Zip Codes with the Highest Percentage of Population Employed in Agriculture, Fishing & Hunting in Eureka, CA
RELATED REPORTS & OPTIONS
Agriculture, Fishing & Hunting
Eureka
Compare Zip Codes
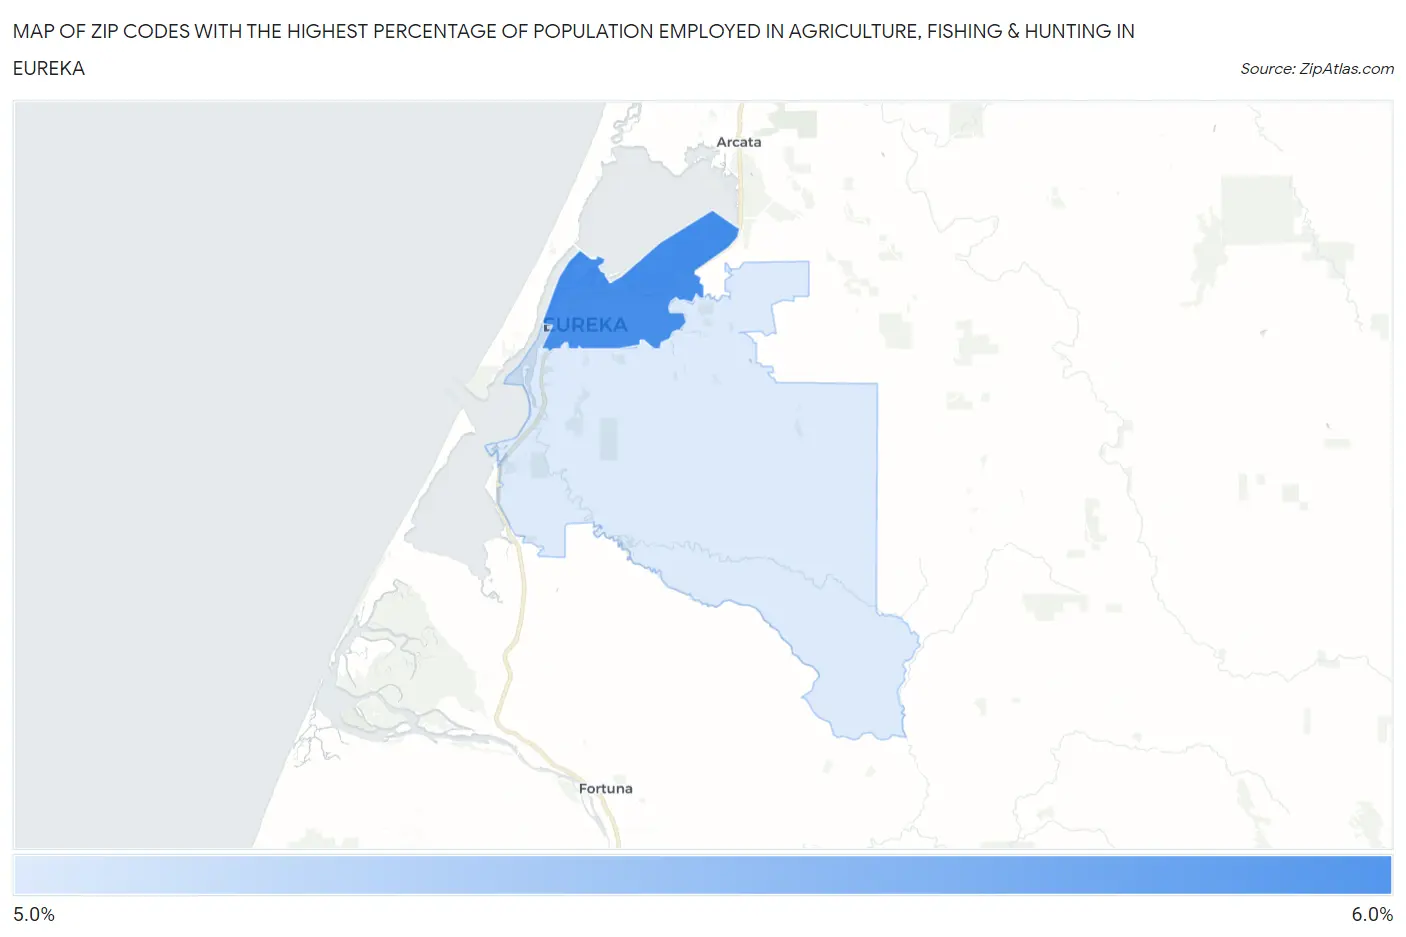
Map of Zip Codes with the Highest Percentage of Population Employed in Agriculture, Fishing & Hunting in Eureka
0.0%
6.0%
Zip Codes with the Highest Percentage of Population Employed in Agriculture, Fishing & Hunting in Eureka, CA
| Zip Code | % Employed | vs State | vs National | |
| 1. | 95501 | 5.4% | 2.0%(+3.43)#373 | 1.2%(+4.22)#7,434 |
| 2. | 95503 | 5.4% | 2.0%(+3.41)#374 | 1.2%(+4.20)#7,450 |
1
Common Questions
What are the Top Zip Codes with the Highest Percentage of Population Employed in Agriculture, Fishing & Hunting in Eureka, CA?
Top Zip Codes with the Highest Percentage of Population Employed in Agriculture, Fishing & Hunting in Eureka, CA are:
What zip code has the Highest Percentage of Population Employed in Agriculture, Fishing & Hunting in Eureka, CA?
95501 has the Highest Percentage of Population Employed in Agriculture, Fishing & Hunting in Eureka, CA with 5.4%.
What is the Percentage of Population Employed in Agriculture, Fishing & Hunting in Eureka, CA?
Percentage of Population Employed in Agriculture, Fishing & Hunting in Eureka is 4.5%.
What is the Percentage of Population Employed in Agriculture, Fishing & Hunting in California?
Percentage of Population Employed in Agriculture, Fishing & Hunting in California is 2.0%.
What is the Percentage of Population Employed in Agriculture, Fishing & Hunting in the United States?
Percentage of Population Employed in Agriculture, Fishing & Hunting in the United States is 1.2%.