El Sobrante CDP Contra Costa County, CA Map & Demographics
El Sobrante CDP Contra Costa County Overview
$45,303
PER CAPITA INCOME
$112,389
AVG FAMILY INCOME
$107,725
AVG HOUSEHOLD INCOME
17.5%
WAGE / INCOME GAP [ % ]
82.5¢/ $1
WAGE / INCOME GAP [ $ ]
0.40
INEQUALITY / GINI INDEX
15,497
TOTAL POPULATION
7,561
MALE POPULATION
7,936
FEMALE POPULATION
95.27
MALES / 100 FEMALES
104.96
FEMALES / 100 MALES
40.9
MEDIAN AGE
3.1
AVG FAMILY SIZE
2.8
AVG HOUSEHOLD SIZE
8,262
LABOR FORCE [ PEOPLE ]
64.7%
PERCENT IN LABOR FORCE
5.6%
UNEMPLOYMENT RATE
Income in El Sobrante CDP Contra Costa County
Income Overview in El Sobrante CDP Contra Costa County
Per Capita Income in El Sobrante CDP Contra Costa County is $45,303, while median incomes of families and households are $112,389 and $107,725 respectively.
| Characteristic | Number | Measure |
| Per Capita Income | 15,497 | $45,303 |
| Median Family Income | 4,087 | $112,389 |
| Mean Family Income | 4,087 | $130,361 |
| Median Household Income | 5,431 | $107,725 |
| Mean Household Income | 5,431 | $127,702 |
| Income Deficit | 4,087 | $0 |
| Wage / Income Gap (%) | 15,497 | 17.55% |
| Wage / Income Gap ($) | 15,497 | 82.45¢ per $1 |
| Gini / Inequality Index | 15,497 | 0.40 |
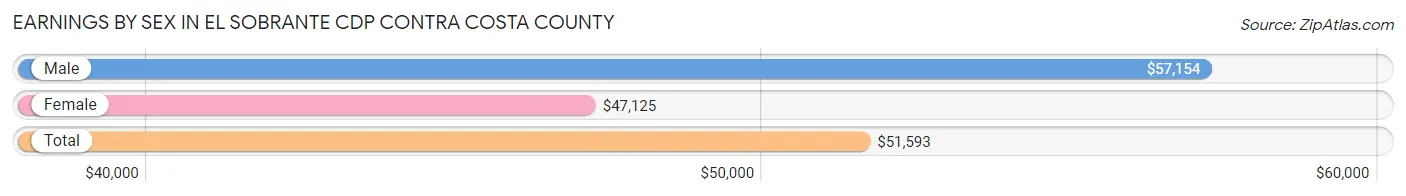
Earnings by Sex in El Sobrante CDP Contra Costa County
Average Earnings in El Sobrante CDP Contra Costa County are $51,593, $57,154 for men and $47,125 for women, a difference of 17.5%.
| Sex | Number | Average Earnings |
| Male | 4,432 (52.5%) | $57,154 |
| Female | 4,005 (47.5%) | $47,125 |
| Total | 8,437 (100.0%) | $51,593 |
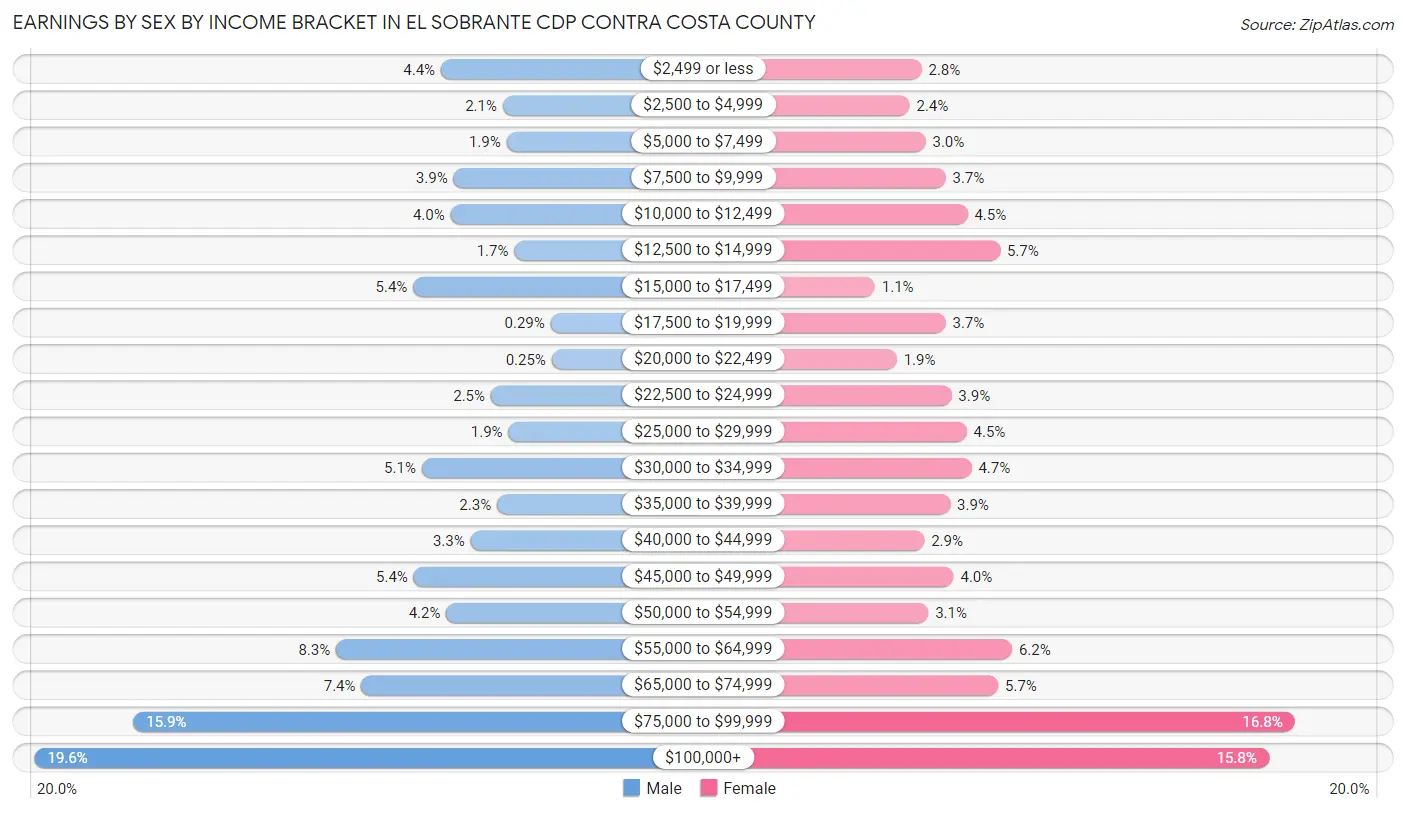
Earnings by Sex by Income Bracket in El Sobrante CDP Contra Costa County
The most common earnings brackets in El Sobrante CDP Contra Costa County are $100,000+ for men (870 | 19.6%) and $75,000 to $99,999 for women (672 | 16.8%).
| Income | Male | Female |
| $2,499 or less | 195 (4.4%) | 112 (2.8%) |
| $2,500 to $4,999 | 92 (2.1%) | 94 (2.4%) |
| $5,000 to $7,499 | 86 (1.9%) | 118 (2.9%) |
| $7,500 to $9,999 | 174 (3.9%) | 148 (3.7%) |
| $10,000 to $12,499 | 179 (4.0%) | 181 (4.5%) |
| $12,500 to $14,999 | 73 (1.7%) | 230 (5.7%) |
| $15,000 to $17,499 | 241 (5.4%) | 42 (1.1%) |
| $17,500 to $19,999 | 13 (0.3%) | 148 (3.7%) |
| $20,000 to $22,499 | 11 (0.3%) | 75 (1.9%) |
| $22,500 to $24,999 | 112 (2.5%) | 157 (3.9%) |
| $25,000 to $29,999 | 83 (1.9%) | 180 (4.5%) |
| $30,000 to $34,999 | 227 (5.1%) | 187 (4.7%) |
| $35,000 to $39,999 | 102 (2.3%) | 155 (3.9%) |
| $40,000 to $44,999 | 146 (3.3%) | 116 (2.9%) |
| $45,000 to $49,999 | 240 (5.4%) | 160 (4.0%) |
| $50,000 to $54,999 | 186 (4.2%) | 122 (3.0%) |
| $55,000 to $64,999 | 369 (8.3%) | 248 (6.2%) |
| $65,000 to $74,999 | 327 (7.4%) | 227 (5.7%) |
| $75,000 to $99,999 | 706 (15.9%) | 672 (16.8%) |
| $100,000+ | 870 (19.6%) | 633 (15.8%) |
| Total | 4,432 (100.0%) | 4,005 (100.0%) |
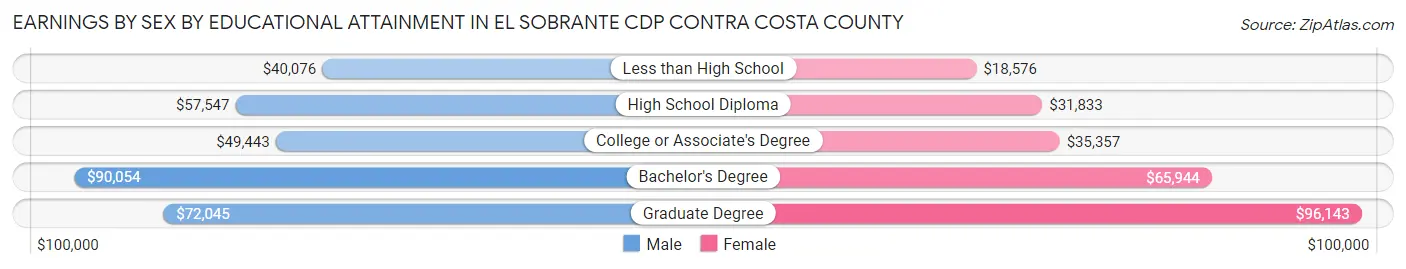
Earnings by Sex by Educational Attainment in El Sobrante CDP Contra Costa County
Average earnings in El Sobrante CDP Contra Costa County are $59,309 for men and $51,791 for women, a difference of 12.7%. Men with an educational attainment of bachelor's degree enjoy the highest average annual earnings of $90,054, while those with less than high school education earn the least with $40,076. Women with an educational attainment of graduate degree earn the most with the average annual earnings of $96,143, while those with less than high school education have the smallest earnings of $18,576.
| Educational Attainment | Male Income | Female Income |
| Less than High School | $40,076 | $18,576 |
| High School Diploma | $57,547 | $31,833 |
| College or Associate's Degree | $49,443 | $35,357 |
| Bachelor's Degree | $90,054 | $65,944 |
| Graduate Degree | $72,045 | $96,143 |
| Total | $59,309 | $51,791 |
Family Income in El Sobrante CDP Contra Costa County
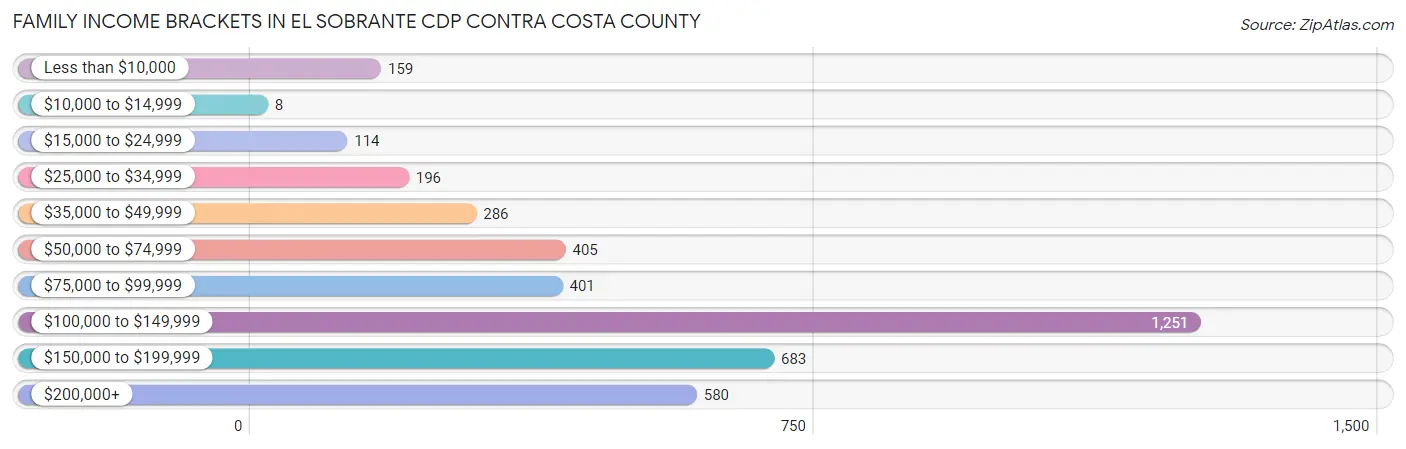
Family Income Brackets in El Sobrante CDP Contra Costa County
According to the El Sobrante CDP Contra Costa County family income data, there are 1,251 families falling into the $100,000 to $149,999 income range, which is the most common income bracket and makes up 30.6% of all families. Conversely, the $10,000 to $14,999 income bracket is the least frequent group with only 8 families (0.2%) belonging to this category.
| Income Bracket | # Families | % Families |
| Less than $10,000 | 159 | 3.9% |
| $10,000 to $14,999 | 8 | 0.2% |
| $15,000 to $24,999 | 114 | 2.8% |
| $25,000 to $34,999 | 196 | 4.8% |
| $35,000 to $49,999 | 286 | 7.0% |
| $50,000 to $74,999 | 405 | 9.9% |
| $75,000 to $99,999 | 401 | 9.8% |
| $100,000 to $149,999 | 1,251 | 30.6% |
| $150,000 to $199,999 | 683 | 16.7% |
| $200,000+ | 580 | 14.2% |
Family Income by Famaliy Size in El Sobrante CDP Contra Costa County
6-person families (32 | 0.8%) account for the highest median family income in El Sobrante CDP Contra Costa County with $250,001 per family, while 2-person families (1,667 | 40.8%) have the highest median income of $53,101 per family member.
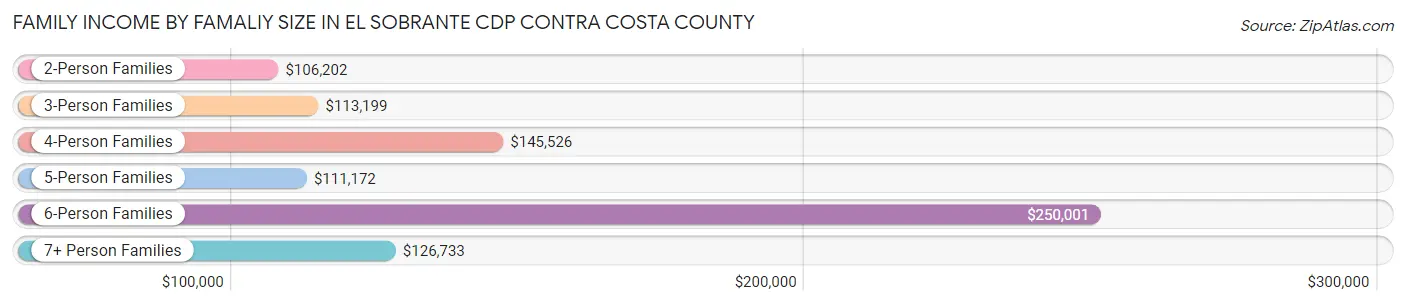
| Income Bracket | # Families | Median Income |
| 2-Person Families | 1,667 (40.8%) | $106,202 |
| 3-Person Families | 1,117 (27.3%) | $113,199 |
| 4-Person Families | 932 (22.8%) | $145,526 |
| 5-Person Families | 192 (4.7%) | $111,172 |
| 6-Person Families | 32 (0.8%) | $250,001 |
| 7+ Person Families | 147 (3.6%) | $126,733 |
| Total | 4,087 (100.0%) | $112,389 |
Family Income by Number of Earners in El Sobrante CDP Contra Costa County
The median family income in El Sobrante CDP Contra Costa County is $112,389, with families comprising 2 earners (1,718) having the highest median family income of $137,250, while families with no earners (450) have the lowest median family income of $60,000, accounting for 42.0% and 11.0% of families, respectively.
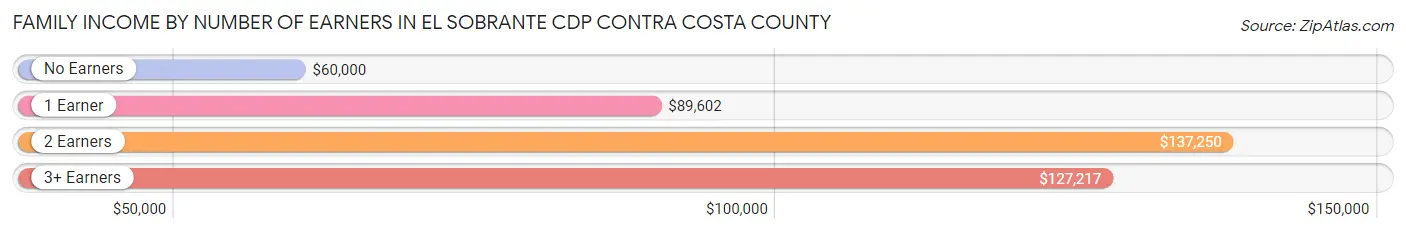
| Number of Earners | # Families | Median Income |
| No Earners | 450 (11.0%) | $60,000 |
| 1 Earner | 1,421 (34.8%) | $89,602 |
| 2 Earners | 1,718 (42.0%) | $137,250 |
| 3+ Earners | 498 (12.2%) | $127,217 |
| Total | 4,087 (100.0%) | $112,389 |
Household Income in El Sobrante CDP Contra Costa County
Household Income Brackets in El Sobrante CDP Contra Costa County
With 1,407 households falling in the category, the $100,000 to $149,999 income range is the most frequent in El Sobrante CDP Contra Costa County, accounting for 25.9% of all households. In contrast, only 65 households (1.2%) fall into the $10,000 to $14,999 income bracket, making it the least populous group.
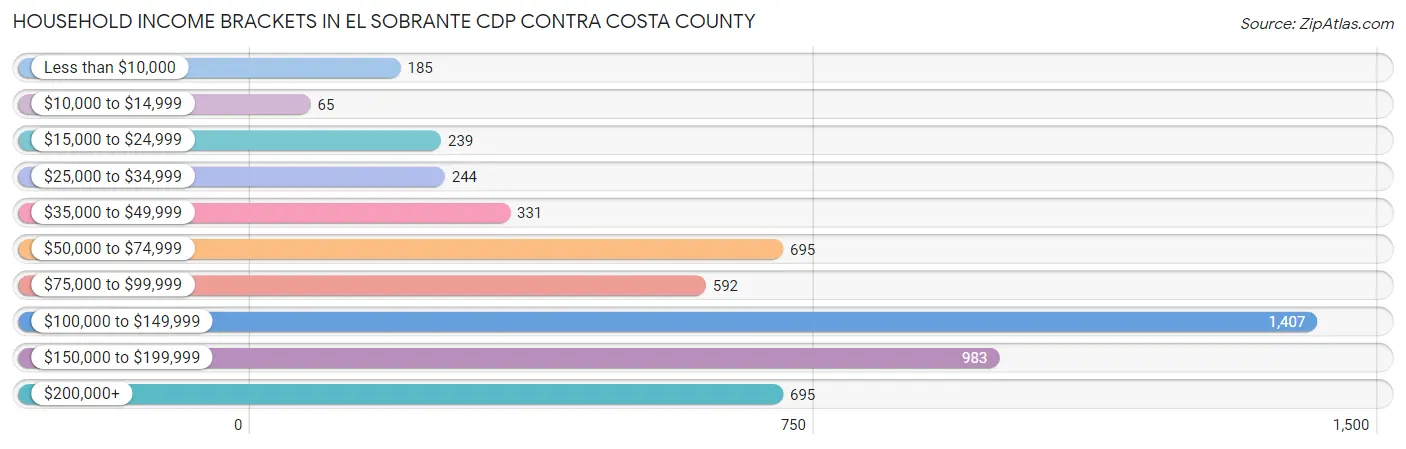
| Income Bracket | # Households | % Households |
| Less than $10,000 | 185 | 3.4% |
| $10,000 to $14,999 | 65 | 1.2% |
| $15,000 to $24,999 | 239 | 4.4% |
| $25,000 to $34,999 | 244 | 4.5% |
| $35,000 to $49,999 | 331 | 6.1% |
| $50,000 to $74,999 | 695 | 12.8% |
| $75,000 to $99,999 | 592 | 10.9% |
| $100,000 to $149,999 | 1,407 | 25.9% |
| $150,000 to $199,999 | 983 | 18.1% |
| $200,000+ | 695 | 12.8% |
Household Income by Householder Age in El Sobrante CDP Contra Costa County
The median household income in El Sobrante CDP Contra Costa County is $107,725, with the highest median household income of $116,563 found in the 45 to 64 years age bracket for the primary householder. A total of 1,951 households (35.9%) fall into this category. Meanwhile, the 15 to 24 years age bracket for the primary householder has the lowest median household income of $0, with 67 households (1.2%) in this group.
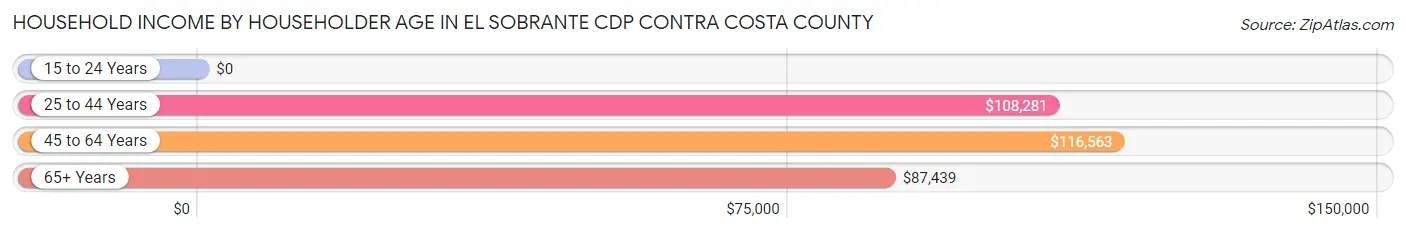
| Income Bracket | # Households | Median Income |
| 15 to 24 Years | 67 (1.2%) | $0 |
| 25 to 44 Years | 1,711 (31.5%) | $108,281 |
| 45 to 64 Years | 1,951 (35.9%) | $116,563 |
| 65+ Years | 1,702 (31.3%) | $87,439 |
| Total | 5,431 (100.0%) | $107,725 |
Poverty in El Sobrante CDP Contra Costa County
Income Below Poverty by Sex and Age in El Sobrante CDP Contra Costa County
With 10.0% poverty level for males and 9.2% for females among the residents of El Sobrante CDP Contra Costa County, 25 to 34 year old males and 15 year old females are the most vulnerable to poverty, with 328 males (20.1%) and 44 females (26.2%) in their respective age groups living below the poverty level.
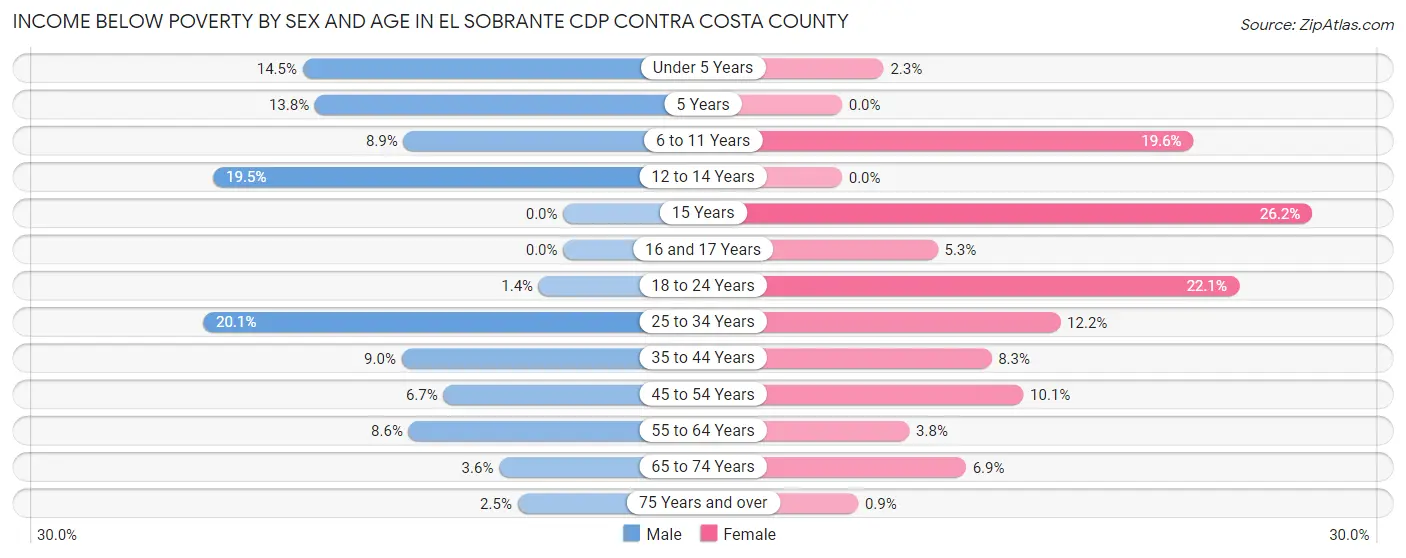
| Age Bracket | Male | Female |
| Under 5 Years | 47 (14.5%) | 8 (2.3%) |
| 5 Years | 35 (13.8%) | 0 (0.0%) |
| 6 to 11 Years | 34 (8.9%) | 139 (19.6%) |
| 12 to 14 Years | 31 (19.5%) | 0 (0.0%) |
| 15 Years | 0 (0.0%) | 44 (26.2%) |
| 16 and 17 Years | 0 (0.0%) | 8 (5.3%) |
| 18 to 24 Years | 6 (1.4%) | 101 (22.1%) |
| 25 to 34 Years | 328 (20.1%) | 113 (12.2%) |
| 35 to 44 Years | 94 (9.0%) | 77 (8.3%) |
| 45 to 54 Years | 69 (6.7%) | 125 (10.1%) |
| 55 to 64 Years | 71 (8.6%) | 44 (3.7%) |
| 65 to 74 Years | 34 (3.6%) | 66 (6.9%) |
| 75 Years and over | 10 (2.5%) | 5 (0.9%) |
| Total | 759 (10.0%) | 730 (9.2%) |
Income Above Poverty by Sex and Age in El Sobrante CDP Contra Costa County
According to the poverty statistics in El Sobrante CDP Contra Costa County, males aged 15 years and females aged 5 years are the age groups that are most secure financially, with 100.0% of males and 100.0% of females in these age groups living above the poverty line.
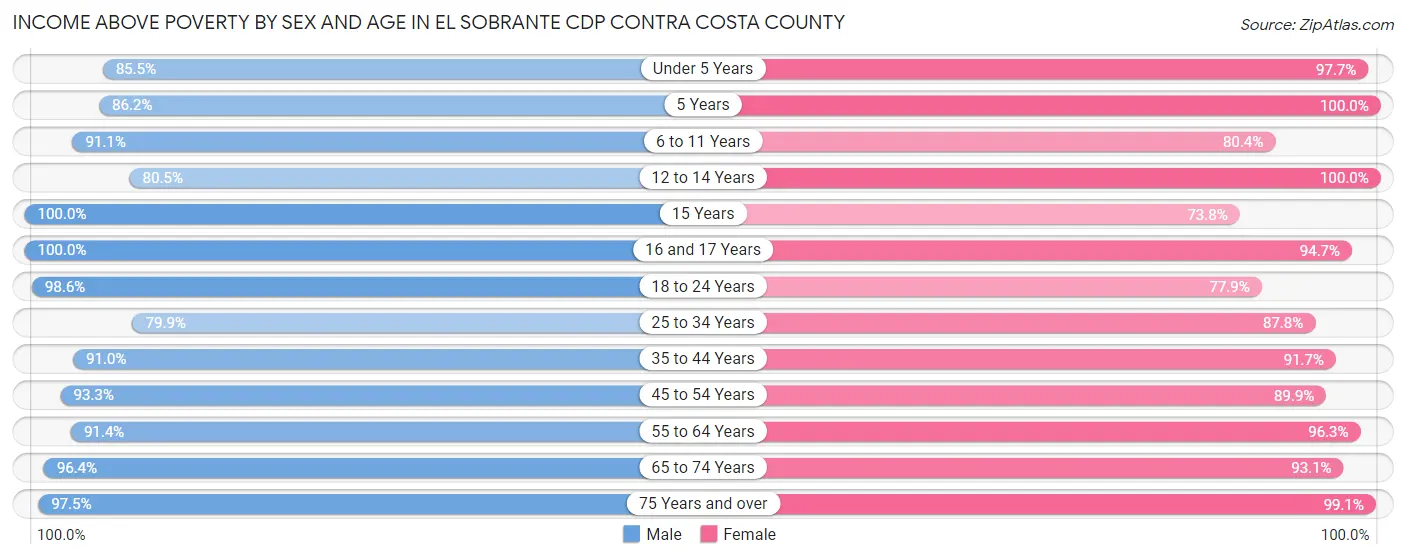
| Age Bracket | Male | Female |
| Under 5 Years | 277 (85.5%) | 337 (97.7%) |
| 5 Years | 218 (86.2%) | 64 (100.0%) |
| 6 to 11 Years | 348 (91.1%) | 571 (80.4%) |
| 12 to 14 Years | 128 (80.5%) | 222 (100.0%) |
| 15 Years | 58 (100.0%) | 124 (73.8%) |
| 16 and 17 Years | 59 (100.0%) | 142 (94.7%) |
| 18 to 24 Years | 435 (98.6%) | 356 (77.9%) |
| 25 to 34 Years | 1,307 (79.9%) | 816 (87.8%) |
| 35 to 44 Years | 950 (91.0%) | 849 (91.7%) |
| 45 to 54 Years | 965 (93.3%) | 1,113 (89.9%) |
| 55 to 64 Years | 754 (91.4%) | 1,129 (96.3%) |
| 65 to 74 Years | 919 (96.4%) | 891 (93.1%) |
| 75 Years and over | 383 (97.5%) | 550 (99.1%) |
| Total | 6,801 (90.0%) | 7,164 (90.7%) |
Income Below Poverty Among Married-Couple Families in El Sobrante CDP Contra Costa County
The poverty statistics for married-couple families in El Sobrante CDP Contra Costa County show that 2.7% or 74 of the total 2,728 families live below the poverty line. Families with 3 or 4 children have the highest poverty rate of 15.3%, comprising of 20 families. On the other hand, families with no children have the lowest poverty rate of 1.6%, which includes 27 families.
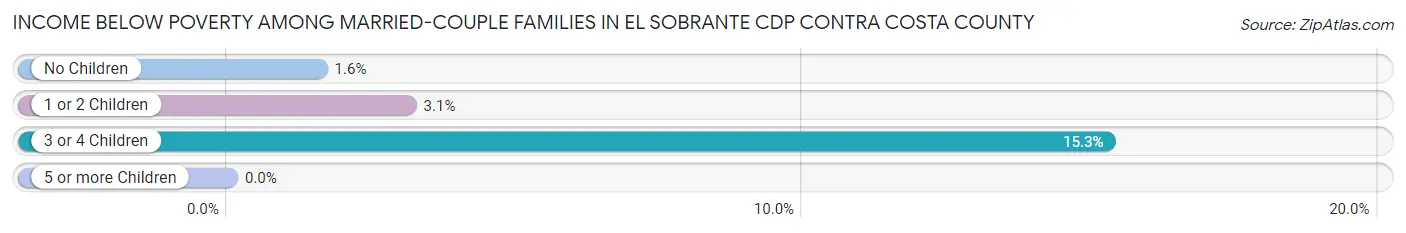
| Children | Above Poverty | Below Poverty |
| No Children | 1,703 (98.4%) | 27 (1.6%) |
| 1 or 2 Children | 840 (96.9%) | 27 (3.1%) |
| 3 or 4 Children | 111 (84.7%) | 20 (15.3%) |
| 5 or more Children | 0 (0.0%) | 0 (0.0%) |
| Total | 2,654 (97.3%) | 74 (2.7%) |
Income Below Poverty Among Single-Parent Households in El Sobrante CDP Contra Costa County
According to the poverty data in El Sobrante CDP Contra Costa County, 3.4% or 17 single-father households and 16.7% or 144 single-mother households are living below the poverty line. Among single-father households, those with 1 or 2 children have the highest poverty rate, with 8 households (4.0%) experiencing poverty. Likewise, among single-mother households, those with 3 or 4 children have the highest poverty rate, with 34 households (100.0%) falling below the poverty line.
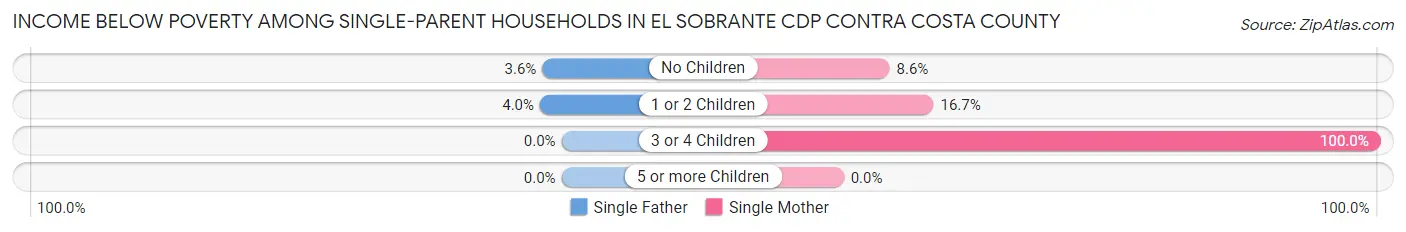
| Children | Single Father | Single Mother |
| No Children | 9 (3.6%) | 30 (8.6%) |
| 1 or 2 Children | 8 (4.0%) | 80 (16.7%) |
| 3 or 4 Children | 0 (0.0%) | 34 (100.0%) |
| 5 or more Children | 0 (0.0%) | 0 (0.0%) |
| Total | 17 (3.4%) | 144 (16.7%) |
Income Below Poverty Among Married-Couple vs Single-Parent Households in El Sobrante CDP Contra Costa County
The poverty data for El Sobrante CDP Contra Costa County shows that 74 of the married-couple family households (2.7%) and 161 of the single-parent households (11.8%) are living below the poverty level. Within the married-couple family households, those with 3 or 4 children have the highest poverty rate, with 20 households (15.3%) falling below the poverty line. Among the single-parent households, those with 3 or 4 children have the highest poverty rate, with 34 household (42.0%) living below poverty.
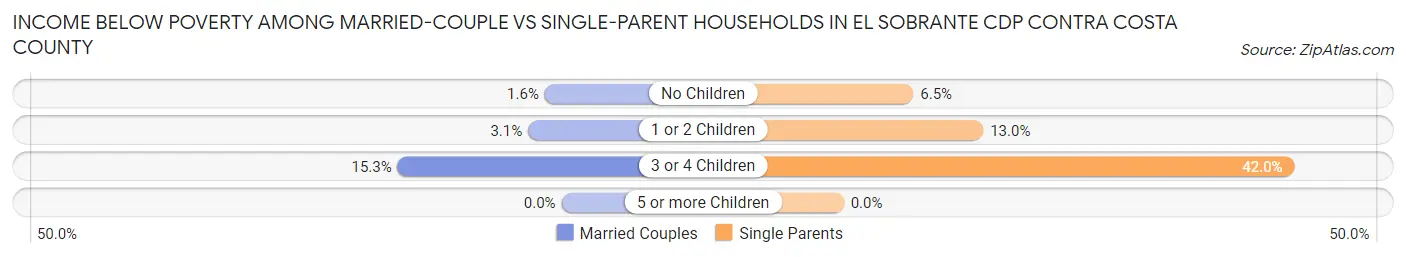
| Children | Married-Couple Families | Single-Parent Households |
| No Children | 27 (1.6%) | 39 (6.5%) |
| 1 or 2 Children | 27 (3.1%) | 88 (13.0%) |
| 3 or 4 Children | 20 (15.3%) | 34 (42.0%) |
| 5 or more Children | 0 (0.0%) | 0 (0.0%) |
| Total | 74 (2.7%) | 161 (11.8%) |
Race in El Sobrante CDP Contra Costa County
The most populous races in El Sobrante CDP Contra Costa County are White / Caucasian (6,773 | 43.7%), Hispanic or Latino (4,613 | 29.8%), and Two or more Races (2,616 | 16.9%).
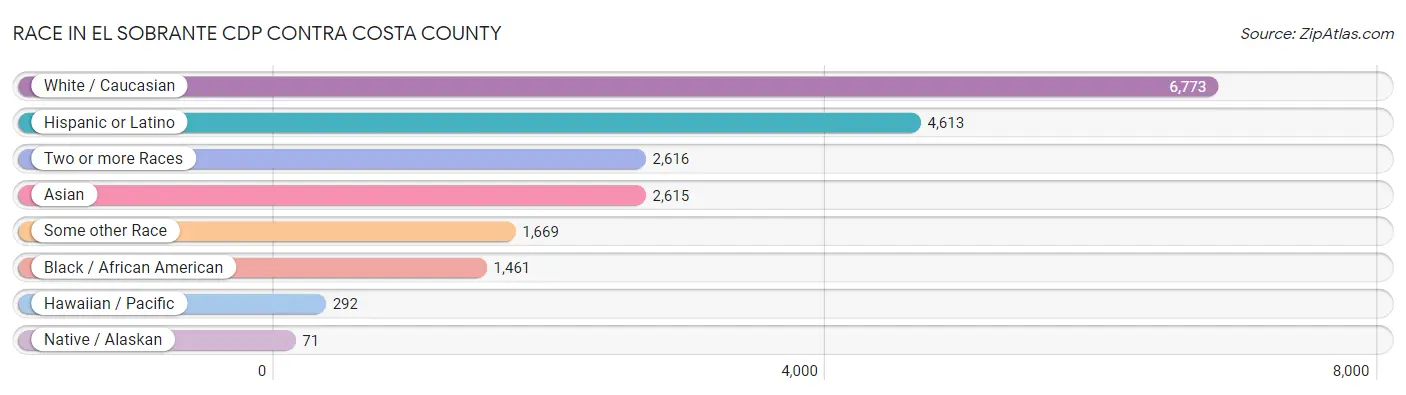
| Race | # Population | % Population |
| Asian | 2,615 | 16.9% |
| Black / African American | 1,461 | 9.4% |
| Hawaiian / Pacific | 292 | 1.9% |
| Hispanic or Latino | 4,613 | 29.8% |
| Native / Alaskan | 71 | 0.5% |
| White / Caucasian | 6,773 | 43.7% |
| Two or more Races | 2,616 | 16.9% |
| Some other Race | 1,669 | 10.8% |
| Total | 15,497 | 100.0% |
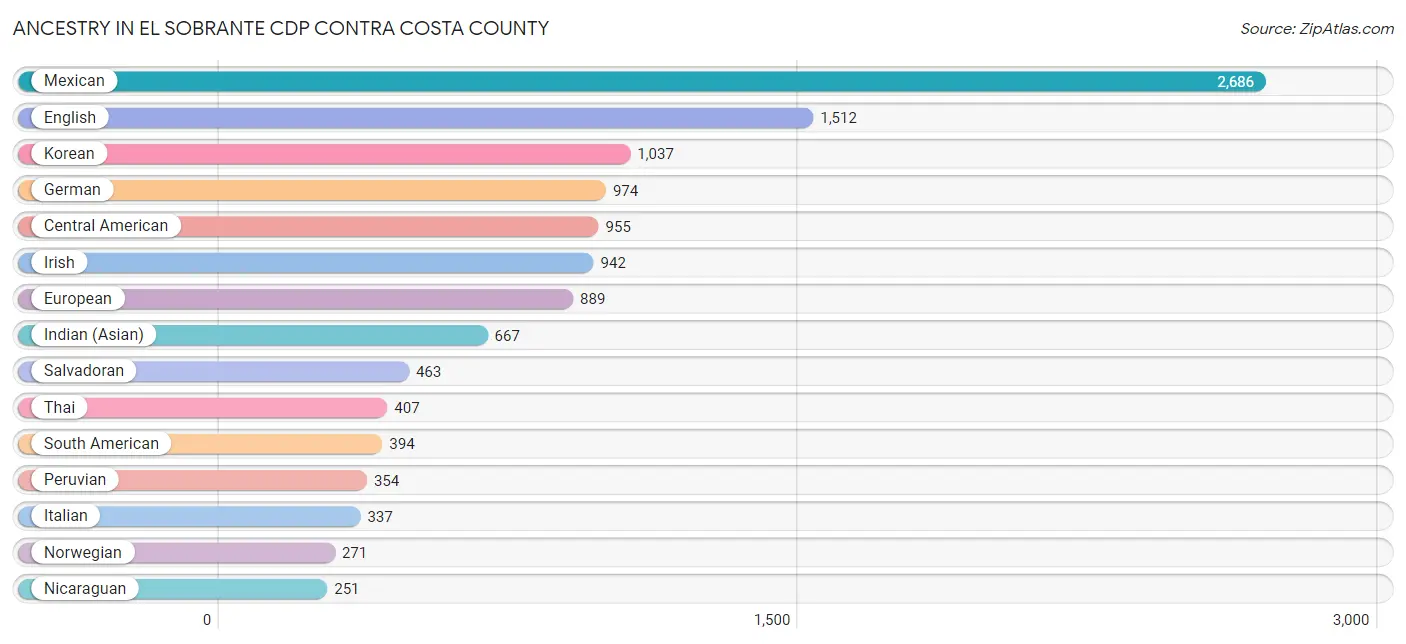
Ancestry in El Sobrante CDP Contra Costa County
The most populous ancestries reported in El Sobrante CDP Contra Costa County are Mexican (2,686 | 17.3%), English (1,512 | 9.8%), Korean (1,037 | 6.7%), German (974 | 6.3%), and Central American (955 | 6.2%), together accounting for 46.2% of all El Sobrante CDP Contra Costa County residents.
| Ancestry | # Population | % Population |
| Afghan | 82 | 0.5% |
| Albanian | 58 | 0.4% |
| Aleut | 6 | 0.0% |
| American | 201 | 1.3% |
| Apache | 12 | 0.1% |
| Arab | 159 | 1.0% |
| Argentinean | 6 | 0.0% |
| Armenian | 16 | 0.1% |
| Assyrian / Chaldean / Syriac | 7 | 0.1% |
| Belgian | 20 | 0.1% |
| Bhutanese | 146 | 0.9% |
| Brazilian | 166 | 1.1% |
| British | 53 | 0.3% |
| Bulgarian | 7 | 0.1% |
| Burmese | 98 | 0.6% |
| Cape Verdean | 29 | 0.2% |
| Central American | 955 | 6.2% |
| Cherokee | 89 | 0.6% |
| Chilean | 34 | 0.2% |
| Choctaw | 23 | 0.2% |
| Costa Rican | 190 | 1.2% |
| Cuban | 45 | 0.3% |
| Danish | 22 | 0.1% |
| Dutch | 128 | 0.8% |
| Eastern European | 14 | 0.1% |
| English | 1,512 | 9.8% |
| Ethiopian | 11 | 0.1% |
| European | 889 | 5.7% |
| Filipino | 59 | 0.4% |
| Finnish | 23 | 0.2% |
| French | 228 | 1.5% |
| French Canadian | 64 | 0.4% |
| German | 974 | 6.3% |
| Greek | 58 | 0.4% |
| Guamanian / Chamorro | 52 | 0.3% |
| Guatemalan | 42 | 0.3% |
| Guyanese | 73 | 0.5% |
| Honduran | 9 | 0.1% |
| Hungarian | 51 | 0.3% |
| Icelander | 31 | 0.2% |
| Indian (Asian) | 667 | 4.3% |
| Iranian | 103 | 0.7% |
| Irish | 942 | 6.1% |
| Italian | 337 | 2.2% |
| Jamaican | 83 | 0.5% |
| Japanese | 8 | 0.1% |
| Korean | 1,037 | 6.7% |
| Lebanese | 7 | 0.1% |
| Lithuanian | 28 | 0.2% |
| Malaysian | 93 | 0.6% |
| Mexican | 2,686 | 17.3% |
| Mexican American Indian | 61 | 0.4% |
| Moroccan | 123 | 0.8% |
| Native Hawaiian | 46 | 0.3% |
| New Zealander | 8 | 0.1% |
| Nicaraguan | 251 | 1.6% |
| Nigerian | 11 | 0.1% |
| Northern European | 38 | 0.3% |
| Norwegian | 271 | 1.8% |
| Peruvian | 354 | 2.3% |
| Polish | 157 | 1.0% |
| Portuguese | 136 | 0.9% |
| Puerto Rican | 132 | 0.9% |
| Russian | 122 | 0.8% |
| Salvadoran | 463 | 3.0% |
| Samoan | 215 | 1.4% |
| Scandinavian | 52 | 0.3% |
| Scotch-Irish | 59 | 0.4% |
| Scottish | 139 | 0.9% |
| Sioux | 11 | 0.1% |
| Slovene | 12 | 0.1% |
| South American | 394 | 2.5% |
| Soviet Union | 83 | 0.5% |
| Spaniard | 135 | 0.9% |
| Spanish | 59 | 0.4% |
| Sri Lankan | 14 | 0.1% |
| Subsaharan African | 51 | 0.3% |
| Swedish | 244 | 1.6% |
| Swiss | 69 | 0.4% |
| Thai | 407 | 2.6% |
| Ukrainian | 102 | 0.7% |
| Welsh | 19 | 0.1% |
| Yugoslavian | 27 | 0.2% | View All 83 Rows |
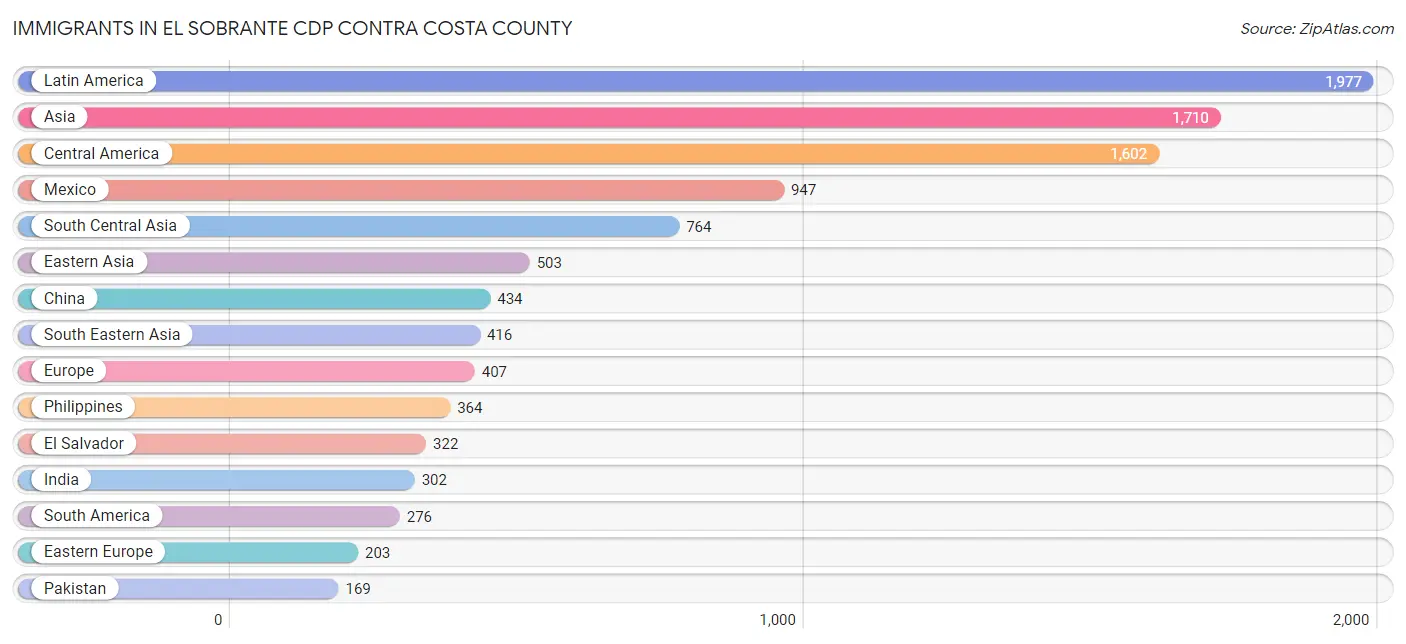
Immigrants in El Sobrante CDP Contra Costa County
The most numerous immigrant groups reported in El Sobrante CDP Contra Costa County came from Latin America (1,977 | 12.8%), Asia (1,710 | 11.0%), Central America (1,602 | 10.3%), Mexico (947 | 6.1%), and South Central Asia (764 | 4.9%), together accounting for 45.2% of all El Sobrante CDP Contra Costa County residents.
| Immigration Origin | # Population | % Population |
| Afghanistan | 27 | 0.2% |
| Africa | 76 | 0.5% |
| Albania | 38 | 0.3% |
| Argentina | 6 | 0.0% |
| Asia | 1,710 | 11.0% |
| Australia | 20 | 0.1% |
| Bahamas | 60 | 0.4% |
| Belarus | 9 | 0.1% |
| Brazil | 142 | 0.9% |
| Cambodia | 8 | 0.1% |
| Canada | 53 | 0.3% |
| Caribbean | 99 | 0.6% |
| Central America | 1,602 | 10.3% |
| China | 434 | 2.8% |
| Costa Rica | 75 | 0.5% |
| Dominican Republic | 39 | 0.3% |
| Eastern Africa | 5 | 0.0% |
| Eastern Asia | 503 | 3.3% |
| Eastern Europe | 203 | 1.3% |
| El Salvador | 322 | 2.1% |
| Europe | 407 | 2.6% |
| Fiji | 25 | 0.2% |
| France | 7 | 0.1% |
| Germany | 7 | 0.1% |
| Guatemala | 65 | 0.4% |
| Honduras | 9 | 0.1% |
| Hong Kong | 46 | 0.3% |
| India | 302 | 1.9% |
| Iran | 76 | 0.5% |
| Iraq | 7 | 0.1% |
| Ireland | 20 | 0.1% |
| Israel | 12 | 0.1% |
| Japan | 21 | 0.1% |
| Korea | 48 | 0.3% |
| Latin America | 1,977 | 12.8% |
| Mexico | 947 | 6.1% |
| Morocco | 60 | 0.4% |
| Nepal | 116 | 0.7% |
| Nicaragua | 156 | 1.0% |
| Nigeria | 11 | 0.1% |
| Northern Africa | 60 | 0.4% |
| Northern Europe | 130 | 0.8% |
| Oceania | 89 | 0.6% |
| Pakistan | 169 | 1.1% |
| Panama | 28 | 0.2% |
| Peru | 128 | 0.8% |
| Philippines | 364 | 2.4% |
| Poland | 30 | 0.2% |
| Portugal | 11 | 0.1% |
| Russia | 43 | 0.3% |
| Singapore | 6 | 0.0% |
| South America | 276 | 1.8% |
| South Central Asia | 764 | 4.9% |
| South Eastern Asia | 416 | 2.7% |
| Southern Europe | 56 | 0.4% |
| Spain | 45 | 0.3% |
| Sweden | 51 | 0.3% |
| Switzerland | 4 | 0.0% |
| Taiwan | 26 | 0.2% |
| Uganda | 5 | 0.0% |
| Vietnam | 14 | 0.1% |
| Western Africa | 11 | 0.1% |
| Western Asia | 27 | 0.2% |
| Western Europe | 18 | 0.1% | View All 64 Rows |
Sex and Age in El Sobrante CDP Contra Costa County
Sex and Age in El Sobrante CDP Contra Costa County
The most populous age groups in El Sobrante CDP Contra Costa County are 30 to 34 Years (893 | 11.8%) for men and 55 to 59 Years (733 | 9.2%) for women.
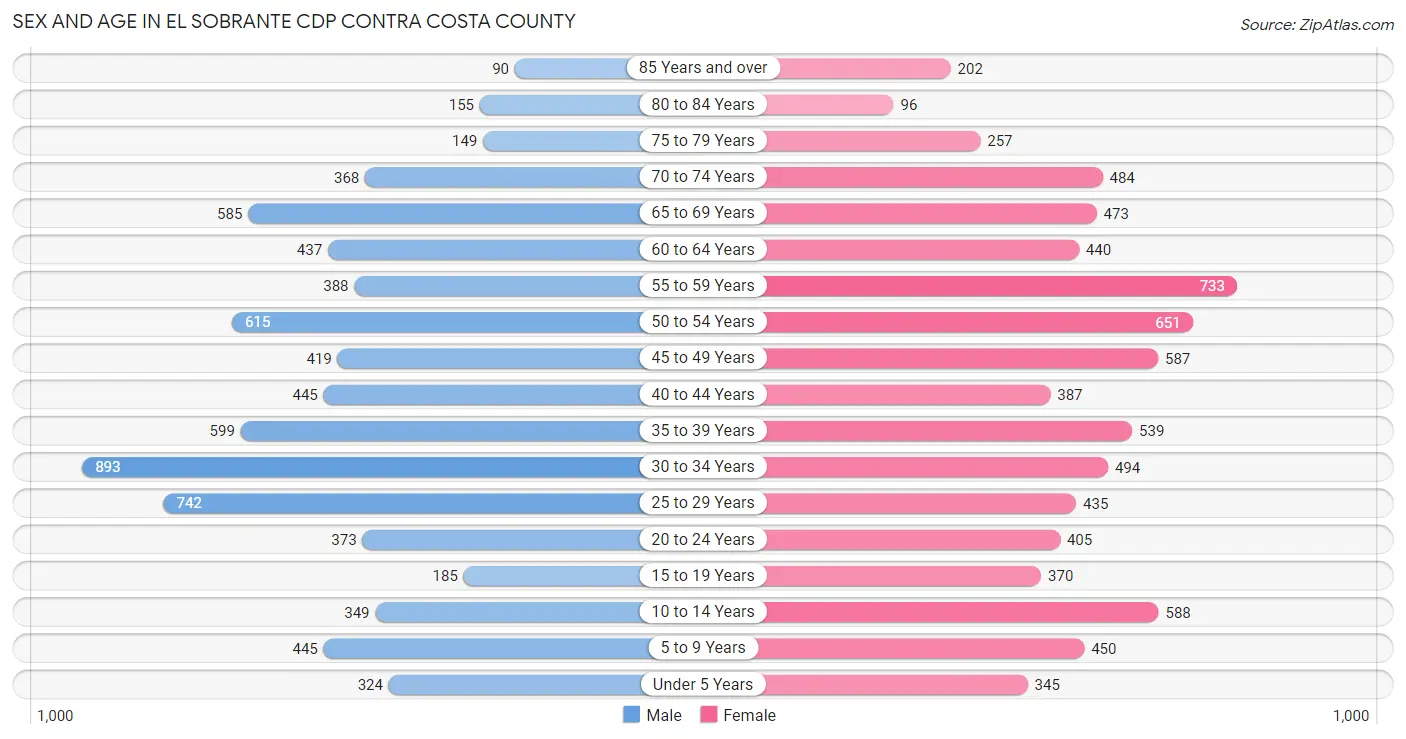
| Age Bracket | Male | Female |
| Under 5 Years | 324 (4.3%) | 345 (4.3%) |
| 5 to 9 Years | 445 (5.9%) | 450 (5.7%) |
| 10 to 14 Years | 349 (4.6%) | 588 (7.4%) |
| 15 to 19 Years | 185 (2.5%) | 370 (4.7%) |
| 20 to 24 Years | 373 (4.9%) | 405 (5.1%) |
| 25 to 29 Years | 742 (9.8%) | 435 (5.5%) |
| 30 to 34 Years | 893 (11.8%) | 494 (6.2%) |
| 35 to 39 Years | 599 (7.9%) | 539 (6.8%) |
| 40 to 44 Years | 445 (5.9%) | 387 (4.9%) |
| 45 to 49 Years | 419 (5.5%) | 587 (7.4%) |
| 50 to 54 Years | 615 (8.1%) | 651 (8.2%) |
| 55 to 59 Years | 388 (5.1%) | 733 (9.2%) |
| 60 to 64 Years | 437 (5.8%) | 440 (5.5%) |
| 65 to 69 Years | 585 (7.7%) | 473 (6.0%) |
| 70 to 74 Years | 368 (4.9%) | 484 (6.1%) |
| 75 to 79 Years | 149 (2.0%) | 257 (3.2%) |
| 80 to 84 Years | 155 (2.1%) | 96 (1.2%) |
| 85 Years and over | 90 (1.2%) | 202 (2.5%) |
| Total | 7,561 (100.0%) | 7,936 (100.0%) |
Families and Households in El Sobrante CDP Contra Costa County
Median Family Size in El Sobrante CDP Contra Costa County
The median family size in El Sobrante CDP Contra Costa County is 3.10 persons per family, with married-couple families (2,728 | 66.7%) accounting for the largest median family size of 3.19 persons per family. On the other hand, single female/mother families (863 | 21.1%) represent the smallest median family size with 2.85 persons per family.
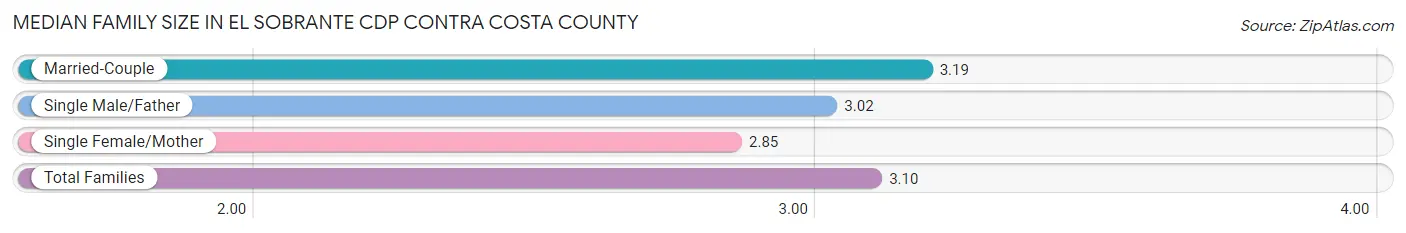
| Family Type | # Families | Family Size |
| Married-Couple | 2,728 (66.7%) | 3.19 |
| Single Male/Father | 496 (12.1%) | 3.02 |
| Single Female/Mother | 863 (21.1%) | 2.85 |
| Total Families | 4,087 (100.0%) | 3.10 |
Median Household Size in El Sobrante CDP Contra Costa County
The median household size in El Sobrante CDP Contra Costa County is 2.84 persons per household, with single male/father households (496 | 9.1%) accounting for the largest median household size of 3.48 persons per household. non-family households (1,344 | 24.7%) represent the smallest median household size with 1.38 persons per household.
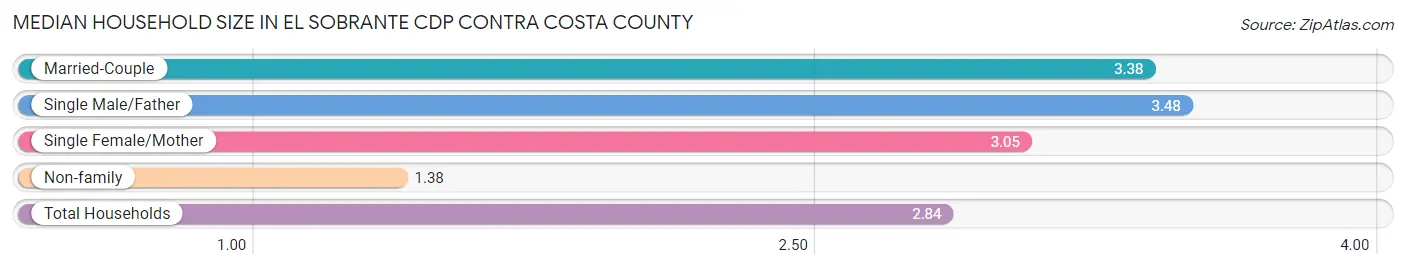
| Household Type | # Households | Household Size |
| Married-Couple | 2,728 (50.2%) | 3.38 |
| Single Male/Father | 496 (9.1%) | 3.48 |
| Single Female/Mother | 863 (15.9%) | 3.05 |
| Non-family | 1,344 (24.7%) | 1.38 |
| Total Households | 5,431 (100.0%) | 2.84 |
Household Size by Marriage Status in El Sobrante CDP Contra Costa County
Out of a total of 5,431 households in El Sobrante CDP Contra Costa County, 4,087 (75.2%) are family households, while 1,344 (24.7%) are nonfamily households. The most numerous type of family households are 2-person households, comprising 1,392, and the most common type of nonfamily households are 1-person households, comprising 919.
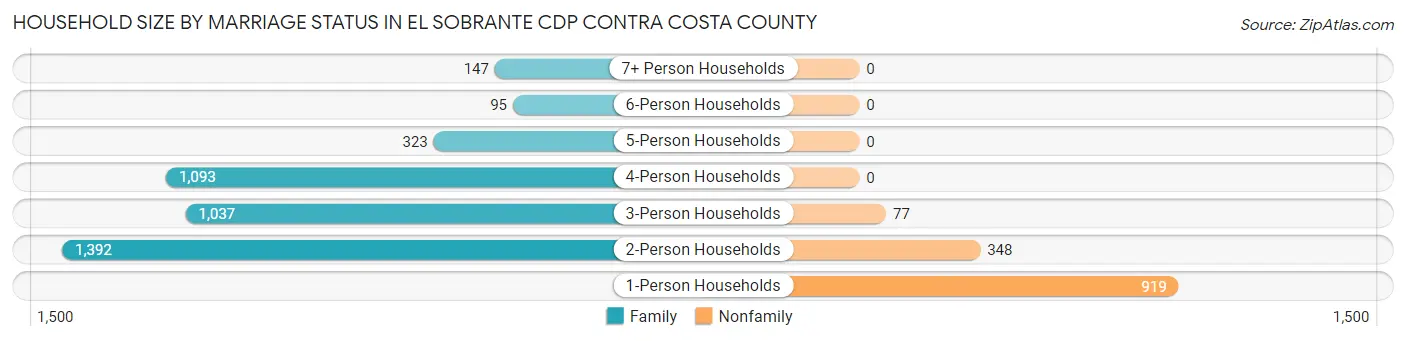
| Household Size | Family Households | Nonfamily Households |
| 1-Person Households | - | 919 (16.9%) |
| 2-Person Households | 1,392 (25.6%) | 348 (6.4%) |
| 3-Person Households | 1,037 (19.1%) | 77 (1.4%) |
| 4-Person Households | 1,093 (20.1%) | 0 (0.0%) |
| 5-Person Households | 323 (5.9%) | 0 (0.0%) |
| 6-Person Households | 95 (1.8%) | 0 (0.0%) |
| 7+ Person Households | 147 (2.7%) | 0 (0.0%) |
| Total | 4,087 (75.2%) | 1,344 (24.7%) |
Female Fertility in El Sobrante CDP Contra Costa County
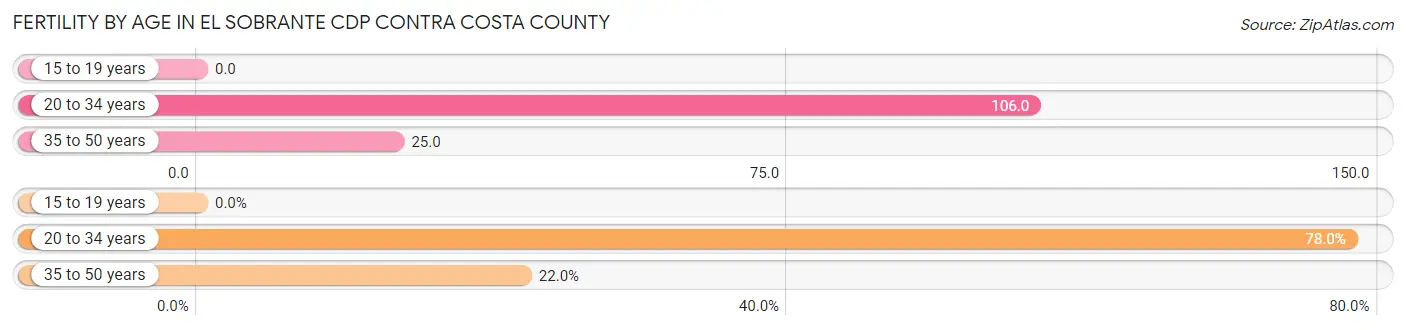
Fertility by Age in El Sobrante CDP Contra Costa County
Average fertility rate in El Sobrante CDP Contra Costa County is 55.0 births per 1,000 women. Women in the age bracket of 20 to 34 years have the highest fertility rate with 106.0 births per 1,000 women. Women in the age bracket of 20 to 34 years acount for 78.0% of all women with births.
| Age Bracket | Women with Births | Births / 1,000 Women |
| 15 to 19 years | 0 (0.0%) | 0.0 |
| 20 to 34 years | 142 (78.0%) | 106.0 |
| 35 to 50 years | 40 (22.0%) | 25.0 |
| Total | 182 (100.0%) | 55.0 |
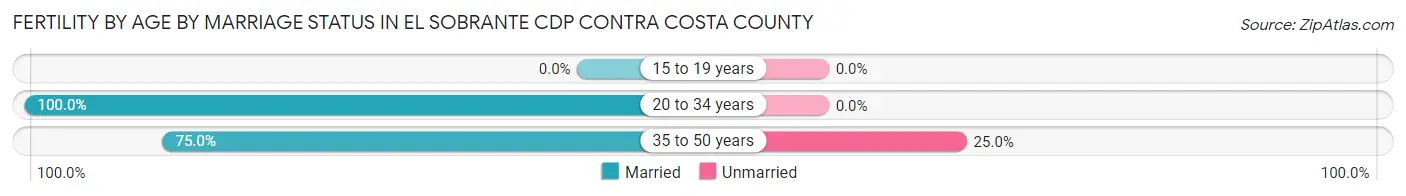
Fertility by Age by Marriage Status in El Sobrante CDP Contra Costa County
94.5% of women with births (182) in El Sobrante CDP Contra Costa County are married. The highest percentage of unmarried women with births falls into 35 to 50 years age bracket with 25.0% of them unmarried at the time of birth, while the lowest percentage of unmarried women with births belong to 20 to 34 years age bracket with 0.0% of them unmarried.
| Age Bracket | Married | Unmarried |
| 15 to 19 years | 0 (0.0%) | 0 (0.0%) |
| 20 to 34 years | 142 (100.0%) | 0 (0.0%) |
| 35 to 50 years | 30 (75.0%) | 10 (25.0%) |
| Total | 172 (94.5%) | 10 (5.5%) |
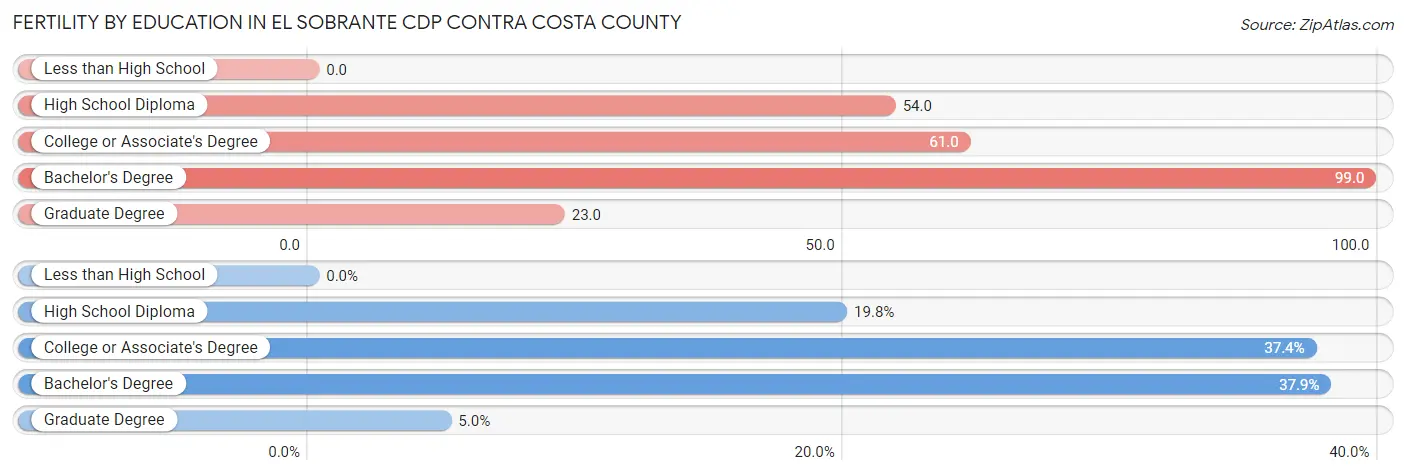
Fertility by Education in El Sobrante CDP Contra Costa County
| Educational Attainment | Women with Births | Births / 1,000 Women |
| Less than High School | 0 (0.0%) | 0.0 |
| High School Diploma | 36 (19.8%) | 54.0 |
| College or Associate's Degree | 68 (37.4%) | 61.0 |
| Bachelor's Degree | 69 (37.9%) | 99.0 |
| Graduate Degree | 9 (5.0%) | 23.0 |
| Total | 182 (100.0%) | 55.0 |
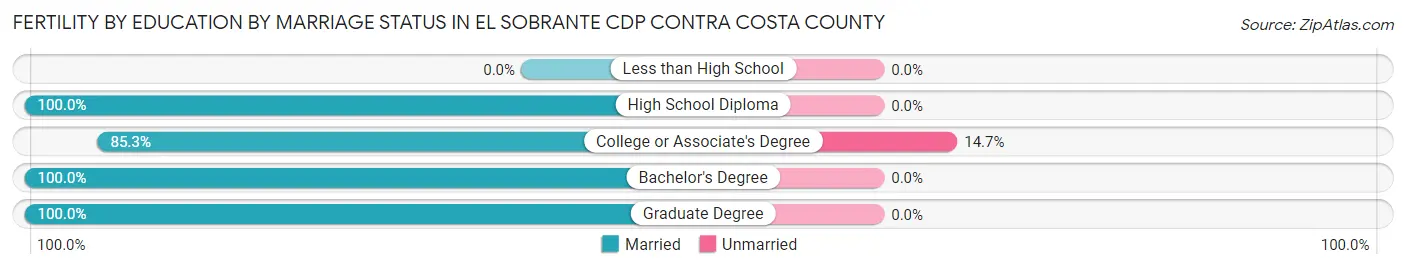
Fertility by Education by Marriage Status in El Sobrante CDP Contra Costa County
5.5% of women with births in El Sobrante CDP Contra Costa County are unmarried. Women with the educational attainment of high school diploma are most likely to be married with 100.0% of them married at childbirth, while women with the educational attainment of college or associate's degree are least likely to be married with 14.7% of them unmarried at childbirth.
| Educational Attainment | Married | Unmarried |
| Less than High School | 0 (0.0%) | 0 (0.0%) |
| High School Diploma | 36 (100.0%) | 0 (0.0%) |
| College or Associate's Degree | 58 (85.3%) | 10 (14.7%) |
| Bachelor's Degree | 69 (100.0%) | 0 (0.0%) |
| Graduate Degree | 9 (100.0%) | 0 (0.0%) |
| Total | 172 (94.5%) | 10 (5.5%) |
Employment Characteristics in El Sobrante CDP Contra Costa County
Employment by Class of Employer in El Sobrante CDP Contra Costa County
Among the 7,424 employed individuals in El Sobrante CDP Contra Costa County, private company employees (4,071 | 54.8%), not-for-profit organizations (956 | 12.9%), and local government employees (791 | 10.6%) make up the most common classes of employment.
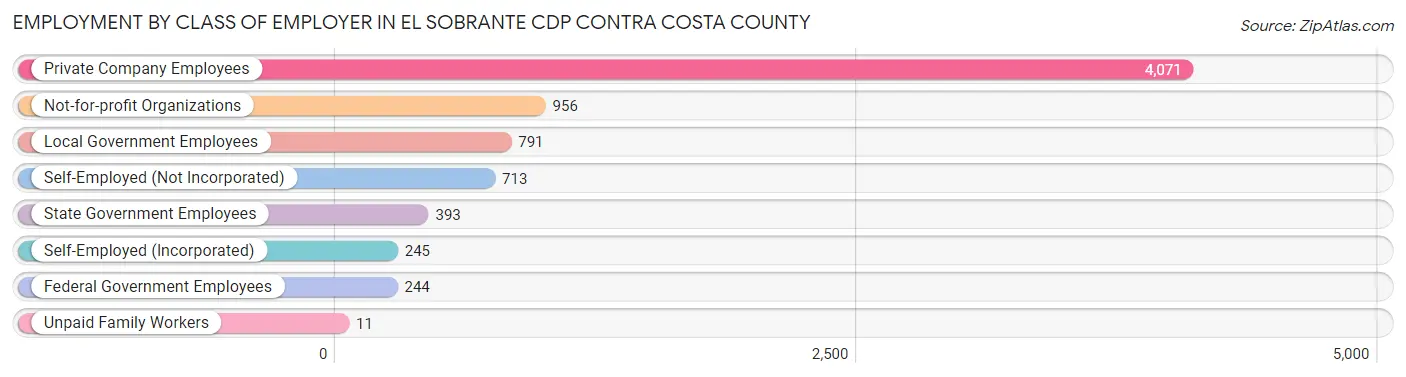
| Employer Class | # Employees | % Employees |
| Private Company Employees | 4,071 | 54.8% |
| Self-Employed (Incorporated) | 245 | 3.3% |
| Self-Employed (Not Incorporated) | 713 | 9.6% |
| Not-for-profit Organizations | 956 | 12.9% |
| Local Government Employees | 791 | 10.6% |
| State Government Employees | 393 | 5.3% |
| Federal Government Employees | 244 | 3.3% |
| Unpaid Family Workers | 11 | 0.2% |
| Total | 7,424 | 100.0% |
Employment Status by Age in El Sobrante CDP Contra Costa County
According to the labor force statistics for El Sobrante CDP Contra Costa County, out of the total population over 16 years of age (12,770), 64.7% or 8,262 individuals are in the labor force, with 5.6% or 463 of them unemployed. The age group with the highest labor force participation rate is 35 to 44 years, with 87.0% or 1,714 individuals in the labor force. Within the labor force, the 20 to 24 years age range has the highest percentage of unemployed individuals, with 22.5% or 121 of them being unemployed.
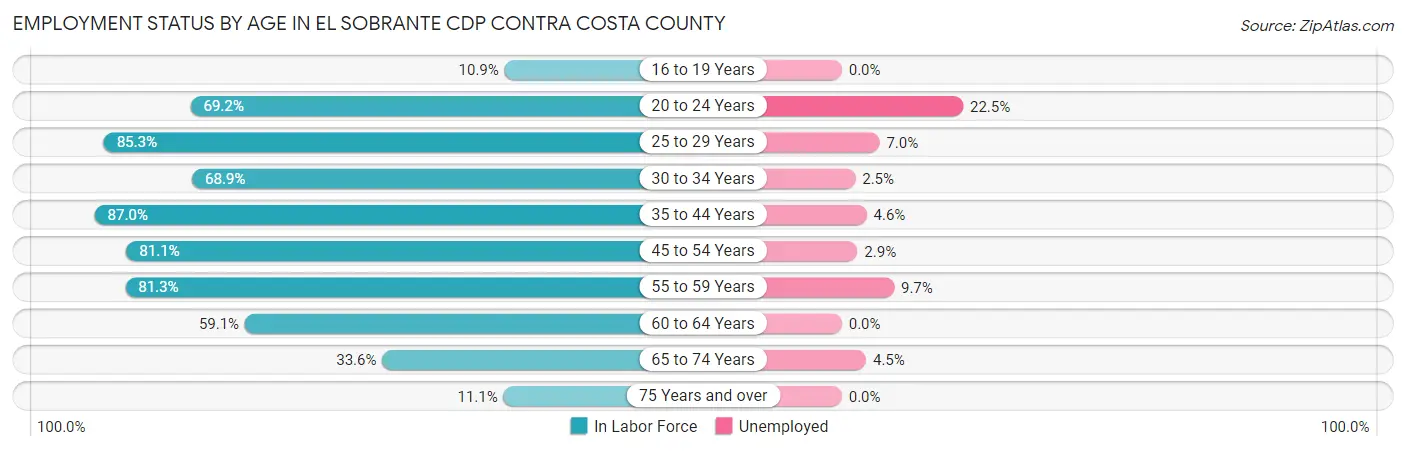
| Age Bracket | In Labor Force | Unemployed |
| 16 to 19 Years | 36 (10.9%) | 0 (0.0%) |
| 20 to 24 Years | 538 (69.2%) | 121 (22.5%) |
| 25 to 29 Years | 1,004 (85.3%) | 70 (7.0%) |
| 30 to 34 Years | 956 (68.9%) | 24 (2.5%) |
| 35 to 44 Years | 1,714 (87.0%) | 79 (4.6%) |
| 45 to 54 Years | 1,843 (81.1%) | 53 (2.9%) |
| 55 to 59 Years | 911 (81.3%) | 88 (9.7%) |
| 60 to 64 Years | 518 (59.1%) | 0 (0.0%) |
| 65 to 74 Years | 642 (33.6%) | 29 (4.5%) |
| 75 Years and over | 105 (11.1%) | 0 (0.0%) |
| Total | 8,262 (64.7%) | 463 (5.6%) |
Employment Status by Educational Attainment in El Sobrante CDP Contra Costa County
According to labor force statistics for El Sobrante CDP Contra Costa County, 78.9% of individuals (6,946) out of the total population between 25 and 64 years of age (8,804) are in the labor force, with 4.5% or 313 of them being unemployed. The group with the highest labor force participation rate are those with the educational attainment of bachelor's degree or higher, with 84.5% or 2,685 individuals in the labor force. Within the labor force, individuals with college / associate degree education have the highest percentage of unemployment, with 6.1% or 136 of them being unemployed.
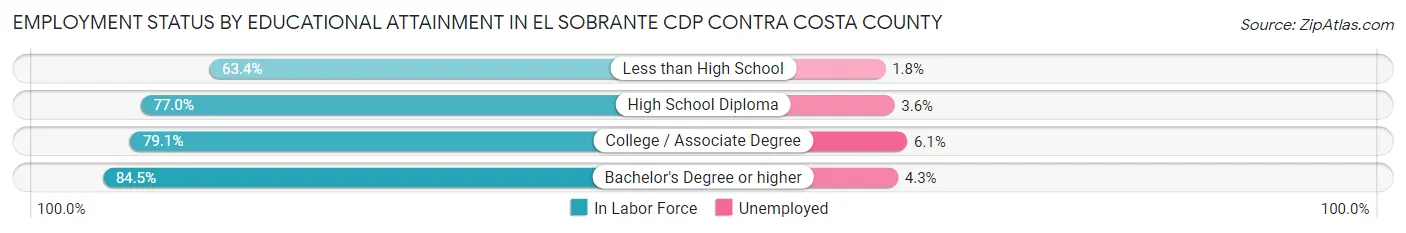
| Educational Attainment | In Labor Force | Unemployed |
| Less than High School | 603 (63.4%) | 17 (1.8%) |
| High School Diploma | 1,428 (77.0%) | 67 (3.6%) |
| College / Associate Degree | 2,231 (79.1%) | 172 (6.1%) |
| Bachelor's Degree or higher | 2,685 (84.5%) | 137 (4.3%) |
| Total | 6,946 (78.9%) | 396 (4.5%) |
Employment Occupations by Sex in El Sobrante CDP Contra Costa County
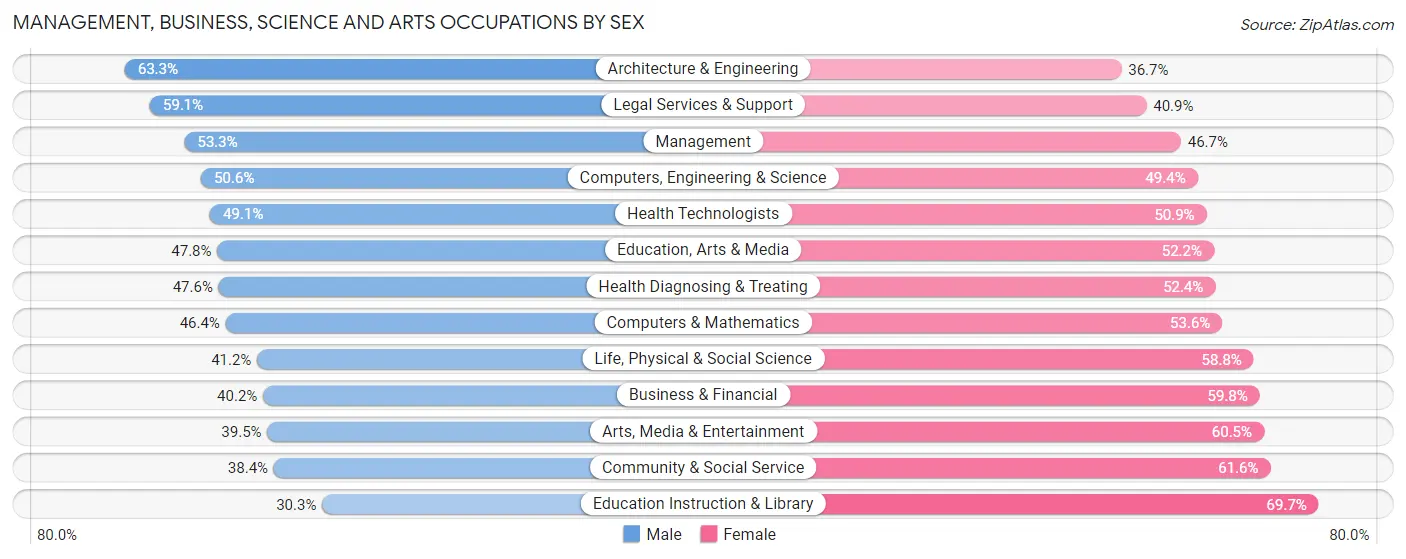
Management, Business, Science and Arts Occupations
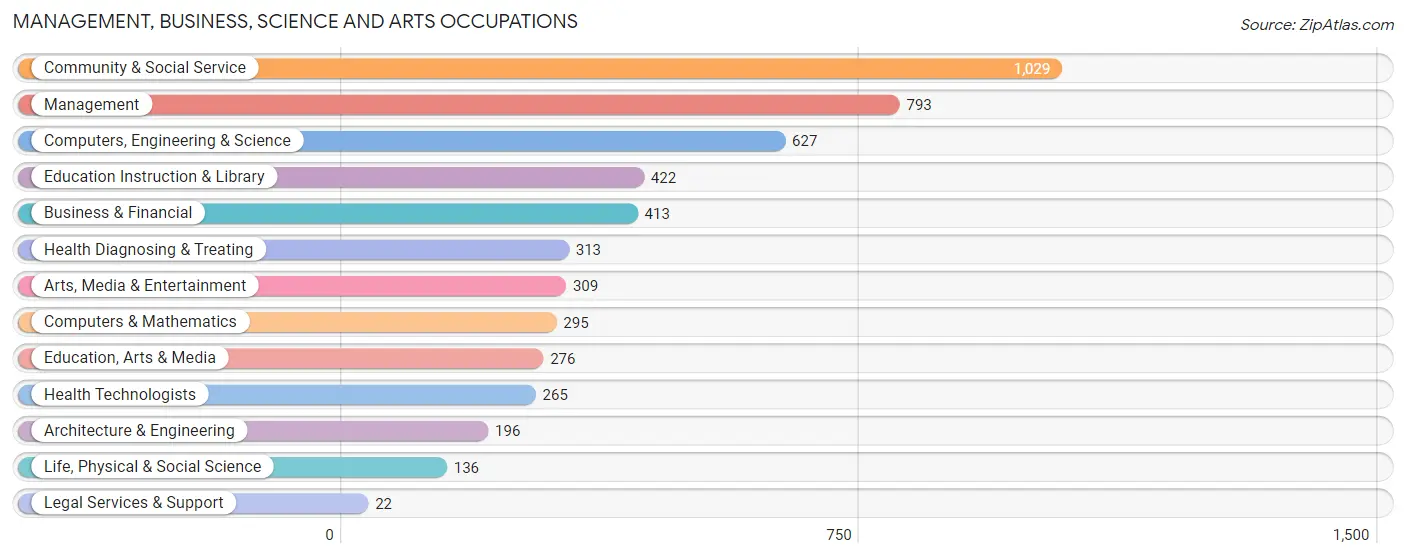
The most common Management, Business, Science and Arts occupations in El Sobrante CDP Contra Costa County are Community & Social Service (1,029 | 13.2%), Management (793 | 10.2%), Computers, Engineering & Science (627 | 8.0%), Education Instruction & Library (422 | 5.4%), and Business & Financial (413 | 5.3%).
Management, Business, Science and Arts Occupations by Sex
Within the Management, Business, Science and Arts occupations in El Sobrante CDP Contra Costa County, the most male-oriented occupations are Architecture & Engineering (63.3%), Legal Services & Support (59.1%), and Management (53.3%), while the most female-oriented occupations are Education Instruction & Library (69.7%), Community & Social Service (61.6%), and Arts, Media & Entertainment (60.5%).
| Occupation | Male | Female |
| Management | 423 (53.3%) | 370 (46.7%) |
| Business & Financial | 166 (40.2%) | 247 (59.8%) |
| Computers, Engineering & Science | 317 (50.6%) | 310 (49.4%) |
| Computers & Mathematics | 137 (46.4%) | 158 (53.6%) |
| Architecture & Engineering | 124 (63.3%) | 72 (36.7%) |
| Life, Physical & Social Science | 56 (41.2%) | 80 (58.8%) |
| Community & Social Service | 395 (38.4%) | 634 (61.6%) |
| Education, Arts & Media | 132 (47.8%) | 144 (52.2%) |
| Legal Services & Support | 13 (59.1%) | 9 (40.9%) |
| Education Instruction & Library | 128 (30.3%) | 294 (69.7%) |
| Arts, Media & Entertainment | 122 (39.5%) | 187 (60.5%) |
| Health Diagnosing & Treating | 149 (47.6%) | 164 (52.4%) |
| Health Technologists | 130 (49.1%) | 135 (50.9%) |
| Total (Category) | 1,450 (45.7%) | 1,725 (54.3%) |
| Total (Overall) | 4,118 (52.8%) | 3,684 (47.2%) |
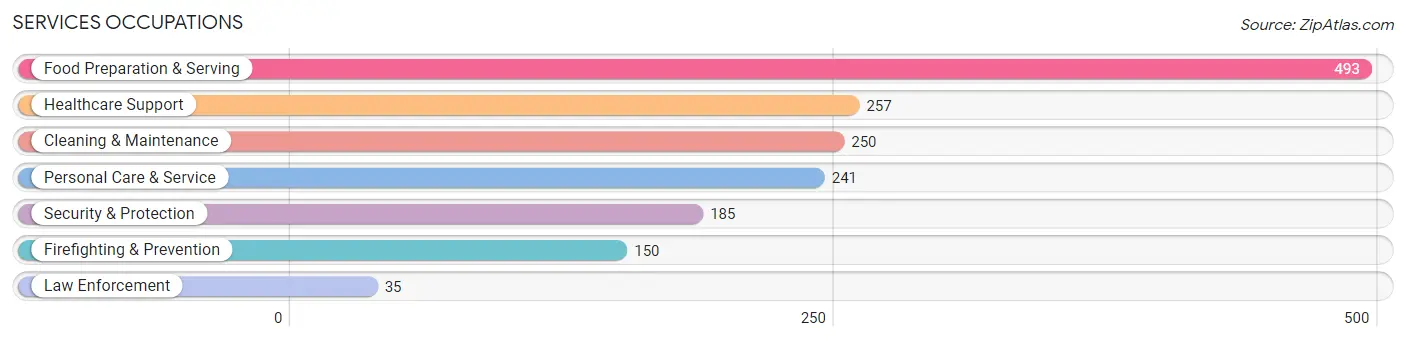
Services Occupations
The most common Services occupations in El Sobrante CDP Contra Costa County are Food Preparation & Serving (493 | 6.3%), Healthcare Support (257 | 3.3%), Cleaning & Maintenance (250 | 3.2%), Personal Care & Service (241 | 3.1%), and Security & Protection (185 | 2.4%).
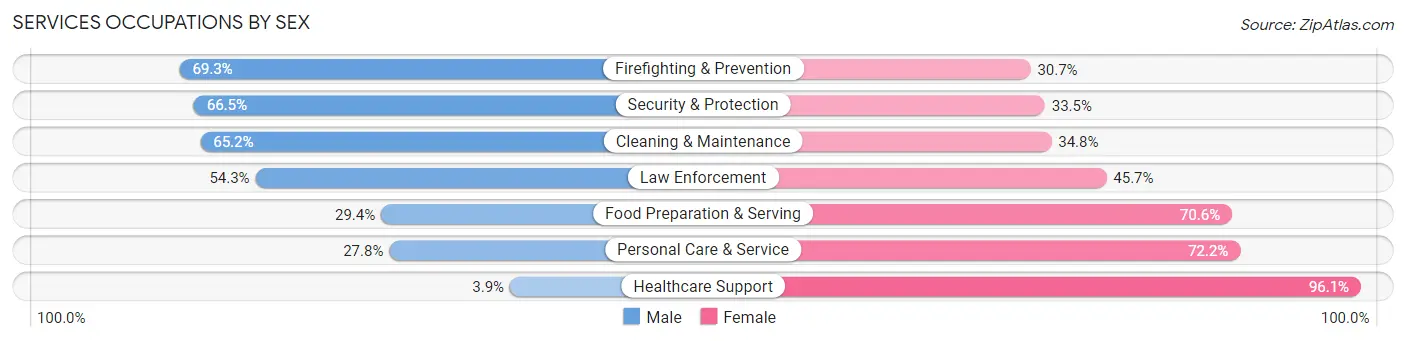
Services Occupations by Sex
Within the Services occupations in El Sobrante CDP Contra Costa County, the most male-oriented occupations are Firefighting & Prevention (69.3%), Security & Protection (66.5%), and Cleaning & Maintenance (65.2%), while the most female-oriented occupations are Healthcare Support (96.1%), Personal Care & Service (72.2%), and Food Preparation & Serving (70.6%).
| Occupation | Male | Female |
| Healthcare Support | 10 (3.9%) | 247 (96.1%) |
| Security & Protection | 123 (66.5%) | 62 (33.5%) |
| Firefighting & Prevention | 104 (69.3%) | 46 (30.7%) |
| Law Enforcement | 19 (54.3%) | 16 (45.7%) |
| Food Preparation & Serving | 145 (29.4%) | 348 (70.6%) |
| Cleaning & Maintenance | 163 (65.2%) | 87 (34.8%) |
| Personal Care & Service | 67 (27.8%) | 174 (72.2%) |
| Total (Category) | 508 (35.6%) | 918 (64.4%) |
| Total (Overall) | 4,118 (52.8%) | 3,684 (47.2%) |
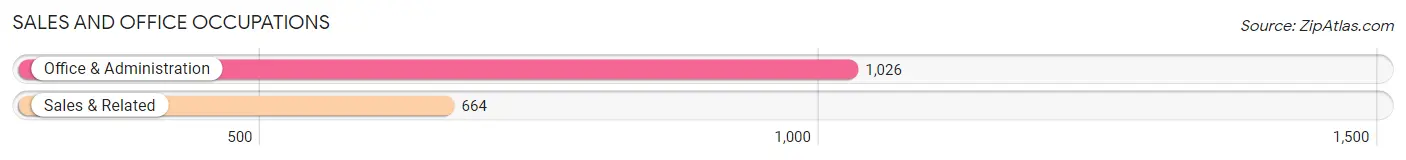
Sales and Office Occupations
The most common Sales and Office occupations in El Sobrante CDP Contra Costa County are Office & Administration (1,026 | 13.2%), and Sales & Related (664 | 8.5%).
Sales and Office Occupations by Sex
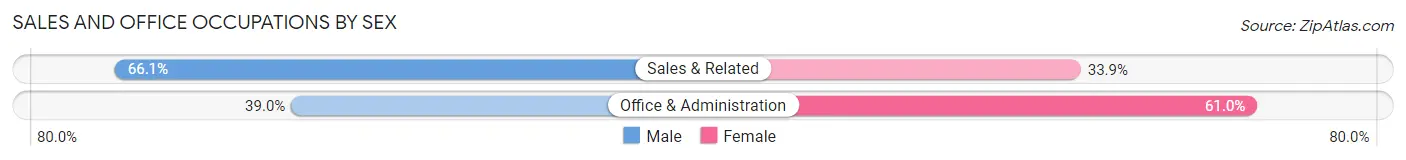
| Occupation | Male | Female |
| Sales & Related | 439 (66.1%) | 225 (33.9%) |
| Office & Administration | 400 (39.0%) | 626 (61.0%) |
| Total (Category) | 839 (49.6%) | 851 (50.4%) |
| Total (Overall) | 4,118 (52.8%) | 3,684 (47.2%) |
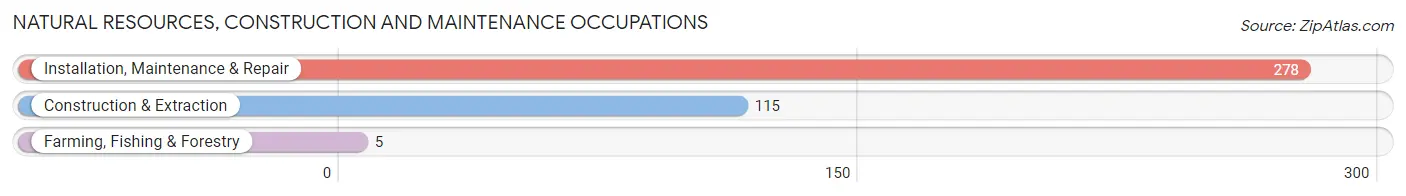
Natural Resources, Construction and Maintenance Occupations
The most common Natural Resources, Construction and Maintenance occupations in El Sobrante CDP Contra Costa County are Installation, Maintenance & Repair (278 | 3.6%), Construction & Extraction (115 | 1.5%), and Farming, Fishing & Forestry (5 | 0.1%).
Natural Resources, Construction and Maintenance Occupations by Sex
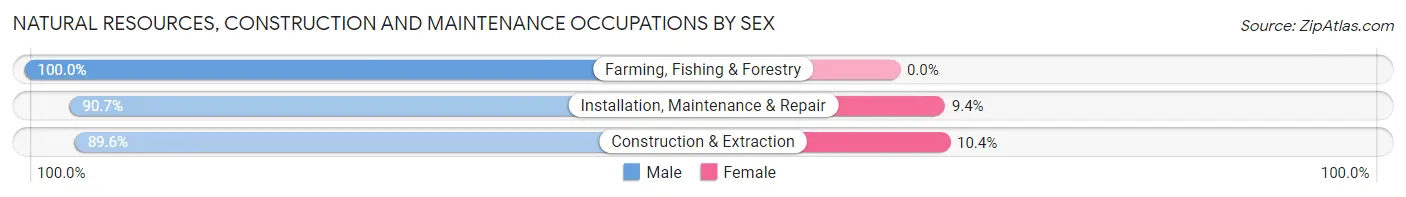
| Occupation | Male | Female |
| Farming, Fishing & Forestry | 5 (100.0%) | 0 (0.0%) |
| Construction & Extraction | 103 (89.6%) | 12 (10.4%) |
| Installation, Maintenance & Repair | 252 (90.6%) | 26 (9.3%) |
| Total (Category) | 360 (90.4%) | 38 (9.6%) |
| Total (Overall) | 4,118 (52.8%) | 3,684 (47.2%) |
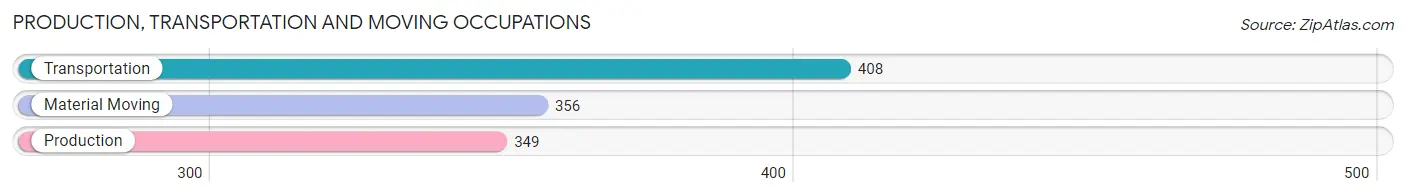
Production, Transportation and Moving Occupations
The most common Production, Transportation and Moving occupations in El Sobrante CDP Contra Costa County are Transportation (408 | 5.2%), Material Moving (356 | 4.6%), and Production (349 | 4.5%).
Production, Transportation and Moving Occupations by Sex
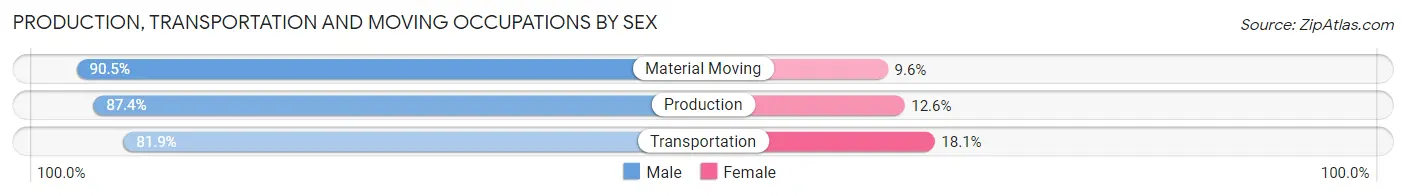
| Occupation | Male | Female |
| Production | 305 (87.4%) | 44 (12.6%) |
| Transportation | 334 (81.9%) | 74 (18.1%) |
| Material Moving | 322 (90.4%) | 34 (9.6%) |
| Total (Category) | 961 (86.3%) | 152 (13.7%) |
| Total (Overall) | 4,118 (52.8%) | 3,684 (47.2%) |
Employment Industries by Sex in El Sobrante CDP Contra Costa County
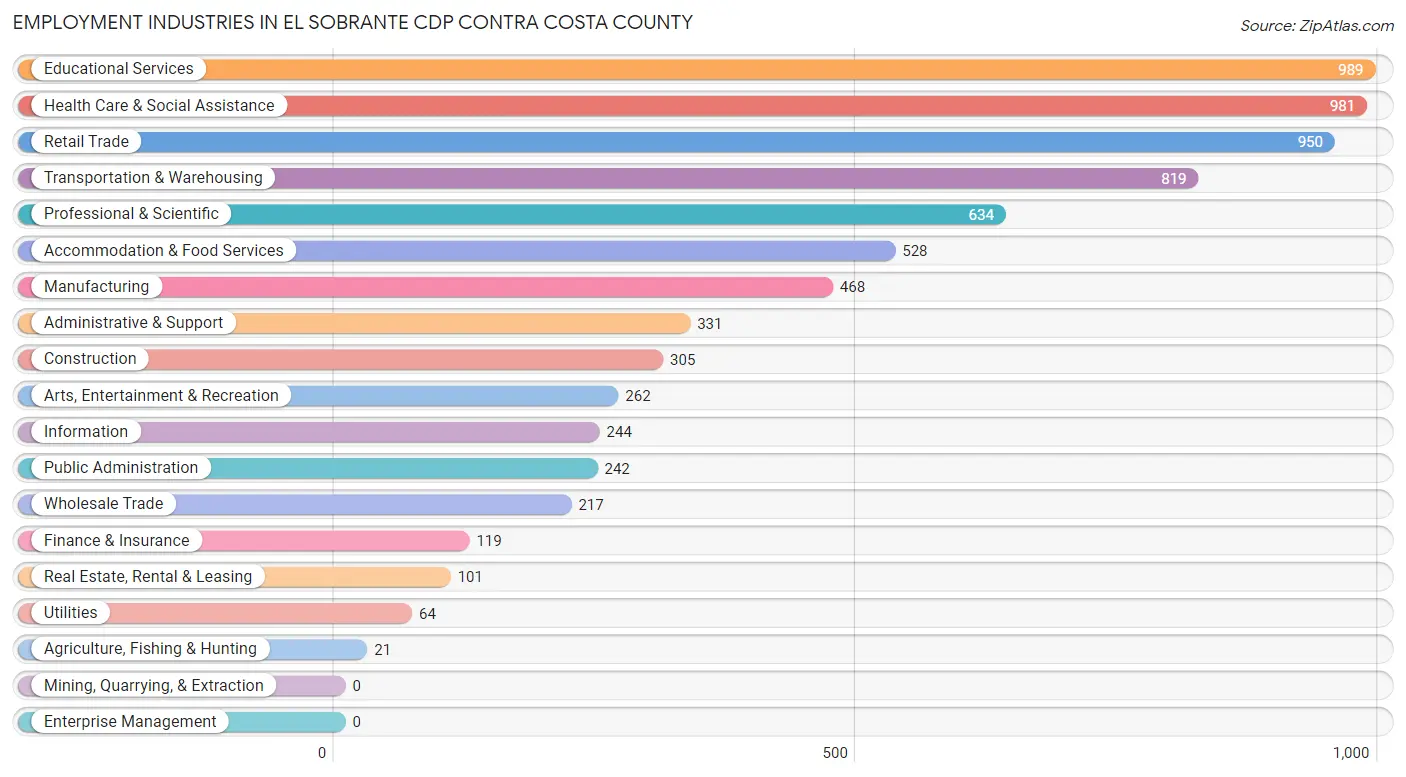
Employment Industries in El Sobrante CDP Contra Costa County
The major employment industries in El Sobrante CDP Contra Costa County include Educational Services (989 | 12.7%), Health Care & Social Assistance (981 | 12.6%), Retail Trade (950 | 12.2%), Transportation & Warehousing (819 | 10.5%), and Professional & Scientific (634 | 8.1%).
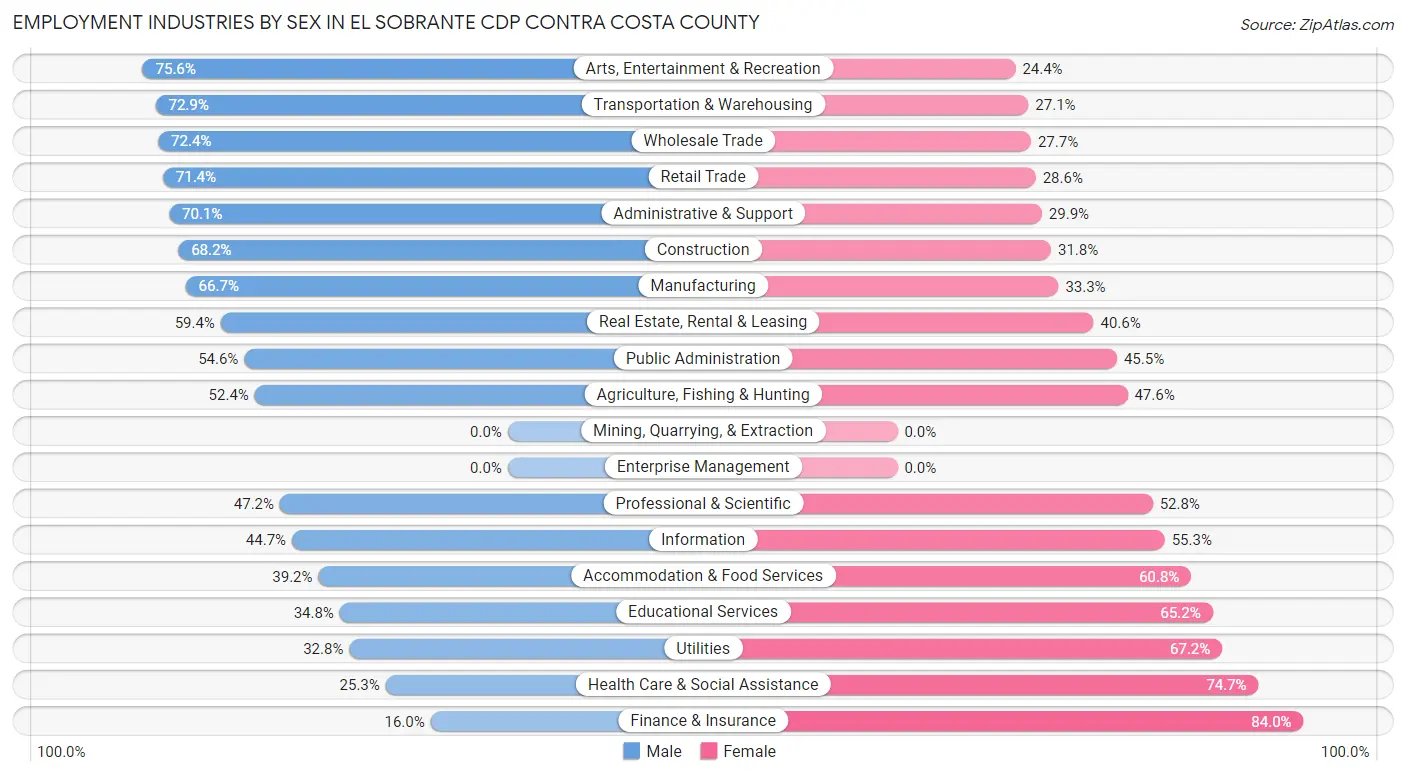
Employment Industries by Sex in El Sobrante CDP Contra Costa County
The El Sobrante CDP Contra Costa County industries that see more men than women are Arts, Entertainment & Recreation (75.6%), Transportation & Warehousing (72.9%), and Wholesale Trade (72.4%), whereas the industries that tend to have a higher number of women are Finance & Insurance (84.0%), Health Care & Social Assistance (74.7%), and Utilities (67.2%).
| Industry | Male | Female |
| Agriculture, Fishing & Hunting | 11 (52.4%) | 10 (47.6%) |
| Mining, Quarrying, & Extraction | 0 (0.0%) | 0 (0.0%) |
| Construction | 208 (68.2%) | 97 (31.8%) |
| Manufacturing | 312 (66.7%) | 156 (33.3%) |
| Wholesale Trade | 157 (72.4%) | 60 (27.7%) |
| Retail Trade | 678 (71.4%) | 272 (28.6%) |
| Transportation & Warehousing | 597 (72.9%) | 222 (27.1%) |
| Utilities | 21 (32.8%) | 43 (67.2%) |
| Information | 109 (44.7%) | 135 (55.3%) |
| Finance & Insurance | 19 (16.0%) | 100 (84.0%) |
| Real Estate, Rental & Leasing | 60 (59.4%) | 41 (40.6%) |
| Professional & Scientific | 299 (47.2%) | 335 (52.8%) |
| Enterprise Management | 0 (0.0%) | 0 (0.0%) |
| Administrative & Support | 232 (70.1%) | 99 (29.9%) |
| Educational Services | 344 (34.8%) | 645 (65.2%) |
| Health Care & Social Assistance | 248 (25.3%) | 733 (74.7%) |
| Arts, Entertainment & Recreation | 198 (75.6%) | 64 (24.4%) |
| Accommodation & Food Services | 207 (39.2%) | 321 (60.8%) |
| Public Administration | 132 (54.5%) | 110 (45.5%) |
| Total | 4,118 (52.8%) | 3,684 (47.2%) |
Education in El Sobrante CDP Contra Costa County
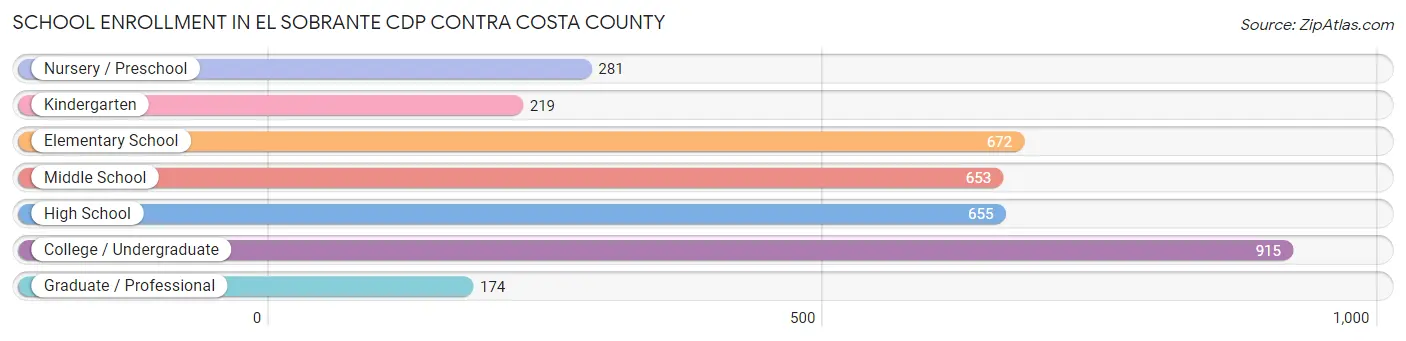
School Enrollment in El Sobrante CDP Contra Costa County
The most common levels of schooling among the 3,569 students in El Sobrante CDP Contra Costa County are college / undergraduate (915 | 25.6%), elementary school (672 | 18.8%), and high school (655 | 18.3%).
| School Level | # Students | % Students |
| Nursery / Preschool | 281 | 7.9% |
| Kindergarten | 219 | 6.1% |
| Elementary School | 672 | 18.8% |
| Middle School | 653 | 18.3% |
| High School | 655 | 18.3% |
| College / Undergraduate | 915 | 25.6% |
| Graduate / Professional | 174 | 4.9% |
| Total | 3,569 | 100.0% |
School Enrollment by Age by Funding Source in El Sobrante CDP Contra Costa County
Out of a total of 3,569 students who are enrolled in schools in El Sobrante CDP Contra Costa County, 739 (20.7%) attend a private institution, while the remaining 2,830 (79.3%) are enrolled in public schools. The age group of 3 to 4 year olds has the highest likelihood of being enrolled in private schools, with 85 (59.0% in the age bracket) enrolled. Conversely, the age group of 15 to 17 year olds has the lowest likelihood of being enrolled in a private school, with 397 (91.3% in the age bracket) attending a public institution.
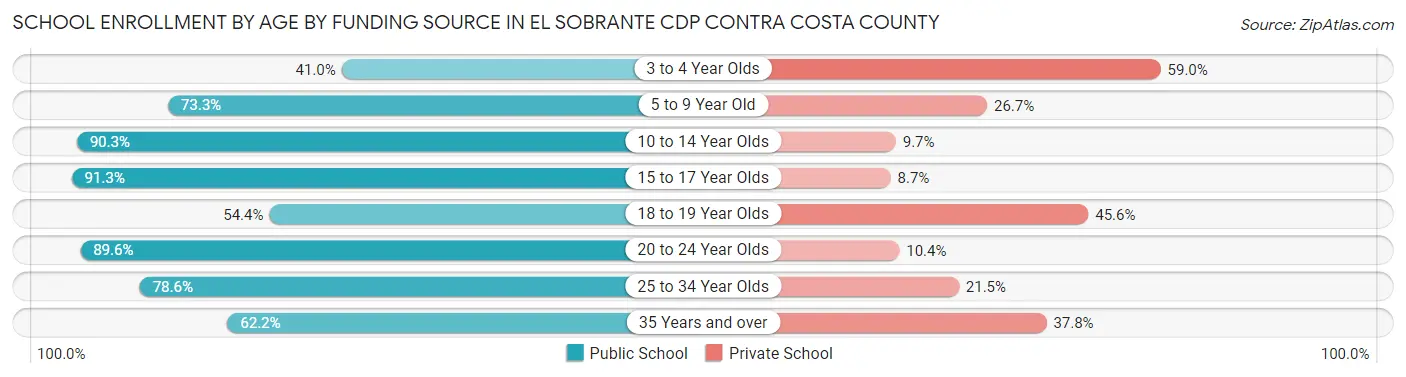
| Age Bracket | Public School | Private School |
| 3 to 4 Year Olds | 59 (41.0%) | 85 (59.0%) |
| 5 to 9 Year Old | 656 (73.3%) | 239 (26.7%) |
| 10 to 14 Year Olds | 846 (90.3%) | 91 (9.7%) |
| 15 to 17 Year Olds | 397 (91.3%) | 38 (8.7%) |
| 18 to 19 Year Olds | 43 (54.4%) | 36 (45.6%) |
| 20 to 24 Year Olds | 346 (89.6%) | 40 (10.4%) |
| 25 to 34 Year Olds | 249 (78.5%) | 68 (21.4%) |
| 35 Years and over | 234 (62.2%) | 142 (37.8%) |
| Total | 2,830 (79.3%) | 739 (20.7%) |
Educational Attainment by Field of Study in El Sobrante CDP Contra Costa County
Social sciences (629 | 14.1%), engineering (474 | 10.6%), business (472 | 10.5%), literature & languages (447 | 10.0%), and education (365 | 8.2%) are the most common fields of study among 4,476 individuals in El Sobrante CDP Contra Costa County who have obtained a bachelor's degree or higher.
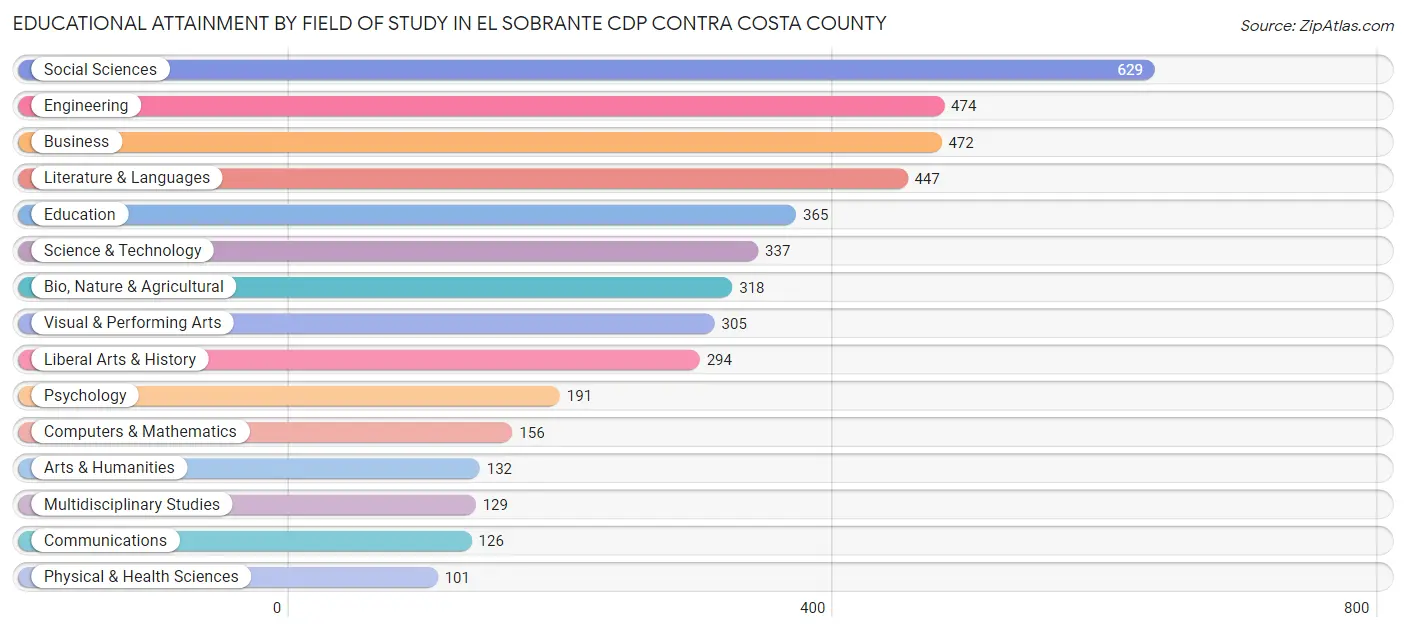
| Field of Study | # Graduates | % Graduates |
| Computers & Mathematics | 156 | 3.5% |
| Bio, Nature & Agricultural | 318 | 7.1% |
| Physical & Health Sciences | 101 | 2.3% |
| Psychology | 191 | 4.3% |
| Social Sciences | 629 | 14.1% |
| Engineering | 474 | 10.6% |
| Multidisciplinary Studies | 129 | 2.9% |
| Science & Technology | 337 | 7.5% |
| Business | 472 | 10.5% |
| Education | 365 | 8.2% |
| Literature & Languages | 447 | 10.0% |
| Liberal Arts & History | 294 | 6.6% |
| Visual & Performing Arts | 305 | 6.8% |
| Communications | 126 | 2.8% |
| Arts & Humanities | 132 | 2.9% |
| Total | 4,476 | 100.0% |
Transportation & Commute in El Sobrante CDP Contra Costa County
Vehicle Availability by Sex in El Sobrante CDP Contra Costa County
The most prevalent vehicle ownership categories in El Sobrante CDP Contra Costa County are males with 2 vehicles (1,734, accounting for 43.8%) and females with 2 vehicles (1,546, making up 50.1%).
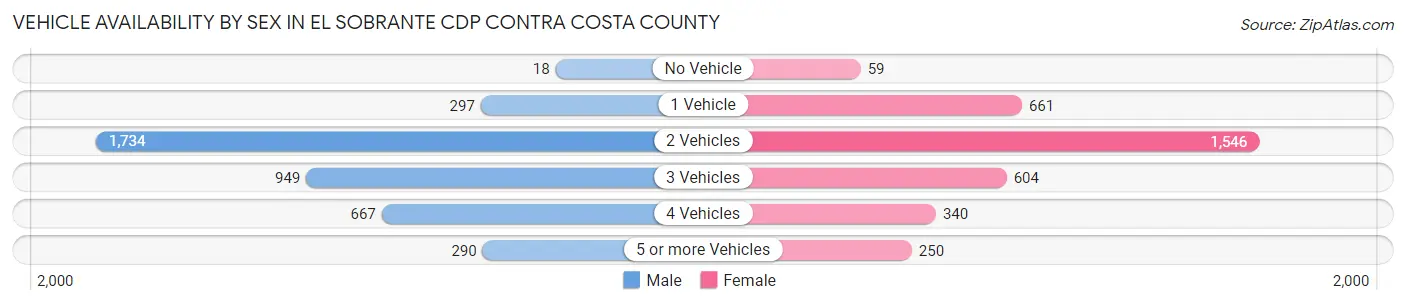
| Vehicles Available | Male | Female |
| No Vehicle | 18 (0.5%) | 59 (1.7%) |
| 1 Vehicle | 297 (7.5%) | 661 (19.1%) |
| 2 Vehicles | 1,734 (43.8%) | 1,546 (44.7%) |
| 3 Vehicles | 949 (24.0%) | 604 (17.5%) |
| 4 Vehicles | 667 (16.9%) | 340 (9.8%) |
| 5 or more Vehicles | 290 (7.3%) | 250 (7.2%) |
| Total | 3,955 (100.0%) | 3,460 (100.0%) |
Commute Time in El Sobrante CDP Contra Costa County
The most frequently occuring commute durations in El Sobrante CDP Contra Costa County are 30 to 34 minutes (1,207 commuters, 18.8%), 60 to 89 minutes (1,042 commuters, 16.3%), and 20 to 24 minutes (966 commuters, 15.1%).
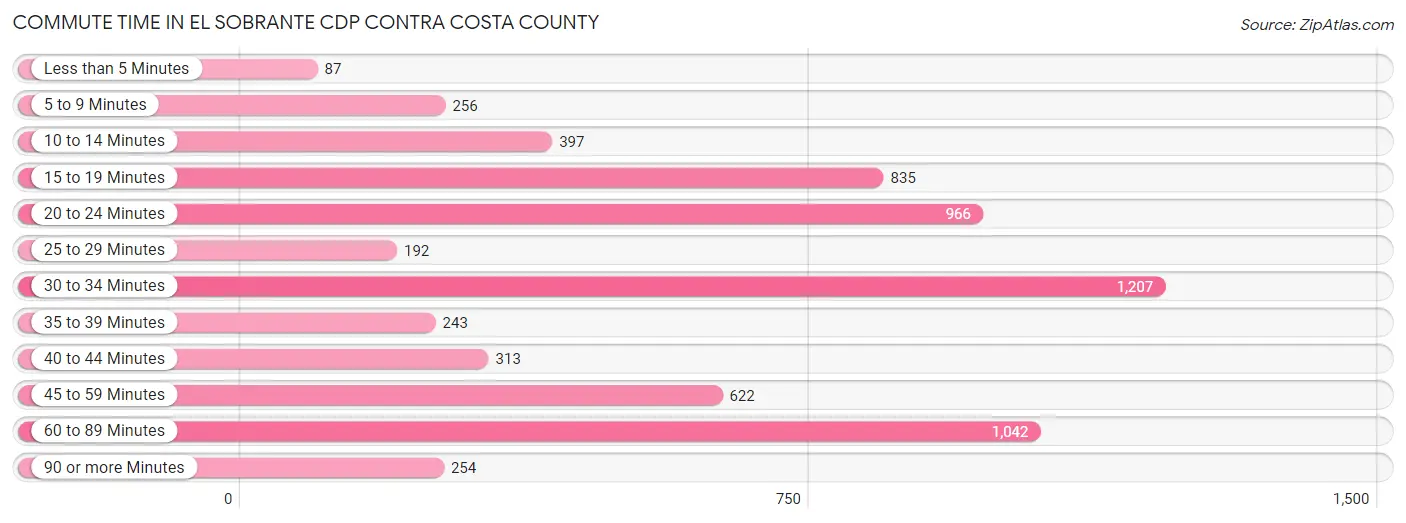
| Commute Time | # Commuters | % Commuters |
| Less than 5 Minutes | 87 | 1.4% |
| 5 to 9 Minutes | 256 | 4.0% |
| 10 to 14 Minutes | 397 | 6.2% |
| 15 to 19 Minutes | 835 | 13.0% |
| 20 to 24 Minutes | 966 | 15.1% |
| 25 to 29 Minutes | 192 | 3.0% |
| 30 to 34 Minutes | 1,207 | 18.8% |
| 35 to 39 Minutes | 243 | 3.8% |
| 40 to 44 Minutes | 313 | 4.9% |
| 45 to 59 Minutes | 622 | 9.7% |
| 60 to 89 Minutes | 1,042 | 16.3% |
| 90 or more Minutes | 254 | 4.0% |
Commute Time by Sex in El Sobrante CDP Contra Costa County
The most common commute times in El Sobrante CDP Contra Costa County are 30 to 34 minutes (909 commuters, 25.9%) for males and 60 to 89 minutes (622 commuters, 21.5%) for females.
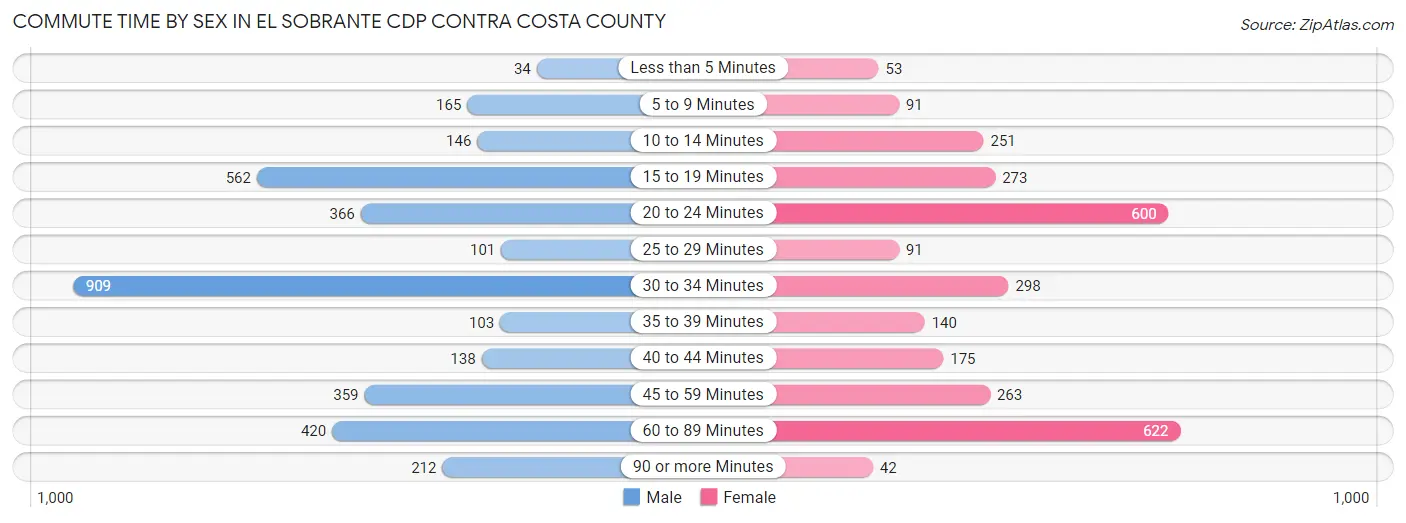
| Commute Time | Male | Female |
| Less than 5 Minutes | 34 (1.0%) | 53 (1.8%) |
| 5 to 9 Minutes | 165 (4.7%) | 91 (3.1%) |
| 10 to 14 Minutes | 146 (4.2%) | 251 (8.7%) |
| 15 to 19 Minutes | 562 (16.0%) | 273 (9.4%) |
| 20 to 24 Minutes | 366 (10.4%) | 600 (20.7%) |
| 25 to 29 Minutes | 101 (2.9%) | 91 (3.1%) |
| 30 to 34 Minutes | 909 (25.9%) | 298 (10.3%) |
| 35 to 39 Minutes | 103 (2.9%) | 140 (4.8%) |
| 40 to 44 Minutes | 138 (3.9%) | 175 (6.0%) |
| 45 to 59 Minutes | 359 (10.2%) | 263 (9.1%) |
| 60 to 89 Minutes | 420 (11.9%) | 622 (21.5%) |
| 90 or more Minutes | 212 (6.0%) | 42 (1.5%) |
Time of Departure to Work by Sex in El Sobrante CDP Contra Costa County
The most frequent times of departure to work in El Sobrante CDP Contra Costa County are 12:00 AM to 4:59 AM (460, 13.1%) for males and 6:30 AM to 6:59 AM (403, 13.9%) for females.
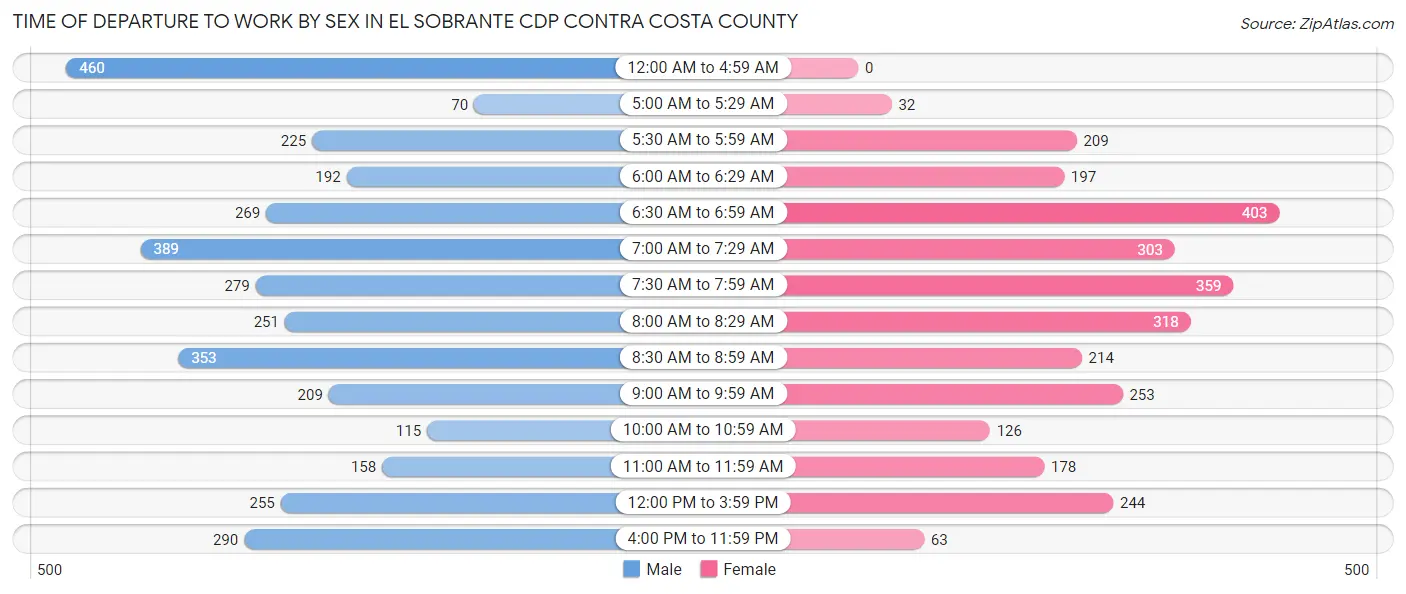
| Time of Departure | Male | Female |
| 12:00 AM to 4:59 AM | 460 (13.1%) | 0 (0.0%) |
| 5:00 AM to 5:29 AM | 70 (2.0%) | 32 (1.1%) |
| 5:30 AM to 5:59 AM | 225 (6.4%) | 209 (7.2%) |
| 6:00 AM to 6:29 AM | 192 (5.5%) | 197 (6.8%) |
| 6:30 AM to 6:59 AM | 269 (7.6%) | 403 (13.9%) |
| 7:00 AM to 7:29 AM | 389 (11.1%) | 303 (10.4%) |
| 7:30 AM to 7:59 AM | 279 (7.9%) | 359 (12.4%) |
| 8:00 AM to 8:29 AM | 251 (7.1%) | 318 (11.0%) |
| 8:30 AM to 8:59 AM | 353 (10.0%) | 214 (7.4%) |
| 9:00 AM to 9:59 AM | 209 (5.9%) | 253 (8.7%) |
| 10:00 AM to 10:59 AM | 115 (3.3%) | 126 (4.3%) |
| 11:00 AM to 11:59 AM | 158 (4.5%) | 178 (6.1%) |
| 12:00 PM to 3:59 PM | 255 (7.2%) | 244 (8.4%) |
| 4:00 PM to 11:59 PM | 290 (8.3%) | 63 (2.2%) |
| Total | 3,515 (100.0%) | 2,899 (100.0%) |
Housing Occupancy in El Sobrante CDP Contra Costa County
Occupancy by Ownership in El Sobrante CDP Contra Costa County
Of the total 5,431 dwellings in El Sobrante CDP Contra Costa County, owner-occupied units account for 3,399 (62.6%), while renter-occupied units make up 2,032 (37.4%).
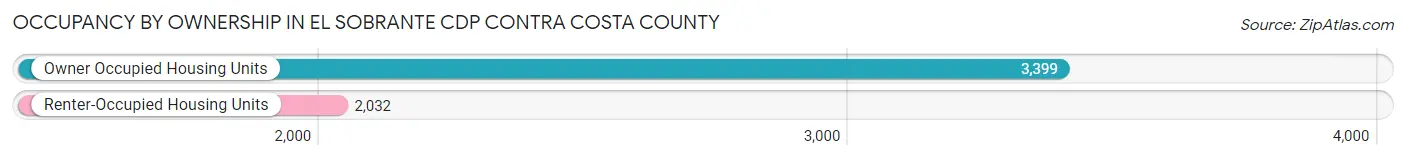
| Occupancy | # Housing Units | % Housing Units |
| Owner Occupied Housing Units | 3,399 | 62.6% |
| Renter-Occupied Housing Units | 2,032 | 37.4% |
| Total Occupied Housing Units | 5,431 | 100.0% |
Occupancy by Household Size in El Sobrante CDP Contra Costa County
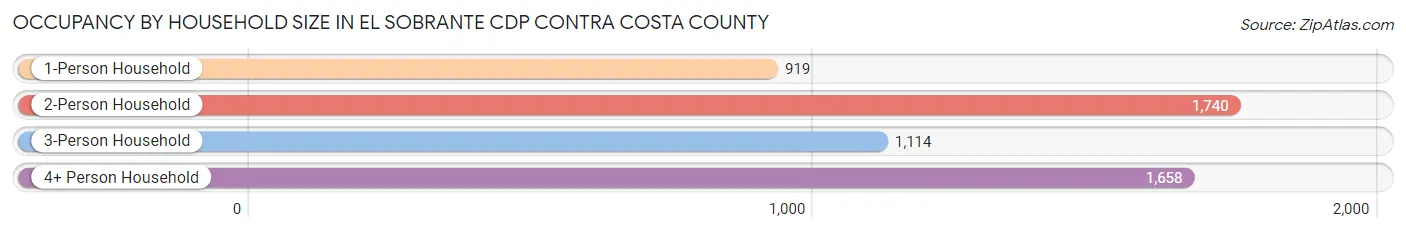
| Household Size | # Housing Units | % Housing Units |
| 1-Person Household | 919 | 16.9% |
| 2-Person Household | 1,740 | 32.0% |
| 3-Person Household | 1,114 | 20.5% |
| 4+ Person Household | 1,658 | 30.5% |
| Total Housing Units | 5,431 | 100.0% |
Occupancy by Ownership by Household Size in El Sobrante CDP Contra Costa County
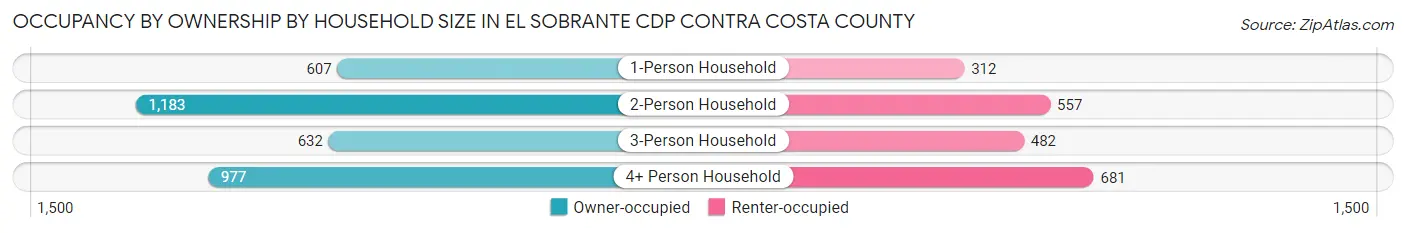
| Household Size | Owner-occupied | Renter-occupied |
| 1-Person Household | 607 (66.0%) | 312 (34.0%) |
| 2-Person Household | 1,183 (68.0%) | 557 (32.0%) |
| 3-Person Household | 632 (56.7%) | 482 (43.3%) |
| 4+ Person Household | 977 (58.9%) | 681 (41.1%) |
| Total Housing Units | 3,399 (62.6%) | 2,032 (37.4%) |
Occupancy by Educational Attainment in El Sobrante CDP Contra Costa County
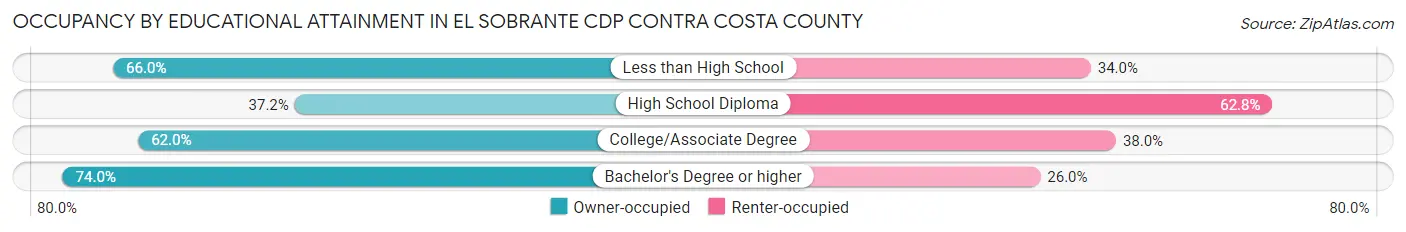
| Household Size | Owner-occupied | Renter-occupied |
| Less than High School | 279 (66.0%) | 144 (34.0%) |
| High School Diploma | 362 (37.2%) | 612 (62.8%) |
| College/Associate Degree | 1,165 (62.0%) | 715 (38.0%) |
| Bachelor's Degree or higher | 1,593 (74.0%) | 561 (26.0%) |
Occupancy by Age of Householder in El Sobrante CDP Contra Costa County
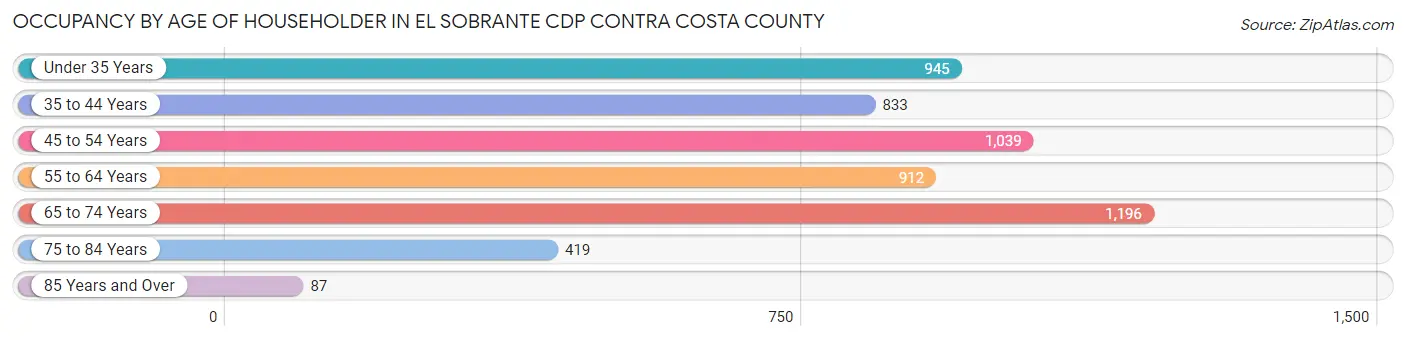
| Age Bracket | # Households | % Households |
| Under 35 Years | 945 | 17.4% |
| 35 to 44 Years | 833 | 15.3% |
| 45 to 54 Years | 1,039 | 19.1% |
| 55 to 64 Years | 912 | 16.8% |
| 65 to 74 Years | 1,196 | 22.0% |
| 75 to 84 Years | 419 | 7.7% |
| 85 Years and Over | 87 | 1.6% |
| Total | 5,431 | 100.0% |
Housing Finances in El Sobrante CDP Contra Costa County
Median Income by Occupancy in El Sobrante CDP Contra Costa County
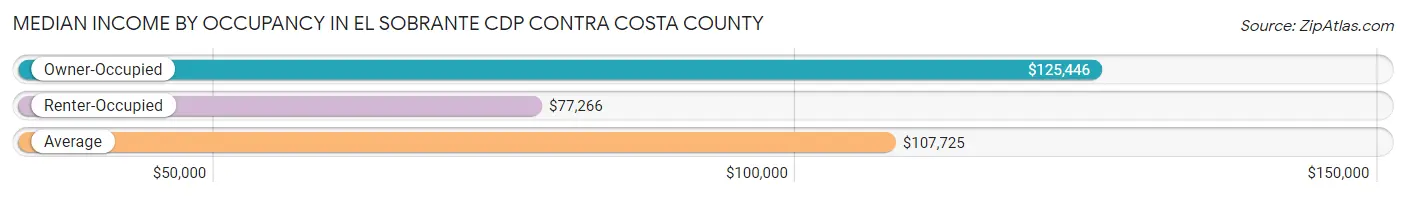
| Occupancy Type | # Households | Median Income |
| Owner-Occupied | 3,399 (62.6%) | $125,446 |
| Renter-Occupied | 2,032 (37.4%) | $77,266 |
| Average | 5,431 (100.0%) | $107,725 |
Occupancy by Householder Income Bracket in El Sobrante CDP Contra Costa County
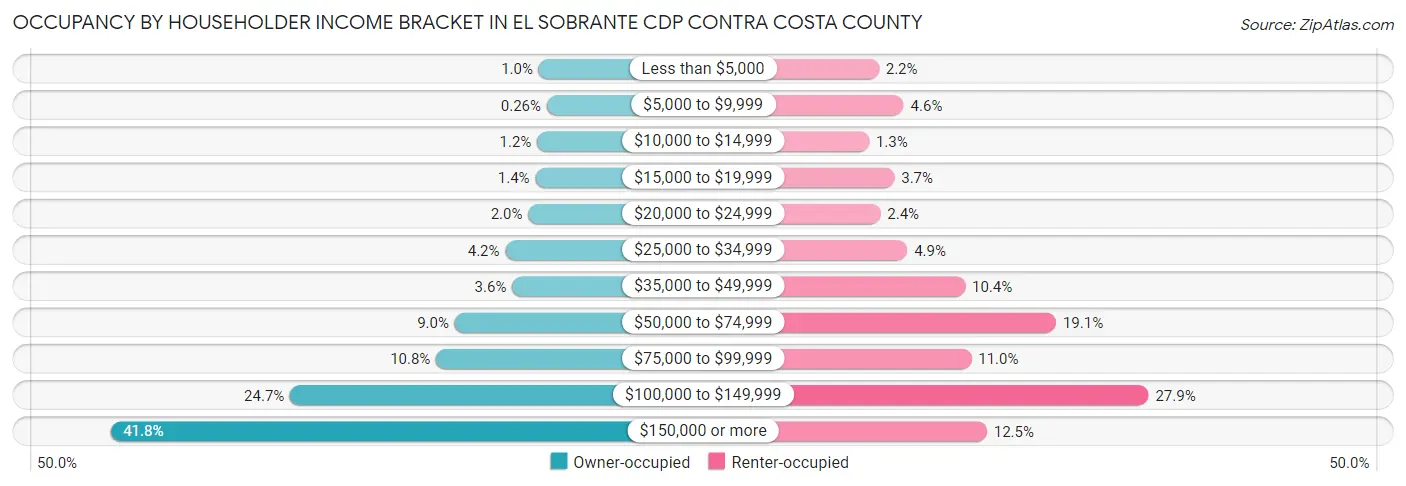
| Income Bracket | Owner-occupied | Renter-occupied |
| Less than $5,000 | 35 (1.0%) | 45 (2.2%) |
| $5,000 to $9,999 | 9 (0.3%) | 93 (4.6%) |
| $10,000 to $14,999 | 40 (1.2%) | 26 (1.3%) |
| $15,000 to $19,999 | 46 (1.3%) | 75 (3.7%) |
| $20,000 to $24,999 | 69 (2.0%) | 48 (2.4%) |
| $25,000 to $34,999 | 143 (4.2%) | 100 (4.9%) |
| $35,000 to $49,999 | 121 (3.6%) | 212 (10.4%) |
| $50,000 to $74,999 | 307 (9.0%) | 388 (19.1%) |
| $75,000 to $99,999 | 367 (10.8%) | 224 (11.0%) |
| $100,000 to $149,999 | 840 (24.7%) | 567 (27.9%) |
| $150,000 or more | 1,422 (41.8%) | 254 (12.5%) |
| Total | 3,399 (100.0%) | 2,032 (100.0%) |
Monthly Housing Cost Tiers in El Sobrante CDP Contra Costa County
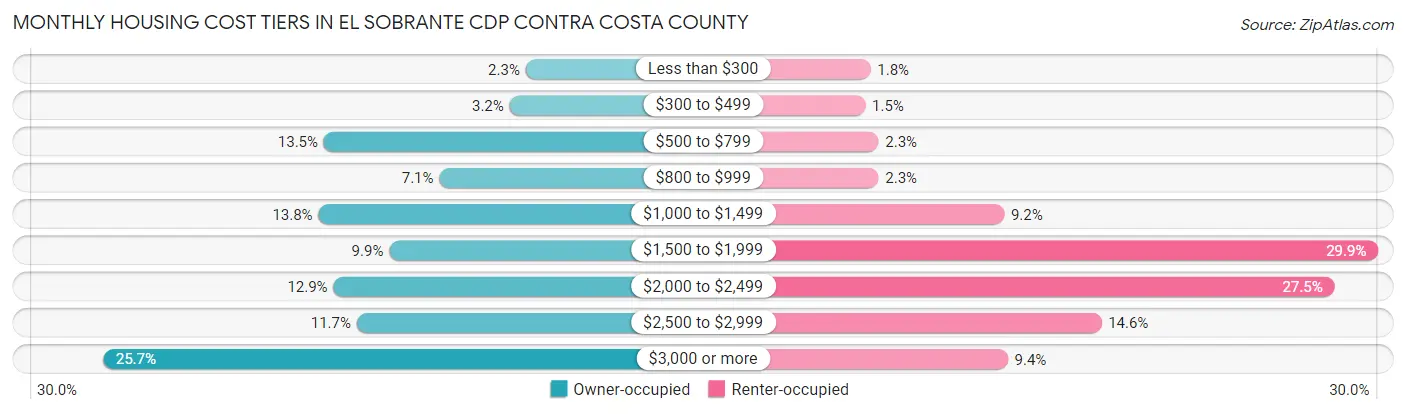
| Monthly Cost | Owner-occupied | Renter-occupied |
| Less than $300 | 79 (2.3%) | 37 (1.8%) |
| $300 to $499 | 109 (3.2%) | 31 (1.5%) |
| $500 to $799 | 458 (13.5%) | 46 (2.3%) |
| $800 to $999 | 241 (7.1%) | 46 (2.3%) |
| $1,000 to $1,499 | 468 (13.8%) | 187 (9.2%) |
| $1,500 to $1,999 | 335 (9.9%) | 607 (29.9%) |
| $2,000 to $2,499 | 440 (12.9%) | 558 (27.5%) |
| $2,500 to $2,999 | 396 (11.7%) | 296 (14.6%) |
| $3,000 or more | 873 (25.7%) | 191 (9.4%) |
| Total | 3,399 (100.0%) | 2,032 (100.0%) |
Physical Housing Characteristics in El Sobrante CDP Contra Costa County
Housing Structures in El Sobrante CDP Contra Costa County
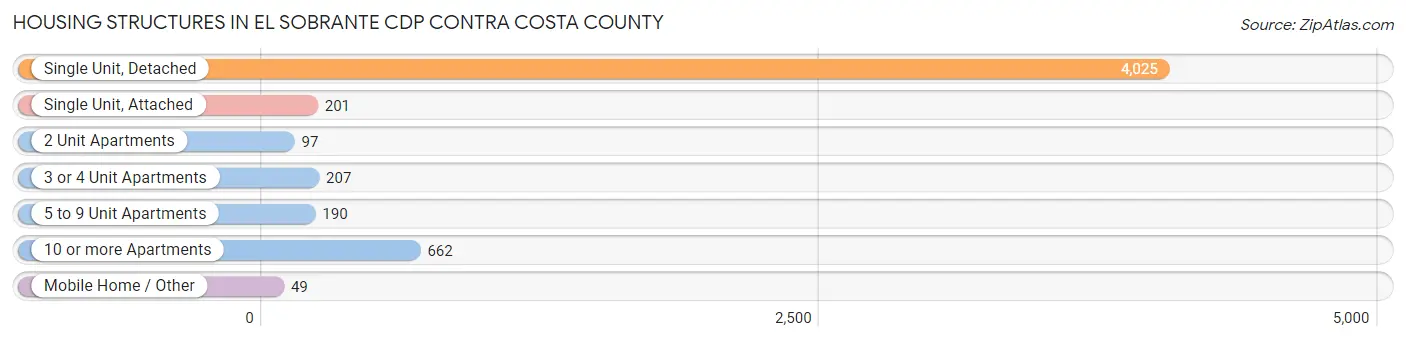
| Structure Type | # Housing Units | % Housing Units |
| Single Unit, Detached | 4,025 | 74.1% |
| Single Unit, Attached | 201 | 3.7% |
| 2 Unit Apartments | 97 | 1.8% |
| 3 or 4 Unit Apartments | 207 | 3.8% |
| 5 to 9 Unit Apartments | 190 | 3.5% |
| 10 or more Apartments | 662 | 12.2% |
| Mobile Home / Other | 49 | 0.9% |
| Total | 5,431 | 100.0% |
Housing Structures by Occupancy in El Sobrante CDP Contra Costa County
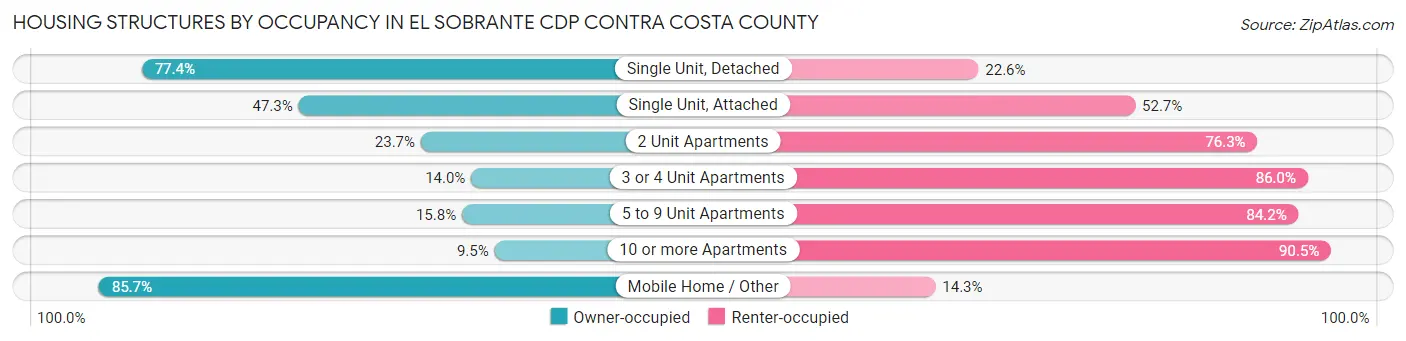
| Structure Type | Owner-occupied | Renter-occupied |
| Single Unit, Detached | 3,117 (77.4%) | 908 (22.6%) |
| Single Unit, Attached | 95 (47.3%) | 106 (52.7%) |
| 2 Unit Apartments | 23 (23.7%) | 74 (76.3%) |
| 3 or 4 Unit Apartments | 29 (14.0%) | 178 (86.0%) |
| 5 to 9 Unit Apartments | 30 (15.8%) | 160 (84.2%) |
| 10 or more Apartments | 63 (9.5%) | 599 (90.5%) |
| Mobile Home / Other | 42 (85.7%) | 7 (14.3%) |
| Total | 3,399 (62.6%) | 2,032 (37.4%) |
Housing Structures by Number of Rooms in El Sobrante CDP Contra Costa County
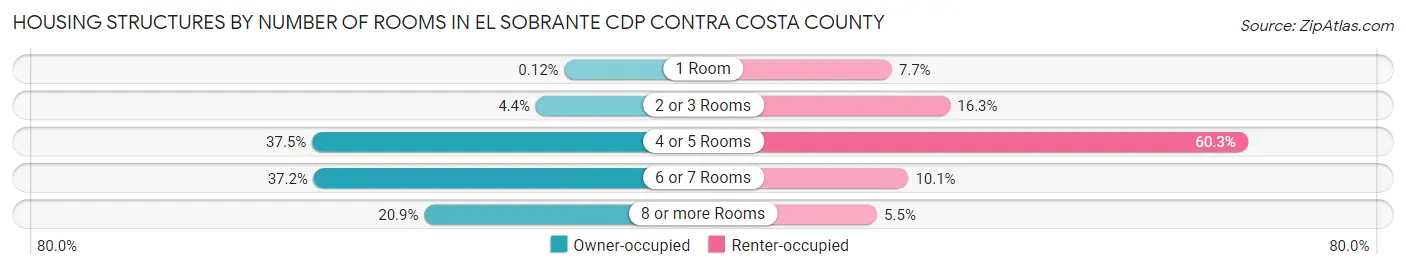
| Number of Rooms | Owner-occupied | Renter-occupied |
| 1 Room | 4 (0.1%) | 156 (7.7%) |
| 2 or 3 Rooms | 148 (4.3%) | 332 (16.3%) |
| 4 or 5 Rooms | 1,273 (37.4%) | 1,226 (60.3%) |
| 6 or 7 Rooms | 1,265 (37.2%) | 206 (10.1%) |
| 8 or more Rooms | 709 (20.9%) | 112 (5.5%) |
| Total | 3,399 (100.0%) | 2,032 (100.0%) |
Housing Structure by Heating Type in El Sobrante CDP Contra Costa County
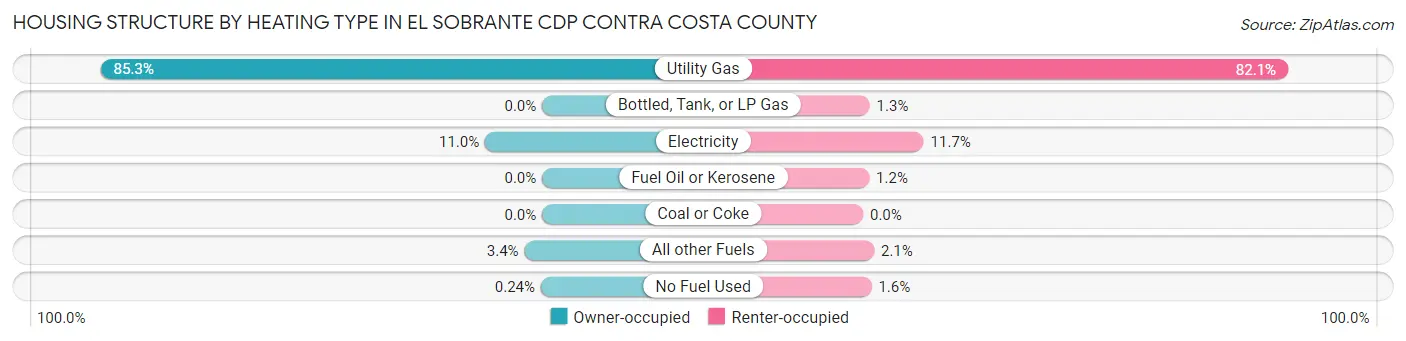
| Heating Type | Owner-occupied | Renter-occupied |
| Utility Gas | 2,900 (85.3%) | 1,668 (82.1%) |
| Bottled, Tank, or LP Gas | 0 (0.0%) | 26 (1.3%) |
| Electricity | 375 (11.0%) | 238 (11.7%) |
| Fuel Oil or Kerosene | 0 (0.0%) | 24 (1.2%) |
| Coal or Coke | 0 (0.0%) | 0 (0.0%) |
| All other Fuels | 116 (3.4%) | 43 (2.1%) |
| No Fuel Used | 8 (0.2%) | 33 (1.6%) |
| Total | 3,399 (100.0%) | 2,032 (100.0%) |
Household Vehicle Usage in El Sobrante CDP Contra Costa County
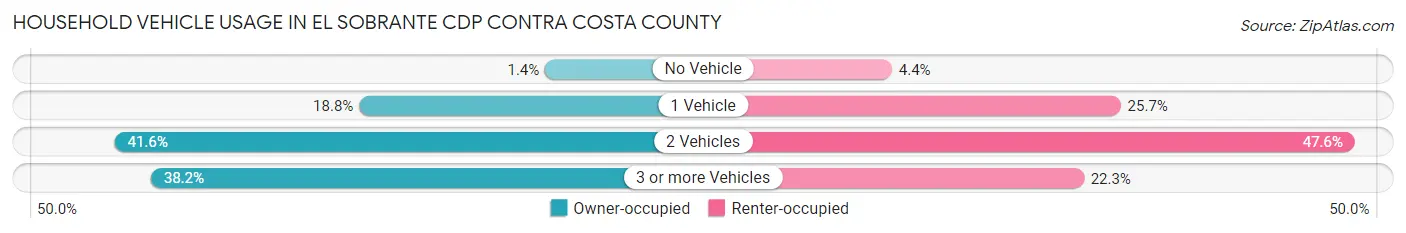
| Vehicles per Household | Owner-occupied | Renter-occupied |
| No Vehicle | 48 (1.4%) | 89 (4.4%) |
| 1 Vehicle | 638 (18.8%) | 523 (25.7%) |
| 2 Vehicles | 1,414 (41.6%) | 967 (47.6%) |
| 3 or more Vehicles | 1,299 (38.2%) | 453 (22.3%) |
| Total | 3,399 (100.0%) | 2,032 (100.0%) |
Real Estate & Mortgages in El Sobrante CDP Contra Costa County
Real Estate and Mortgage Overview in El Sobrante CDP Contra Costa County
| Characteristic | Without Mortgage | With Mortgage |
| Housing Units | 1,106 | 2,293 |
| Median Property Value | $694,600 | $680,400 |
| Median Household Income | $119,444 | $961 |
| Monthly Housing Costs | $767 | $873 |
| Real Estate Taxes | $4,164 | $28 |
Property Value by Mortgage Status in El Sobrante CDP Contra Costa County
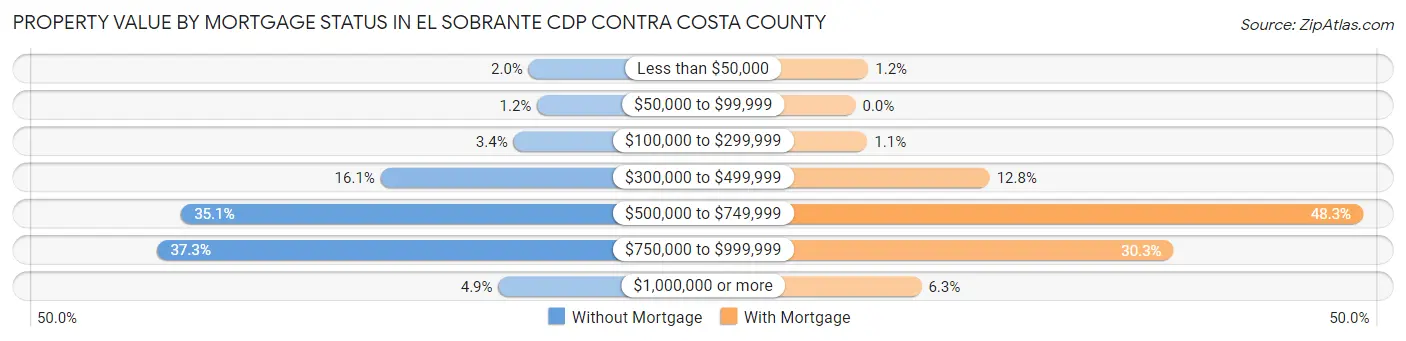
| Property Value | Without Mortgage | With Mortgage |
| Less than $50,000 | 22 (2.0%) | 28 (1.2%) |
| $50,000 to $99,999 | 13 (1.2%) | 0 (0.0%) |
| $100,000 to $299,999 | 38 (3.4%) | 26 (1.1%) |
| $300,000 to $499,999 | 178 (16.1%) | 293 (12.8%) |
| $500,000 to $749,999 | 388 (35.1%) | 1,108 (48.3%) |
| $750,000 to $999,999 | 413 (37.3%) | 694 (30.3%) |
| $1,000,000 or more | 54 (4.9%) | 144 (6.3%) |
| Total | 1,106 (100.0%) | 2,293 (100.0%) |
Household Income by Mortgage Status in El Sobrante CDP Contra Costa County
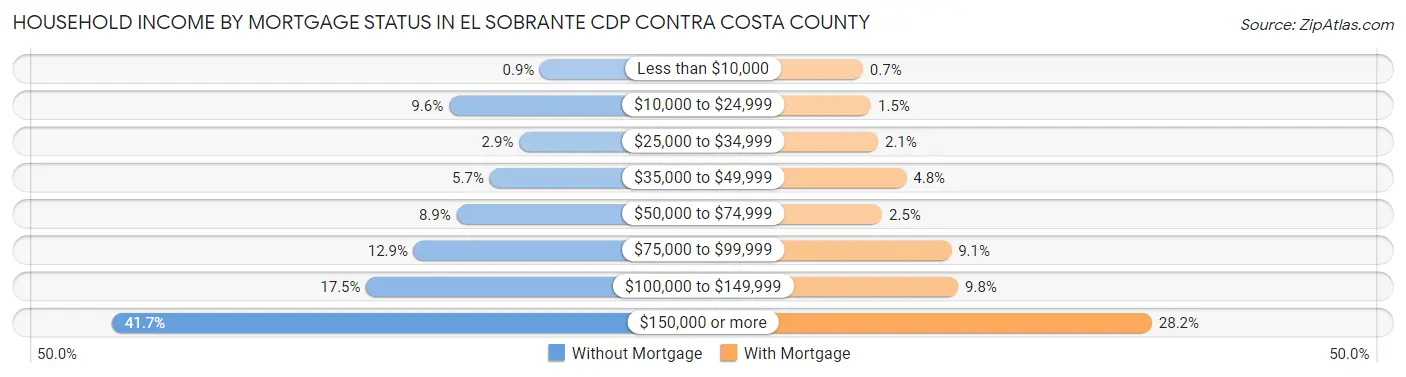
| Household Income | Without Mortgage | With Mortgage |
| Less than $10,000 | 10 (0.9%) | 16 (0.7%) |
| $10,000 to $24,999 | 106 (9.6%) | 34 (1.5%) |
| $25,000 to $34,999 | 32 (2.9%) | 49 (2.1%) |
| $35,000 to $49,999 | 63 (5.7%) | 111 (4.8%) |
| $50,000 to $74,999 | 98 (8.9%) | 58 (2.5%) |
| $75,000 to $99,999 | 143 (12.9%) | 209 (9.1%) |
| $100,000 to $149,999 | 193 (17.4%) | 224 (9.8%) |
| $150,000 or more | 461 (41.7%) | 647 (28.2%) |
| Total | 1,106 (100.0%) | 2,293 (100.0%) |
Property Value to Household Income Ratio in El Sobrante CDP Contra Costa County
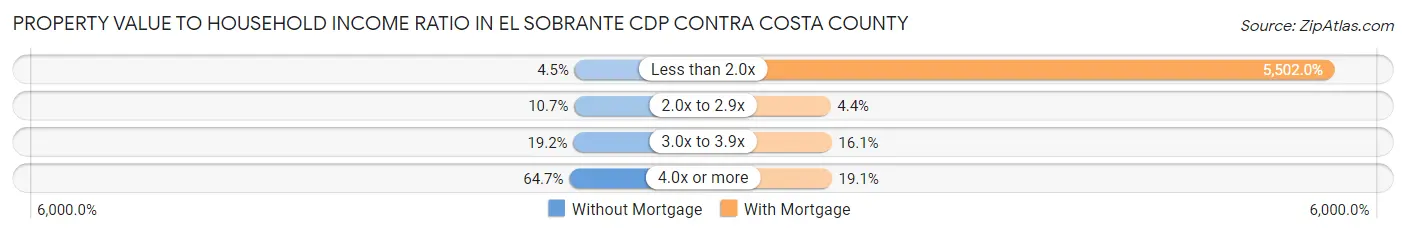
| Value-to-Income Ratio | Without Mortgage | With Mortgage |
| Less than 2.0x | 50 (4.5%) | 126,161 (5,502.0%) |
| 2.0x to 2.9x | 118 (10.7%) | 100 (4.4%) |
| 3.0x to 3.9x | 212 (19.2%) | 368 (16.1%) |
| 4.0x or more | 716 (64.7%) | 437 (19.1%) |
| Total | 1,106 (100.0%) | 2,293 (100.0%) |
Real Estate Taxes by Mortgage Status in El Sobrante CDP Contra Costa County
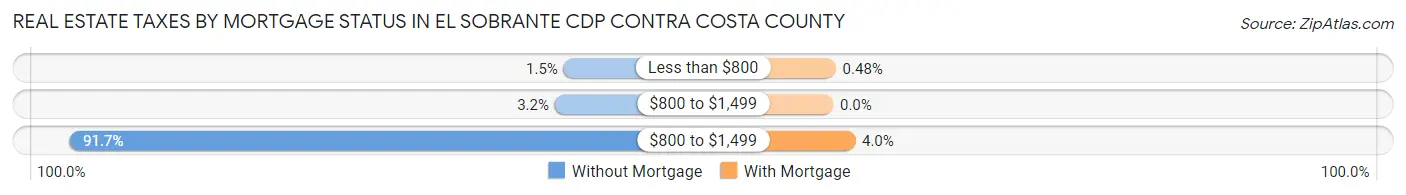
| Property Taxes | Without Mortgage | With Mortgage |
| Less than $800 | 17 (1.5%) | 11 (0.5%) |
| $800 to $1,499 | 35 (3.2%) | 0 (0.0%) |
| $800 to $1,499 | 1,014 (91.7%) | 92 (4.0%) |
| Total | 1,106 (100.0%) | 2,293 (100.0%) |
Health & Disability in El Sobrante CDP Contra Costa County
Health Insurance Coverage by Age in El Sobrante CDP Contra Costa County
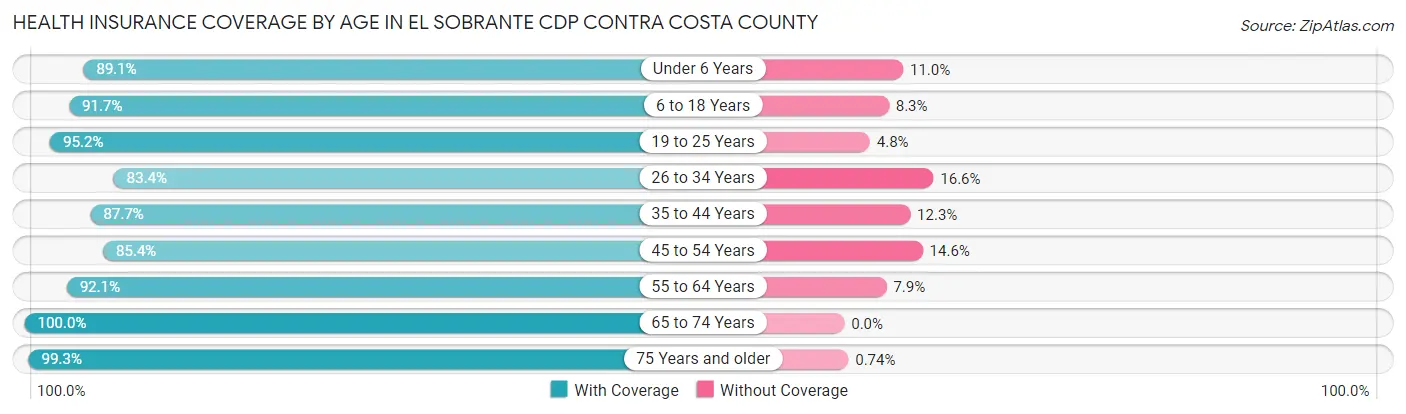
| Age Bracket | With Coverage | Without Coverage |
| Under 6 Years | 878 (89.0%) | 108 (11.0%) |
| 6 to 18 Years | 1,855 (91.7%) | 168 (8.3%) |
| 19 to 25 Years | 860 (95.2%) | 43 (4.8%) |
| 26 to 34 Years | 2,073 (83.4%) | 413 (16.6%) |
| 35 to 44 Years | 1,728 (87.7%) | 242 (12.3%) |
| 45 to 54 Years | 1,940 (85.4%) | 332 (14.6%) |
| 55 to 64 Years | 1,841 (92.1%) | 157 (7.9%) |
| 65 to 74 Years | 1,910 (100.0%) | 0 (0.0%) |
| 75 Years and older | 941 (99.3%) | 7 (0.7%) |
| Total | 14,026 (90.5%) | 1,470 (9.5%) |
Health Insurance Coverage by Citizenship Status in El Sobrante CDP Contra Costa County
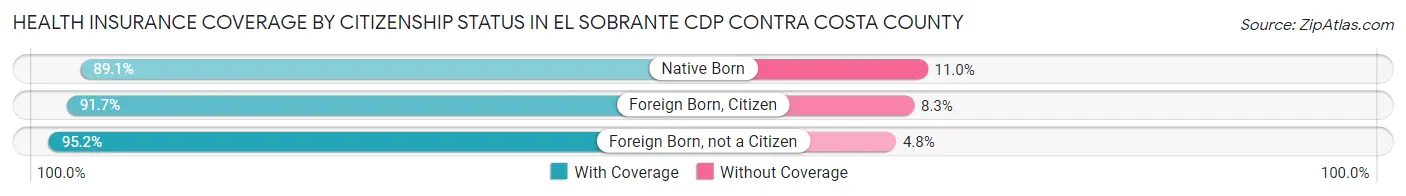
| Citizenship Status | With Coverage | Without Coverage |
| Native Born | 878 (89.0%) | 108 (11.0%) |
| Foreign Born, Citizen | 1,855 (91.7%) | 168 (8.3%) |
| Foreign Born, not a Citizen | 860 (95.2%) | 43 (4.8%) |
Health Insurance Coverage by Household Income in El Sobrante CDP Contra Costa County
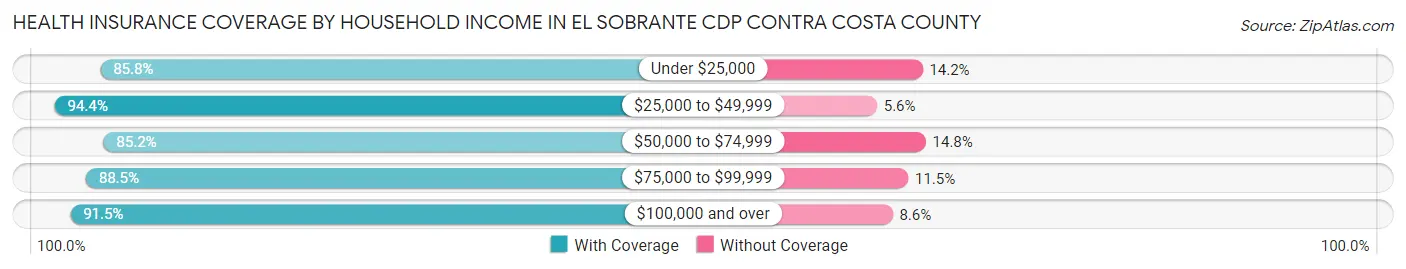
| Household Income | With Coverage | Without Coverage |
| Under $25,000 | 957 (85.8%) | 158 (14.2%) |
| $25,000 to $49,999 | 1,410 (94.4%) | 84 (5.6%) |
| $50,000 to $74,999 | 1,148 (85.2%) | 199 (14.8%) |
| $75,000 to $99,999 | 1,482 (88.5%) | 192 (11.5%) |
| $100,000 and over | 8,957 (91.4%) | 837 (8.6%) |
Public vs Private Health Insurance Coverage by Age in El Sobrante CDP Contra Costa County
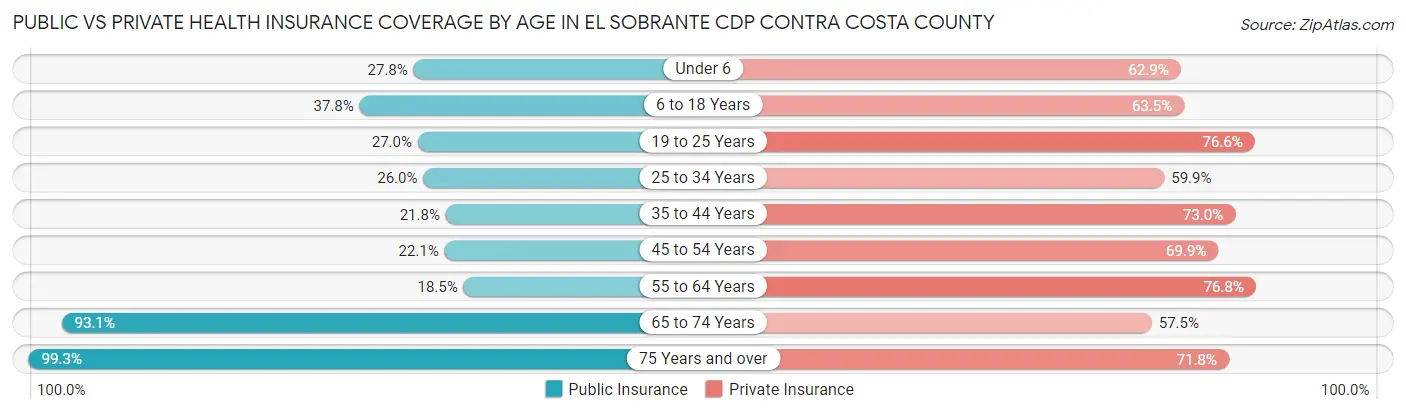
| Age Bracket | Public Insurance | Private Insurance |
| Under 6 | 274 (27.8%) | 620 (62.9%) |
| 6 to 18 Years | 765 (37.8%) | 1,285 (63.5%) |
| 19 to 25 Years | 244 (27.0%) | 692 (76.6%) |
| 25 to 34 Years | 646 (26.0%) | 1,488 (59.9%) |
| 35 to 44 Years | 430 (21.8%) | 1,438 (73.0%) |
| 45 to 54 Years | 501 (22.1%) | 1,587 (69.9%) |
| 55 to 64 Years | 370 (18.5%) | 1,535 (76.8%) |
| 65 to 74 Years | 1,779 (93.1%) | 1,099 (57.5%) |
| 75 Years and over | 941 (99.3%) | 681 (71.8%) |
| Total | 5,950 (38.4%) | 10,425 (67.3%) |
Disability Status by Sex by Age in El Sobrante CDP Contra Costa County
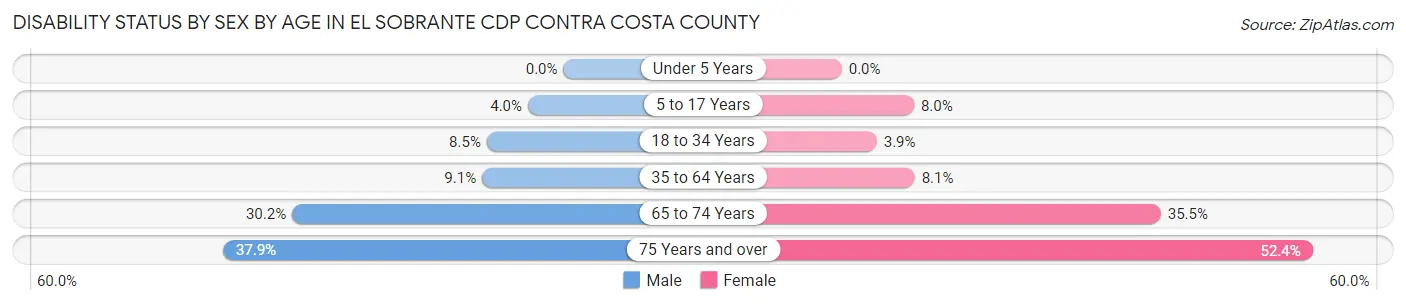
| Age Bracket | Male | Female |
| Under 5 Years | 0 (0.0%) | 0 (0.0%) |
| 5 to 17 Years | 36 (4.0%) | 109 (8.0%) |
| 18 to 34 Years | 177 (8.5%) | 54 (3.9%) |
| 35 to 64 Years | 263 (9.1%) | 271 (8.1%) |
| 65 to 74 Years | 288 (30.2%) | 340 (35.5%) |
| 75 Years and over | 149 (37.9%) | 291 (52.4%) |
Disability Class by Sex by Age in El Sobrante CDP Contra Costa County
Disability Class: Hearing Difficulty
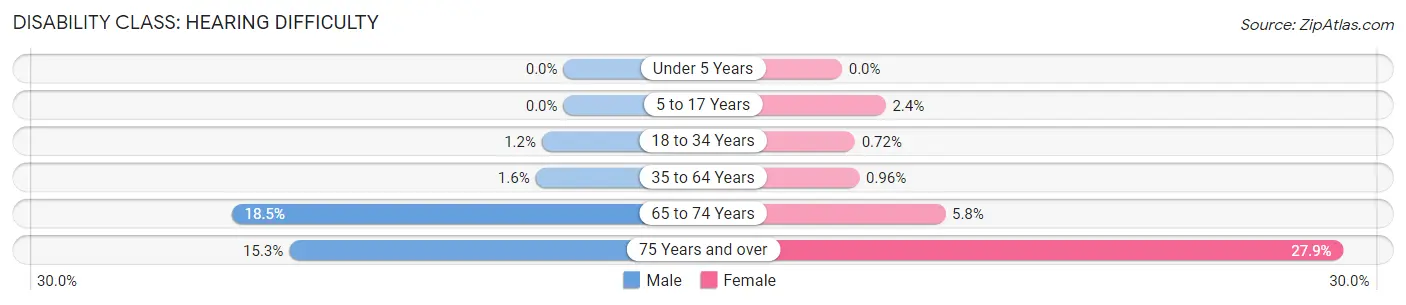
| Age Bracket | Male | Female |
| Under 5 Years | 0 (0.0%) | 0 (0.0%) |
| 5 to 17 Years | 0 (0.0%) | 33 (2.4%) |
| 18 to 34 Years | 25 (1.2%) | 10 (0.7%) |
| 35 to 64 Years | 45 (1.5%) | 32 (1.0%) |
| 65 to 74 Years | 176 (18.5%) | 55 (5.8%) |
| 75 Years and over | 60 (15.3%) | 155 (27.9%) |
Disability Class: Vision Difficulty
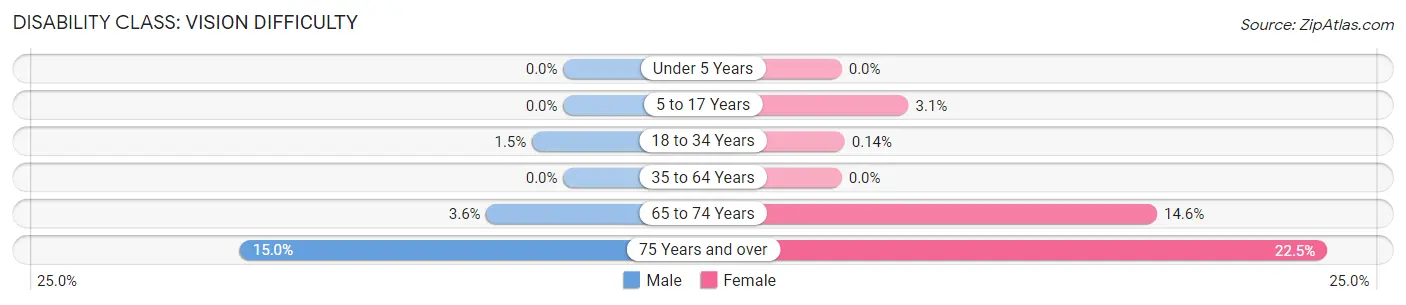
| Age Bracket | Male | Female |
| Under 5 Years | 0 (0.0%) | 0 (0.0%) |
| 5 to 17 Years | 0 (0.0%) | 42 (3.1%) |
| 18 to 34 Years | 30 (1.5%) | 2 (0.1%) |
| 35 to 64 Years | 0 (0.0%) | 0 (0.0%) |
| 65 to 74 Years | 34 (3.6%) | 140 (14.6%) |
| 75 Years and over | 59 (15.0%) | 125 (22.5%) |
Disability Class: Cognitive Difficulty
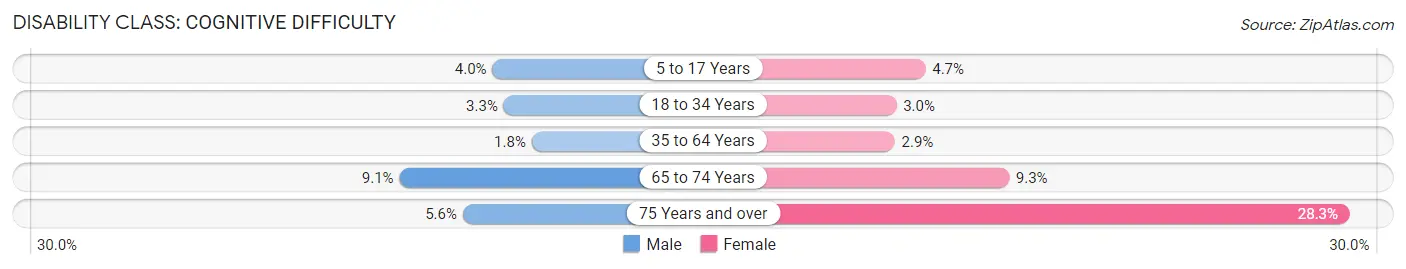
| Age Bracket | Male | Female |
| 5 to 17 Years | 36 (4.0%) | 63 (4.6%) |
| 18 to 34 Years | 69 (3.3%) | 42 (3.0%) |
| 35 to 64 Years | 51 (1.8%) | 98 (2.9%) |
| 65 to 74 Years | 87 (9.1%) | 89 (9.3%) |
| 75 Years and over | 22 (5.6%) | 157 (28.3%) |
Disability Class: Ambulatory Difficulty
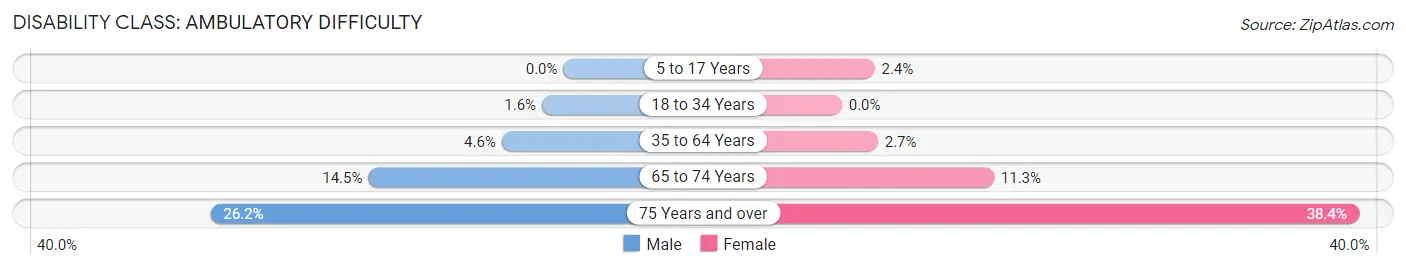
| Age Bracket | Male | Female |
| 5 to 17 Years | 0 (0.0%) | 33 (2.4%) |
| 18 to 34 Years | 33 (1.6%) | 0 (0.0%) |
| 35 to 64 Years | 133 (4.6%) | 89 (2.7%) |
| 65 to 74 Years | 138 (14.5%) | 108 (11.3%) |
| 75 Years and over | 103 (26.2%) | 213 (38.4%) |
Disability Class: Self-Care Difficulty
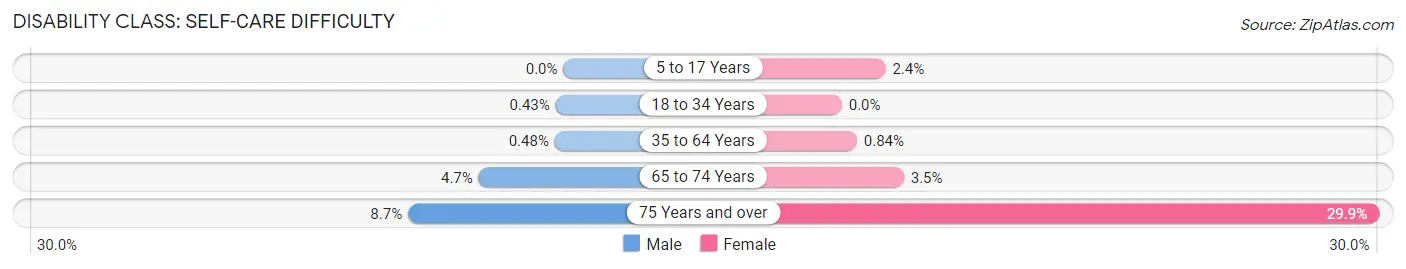
| Age Bracket | Male | Female |
| 5 to 17 Years | 0 (0.0%) | 33 (2.4%) |
| 18 to 34 Years | 9 (0.4%) | 0 (0.0%) |
| 35 to 64 Years | 14 (0.5%) | 28 (0.8%) |
| 65 to 74 Years | 45 (4.7%) | 33 (3.5%) |
| 75 Years and over | 34 (8.6%) | 166 (29.9%) |
Technology Access in El Sobrante CDP Contra Costa County
Computing Device Access in El Sobrante CDP Contra Costa County
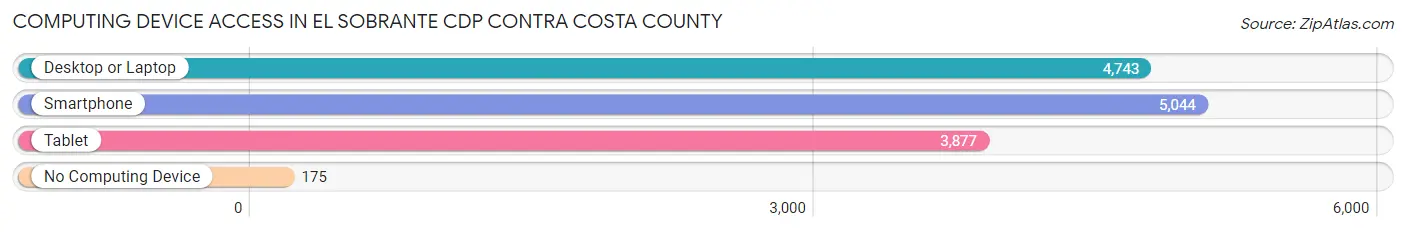
| Device Type | # Households | % Households |
| Desktop or Laptop | 4,743 | 87.3% |
| Smartphone | 5,044 | 92.9% |
| Tablet | 3,877 | 71.4% |
| No Computing Device | 175 | 3.2% |
| Total | 5,431 | 100.0% |
Internet Access in El Sobrante CDP Contra Costa County
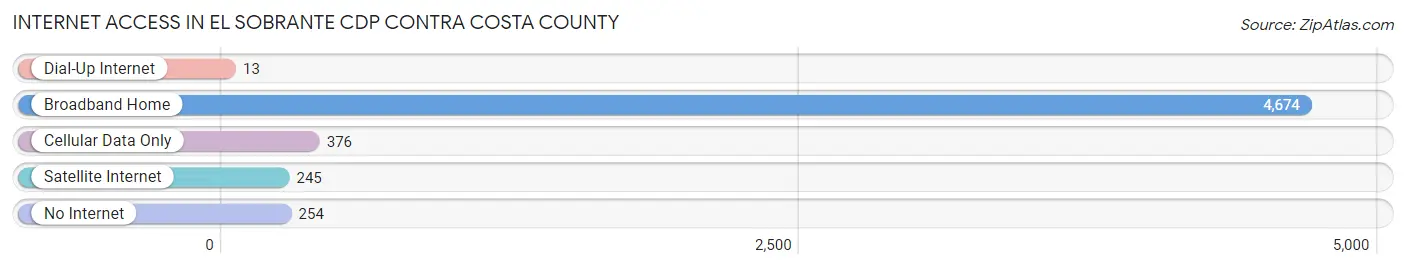
| Internet Type | # Households | % Households |
| Dial-Up Internet | 13 | 0.2% |
| Broadband Home | 4,674 | 86.1% |
| Cellular Data Only | 376 | 6.9% |
| Satellite Internet | 245 | 4.5% |
| No Internet | 254 | 4.7% |
| Total | 5,431 | 100.0% |
El Sobrante CDP Contra Costa County Summary
Sobrante CDP is a census-designated place (CDP) located in Contra Costa County, California. It is situated in the San Francisco Bay Area, approximately 20 miles northeast of Oakland and 30 miles northwest of San Jose. The population of Sobrante CDP was 8,845 at the 2010 census.
History
The area now known as Sobrante CDP was originally inhabited by the Ohlone people, who were the first inhabitants of the San Francisco Bay Area. The Ohlone people lived in the area for thousands of years before the arrival of Europeans.
In the late 1700s, Spanish explorers and missionaries arrived in the area and began to colonize it. The area was part of the Rancho El Sobrante land grant, which was granted to the family of Don Ygnacio Martinez in 1841. The Martinez family owned the land until the early 1900s, when it was sold to developers.
In the 1950s, the area began to be developed as a residential community. The Sobrante CDP was officially established in the 1970s.
Geography
Sobrante CDP is located at 37°59'25"N 122°10'17"W (37.990278, -122.171389). It is situated in the San Francisco Bay Area, approximately 20 miles northeast of Oakland and 30 miles northwest of San Jose.
The CDP has a total area of 2.2 square miles, all of which is land. It is bordered by the cities of El Sobrante, Pinole, and Richmond.
Economy
The economy of Sobrante CDP is largely based on the service industry. The largest employers in the area are the Contra Costa County government, the Contra Costa County Office of Education, and the Contra Costa County Library.
Demographics
As of the 2010 census, there were 8,845 people, 2,945 households, and 2,072 families residing in the CDP. The population density was 4,039.3 people per square mile. The racial makeup of the CDP was 57.2% White, 16.2% African American, 0.7% Native American, 11.2% Asian, 0.3% Pacific Islander, 9.7% from other races, and 5.4% from two or more races. Hispanic or Latino of any race were 20.2% of the population.
The median income for a household in the CDP was $60,938, and the median income for a family was $68,958. The per capita income for the CDP was $25,945. About 8.2% of families and 10.2% of the population were below the poverty line, including 14.2% of those under age 18 and 6.2% of those age 65 or over.
Common Questions
What is Per Capita Income in El Sobrante CDP Contra Costa County?
Per Capita income in El Sobrante CDP Contra Costa County is $45,303.
What is the Median Family Income in El Sobrante CDP Contra Costa County?
Median Family Income in El Sobrante CDP Contra Costa County is $112,389.
What is the Median Household income in El Sobrante CDP Contra Costa County?
Median Household Income in El Sobrante CDP Contra Costa County is $107,725.
What is Income or Wage Gap in El Sobrante CDP Contra Costa County?
Income or Wage Gap in El Sobrante CDP Contra Costa County is 17.5%.
Women in El Sobrante CDP Contra Costa County earn 82.5 cents for every dollar earned by a man.
What is Inequality or Gini Index in El Sobrante CDP Contra Costa County?
Inequality or Gini Index in El Sobrante CDP Contra Costa County is 0.40.
What is the Total Population of El Sobrante CDP Contra Costa County?
Total Population of El Sobrante CDP Contra Costa County is 15,497.
What is the Total Male Population of El Sobrante CDP Contra Costa County?
Total Male Population of El Sobrante CDP Contra Costa County is 7,561.
What is the Total Female Population of El Sobrante CDP Contra Costa County?
Total Female Population of El Sobrante CDP Contra Costa County is 7,936.
What is the Ratio of Males per 100 Females in El Sobrante CDP Contra Costa County?
There are 95.27 Males per 100 Females in El Sobrante CDP Contra Costa County.
What is the Ratio of Females per 100 Males in El Sobrante CDP Contra Costa County?
There are 104.96 Females per 100 Males in El Sobrante CDP Contra Costa County.
What is the Median Population Age in El Sobrante CDP Contra Costa County?
Median Population Age in El Sobrante CDP Contra Costa County is 40.9 Years.
What is the Average Family Size in El Sobrante CDP Contra Costa County
Average Family Size in El Sobrante CDP Contra Costa County is 3.1 People.
What is the Average Household Size in El Sobrante CDP Contra Costa County
Average Household Size in El Sobrante CDP Contra Costa County is 2.8 People.
How Large is the Labor Force in El Sobrante CDP Contra Costa County?
There are 8,262 People in the Labor Forcein in El Sobrante CDP Contra Costa County.
What is the Percentage of People in the Labor Force in El Sobrante CDP Contra Costa County?
64.7% of People are in the Labor Force in El Sobrante CDP Contra Costa County.
What is the Unemployment Rate in El Sobrante CDP Contra Costa County?
Unemployment Rate in El Sobrante CDP Contra Costa County is 5.6%.