Zip Codes with the Highest Percentage of Population Employed in Agriculture, Fishing & Hunting in El Monte, CA
RELATED REPORTS & OPTIONS
Agriculture, Fishing & Hunting
El Monte
Compare Zip Codes
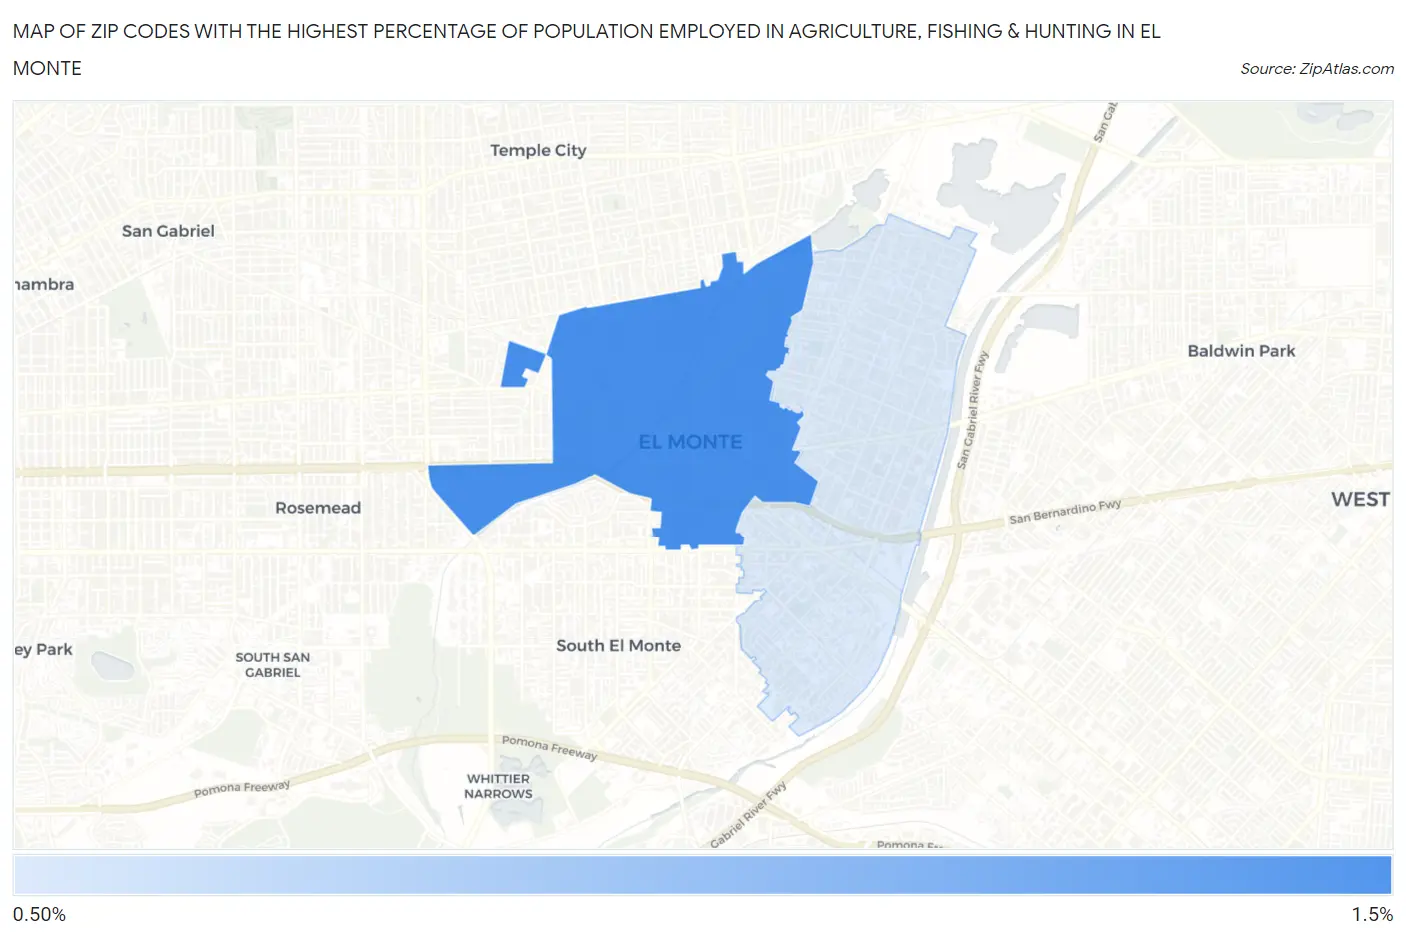
Map of Zip Codes with the Highest Percentage of Population Employed in Agriculture, Fishing & Hunting in El Monte
0.0%
1.5%
Zip Codes with the Highest Percentage of Population Employed in Agriculture, Fishing & Hunting in El Monte, CA
| Zip Code | % Employed | vs State | vs National | |
| 1. | 91731 | 1.4% | 2.0%(-0.586)#648 | 1.2%(+0.201)#14,634 |
| 2. | 91732 | 1.1% | 2.0%(-0.935)#716 | 1.2%(-0.148)#16,005 |
1
Common Questions
What are the Top Zip Codes with the Highest Percentage of Population Employed in Agriculture, Fishing & Hunting in El Monte, CA?
Top Zip Codes with the Highest Percentage of Population Employed in Agriculture, Fishing & Hunting in El Monte, CA are:
What zip code has the Highest Percentage of Population Employed in Agriculture, Fishing & Hunting in El Monte, CA?
91731 has the Highest Percentage of Population Employed in Agriculture, Fishing & Hunting in El Monte, CA with 1.4%.
What is the Percentage of Population Employed in Agriculture, Fishing & Hunting in El Monte, CA?
Percentage of Population Employed in Agriculture, Fishing & Hunting in El Monte is 1.0%.
What is the Percentage of Population Employed in Agriculture, Fishing & Hunting in California?
Percentage of Population Employed in Agriculture, Fishing & Hunting in California is 2.0%.
What is the Percentage of Population Employed in Agriculture, Fishing & Hunting in the United States?
Percentage of Population Employed in Agriculture, Fishing & Hunting in the United States is 1.2%.