East Tulare Villa, CA Map & Demographics
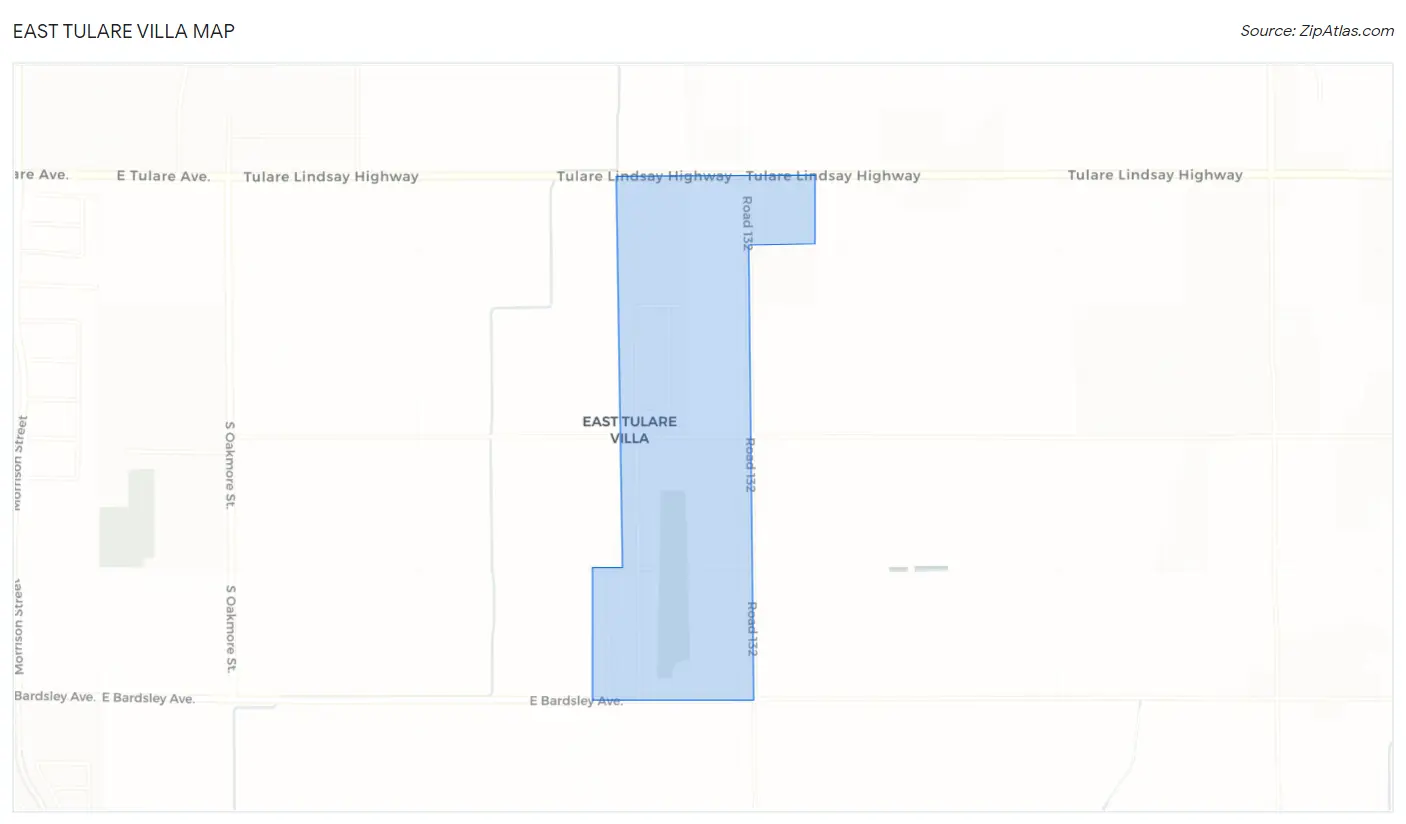
East Tulare Villa Map
East Tulare Villa Overview
$23,705
PER CAPITA INCOME
$74,167
AVG FAMILY INCOME
$64,722
AVG HOUSEHOLD INCOME
7.0%
WAGE / INCOME GAP [ % ]
93.0¢/ $1
WAGE / INCOME GAP [ $ ]
0.45
INEQUALITY / GINI INDEX
862
TOTAL POPULATION
456
MALE POPULATION
406
FEMALE POPULATION
112.32
MALES / 100 FEMALES
89.04
FEMALES / 100 MALES
30.4
MEDIAN AGE
4.0
AVG FAMILY SIZE
3.8
AVG HOUSEHOLD SIZE
383
LABOR FORCE [ PEOPLE ]
63.6%
PERCENT IN LABOR FORCE
7.3%
UNEMPLOYMENT RATE
Income in East Tulare Villa
Income Overview in East Tulare Villa
Per Capita Income in East Tulare Villa is $23,705, while median incomes of families and households are $74,167 and $64,722 respectively.
| Characteristic | Number | Measure |
| Per Capita Income | 862 | $23,705 |
| Median Family Income | 190 | $74,167 |
| Mean Family Income | 190 | $80,435 |
| Median Household Income | 226 | $64,722 |
| Mean Household Income | 226 | $81,424 |
| Income Deficit | 190 | $0 |
| Wage / Income Gap (%) | 862 | 7.03% |
| Wage / Income Gap ($) | 862 | 92.97¢ per $1 |
| Gini / Inequality Index | 862 | 0.45 |
Earnings by Sex in East Tulare Villa
Average Earnings in East Tulare Villa are $39,183, $40,483 for men and $37,639 for women, a difference of 7.0%.
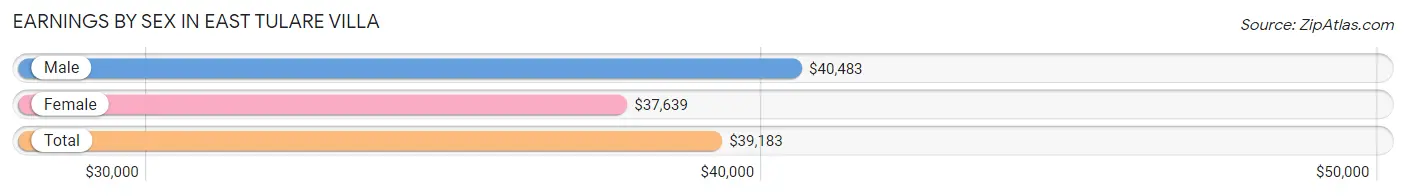
| Sex | Number | Average Earnings |
| Male | 181 (49.6%) | $40,483 |
| Female | 184 (50.4%) | $37,639 |
| Total | 365 (100.0%) | $39,183 |
Earnings by Sex by Income Bracket in East Tulare Villa
The most common earnings brackets in East Tulare Villa are $40,000 to $44,999 for men (44 | 24.3%) and $35,000 to $39,999 for women (50 | 27.2%).
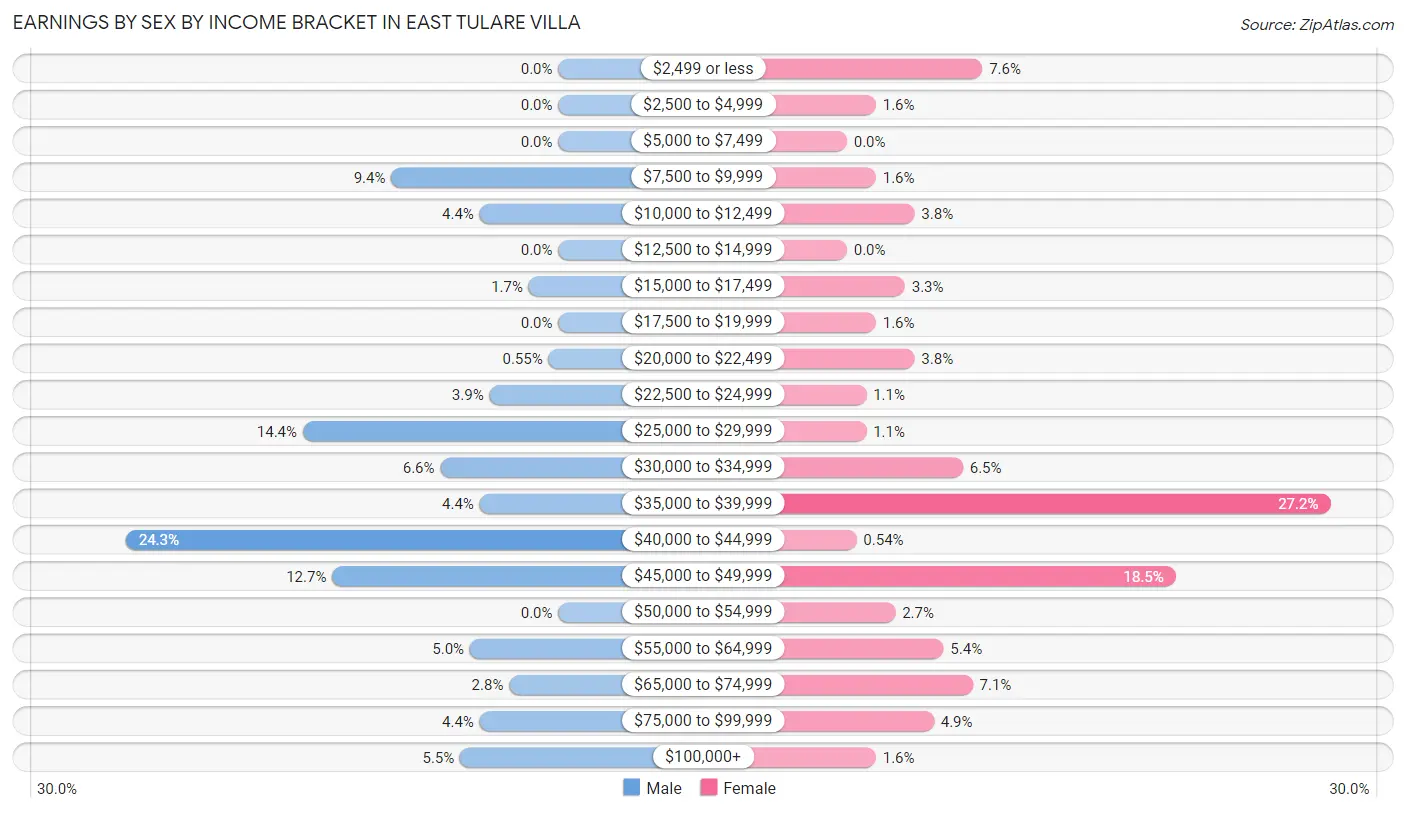
| Income | Male | Female |
| $2,499 or less | 0 (0.0%) | 14 (7.6%) |
| $2,500 to $4,999 | 0 (0.0%) | 3 (1.6%) |
| $5,000 to $7,499 | 0 (0.0%) | 0 (0.0%) |
| $7,500 to $9,999 | 17 (9.4%) | 3 (1.6%) |
| $10,000 to $12,499 | 8 (4.4%) | 7 (3.8%) |
| $12,500 to $14,999 | 0 (0.0%) | 0 (0.0%) |
| $15,000 to $17,499 | 3 (1.7%) | 6 (3.3%) |
| $17,500 to $19,999 | 0 (0.0%) | 3 (1.6%) |
| $20,000 to $22,499 | 1 (0.5%) | 7 (3.8%) |
| $22,500 to $24,999 | 7 (3.9%) | 2 (1.1%) |
| $25,000 to $29,999 | 26 (14.4%) | 2 (1.1%) |
| $30,000 to $34,999 | 12 (6.6%) | 12 (6.5%) |
| $35,000 to $39,999 | 8 (4.4%) | 50 (27.2%) |
| $40,000 to $44,999 | 44 (24.3%) | 1 (0.5%) |
| $45,000 to $49,999 | 23 (12.7%) | 34 (18.5%) |
| $50,000 to $54,999 | 0 (0.0%) | 5 (2.7%) |
| $55,000 to $64,999 | 9 (5.0%) | 10 (5.4%) |
| $65,000 to $74,999 | 5 (2.8%) | 13 (7.1%) |
| $75,000 to $99,999 | 8 (4.4%) | 9 (4.9%) |
| $100,000+ | 10 (5.5%) | 3 (1.6%) |
| Total | 181 (100.0%) | 184 (100.0%) |
Earnings by Sex by Educational Attainment in East Tulare Villa
Average earnings in East Tulare Villa are $41,222 for men and $38,889 for women, a difference of 5.7%. Men with an educational attainment of college or associate's degree enjoy the highest average annual earnings of $58,125, while those with high school diploma education earn the least with $40,129. Women with an educational attainment of less than high school earn the most with the average annual earnings of $38,281, while those with college or associate's degree education have the smallest earnings of $36,250.
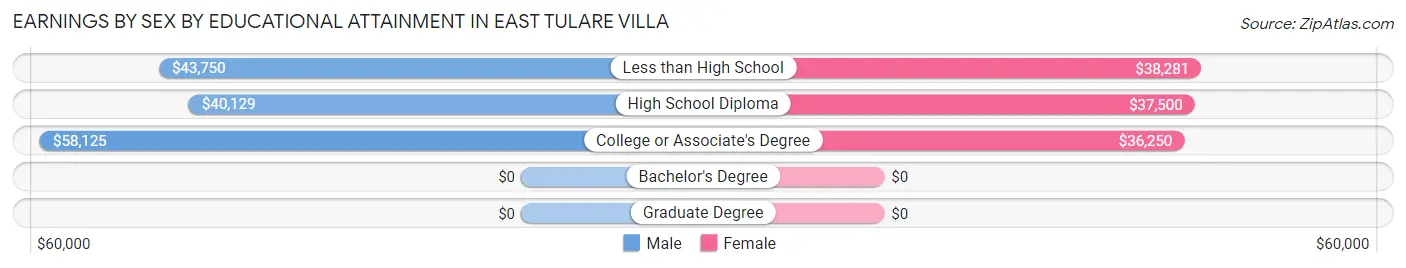
| Educational Attainment | Male Income | Female Income |
| Less than High School | $43,750 | $38,281 |
| High School Diploma | $40,129 | $37,500 |
| College or Associate's Degree | $58,125 | $36,250 |
| Bachelor's Degree | - | - |
| Graduate Degree | - | - |
| Total | $41,222 | $38,889 |
Family Income in East Tulare Villa
Family Income Brackets in East Tulare Villa
According to the East Tulare Villa family income data, there are 44 families falling into the $35,000 to $49,999 income range, which is the most common income bracket and makes up 23.2% of all families. Conversely, the $25,000 to $34,999 income bracket is the least frequent group with only 2 families (1.1%) belonging to this category.
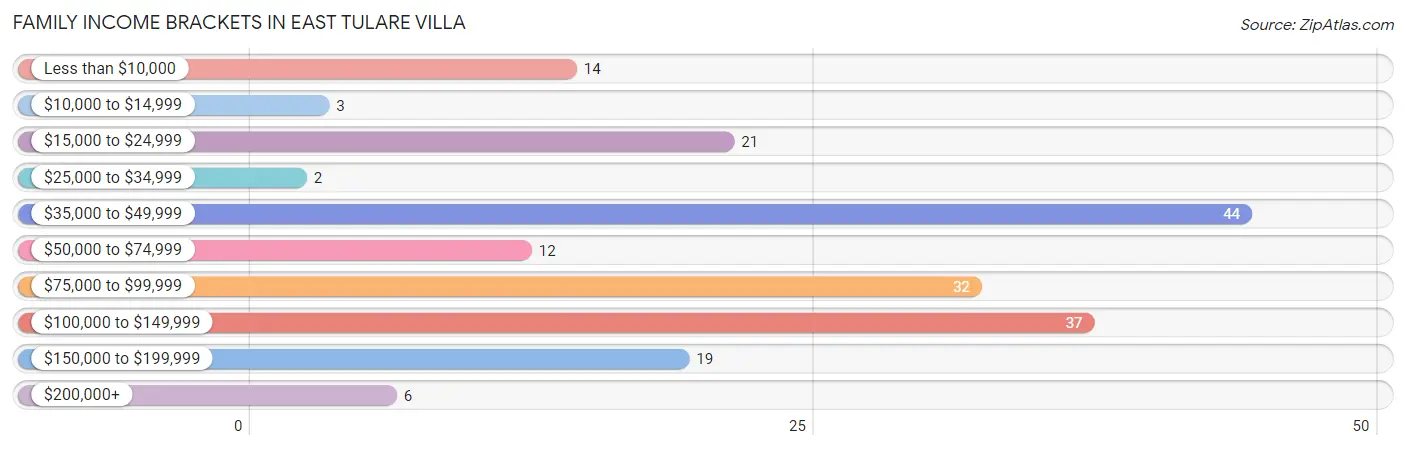
| Income Bracket | # Families | % Families |
| Less than $10,000 | 14 | 7.4% |
| $10,000 to $14,999 | 3 | 1.6% |
| $15,000 to $24,999 | 21 | 11.1% |
| $25,000 to $34,999 | 2 | 1.1% |
| $35,000 to $49,999 | 44 | 23.2% |
| $50,000 to $74,999 | 12 | 6.3% |
| $75,000 to $99,999 | 32 | 16.8% |
| $100,000 to $149,999 | 37 | 19.5% |
| $150,000 to $199,999 | 19 | 10.0% |
| $200,000+ | 6 | 3.2% |
Family Income by Famaliy Size in East Tulare Villa
4-person families (40 | 21.0%) account for the highest median family income in East Tulare Villa with $115,000 per family, while 4-person families (40 | 21.0%) have the highest median income of $28,750 per family member.
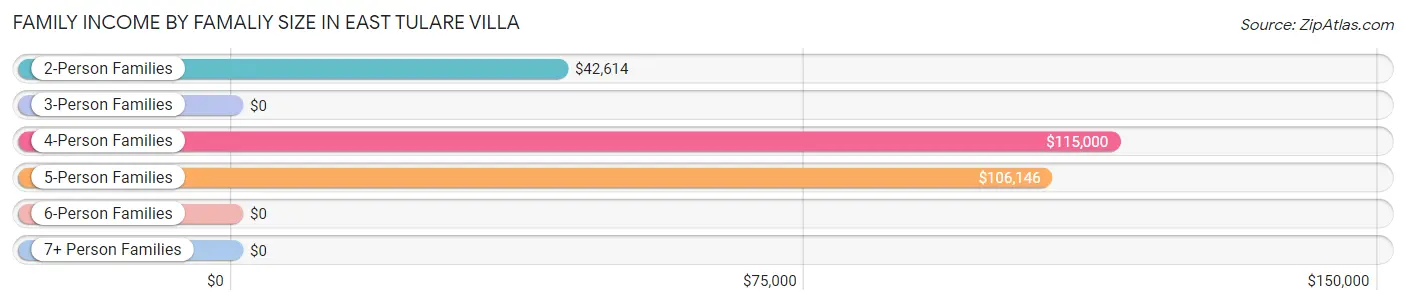
| Income Bracket | # Families | Median Income |
| 2-Person Families | 71 (37.4%) | $42,614 |
| 3-Person Families | 18 (9.5%) | $0 |
| 4-Person Families | 40 (21.0%) | $115,000 |
| 5-Person Families | 35 (18.4%) | $106,146 |
| 6-Person Families | 26 (13.7%) | $0 |
| 7+ Person Families | 0 (0.0%) | $0 |
| Total | 190 (100.0%) | $74,167 |
Family Income by Number of Earners in East Tulare Villa
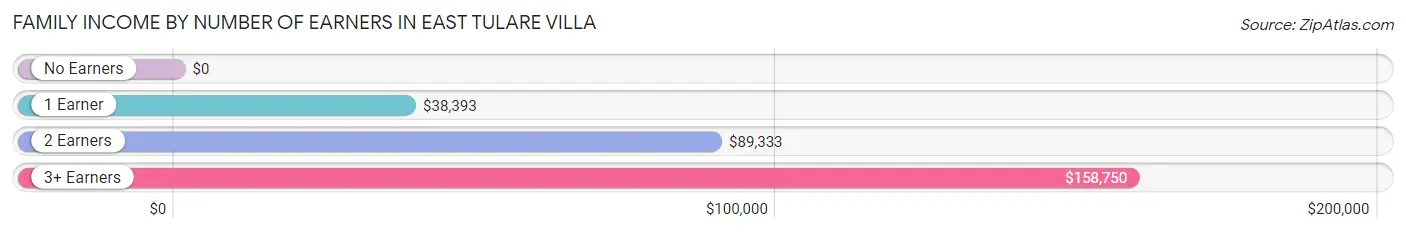
| Number of Earners | # Families | Median Income |
| No Earners | 49 (25.8%) | $0 |
| 1 Earner | 49 (25.8%) | $38,393 |
| 2 Earners | 68 (35.8%) | $89,333 |
| 3+ Earners | 24 (12.6%) | $158,750 |
| Total | 190 (100.0%) | $74,167 |
Household Income in East Tulare Villa
Household Income Brackets in East Tulare Villa
With 40 households falling in the category, the $75,000 to $99,999 income range is the most frequent in East Tulare Villa, accounting for 17.7% of all households. In contrast, only 8 households (3.5%) fall into the $25,000 to $34,999 income bracket, making it the least populous group.
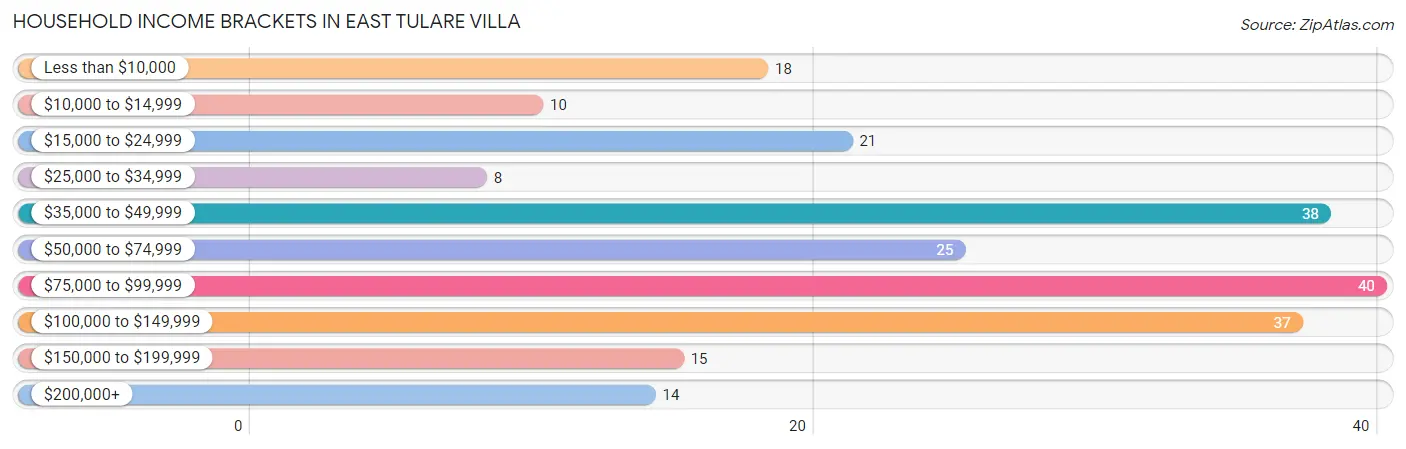
| Income Bracket | # Households | % Households |
| Less than $10,000 | 18 | 8.0% |
| $10,000 to $14,999 | 10 | 4.4% |
| $15,000 to $24,999 | 21 | 9.3% |
| $25,000 to $34,999 | 8 | 3.5% |
| $35,000 to $49,999 | 38 | 16.8% |
| $50,000 to $74,999 | 25 | 11.1% |
| $75,000 to $99,999 | 40 | 17.7% |
| $100,000 to $149,999 | 37 | 16.4% |
| $150,000 to $199,999 | 15 | 6.6% |
| $200,000+ | 14 | 6.2% |
Household Income by Householder Age in East Tulare Villa
The median household income in East Tulare Villa is $64,722, with the highest median household income of $87,833 found in the 45 to 64 years age bracket for the primary householder. A total of 66 households (29.2%) fall into this category.
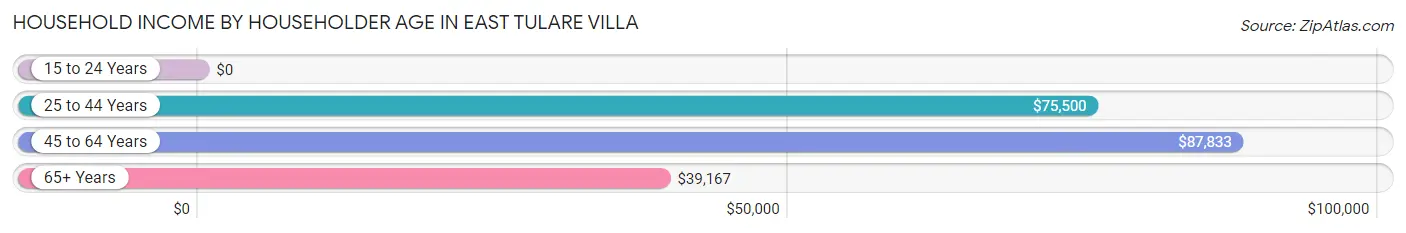
| Income Bracket | # Households | Median Income |
| 15 to 24 Years | 0 (0.0%) | $0 |
| 25 to 44 Years | 88 (38.9%) | $75,500 |
| 45 to 64 Years | 66 (29.2%) | $87,833 |
| 65+ Years | 72 (31.9%) | $39,167 |
| Total | 226 (100.0%) | $64,722 |
Poverty in East Tulare Villa
Income Below Poverty by Sex and Age in East Tulare Villa
With 23.4% poverty level for males and 19.4% for females among the residents of East Tulare Villa, 65 to 74 year old males and 35 to 44 year old females are the most vulnerable to poverty, with 21 males (47.7%) and 26 females (45.6%) in their respective age groups living below the poverty level.
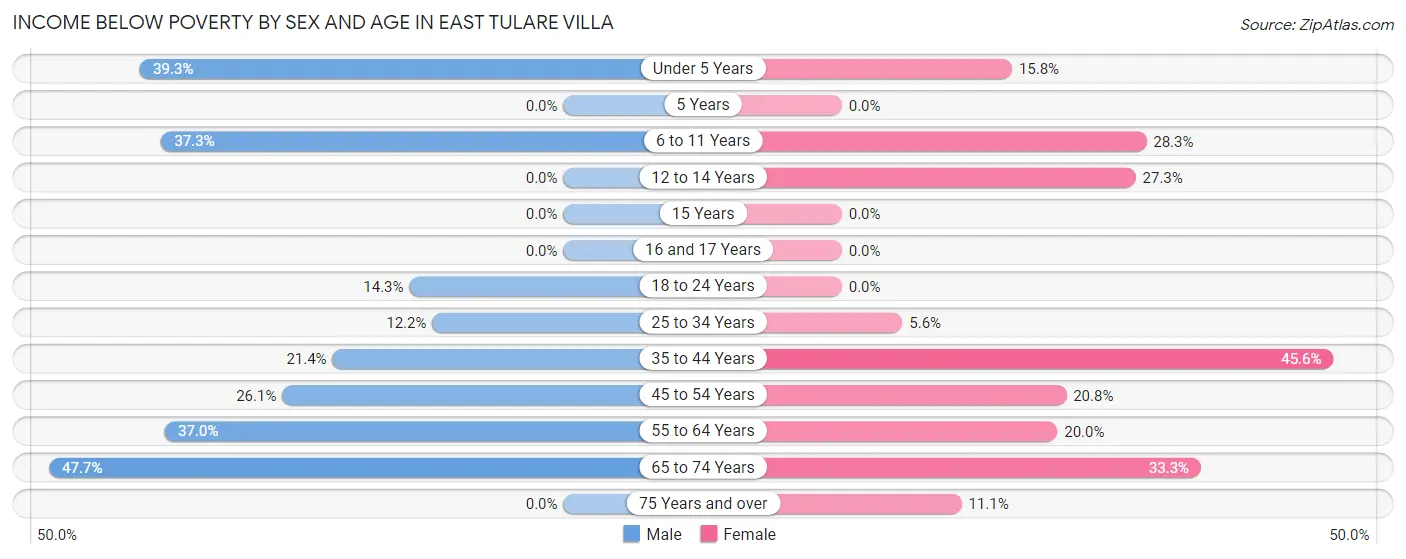
| Age Bracket | Male | Female |
| Under 5 Years | 11 (39.3%) | 3 (15.8%) |
| 5 Years | 0 (0.0%) | 0 (0.0%) |
| 6 to 11 Years | 25 (37.3%) | 13 (28.3%) |
| 12 to 14 Years | 0 (0.0%) | 3 (27.3%) |
| 15 Years | 0 (0.0%) | 0 (0.0%) |
| 16 and 17 Years | 0 (0.0%) | 0 (0.0%) |
| 18 to 24 Years | 5 (14.3%) | 0 (0.0%) |
| 25 to 34 Years | 9 (12.2%) | 5 (5.6%) |
| 35 to 44 Years | 12 (21.4%) | 26 (45.6%) |
| 45 to 54 Years | 6 (26.1%) | 10 (20.8%) |
| 55 to 64 Years | 17 (37.0%) | 8 (20.0%) |
| 65 to 74 Years | 21 (47.7%) | 6 (33.3%) |
| 75 Years and over | 0 (0.0%) | 3 (11.1%) |
| Total | 106 (23.4%) | 77 (19.4%) |
Income Above Poverty by Sex and Age in East Tulare Villa
According to the poverty statistics in East Tulare Villa, males aged 5 years and females aged 5 years are the age groups that are most secure financially, with 100.0% of males and 100.0% of females in these age groups living above the poverty line.
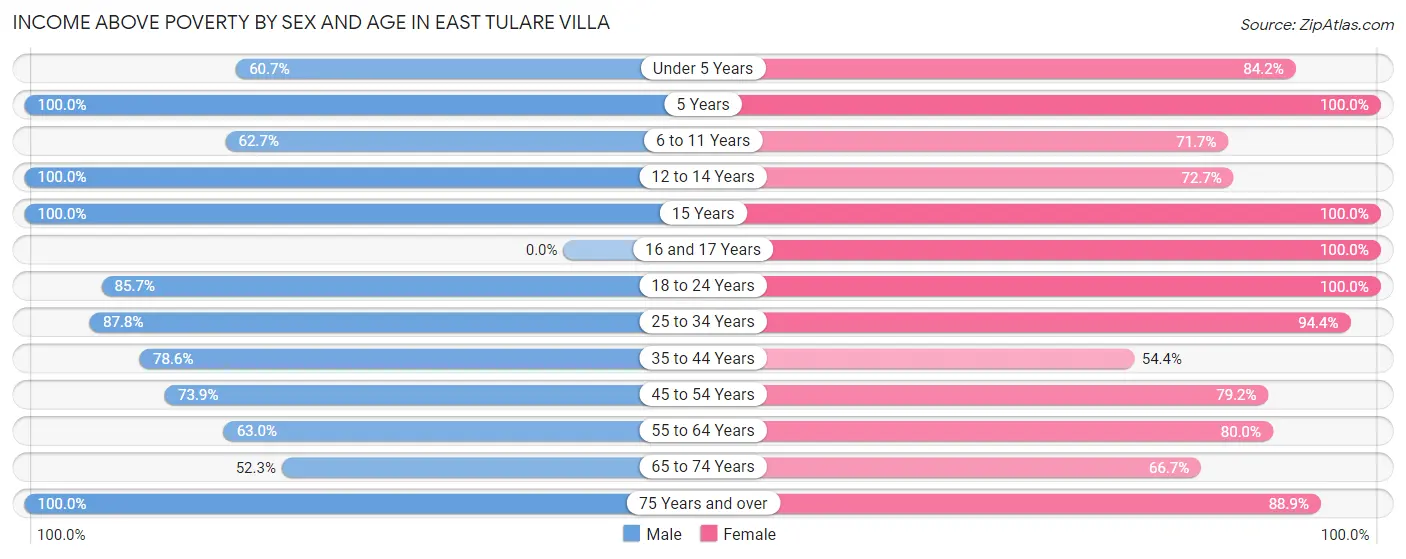
| Age Bracket | Male | Female |
| Under 5 Years | 17 (60.7%) | 16 (84.2%) |
| 5 Years | 8 (100.0%) | 6 (100.0%) |
| 6 to 11 Years | 42 (62.7%) | 33 (71.7%) |
| 12 to 14 Years | 38 (100.0%) | 8 (72.7%) |
| 15 Years | 12 (100.0%) | 13 (100.0%) |
| 16 and 17 Years | 0 (0.0%) | 3 (100.0%) |
| 18 to 24 Years | 30 (85.7%) | 21 (100.0%) |
| 25 to 34 Years | 65 (87.8%) | 84 (94.4%) |
| 35 to 44 Years | 44 (78.6%) | 31 (54.4%) |
| 45 to 54 Years | 17 (73.9%) | 38 (79.2%) |
| 55 to 64 Years | 29 (63.0%) | 32 (80.0%) |
| 65 to 74 Years | 23 (52.3%) | 12 (66.7%) |
| 75 Years and over | 21 (100.0%) | 24 (88.9%) |
| Total | 346 (76.5%) | 321 (80.6%) |
Income Below Poverty Among Married-Couple Families in East Tulare Villa
The poverty statistics for married-couple families in East Tulare Villa show that 25.8% or 32 of the total 124 families live below the poverty line. Families with 3 or 4 children have the highest poverty rate of 40.7%, comprising of 11 families. On the other hand, families with 1 or 2 children have the lowest poverty rate of 8.3%, which includes 3 families.
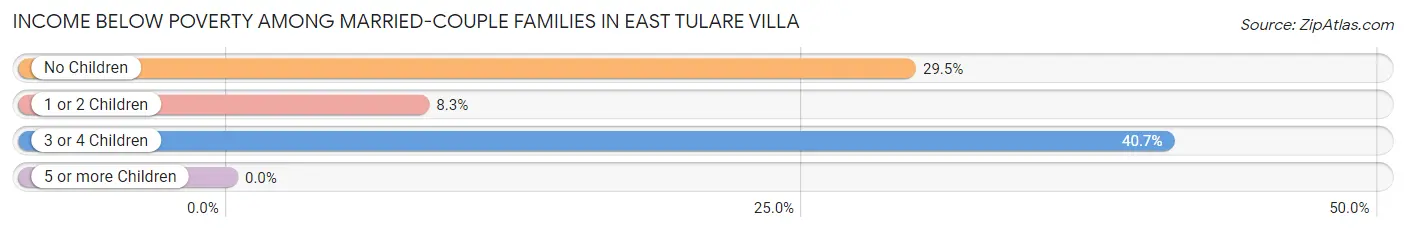
| Children | Above Poverty | Below Poverty |
| No Children | 43 (70.5%) | 18 (29.5%) |
| 1 or 2 Children | 33 (91.7%) | 3 (8.3%) |
| 3 or 4 Children | 16 (59.3%) | 11 (40.7%) |
| 5 or more Children | 0 (0.0%) | 0 (0.0%) |
| Total | 92 (74.2%) | 32 (25.8%) |
Income Below Poverty Among Single-Parent Households in East Tulare Villa
According to the poverty data in East Tulare Villa, 50.0% or 3 single-father households and 5.0% or 3 single-mother households are living below the poverty line. Among single-father households, those with 1 or 2 children have the highest poverty rate, with 3 households (100.0%) experiencing poverty. Likewise, among single-mother households, those with no children have the highest poverty rate, with 3 households (9.7%) falling below the poverty line.
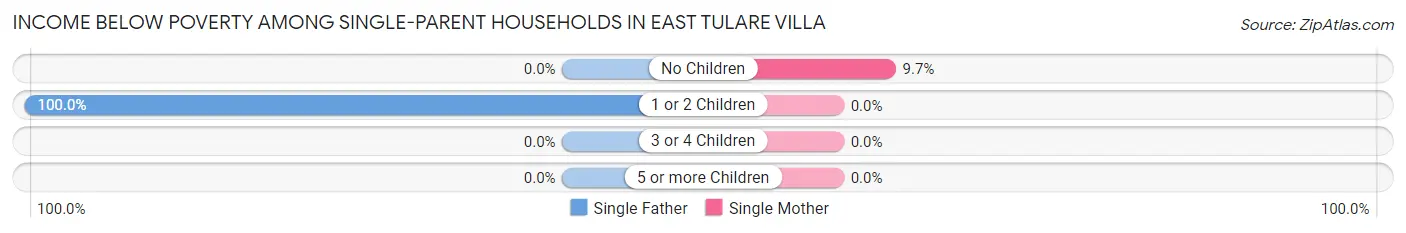
| Children | Single Father | Single Mother |
| No Children | 0 (0.0%) | 3 (9.7%) |
| 1 or 2 Children | 3 (100.0%) | 0 (0.0%) |
| 3 or 4 Children | 0 (0.0%) | 0 (0.0%) |
| 5 or more Children | 0 (0.0%) | 0 (0.0%) |
| Total | 3 (50.0%) | 3 (5.0%) |
Income Below Poverty Among Married-Couple vs Single-Parent Households in East Tulare Villa
The poverty data for East Tulare Villa shows that 32 of the married-couple family households (25.8%) and 6 of the single-parent households (9.1%) are living below the poverty level. Within the married-couple family households, those with 3 or 4 children have the highest poverty rate, with 11 households (40.7%) falling below the poverty line. Among the single-parent households, those with 1 or 2 children have the highest poverty rate, with 3 household (25.0%) living below poverty.
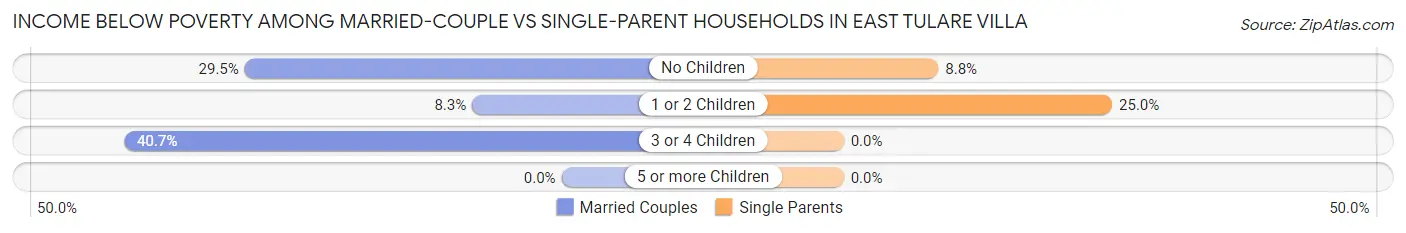
| Children | Married-Couple Families | Single-Parent Households |
| No Children | 18 (29.5%) | 3 (8.8%) |
| 1 or 2 Children | 3 (8.3%) | 3 (25.0%) |
| 3 or 4 Children | 11 (40.7%) | 0 (0.0%) |
| 5 or more Children | 0 (0.0%) | 0 (0.0%) |
| Total | 32 (25.8%) | 6 (9.1%) |
Race in East Tulare Villa
The most populous races in East Tulare Villa are White / Caucasian (477 | 55.3%), Hispanic or Latino (472 | 54.8%), and Two or more Races (203 | 23.5%).
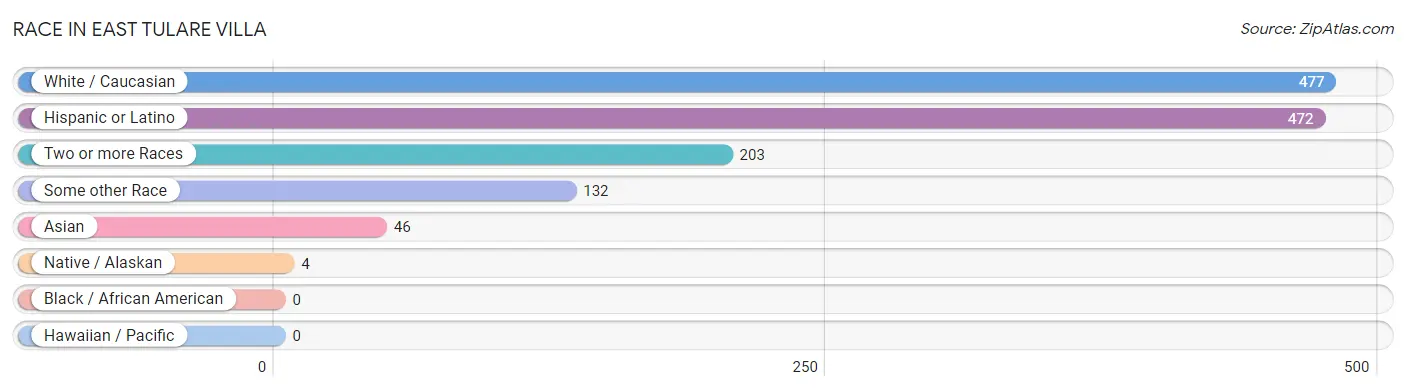
| Race | # Population | % Population |
| Asian | 46 | 5.3% |
| Black / African American | 0 | 0.0% |
| Hawaiian / Pacific | 0 | 0.0% |
| Hispanic or Latino | 472 | 54.8% |
| Native / Alaskan | 4 | 0.5% |
| White / Caucasian | 477 | 55.3% |
| Two or more Races | 203 | 23.5% |
| Some other Race | 132 | 15.3% |
| Total | 862 | 100.0% |
Ancestry in East Tulare Villa
The most populous ancestries reported in East Tulare Villa are Mexican (392 | 45.5%), Portuguese (80 | 9.3%), English (57 | 6.6%), Bangladeshi (46 | 5.3%), and Central American (44 | 5.1%), together accounting for 71.8% of all East Tulare Villa residents.
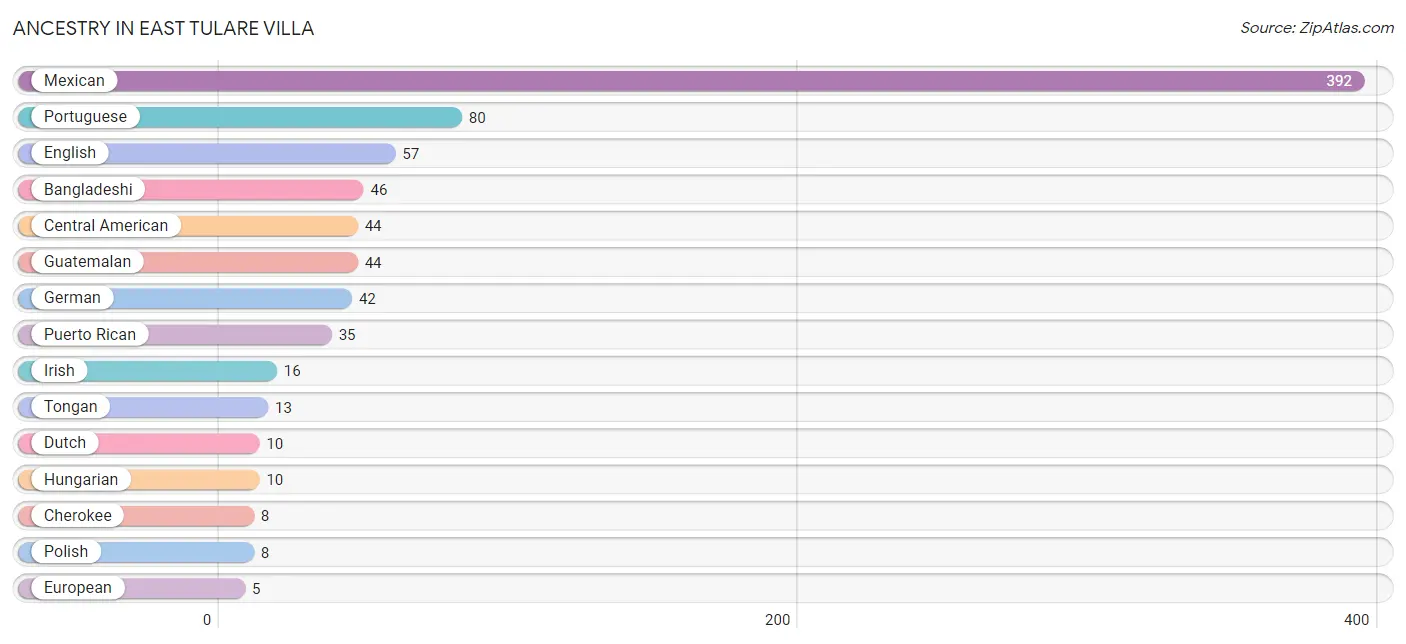
| Ancestry | # Population | % Population |
| American | 4 | 0.5% |
| Bangladeshi | 46 | 5.3% |
| Belgian | 3 | 0.4% |
| Central American | 44 | 5.1% |
| Cherokee | 8 | 0.9% |
| Choctaw | 2 | 0.2% |
| Dutch | 10 | 1.2% |
| English | 57 | 6.6% |
| European | 5 | 0.6% |
| French | 4 | 0.5% |
| German | 42 | 4.9% |
| Guatemalan | 44 | 5.1% |
| Hungarian | 10 | 1.2% |
| Irish | 16 | 1.9% |
| Mexican | 392 | 45.5% |
| Paiute | 4 | 0.5% |
| Polish | 8 | 0.9% |
| Portuguese | 80 | 9.3% |
| Puerto Rican | 35 | 4.1% |
| Tongan | 13 | 1.5% | View All 20 Rows |
Immigrants in East Tulare Villa
The most numerous immigrant groups reported in East Tulare Villa came from Central America (175 | 20.3%), Latin America (175 | 20.3%), Mexico (148 | 17.2%), Guatemala (27 | 3.1%), and Asia (7 | 0.8%), together accounting for 61.7% of all East Tulare Villa residents.
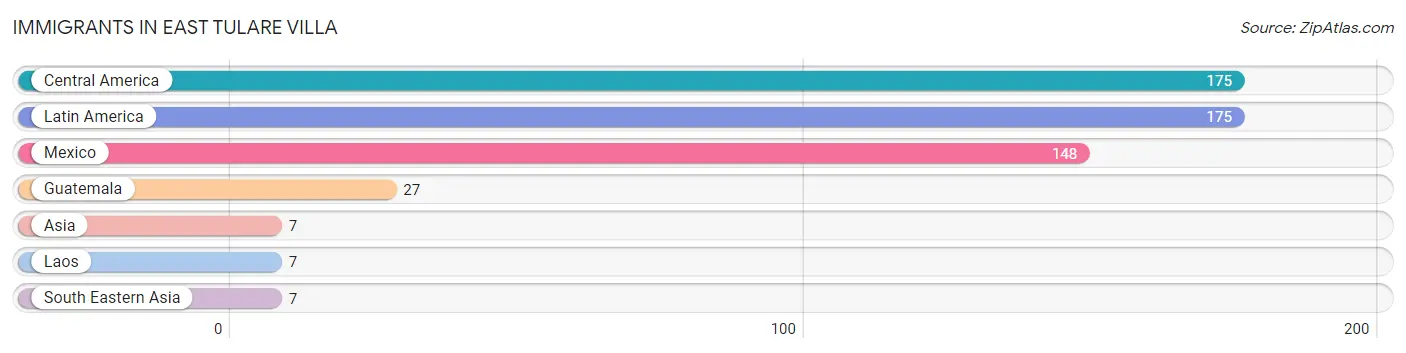
| Immigration Origin | # Population | % Population |
| Asia | 7 | 0.8% |
| Central America | 175 | 20.3% |
| Guatemala | 27 | 3.1% |
| Laos | 7 | 0.8% |
| Latin America | 175 | 20.3% |
| Mexico | 148 | 17.2% |
| South Eastern Asia | 7 | 0.8% | View All 7 Rows |
Sex and Age in East Tulare Villa
Sex and Age in East Tulare Villa
The most populous age groups in East Tulare Villa are 10 to 14 Years (80 | 17.5%) for men and 5 to 9 Years (54 | 13.3%) for women.
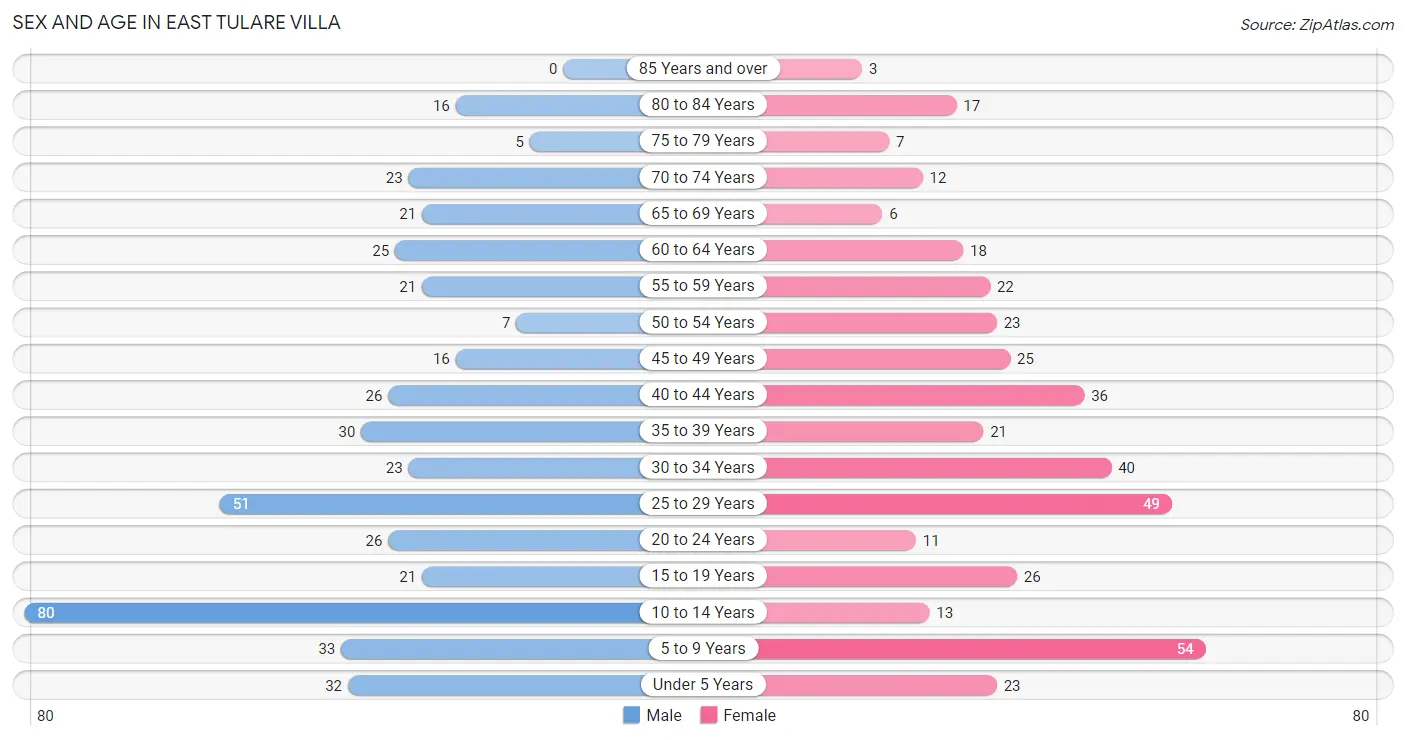
| Age Bracket | Male | Female |
| Under 5 Years | 32 (7.0%) | 23 (5.7%) |
| 5 to 9 Years | 33 (7.2%) | 54 (13.3%) |
| 10 to 14 Years | 80 (17.5%) | 13 (3.2%) |
| 15 to 19 Years | 21 (4.6%) | 26 (6.4%) |
| 20 to 24 Years | 26 (5.7%) | 11 (2.7%) |
| 25 to 29 Years | 51 (11.2%) | 49 (12.1%) |
| 30 to 34 Years | 23 (5.0%) | 40 (9.9%) |
| 35 to 39 Years | 30 (6.6%) | 21 (5.2%) |
| 40 to 44 Years | 26 (5.7%) | 36 (8.9%) |
| 45 to 49 Years | 16 (3.5%) | 25 (6.2%) |
| 50 to 54 Years | 7 (1.5%) | 23 (5.7%) |
| 55 to 59 Years | 21 (4.6%) | 22 (5.4%) |
| 60 to 64 Years | 25 (5.5%) | 18 (4.4%) |
| 65 to 69 Years | 21 (4.6%) | 6 (1.5%) |
| 70 to 74 Years | 23 (5.0%) | 12 (3.0%) |
| 75 to 79 Years | 5 (1.1%) | 7 (1.7%) |
| 80 to 84 Years | 16 (3.5%) | 17 (4.2%) |
| 85 Years and over | 0 (0.0%) | 3 (0.7%) |
| Total | 456 (100.0%) | 406 (100.0%) |
Families and Households in East Tulare Villa
Median Family Size in East Tulare Villa
The median family size in East Tulare Villa is 3.99 persons per family, with single female/mother families (60 | 31.6%) accounting for the largest median family size of 4.23 persons per family. On the other hand, single male/father families (6 | 3.2%) represent the smallest median family size with 2.50 persons per family.
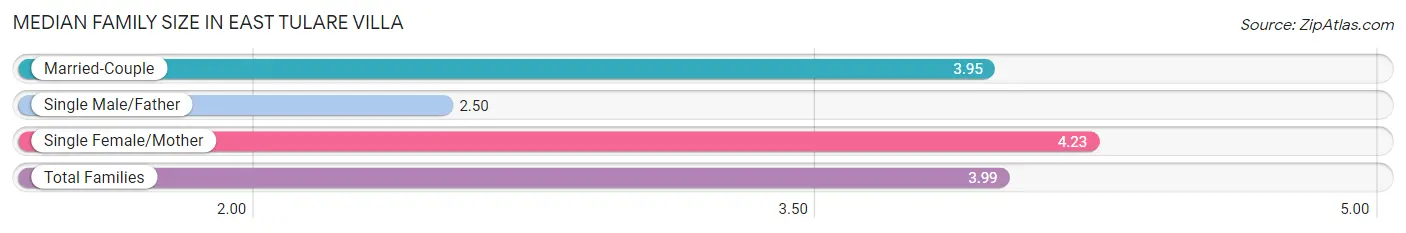
| Family Type | # Families | Family Size |
| Married-Couple | 124 (65.3%) | 3.95 |
| Single Male/Father | 6 (3.2%) | 2.50 |
| Single Female/Mother | 60 (31.6%) | 4.23 |
| Total Families | 190 (100.0%) | 3.99 |
Median Household Size in East Tulare Villa
The median household size in East Tulare Villa is 3.81 persons per household, with single female/mother households (60 | 26.6%) accounting for the largest median household size of 4.6 persons per household. non-family households (36 | 15.9%) represent the smallest median household size with 1.56 persons per household.
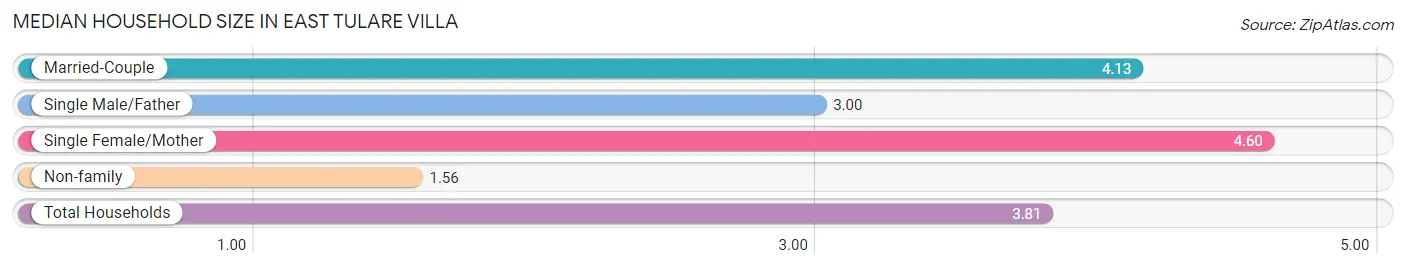
| Household Type | # Households | Household Size |
| Married-Couple | 124 (54.9%) | 4.13 |
| Single Male/Father | 6 (2.6%) | 3.00 |
| Single Female/Mother | 60 (26.6%) | 4.60 |
| Non-family | 36 (15.9%) | 1.56 |
| Total Households | 226 (100.0%) | 3.81 |
Household Size by Marriage Status in East Tulare Villa
Out of a total of 226 households in East Tulare Villa, 190 (84.1%) are family households, while 36 (15.9%) are nonfamily households. The most numerous type of family households are 2-person households, comprising 55, and the most common type of nonfamily households are 2-person households, comprising 19.
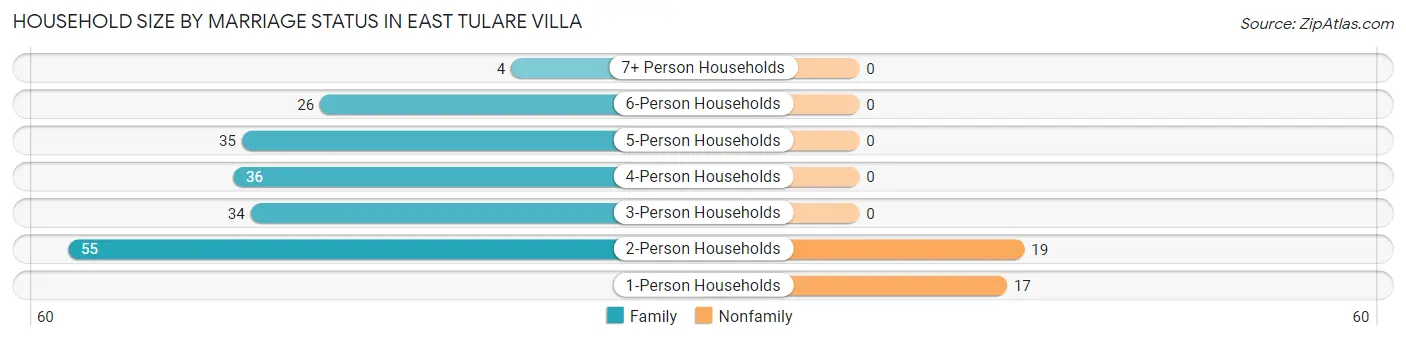
| Household Size | Family Households | Nonfamily Households |
| 1-Person Households | - | 17 (7.5%) |
| 2-Person Households | 55 (24.3%) | 19 (8.4%) |
| 3-Person Households | 34 (15.0%) | 0 (0.0%) |
| 4-Person Households | 36 (15.9%) | 0 (0.0%) |
| 5-Person Households | 35 (15.5%) | 0 (0.0%) |
| 6-Person Households | 26 (11.5%) | 0 (0.0%) |
| 7+ Person Households | 4 (1.8%) | 0 (0.0%) |
| Total | 190 (84.1%) | 36 (15.9%) |
Female Fertility in East Tulare Villa
Fertility by Age in East Tulare Villa
Average fertility rate in East Tulare Villa is 5.0 births per 1,000 women. Women in the age bracket of 20 to 34 years have the highest fertility rate with 10.0 births per 1,000 women. Women in the age bracket of 20 to 34 years acount for 100.0% of all women with births.
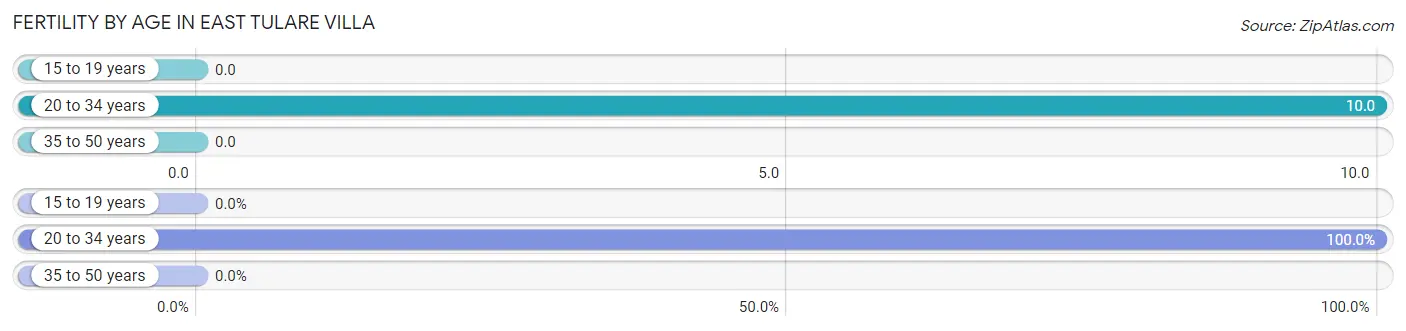
| Age Bracket | Women with Births | Births / 1,000 Women |
| 15 to 19 years | 0 (0.0%) | 0.0 |
| 20 to 34 years | 1 (100.0%) | 10.0 |
| 35 to 50 years | 0 (0.0%) | 0.0 |
| Total | 1 (100.0%) | 5.0 |
Fertility by Age by Marriage Status in East Tulare Villa
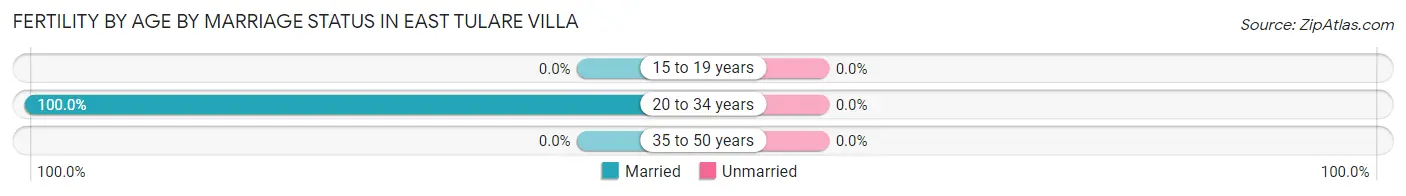
| Age Bracket | Married | Unmarried |
| 15 to 19 years | 0 (0.0%) | 0 (0.0%) |
| 20 to 34 years | 1 (100.0%) | 0 (0.0%) |
| 35 to 50 years | 0 (0.0%) | 0 (0.0%) |
| Total | 1 (100.0%) | 0 (0.0%) |
Fertility by Education in East Tulare Villa
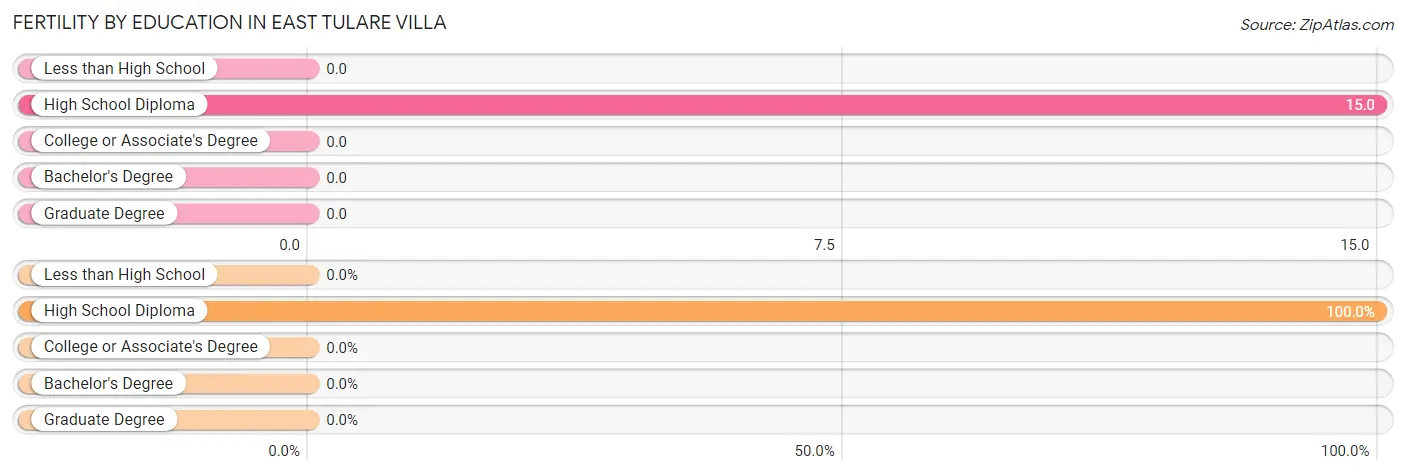
| Educational Attainment | Women with Births | Births / 1,000 Women |
| Less than High School | 0 (0.0%) | 0.0 |
| High School Diploma | 1 (100.0%) | 15.0 |
| College or Associate's Degree | 0 (0.0%) | 0.0 |
| Bachelor's Degree | 0 (0.0%) | 0.0 |
| Graduate Degree | 0 (0.0%) | 0.0 |
| Total | 1 (100.0%) | 5.0 |
Fertility by Education by Marriage Status in East Tulare Villa
| Educational Attainment | Married | Unmarried |
| Less than High School | 0 (0.0%) | 0 (0.0%) |
| High School Diploma | 1 (100.0%) | 0 (0.0%) |
| College or Associate's Degree | 0 (0.0%) | 0 (0.0%) |
| Bachelor's Degree | 0 (0.0%) | 0 (0.0%) |
| Graduate Degree | 0 (0.0%) | 0 (0.0%) |
| Total | 1 (100.0%) | 0 (0.0%) |
Employment Characteristics in East Tulare Villa
Employment by Class of Employer in East Tulare Villa
Among the 347 employed individuals in East Tulare Villa, private company employees (265 | 76.4%), self-employed (not incorporated) (25 | 7.2%), and local government employees (24 | 6.9%) make up the most common classes of employment.
| Employer Class | # Employees | % Employees |
| Private Company Employees | 265 | 76.4% |
| Self-Employed (Incorporated) | 9 | 2.6% |
| Self-Employed (Not Incorporated) | 25 | 7.2% |
| Not-for-profit Organizations | 18 | 5.2% |
| Local Government Employees | 24 | 6.9% |
| State Government Employees | 6 | 1.7% |
| Federal Government Employees | 0 | 0.0% |
| Unpaid Family Workers | 0 | 0.0% |
| Total | 347 | 100.0% |
Employment Status by Age in East Tulare Villa
According to the labor force statistics for East Tulare Villa, out of the total population over 16 years of age (602), 63.6% or 383 individuals are in the labor force, with 7.3% or 28 of them unemployed. The age group with the highest labor force participation rate is 20 to 24 years, with 100.0% or 37 individuals in the labor force. Within the labor force, the 16 to 19 years age range has the highest percentage of unemployed individuals, with 25.0% or 4 of them being unemployed.
| Age Bracket | In Labor Force | Unemployed |
| 16 to 19 Years | 16 (72.7%) | 4 (25.0%) |
| 20 to 24 Years | 37 (100.0%) | 5 (13.5%) |
| 25 to 29 Years | 76 (76.0%) | 0 (0.0%) |
| 30 to 34 Years | 54 (85.7%) | 0 (0.0%) |
| 35 to 44 Years | 77 (68.1%) | 9 (11.7%) |
| 45 to 54 Years | 60 (84.5%) | 10 (16.7%) |
| 55 to 59 Years | 43 (100.0%) | 0 (0.0%) |
| 60 to 64 Years | 7 (16.3%) | 0 (0.0%) |
| 65 to 74 Years | 10 (16.1%) | 0 (0.0%) |
| 75 Years and over | 3 (6.3%) | 0 (0.0%) |
| Total | 383 (63.6%) | 28 (7.3%) |
Employment Status by Educational Attainment in East Tulare Villa
According to labor force statistics for East Tulare Villa, 73.2% of individuals (317) out of the total population between 25 and 64 years of age (433) are in the labor force, with 6.0% or 19 of them being unemployed. The group with the highest labor force participation rate are those with the educational attainment of bachelor's degree or higher, with 100.0% or 19 individuals in the labor force. Within the labor force, individuals with college / associate degree education have the highest percentage of unemployment, with 11.5% or 10 of them being unemployed.
| Educational Attainment | In Labor Force | Unemployed |
| Less than High School | 79 (67.5%) | 0 (0.0%) |
| High School Diploma | 132 (85.2%) | 11 (6.8%) |
| College / Associate Degree | 87 (61.3%) | 16 (11.5%) |
| Bachelor's Degree or higher | 19 (100.0%) | 0 (0.0%) |
| Total | 317 (73.2%) | 26 (6.0%) |
Employment Occupations by Sex in East Tulare Villa
Management, Business, Science and Arts Occupations
The most common Management, Business, Science and Arts occupations in East Tulare Villa are Community & Social Service (19 | 5.3%), Management (14 | 3.9%), Business & Financial (13 | 3.7%), Education, Arts & Media (10 | 2.8%), and Health Diagnosing & Treating (8 | 2.2%).
Management, Business, Science and Arts Occupations by Sex
Within the Management, Business, Science and Arts occupations in East Tulare Villa, the most male-oriented occupations are Computers, Engineering & Science (100.0%), Life, Physical & Social Science (100.0%), and Education Instruction & Library (50.0%), while the most female-oriented occupations are Business & Financial (100.0%), Education, Arts & Media (100.0%), and Arts, Media & Entertainment (100.0%).
| Occupation | Male | Female |
| Management | 1 (7.1%) | 13 (92.9%) |
| Business & Financial | 0 (0.0%) | 13 (100.0%) |
| Computers, Engineering & Science | 6 (100.0%) | 0 (0.0%) |
| Computers & Mathematics | 0 (0.0%) | 0 (0.0%) |
| Architecture & Engineering | 0 (0.0%) | 0 (0.0%) |
| Life, Physical & Social Science | 6 (100.0%) | 0 (0.0%) |
| Community & Social Service | 3 (15.8%) | 16 (84.2%) |
| Education, Arts & Media | 0 (0.0%) | 10 (100.0%) |
| Legal Services & Support | 0 (0.0%) | 0 (0.0%) |
| Education Instruction & Library | 3 (50.0%) | 3 (50.0%) |
| Arts, Media & Entertainment | 0 (0.0%) | 3 (100.0%) |
| Health Diagnosing & Treating | 0 (0.0%) | 8 (100.0%) |
| Health Technologists | 0 (0.0%) | 0 (0.0%) |
| Total (Category) | 10 (16.7%) | 50 (83.3%) |
| Total (Overall) | 181 (51.0%) | 174 (49.0%) |
Services Occupations
The most common Services occupations in East Tulare Villa are Healthcare Support (47 | 13.2%), Food Preparation & Serving (15 | 4.2%), and Personal Care & Service (15 | 4.2%).
Services Occupations by Sex
| Occupation | Male | Female |
| Healthcare Support | 21 (44.7%) | 26 (55.3%) |
| Security & Protection | 0 (0.0%) | 0 (0.0%) |
| Firefighting & Prevention | 0 (0.0%) | 0 (0.0%) |
| Law Enforcement | 0 (0.0%) | 0 (0.0%) |
| Food Preparation & Serving | 0 (0.0%) | 15 (100.0%) |
| Cleaning & Maintenance | 0 (0.0%) | 0 (0.0%) |
| Personal Care & Service | 0 (0.0%) | 15 (100.0%) |
| Total (Category) | 21 (27.3%) | 56 (72.7%) |
| Total (Overall) | 181 (51.0%) | 174 (49.0%) |
Sales and Office Occupations
The most common Sales and Office occupations in East Tulare Villa are Office & Administration (29 | 8.2%), and Sales & Related (17 | 4.8%).

Sales and Office Occupations by Sex

| Occupation | Male | Female |
| Sales & Related | 8 (47.1%) | 9 (52.9%) |
| Office & Administration | 0 (0.0%) | 29 (100.0%) |
| Total (Category) | 8 (17.4%) | 38 (82.6%) |
| Total (Overall) | 181 (51.0%) | 174 (49.0%) |
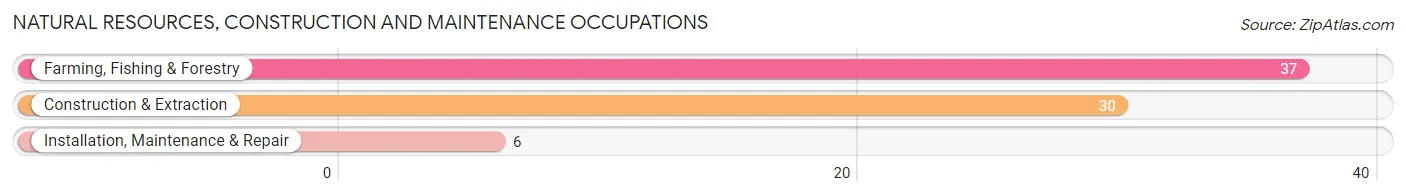
Natural Resources, Construction and Maintenance Occupations
The most common Natural Resources, Construction and Maintenance occupations in East Tulare Villa are Farming, Fishing & Forestry (37 | 10.4%), Construction & Extraction (30 | 8.5%), and Installation, Maintenance & Repair (6 | 1.7%).
Natural Resources, Construction and Maintenance Occupations by Sex
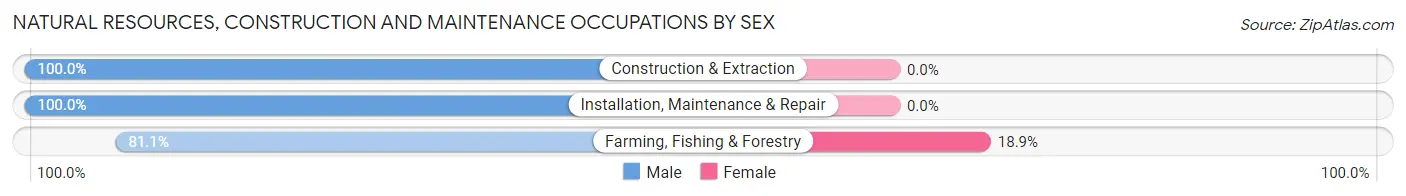
| Occupation | Male | Female |
| Farming, Fishing & Forestry | 30 (81.1%) | 7 (18.9%) |
| Construction & Extraction | 30 (100.0%) | 0 (0.0%) |
| Installation, Maintenance & Repair | 6 (100.0%) | 0 (0.0%) |
| Total (Category) | 66 (90.4%) | 7 (9.6%) |
| Total (Overall) | 181 (51.0%) | 174 (49.0%) |
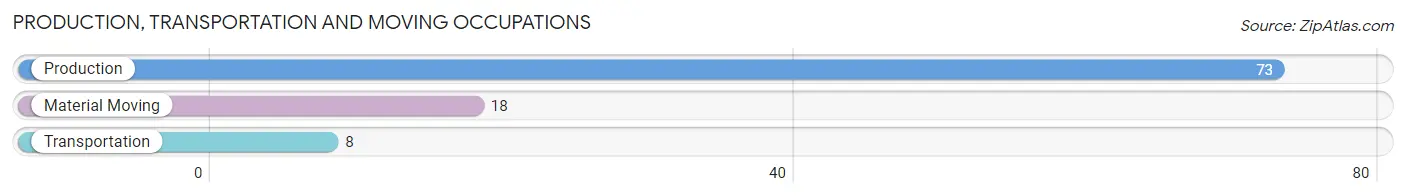
Production, Transportation and Moving Occupations
The most common Production, Transportation and Moving occupations in East Tulare Villa are Production (73 | 20.6%), Material Moving (18 | 5.1%), and Transportation (8 | 2.2%).
Production, Transportation and Moving Occupations by Sex
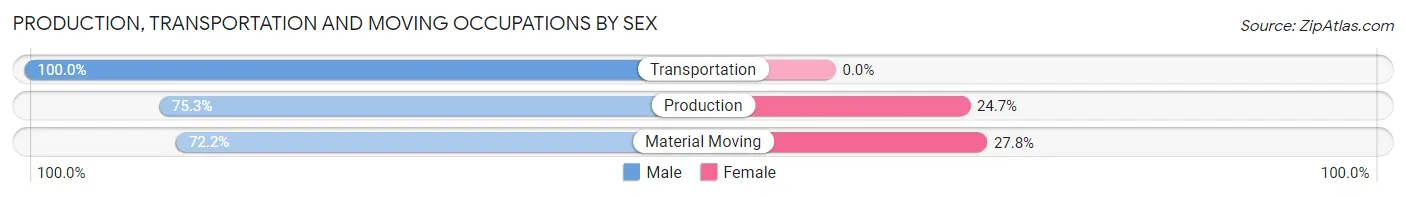
| Occupation | Male | Female |
| Production | 55 (75.3%) | 18 (24.7%) |
| Transportation | 8 (100.0%) | 0 (0.0%) |
| Material Moving | 13 (72.2%) | 5 (27.8%) |
| Total (Category) | 76 (76.8%) | 23 (23.2%) |
| Total (Overall) | 181 (51.0%) | 174 (49.0%) |
Employment Industries by Sex in East Tulare Villa
Employment Industries in East Tulare Villa
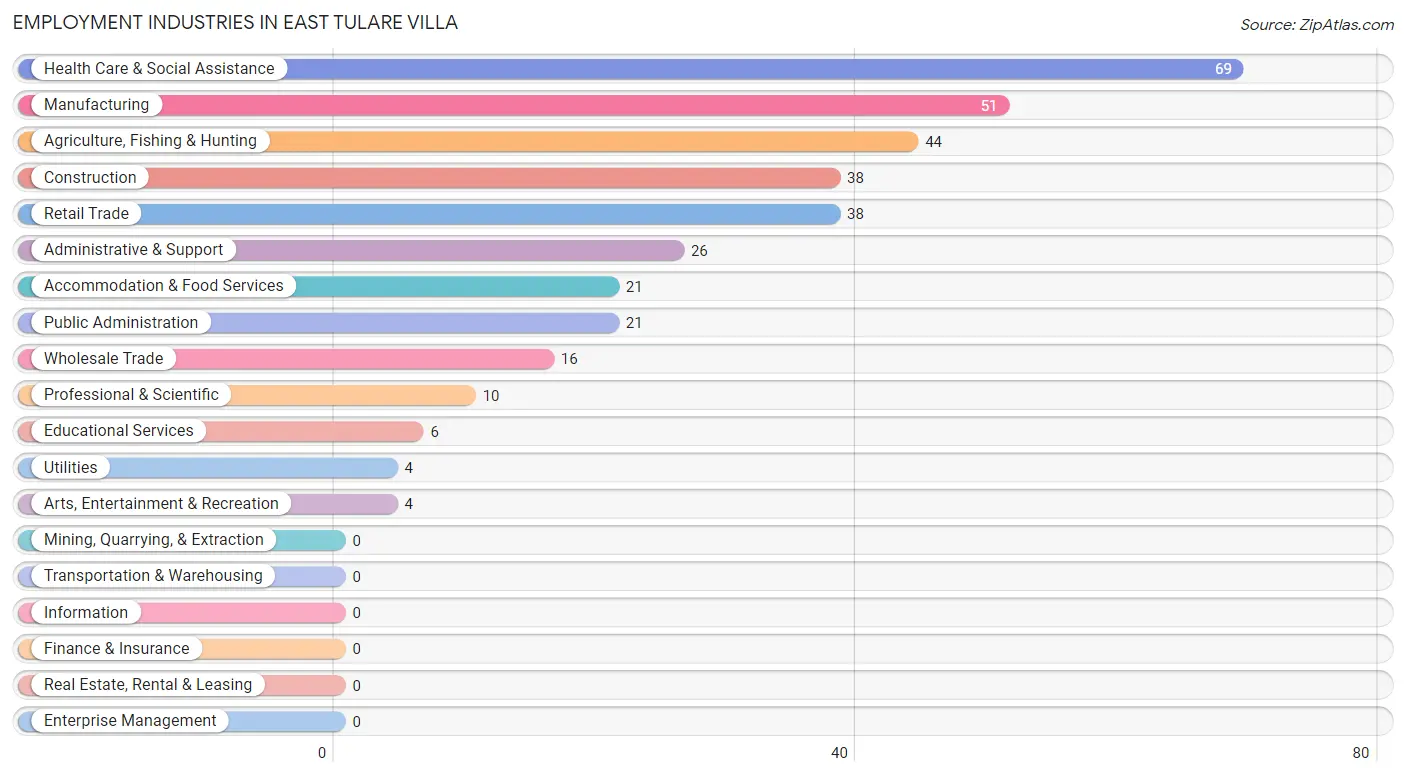
The major employment industries in East Tulare Villa include Health Care & Social Assistance (69 | 19.4%), Manufacturing (51 | 14.4%), Agriculture, Fishing & Hunting (44 | 12.4%), Construction (38 | 10.7%), and Retail Trade (38 | 10.7%).
Employment Industries by Sex in East Tulare Villa
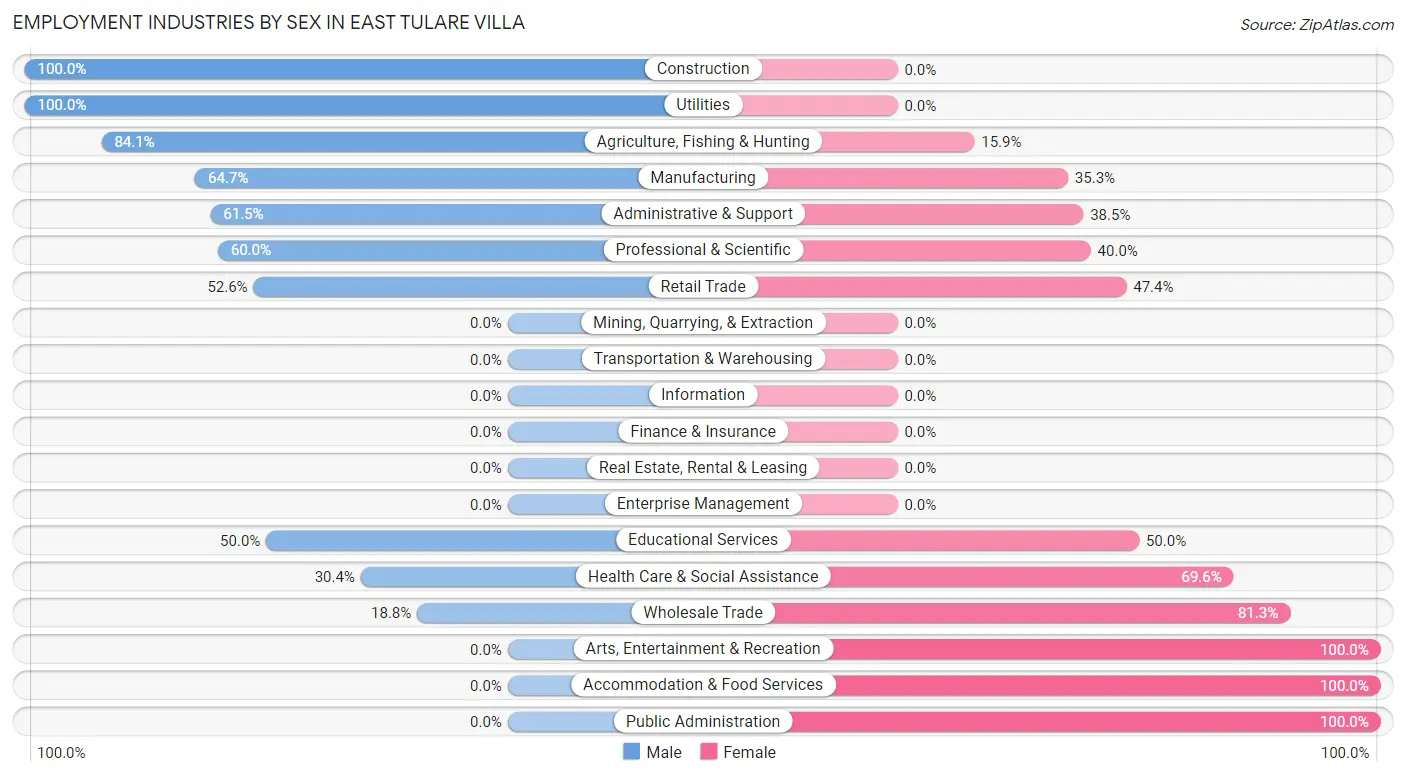
The East Tulare Villa industries that see more men than women are Construction (100.0%), Utilities (100.0%), and Agriculture, Fishing & Hunting (84.1%), whereas the industries that tend to have a higher number of women are Arts, Entertainment & Recreation (100.0%), Accommodation & Food Services (100.0%), and Public Administration (100.0%).
| Industry | Male | Female |
| Agriculture, Fishing & Hunting | 37 (84.1%) | 7 (15.9%) |
| Mining, Quarrying, & Extraction | 0 (0.0%) | 0 (0.0%) |
| Construction | 38 (100.0%) | 0 (0.0%) |
| Manufacturing | 33 (64.7%) | 18 (35.3%) |
| Wholesale Trade | 3 (18.8%) | 13 (81.2%) |
| Retail Trade | 20 (52.6%) | 18 (47.4%) |
| Transportation & Warehousing | 0 (0.0%) | 0 (0.0%) |
| Utilities | 4 (100.0%) | 0 (0.0%) |
| Information | 0 (0.0%) | 0 (0.0%) |
| Finance & Insurance | 0 (0.0%) | 0 (0.0%) |
| Real Estate, Rental & Leasing | 0 (0.0%) | 0 (0.0%) |
| Professional & Scientific | 6 (60.0%) | 4 (40.0%) |
| Enterprise Management | 0 (0.0%) | 0 (0.0%) |
| Administrative & Support | 16 (61.5%) | 10 (38.5%) |
| Educational Services | 3 (50.0%) | 3 (50.0%) |
| Health Care & Social Assistance | 21 (30.4%) | 48 (69.6%) |
| Arts, Entertainment & Recreation | 0 (0.0%) | 4 (100.0%) |
| Accommodation & Food Services | 0 (0.0%) | 21 (100.0%) |
| Public Administration | 0 (0.0%) | 21 (100.0%) |
| Total | 181 (51.0%) | 174 (49.0%) |
Education in East Tulare Villa
School Enrollment in East Tulare Villa
The most common levels of schooling among the 253 students in East Tulare Villa are middle school (86 | 34.0%), elementary school (66 | 26.1%), and college / undergraduate (44 | 17.4%).
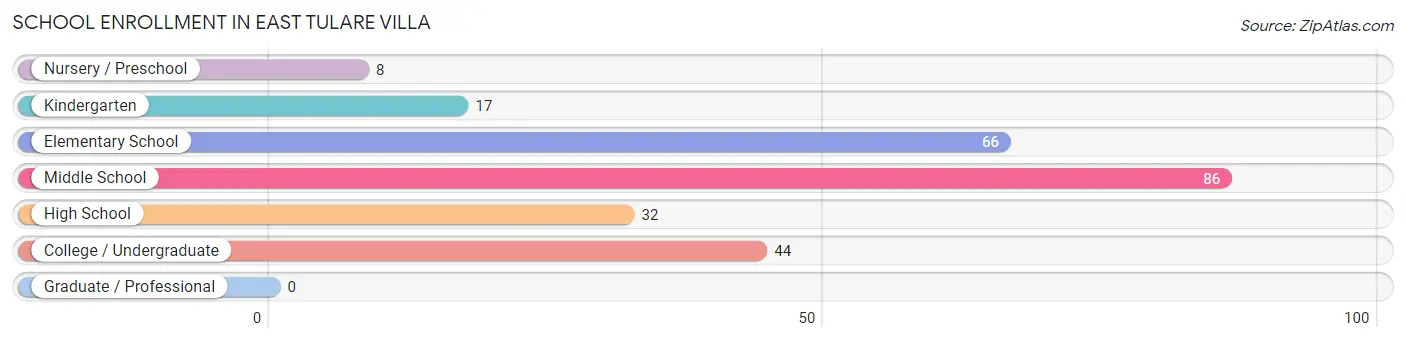
| School Level | # Students | % Students |
| Nursery / Preschool | 8 | 3.2% |
| Kindergarten | 17 | 6.7% |
| Elementary School | 66 | 26.1% |
| Middle School | 86 | 34.0% |
| High School | 32 | 12.7% |
| College / Undergraduate | 44 | 17.4% |
| Graduate / Professional | 0 | 0.0% |
| Total | 253 | 100.0% |
School Enrollment by Age by Funding Source in East Tulare Villa
Out of a total of 253 students who are enrolled in schools in East Tulare Villa, 18 (7.1%) attend a private institution, while the remaining 235 (92.9%) are enrolled in public schools. The age group of 10 to 14 year olds has the highest likelihood of being enrolled in private schools, with 14 (15.0% in the age bracket) enrolled. Conversely, the age group of 3 to 4 year olds has the lowest likelihood of being enrolled in a private school, with 4 (100.0% in the age bracket) attending a public institution.
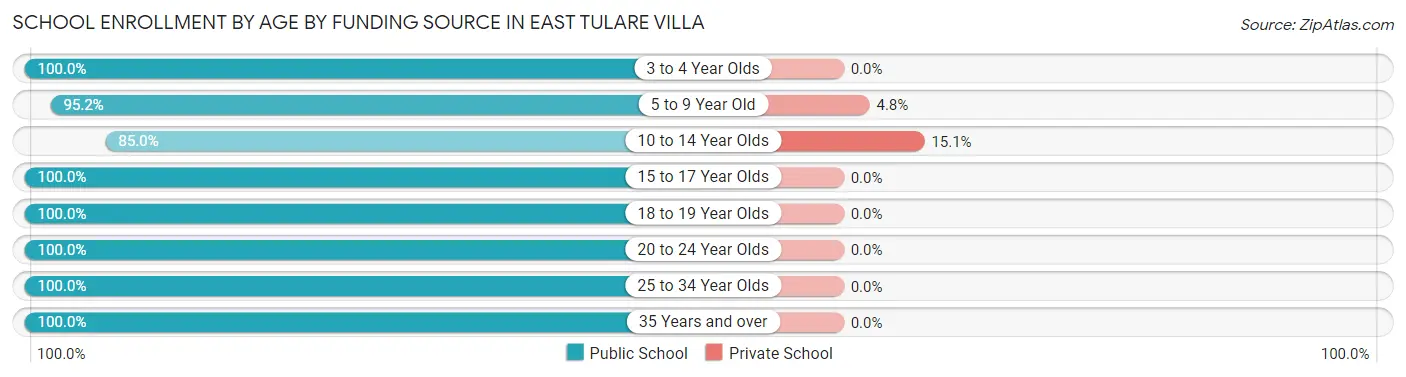
| Age Bracket | Public School | Private School |
| 3 to 4 Year Olds | 4 (100.0%) | 0 (0.0%) |
| 5 to 9 Year Old | 79 (95.2%) | 4 (4.8%) |
| 10 to 14 Year Olds | 79 (85.0%) | 14 (15.0%) |
| 15 to 17 Year Olds | 28 (100.0%) | 0 (0.0%) |
| 18 to 19 Year Olds | 14 (100.0%) | 0 (0.0%) |
| 20 to 24 Year Olds | 21 (100.0%) | 0 (0.0%) |
| 25 to 34 Year Olds | 8 (100.0%) | 0 (0.0%) |
| 35 Years and over | 2 (100.0%) | 0 (0.0%) |
| Total | 235 (92.9%) | 18 (7.1%) |
Educational Attainment by Field of Study in East Tulare Villa
Arts & humanities (10 | 45.5%), business (9 | 40.9%), and social sciences (3 | 13.6%) are the most common fields of study among 22 individuals in East Tulare Villa who have obtained a bachelor's degree or higher.
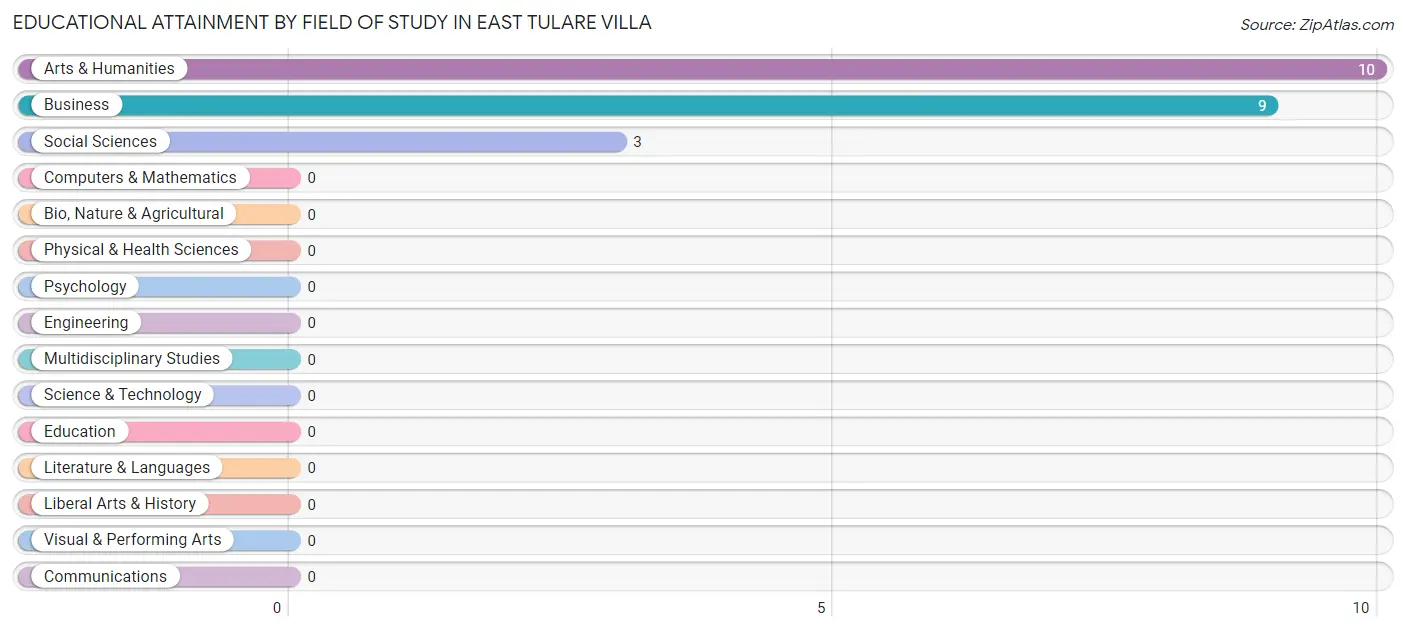
| Field of Study | # Graduates | % Graduates |
| Computers & Mathematics | 0 | 0.0% |
| Bio, Nature & Agricultural | 0 | 0.0% |
| Physical & Health Sciences | 0 | 0.0% |
| Psychology | 0 | 0.0% |
| Social Sciences | 3 | 13.6% |
| Engineering | 0 | 0.0% |
| Multidisciplinary Studies | 0 | 0.0% |
| Science & Technology | 0 | 0.0% |
| Business | 9 | 40.9% |
| Education | 0 | 0.0% |
| Literature & Languages | 0 | 0.0% |
| Liberal Arts & History | 0 | 0.0% |
| Visual & Performing Arts | 0 | 0.0% |
| Communications | 0 | 0.0% |
| Arts & Humanities | 10 | 45.5% |
| Total | 22 | 100.0% |
Transportation & Commute in East Tulare Villa
Vehicle Availability by Sex in East Tulare Villa
The most prevalent vehicle ownership categories in East Tulare Villa are males with 4 vehicles (53, accounting for 30.6%) and females with 4 vehicles (57, making up 30.5%).
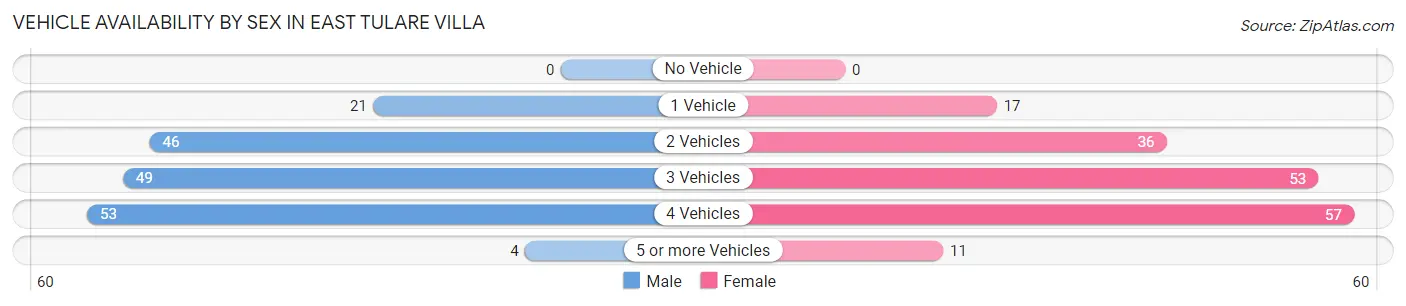
| Vehicles Available | Male | Female |
| No Vehicle | 0 (0.0%) | 0 (0.0%) |
| 1 Vehicle | 21 (12.1%) | 17 (9.8%) |
| 2 Vehicles | 46 (26.6%) | 36 (20.7%) |
| 3 Vehicles | 49 (28.3%) | 53 (30.5%) |
| 4 Vehicles | 53 (30.6%) | 57 (32.8%) |
| 5 or more Vehicles | 4 (2.3%) | 11 (6.3%) |
| Total | 173 (100.0%) | 174 (100.0%) |
Commute Time in East Tulare Villa
The most frequently occuring commute durations in East Tulare Villa are 10 to 14 minutes (86 commuters, 24.8%), 15 to 19 minutes (70 commuters, 20.2%), and 20 to 24 minutes (68 commuters, 19.6%).
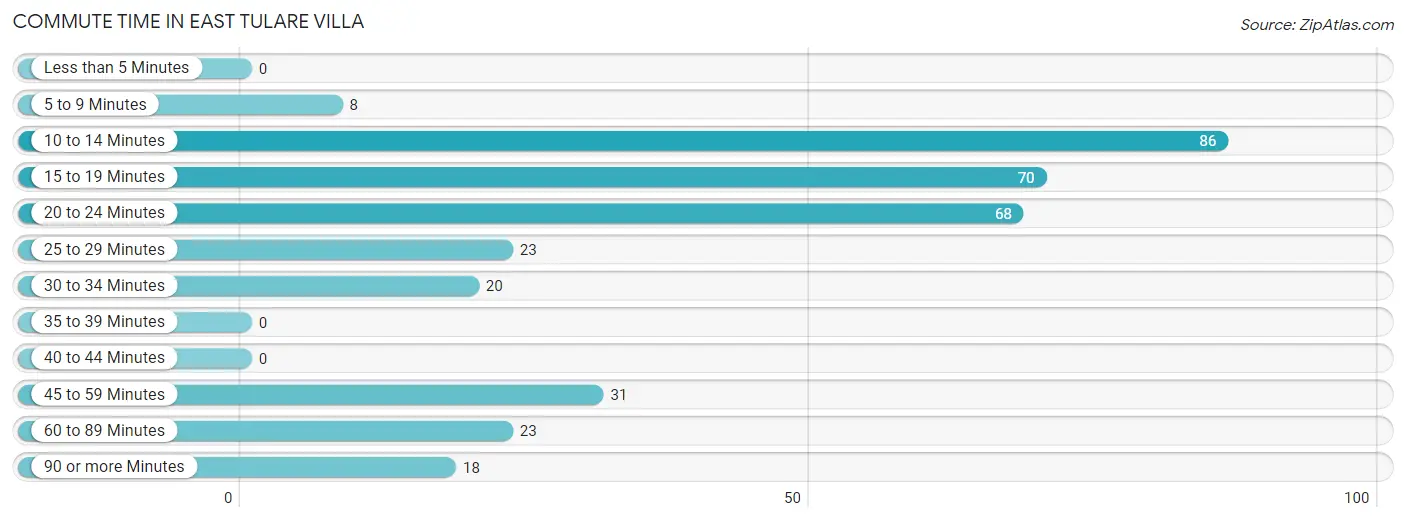
| Commute Time | # Commuters | % Commuters |
| Less than 5 Minutes | 0 | 0.0% |
| 5 to 9 Minutes | 8 | 2.3% |
| 10 to 14 Minutes | 86 | 24.8% |
| 15 to 19 Minutes | 70 | 20.2% |
| 20 to 24 Minutes | 68 | 19.6% |
| 25 to 29 Minutes | 23 | 6.6% |
| 30 to 34 Minutes | 20 | 5.8% |
| 35 to 39 Minutes | 0 | 0.0% |
| 40 to 44 Minutes | 0 | 0.0% |
| 45 to 59 Minutes | 31 | 8.9% |
| 60 to 89 Minutes | 23 | 6.6% |
| 90 or more Minutes | 18 | 5.2% |
Commute Time by Sex in East Tulare Villa
The most common commute times in East Tulare Villa are 10 to 14 minutes (55 commuters, 31.8%) for males and 15 to 19 minutes (48 commuters, 27.6%) for females.
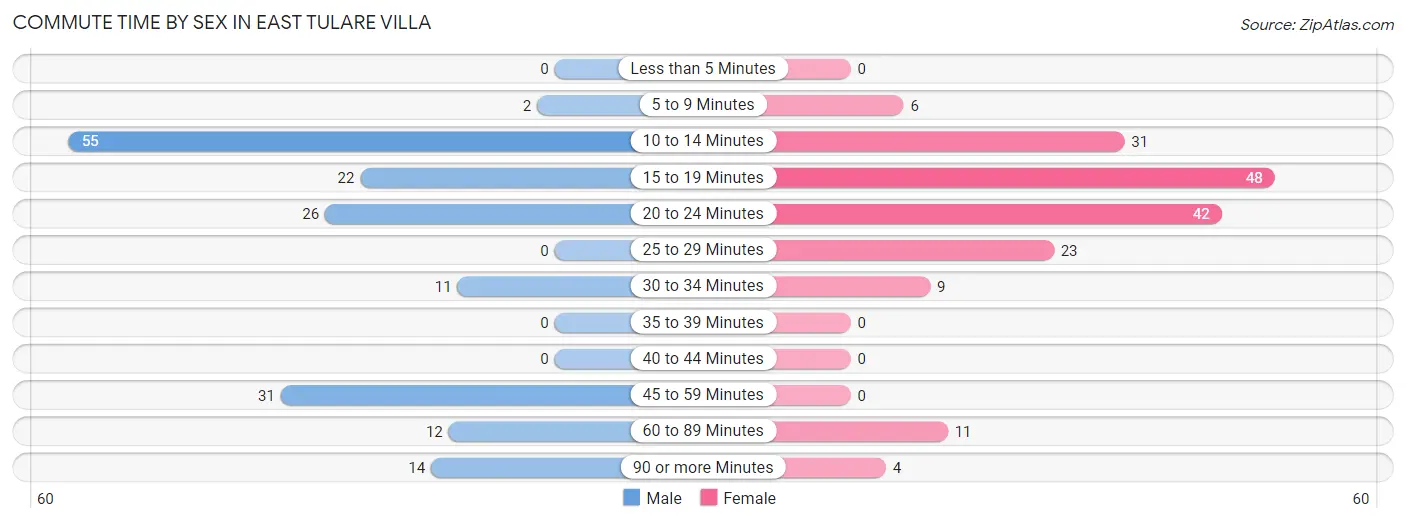
| Commute Time | Male | Female |
| Less than 5 Minutes | 0 (0.0%) | 0 (0.0%) |
| 5 to 9 Minutes | 2 (1.2%) | 6 (3.5%) |
| 10 to 14 Minutes | 55 (31.8%) | 31 (17.8%) |
| 15 to 19 Minutes | 22 (12.7%) | 48 (27.6%) |
| 20 to 24 Minutes | 26 (15.0%) | 42 (24.1%) |
| 25 to 29 Minutes | 0 (0.0%) | 23 (13.2%) |
| 30 to 34 Minutes | 11 (6.4%) | 9 (5.2%) |
| 35 to 39 Minutes | 0 (0.0%) | 0 (0.0%) |
| 40 to 44 Minutes | 0 (0.0%) | 0 (0.0%) |
| 45 to 59 Minutes | 31 (17.9%) | 0 (0.0%) |
| 60 to 89 Minutes | 12 (6.9%) | 11 (6.3%) |
| 90 or more Minutes | 14 (8.1%) | 4 (2.3%) |
Time of Departure to Work by Sex in East Tulare Villa
The most frequent times of departure to work in East Tulare Villa are 6:00 AM to 6:29 AM (40, 23.1%) for males and 7:30 AM to 7:59 AM (31, 17.8%) for females.
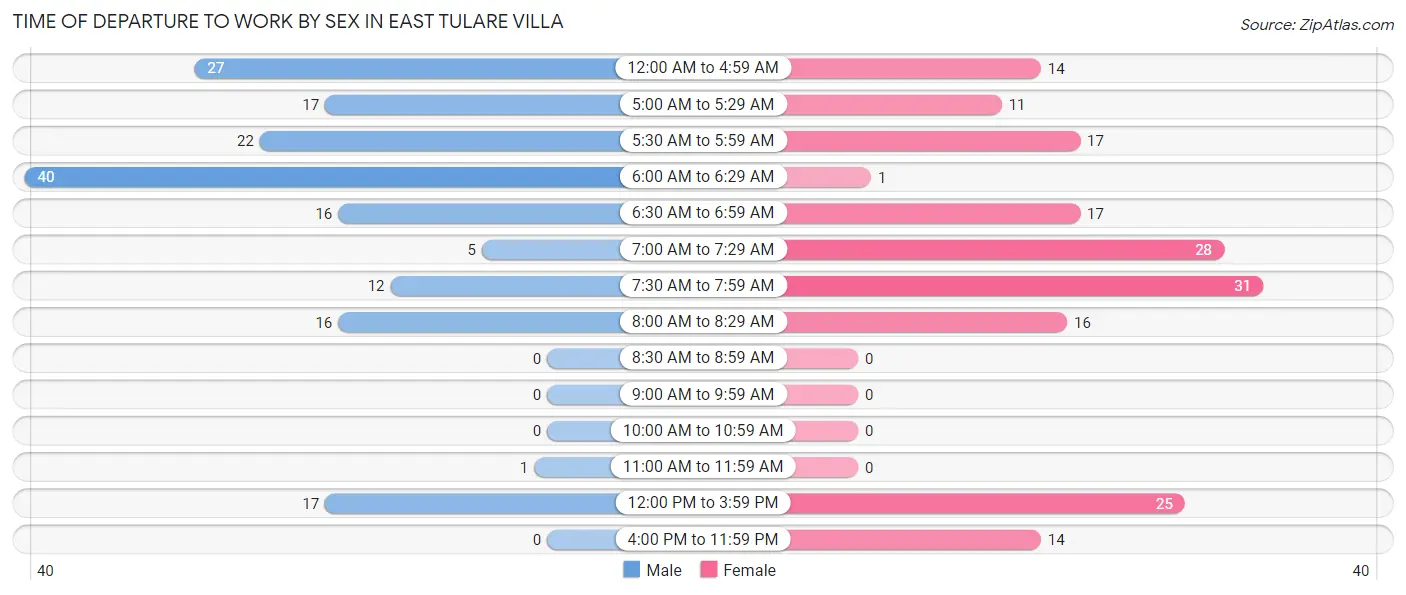
| Time of Departure | Male | Female |
| 12:00 AM to 4:59 AM | 27 (15.6%) | 14 (8.1%) |
| 5:00 AM to 5:29 AM | 17 (9.8%) | 11 (6.3%) |
| 5:30 AM to 5:59 AM | 22 (12.7%) | 17 (9.8%) |
| 6:00 AM to 6:29 AM | 40 (23.1%) | 1 (0.6%) |
| 6:30 AM to 6:59 AM | 16 (9.2%) | 17 (9.8%) |
| 7:00 AM to 7:29 AM | 5 (2.9%) | 28 (16.1%) |
| 7:30 AM to 7:59 AM | 12 (6.9%) | 31 (17.8%) |
| 8:00 AM to 8:29 AM | 16 (9.2%) | 16 (9.2%) |
| 8:30 AM to 8:59 AM | 0 (0.0%) | 0 (0.0%) |
| 9:00 AM to 9:59 AM | 0 (0.0%) | 0 (0.0%) |
| 10:00 AM to 10:59 AM | 0 (0.0%) | 0 (0.0%) |
| 11:00 AM to 11:59 AM | 1 (0.6%) | 0 (0.0%) |
| 12:00 PM to 3:59 PM | 17 (9.8%) | 25 (14.4%) |
| 4:00 PM to 11:59 PM | 0 (0.0%) | 14 (8.1%) |
| Total | 173 (100.0%) | 174 (100.0%) |
Housing Occupancy in East Tulare Villa
Occupancy by Ownership in East Tulare Villa
Of the total 226 dwellings in East Tulare Villa, owner-occupied units account for 120 (53.1%), while renter-occupied units make up 106 (46.9%).
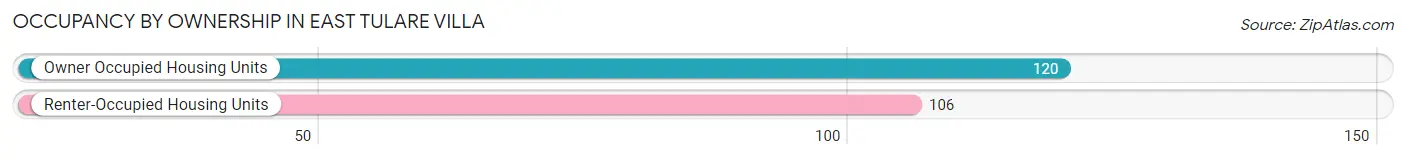
| Occupancy | # Housing Units | % Housing Units |
| Owner Occupied Housing Units | 120 | 53.1% |
| Renter-Occupied Housing Units | 106 | 46.9% |
| Total Occupied Housing Units | 226 | 100.0% |
Occupancy by Household Size in East Tulare Villa
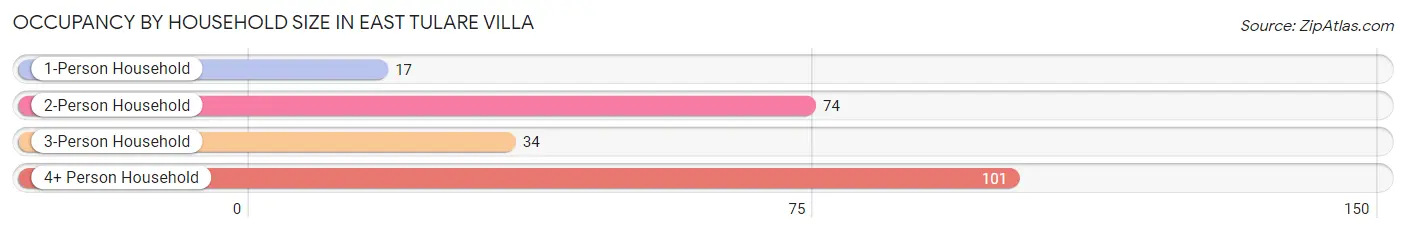
| Household Size | # Housing Units | % Housing Units |
| 1-Person Household | 17 | 7.5% |
| 2-Person Household | 74 | 32.7% |
| 3-Person Household | 34 | 15.0% |
| 4+ Person Household | 101 | 44.7% |
| Total Housing Units | 226 | 100.0% |
Occupancy by Ownership by Household Size in East Tulare Villa
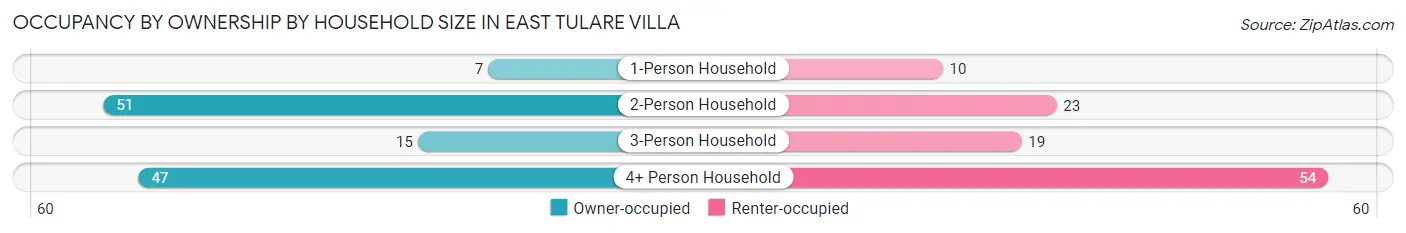
| Household Size | Owner-occupied | Renter-occupied |
| 1-Person Household | 7 (41.2%) | 10 (58.8%) |
| 2-Person Household | 51 (68.9%) | 23 (31.1%) |
| 3-Person Household | 15 (44.1%) | 19 (55.9%) |
| 4+ Person Household | 47 (46.5%) | 54 (53.5%) |
| Total Housing Units | 120 (53.1%) | 106 (46.9%) |
Occupancy by Educational Attainment in East Tulare Villa
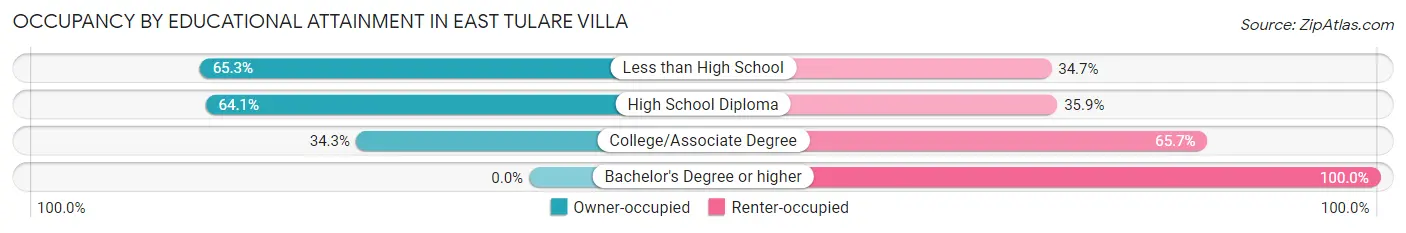
| Household Size | Owner-occupied | Renter-occupied |
| Less than High School | 47 (65.3%) | 25 (34.7%) |
| High School Diploma | 50 (64.1%) | 28 (35.9%) |
| College/Associate Degree | 23 (34.3%) | 44 (65.7%) |
| Bachelor's Degree or higher | 0 (0.0%) | 9 (100.0%) |
Occupancy by Age of Householder in East Tulare Villa
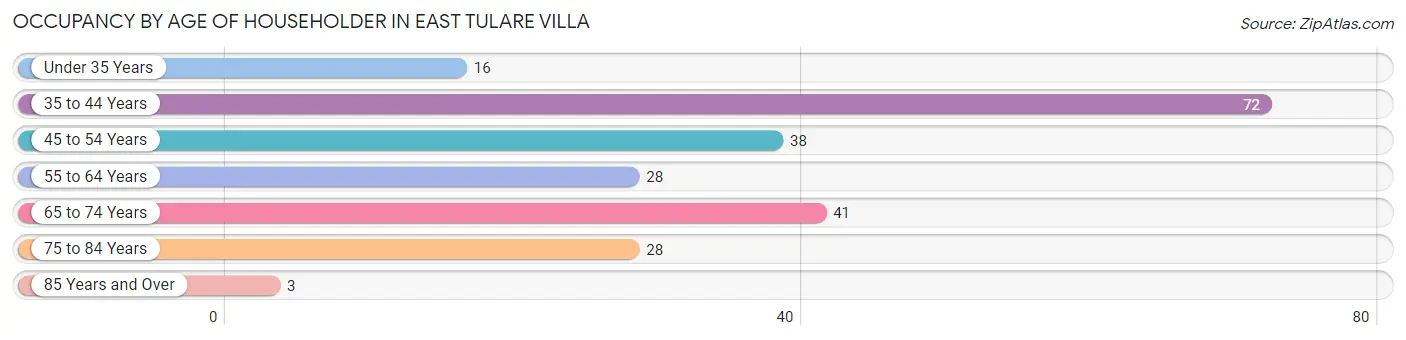
| Age Bracket | # Households | % Households |
| Under 35 Years | 16 | 7.1% |
| 35 to 44 Years | 72 | 31.9% |
| 45 to 54 Years | 38 | 16.8% |
| 55 to 64 Years | 28 | 12.4% |
| 65 to 74 Years | 41 | 18.1% |
| 75 to 84 Years | 28 | 12.4% |
| 85 Years and Over | 3 | 1.3% |
| Total | 226 | 100.0% |
Housing Finances in East Tulare Villa
Median Income by Occupancy in East Tulare Villa
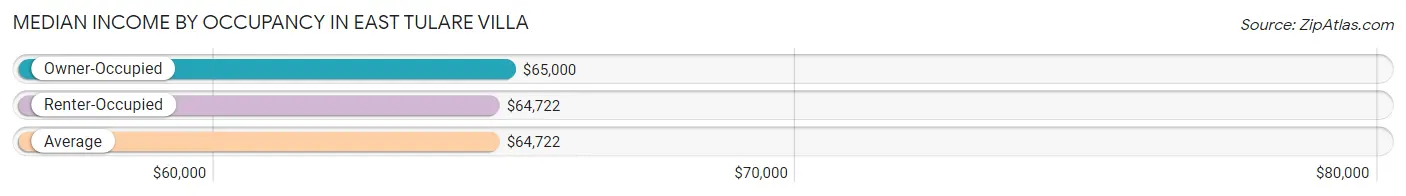
| Occupancy Type | # Households | Median Income |
| Owner-Occupied | 120 (53.1%) | $65,000 |
| Renter-Occupied | 106 (46.9%) | $64,722 |
| Average | 226 (100.0%) | $64,722 |
Occupancy by Householder Income Bracket in East Tulare Villa
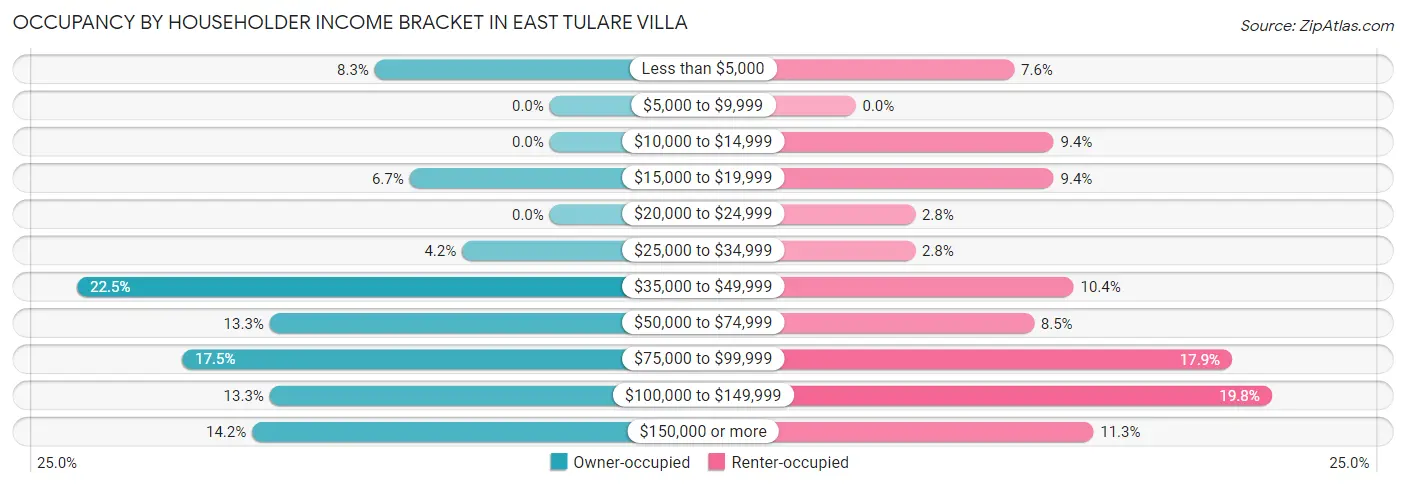
| Income Bracket | Owner-occupied | Renter-occupied |
| Less than $5,000 | 10 (8.3%) | 8 (7.5%) |
| $5,000 to $9,999 | 0 (0.0%) | 0 (0.0%) |
| $10,000 to $14,999 | 0 (0.0%) | 10 (9.4%) |
| $15,000 to $19,999 | 8 (6.7%) | 10 (9.4%) |
| $20,000 to $24,999 | 0 (0.0%) | 3 (2.8%) |
| $25,000 to $34,999 | 5 (4.2%) | 3 (2.8%) |
| $35,000 to $49,999 | 27 (22.5%) | 11 (10.4%) |
| $50,000 to $74,999 | 16 (13.3%) | 9 (8.5%) |
| $75,000 to $99,999 | 21 (17.5%) | 19 (17.9%) |
| $100,000 to $149,999 | 16 (13.3%) | 21 (19.8%) |
| $150,000 or more | 17 (14.2%) | 12 (11.3%) |
| Total | 120 (100.0%) | 106 (100.0%) |
Monthly Housing Cost Tiers in East Tulare Villa
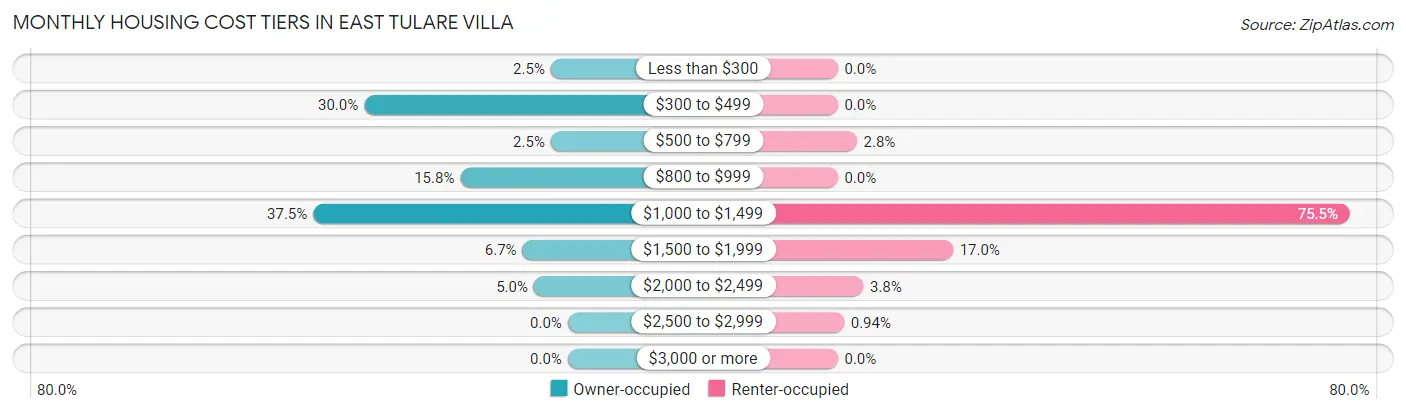
| Monthly Cost | Owner-occupied | Renter-occupied |
| Less than $300 | 3 (2.5%) | 0 (0.0%) |
| $300 to $499 | 36 (30.0%) | 0 (0.0%) |
| $500 to $799 | 3 (2.5%) | 3 (2.8%) |
| $800 to $999 | 19 (15.8%) | 0 (0.0%) |
| $1,000 to $1,499 | 45 (37.5%) | 80 (75.5%) |
| $1,500 to $1,999 | 8 (6.7%) | 18 (17.0%) |
| $2,000 to $2,499 | 6 (5.0%) | 4 (3.8%) |
| $2,500 to $2,999 | 0 (0.0%) | 1 (0.9%) |
| $3,000 or more | 0 (0.0%) | 0 (0.0%) |
| Total | 120 (100.0%) | 106 (100.0%) |
Physical Housing Characteristics in East Tulare Villa
Housing Structures in East Tulare Villa
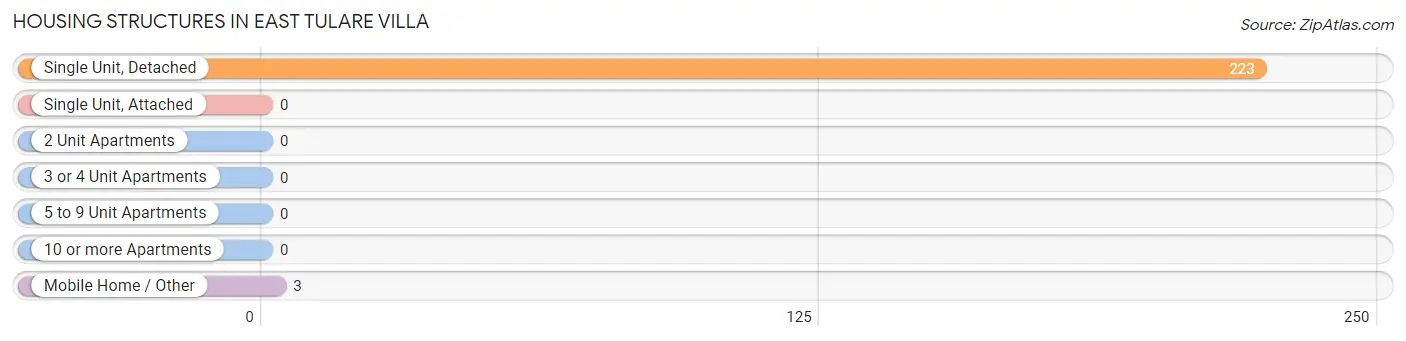
| Structure Type | # Housing Units | % Housing Units |
| Single Unit, Detached | 223 | 98.7% |
| Single Unit, Attached | 0 | 0.0% |
| 2 Unit Apartments | 0 | 0.0% |
| 3 or 4 Unit Apartments | 0 | 0.0% |
| 5 to 9 Unit Apartments | 0 | 0.0% |
| 10 or more Apartments | 0 | 0.0% |
| Mobile Home / Other | 3 | 1.3% |
| Total | 226 | 100.0% |
Housing Structures by Occupancy in East Tulare Villa
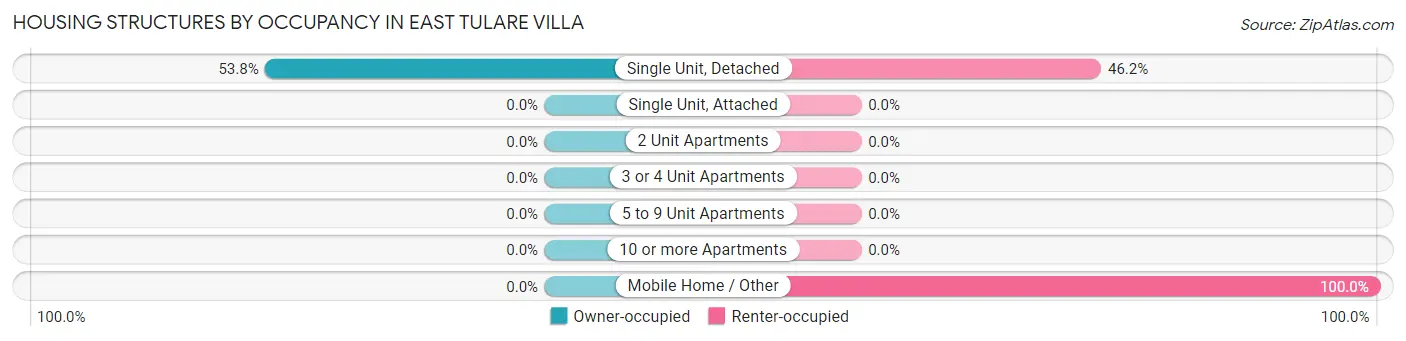
| Structure Type | Owner-occupied | Renter-occupied |
| Single Unit, Detached | 120 (53.8%) | 103 (46.2%) |
| Single Unit, Attached | 0 (0.0%) | 0 (0.0%) |
| 2 Unit Apartments | 0 (0.0%) | 0 (0.0%) |
| 3 or 4 Unit Apartments | 0 (0.0%) | 0 (0.0%) |
| 5 to 9 Unit Apartments | 0 (0.0%) | 0 (0.0%) |
| 10 or more Apartments | 0 (0.0%) | 0 (0.0%) |
| Mobile Home / Other | 0 (0.0%) | 3 (100.0%) |
| Total | 120 (53.1%) | 106 (46.9%) |
Housing Structures by Number of Rooms in East Tulare Villa
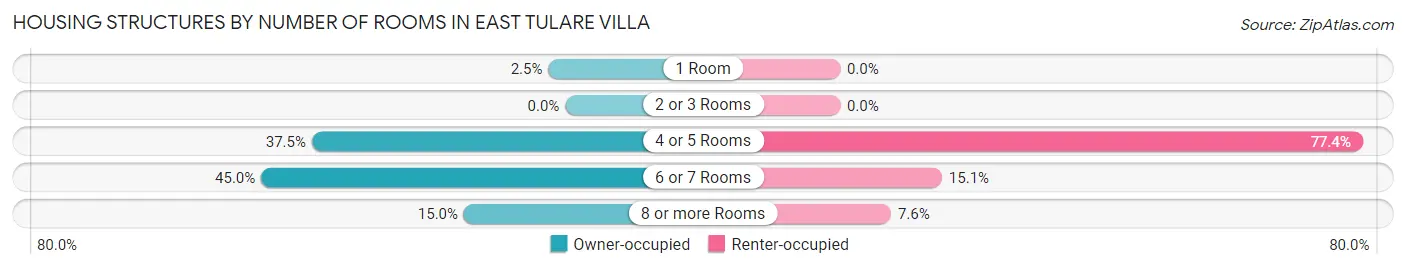
| Number of Rooms | Owner-occupied | Renter-occupied |
| 1 Room | 3 (2.5%) | 0 (0.0%) |
| 2 or 3 Rooms | 0 (0.0%) | 0 (0.0%) |
| 4 or 5 Rooms | 45 (37.5%) | 82 (77.4%) |
| 6 or 7 Rooms | 54 (45.0%) | 16 (15.1%) |
| 8 or more Rooms | 18 (15.0%) | 8 (7.5%) |
| Total | 120 (100.0%) | 106 (100.0%) |
Housing Structure by Heating Type in East Tulare Villa
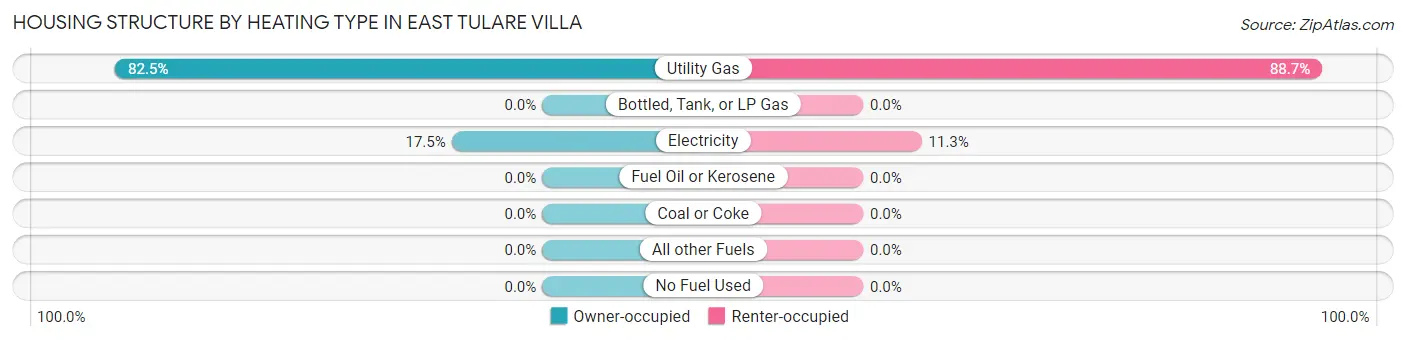
| Heating Type | Owner-occupied | Renter-occupied |
| Utility Gas | 99 (82.5%) | 94 (88.7%) |
| Bottled, Tank, or LP Gas | 0 (0.0%) | 0 (0.0%) |
| Electricity | 21 (17.5%) | 12 (11.3%) |
| Fuel Oil or Kerosene | 0 (0.0%) | 0 (0.0%) |
| Coal or Coke | 0 (0.0%) | 0 (0.0%) |
| All other Fuels | 0 (0.0%) | 0 (0.0%) |
| No Fuel Used | 0 (0.0%) | 0 (0.0%) |
| Total | 120 (100.0%) | 106 (100.0%) |
Household Vehicle Usage in East Tulare Villa
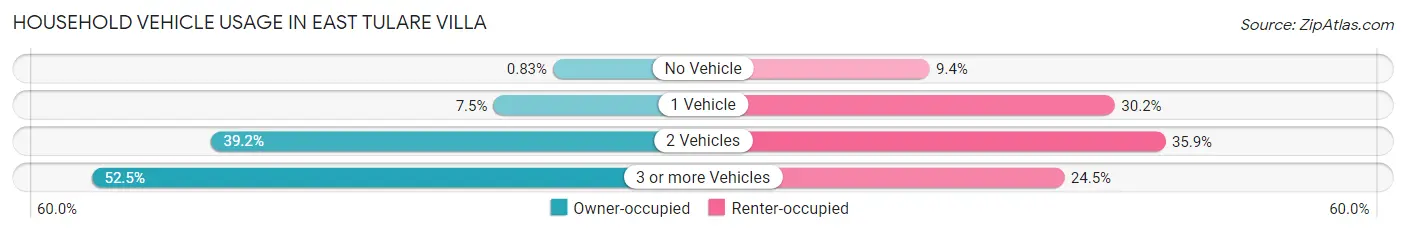
| Vehicles per Household | Owner-occupied | Renter-occupied |
| No Vehicle | 1 (0.8%) | 10 (9.4%) |
| 1 Vehicle | 9 (7.5%) | 32 (30.2%) |
| 2 Vehicles | 47 (39.2%) | 38 (35.8%) |
| 3 or more Vehicles | 63 (52.5%) | 26 (24.5%) |
| Total | 120 (100.0%) | 106 (100.0%) |
Real Estate & Mortgages in East Tulare Villa
Real Estate and Mortgage Overview in East Tulare Villa
| Characteristic | Without Mortgage | With Mortgage |
| Housing Units | 42 | 78 |
| Median Property Value | $224,000 | $224,300 |
| Median Household Income | $68,333 | $17 |
| Monthly Housing Costs | $333 | $0 |
| Real Estate Taxes | $1,118 | $0 |
Property Value by Mortgage Status in East Tulare Villa
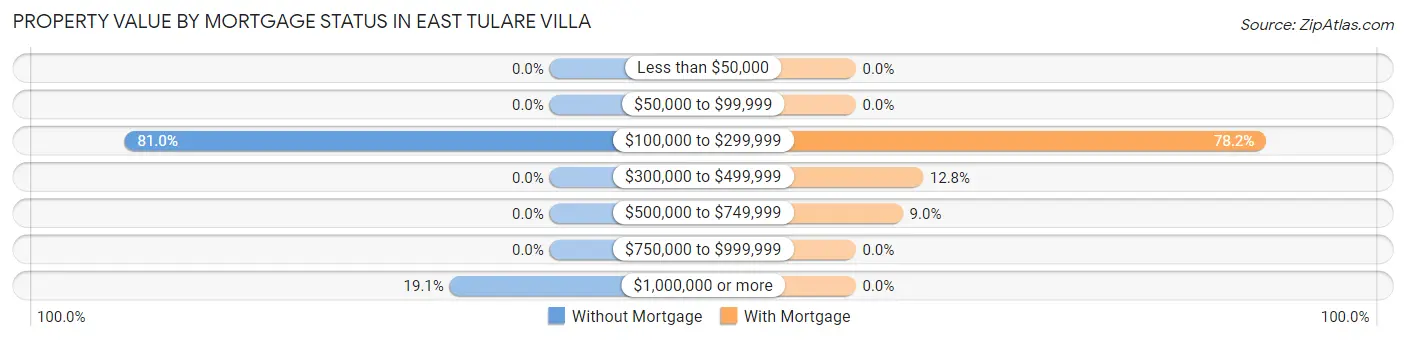
| Property Value | Without Mortgage | With Mortgage |
| Less than $50,000 | 0 (0.0%) | 0 (0.0%) |
| $50,000 to $99,999 | 0 (0.0%) | 0 (0.0%) |
| $100,000 to $299,999 | 34 (80.9%) | 61 (78.2%) |
| $300,000 to $499,999 | 0 (0.0%) | 10 (12.8%) |
| $500,000 to $749,999 | 0 (0.0%) | 7 (9.0%) |
| $750,000 to $999,999 | 0 (0.0%) | 0 (0.0%) |
| $1,000,000 or more | 8 (19.1%) | 0 (0.0%) |
| Total | 42 (100.0%) | 78 (100.0%) |
Household Income by Mortgage Status in East Tulare Villa
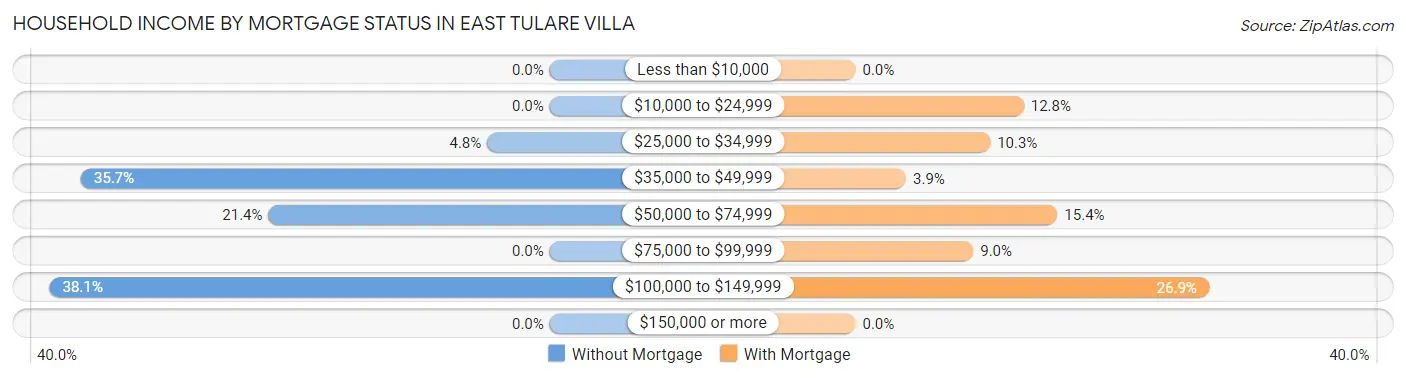
| Household Income | Without Mortgage | With Mortgage |
| Less than $10,000 | 0 (0.0%) | 0 (0.0%) |
| $10,000 to $24,999 | 0 (0.0%) | 10 (12.8%) |
| $25,000 to $34,999 | 2 (4.8%) | 8 (10.3%) |
| $35,000 to $49,999 | 15 (35.7%) | 3 (3.8%) |
| $50,000 to $74,999 | 9 (21.4%) | 12 (15.4%) |
| $75,000 to $99,999 | 0 (0.0%) | 7 (9.0%) |
| $100,000 to $149,999 | 16 (38.1%) | 21 (26.9%) |
| $150,000 or more | 0 (0.0%) | 0 (0.0%) |
| Total | 42 (100.0%) | 78 (100.0%) |
Property Value to Household Income Ratio in East Tulare Villa
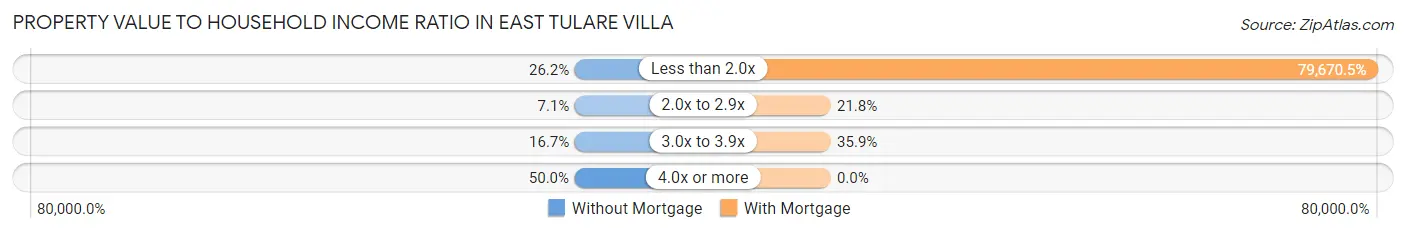
| Value-to-Income Ratio | Without Mortgage | With Mortgage |
| Less than 2.0x | 11 (26.2%) | 62,143 (79,670.5%) |
| 2.0x to 2.9x | 3 (7.1%) | 17 (21.8%) |
| 3.0x to 3.9x | 7 (16.7%) | 28 (35.9%) |
| 4.0x or more | 21 (50.0%) | 0 (0.0%) |
| Total | 42 (100.0%) | 78 (100.0%) |
Real Estate Taxes by Mortgage Status in East Tulare Villa
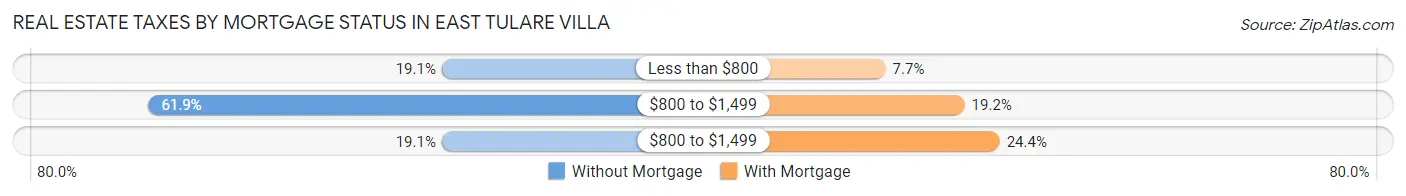
| Property Taxes | Without Mortgage | With Mortgage |
| Less than $800 | 8 (19.1%) | 6 (7.7%) |
| $800 to $1,499 | 26 (61.9%) | 15 (19.2%) |
| $800 to $1,499 | 8 (19.1%) | 19 (24.4%) |
| Total | 42 (100.0%) | 78 (100.0%) |
Health & Disability in East Tulare Villa
Health Insurance Coverage by Age in East Tulare Villa
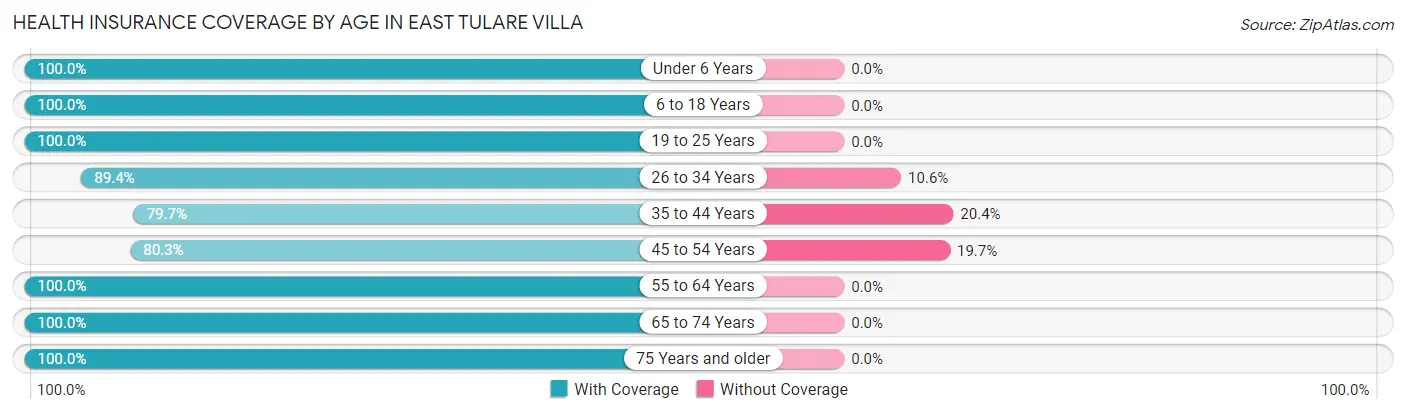
| Age Bracket | With Coverage | Without Coverage |
| Under 6 Years | 73 (100.0%) | 0 (0.0%) |
| 6 to 18 Years | 198 (100.0%) | 0 (0.0%) |
| 19 to 25 Years | 60 (100.0%) | 0 (0.0%) |
| 26 to 34 Years | 135 (89.4%) | 16 (10.6%) |
| 35 to 44 Years | 90 (79.6%) | 23 (20.3%) |
| 45 to 54 Years | 57 (80.3%) | 14 (19.7%) |
| 55 to 64 Years | 86 (100.0%) | 0 (0.0%) |
| 65 to 74 Years | 62 (100.0%) | 0 (0.0%) |
| 75 Years and older | 48 (100.0%) | 0 (0.0%) |
| Total | 809 (93.9%) | 53 (6.1%) |
Health Insurance Coverage by Citizenship Status in East Tulare Villa

| Citizenship Status | With Coverage | Without Coverage |
| Native Born | 73 (100.0%) | 0 (0.0%) |
| Foreign Born, Citizen | 198 (100.0%) | 0 (0.0%) |
| Foreign Born, not a Citizen | 60 (100.0%) | 0 (0.0%) |
Health Insurance Coverage by Household Income in East Tulare Villa
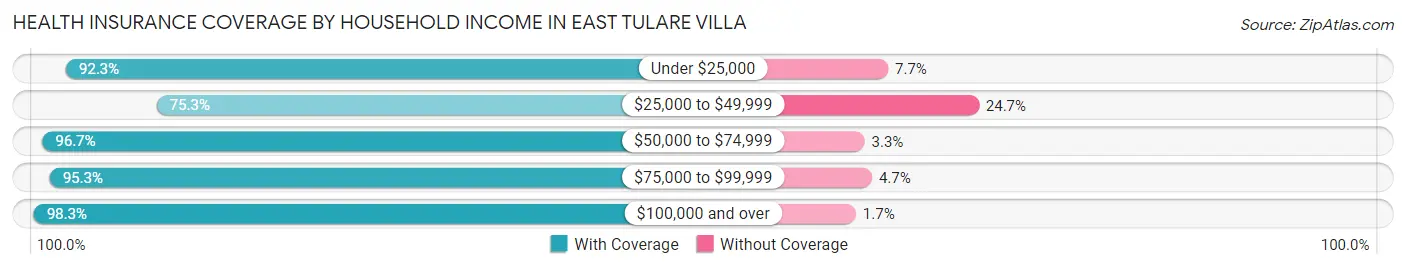
| Household Income | With Coverage | Without Coverage |
| Under $25,000 | 143 (92.3%) | 12 (7.7%) |
| $25,000 to $49,999 | 73 (75.3%) | 24 (24.7%) |
| $50,000 to $74,999 | 87 (96.7%) | 3 (3.3%) |
| $75,000 to $99,999 | 162 (95.3%) | 8 (4.7%) |
| $100,000 and over | 344 (98.3%) | 6 (1.7%) |
Public vs Private Health Insurance Coverage by Age in East Tulare Villa
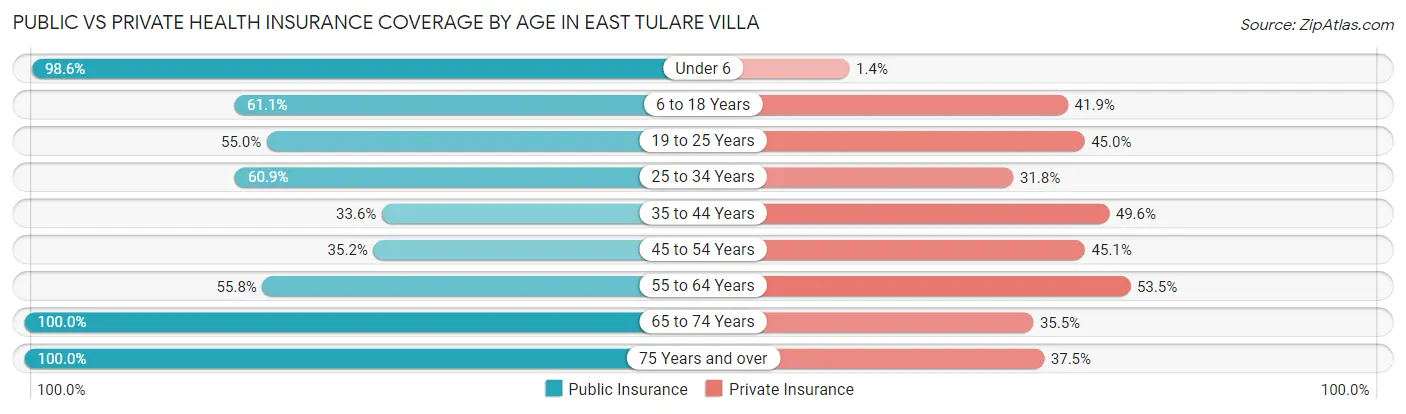
| Age Bracket | Public Insurance | Private Insurance |
| Under 6 | 72 (98.6%) | 1 (1.4%) |
| 6 to 18 Years | 121 (61.1%) | 83 (41.9%) |
| 19 to 25 Years | 33 (55.0%) | 27 (45.0%) |
| 25 to 34 Years | 92 (60.9%) | 48 (31.8%) |
| 35 to 44 Years | 38 (33.6%) | 56 (49.6%) |
| 45 to 54 Years | 25 (35.2%) | 32 (45.1%) |
| 55 to 64 Years | 48 (55.8%) | 46 (53.5%) |
| 65 to 74 Years | 62 (100.0%) | 22 (35.5%) |
| 75 Years and over | 48 (100.0%) | 18 (37.5%) |
| Total | 539 (62.5%) | 333 (38.6%) |
Disability Status by Sex by Age in East Tulare Villa
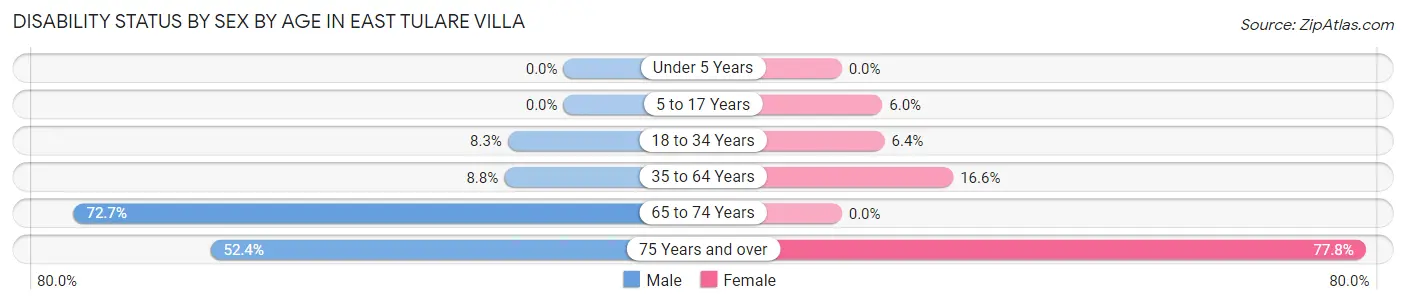
| Age Bracket | Male | Female |
| Under 5 Years | 0 (0.0%) | 0 (0.0%) |
| 5 to 17 Years | 0 (0.0%) | 5 (6.0%) |
| 18 to 34 Years | 9 (8.3%) | 7 (6.4%) |
| 35 to 64 Years | 11 (8.8%) | 24 (16.6%) |
| 65 to 74 Years | 32 (72.7%) | 0 (0.0%) |
| 75 Years and over | 11 (52.4%) | 21 (77.8%) |
Disability Class by Sex by Age in East Tulare Villa
Disability Class: Hearing Difficulty
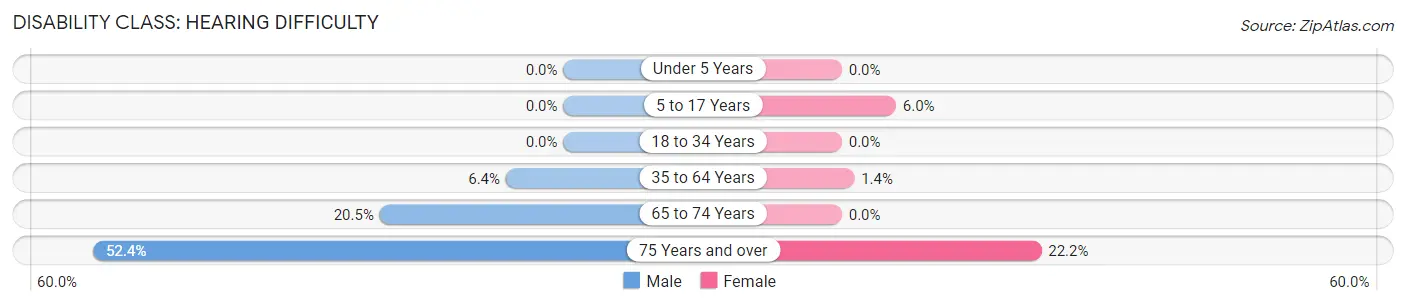
| Age Bracket | Male | Female |
| Under 5 Years | 0 (0.0%) | 0 (0.0%) |
| 5 to 17 Years | 0 (0.0%) | 5 (6.0%) |
| 18 to 34 Years | 0 (0.0%) | 0 (0.0%) |
| 35 to 64 Years | 8 (6.4%) | 2 (1.4%) |
| 65 to 74 Years | 9 (20.4%) | 0 (0.0%) |
| 75 Years and over | 11 (52.4%) | 6 (22.2%) |
Disability Class: Vision Difficulty
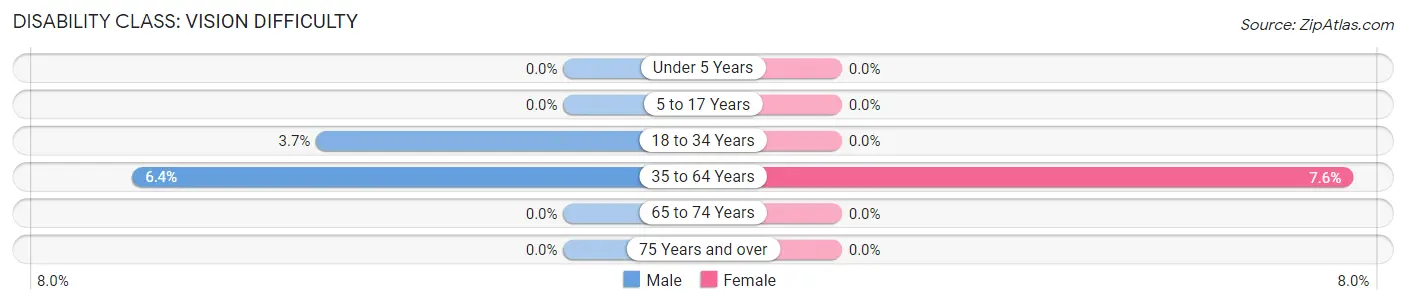
| Age Bracket | Male | Female |
| Under 5 Years | 0 (0.0%) | 0 (0.0%) |
| 5 to 17 Years | 0 (0.0%) | 0 (0.0%) |
| 18 to 34 Years | 4 (3.7%) | 0 (0.0%) |
| 35 to 64 Years | 8 (6.4%) | 11 (7.6%) |
| 65 to 74 Years | 0 (0.0%) | 0 (0.0%) |
| 75 Years and over | 0 (0.0%) | 0 (0.0%) |
Disability Class: Cognitive Difficulty
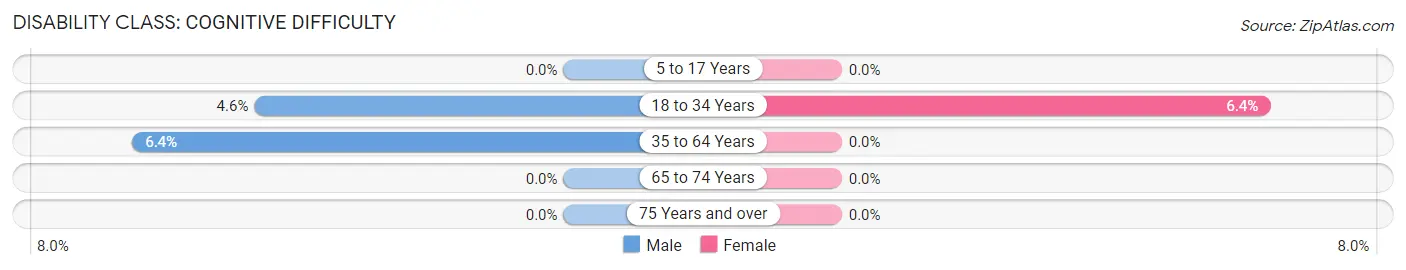
| Age Bracket | Male | Female |
| 5 to 17 Years | 0 (0.0%) | 0 (0.0%) |
| 18 to 34 Years | 5 (4.6%) | 7 (6.4%) |
| 35 to 64 Years | 8 (6.4%) | 0 (0.0%) |
| 65 to 74 Years | 0 (0.0%) | 0 (0.0%) |
| 75 Years and over | 0 (0.0%) | 0 (0.0%) |
Disability Class: Ambulatory Difficulty
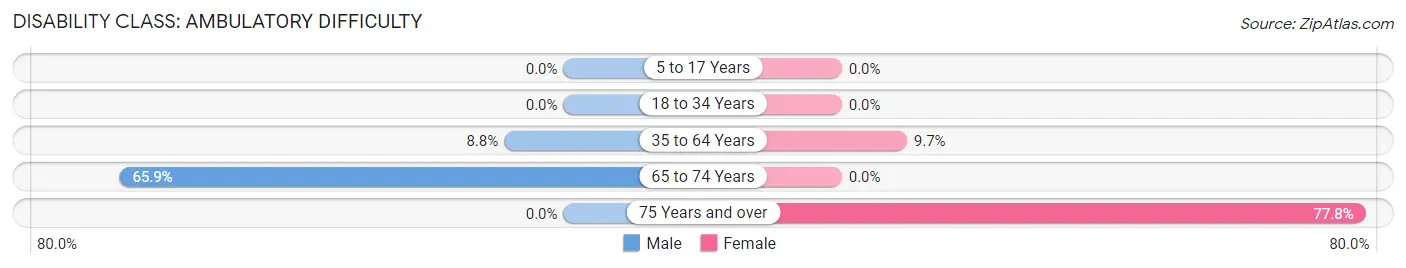
| Age Bracket | Male | Female |
| 5 to 17 Years | 0 (0.0%) | 0 (0.0%) |
| 18 to 34 Years | 0 (0.0%) | 0 (0.0%) |
| 35 to 64 Years | 11 (8.8%) | 14 (9.7%) |
| 65 to 74 Years | 29 (65.9%) | 0 (0.0%) |
| 75 Years and over | 0 (0.0%) | 21 (77.8%) |
Disability Class: Self-Care Difficulty
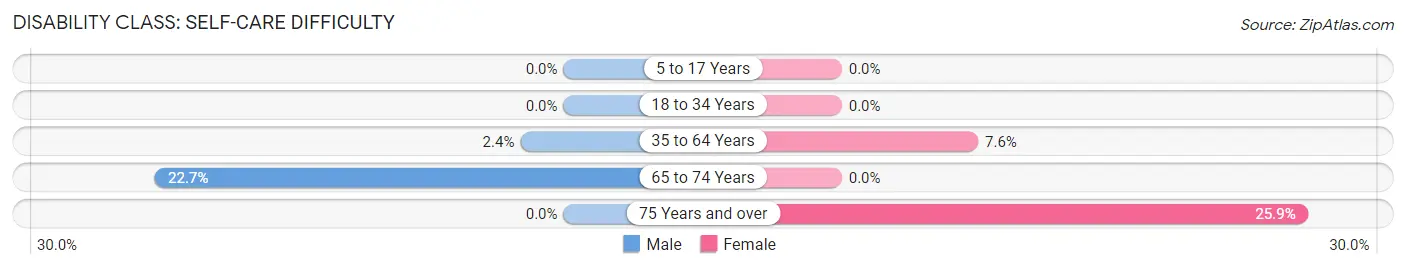
| Age Bracket | Male | Female |
| 5 to 17 Years | 0 (0.0%) | 0 (0.0%) |
| 18 to 34 Years | 0 (0.0%) | 0 (0.0%) |
| 35 to 64 Years | 3 (2.4%) | 11 (7.6%) |
| 65 to 74 Years | 10 (22.7%) | 0 (0.0%) |
| 75 Years and over | 0 (0.0%) | 7 (25.9%) |
Technology Access in East Tulare Villa
Computing Device Access in East Tulare Villa
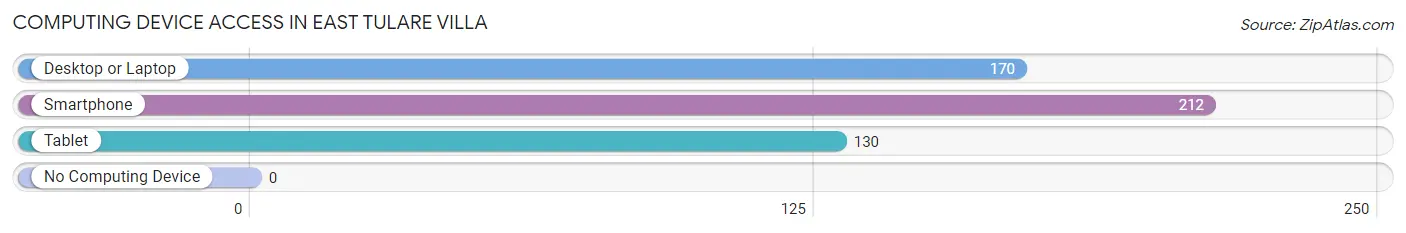
| Device Type | # Households | % Households |
| Desktop or Laptop | 170 | 75.2% |
| Smartphone | 212 | 93.8% |
| Tablet | 130 | 57.5% |
| No Computing Device | 0 | 0.0% |
| Total | 226 | 100.0% |
Internet Access in East Tulare Villa
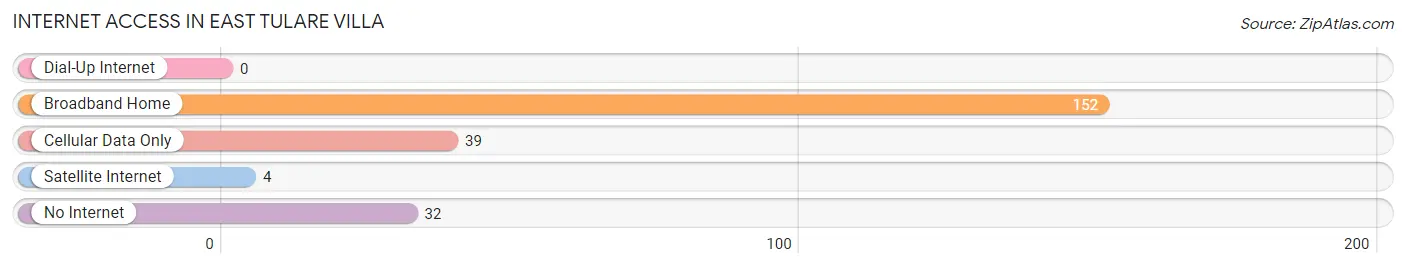
| Internet Type | # Households | % Households |
| Dial-Up Internet | 0 | 0.0% |
| Broadband Home | 152 | 67.3% |
| Cellular Data Only | 39 | 17.3% |
| Satellite Internet | 4 | 1.8% |
| No Internet | 32 | 14.2% |
| Total | 226 | 100.0% |
East Tulare Villa Summary
History
East Tulare Villa is a small unincorporated community located in Tulare County, California. It is situated in the San Joaquin Valley, approximately 8 miles east of the city of Tulare. The community was founded in the early 1900s by a group of settlers from the nearby town of Tulare. The settlers were looking for a place to call home and found the area to be ideal for farming and ranching.
The area was originally known as East Tulare, but the name was changed to East Tulare Villa in the early 1920s. The name was chosen to reflect the Spanish influence in the area, as the word “villa” is derived from the Spanish word for “village”.
The community was primarily an agricultural area, with many of the residents working in the fields or on the ranches. The area was also home to a number of small businesses, including a general store, a blacksmith shop, and a post office.
In the 1950s, the area began to experience a population boom as more people moved to the area to take advantage of the agricultural opportunities. This growth continued into the 1960s and 1970s, and by the 1980s, the population had grown to over 1,000 people.
Geography
East Tulare Villa is located in the San Joaquin Valley, approximately 8 miles east of the city of Tulare. The area is mostly flat, with some rolling hills in the surrounding area. The climate is generally mild, with hot summers and cool winters.
The area is home to a variety of wildlife, including deer, coyotes, and various species of birds. The nearby Tule River provides a habitat for a variety of fish, including bass, catfish, and trout.
Economy
The economy of East Tulare Villa is primarily based on agriculture. The area is home to a number of farms and ranches, which produce a variety of crops, including grapes, almonds, and cotton. The area is also home to a number of small businesses, including a general store, a blacksmith shop, and a post office.
Demographics
As of the 2010 census, the population of East Tulare Villa was 1,093. The racial makeup of the community was 65.3% White, 0.9% African American, 0.7% Native American, 0.3% Asian, 0.1% Pacific Islander, and 32.7% from other races. The median household income was $31,250, and the median family income was $35,000. The per capita income was $14,845.
Conclusion
East Tulare Villa is a small unincorporated community located in Tulare County, California. It is situated in the San Joaquin Valley, approximately 8 miles east of the city of Tulare. The area was originally known as East Tulare, but the name was changed to East Tulare Villa in the early 1920s. The economy of East Tulare Villa is primarily based on agriculture, with many of the residents working in the fields or on the ranches. As of the 2010 census, the population of East Tulare Villa was 1,093. The racial makeup of the community was 65.3% White, 0.9% African American, 0.7% Native American, 0.3% Asian, 0.1% Pacific Islander, and 32.7% from other races. The median household income was $31,250, and the median family income was $35,000. The per capita income was $14,845.
Common Questions
What is Per Capita Income in East Tulare Villa?
Per Capita income in East Tulare Villa is $23,705.
What is the Median Family Income in East Tulare Villa?
Median Family Income in East Tulare Villa is $74,167.
What is the Median Household income in East Tulare Villa?
Median Household Income in East Tulare Villa is $64,722.
What is Income or Wage Gap in East Tulare Villa?
Income or Wage Gap in East Tulare Villa is 7.0%.
Women in East Tulare Villa earn 93.0 cents for every dollar earned by a man.
What is Inequality or Gini Index in East Tulare Villa?
Inequality or Gini Index in East Tulare Villa is 0.45.
What is the Total Population of East Tulare Villa?
Total Population of East Tulare Villa is 862.
What is the Total Male Population of East Tulare Villa?
Total Male Population of East Tulare Villa is 456.
What is the Total Female Population of East Tulare Villa?
Total Female Population of East Tulare Villa is 406.
What is the Ratio of Males per 100 Females in East Tulare Villa?
There are 112.32 Males per 100 Females in East Tulare Villa.
What is the Ratio of Females per 100 Males in East Tulare Villa?
There are 89.04 Females per 100 Males in East Tulare Villa.
What is the Median Population Age in East Tulare Villa?
Median Population Age in East Tulare Villa is 30.4 Years.
What is the Average Family Size in East Tulare Villa
Average Family Size in East Tulare Villa is 4.0 People.
What is the Average Household Size in East Tulare Villa
Average Household Size in East Tulare Villa is 3.8 People.
How Large is the Labor Force in East Tulare Villa?
There are 383 People in the Labor Forcein in East Tulare Villa.
What is the Percentage of People in the Labor Force in East Tulare Villa?
63.6% of People are in the Labor Force in East Tulare Villa.
What is the Unemployment Rate in East Tulare Villa?
Unemployment Rate in East Tulare Villa is 7.3%.