East Sonora, CA Map & Demographics
East Sonora Map
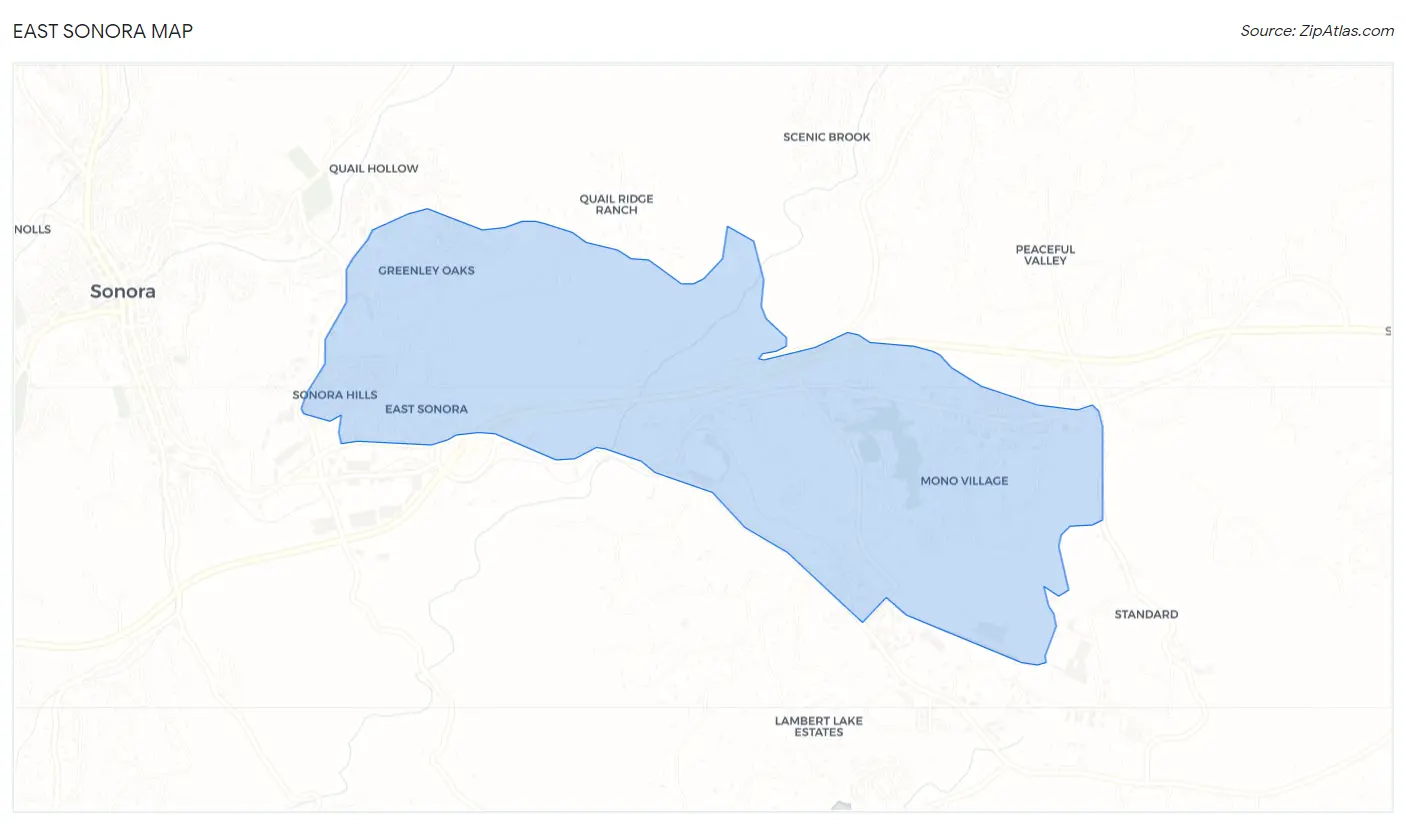
East Sonora Overview
$51,280
PER CAPITA INCOME
$88,462
AVG FAMILY INCOME
$73,466
AVG HOUSEHOLD INCOME
25.5%
WAGE / INCOME GAP [ % ]
74.5¢/ $1
WAGE / INCOME GAP [ $ ]
0.47
INEQUALITY / GINI INDEX
2,664
TOTAL POPULATION
1,121
MALE POPULATION
1,543
FEMALE POPULATION
72.65
MALES / 100 FEMALES
137.64
FEMALES / 100 MALES
61.7
MEDIAN AGE
2.4
AVG FAMILY SIZE
1.8
AVG HOUSEHOLD SIZE
888
LABOR FORCE [ PEOPLE ]
37.4%
PERCENT IN LABOR FORCE
Income in East Sonora
Income Overview in East Sonora
Per Capita Income in East Sonora is $51,280, while median incomes of families and households are $88,462 and $73,466 respectively.
| Characteristic | Number | Measure |
| Per Capita Income | 2,664 | $51,280 |
| Median Family Income | 768 | $88,462 |
| Mean Family Income | 768 | $107,035 |
| Median Household Income | 1,361 | $73,466 |
| Mean Household Income | 1,361 | $101,335 |
| Income Deficit | 768 | $0 |
| Wage / Income Gap (%) | 2,664 | 25.55% |
| Wage / Income Gap ($) | 2,664 | 74.45¢ per $1 |
| Gini / Inequality Index | 2,664 | 0.47 |
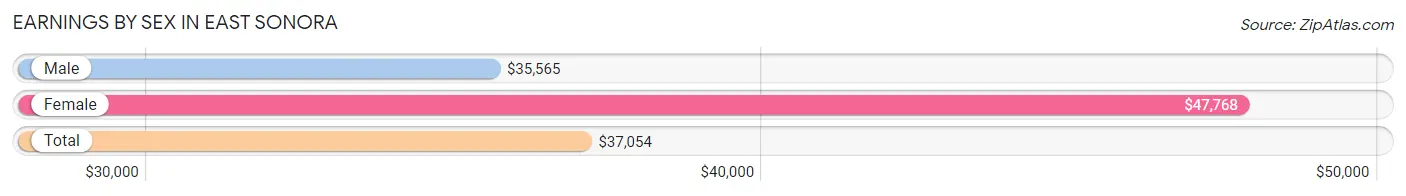
Earnings by Sex in East Sonora
Average Earnings in East Sonora are $37,054, $35,565 for men and $47,768 for women, a difference of 25.6%.
| Sex | Number | Average Earnings |
| Male | 515 (48.6%) | $35,565 |
| Female | 544 (51.4%) | $47,768 |
| Total | 1,059 (100.0%) | $37,054 |
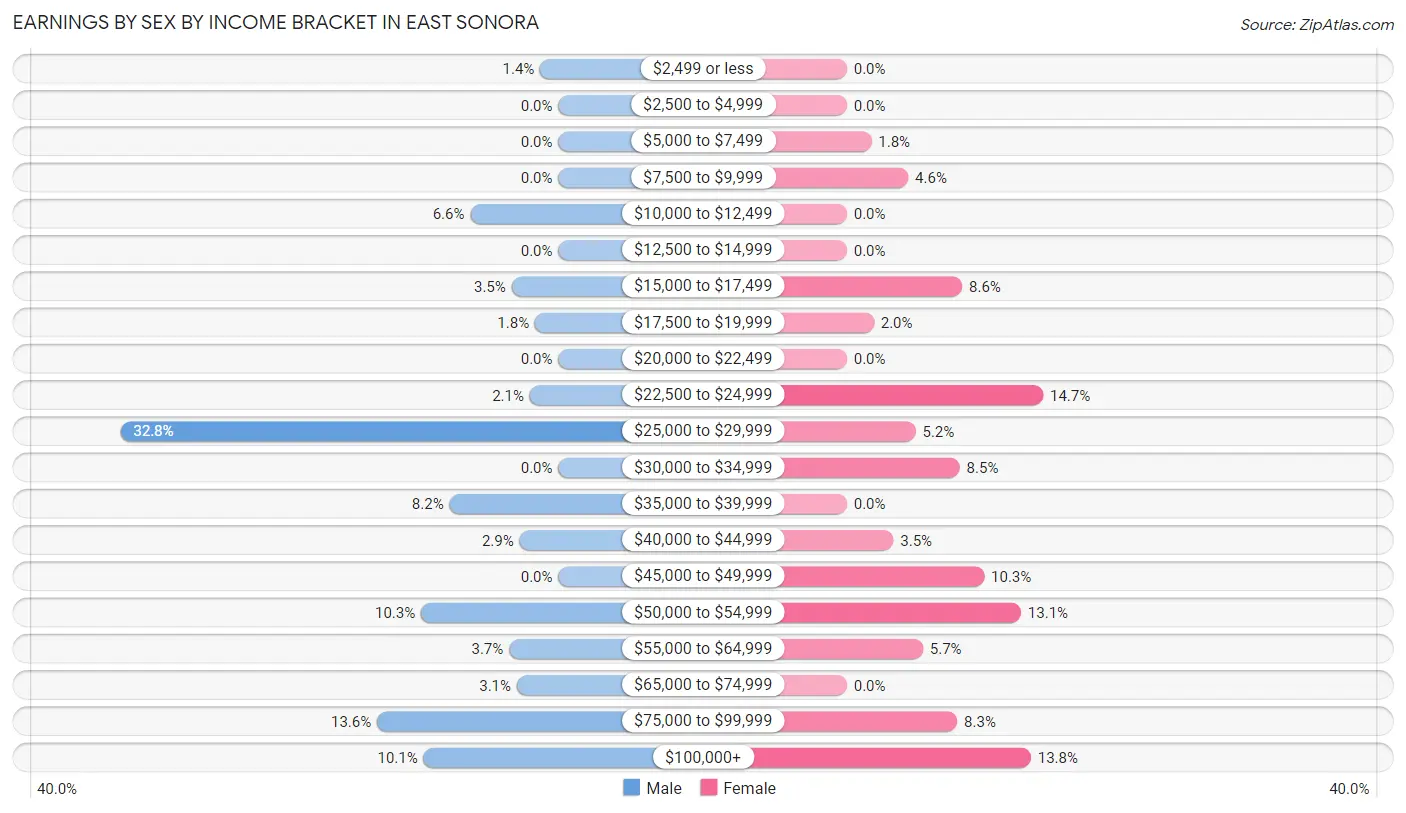
Earnings by Sex by Income Bracket in East Sonora
The most common earnings brackets in East Sonora are $25,000 to $29,999 for men (169 | 32.8%) and $22,500 to $24,999 for women (80 | 14.7%).
| Income | Male | Female |
| $2,499 or less | 7 (1.4%) | 0 (0.0%) |
| $2,500 to $4,999 | 0 (0.0%) | 0 (0.0%) |
| $5,000 to $7,499 | 0 (0.0%) | 10 (1.8%) |
| $7,500 to $9,999 | 0 (0.0%) | 25 (4.6%) |
| $10,000 to $12,499 | 34 (6.6%) | 0 (0.0%) |
| $12,500 to $14,999 | 0 (0.0%) | 0 (0.0%) |
| $15,000 to $17,499 | 18 (3.5%) | 47 (8.6%) |
| $17,500 to $19,999 | 9 (1.8%) | 11 (2.0%) |
| $20,000 to $22,499 | 0 (0.0%) | 0 (0.0%) |
| $22,500 to $24,999 | 11 (2.1%) | 80 (14.7%) |
| $25,000 to $29,999 | 169 (32.8%) | 28 (5.1%) |
| $30,000 to $34,999 | 0 (0.0%) | 46 (8.5%) |
| $35,000 to $39,999 | 42 (8.2%) | 0 (0.0%) |
| $40,000 to $44,999 | 15 (2.9%) | 19 (3.5%) |
| $45,000 to $49,999 | 0 (0.0%) | 56 (10.3%) |
| $50,000 to $54,999 | 53 (10.3%) | 71 (13.1%) |
| $55,000 to $64,999 | 19 (3.7%) | 31 (5.7%) |
| $65,000 to $74,999 | 16 (3.1%) | 0 (0.0%) |
| $75,000 to $99,999 | 70 (13.6%) | 45 (8.3%) |
| $100,000+ | 52 (10.1%) | 75 (13.8%) |
| Total | 515 (100.0%) | 544 (100.0%) |
Earnings by Sex by Educational Attainment in East Sonora
Average earnings in East Sonora are $35,565 for men and $48,638 for women, a difference of 26.9%. Men with an educational attainment of college or associate's degree enjoy the highest average annual earnings of $50,673, while those with bachelor's degree education earn the least with $26,496. Women with an educational attainment of college or associate's degree earn the most with the average annual earnings of $42,368, while those with college or associate's degree education have the smallest earnings of $42,368.

| Educational Attainment | Male Income | Female Income |
| Less than High School | - | - |
| High School Diploma | - | - |
| College or Associate's Degree | $50,673 | $42,368 |
| Bachelor's Degree | $26,496 | $0 |
| Graduate Degree | - | - |
| Total | $35,565 | $48,638 |
Family Income in East Sonora
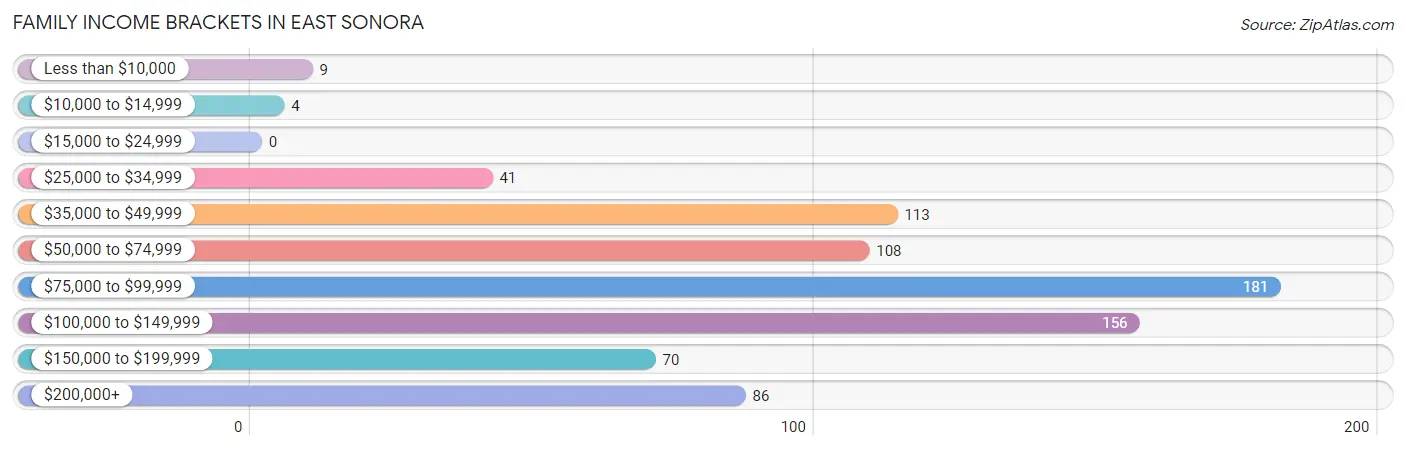
Family Income Brackets in East Sonora
According to the East Sonora family income data, there are 181 families falling into the $75,000 to $99,999 income range, which is the most common income bracket and makes up 23.6% of all families.
| Income Bracket | # Families | % Families |
| Less than $10,000 | 9 | 1.2% |
| $10,000 to $14,999 | 4 | 0.5% |
| $15,000 to $24,999 | 0 | 0.0% |
| $25,000 to $34,999 | 41 | 5.3% |
| $35,000 to $49,999 | 113 | 14.7% |
| $50,000 to $74,999 | 108 | 14.1% |
| $75,000 to $99,999 | 181 | 23.6% |
| $100,000 to $149,999 | 156 | 20.3% |
| $150,000 to $199,999 | 70 | 9.1% |
| $200,000+ | 86 | 11.2% |
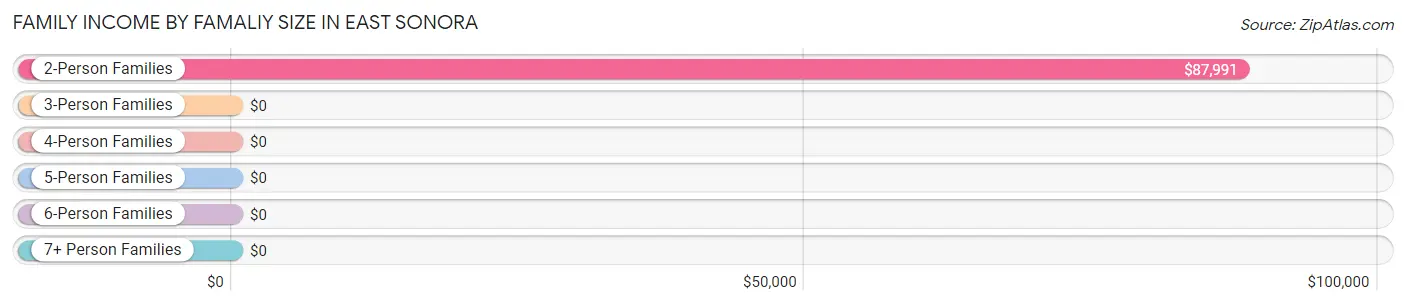
Family Income by Famaliy Size in East Sonora
2-person families (602 | 78.4%) account for the highest median family income in East Sonora with $87,991 per family, while 2-person families (602 | 78.4%) have the highest median income of $43,996 per family member.
| Income Bracket | # Families | Median Income |
| 2-Person Families | 602 (78.4%) | $87,991 |
| 3-Person Families | 29 (3.8%) | $0 |
| 4-Person Families | 137 (17.8%) | $0 |
| 5-Person Families | 0 (0.0%) | $0 |
| 6-Person Families | 0 (0.0%) | $0 |
| 7+ Person Families | 0 (0.0%) | $0 |
| Total | 768 (100.0%) | $88,462 |
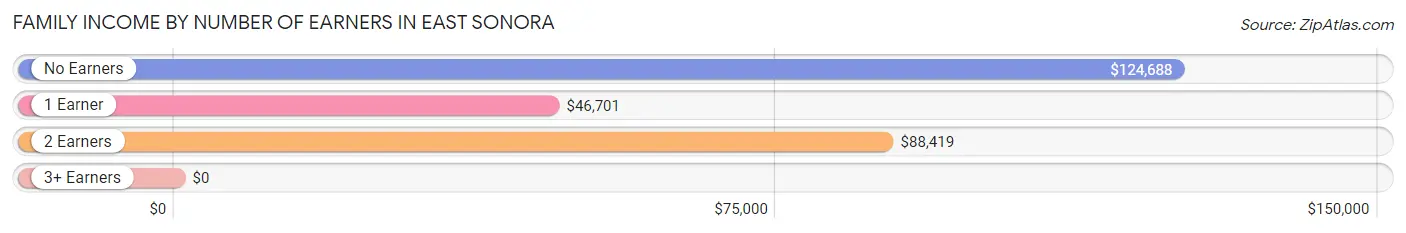
Family Income by Number of Earners in East Sonora
| Number of Earners | # Families | Median Income |
| No Earners | 215 (28.0%) | $124,688 |
| 1 Earner | 209 (27.2%) | $46,701 |
| 2 Earners | 306 (39.8%) | $88,419 |
| 3+ Earners | 38 (5.0%) | $0 |
| Total | 768 (100.0%) | $88,462 |
Household Income in East Sonora
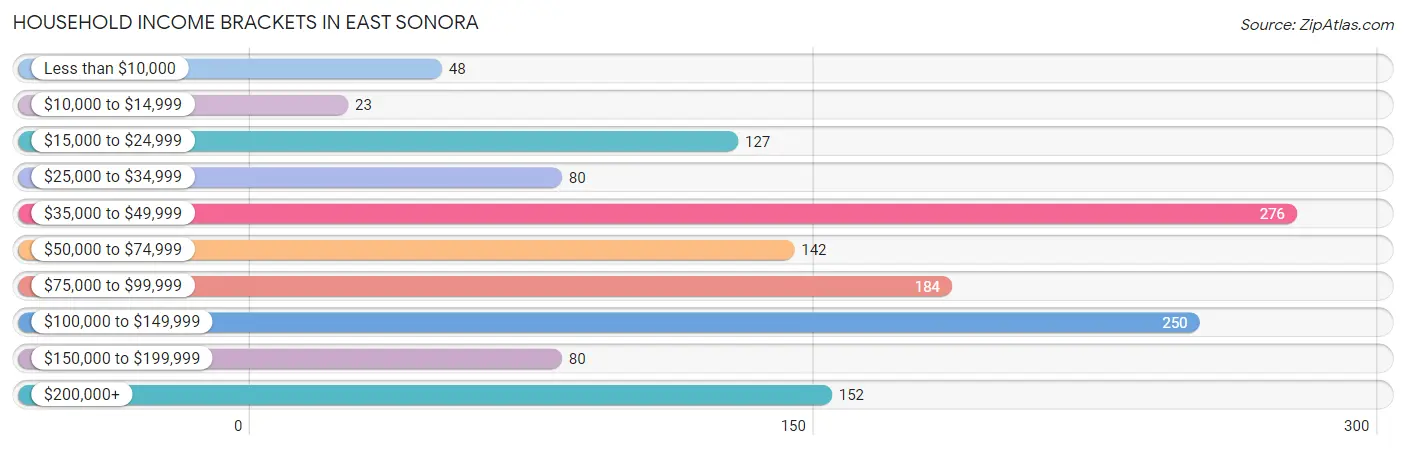
Household Income Brackets in East Sonora
With 276 households falling in the category, the $35,000 to $49,999 income range is the most frequent in East Sonora, accounting for 20.3% of all households. In contrast, only 23 households (1.7%) fall into the $10,000 to $14,999 income bracket, making it the least populous group.
| Income Bracket | # Households | % Households |
| Less than $10,000 | 48 | 3.5% |
| $10,000 to $14,999 | 23 | 1.7% |
| $15,000 to $24,999 | 127 | 9.3% |
| $25,000 to $34,999 | 80 | 5.9% |
| $35,000 to $49,999 | 276 | 20.3% |
| $50,000 to $74,999 | 142 | 10.4% |
| $75,000 to $99,999 | 184 | 13.5% |
| $100,000 to $149,999 | 250 | 18.4% |
| $150,000 to $199,999 | 80 | 5.9% |
| $200,000+ | 152 | 11.2% |
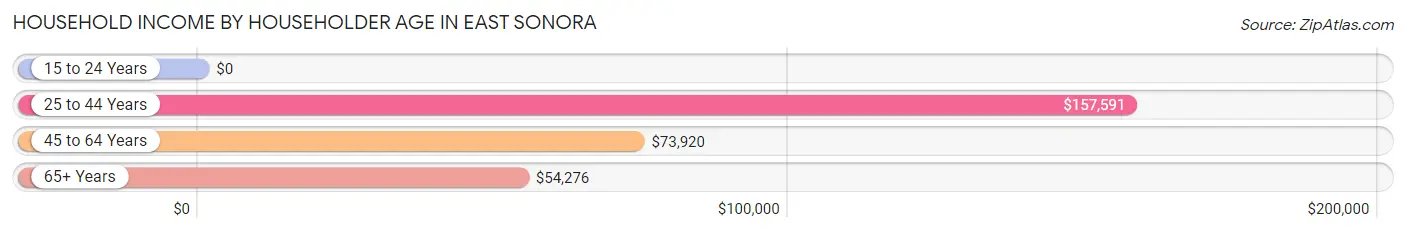
Household Income by Householder Age in East Sonora
The median household income in East Sonora is $73,466, with the highest median household income of $157,591 found in the 25 to 44 years age bracket for the primary householder. A total of 213 households (15.7%) fall into this category.
| Income Bracket | # Households | Median Income |
| 15 to 24 Years | 0 (0.0%) | $0 |
| 25 to 44 Years | 213 (15.7%) | $157,591 |
| 45 to 64 Years | 327 (24.0%) | $73,920 |
| 65+ Years | 821 (60.3%) | $54,276 |
| Total | 1,361 (100.0%) | $73,466 |
Poverty in East Sonora
Income Below Poverty by Sex and Age in East Sonora
With 3.0% poverty level for males and 5.9% for females among the residents of East Sonora, 25 to 34 year old males and 65 to 74 year old females are the most vulnerable to poverty, with 12 males (18.8%) and 36 females (12.2%) in their respective age groups living below the poverty level.
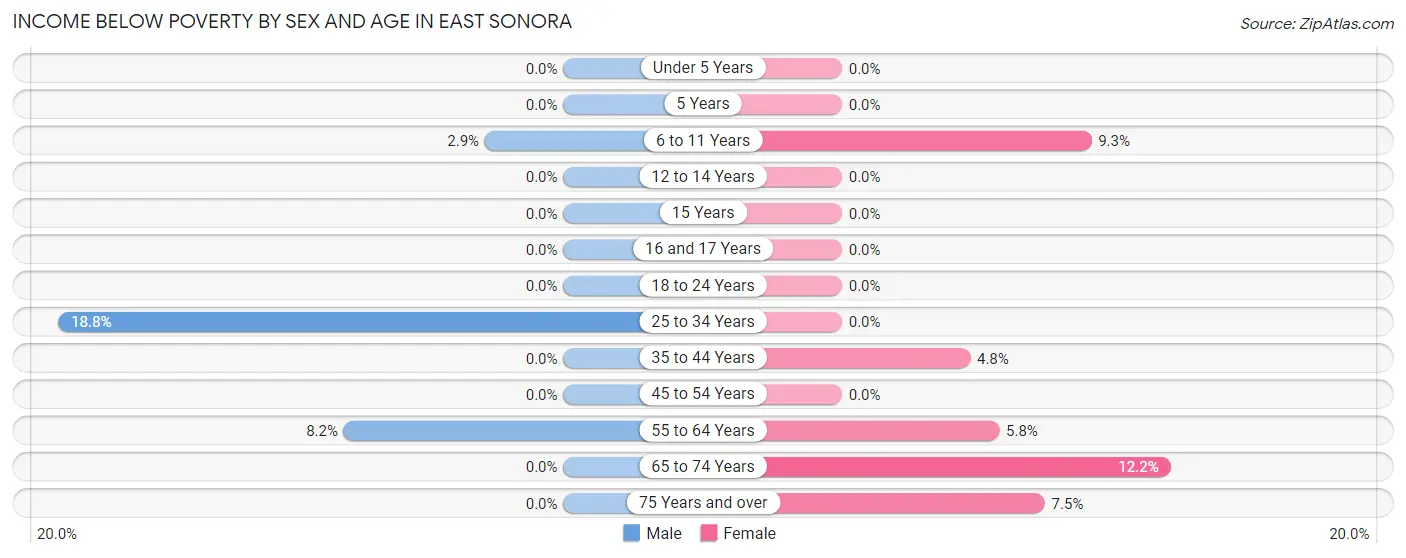
| Age Bracket | Male | Female |
| Under 5 Years | 0 (0.0%) | 0 (0.0%) |
| 5 Years | 0 (0.0%) | 0 (0.0%) |
| 6 to 11 Years | 5 (2.9%) | 5 (9.3%) |
| 12 to 14 Years | 0 (0.0%) | 0 (0.0%) |
| 15 Years | 0 (0.0%) | 0 (0.0%) |
| 16 and 17 Years | 0 (0.0%) | 0 (0.0%) |
| 18 to 24 Years | 0 (0.0%) | 0 (0.0%) |
| 25 to 34 Years | 12 (18.8%) | 0 (0.0%) |
| 35 to 44 Years | 0 (0.0%) | 4 (4.8%) |
| 45 to 54 Years | 0 (0.0%) | 0 (0.0%) |
| 55 to 64 Years | 15 (8.2%) | 9 (5.8%) |
| 65 to 74 Years | 0 (0.0%) | 36 (12.2%) |
| 75 Years and over | 0 (0.0%) | 29 (7.5%) |
| Total | 32 (3.0%) | 83 (5.9%) |
Income Above Poverty by Sex and Age in East Sonora
According to the poverty statistics in East Sonora, males aged under 5 years and females aged under 5 years are the age groups that are most secure financially, with 100.0% of males and 100.0% of females in these age groups living above the poverty line.
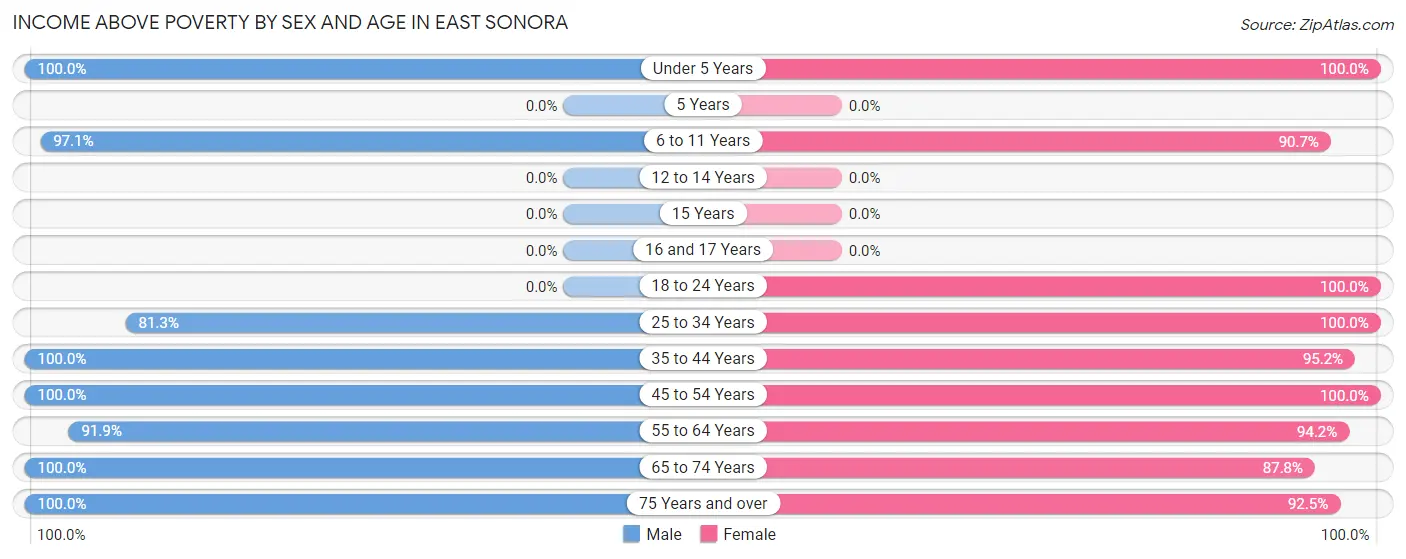
| Age Bracket | Male | Female |
| Under 5 Years | 58 (100.0%) | 7 (100.0%) |
| 5 Years | 0 (0.0%) | 0 (0.0%) |
| 6 to 11 Years | 167 (97.1%) | 49 (90.7%) |
| 12 to 14 Years | 0 (0.0%) | 0 (0.0%) |
| 15 Years | 0 (0.0%) | 0 (0.0%) |
| 16 and 17 Years | 0 (0.0%) | 0 (0.0%) |
| 18 to 24 Years | 0 (0.0%) | 39 (100.0%) |
| 25 to 34 Years | 52 (81.2%) | 130 (100.0%) |
| 35 to 44 Years | 99 (100.0%) | 80 (95.2%) |
| 45 to 54 Years | 50 (100.0%) | 271 (100.0%) |
| 55 to 64 Years | 169 (91.8%) | 145 (94.2%) |
| 65 to 74 Years | 246 (100.0%) | 259 (87.8%) |
| 75 Years and over | 190 (100.0%) | 356 (92.5%) |
| Total | 1,031 (97.0%) | 1,336 (94.2%) |
Income Below Poverty Among Married-Couple Families in East Sonora
The poverty statistics for married-couple families in East Sonora show that 1.3% or 9 of the total 698 families live below the poverty line. Families with no children have the highest poverty rate of 1.5%, comprising of 9 families. On the other hand, families with 1 or 2 children have the lowest poverty rate of 0.0%, which includes 0 families.
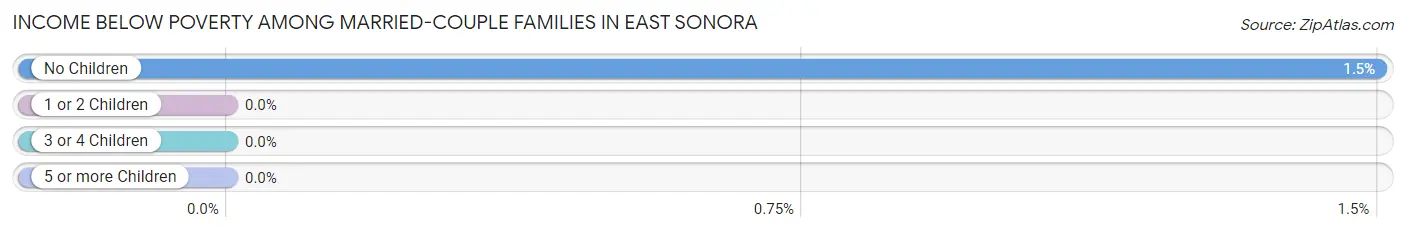
| Children | Above Poverty | Below Poverty |
| No Children | 590 (98.5%) | 9 (1.5%) |
| 1 or 2 Children | 99 (100.0%) | 0 (0.0%) |
| 3 or 4 Children | 0 (0.0%) | 0 (0.0%) |
| 5 or more Children | 0 (0.0%) | 0 (0.0%) |
| Total | 689 (98.7%) | 9 (1.3%) |
Income Below Poverty Among Single-Parent Households in East Sonora
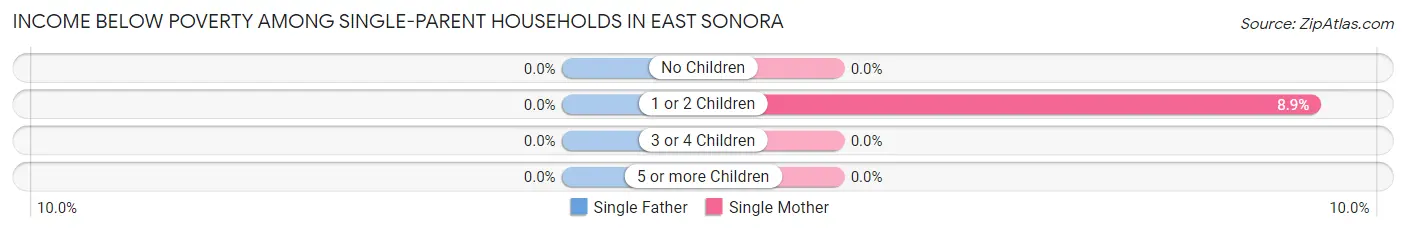
| Children | Single Father | Single Mother |
| No Children | 0 (0.0%) | 0 (0.0%) |
| 1 or 2 Children | 0 (0.0%) | 4 (8.9%) |
| 3 or 4 Children | 0 (0.0%) | 0 (0.0%) |
| 5 or more Children | 0 (0.0%) | 0 (0.0%) |
| Total | 0 (0.0%) | 4 (5.7%) |
Income Below Poverty Among Married-Couple vs Single-Parent Households in East Sonora
The poverty data for East Sonora shows that 9 of the married-couple family households (1.3%) and 4 of the single-parent households (5.7%) are living below the poverty level. Within the married-couple family households, those with no children have the highest poverty rate, with 9 households (1.5%) falling below the poverty line. Among the single-parent households, those with 1 or 2 children have the highest poverty rate, with 4 household (8.9%) living below poverty.
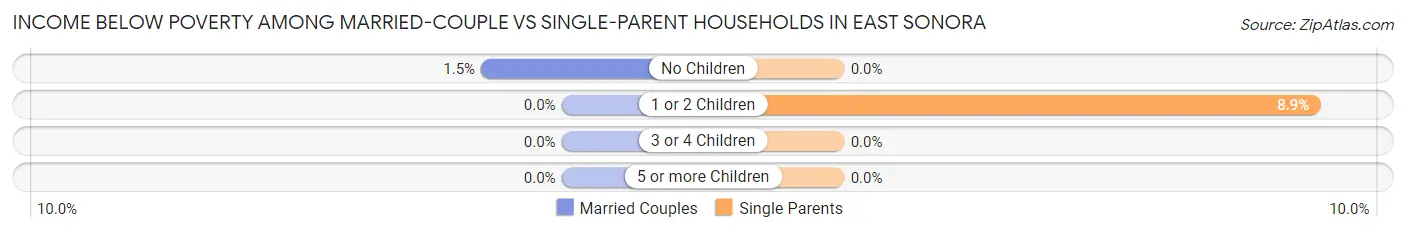
| Children | Married-Couple Families | Single-Parent Households |
| No Children | 9 (1.5%) | 0 (0.0%) |
| 1 or 2 Children | 0 (0.0%) | 4 (8.9%) |
| 3 or 4 Children | 0 (0.0%) | 0 (0.0%) |
| 5 or more Children | 0 (0.0%) | 0 (0.0%) |
| Total | 9 (1.3%) | 4 (5.7%) |
Race in East Sonora
The most populous races in East Sonora are White / Caucasian (2,365 | 88.8%), Two or more Races (251 | 9.4%), and Hispanic or Latino (157 | 5.9%).
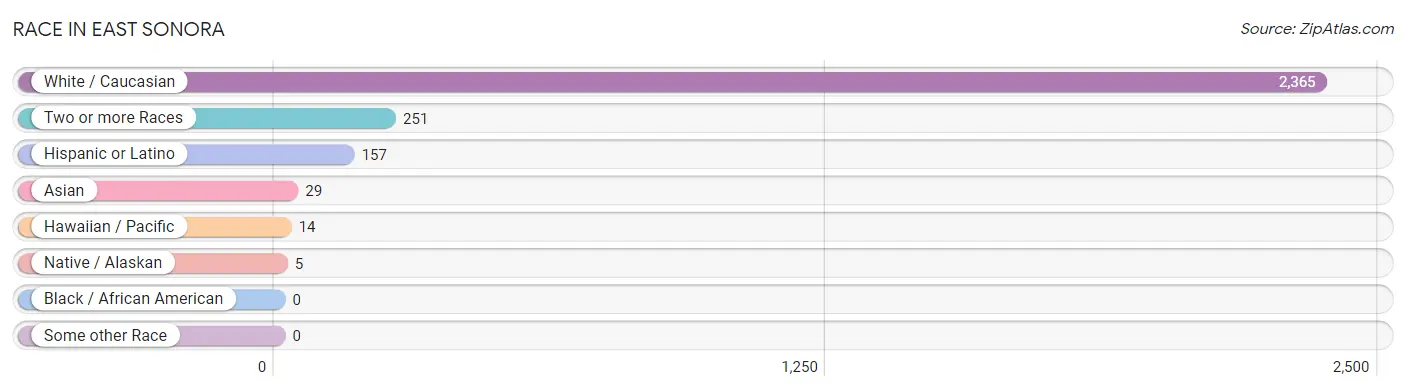
| Race | # Population | % Population |
| Asian | 29 | 1.1% |
| Black / African American | 0 | 0.0% |
| Hawaiian / Pacific | 14 | 0.5% |
| Hispanic or Latino | 157 | 5.9% |
| Native / Alaskan | 5 | 0.2% |
| White / Caucasian | 2,365 | 88.8% |
| Two or more Races | 251 | 9.4% |
| Some other Race | 0 | 0.0% |
| Total | 2,664 | 100.0% |
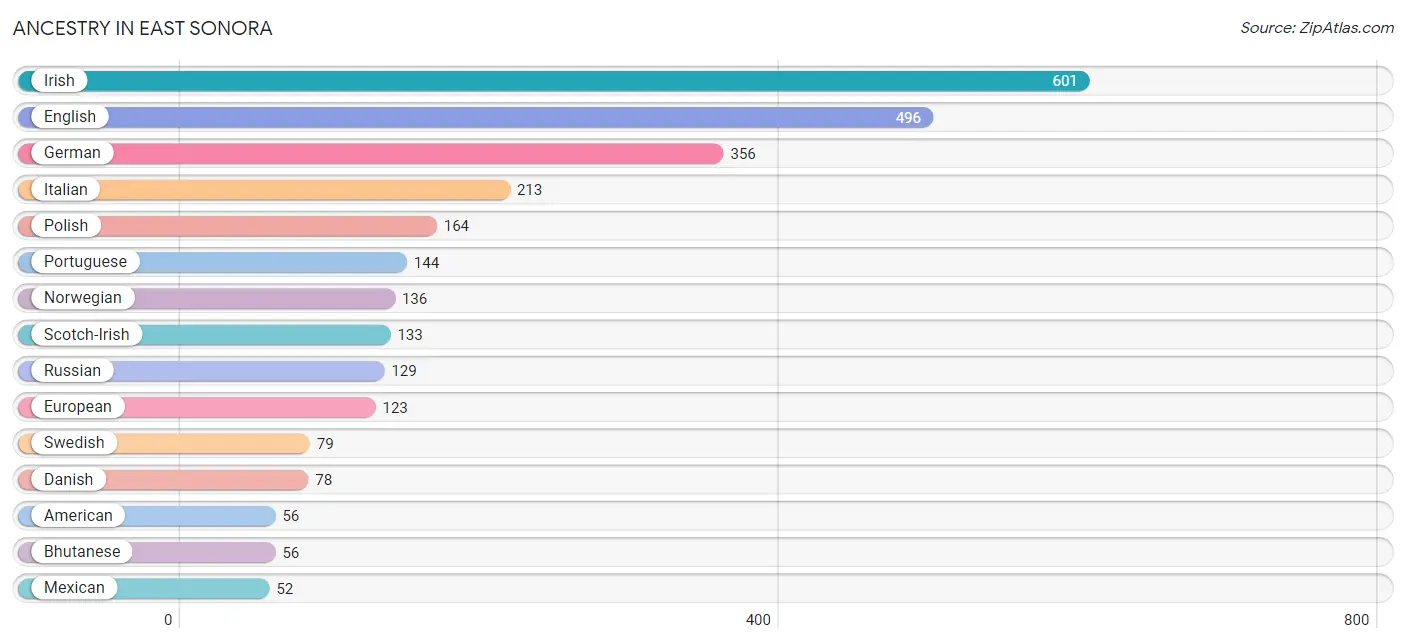
Ancestry in East Sonora
The most populous ancestries reported in East Sonora are Irish (601 | 22.6%), English (496 | 18.6%), German (356 | 13.4%), Italian (213 | 8.0%), and Polish (164 | 6.2%), together accounting for 68.7% of all East Sonora residents.
| Ancestry | # Population | % Population |
| American | 56 | 2.1% |
| Austrian | 32 | 1.2% |
| Basque | 5 | 0.2% |
| Bhutanese | 56 | 2.1% |
| British | 15 | 0.6% |
| Canadian | 5 | 0.2% |
| Central American | 19 | 0.7% |
| Cherokee | 40 | 1.5% |
| Choctaw | 17 | 0.6% |
| Czech | 18 | 0.7% |
| Czechoslovakian | 8 | 0.3% |
| Danish | 78 | 2.9% |
| Dutch | 20 | 0.7% |
| English | 496 | 18.6% |
| European | 123 | 4.6% |
| French | 32 | 1.2% |
| German | 356 | 13.4% |
| Indian (Asian) | 10 | 0.4% |
| Irish | 601 | 22.6% |
| Italian | 213 | 8.0% |
| Mexican | 52 | 1.9% |
| Native Hawaiian | 19 | 0.7% |
| Nigerian | 5 | 0.2% |
| Norwegian | 136 | 5.1% |
| Pennsylvania German | 6 | 0.2% |
| Polish | 164 | 6.2% |
| Portuguese | 144 | 5.4% |
| Puerto Rican | 39 | 1.5% |
| Russian | 129 | 4.8% |
| Salvadoran | 19 | 0.7% |
| Samoan | 3 | 0.1% |
| Scotch-Irish | 133 | 5.0% |
| Scottish | 10 | 0.4% |
| Spaniard | 29 | 1.1% |
| Subsaharan African | 5 | 0.2% |
| Swedish | 79 | 3.0% |
| Swiss | 15 | 0.6% |
| Tongan | 14 | 0.5% |
| Welsh | 6 | 0.2% | View All 39 Rows |
Immigrants in East Sonora
The most numerous immigrant groups reported in East Sonora came from Europe (104 | 3.9%), Northern Europe (72 | 2.7%), England (41 | 1.5%), Eastern Europe (17 | 0.6%), and Poland (17 | 0.6%), together accounting for 9.4% of all East Sonora residents.
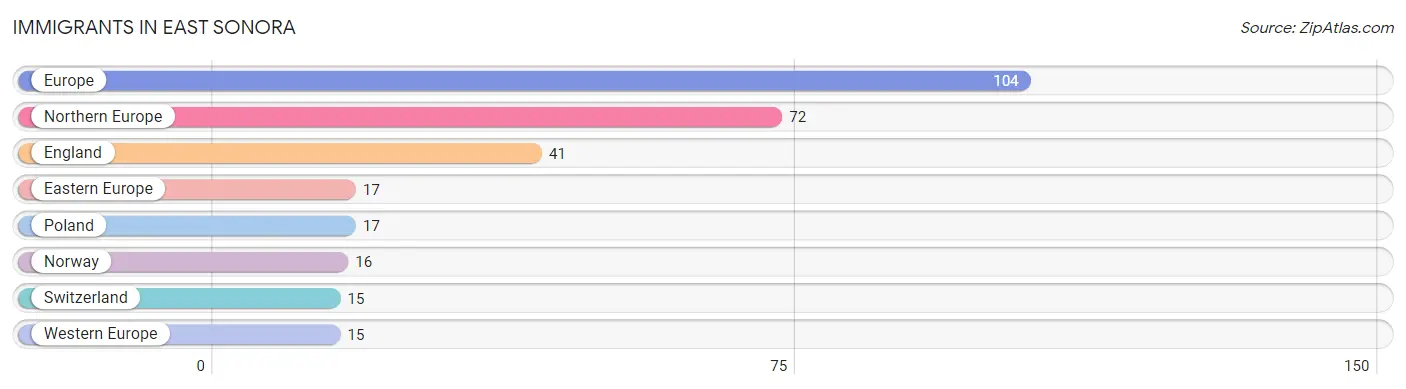
| Immigration Origin | # Population | % Population |
| Eastern Europe | 17 | 0.6% |
| England | 41 | 1.5% |
| Europe | 104 | 3.9% |
| Northern Europe | 72 | 2.7% |
| Norway | 16 | 0.6% |
| Poland | 17 | 0.6% |
| Switzerland | 15 | 0.6% |
| Western Europe | 15 | 0.6% | View All 8 Rows |
Sex and Age in East Sonora
Sex and Age in East Sonora
The most populous age groups in East Sonora are 65 to 69 Years (194 | 17.3%) for men and 85 Years and over (226 | 14.6%) for women.
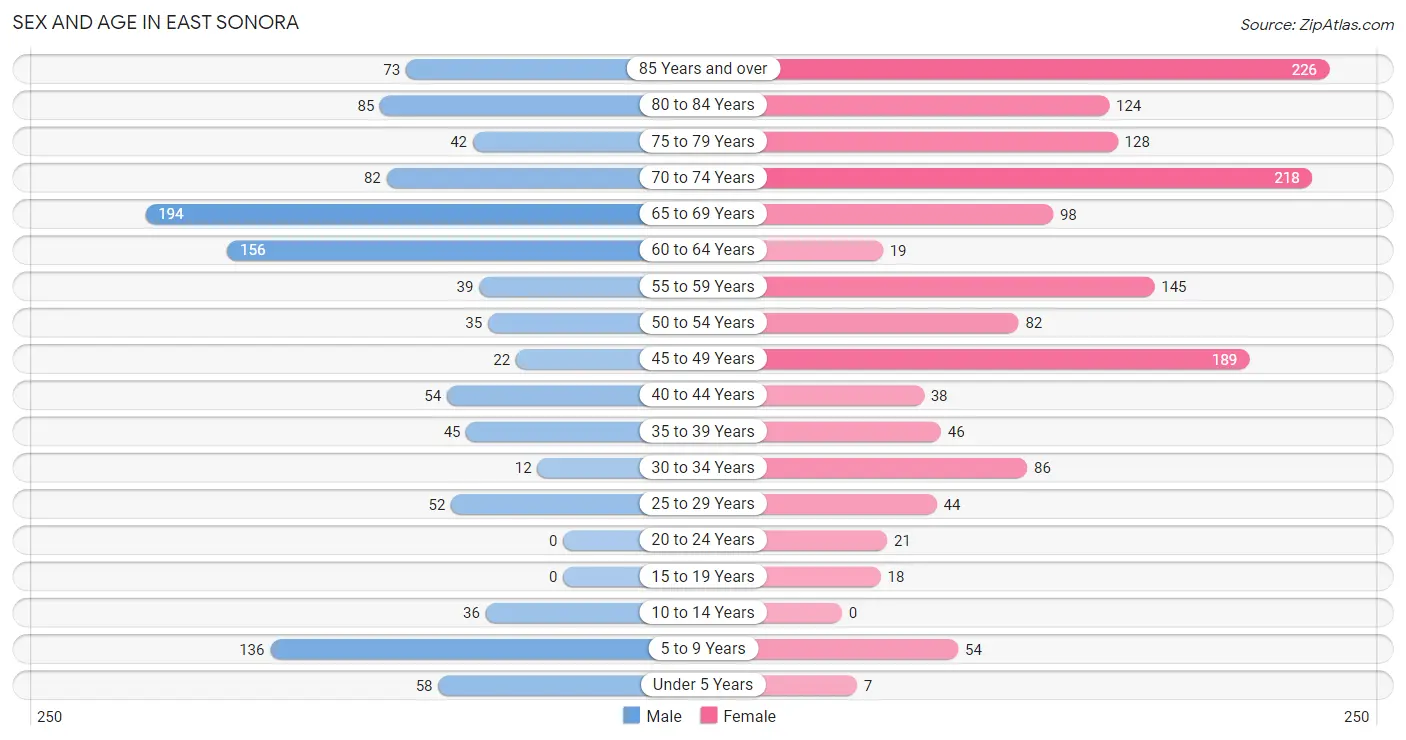
| Age Bracket | Male | Female |
| Under 5 Years | 58 (5.2%) | 7 (0.4%) |
| 5 to 9 Years | 136 (12.1%) | 54 (3.5%) |
| 10 to 14 Years | 36 (3.2%) | 0 (0.0%) |
| 15 to 19 Years | 0 (0.0%) | 18 (1.2%) |
| 20 to 24 Years | 0 (0.0%) | 21 (1.4%) |
| 25 to 29 Years | 52 (4.6%) | 44 (2.9%) |
| 30 to 34 Years | 12 (1.1%) | 86 (5.6%) |
| 35 to 39 Years | 45 (4.0%) | 46 (3.0%) |
| 40 to 44 Years | 54 (4.8%) | 38 (2.5%) |
| 45 to 49 Years | 22 (2.0%) | 189 (12.2%) |
| 50 to 54 Years | 35 (3.1%) | 82 (5.3%) |
| 55 to 59 Years | 39 (3.5%) | 145 (9.4%) |
| 60 to 64 Years | 156 (13.9%) | 19 (1.2%) |
| 65 to 69 Years | 194 (17.3%) | 98 (6.4%) |
| 70 to 74 Years | 82 (7.3%) | 218 (14.1%) |
| 75 to 79 Years | 42 (3.7%) | 128 (8.3%) |
| 80 to 84 Years | 85 (7.6%) | 124 (8.0%) |
| 85 Years and over | 73 (6.5%) | 226 (14.6%) |
| Total | 1,121 (100.0%) | 1,543 (100.0%) |
Families and Households in East Sonora
Median Family Size in East Sonora
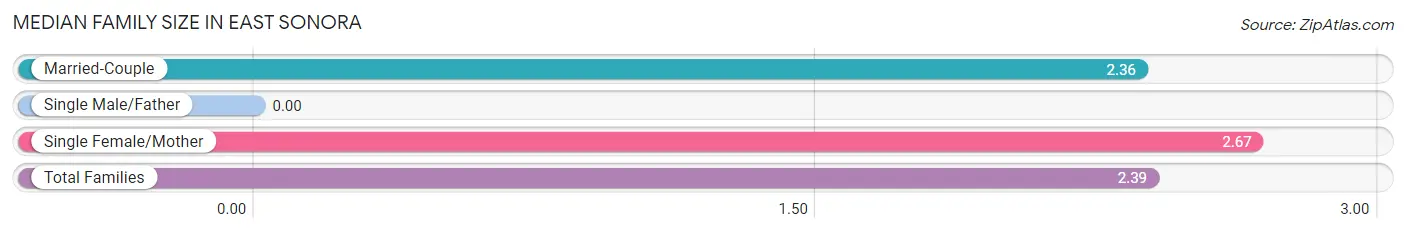
| Family Type | # Families | Family Size |
| Married-Couple | 698 (90.9%) | 2.36 |
| Single Male/Father | 0 (0.0%) | - |
| Single Female/Mother | 70 (9.1%) | 2.67 |
| Total Families | 768 (100.0%) | 2.39 |
Median Household Size in East Sonora
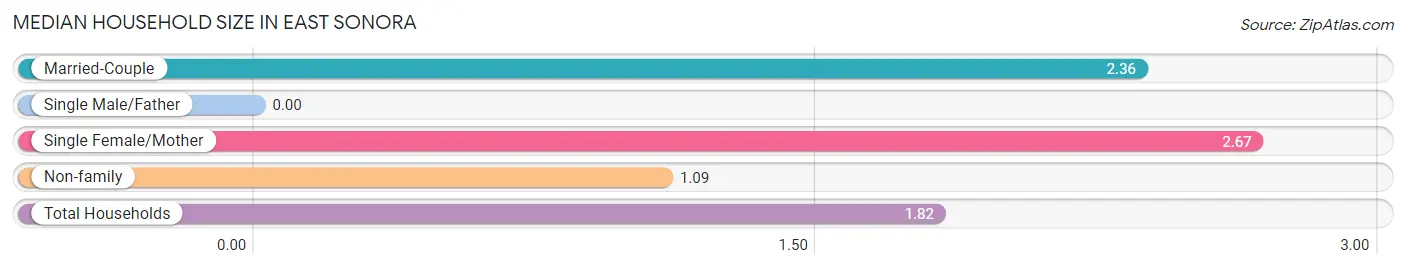
| Household Type | # Households | Household Size |
| Married-Couple | 698 (51.3%) | 2.36 |
| Single Male/Father | 0 (0.0%) | - |
| Single Female/Mother | 70 (5.1%) | 2.67 |
| Non-family | 593 (43.6%) | 1.09 |
| Total Households | 1,361 (100.0%) | 1.82 |
Household Size by Marriage Status in East Sonora
Out of a total of 1,361 households in East Sonora, 768 (56.4%) are family households, while 593 (43.6%) are nonfamily households. The most numerous type of family households are 2-person households, comprising 602, and the most common type of nonfamily households are 1-person households, comprising 539.
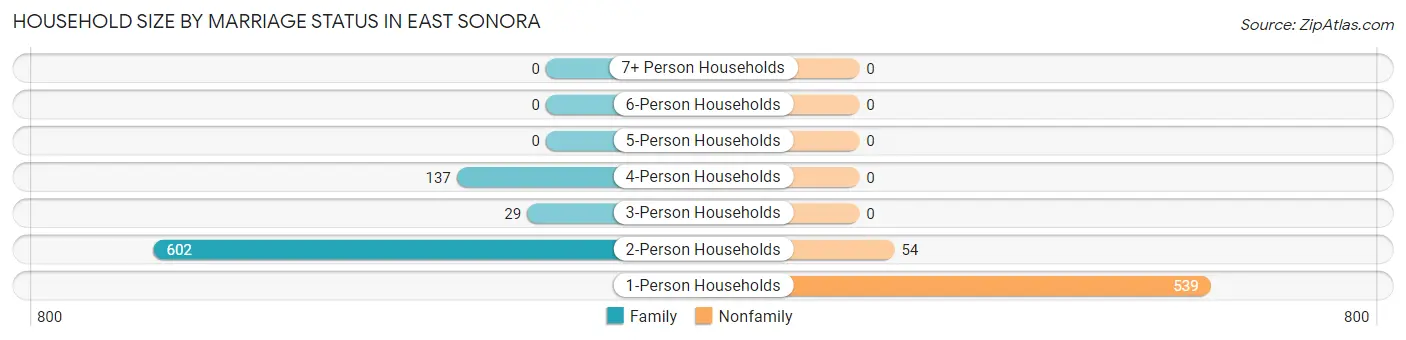
| Household Size | Family Households | Nonfamily Households |
| 1-Person Households | - | 539 (39.6%) |
| 2-Person Households | 602 (44.2%) | 54 (4.0%) |
| 3-Person Households | 29 (2.1%) | 0 (0.0%) |
| 4-Person Households | 137 (10.1%) | 0 (0.0%) |
| 5-Person Households | 0 (0.0%) | 0 (0.0%) |
| 6-Person Households | 0 (0.0%) | 0 (0.0%) |
| 7+ Person Households | 0 (0.0%) | 0 (0.0%) |
| Total | 768 (56.4%) | 593 (43.6%) |
Female Fertility in East Sonora
Fertility by Age in East Sonora
Average fertility rate in East Sonora is 129.0 births per 1,000 women. Women in the age bracket of 20 to 34 years have the highest fertility rate with 377.0 births per 1,000 women. Women in the age bracket of 20 to 34 years acount for 100.0% of all women with births.
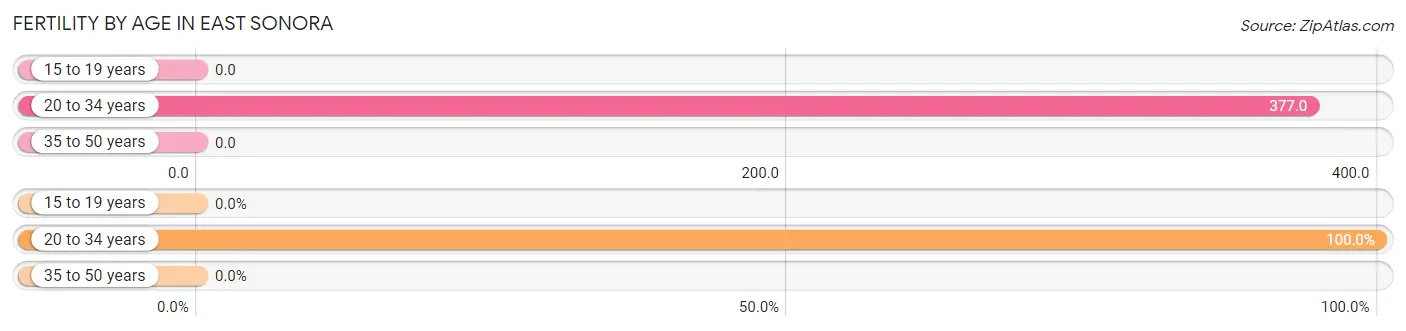
| Age Bracket | Women with Births | Births / 1,000 Women |
| 15 to 19 years | 0 (0.0%) | 0.0 |
| 20 to 34 years | 57 (100.0%) | 377.0 |
| 35 to 50 years | 0 (0.0%) | 0.0 |
| Total | 57 (100.0%) | 129.0 |
Fertility by Age by Marriage Status in East Sonora
56.1% of women with births (57) in East Sonora are married. The highest percentage of unmarried women with births falls into 20 to 34 years age bracket with 43.9% of them unmarried at the time of birth, while the lowest percentage of unmarried women with births belong to 20 to 34 years age bracket with 43.9% of them unmarried.
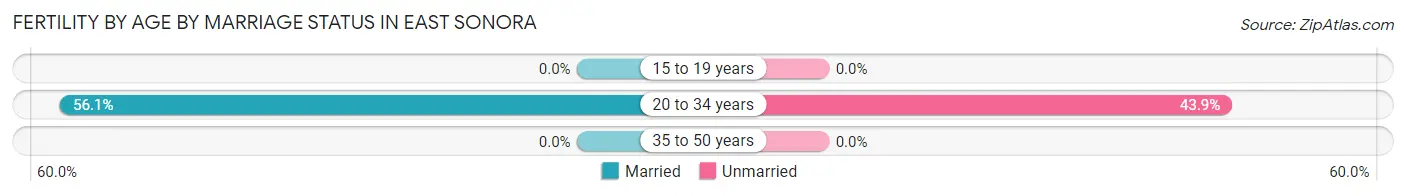
| Age Bracket | Married | Unmarried |
| 15 to 19 years | 0 (0.0%) | 0 (0.0%) |
| 20 to 34 years | 32 (56.1%) | 25 (43.9%) |
| 35 to 50 years | 0 (0.0%) | 0 (0.0%) |
| Total | 32 (56.1%) | 25 (43.9%) |
Fertility by Education in East Sonora
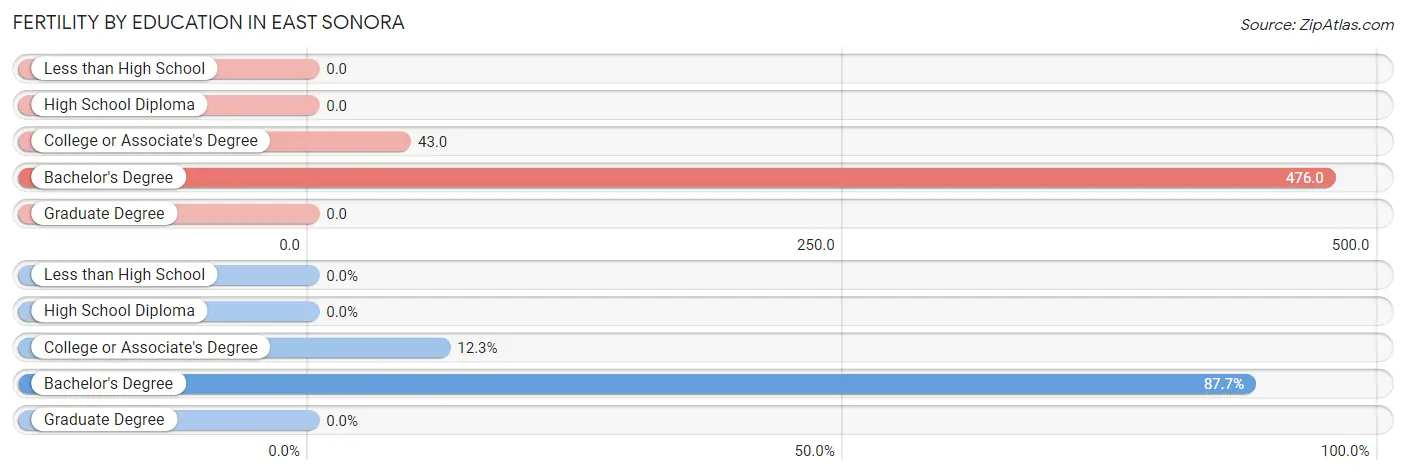
| Educational Attainment | Women with Births | Births / 1,000 Women |
| Less than High School | 0 (0.0%) | 0.0 |
| High School Diploma | 0 (0.0%) | 0.0 |
| College or Associate's Degree | 7 (12.3%) | 43.0 |
| Bachelor's Degree | 50 (87.7%) | 476.0 |
| Graduate Degree | 0 (0.0%) | 0.0 |
| Total | 57 (100.0%) | 129.0 |
Fertility by Education by Marriage Status in East Sonora
43.9% of women with births in East Sonora are unmarried. Women with the educational attainment of college or associate's degree are most likely to be married with 100.0% of them married at childbirth, while women with the educational attainment of bachelor's degree are least likely to be married with 50.0% of them unmarried at childbirth.
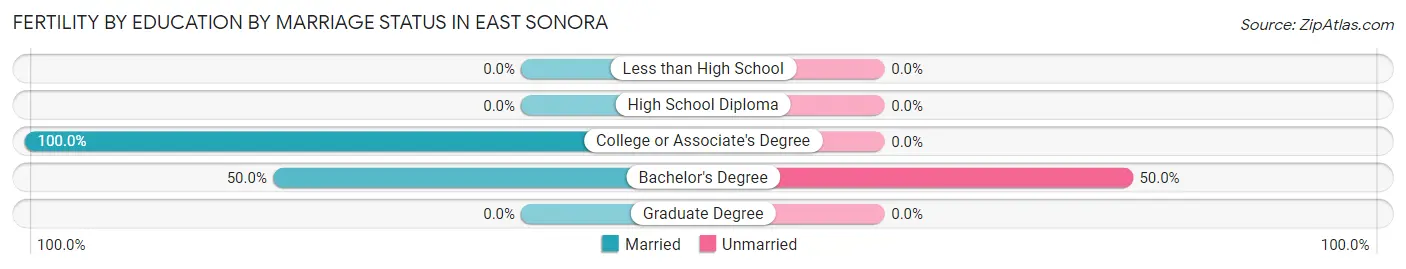
| Educational Attainment | Married | Unmarried |
| Less than High School | 0 (0.0%) | 0 (0.0%) |
| High School Diploma | 0 (0.0%) | 0 (0.0%) |
| College or Associate's Degree | 7 (100.0%) | 0 (0.0%) |
| Bachelor's Degree | 25 (50.0%) | 25 (50.0%) |
| Graduate Degree | 0 (0.0%) | 0 (0.0%) |
| Total | 32 (56.1%) | 25 (43.9%) |
Employment Characteristics in East Sonora
Employment by Class of Employer in East Sonora
Among the 845 employed individuals in East Sonora, private company employees (295 | 34.9%), local government employees (211 | 25.0%), and federal government employees (125 | 14.8%) make up the most common classes of employment.
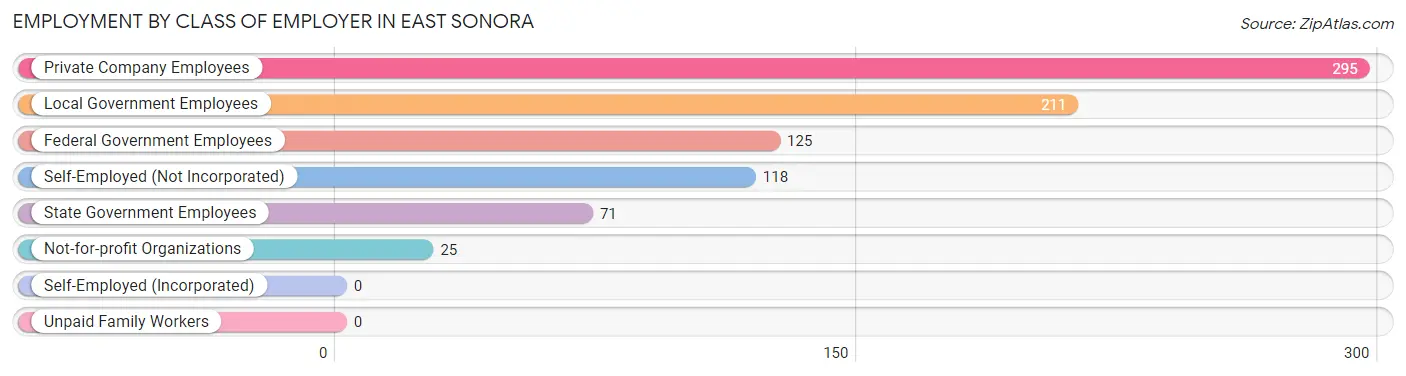
| Employer Class | # Employees | % Employees |
| Private Company Employees | 295 | 34.9% |
| Self-Employed (Incorporated) | 0 | 0.0% |
| Self-Employed (Not Incorporated) | 118 | 14.0% |
| Not-for-profit Organizations | 25 | 3.0% |
| Local Government Employees | 211 | 25.0% |
| State Government Employees | 71 | 8.4% |
| Federal Government Employees | 125 | 14.8% |
| Unpaid Family Workers | 0 | 0.0% |
| Total | 845 | 100.0% |
Employment Status by Age in East Sonora
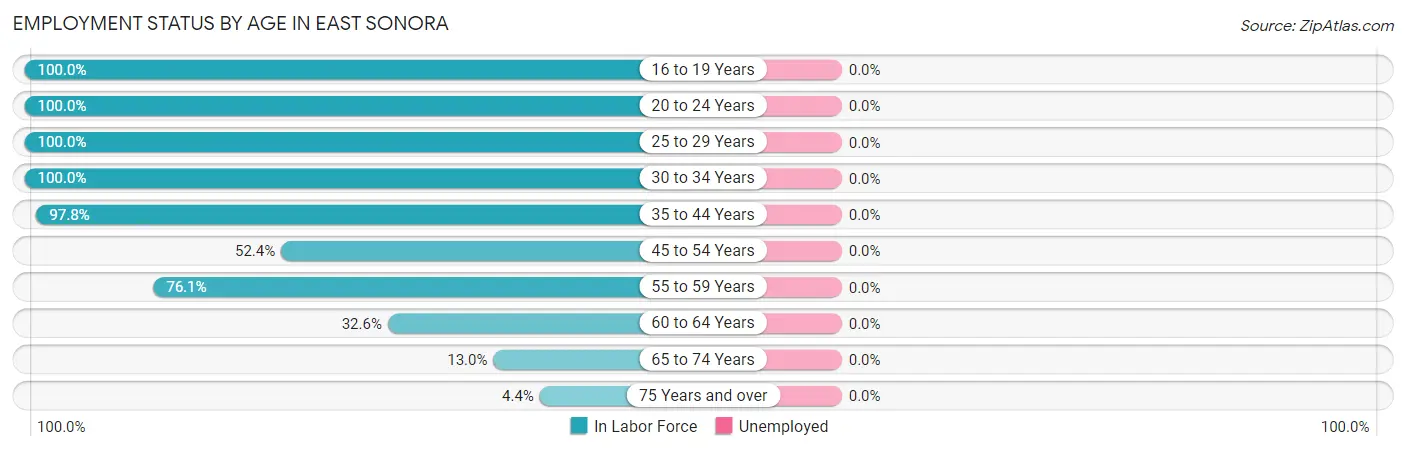
| Age Bracket | In Labor Force | Unemployed |
| 16 to 19 Years | 18 (100.0%) | 0 (0.0%) |
| 20 to 24 Years | 21 (100.0%) | 0 (0.0%) |
| 25 to 29 Years | 96 (100.0%) | 0 (0.0%) |
| 30 to 34 Years | 98 (100.0%) | 0 (0.0%) |
| 35 to 44 Years | 179 (97.8%) | 0 (0.0%) |
| 45 to 54 Years | 172 (52.4%) | 0 (0.0%) |
| 55 to 59 Years | 140 (76.1%) | 0 (0.0%) |
| 60 to 64 Years | 57 (32.6%) | 0 (0.0%) |
| 65 to 74 Years | 77 (13.0%) | 0 (0.0%) |
| 75 Years and over | 30 (4.4%) | 0 (0.0%) |
| Total | 888 (37.4%) | 0 (0.0%) |
Employment Status by Educational Attainment in East Sonora
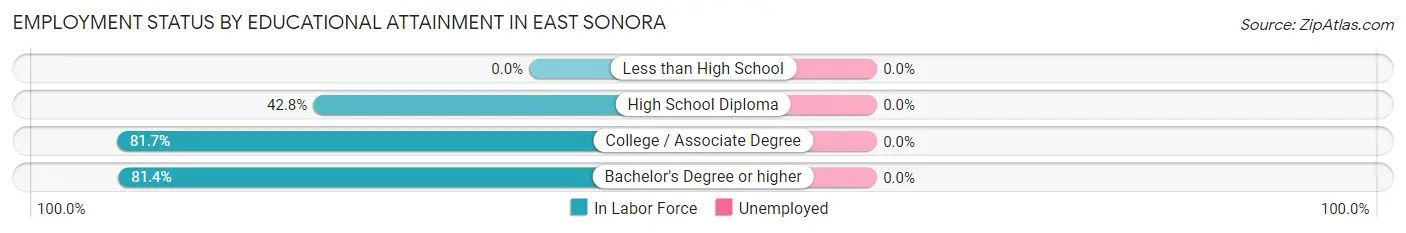
| Educational Attainment | In Labor Force | Unemployed |
| Less than High School | 0 (0.0%) | 0 (0.0%) |
| High School Diploma | 92 (42.8%) | 0 (0.0%) |
| College / Associate Degree | 388 (81.7%) | 0 (0.0%) |
| Bachelor's Degree or higher | 262 (81.4%) | 0 (0.0%) |
| Total | 742 (69.7%) | 0 (0.0%) |
Employment Occupations by Sex in East Sonora
Management, Business, Science and Arts Occupations
The most common Management, Business, Science and Arts occupations in East Sonora are Computers, Engineering & Science (117 | 13.2%), Community & Social Service (112 | 12.6%), Computers & Mathematics (71 | 8.0%), Education Instruction & Library (62 | 7.0%), and Business & Financial (55 | 6.2%).
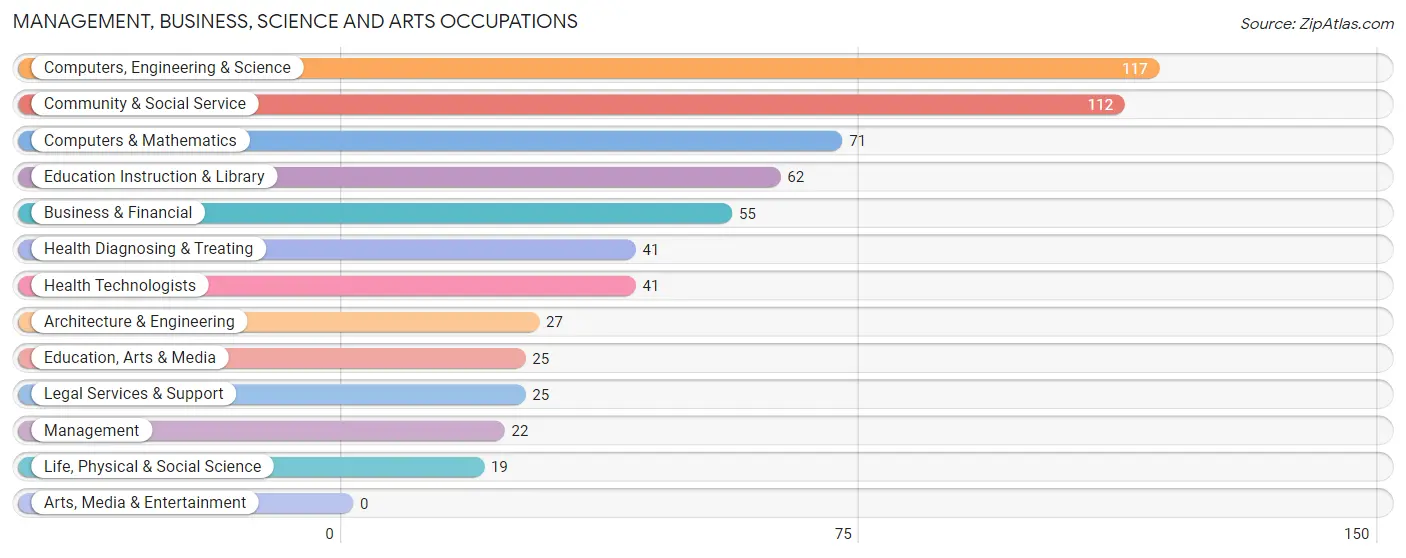
Management, Business, Science and Arts Occupations by Sex
Within the Management, Business, Science and Arts occupations in East Sonora, the most male-oriented occupations are Management (100.0%), Architecture & Engineering (100.0%), and Life, Physical & Social Science (100.0%), while the most female-oriented occupations are Business & Financial (100.0%), Education, Arts & Media (100.0%), and Legal Services & Support (100.0%).
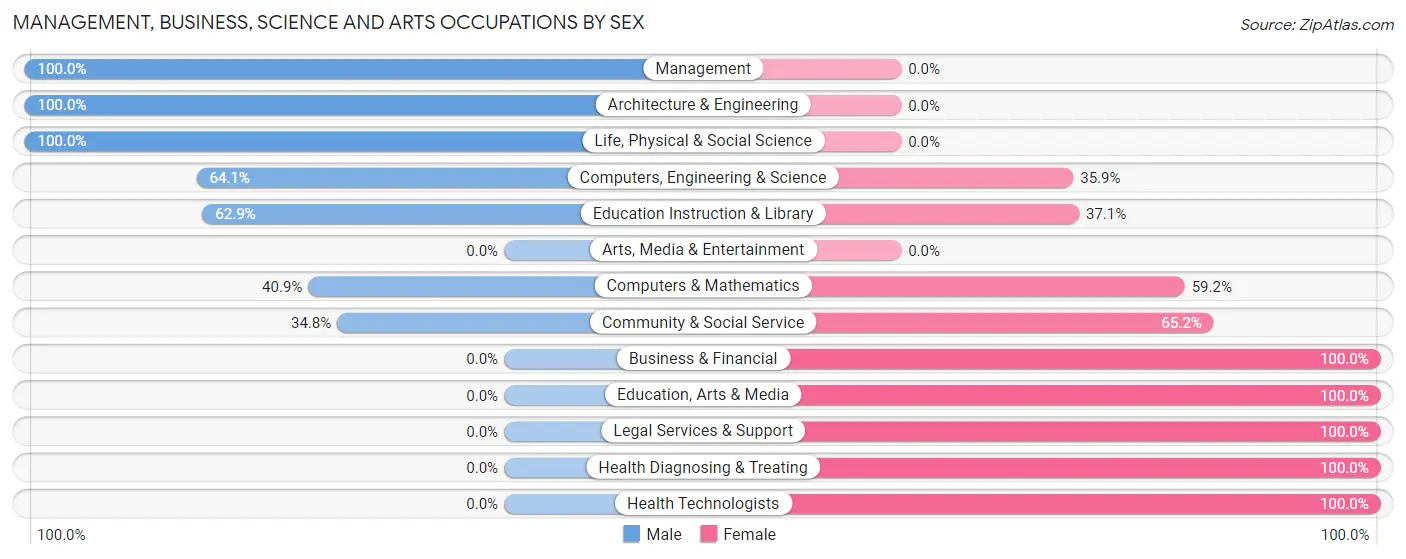
| Occupation | Male | Female |
| Management | 22 (100.0%) | 0 (0.0%) |
| Business & Financial | 0 (0.0%) | 55 (100.0%) |
| Computers, Engineering & Science | 75 (64.1%) | 42 (35.9%) |
| Computers & Mathematics | 29 (40.8%) | 42 (59.2%) |
| Architecture & Engineering | 27 (100.0%) | 0 (0.0%) |
| Life, Physical & Social Science | 19 (100.0%) | 0 (0.0%) |
| Community & Social Service | 39 (34.8%) | 73 (65.2%) |
| Education, Arts & Media | 0 (0.0%) | 25 (100.0%) |
| Legal Services & Support | 0 (0.0%) | 25 (100.0%) |
| Education Instruction & Library | 39 (62.9%) | 23 (37.1%) |
| Arts, Media & Entertainment | 0 (0.0%) | 0 (0.0%) |
| Health Diagnosing & Treating | 0 (0.0%) | 41 (100.0%) |
| Health Technologists | 0 (0.0%) | 41 (100.0%) |
| Total (Category) | 136 (39.2%) | 211 (60.8%) |
| Total (Overall) | 344 (38.7%) | 544 (61.3%) |
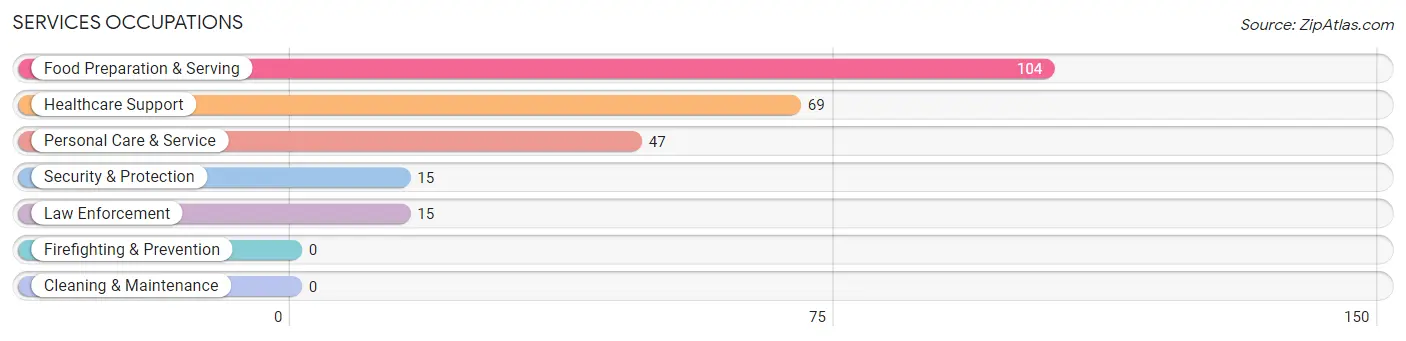
Services Occupations
The most common Services occupations in East Sonora are Food Preparation & Serving (104 | 11.7%), Healthcare Support (69 | 7.8%), Personal Care & Service (47 | 5.3%), Security & Protection (15 | 1.7%), and Law Enforcement (15 | 1.7%).
Services Occupations by Sex
Within the Services occupations in East Sonora, the most male-oriented occupations are Security & Protection (100.0%), Law Enforcement (100.0%), and Food Preparation & Serving (82.7%), while the most female-oriented occupations are Healthcare Support (100.0%), Personal Care & Service (100.0%), and Food Preparation & Serving (17.3%).
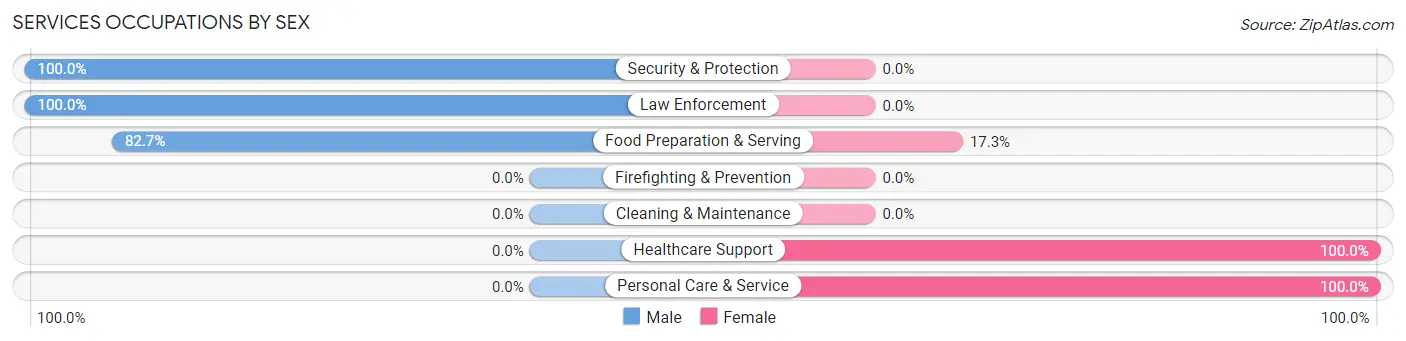
| Occupation | Male | Female |
| Healthcare Support | 0 (0.0%) | 69 (100.0%) |
| Security & Protection | 15 (100.0%) | 0 (0.0%) |
| Firefighting & Prevention | 0 (0.0%) | 0 (0.0%) |
| Law Enforcement | 15 (100.0%) | 0 (0.0%) |
| Food Preparation & Serving | 86 (82.7%) | 18 (17.3%) |
| Cleaning & Maintenance | 0 (0.0%) | 0 (0.0%) |
| Personal Care & Service | 0 (0.0%) | 47 (100.0%) |
| Total (Category) | 101 (43.0%) | 134 (57.0%) |
| Total (Overall) | 344 (38.7%) | 544 (61.3%) |
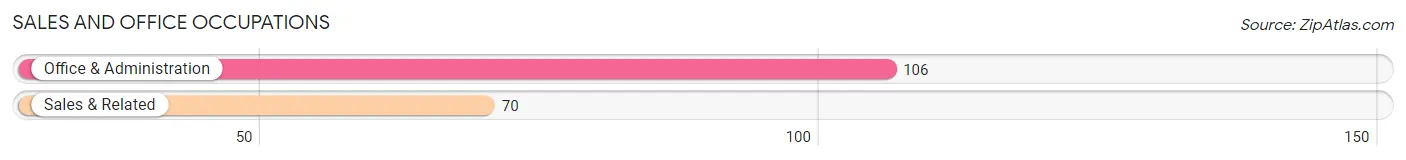
Sales and Office Occupations
The most common Sales and Office occupations in East Sonora are Office & Administration (106 | 11.9%), and Sales & Related (70 | 7.9%).
Sales and Office Occupations by Sex
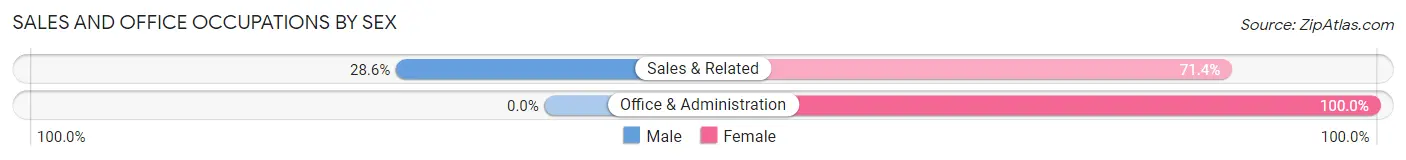
| Occupation | Male | Female |
| Sales & Related | 20 (28.6%) | 50 (71.4%) |
| Office & Administration | 0 (0.0%) | 106 (100.0%) |
| Total (Category) | 20 (11.4%) | 156 (88.6%) |
| Total (Overall) | 344 (38.7%) | 544 (61.3%) |
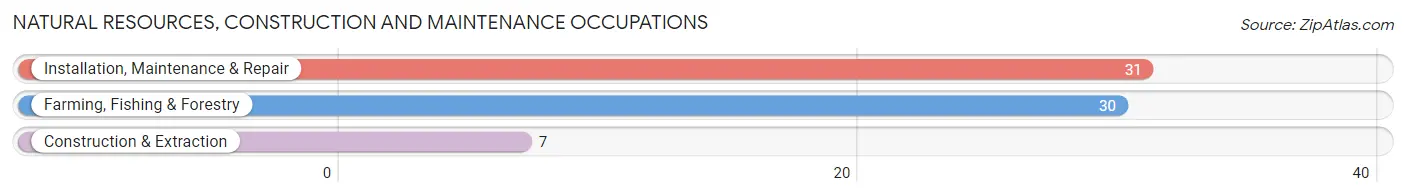
Natural Resources, Construction and Maintenance Occupations
The most common Natural Resources, Construction and Maintenance occupations in East Sonora are Installation, Maintenance & Repair (31 | 3.5%), Farming, Fishing & Forestry (30 | 3.4%), and Construction & Extraction (7 | 0.8%).
Natural Resources, Construction and Maintenance Occupations by Sex
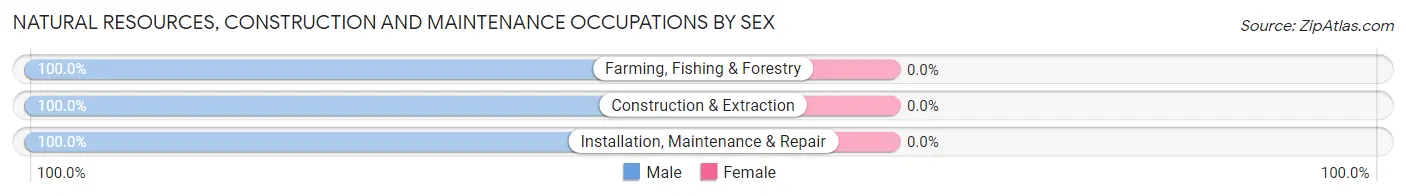
| Occupation | Male | Female |
| Farming, Fishing & Forestry | 30 (100.0%) | 0 (0.0%) |
| Construction & Extraction | 7 (100.0%) | 0 (0.0%) |
| Installation, Maintenance & Repair | 31 (100.0%) | 0 (0.0%) |
| Total (Category) | 68 (100.0%) | 0 (0.0%) |
| Total (Overall) | 344 (38.7%) | 544 (61.3%) |
Production, Transportation and Moving Occupations
The most common Production, Transportation and Moving occupations in East Sonora are Material Moving (28 | 3.2%), Production (27 | 3.0%), and Transportation (7 | 0.8%).
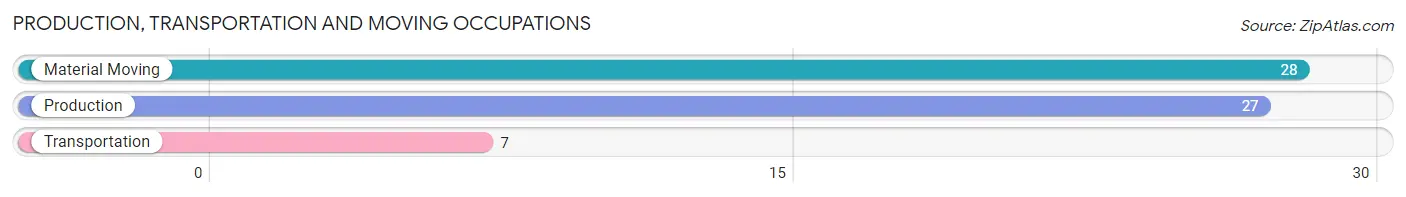
Production, Transportation and Moving Occupations by Sex
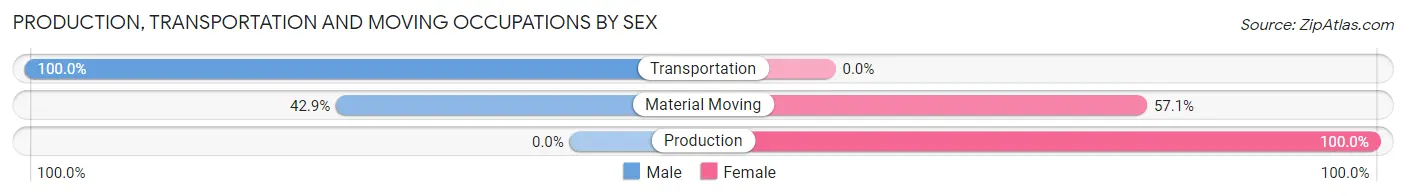
| Occupation | Male | Female |
| Production | 0 (0.0%) | 27 (100.0%) |
| Transportation | 7 (100.0%) | 0 (0.0%) |
| Material Moving | 12 (42.9%) | 16 (57.1%) |
| Total (Category) | 19 (30.6%) | 43 (69.4%) |
| Total (Overall) | 344 (38.7%) | 544 (61.3%) |
Employment Industries by Sex in East Sonora
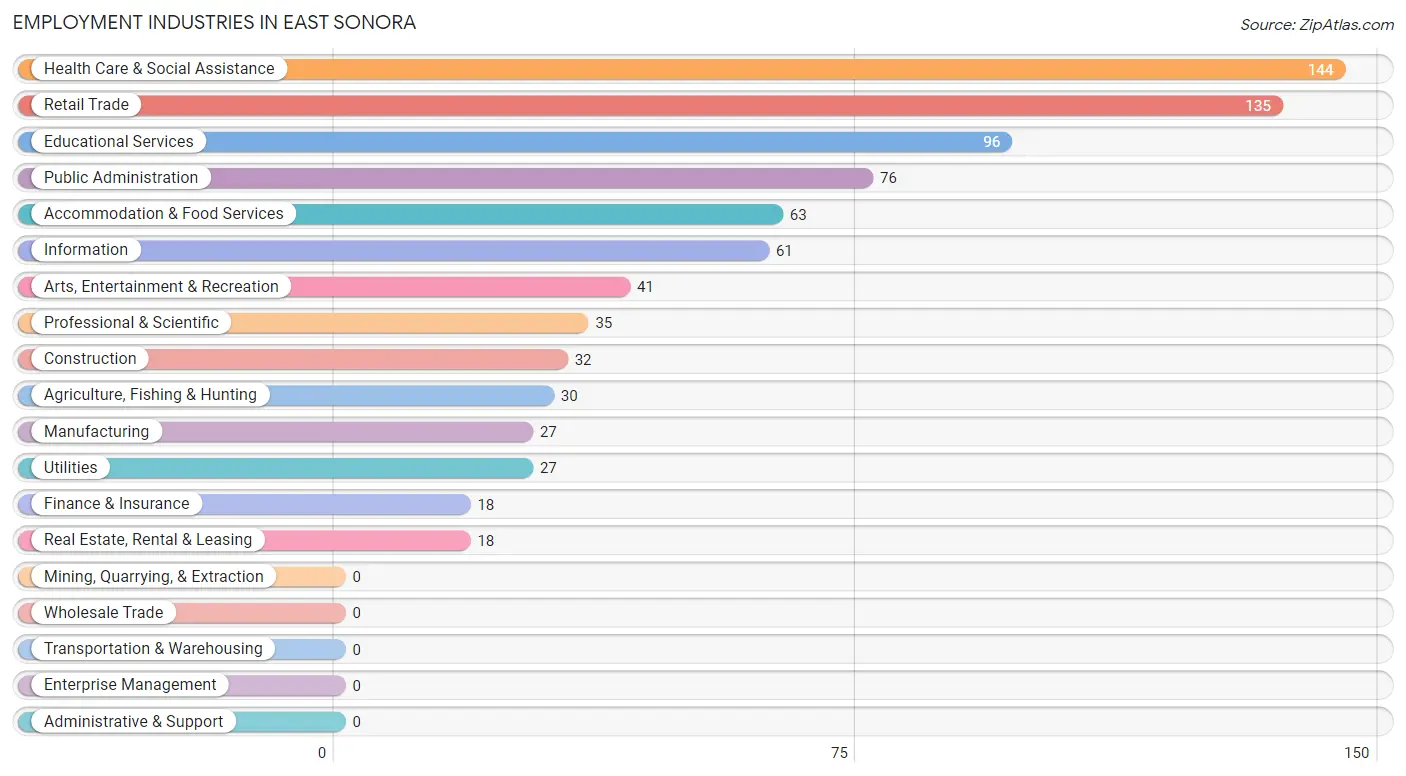
Employment Industries in East Sonora
The major employment industries in East Sonora include Health Care & Social Assistance (144 | 16.2%), Retail Trade (135 | 15.2%), Educational Services (96 | 10.8%), Public Administration (76 | 8.6%), and Accommodation & Food Services (63 | 7.1%).
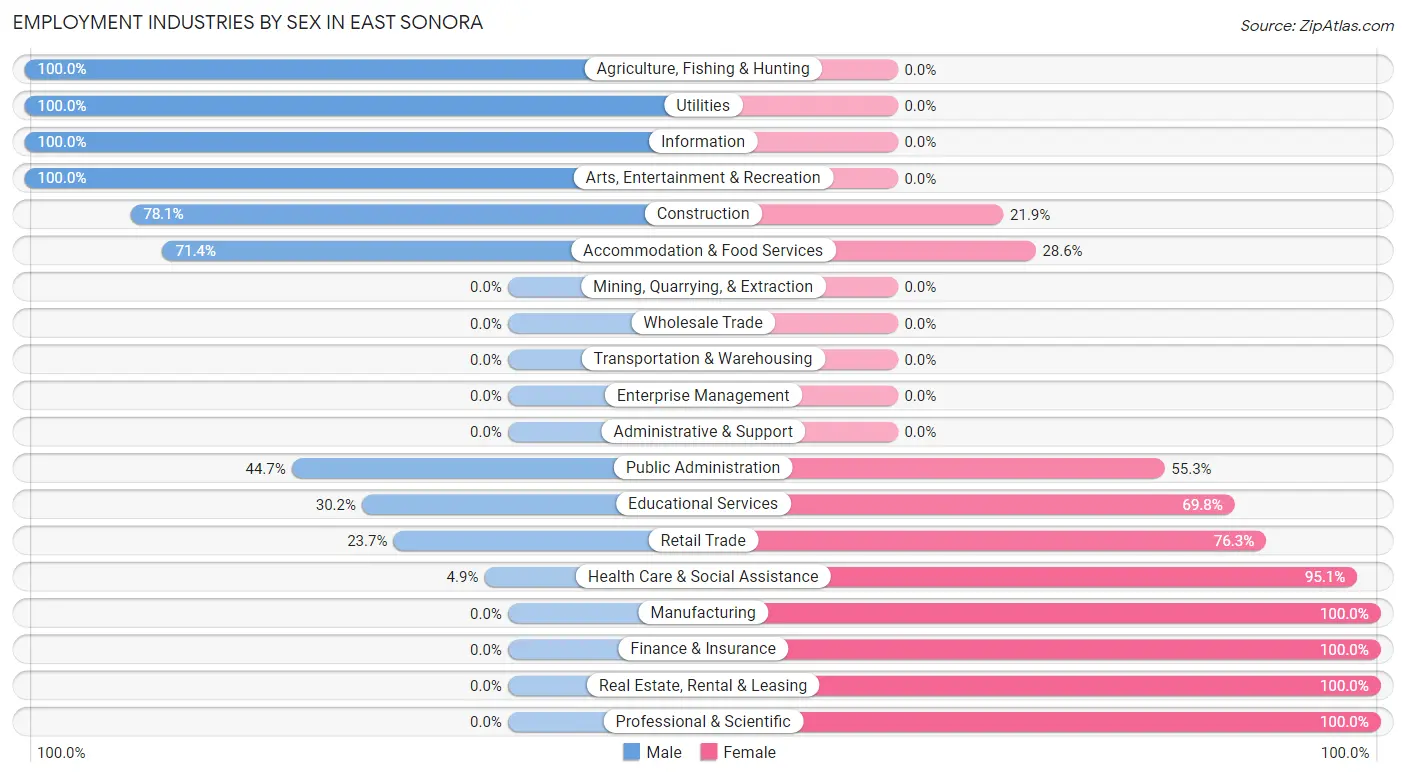
Employment Industries by Sex in East Sonora
The East Sonora industries that see more men than women are Agriculture, Fishing & Hunting (100.0%), Utilities (100.0%), and Information (100.0%), whereas the industries that tend to have a higher number of women are Manufacturing (100.0%), Finance & Insurance (100.0%), and Real Estate, Rental & Leasing (100.0%).
| Industry | Male | Female |
| Agriculture, Fishing & Hunting | 30 (100.0%) | 0 (0.0%) |
| Mining, Quarrying, & Extraction | 0 (0.0%) | 0 (0.0%) |
| Construction | 25 (78.1%) | 7 (21.9%) |
| Manufacturing | 0 (0.0%) | 27 (100.0%) |
| Wholesale Trade | 0 (0.0%) | 0 (0.0%) |
| Retail Trade | 32 (23.7%) | 103 (76.3%) |
| Transportation & Warehousing | 0 (0.0%) | 0 (0.0%) |
| Utilities | 27 (100.0%) | 0 (0.0%) |
| Information | 61 (100.0%) | 0 (0.0%) |
| Finance & Insurance | 0 (0.0%) | 18 (100.0%) |
| Real Estate, Rental & Leasing | 0 (0.0%) | 18 (100.0%) |
| Professional & Scientific | 0 (0.0%) | 35 (100.0%) |
| Enterprise Management | 0 (0.0%) | 0 (0.0%) |
| Administrative & Support | 0 (0.0%) | 0 (0.0%) |
| Educational Services | 29 (30.2%) | 67 (69.8%) |
| Health Care & Social Assistance | 7 (4.9%) | 137 (95.1%) |
| Arts, Entertainment & Recreation | 41 (100.0%) | 0 (0.0%) |
| Accommodation & Food Services | 45 (71.4%) | 18 (28.6%) |
| Public Administration | 34 (44.7%) | 42 (55.3%) |
| Total | 344 (38.7%) | 544 (61.3%) |
Education in East Sonora
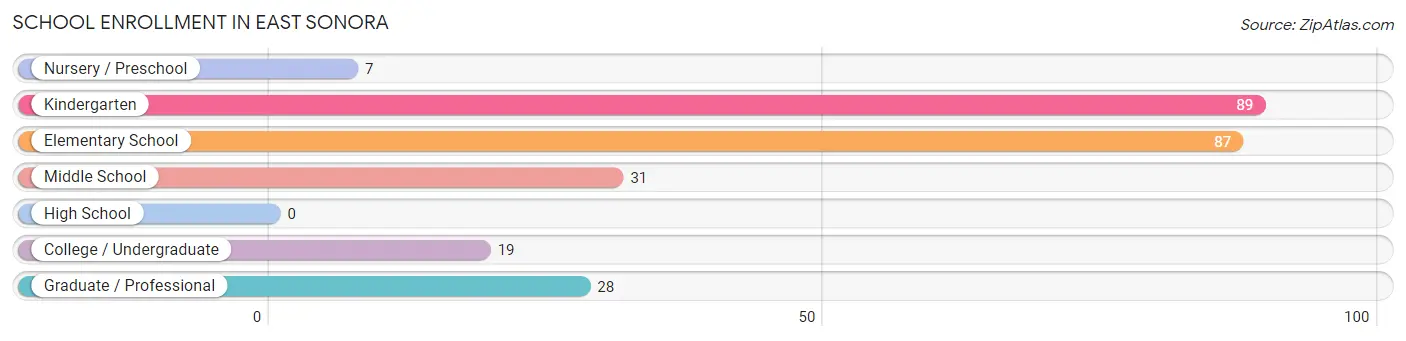
School Enrollment in East Sonora
The most common levels of schooling among the 261 students in East Sonora are kindergarten (89 | 34.1%), elementary school (87 | 33.3%), and middle school (31 | 11.9%).
| School Level | # Students | % Students |
| Nursery / Preschool | 7 | 2.7% |
| Kindergarten | 89 | 34.1% |
| Elementary School | 87 | 33.3% |
| Middle School | 31 | 11.9% |
| High School | 0 | 0.0% |
| College / Undergraduate | 19 | 7.3% |
| Graduate / Professional | 28 | 10.7% |
| Total | 261 | 100.0% |
School Enrollment by Age by Funding Source in East Sonora
Out of a total of 261 students who are enrolled in schools in East Sonora, 81 (31.0%) attend a private institution, while the remaining 180 (69.0%) are enrolled in public schools. The age group of 35 years and over has the highest likelihood of being enrolled in private schools, with 7 (100.0% in the age bracket) enrolled. Conversely, the age group of 3 to 4 year olds has the lowest likelihood of being enrolled in a private school, with 7 (100.0% in the age bracket) attending a public institution.
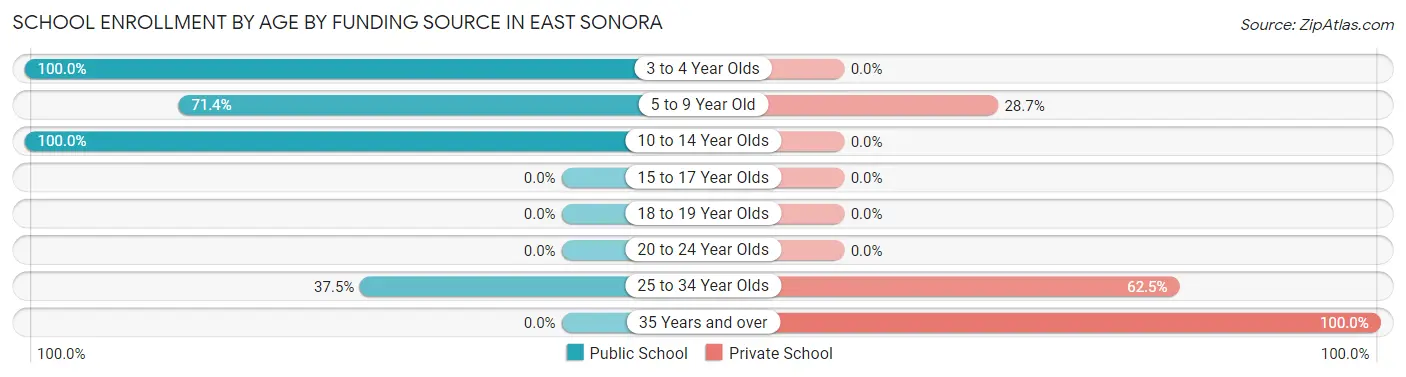
| Age Bracket | Public School | Private School |
| 3 to 4 Year Olds | 7 (100.0%) | 0 (0.0%) |
| 5 to 9 Year Old | 122 (71.4%) | 49 (28.6%) |
| 10 to 14 Year Olds | 36 (100.0%) | 0 (0.0%) |
| 15 to 17 Year Olds | 0 (0.0%) | 0 (0.0%) |
| 18 to 19 Year Olds | 0 (0.0%) | 0 (0.0%) |
| 20 to 24 Year Olds | 0 (0.0%) | 0 (0.0%) |
| 25 to 34 Year Olds | 15 (37.5%) | 25 (62.5%) |
| 35 Years and over | 0 (0.0%) | 7 (100.0%) |
| Total | 180 (69.0%) | 81 (31.0%) |
Educational Attainment by Field of Study in East Sonora
Business (151 | 18.9%), communications (117 | 14.6%), education (101 | 12.6%), arts & humanities (68 | 8.5%), and visual & performing arts (62 | 7.8%) are the most common fields of study among 799 individuals in East Sonora who have obtained a bachelor's degree or higher.
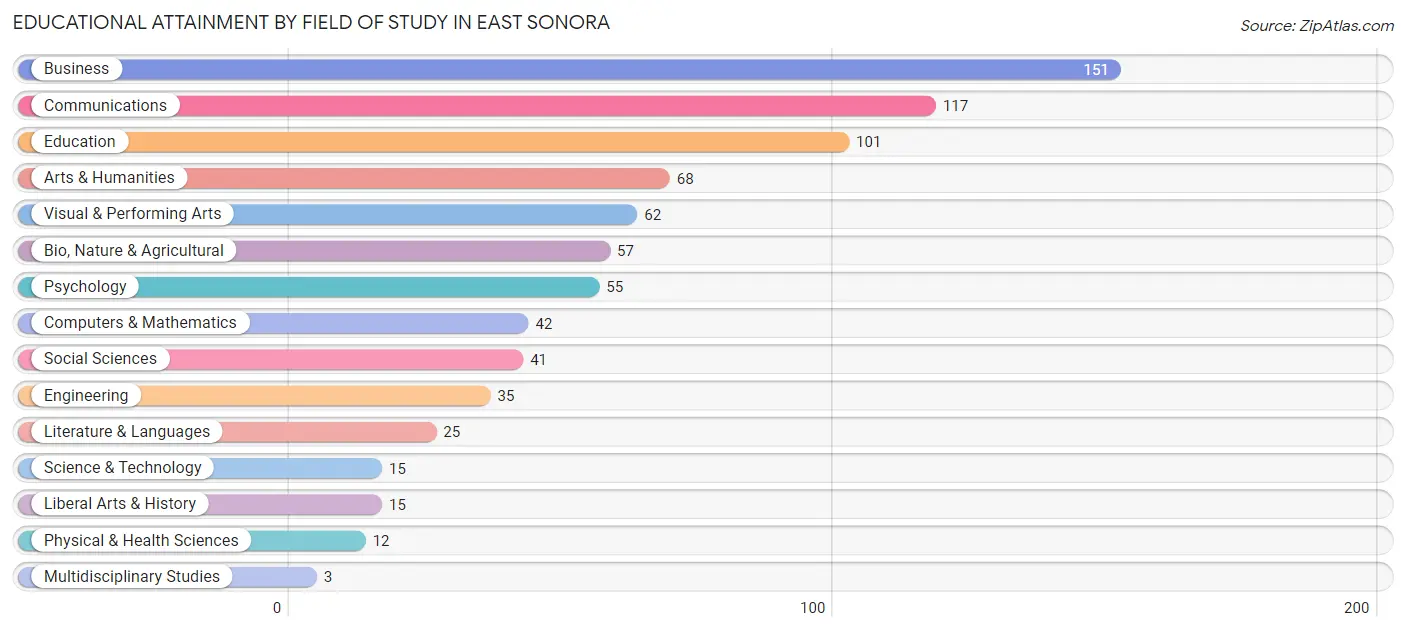
| Field of Study | # Graduates | % Graduates |
| Computers & Mathematics | 42 | 5.3% |
| Bio, Nature & Agricultural | 57 | 7.1% |
| Physical & Health Sciences | 12 | 1.5% |
| Psychology | 55 | 6.9% |
| Social Sciences | 41 | 5.1% |
| Engineering | 35 | 4.4% |
| Multidisciplinary Studies | 3 | 0.4% |
| Science & Technology | 15 | 1.9% |
| Business | 151 | 18.9% |
| Education | 101 | 12.6% |
| Literature & Languages | 25 | 3.1% |
| Liberal Arts & History | 15 | 1.9% |
| Visual & Performing Arts | 62 | 7.8% |
| Communications | 117 | 14.6% |
| Arts & Humanities | 68 | 8.5% |
| Total | 799 | 100.0% |
Transportation & Commute in East Sonora
Vehicle Availability by Sex in East Sonora
The most prevalent vehicle ownership categories in East Sonora are males with 2 vehicles (135, accounting for 39.2%) and females with 2 vehicles (228, making up 27.0%).
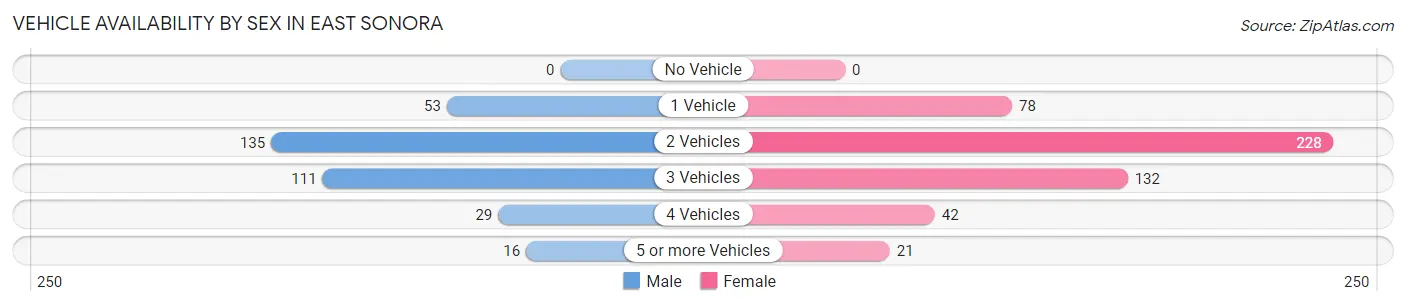
| Vehicles Available | Male | Female |
| No Vehicle | 0 (0.0%) | 0 (0.0%) |
| 1 Vehicle | 53 (15.4%) | 78 (15.6%) |
| 2 Vehicles | 135 (39.2%) | 228 (45.5%) |
| 3 Vehicles | 111 (32.3%) | 132 (26.4%) |
| 4 Vehicles | 29 (8.4%) | 42 (8.4%) |
| 5 or more Vehicles | 16 (4.6%) | 21 (4.2%) |
| Total | 344 (100.0%) | 501 (100.0%) |
Commute Time in East Sonora
The most frequently occuring commute durations in East Sonora are 5 to 9 minutes (166 commuters, 25.9%), 20 to 24 minutes (124 commuters, 19.4%), and 25 to 29 minutes (108 commuters, 16.9%).
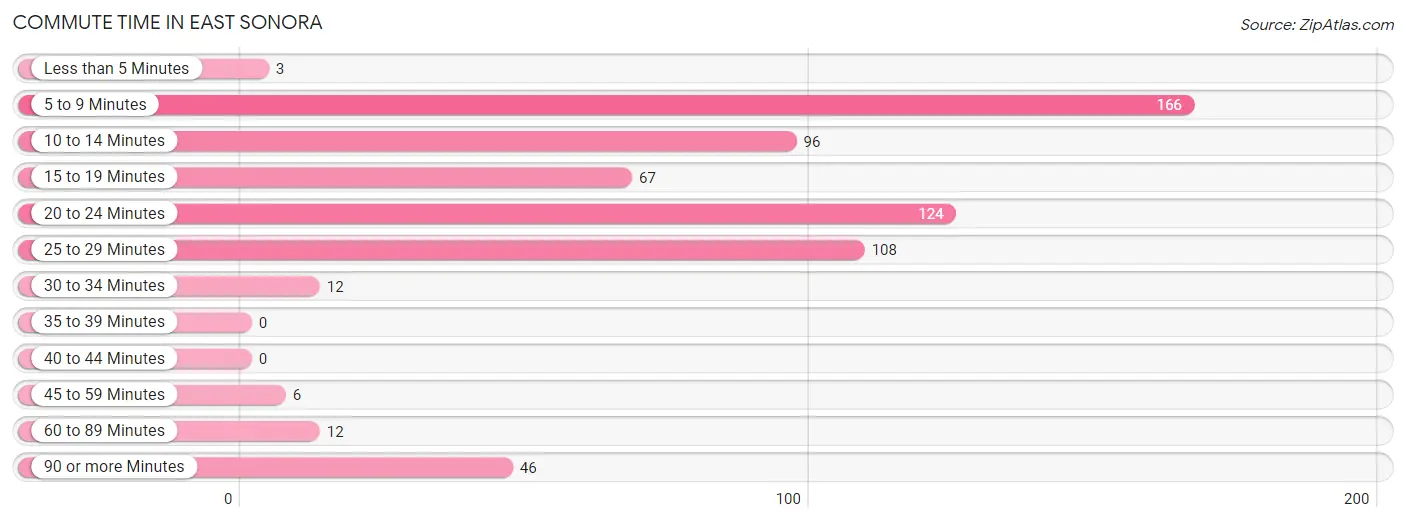
| Commute Time | # Commuters | % Commuters |
| Less than 5 Minutes | 3 | 0.5% |
| 5 to 9 Minutes | 166 | 25.9% |
| 10 to 14 Minutes | 96 | 15.0% |
| 15 to 19 Minutes | 67 | 10.5% |
| 20 to 24 Minutes | 124 | 19.4% |
| 25 to 29 Minutes | 108 | 16.9% |
| 30 to 34 Minutes | 12 | 1.9% |
| 35 to 39 Minutes | 0 | 0.0% |
| 40 to 44 Minutes | 0 | 0.0% |
| 45 to 59 Minutes | 6 | 0.9% |
| 60 to 89 Minutes | 12 | 1.9% |
| 90 or more Minutes | 46 | 7.2% |
Commute Time by Sex in East Sonora
The most common commute times in East Sonora are 20 to 24 minutes (116 commuters, 36.0%) for males and 5 to 9 minutes (121 commuters, 38.1%) for females.
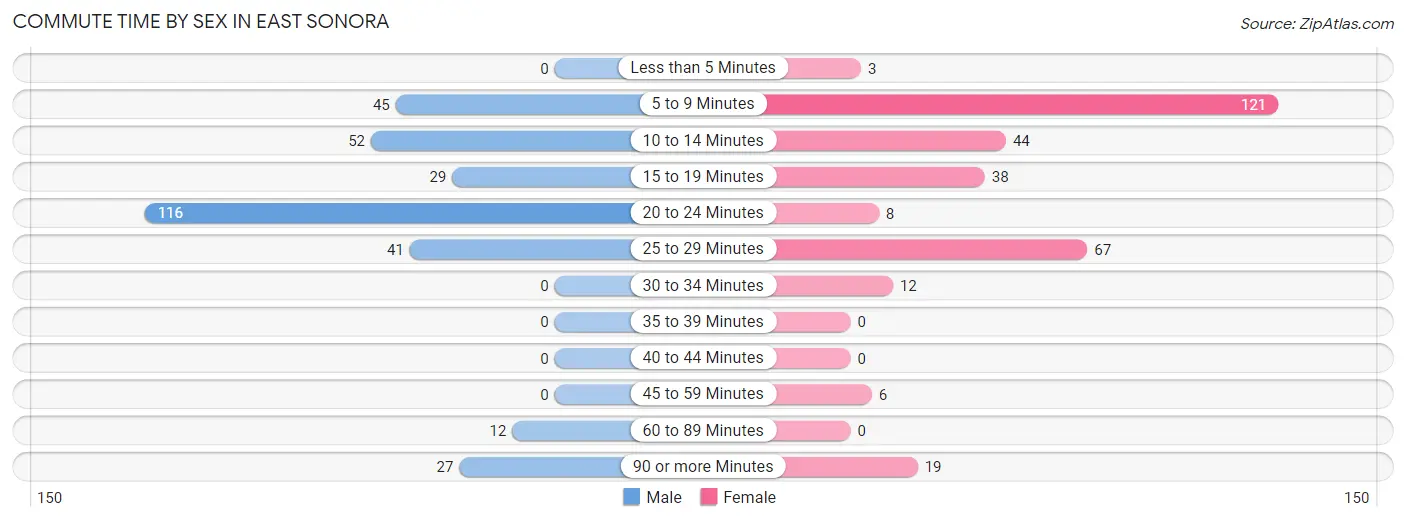
| Commute Time | Male | Female |
| Less than 5 Minutes | 0 (0.0%) | 3 (0.9%) |
| 5 to 9 Minutes | 45 (14.0%) | 121 (38.1%) |
| 10 to 14 Minutes | 52 (16.2%) | 44 (13.8%) |
| 15 to 19 Minutes | 29 (9.0%) | 38 (11.9%) |
| 20 to 24 Minutes | 116 (36.0%) | 8 (2.5%) |
| 25 to 29 Minutes | 41 (12.7%) | 67 (21.1%) |
| 30 to 34 Minutes | 0 (0.0%) | 12 (3.8%) |
| 35 to 39 Minutes | 0 (0.0%) | 0 (0.0%) |
| 40 to 44 Minutes | 0 (0.0%) | 0 (0.0%) |
| 45 to 59 Minutes | 0 (0.0%) | 6 (1.9%) |
| 60 to 89 Minutes | 12 (3.7%) | 0 (0.0%) |
| 90 or more Minutes | 27 (8.4%) | 19 (6.0%) |
Time of Departure to Work by Sex in East Sonora
The most frequent times of departure to work in East Sonora are 6:30 AM to 6:59 AM (93, 28.9%) for males and 7:00 AM to 7:29 AM (116, 36.5%) for females.
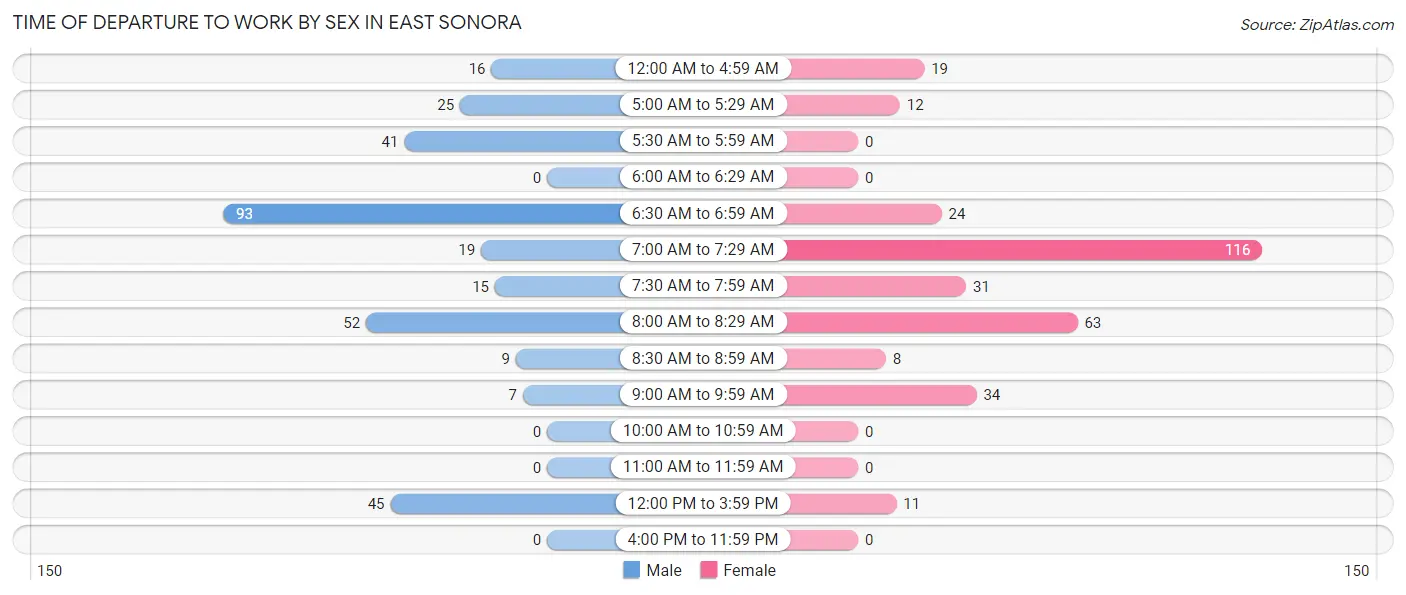
| Time of Departure | Male | Female |
| 12:00 AM to 4:59 AM | 16 (5.0%) | 19 (6.0%) |
| 5:00 AM to 5:29 AM | 25 (7.8%) | 12 (3.8%) |
| 5:30 AM to 5:59 AM | 41 (12.7%) | 0 (0.0%) |
| 6:00 AM to 6:29 AM | 0 (0.0%) | 0 (0.0%) |
| 6:30 AM to 6:59 AM | 93 (28.9%) | 24 (7.5%) |
| 7:00 AM to 7:29 AM | 19 (5.9%) | 116 (36.5%) |
| 7:30 AM to 7:59 AM | 15 (4.7%) | 31 (9.8%) |
| 8:00 AM to 8:29 AM | 52 (16.2%) | 63 (19.8%) |
| 8:30 AM to 8:59 AM | 9 (2.8%) | 8 (2.5%) |
| 9:00 AM to 9:59 AM | 7 (2.2%) | 34 (10.7%) |
| 10:00 AM to 10:59 AM | 0 (0.0%) | 0 (0.0%) |
| 11:00 AM to 11:59 AM | 0 (0.0%) | 0 (0.0%) |
| 12:00 PM to 3:59 PM | 45 (14.0%) | 11 (3.5%) |
| 4:00 PM to 11:59 PM | 0 (0.0%) | 0 (0.0%) |
| Total | 322 (100.0%) | 318 (100.0%) |
Housing Occupancy in East Sonora
Occupancy by Ownership in East Sonora
Of the total 1,361 dwellings in East Sonora, owner-occupied units account for 982 (72.2%), while renter-occupied units make up 379 (27.9%).
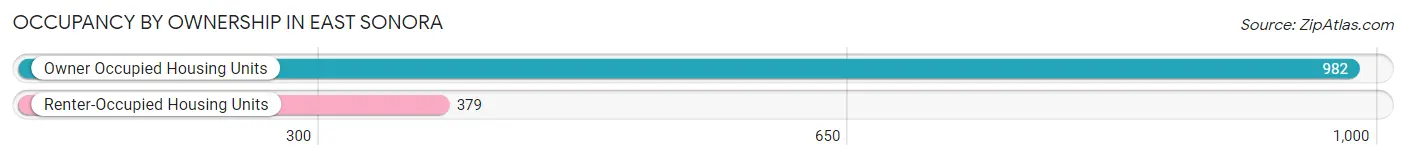
| Occupancy | # Housing Units | % Housing Units |
| Owner Occupied Housing Units | 982 | 72.2% |
| Renter-Occupied Housing Units | 379 | 27.9% |
| Total Occupied Housing Units | 1,361 | 100.0% |
Occupancy by Household Size in East Sonora
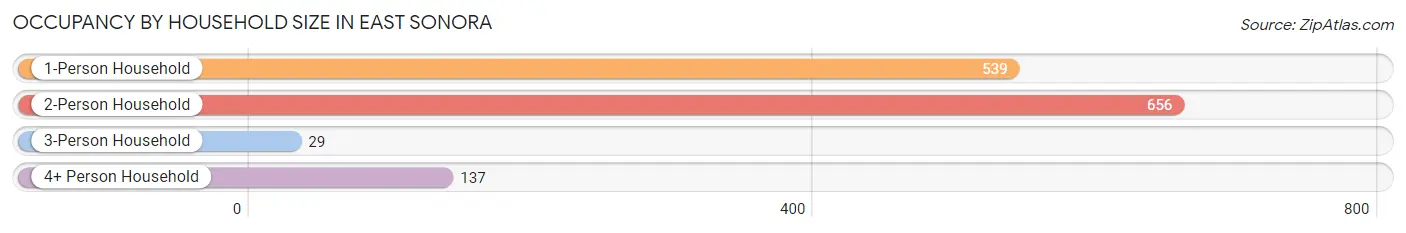
| Household Size | # Housing Units | % Housing Units |
| 1-Person Household | 539 | 39.6% |
| 2-Person Household | 656 | 48.2% |
| 3-Person Household | 29 | 2.1% |
| 4+ Person Household | 137 | 10.1% |
| Total Housing Units | 1,361 | 100.0% |
Occupancy by Ownership by Household Size in East Sonora
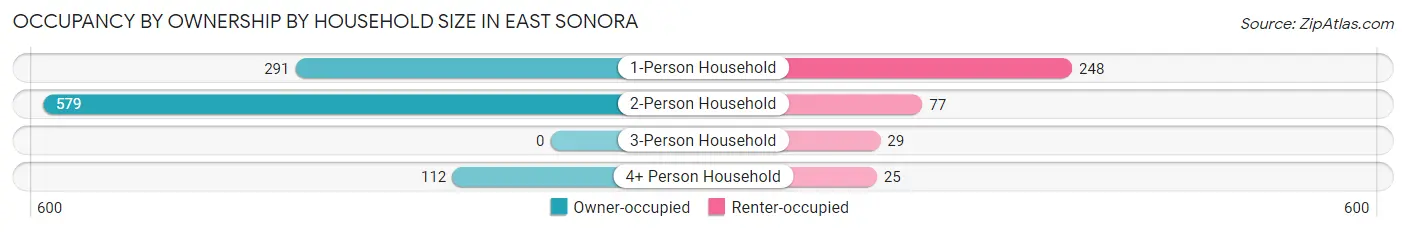
| Household Size | Owner-occupied | Renter-occupied |
| 1-Person Household | 291 (54.0%) | 248 (46.0%) |
| 2-Person Household | 579 (88.3%) | 77 (11.7%) |
| 3-Person Household | 0 (0.0%) | 29 (100.0%) |
| 4+ Person Household | 112 (81.8%) | 25 (18.2%) |
| Total Housing Units | 982 (72.2%) | 379 (27.9%) |
Occupancy by Educational Attainment in East Sonora
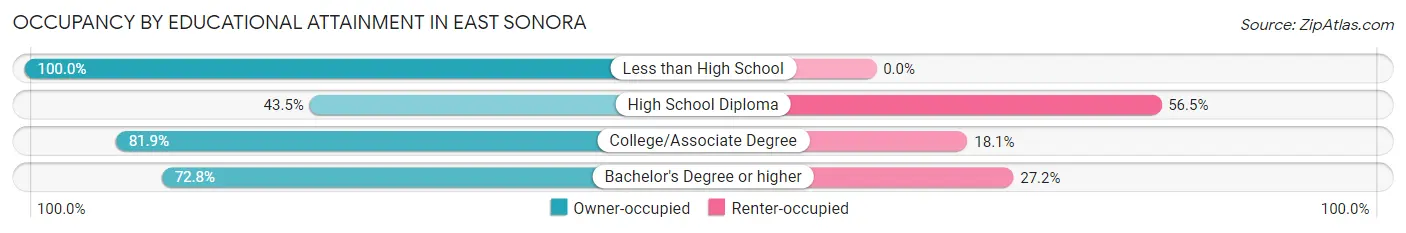
| Household Size | Owner-occupied | Renter-occupied |
| Less than High School | 41 (100.0%) | 0 (0.0%) |
| High School Diploma | 100 (43.5%) | 130 (56.5%) |
| College/Associate Degree | 426 (81.9%) | 94 (18.1%) |
| Bachelor's Degree or higher | 415 (72.8%) | 155 (27.2%) |
Occupancy by Age of Householder in East Sonora
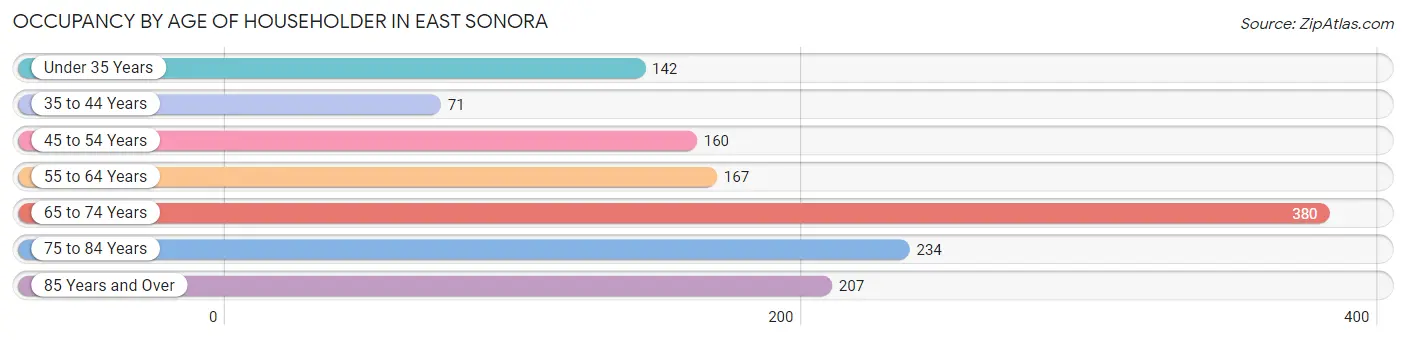
| Age Bracket | # Households | % Households |
| Under 35 Years | 142 | 10.4% |
| 35 to 44 Years | 71 | 5.2% |
| 45 to 54 Years | 160 | 11.8% |
| 55 to 64 Years | 167 | 12.3% |
| 65 to 74 Years | 380 | 27.9% |
| 75 to 84 Years | 234 | 17.2% |
| 85 Years and Over | 207 | 15.2% |
| Total | 1,361 | 100.0% |
Housing Finances in East Sonora
Median Income by Occupancy in East Sonora
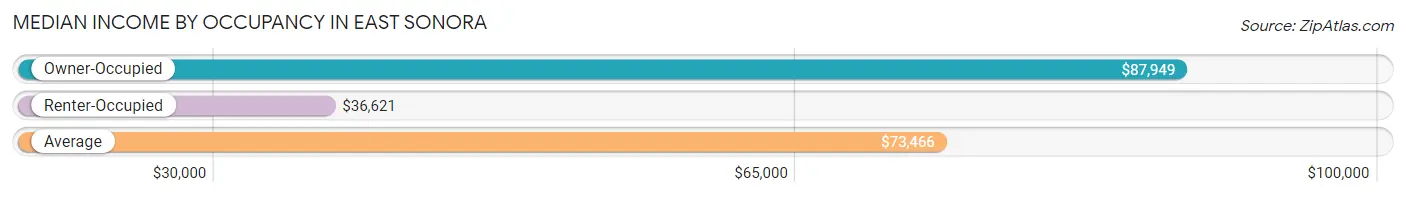
| Occupancy Type | # Households | Median Income |
| Owner-Occupied | 982 (72.2%) | $87,949 |
| Renter-Occupied | 379 (27.9%) | $36,621 |
| Average | 1,361 (100.0%) | $73,466 |
Occupancy by Householder Income Bracket in East Sonora
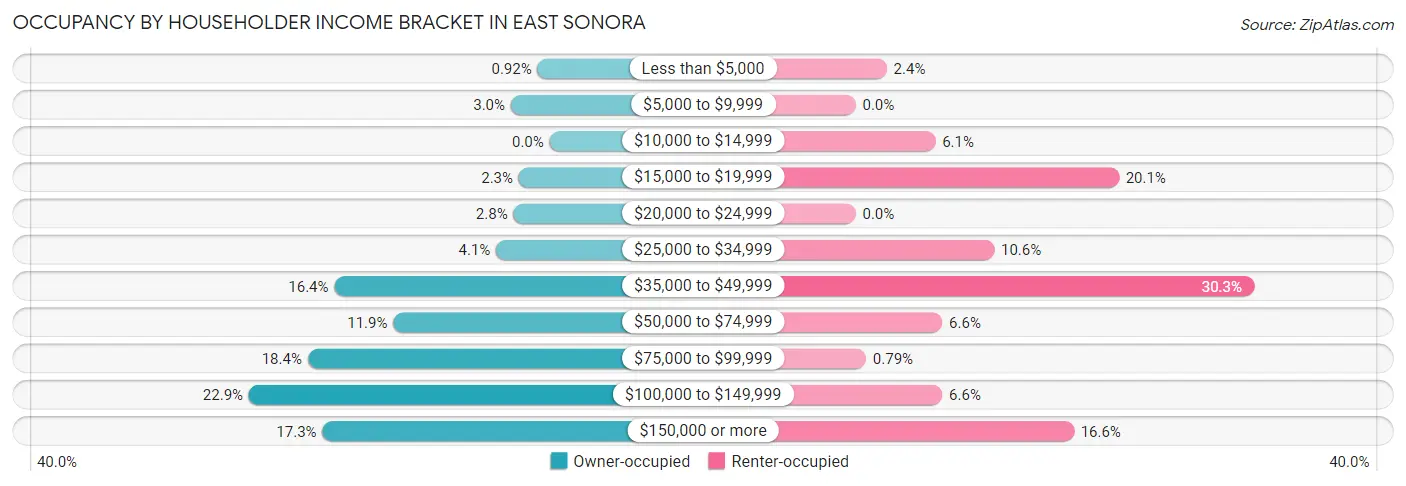
| Income Bracket | Owner-occupied | Renter-occupied |
| Less than $5,000 | 9 (0.9%) | 9 (2.4%) |
| $5,000 to $9,999 | 29 (2.9%) | 0 (0.0%) |
| $10,000 to $14,999 | 0 (0.0%) | 23 (6.1%) |
| $15,000 to $19,999 | 23 (2.3%) | 76 (20.1%) |
| $20,000 to $24,999 | 27 (2.8%) | 0 (0.0%) |
| $25,000 to $34,999 | 40 (4.1%) | 40 (10.5%) |
| $35,000 to $49,999 | 161 (16.4%) | 115 (30.3%) |
| $50,000 to $74,999 | 117 (11.9%) | 25 (6.6%) |
| $75,000 to $99,999 | 181 (18.4%) | 3 (0.8%) |
| $100,000 to $149,999 | 225 (22.9%) | 25 (6.6%) |
| $150,000 or more | 170 (17.3%) | 63 (16.6%) |
| Total | 982 (100.0%) | 379 (100.0%) |
Monthly Housing Cost Tiers in East Sonora
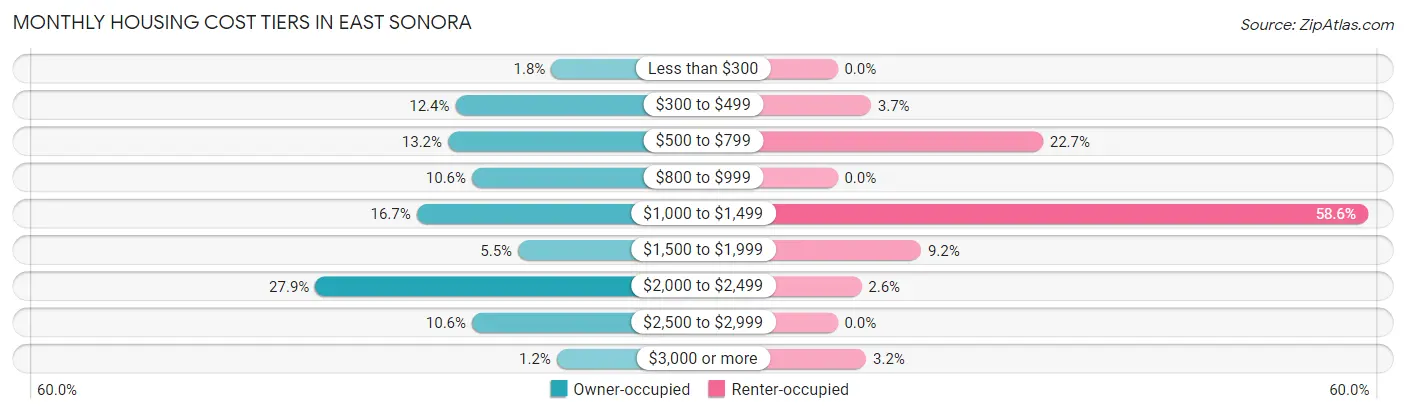
| Monthly Cost | Owner-occupied | Renter-occupied |
| Less than $300 | 18 (1.8%) | 0 (0.0%) |
| $300 to $499 | 122 (12.4%) | 14 (3.7%) |
| $500 to $799 | 130 (13.2%) | 86 (22.7%) |
| $800 to $999 | 104 (10.6%) | 0 (0.0%) |
| $1,000 to $1,499 | 164 (16.7%) | 222 (58.6%) |
| $1,500 to $1,999 | 54 (5.5%) | 35 (9.2%) |
| $2,000 to $2,499 | 274 (27.9%) | 10 (2.6%) |
| $2,500 to $2,999 | 104 (10.6%) | 0 (0.0%) |
| $3,000 or more | 12 (1.2%) | 12 (3.2%) |
| Total | 982 (100.0%) | 379 (100.0%) |
Physical Housing Characteristics in East Sonora
Housing Structures in East Sonora
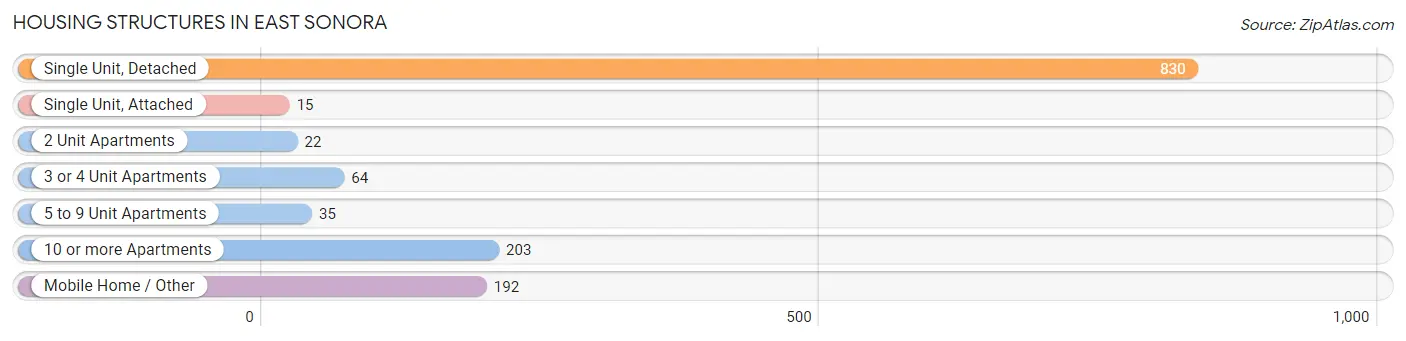
| Structure Type | # Housing Units | % Housing Units |
| Single Unit, Detached | 830 | 61.0% |
| Single Unit, Attached | 15 | 1.1% |
| 2 Unit Apartments | 22 | 1.6% |
| 3 or 4 Unit Apartments | 64 | 4.7% |
| 5 to 9 Unit Apartments | 35 | 2.6% |
| 10 or more Apartments | 203 | 14.9% |
| Mobile Home / Other | 192 | 14.1% |
| Total | 1,361 | 100.0% |
Housing Structures by Occupancy in East Sonora
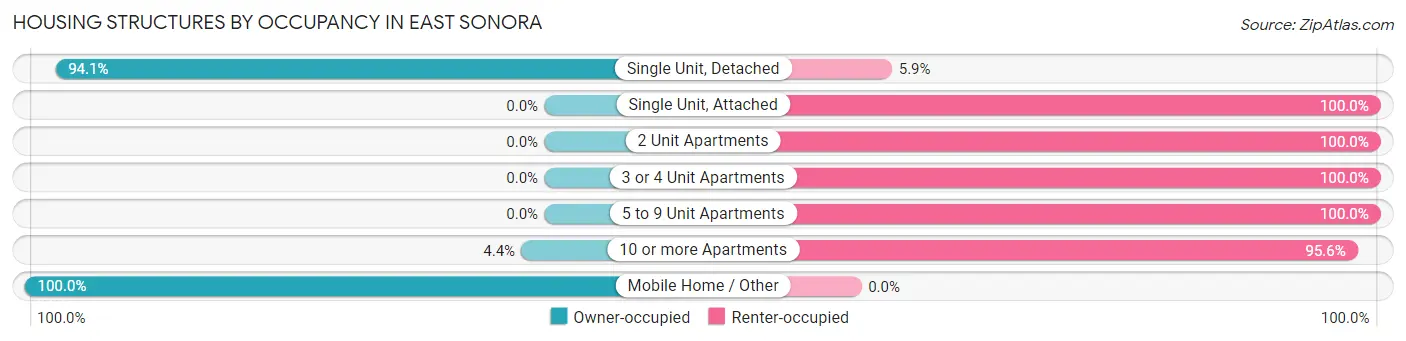
| Structure Type | Owner-occupied | Renter-occupied |
| Single Unit, Detached | 781 (94.1%) | 49 (5.9%) |
| Single Unit, Attached | 0 (0.0%) | 15 (100.0%) |
| 2 Unit Apartments | 0 (0.0%) | 22 (100.0%) |
| 3 or 4 Unit Apartments | 0 (0.0%) | 64 (100.0%) |
| 5 to 9 Unit Apartments | 0 (0.0%) | 35 (100.0%) |
| 10 or more Apartments | 9 (4.4%) | 194 (95.6%) |
| Mobile Home / Other | 192 (100.0%) | 0 (0.0%) |
| Total | 982 (72.2%) | 379 (27.9%) |
Housing Structures by Number of Rooms in East Sonora
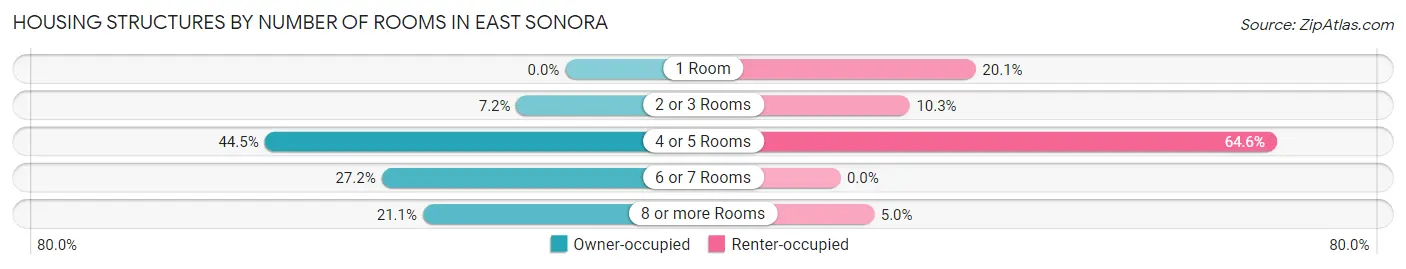
| Number of Rooms | Owner-occupied | Renter-occupied |
| 1 Room | 0 (0.0%) | 76 (20.1%) |
| 2 or 3 Rooms | 71 (7.2%) | 39 (10.3%) |
| 4 or 5 Rooms | 437 (44.5%) | 245 (64.6%) |
| 6 or 7 Rooms | 267 (27.2%) | 0 (0.0%) |
| 8 or more Rooms | 207 (21.1%) | 19 (5.0%) |
| Total | 982 (100.0%) | 379 (100.0%) |
Housing Structure by Heating Type in East Sonora
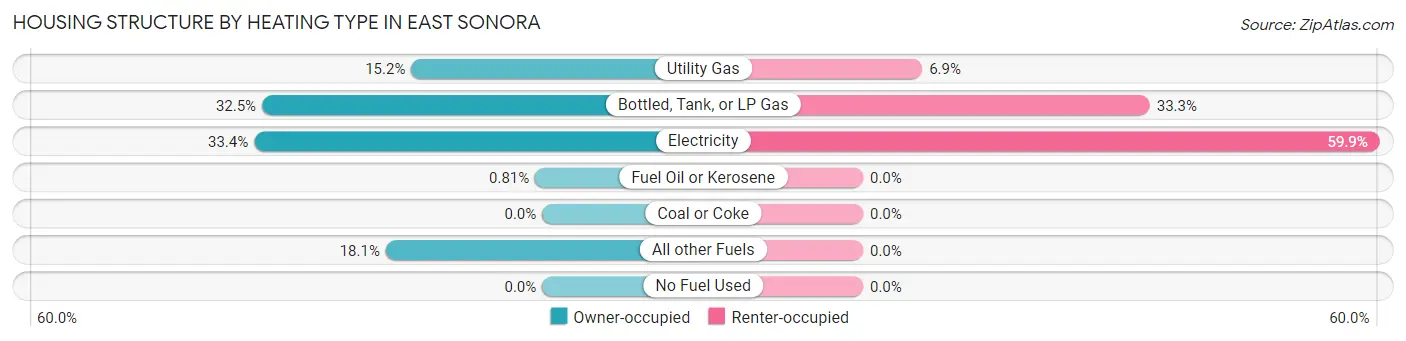
| Heating Type | Owner-occupied | Renter-occupied |
| Utility Gas | 149 (15.2%) | 26 (6.9%) |
| Bottled, Tank, or LP Gas | 319 (32.5%) | 126 (33.3%) |
| Electricity | 328 (33.4%) | 227 (59.9%) |
| Fuel Oil or Kerosene | 8 (0.8%) | 0 (0.0%) |
| Coal or Coke | 0 (0.0%) | 0 (0.0%) |
| All other Fuels | 178 (18.1%) | 0 (0.0%) |
| No Fuel Used | 0 (0.0%) | 0 (0.0%) |
| Total | 982 (100.0%) | 379 (100.0%) |
Household Vehicle Usage in East Sonora
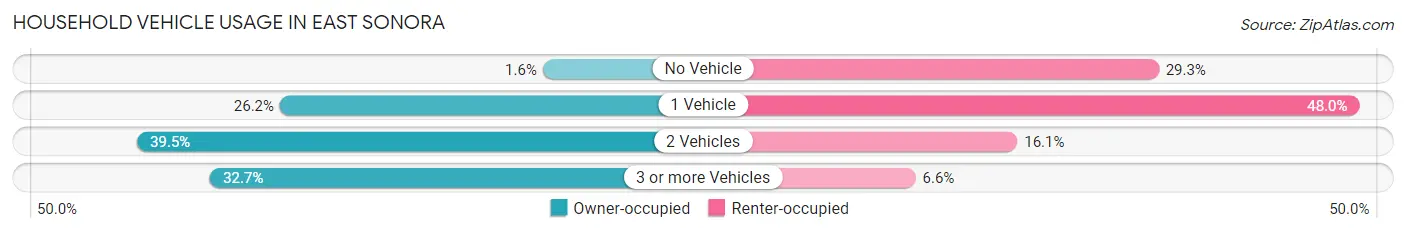
| Vehicles per Household | Owner-occupied | Renter-occupied |
| No Vehicle | 16 (1.6%) | 111 (29.3%) |
| 1 Vehicle | 257 (26.2%) | 182 (48.0%) |
| 2 Vehicles | 388 (39.5%) | 61 (16.1%) |
| 3 or more Vehicles | 321 (32.7%) | 25 (6.6%) |
| Total | 982 (100.0%) | 379 (100.0%) |
Real Estate & Mortgages in East Sonora
Real Estate and Mortgage Overview in East Sonora
| Characteristic | Without Mortgage | With Mortgage |
| Housing Units | 571 | 411 |
| Median Property Value | $241,500 | $291,800 |
| Median Household Income | - | - |
| Monthly Housing Costs | $860 | $12 |
| Real Estate Taxes | - | - |
Property Value by Mortgage Status in East Sonora
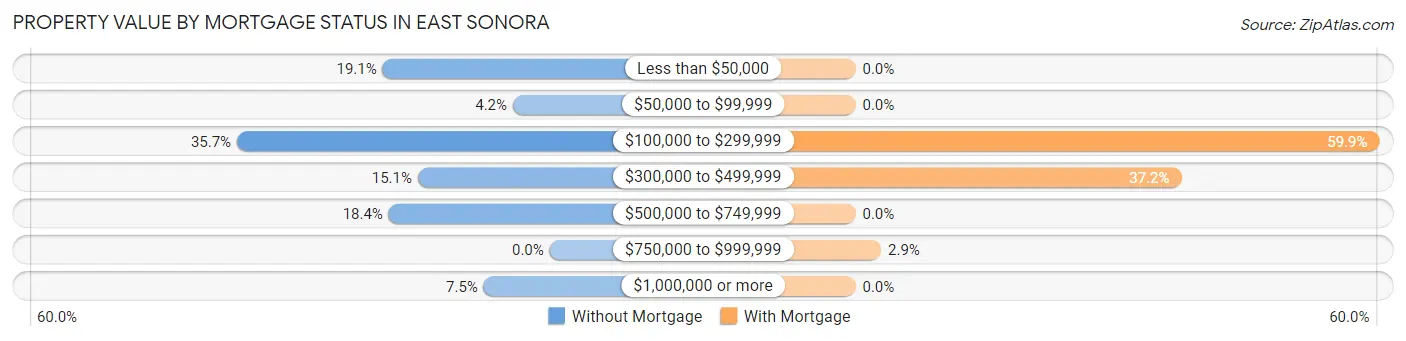
| Property Value | Without Mortgage | With Mortgage |
| Less than $50,000 | 109 (19.1%) | 0 (0.0%) |
| $50,000 to $99,999 | 24 (4.2%) | 0 (0.0%) |
| $100,000 to $299,999 | 204 (35.7%) | 246 (59.9%) |
| $300,000 to $499,999 | 86 (15.1%) | 153 (37.2%) |
| $500,000 to $749,999 | 105 (18.4%) | 0 (0.0%) |
| $750,000 to $999,999 | 0 (0.0%) | 12 (2.9%) |
| $1,000,000 or more | 43 (7.5%) | 0 (0.0%) |
| Total | 571 (100.0%) | 411 (100.0%) |
Household Income by Mortgage Status in East Sonora
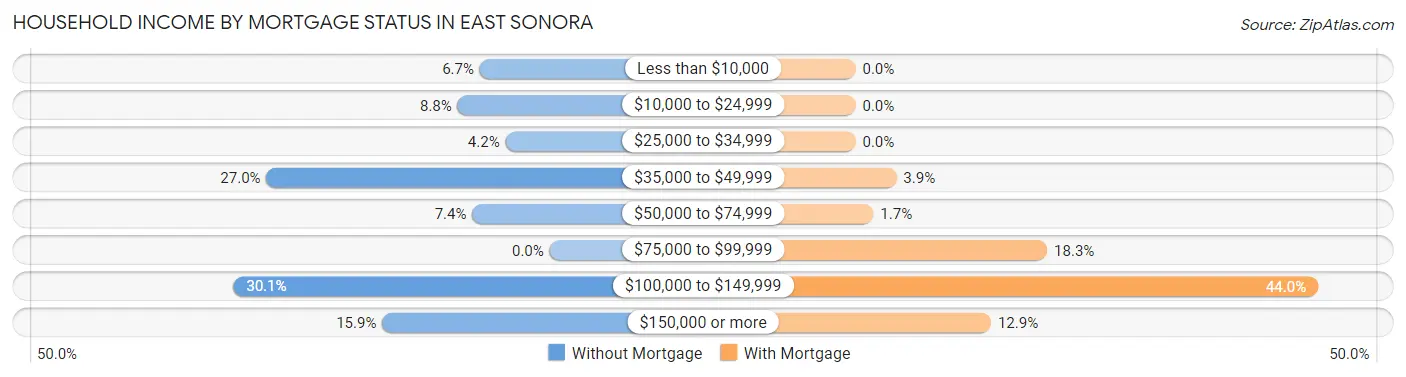
| Household Income | Without Mortgage | With Mortgage |
| Less than $10,000 | 38 (6.7%) | 0 (0.0%) |
| $10,000 to $24,999 | 50 (8.8%) | 0 (0.0%) |
| $25,000 to $34,999 | 24 (4.2%) | 0 (0.0%) |
| $35,000 to $49,999 | 154 (27.0%) | 16 (3.9%) |
| $50,000 to $74,999 | 42 (7.4%) | 7 (1.7%) |
| $75,000 to $99,999 | 0 (0.0%) | 75 (18.2%) |
| $100,000 to $149,999 | 172 (30.1%) | 181 (44.0%) |
| $150,000 or more | 91 (15.9%) | 53 (12.9%) |
| Total | 571 (100.0%) | 411 (100.0%) |
Property Value to Household Income Ratio in East Sonora
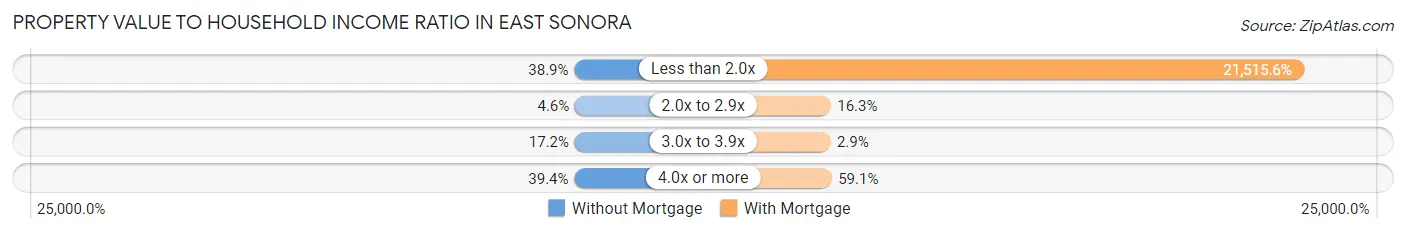
| Value-to-Income Ratio | Without Mortgage | With Mortgage |
| Less than 2.0x | 222 (38.9%) | 88,429 (21,515.6%) |
| 2.0x to 2.9x | 26 (4.5%) | 67 (16.3%) |
| 3.0x to 3.9x | 98 (17.2%) | 12 (2.9%) |
| 4.0x or more | 225 (39.4%) | 243 (59.1%) |
| Total | 571 (100.0%) | 411 (100.0%) |
Real Estate Taxes by Mortgage Status in East Sonora
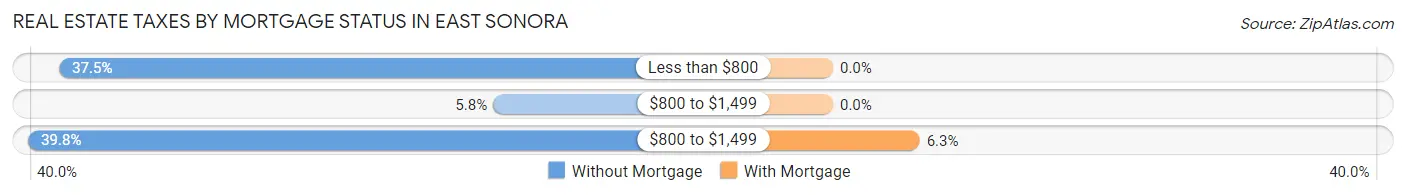
| Property Taxes | Without Mortgage | With Mortgage |
| Less than $800 | 214 (37.5%) | 0 (0.0%) |
| $800 to $1,499 | 33 (5.8%) | 0 (0.0%) |
| $800 to $1,499 | 227 (39.8%) | 26 (6.3%) |
| Total | 571 (100.0%) | 411 (100.0%) |
Health & Disability in East Sonora
Health Insurance Coverage by Age in East Sonora
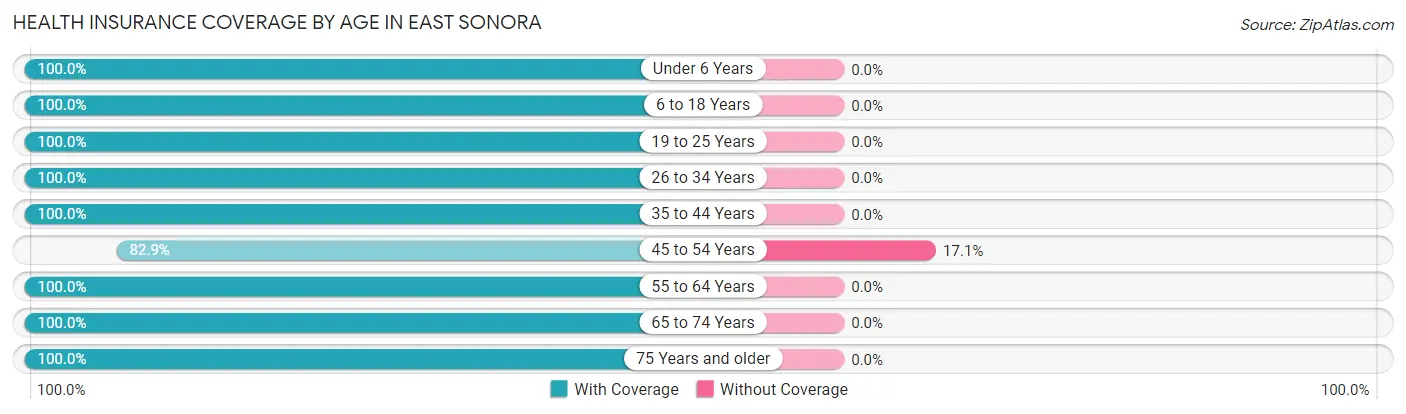
| Age Bracket | With Coverage | Without Coverage |
| Under 6 Years | 65 (100.0%) | 0 (0.0%) |
| 6 to 18 Years | 244 (100.0%) | 0 (0.0%) |
| 19 to 25 Years | 55 (100.0%) | 0 (0.0%) |
| 26 to 34 Years | 160 (100.0%) | 0 (0.0%) |
| 35 to 44 Years | 183 (100.0%) | 0 (0.0%) |
| 45 to 54 Years | 266 (82.9%) | 55 (17.1%) |
| 55 to 64 Years | 338 (100.0%) | 0 (0.0%) |
| 65 to 74 Years | 541 (100.0%) | 0 (0.0%) |
| 75 Years and older | 575 (100.0%) | 0 (0.0%) |
| Total | 2,427 (97.8%) | 55 (2.2%) |
Health Insurance Coverage by Citizenship Status in East Sonora
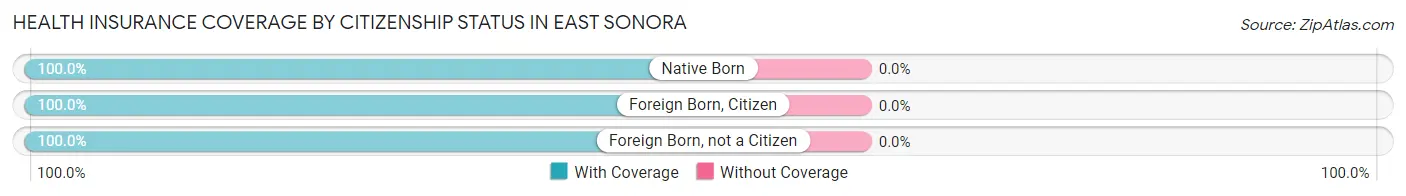
| Citizenship Status | With Coverage | Without Coverage |
| Native Born | 65 (100.0%) | 0 (0.0%) |
| Foreign Born, Citizen | 244 (100.0%) | 0 (0.0%) |
| Foreign Born, not a Citizen | 55 (100.0%) | 0 (0.0%) |
Health Insurance Coverage by Household Income in East Sonora
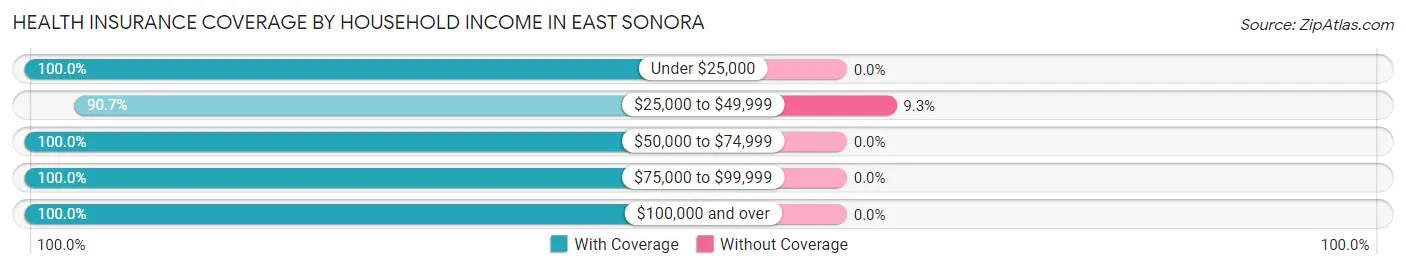
| Household Income | With Coverage | Without Coverage |
| Under $25,000 | 223 (100.0%) | 0 (0.0%) |
| $25,000 to $49,999 | 537 (90.7%) | 55 (9.3%) |
| $50,000 to $74,999 | 245 (100.0%) | 0 (0.0%) |
| $75,000 to $99,999 | 307 (100.0%) | 0 (0.0%) |
| $100,000 and over | 1,115 (100.0%) | 0 (0.0%) |
Public vs Private Health Insurance Coverage by Age in East Sonora
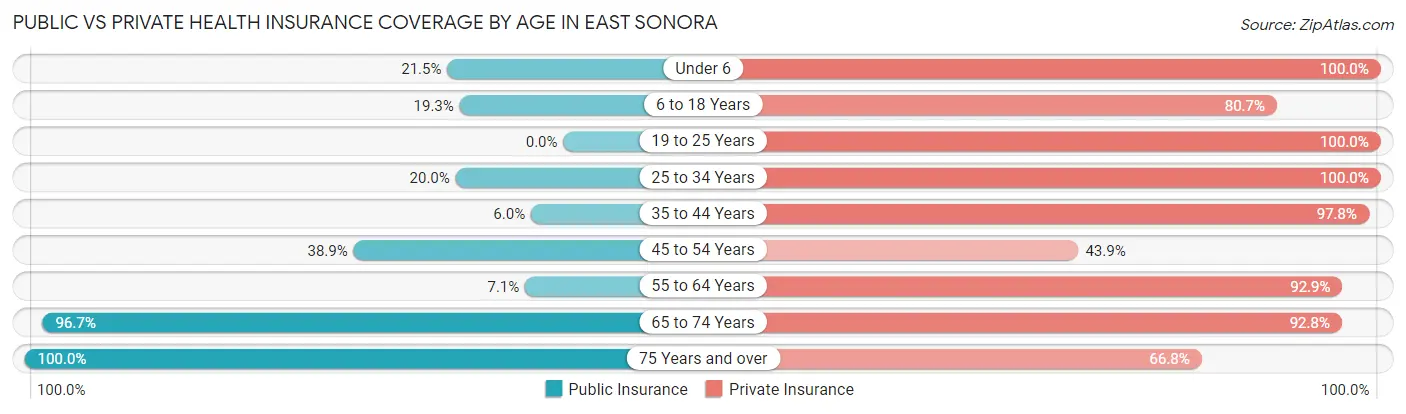
| Age Bracket | Public Insurance | Private Insurance |
| Under 6 | 14 (21.5%) | 65 (100.0%) |
| 6 to 18 Years | 47 (19.3%) | 197 (80.7%) |
| 19 to 25 Years | 0 (0.0%) | 55 (100.0%) |
| 25 to 34 Years | 32 (20.0%) | 160 (100.0%) |
| 35 to 44 Years | 11 (6.0%) | 179 (97.8%) |
| 45 to 54 Years | 125 (38.9%) | 141 (43.9%) |
| 55 to 64 Years | 24 (7.1%) | 314 (92.9%) |
| 65 to 74 Years | 523 (96.7%) | 502 (92.8%) |
| 75 Years and over | 575 (100.0%) | 384 (66.8%) |
| Total | 1,351 (54.4%) | 1,997 (80.5%) |
Disability Status by Sex by Age in East Sonora
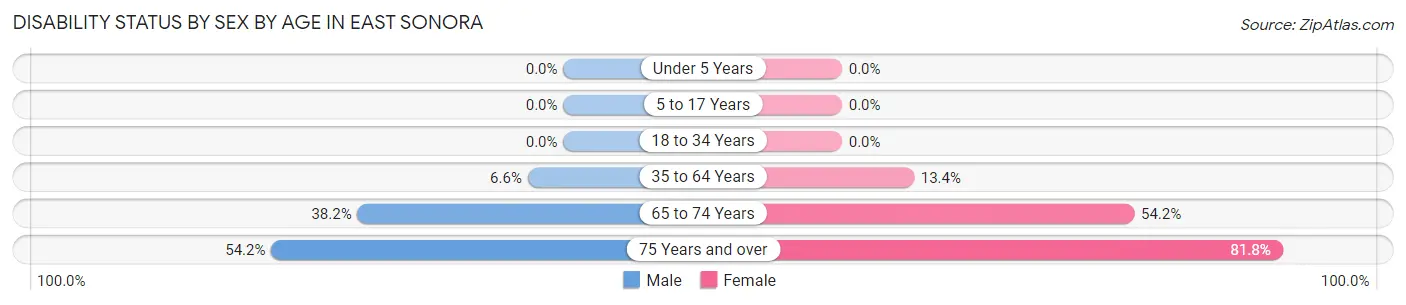
| Age Bracket | Male | Female |
| Under 5 Years | 0 (0.0%) | 0 (0.0%) |
| 5 to 17 Years | 0 (0.0%) | 0 (0.0%) |
| 18 to 34 Years | 0 (0.0%) | 0 (0.0%) |
| 35 to 64 Years | 22 (6.6%) | 68 (13.4%) |
| 65 to 74 Years | 94 (38.2%) | 160 (54.2%) |
| 75 Years and over | 103 (54.2%) | 315 (81.8%) |
Disability Class by Sex by Age in East Sonora
Disability Class: Hearing Difficulty
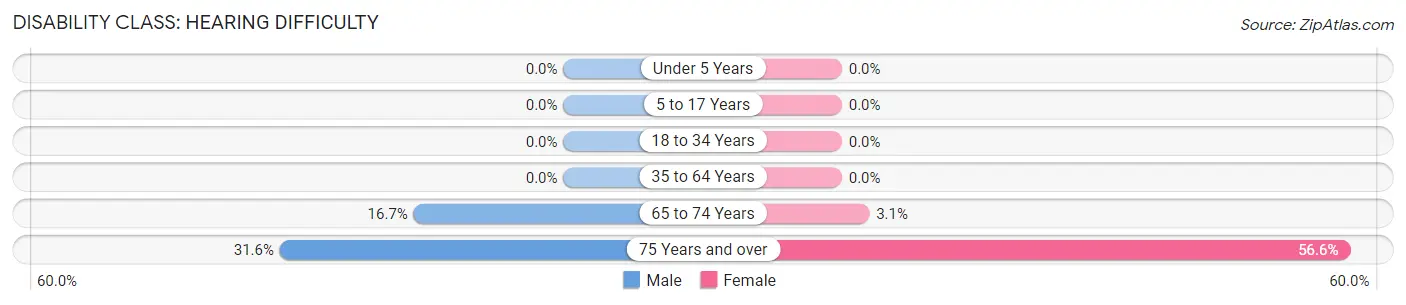
| Age Bracket | Male | Female |
| Under 5 Years | 0 (0.0%) | 0 (0.0%) |
| 5 to 17 Years | 0 (0.0%) | 0 (0.0%) |
| 18 to 34 Years | 0 (0.0%) | 0 (0.0%) |
| 35 to 64 Years | 0 (0.0%) | 0 (0.0%) |
| 65 to 74 Years | 41 (16.7%) | 9 (3.0%) |
| 75 Years and over | 60 (31.6%) | 218 (56.6%) |
Disability Class: Vision Difficulty
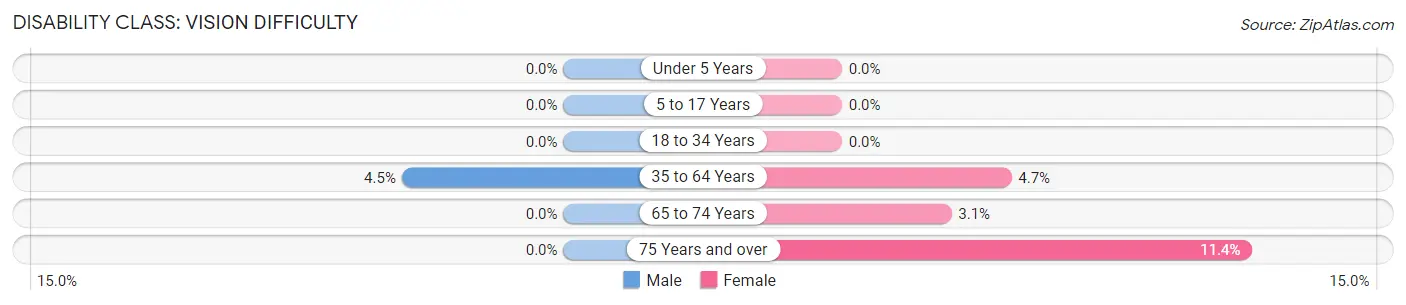
| Age Bracket | Male | Female |
| Under 5 Years | 0 (0.0%) | 0 (0.0%) |
| 5 to 17 Years | 0 (0.0%) | 0 (0.0%) |
| 18 to 34 Years | 0 (0.0%) | 0 (0.0%) |
| 35 to 64 Years | 15 (4.5%) | 24 (4.7%) |
| 65 to 74 Years | 0 (0.0%) | 9 (3.0%) |
| 75 Years and over | 0 (0.0%) | 44 (11.4%) |
Disability Class: Cognitive Difficulty
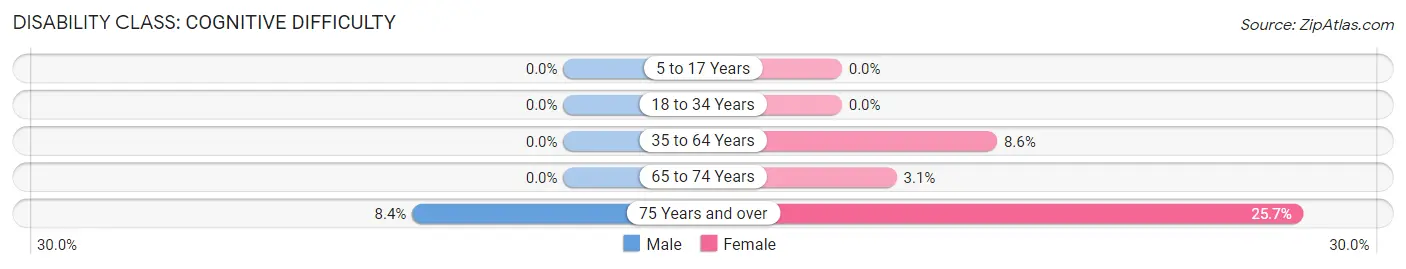
| Age Bracket | Male | Female |
| 5 to 17 Years | 0 (0.0%) | 0 (0.0%) |
| 18 to 34 Years | 0 (0.0%) | 0 (0.0%) |
| 35 to 64 Years | 0 (0.0%) | 44 (8.6%) |
| 65 to 74 Years | 0 (0.0%) | 9 (3.0%) |
| 75 Years and over | 16 (8.4%) | 99 (25.7%) |
Disability Class: Ambulatory Difficulty
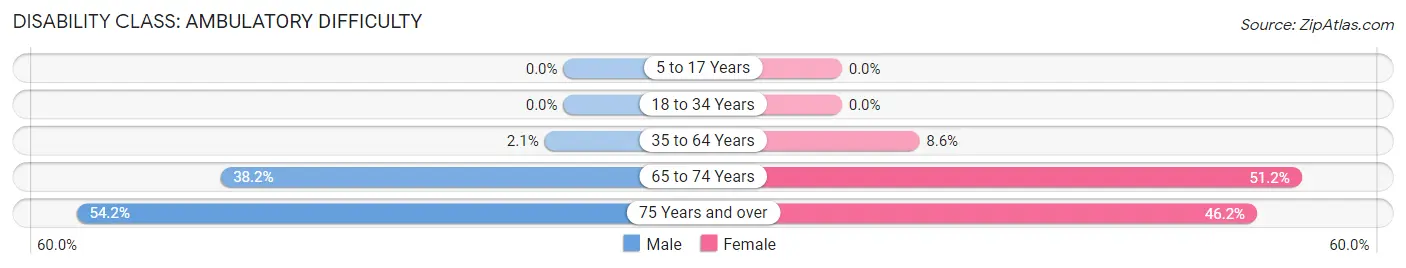
| Age Bracket | Male | Female |
| 5 to 17 Years | 0 (0.0%) | 0 (0.0%) |
| 18 to 34 Years | 0 (0.0%) | 0 (0.0%) |
| 35 to 64 Years | 7 (2.1%) | 44 (8.6%) |
| 65 to 74 Years | 94 (38.2%) | 151 (51.2%) |
| 75 Years and over | 103 (54.2%) | 178 (46.2%) |
Disability Class: Self-Care Difficulty
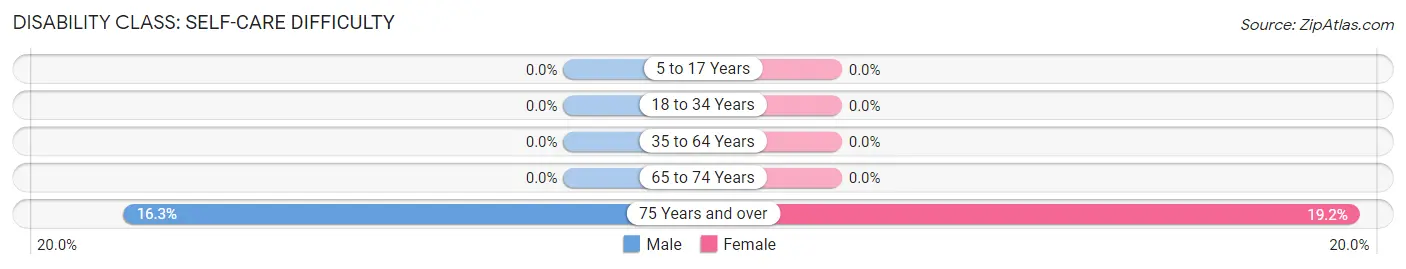
| Age Bracket | Male | Female |
| 5 to 17 Years | 0 (0.0%) | 0 (0.0%) |
| 18 to 34 Years | 0 (0.0%) | 0 (0.0%) |
| 35 to 64 Years | 0 (0.0%) | 0 (0.0%) |
| 65 to 74 Years | 0 (0.0%) | 0 (0.0%) |
| 75 Years and over | 31 (16.3%) | 74 (19.2%) |
Technology Access in East Sonora
Computing Device Access in East Sonora
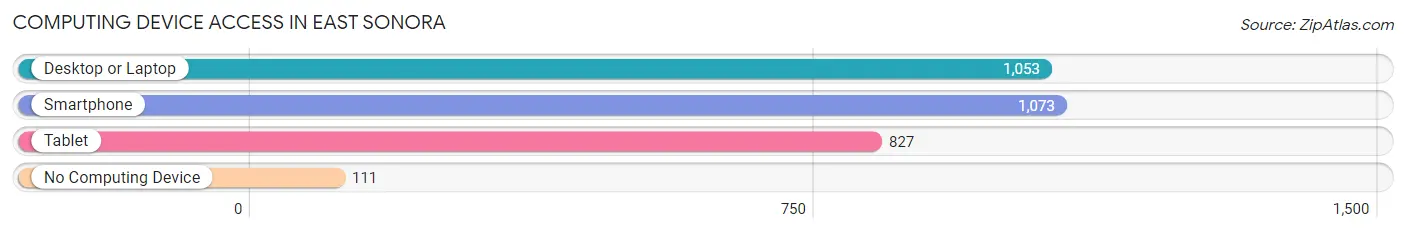
| Device Type | # Households | % Households |
| Desktop or Laptop | 1,053 | 77.4% |
| Smartphone | 1,073 | 78.8% |
| Tablet | 827 | 60.8% |
| No Computing Device | 111 | 8.2% |
| Total | 1,361 | 100.0% |
Internet Access in East Sonora
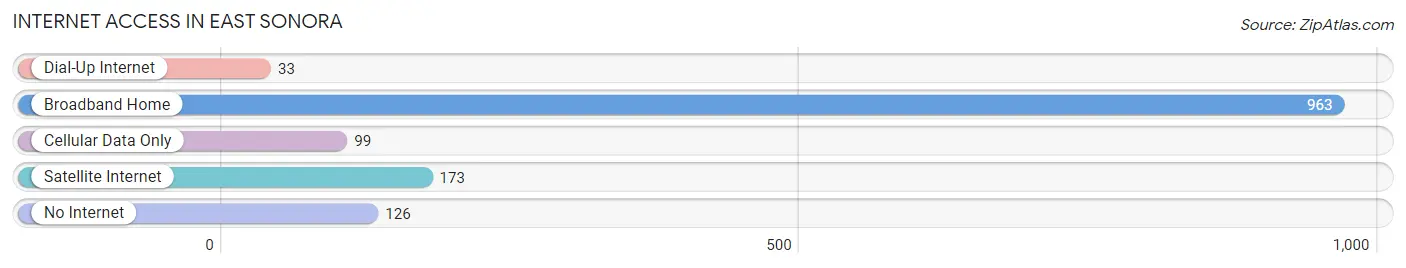
| Internet Type | # Households | % Households |
| Dial-Up Internet | 33 | 2.4% |
| Broadband Home | 963 | 70.8% |
| Cellular Data Only | 99 | 7.3% |
| Satellite Internet | 173 | 12.7% |
| No Internet | 126 | 9.3% |
| Total | 1,361 | 100.0% |
East Sonora Summary
Sonora, California is a small city located in the Sierra Nevada foothills of Tuolumne County, California. It is situated at an elevation of 2,000 feet (610 m) and is located approximately 60 miles (97 km) east of Sacramento and 120 miles (193 km) east of San Francisco. The city has a population of 4,903 as of the 2010 census.
History
The area that is now Sonora was originally inhabited by the Miwok and Mono Native American tribes. The first European settlers arrived in the area in the early 1850s, and the town of Sonora was founded in 1851. The town was named after the nearby Sonora Mine, which was discovered in 1848.
The town quickly grew and became an important center for the mining industry in the region. During the California Gold Rush, Sonora was a major supply center for miners and prospectors. The town also became a popular destination for tourists, and many of the buildings in the downtown area were built during this period.
In the late 19th century, Sonora was a major center for the logging industry. The town was also home to several large lumber mills.
Geography
Sonora is located in the Sierra Nevada foothills of Tuolumne County, California. It is situated at an elevation of 2,000 feet (610 m) and is located approximately 60 miles (97 km) east of Sacramento and 120 miles (193 km) east of San Francisco.
The city is located in the foothills of the Sierra Nevada mountain range, and is surrounded by rolling hills and oak woodlands. The city is located in the Stanislaus National Forest, and is home to several popular recreational areas, including the Pinecrest Lake Recreation Area and the Columbia State Historic Park.
Economy
The economy of Sonora is largely based on tourism and the service industry. The city is home to several popular tourist attractions, including the Columbia State Historic Park, the Tuolumne County Museum, and the Sonora Opera Hall. The city is also home to several wineries and vineyards, and is a popular destination for wine tasting.
The city is also home to several manufacturing and industrial businesses, including a large lumber mill and a paper mill. The city is also home to several retail stores, restaurants, and other businesses.
Demographics
As of the 2010 census, the population of Sonora was 4,903. The racial makeup of the city was 87.3% White, 0.7% African American, 1.2% Native American, 0.7% Asian, 0.1% Pacific Islander, 8.2% from other races, and 2.0% from two or more races. Hispanic or Latino of any race were 18.2% of the population.
The median income for a household in the city was $37,917, and the median income for a family was $45,938. The per capita income for the city was $20,945. About 11.3% of families and 14.2% of the population were below the poverty line, including 19.2% of those under age 18 and 8.2% of those age 65 or over.
Common Questions
What is Per Capita Income in East Sonora?
Per Capita income in East Sonora is $51,280.
What is the Median Family Income in East Sonora?
Median Family Income in East Sonora is $88,462.
What is the Median Household income in East Sonora?
Median Household Income in East Sonora is $73,466.
What is Income or Wage Gap in East Sonora?
Income or Wage Gap in East Sonora is 25.5%.
Women in East Sonora earn 74.5 cents for every dollar earned by a man.
What is Inequality or Gini Index in East Sonora?
Inequality or Gini Index in East Sonora is 0.47.
What is the Total Population of East Sonora?
Total Population of East Sonora is 2,664.
What is the Total Male Population of East Sonora?
Total Male Population of East Sonora is 1,121.
What is the Total Female Population of East Sonora?
Total Female Population of East Sonora is 1,543.
What is the Ratio of Males per 100 Females in East Sonora?
There are 72.65 Males per 100 Females in East Sonora.
What is the Ratio of Females per 100 Males in East Sonora?
There are 137.64 Females per 100 Males in East Sonora.
What is the Median Population Age in East Sonora?
Median Population Age in East Sonora is 61.7 Years.
What is the Average Family Size in East Sonora
Average Family Size in East Sonora is 2.4 People.
What is the Average Household Size in East Sonora
Average Household Size in East Sonora is 1.8 People.
How Large is the Labor Force in East Sonora?
There are 888 People in the Labor Forcein in East Sonora.
What is the Percentage of People in the Labor Force in East Sonora?
37.4% of People are in the Labor Force in East Sonora.