East Rancho Dominguez, CA Map & Demographics
East Rancho Dominguez Map
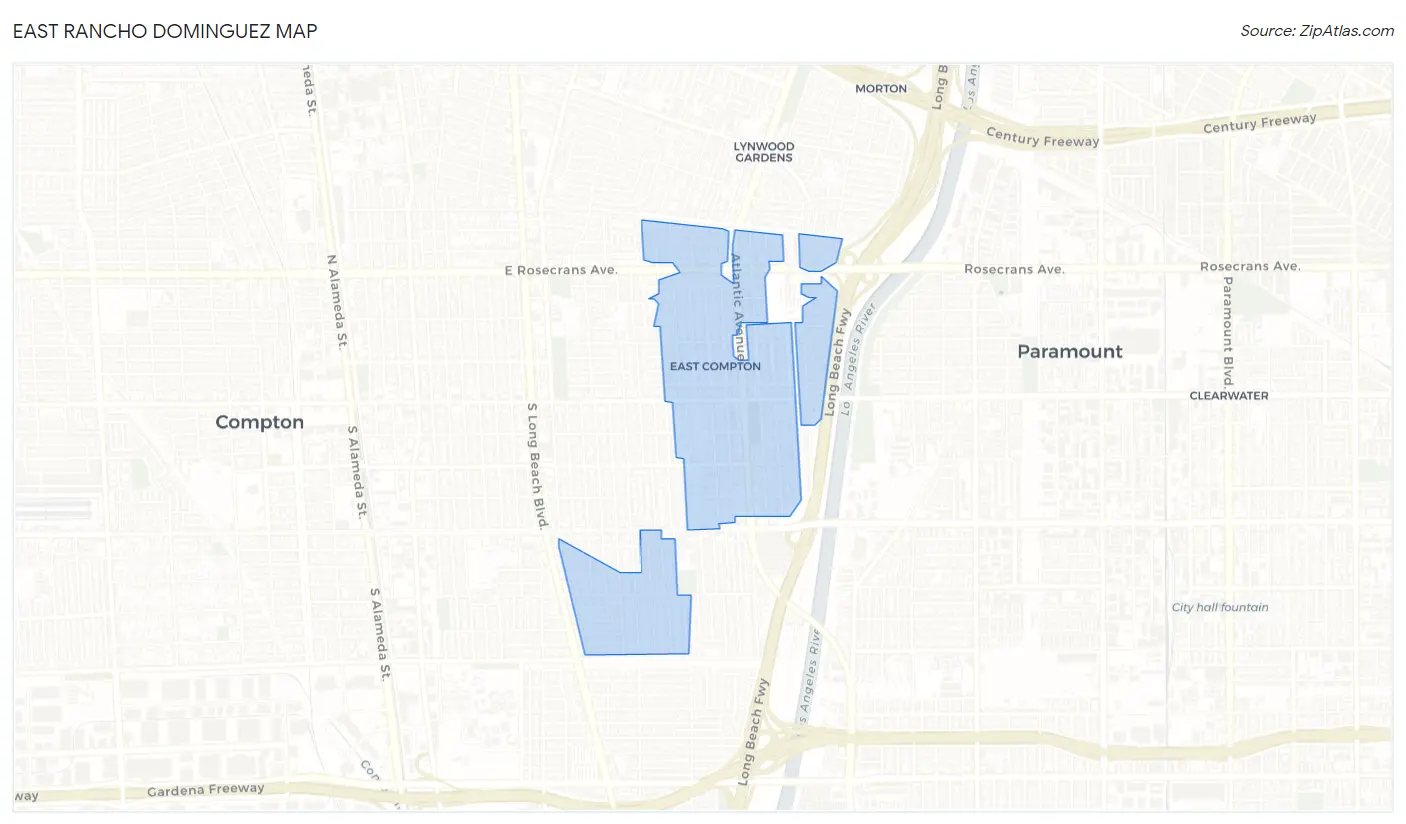
East Rancho Dominguez Overview
$21,024
PER CAPITA INCOME
$69,242
AVG FAMILY INCOME
$64,673
AVG HOUSEHOLD INCOME
11.9%
WAGE / INCOME GAP [ % ]
88.1¢/ $1
WAGE / INCOME GAP [ $ ]
$15,147
FAMILY INCOME DEFICIT
0.45
INEQUALITY / GINI INDEX
14,924
TOTAL POPULATION
7,667
MALE POPULATION
7,257
FEMALE POPULATION
105.65
MALES / 100 FEMALES
94.65
FEMALES / 100 MALES
32.4
MEDIAN AGE
4.7
AVG FAMILY SIZE
4.2
AVG HOUSEHOLD SIZE
7,152
LABOR FORCE [ PEOPLE ]
61.1%
PERCENT IN LABOR FORCE
6.5%
UNEMPLOYMENT RATE
Income in East Rancho Dominguez
Income Overview in East Rancho Dominguez
Per Capita Income in East Rancho Dominguez is $21,024, while median incomes of families and households are $69,242 and $64,673 respectively.
| Characteristic | Number | Measure |
| Per Capita Income | 14,924 | $21,024 |
| Median Family Income | 2,684 | $69,242 |
| Mean Family Income | 2,684 | $84,038 |
| Median Household Income | 3,561 | $64,673 |
| Mean Household Income | 3,561 | $81,878 |
| Income Deficit | 2,684 | $15,147 |
| Wage / Income Gap (%) | 14,924 | 11.94% |
| Wage / Income Gap ($) | 14,924 | 88.06¢ per $1 |
| Gini / Inequality Index | 14,924 | 0.45 |
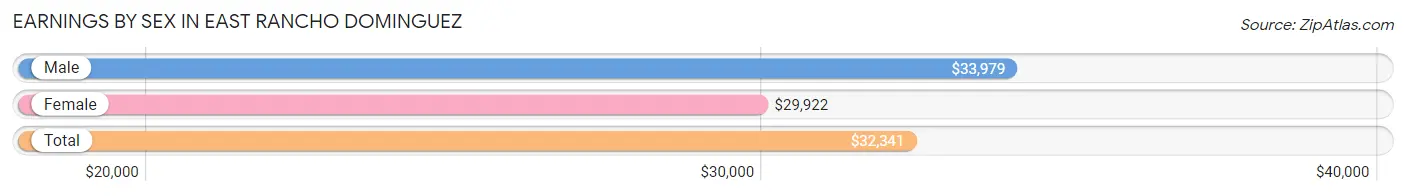
Earnings by Sex in East Rancho Dominguez
Average Earnings in East Rancho Dominguez are $32,341, $33,979 for men and $29,922 for women, a difference of 11.9%.
| Sex | Number | Average Earnings |
| Male | 4,228 (58.5%) | $33,979 |
| Female | 2,995 (41.5%) | $29,922 |
| Total | 7,223 (100.0%) | $32,341 |
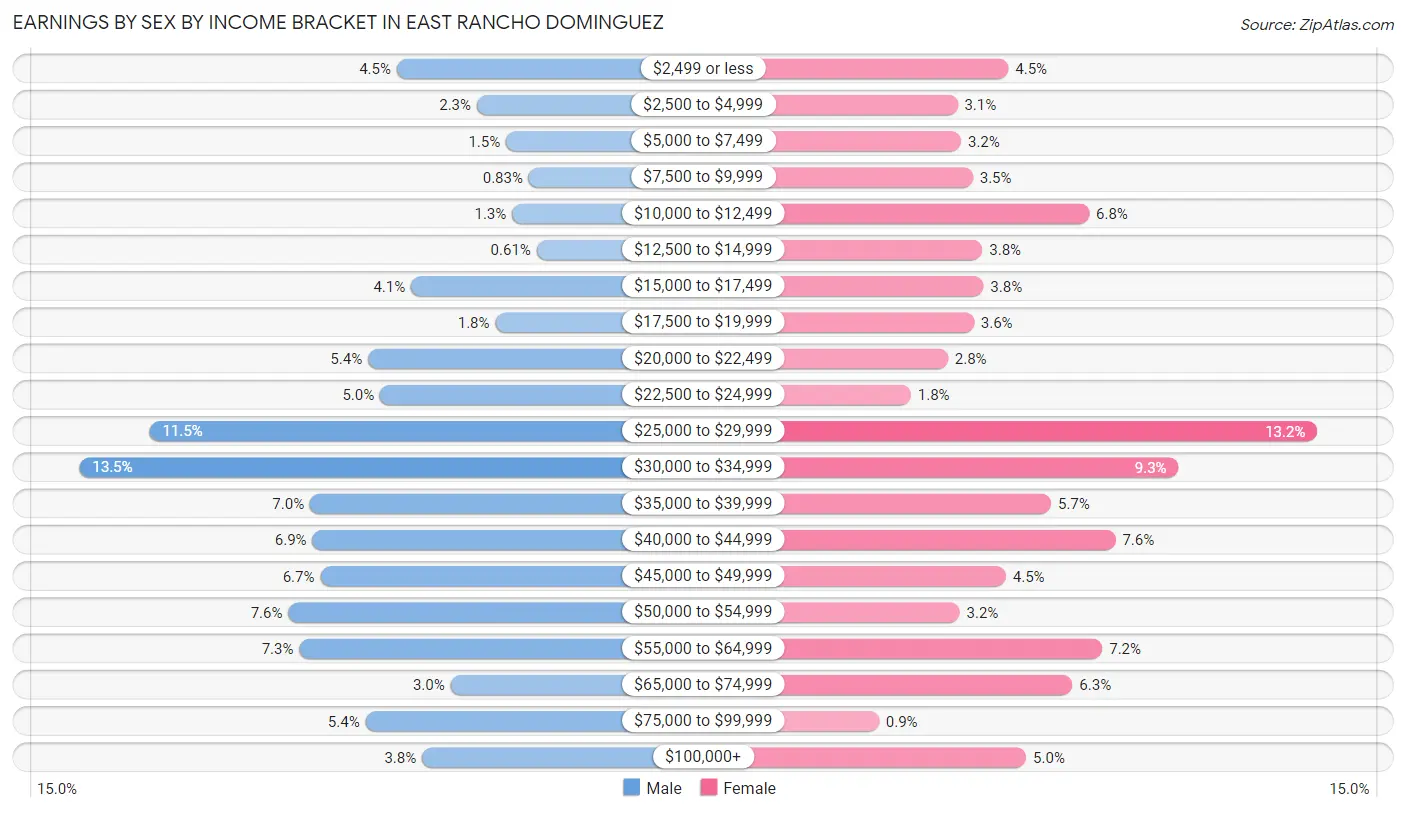
Earnings by Sex by Income Bracket in East Rancho Dominguez
The most common earnings brackets in East Rancho Dominguez are $30,000 to $34,999 for men (569 | 13.5%) and $25,000 to $29,999 for women (396 | 13.2%).
| Income | Male | Female |
| $2,499 or less | 192 (4.5%) | 136 (4.5%) |
| $2,500 to $4,999 | 97 (2.3%) | 93 (3.1%) |
| $5,000 to $7,499 | 62 (1.5%) | 96 (3.2%) |
| $7,500 to $9,999 | 35 (0.8%) | 106 (3.5%) |
| $10,000 to $12,499 | 55 (1.3%) | 204 (6.8%) |
| $12,500 to $14,999 | 26 (0.6%) | 114 (3.8%) |
| $15,000 to $17,499 | 175 (4.1%) | 115 (3.8%) |
| $17,500 to $19,999 | 75 (1.8%) | 107 (3.6%) |
| $20,000 to $22,499 | 226 (5.3%) | 85 (2.8%) |
| $22,500 to $24,999 | 212 (5.0%) | 54 (1.8%) |
| $25,000 to $29,999 | 486 (11.5%) | 396 (13.2%) |
| $30,000 to $34,999 | 569 (13.5%) | 279 (9.3%) |
| $35,000 to $39,999 | 295 (7.0%) | 172 (5.7%) |
| $40,000 to $44,999 | 292 (6.9%) | 226 (7.5%) |
| $45,000 to $49,999 | 283 (6.7%) | 134 (4.5%) |
| $50,000 to $54,999 | 321 (7.6%) | 95 (3.2%) |
| $55,000 to $64,999 | 308 (7.3%) | 215 (7.2%) |
| $65,000 to $74,999 | 128 (3.0%) | 190 (6.3%) |
| $75,000 to $99,999 | 229 (5.4%) | 27 (0.9%) |
| $100,000+ | 162 (3.8%) | 151 (5.0%) |
| Total | 4,228 (100.0%) | 2,995 (100.0%) |
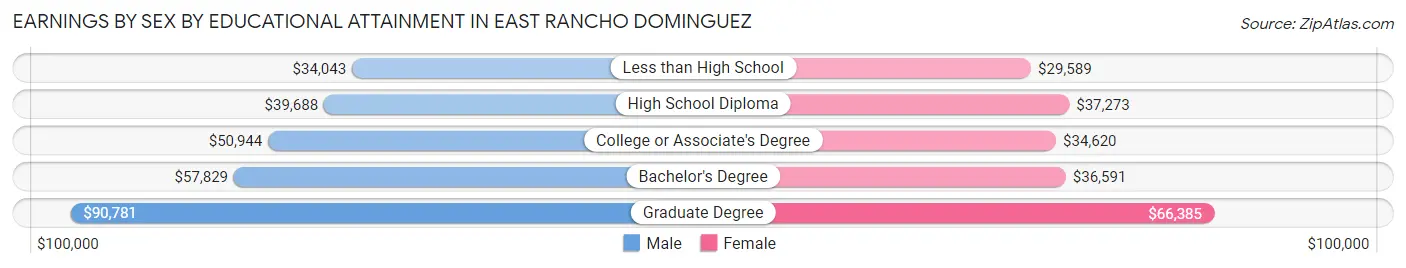
Earnings by Sex by Educational Attainment in East Rancho Dominguez
Average earnings in East Rancho Dominguez are $38,922 for men and $32,524 for women, a difference of 16.4%. Men with an educational attainment of graduate degree enjoy the highest average annual earnings of $90,781, while those with less than high school education earn the least with $34,043. Women with an educational attainment of graduate degree earn the most with the average annual earnings of $66,385, while those with less than high school education have the smallest earnings of $29,589.
| Educational Attainment | Male Income | Female Income |
| Less than High School | $34,043 | $29,589 |
| High School Diploma | $39,688 | $37,273 |
| College or Associate's Degree | $50,944 | $34,620 |
| Bachelor's Degree | $57,829 | $36,591 |
| Graduate Degree | $90,781 | $66,385 |
| Total | $38,922 | $32,524 |
Family Income in East Rancho Dominguez
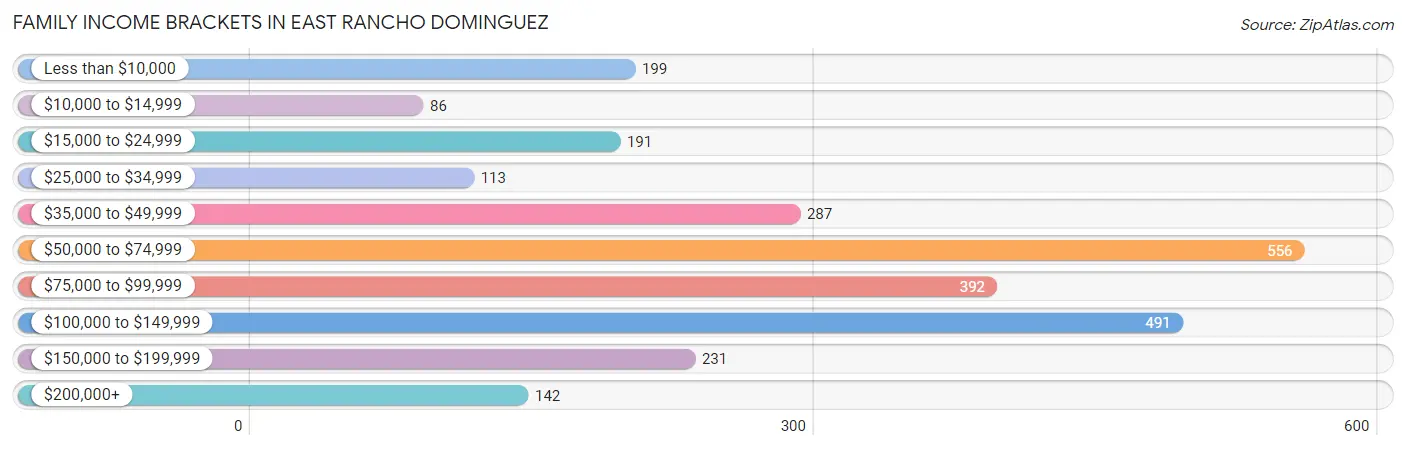
Family Income Brackets in East Rancho Dominguez
According to the East Rancho Dominguez family income data, there are 556 families falling into the $50,000 to $74,999 income range, which is the most common income bracket and makes up 20.7% of all families. Conversely, the $10,000 to $14,999 income bracket is the least frequent group with only 86 families (3.2%) belonging to this category.
| Income Bracket | # Families | % Families |
| Less than $10,000 | 199 | 7.4% |
| $10,000 to $14,999 | 86 | 3.2% |
| $15,000 to $24,999 | 191 | 7.1% |
| $25,000 to $34,999 | 113 | 4.2% |
| $35,000 to $49,999 | 287 | 10.7% |
| $50,000 to $74,999 | 556 | 20.7% |
| $75,000 to $99,999 | 392 | 14.6% |
| $100,000 to $149,999 | 491 | 18.3% |
| $150,000 to $199,999 | 231 | 8.6% |
| $200,000+ | 142 | 5.3% |
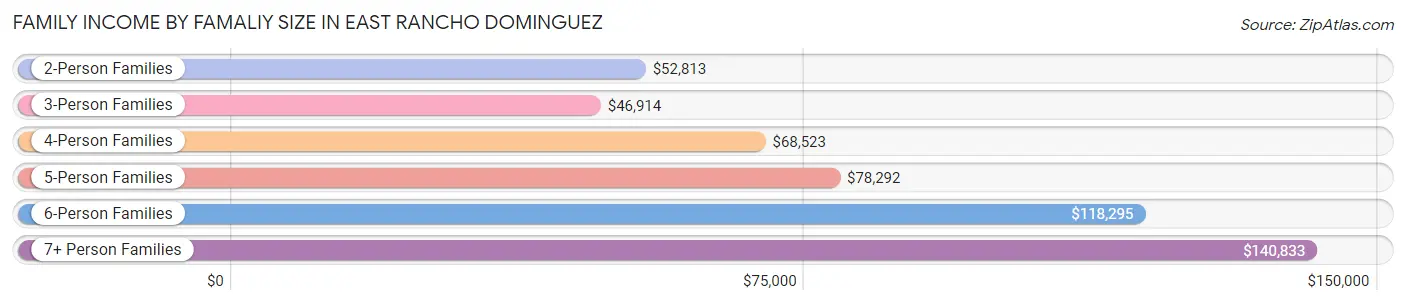
Family Income by Famaliy Size in East Rancho Dominguez
7+ person families (388 | 14.5%) account for the highest median family income in East Rancho Dominguez with $140,833 per family, while 2-person families (654 | 24.4%) have the highest median income of $26,406 per family member.
| Income Bracket | # Families | Median Income |
| 2-Person Families | 654 (24.4%) | $52,813 |
| 3-Person Families | 385 (14.3%) | $46,914 |
| 4-Person Families | 489 (18.2%) | $68,523 |
| 5-Person Families | 507 (18.9%) | $78,292 |
| 6-Person Families | 261 (9.7%) | $118,295 |
| 7+ Person Families | 388 (14.5%) | $140,833 |
| Total | 2,684 (100.0%) | $69,242 |
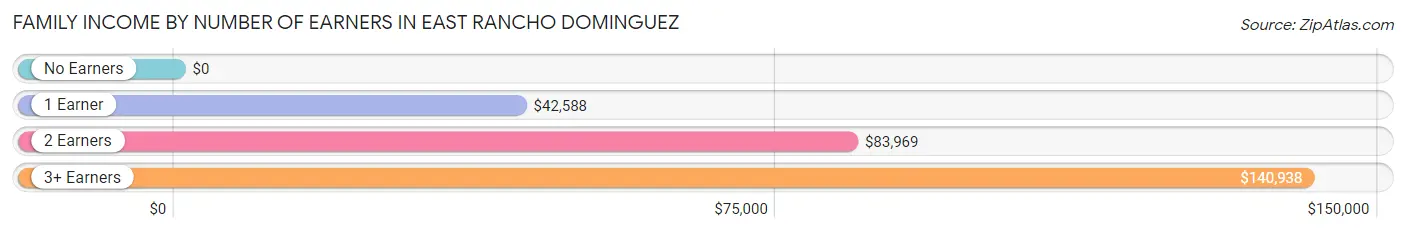
Family Income by Number of Earners in East Rancho Dominguez
| Number of Earners | # Families | Median Income |
| No Earners | 295 (11.0%) | $0 |
| 1 Earner | 844 (31.5%) | $42,588 |
| 2 Earners | 773 (28.8%) | $83,969 |
| 3+ Earners | 772 (28.8%) | $140,938 |
| Total | 2,684 (100.0%) | $69,242 |
Household Income in East Rancho Dominguez
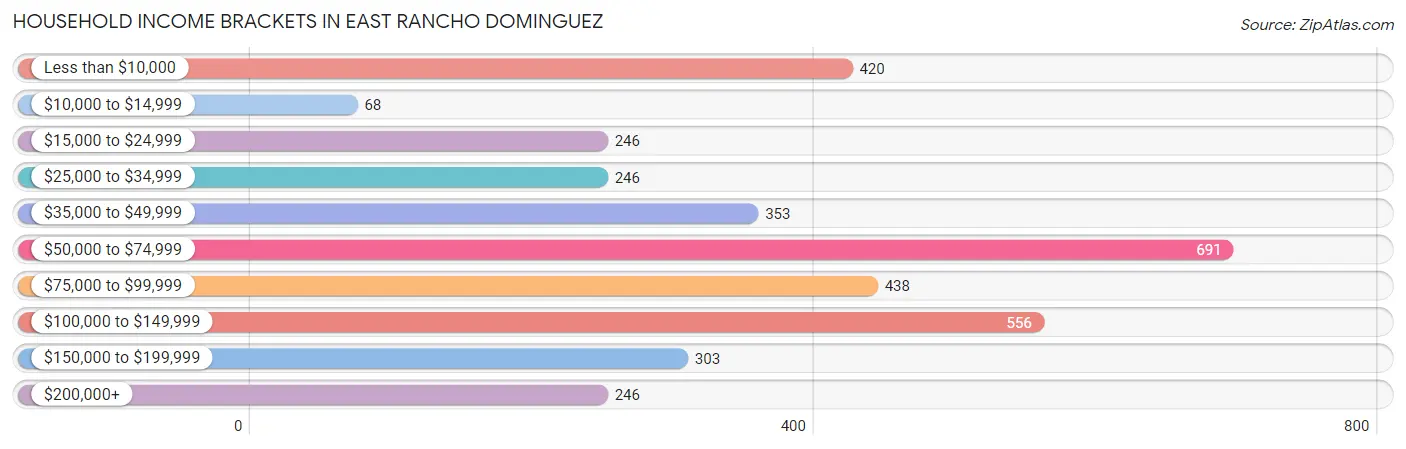
Household Income Brackets in East Rancho Dominguez
With 691 households falling in the category, the $50,000 to $74,999 income range is the most frequent in East Rancho Dominguez, accounting for 19.4% of all households. In contrast, only 68 households (1.9%) fall into the $10,000 to $14,999 income bracket, making it the least populous group.
| Income Bracket | # Households | % Households |
| Less than $10,000 | 420 | 11.8% |
| $10,000 to $14,999 | 68 | 1.9% |
| $15,000 to $24,999 | 246 | 6.9% |
| $25,000 to $34,999 | 246 | 6.9% |
| $35,000 to $49,999 | 353 | 9.9% |
| $50,000 to $74,999 | 691 | 19.4% |
| $75,000 to $99,999 | 438 | 12.3% |
| $100,000 to $149,999 | 556 | 15.6% |
| $150,000 to $199,999 | 303 | 8.5% |
| $200,000+ | 246 | 6.9% |
Household Income by Householder Age in East Rancho Dominguez
The median household income in East Rancho Dominguez is $64,673, with the highest median household income of $73,095 found in the 45 to 64 years age bracket for the primary householder. A total of 1,858 households (52.2%) fall into this category. Meanwhile, the 15 to 24 years age bracket for the primary householder has the lowest median household income of $0, with 78 households (2.2%) in this group.
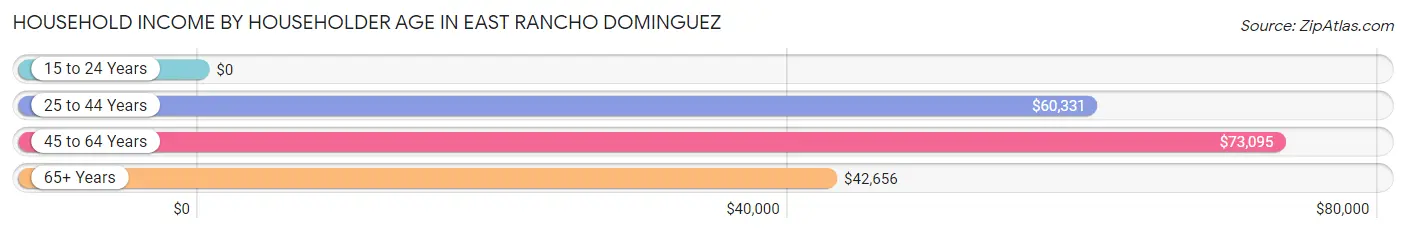
| Income Bracket | # Households | Median Income |
| 15 to 24 Years | 78 (2.2%) | $0 |
| 25 to 44 Years | 953 (26.8%) | $60,331 |
| 45 to 64 Years | 1,858 (52.2%) | $73,095 |
| 65+ Years | 672 (18.9%) | $42,656 |
| Total | 3,561 (100.0%) | $64,673 |
Poverty in East Rancho Dominguez
Income Below Poverty by Sex and Age in East Rancho Dominguez
With 16.7% poverty level for males and 20.4% for females among the residents of East Rancho Dominguez, 5 year old males and 5 year old females are the most vulnerable to poverty, with 40 males (63.5%) and 17 females (46.0%) in their respective age groups living below the poverty level.
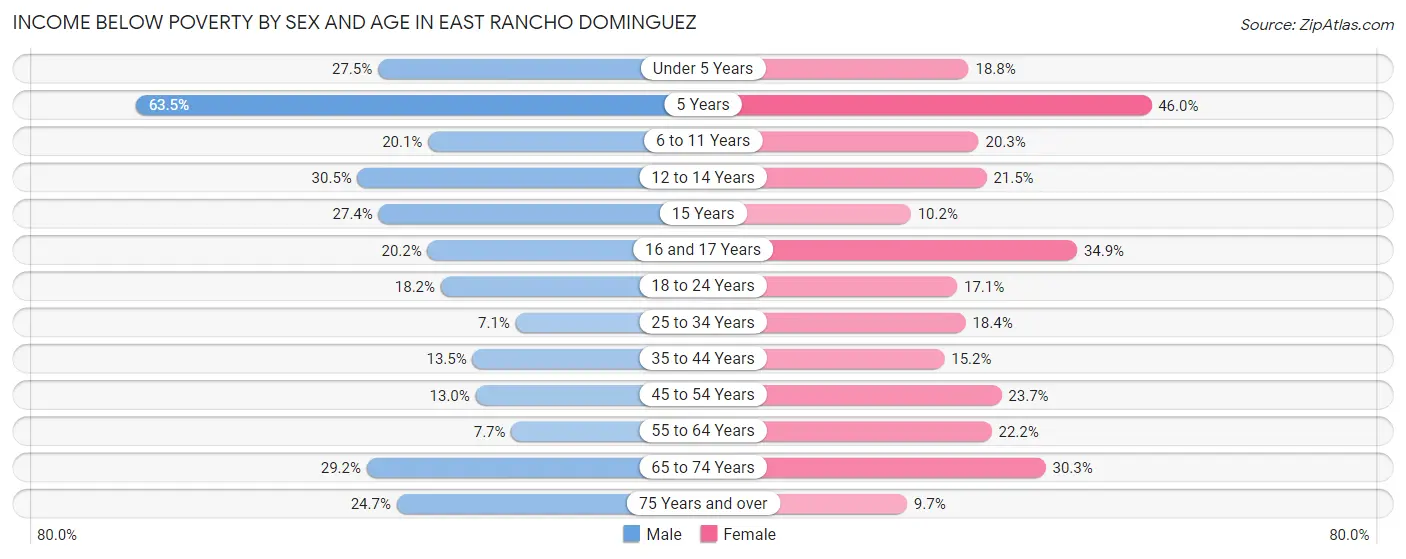
| Age Bracket | Male | Female |
| Under 5 Years | 90 (27.5%) | 64 (18.8%) |
| 5 Years | 40 (63.5%) | 17 (46.0%) |
| 6 to 11 Years | 108 (20.1%) | 106 (20.3%) |
| 12 to 14 Years | 157 (30.5%) | 96 (21.5%) |
| 15 Years | 31 (27.4%) | 13 (10.2%) |
| 16 and 17 Years | 52 (20.2%) | 139 (34.9%) |
| 18 to 24 Years | 205 (18.2%) | 108 (17.1%) |
| 25 to 34 Years | 85 (7.1%) | 205 (18.4%) |
| 35 to 44 Years | 143 (13.5%) | 140 (15.2%) |
| 45 to 54 Years | 122 (13.0%) | 209 (23.7%) |
| 55 to 64 Years | 62 (7.7%) | 248 (22.2%) |
| 65 to 74 Years | 122 (29.2%) | 85 (30.2%) |
| 75 Years and over | 47 (24.7%) | 35 (9.7%) |
| Total | 1,264 (16.7%) | 1,465 (20.4%) |
Income Above Poverty by Sex and Age in East Rancho Dominguez
According to the poverty statistics in East Rancho Dominguez, males aged 25 to 34 years and females aged 75 years and over are the age groups that are most secure financially, with 92.9% of males and 90.3% of females in these age groups living above the poverty line.
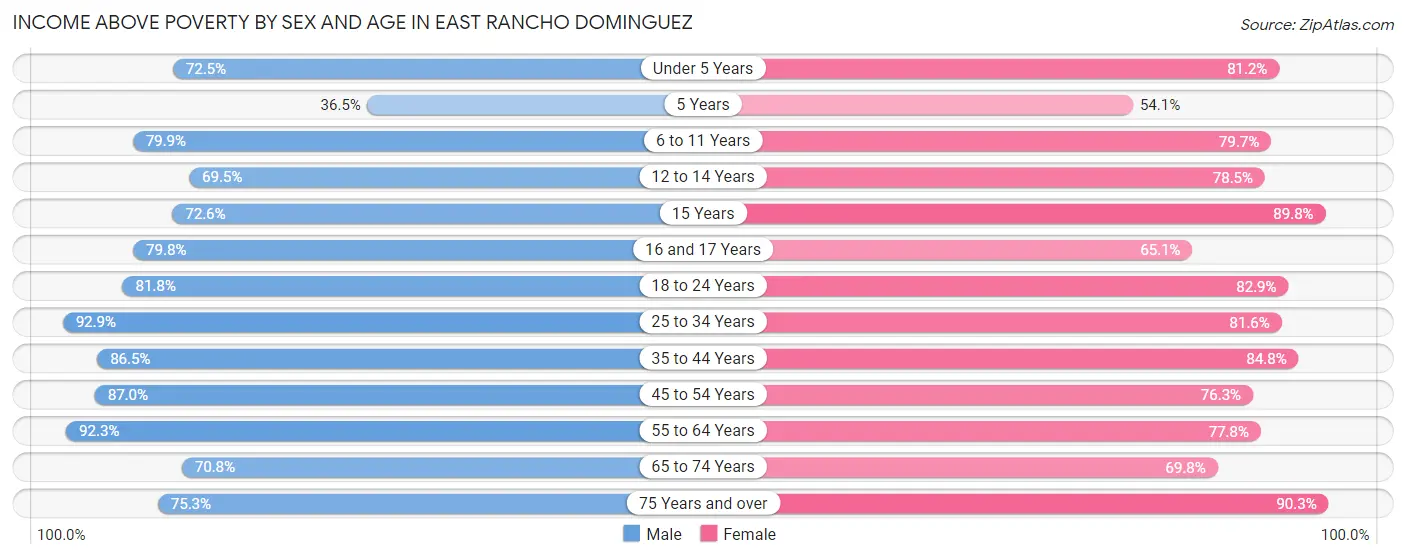
| Age Bracket | Male | Female |
| Under 5 Years | 237 (72.5%) | 276 (81.2%) |
| 5 Years | 23 (36.5%) | 20 (54.0%) |
| 6 to 11 Years | 430 (79.9%) | 416 (79.7%) |
| 12 to 14 Years | 357 (69.5%) | 351 (78.5%) |
| 15 Years | 82 (72.6%) | 114 (89.8%) |
| 16 and 17 Years | 206 (79.8%) | 259 (65.1%) |
| 18 to 24 Years | 922 (81.8%) | 523 (82.9%) |
| 25 to 34 Years | 1,116 (92.9%) | 911 (81.6%) |
| 35 to 44 Years | 918 (86.5%) | 780 (84.8%) |
| 45 to 54 Years | 814 (87.0%) | 673 (76.3%) |
| 55 to 64 Years | 741 (92.3%) | 867 (77.8%) |
| 65 to 74 Years | 296 (70.8%) | 196 (69.8%) |
| 75 Years and over | 143 (75.3%) | 327 (90.3%) |
| Total | 6,285 (83.3%) | 5,713 (79.6%) |
Income Below Poverty Among Married-Couple Families in East Rancho Dominguez
The poverty statistics for married-couple families in East Rancho Dominguez show that 11.6% or 183 of the total 1,576 families live below the poverty line. Families with 3 or 4 children have the highest poverty rate of 28.7%, comprising of 80 families. On the other hand, families with 1 or 2 children have the lowest poverty rate of 3.3%, which includes 22 families.
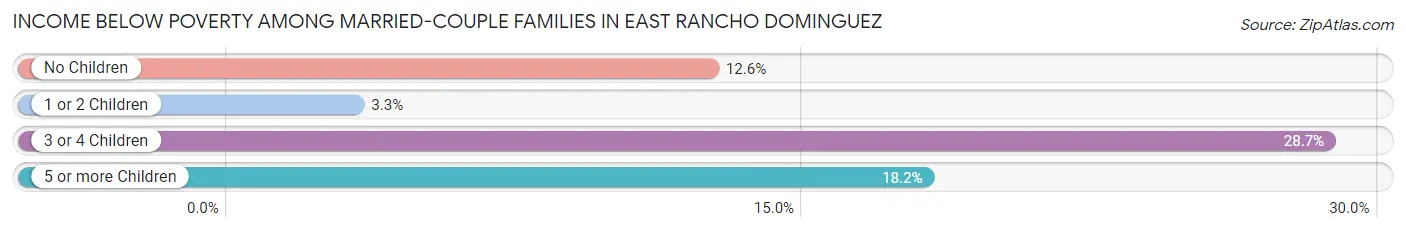
| Children | Above Poverty | Below Poverty |
| No Children | 522 (87.4%) | 75 (12.6%) |
| 1 or 2 Children | 645 (96.7%) | 22 (3.3%) |
| 3 or 4 Children | 199 (71.3%) | 80 (28.7%) |
| 5 or more Children | 27 (81.8%) | 6 (18.2%) |
| Total | 1,393 (88.4%) | 183 (11.6%) |
Income Below Poverty Among Single-Parent Households in East Rancho Dominguez
According to the poverty data in East Rancho Dominguez, 18.5% or 66 single-father households and 32.3% or 243 single-mother households are living below the poverty line. Among single-father households, those with 3 or 4 children have the highest poverty rate, with 62 households (68.9%) experiencing poverty. Likewise, among single-mother households, those with 3 or 4 children have the highest poverty rate, with 59 households (44.0%) falling below the poverty line.
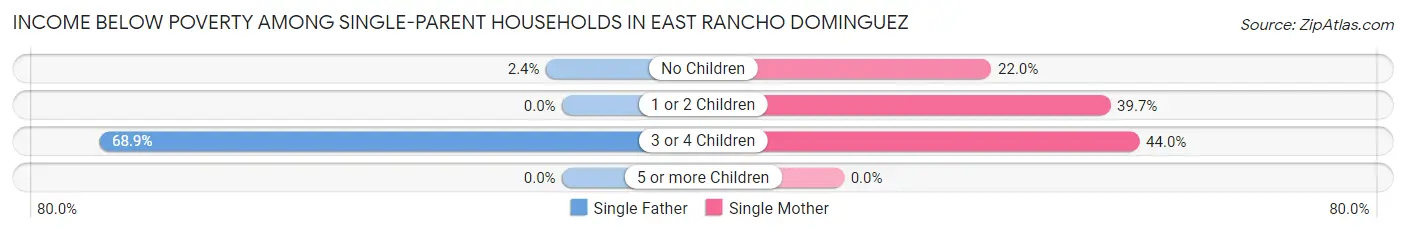
| Children | Single Father | Single Mother |
| No Children | 4 (2.4%) | 76 (22.0%) |
| 1 or 2 Children | 0 (0.0%) | 108 (39.7%) |
| 3 or 4 Children | 62 (68.9%) | 59 (44.0%) |
| 5 or more Children | 0 (0.0%) | 0 (0.0%) |
| Total | 66 (18.5%) | 243 (32.3%) |
Income Below Poverty Among Married-Couple vs Single-Parent Households in East Rancho Dominguez
The poverty data for East Rancho Dominguez shows that 183 of the married-couple family households (11.6%) and 309 of the single-parent households (27.9%) are living below the poverty level. Within the married-couple family households, those with 3 or 4 children have the highest poverty rate, with 80 households (28.7%) falling below the poverty line. Among the single-parent households, those with 3 or 4 children have the highest poverty rate, with 121 household (54.0%) living below poverty.
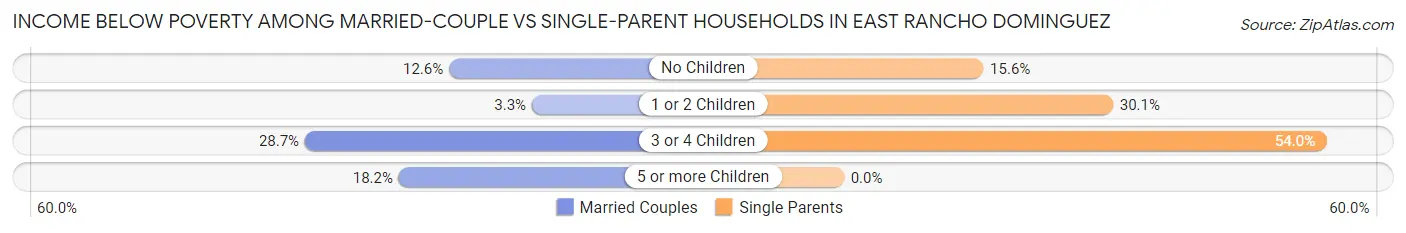
| Children | Married-Couple Families | Single-Parent Households |
| No Children | 75 (12.6%) | 80 (15.6%) |
| 1 or 2 Children | 22 (3.3%) | 108 (30.1%) |
| 3 or 4 Children | 80 (28.7%) | 121 (54.0%) |
| 5 or more Children | 6 (18.2%) | 0 (0.0%) |
| Total | 183 (11.6%) | 309 (27.9%) |
Race in East Rancho Dominguez
The most populous races in East Rancho Dominguez are Hispanic or Latino (12,475 | 83.6%), Some other Race (4,954 | 33.2%), and Two or more Races (4,756 | 31.9%).
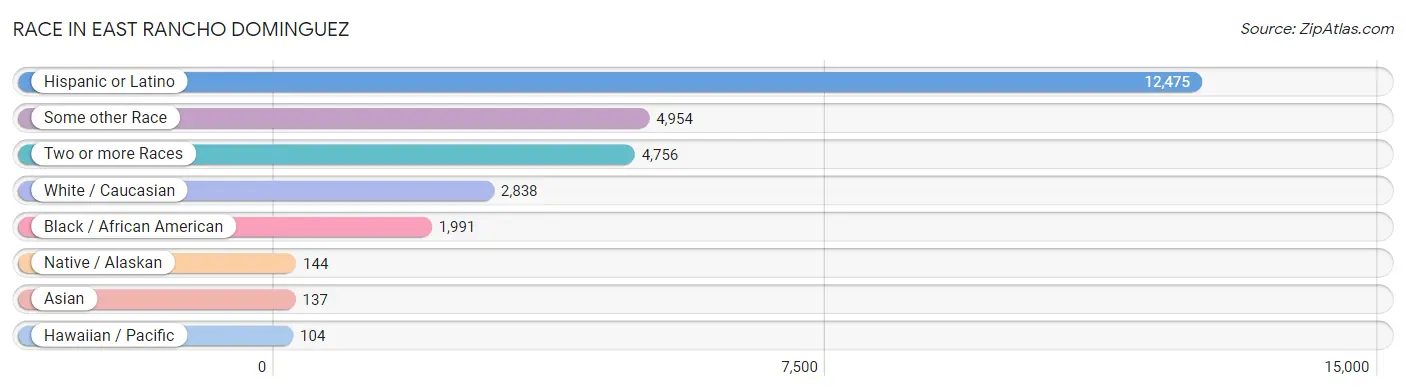
| Race | # Population | % Population |
| Asian | 137 | 0.9% |
| Black / African American | 1,991 | 13.3% |
| Hawaiian / Pacific | 104 | 0.7% |
| Hispanic or Latino | 12,475 | 83.6% |
| Native / Alaskan | 144 | 1.0% |
| White / Caucasian | 2,838 | 19.0% |
| Two or more Races | 4,756 | 31.9% |
| Some other Race | 4,954 | 33.2% |
| Total | 14,924 | 100.0% |
Ancestry in East Rancho Dominguez
The most populous ancestries reported in East Rancho Dominguez are Mexican (10,962 | 73.5%), Central American (950 | 6.4%), Salvadoran (443 | 3.0%), Guatemalan (285 | 1.9%), and American (245 | 1.6%), together accounting for 86.3% of all East Rancho Dominguez residents.
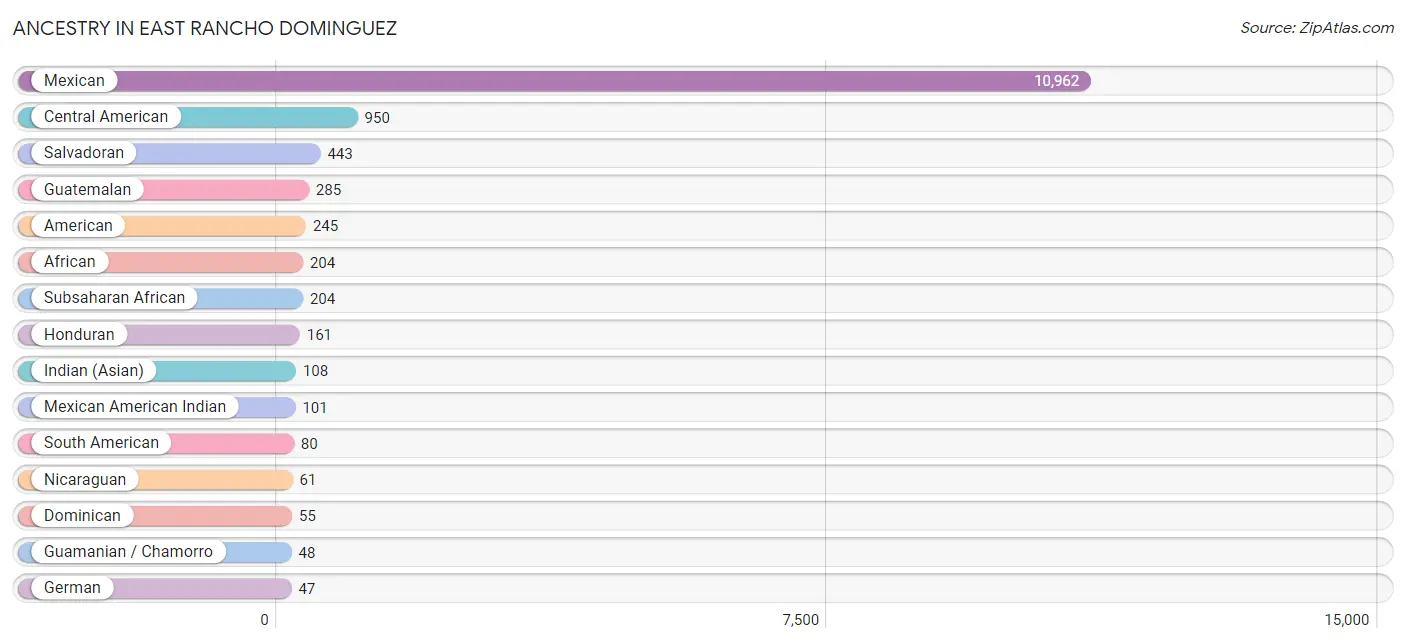
| Ancestry | # Population | % Population |
| African | 204 | 1.4% |
| American | 245 | 1.6% |
| Apache | 11 | 0.1% |
| Argentinean | 18 | 0.1% |
| Belgian | 1 | 0.0% |
| Bhutanese | 11 | 0.1% |
| Burmese | 3 | 0.0% |
| Central American | 950 | 6.4% |
| Colombian | 39 | 0.3% |
| Cuban | 9 | 0.1% |
| Dominican | 55 | 0.4% |
| English | 6 | 0.0% |
| European | 2 | 0.0% |
| French | 9 | 0.1% |
| German | 47 | 0.3% |
| Guamanian / Chamorro | 48 | 0.3% |
| Guatemalan | 285 | 1.9% |
| Honduran | 161 | 1.1% |
| Hungarian | 5 | 0.0% |
| Indian (Asian) | 108 | 0.7% |
| Irish | 36 | 0.2% |
| Iroquois | 6 | 0.0% |
| Italian | 29 | 0.2% |
| Jamaican | 44 | 0.3% |
| Korean | 17 | 0.1% |
| Mexican | 10,962 | 73.5% |
| Mexican American Indian | 101 | 0.7% |
| Navajo | 1 | 0.0% |
| Nicaraguan | 61 | 0.4% |
| Norwegian | 8 | 0.1% |
| Peruvian | 23 | 0.2% |
| Puerto Rican | 31 | 0.2% |
| Salvadoran | 443 | 3.0% |
| Samoan | 46 | 0.3% |
| South American | 80 | 0.5% |
| South American Indian | 19 | 0.1% |
| Spaniard | 22 | 0.2% |
| Spanish | 21 | 0.1% |
| Sri Lankan | 2 | 0.0% |
| Subsaharan African | 204 | 1.4% |
| Thai | 8 | 0.1% |
| Tongan | 47 | 0.3% |
| Trinidadian and Tobagonian | 2 | 0.0% | View All 43 Rows |
Immigrants in East Rancho Dominguez
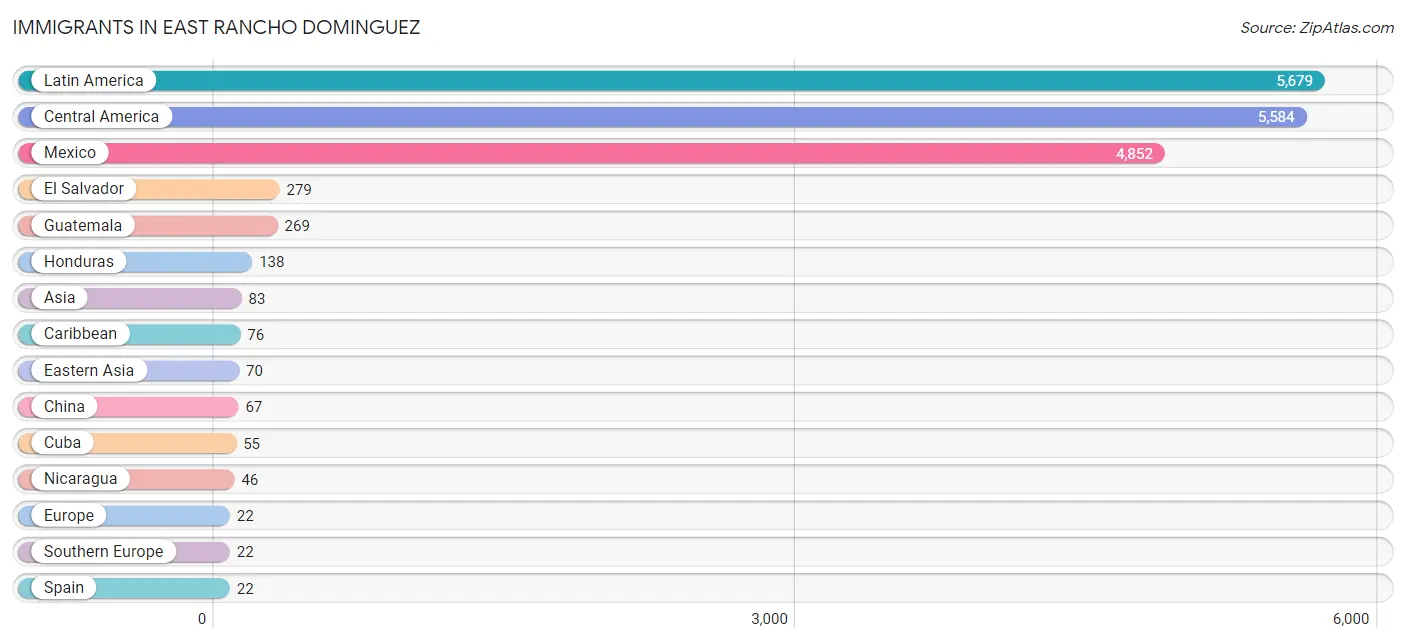
The most numerous immigrant groups reported in East Rancho Dominguez came from Latin America (5,679 | 38.1%), Central America (5,584 | 37.4%), Mexico (4,852 | 32.5%), El Salvador (279 | 1.9%), and Guatemala (269 | 1.8%), together accounting for 111.6% of all East Rancho Dominguez residents.
| Immigration Origin | # Population | % Population |
| Asia | 83 | 0.6% |
| Caribbean | 76 | 0.5% |
| Central America | 5,584 | 37.4% |
| China | 67 | 0.4% |
| Colombia | 19 | 0.1% |
| Cuba | 55 | 0.4% |
| Dominican Republic | 11 | 0.1% |
| Eastern Asia | 70 | 0.5% |
| El Salvador | 279 | 1.9% |
| Europe | 22 | 0.2% |
| Guatemala | 269 | 1.8% |
| Honduras | 138 | 0.9% |
| Jamaica | 10 | 0.1% |
| Korea | 3 | 0.0% |
| Latin America | 5,679 | 38.1% |
| Mexico | 4,852 | 32.5% |
| Nicaragua | 46 | 0.3% |
| Philippines | 11 | 0.1% |
| South America | 19 | 0.1% |
| South Eastern Asia | 13 | 0.1% |
| Southern Europe | 22 | 0.2% |
| Spain | 22 | 0.2% |
| Vietnam | 2 | 0.0% | View All 23 Rows |
Sex and Age in East Rancho Dominguez
Sex and Age in East Rancho Dominguez
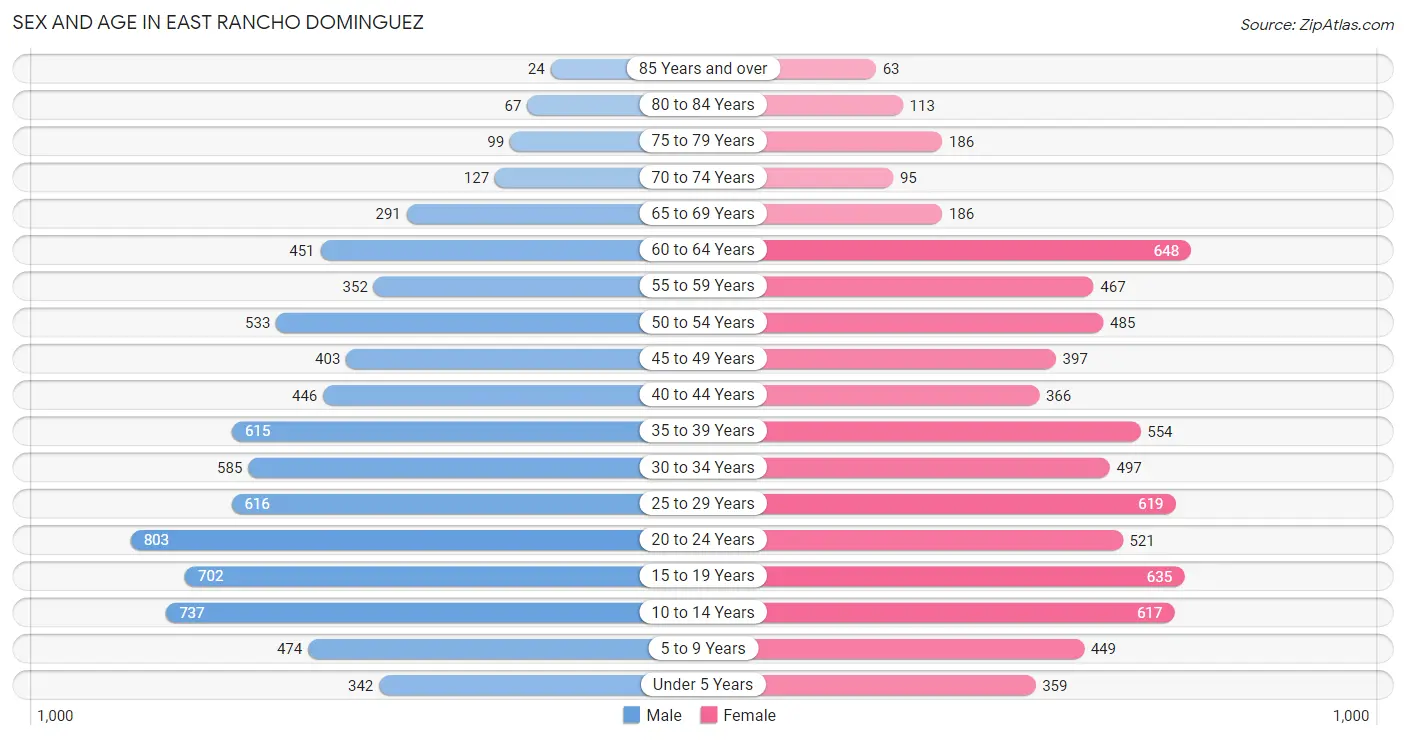
The most populous age groups in East Rancho Dominguez are 20 to 24 Years (803 | 10.5%) for men and 60 to 64 Years (648 | 8.9%) for women.
| Age Bracket | Male | Female |
| Under 5 Years | 342 (4.5%) | 359 (5.0%) |
| 5 to 9 Years | 474 (6.2%) | 449 (6.2%) |
| 10 to 14 Years | 737 (9.6%) | 617 (8.5%) |
| 15 to 19 Years | 702 (9.2%) | 635 (8.7%) |
| 20 to 24 Years | 803 (10.5%) | 521 (7.2%) |
| 25 to 29 Years | 616 (8.0%) | 619 (8.5%) |
| 30 to 34 Years | 585 (7.6%) | 497 (6.9%) |
| 35 to 39 Years | 615 (8.0%) | 554 (7.6%) |
| 40 to 44 Years | 446 (5.8%) | 366 (5.0%) |
| 45 to 49 Years | 403 (5.3%) | 397 (5.5%) |
| 50 to 54 Years | 533 (7.0%) | 485 (6.7%) |
| 55 to 59 Years | 352 (4.6%) | 467 (6.4%) |
| 60 to 64 Years | 451 (5.9%) | 648 (8.9%) |
| 65 to 69 Years | 291 (3.8%) | 186 (2.6%) |
| 70 to 74 Years | 127 (1.7%) | 95 (1.3%) |
| 75 to 79 Years | 99 (1.3%) | 186 (2.6%) |
| 80 to 84 Years | 67 (0.9%) | 113 (1.6%) |
| 85 Years and over | 24 (0.3%) | 63 (0.9%) |
| Total | 7,667 (100.0%) | 7,257 (100.0%) |
Families and Households in East Rancho Dominguez
Median Family Size in East Rancho Dominguez
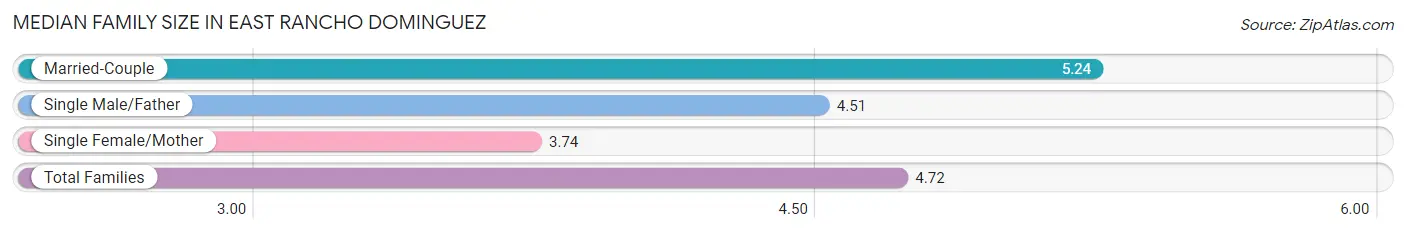
The median family size in East Rancho Dominguez is 4.72 persons per family, with married-couple families (1,576 | 58.7%) accounting for the largest median family size of 5.24 persons per family. On the other hand, single female/mother families (752 | 28.0%) represent the smallest median family size with 3.74 persons per family.
| Family Type | # Families | Family Size |
| Married-Couple | 1,576 (58.7%) | 5.24 |
| Single Male/Father | 356 (13.3%) | 4.51 |
| Single Female/Mother | 752 (28.0%) | 3.74 |
| Total Families | 2,684 (100.0%) | 4.72 |
Median Household Size in East Rancho Dominguez
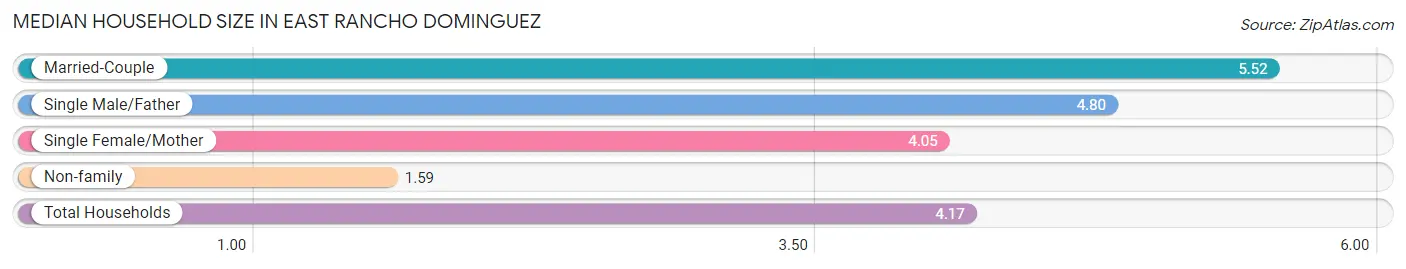
The median household size in East Rancho Dominguez is 4.17 persons per household, with married-couple households (1,576 | 44.3%) accounting for the largest median household size of 5.52 persons per household. non-family households (877 | 24.6%) represent the smallest median household size with 1.59 persons per household.
| Household Type | # Households | Household Size |
| Married-Couple | 1,576 (44.3%) | 5.52 |
| Single Male/Father | 356 (10.0%) | 4.80 |
| Single Female/Mother | 752 (21.1%) | 4.05 |
| Non-family | 877 (24.6%) | 1.59 |
| Total Households | 3,561 (100.0%) | 4.17 |
Household Size by Marriage Status in East Rancho Dominguez
Out of a total of 3,561 households in East Rancho Dominguez, 2,684 (75.4%) are family households, while 877 (24.6%) are nonfamily households. The most numerous type of family households are 5-person households, comprising 559, and the most common type of nonfamily households are 1-person households, comprising 708.
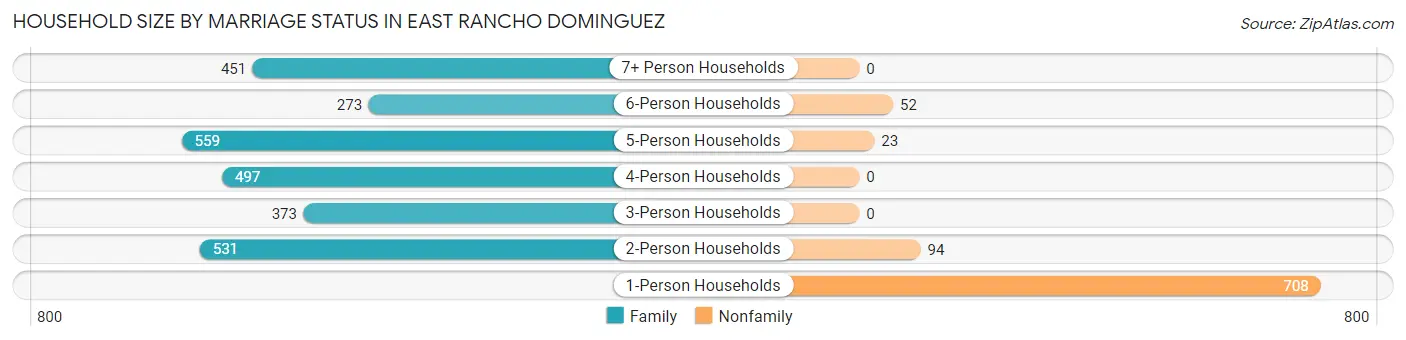
| Household Size | Family Households | Nonfamily Households |
| 1-Person Households | - | 708 (19.9%) |
| 2-Person Households | 531 (14.9%) | 94 (2.6%) |
| 3-Person Households | 373 (10.5%) | 0 (0.0%) |
| 4-Person Households | 497 (14.0%) | 0 (0.0%) |
| 5-Person Households | 559 (15.7%) | 23 (0.6%) |
| 6-Person Households | 273 (7.7%) | 52 (1.5%) |
| 7+ Person Households | 451 (12.7%) | 0 (0.0%) |
| Total | 2,684 (75.4%) | 877 (24.6%) |
Female Fertility in East Rancho Dominguez
Fertility by Age in East Rancho Dominguez
Average fertility rate in East Rancho Dominguez is 49.0 births per 1,000 women. Women in the age bracket of 35 to 50 years have the highest fertility rate with 71.0 births per 1,000 women. Women in the age bracket of 35 to 50 years acount for 56.4% of all women with births.
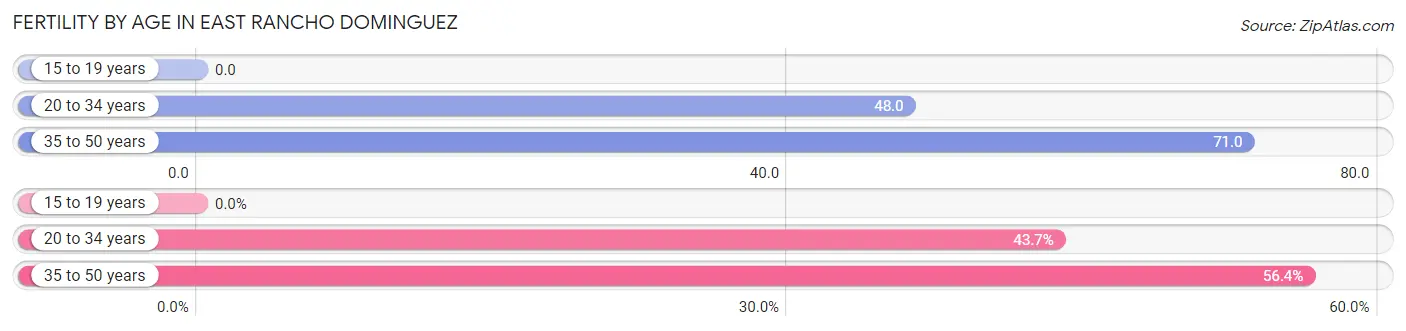
| Age Bracket | Women with Births | Births / 1,000 Women |
| 15 to 19 years | 0 (0.0%) | 0.0 |
| 20 to 34 years | 79 (43.6%) | 48.0 |
| 35 to 50 years | 102 (56.4%) | 71.0 |
| Total | 181 (100.0%) | 49.0 |
Fertility by Age by Marriage Status in East Rancho Dominguez
61.9% of women with births (181) in East Rancho Dominguez are married. The highest percentage of unmarried women with births falls into 20 to 34 years age bracket with 54.4% of them unmarried at the time of birth, while the lowest percentage of unmarried women with births belong to 35 to 50 years age bracket with 25.5% of them unmarried.
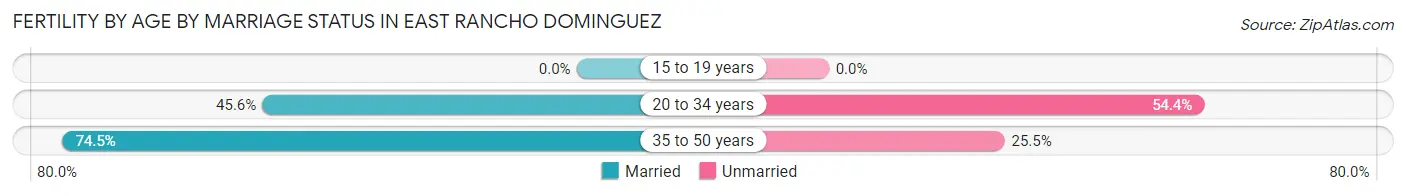
| Age Bracket | Married | Unmarried |
| 15 to 19 years | 0 (0.0%) | 0 (0.0%) |
| 20 to 34 years | 36 (45.6%) | 43 (54.4%) |
| 35 to 50 years | 76 (74.5%) | 26 (25.5%) |
| Total | 112 (61.9%) | 69 (38.1%) |
Fertility by Education in East Rancho Dominguez
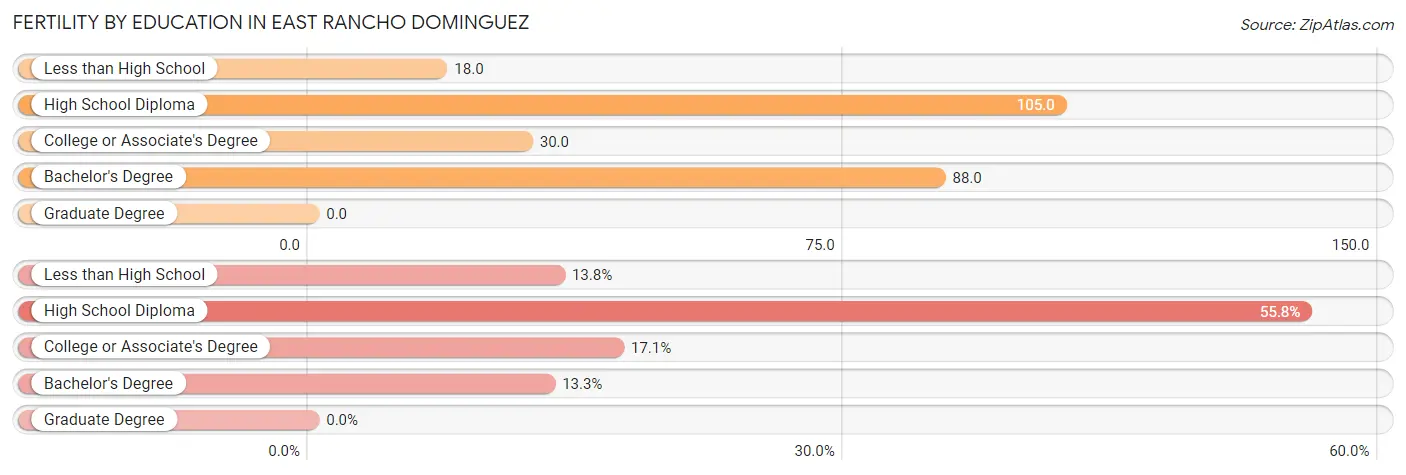
| Educational Attainment | Women with Births | Births / 1,000 Women |
| Less than High School | 25 (13.8%) | 18.0 |
| High School Diploma | 101 (55.8%) | 105.0 |
| College or Associate's Degree | 31 (17.1%) | 30.0 |
| Bachelor's Degree | 24 (13.3%) | 88.0 |
| Graduate Degree | 0 (0.0%) | 0.0 |
| Total | 181 (100.0%) | 49.0 |
Fertility by Education by Marriage Status in East Rancho Dominguez
38.1% of women with births in East Rancho Dominguez are unmarried. Women with the educational attainment of less than high school are most likely to be married with 100.0% of them married at childbirth, while women with the educational attainment of college or associate's degree are least likely to be married with 51.6% of them unmarried at childbirth.
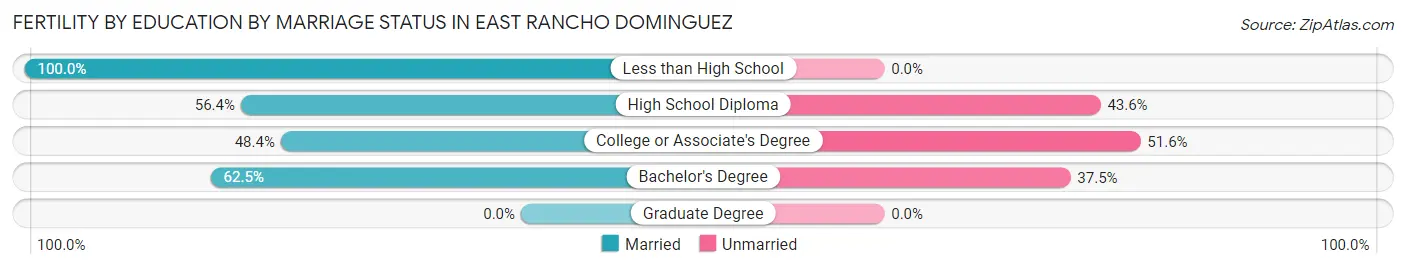
| Educational Attainment | Married | Unmarried |
| Less than High School | 25 (100.0%) | 0 (0.0%) |
| High School Diploma | 57 (56.4%) | 44 (43.6%) |
| College or Associate's Degree | 15 (48.4%) | 16 (51.6%) |
| Bachelor's Degree | 15 (62.5%) | 9 (37.5%) |
| Graduate Degree | 0 (0.0%) | 0 (0.0%) |
| Total | 112 (61.9%) | 69 (38.1%) |
Employment Characteristics in East Rancho Dominguez
Employment by Class of Employer in East Rancho Dominguez
Among the 6,542 employed individuals in East Rancho Dominguez, private company employees (4,916 | 75.1%), self-employed (not incorporated) (436 | 6.7%), and not-for-profit organizations (335 | 5.1%) make up the most common classes of employment.
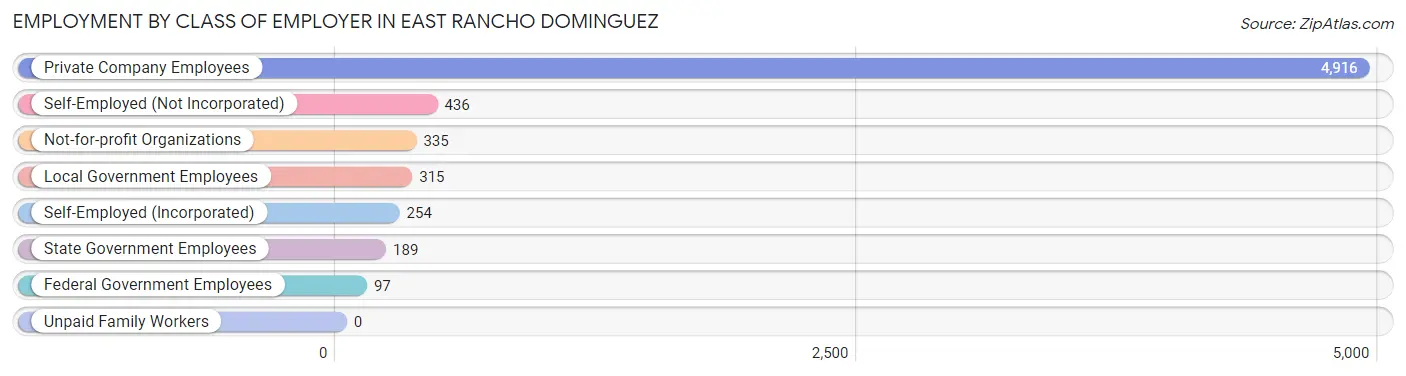
| Employer Class | # Employees | % Employees |
| Private Company Employees | 4,916 | 75.1% |
| Self-Employed (Incorporated) | 254 | 3.9% |
| Self-Employed (Not Incorporated) | 436 | 6.7% |
| Not-for-profit Organizations | 335 | 5.1% |
| Local Government Employees | 315 | 4.8% |
| State Government Employees | 189 | 2.9% |
| Federal Government Employees | 97 | 1.5% |
| Unpaid Family Workers | 0 | 0.0% |
| Total | 6,542 | 100.0% |
Employment Status by Age in East Rancho Dominguez
According to the labor force statistics for East Rancho Dominguez, out of the total population over 16 years of age (11,706), 61.1% or 7,152 individuals are in the labor force, with 6.5% or 465 of them unemployed. The age group with the highest labor force participation rate is 30 to 34 years, with 81.5% or 882 individuals in the labor force. Within the labor force, the 16 to 19 years age range has the highest percentage of unemployed individuals, with 42.1% or 83 of them being unemployed.
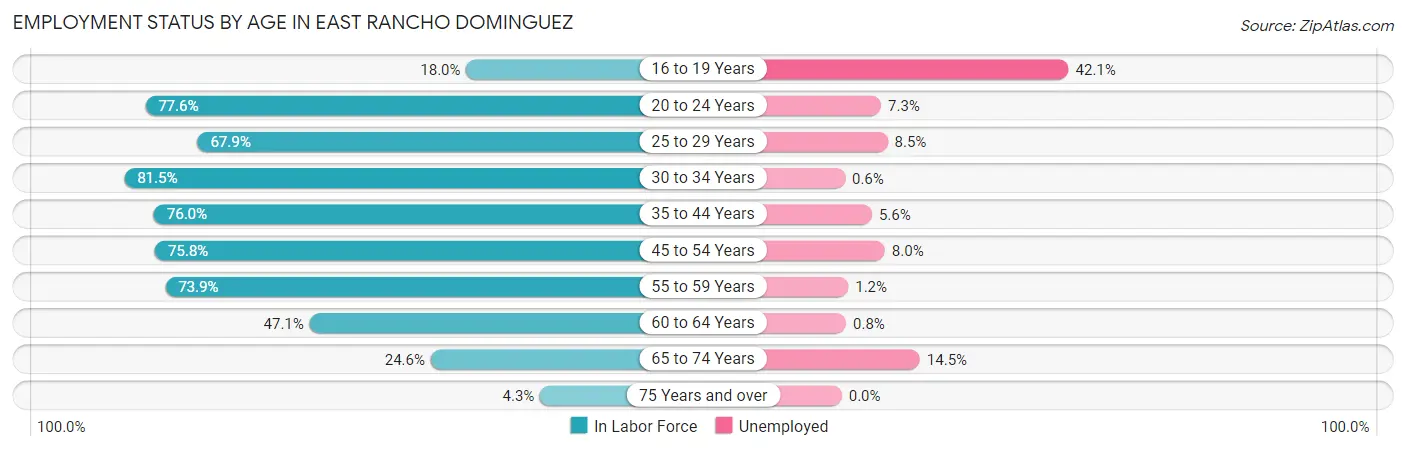
| Age Bracket | In Labor Force | Unemployed |
| 16 to 19 Years | 197 (18.0%) | 83 (42.1%) |
| 20 to 24 Years | 1,027 (77.6%) | 75 (7.3%) |
| 25 to 29 Years | 839 (67.9%) | 71 (8.5%) |
| 30 to 34 Years | 882 (81.5%) | 5 (0.6%) |
| 35 to 44 Years | 1,506 (76.0%) | 84 (5.6%) |
| 45 to 54 Years | 1,378 (75.8%) | 110 (8.0%) |
| 55 to 59 Years | 605 (73.9%) | 7 (1.2%) |
| 60 to 64 Years | 518 (47.1%) | 4 (0.8%) |
| 65 to 74 Years | 172 (24.6%) | 25 (14.5%) |
| 75 Years and over | 24 (4.3%) | 0 (0.0%) |
| Total | 7,152 (61.1%) | 465 (6.5%) |
Employment Status by Educational Attainment in East Rancho Dominguez
According to labor force statistics for East Rancho Dominguez, 71.3% of individuals (5,728) out of the total population between 25 and 64 years of age (8,034) are in the labor force, with 4.9% or 281 of them being unemployed. The group with the highest labor force participation rate are those with the educational attainment of bachelor's degree or higher, with 82.8% or 425 individuals in the labor force. Within the labor force, individuals with college / associate degree education have the highest percentage of unemployment, with 6.6% or 77 of them being unemployed.
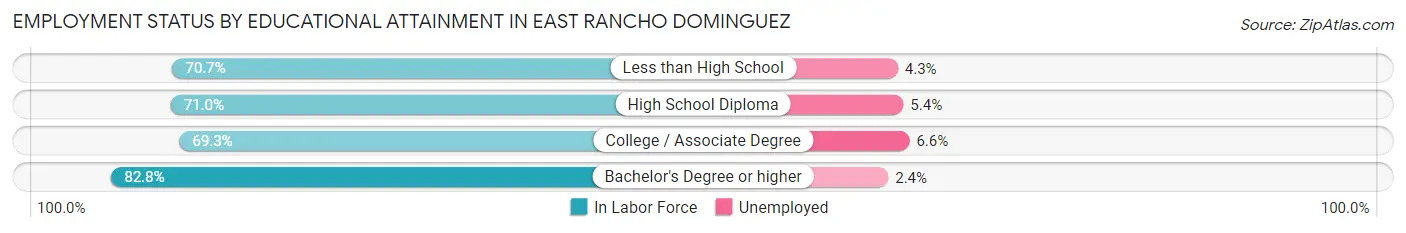
| Educational Attainment | In Labor Force | Unemployed |
| Less than High School | 2,581 (70.7%) | 157 (4.3%) |
| High School Diploma | 1,546 (71.0%) | 118 (5.4%) |
| College / Associate Degree | 1,173 (69.3%) | 112 (6.6%) |
| Bachelor's Degree or higher | 425 (82.8%) | 12 (2.4%) |
| Total | 5,728 (71.3%) | 394 (4.9%) |
Employment Occupations by Sex in East Rancho Dominguez
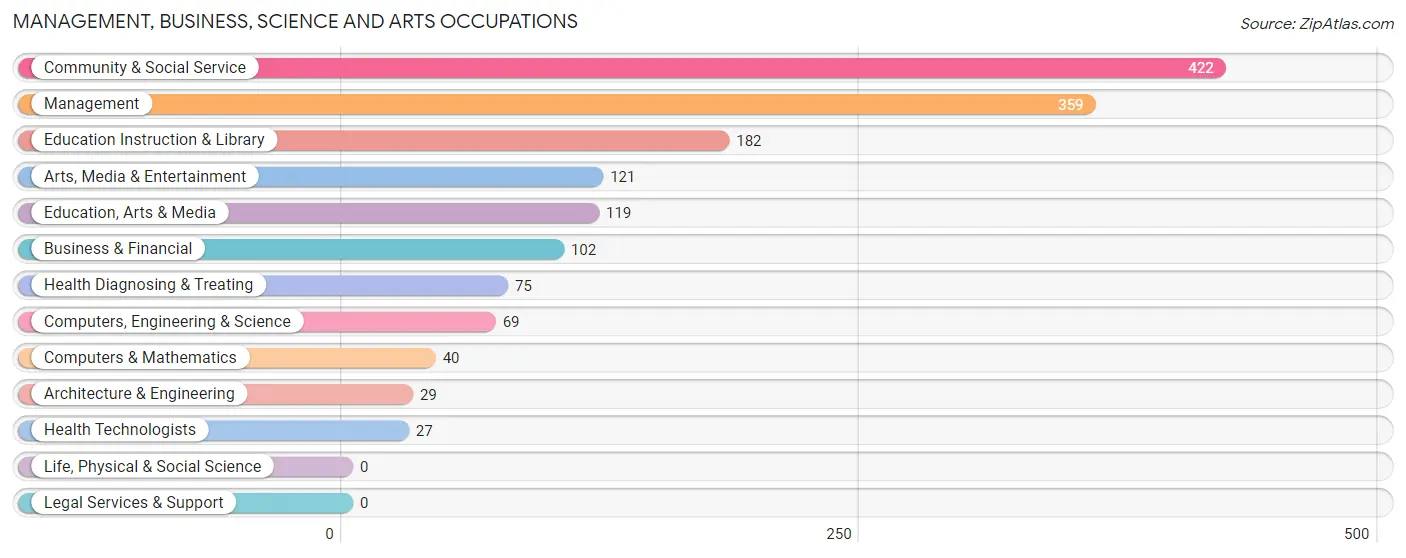
Management, Business, Science and Arts Occupations
The most common Management, Business, Science and Arts occupations in East Rancho Dominguez are Community & Social Service (422 | 6.3%), Management (359 | 5.4%), Education Instruction & Library (182 | 2.7%), Arts, Media & Entertainment (121 | 1.8%), and Education, Arts & Media (119 | 1.8%).
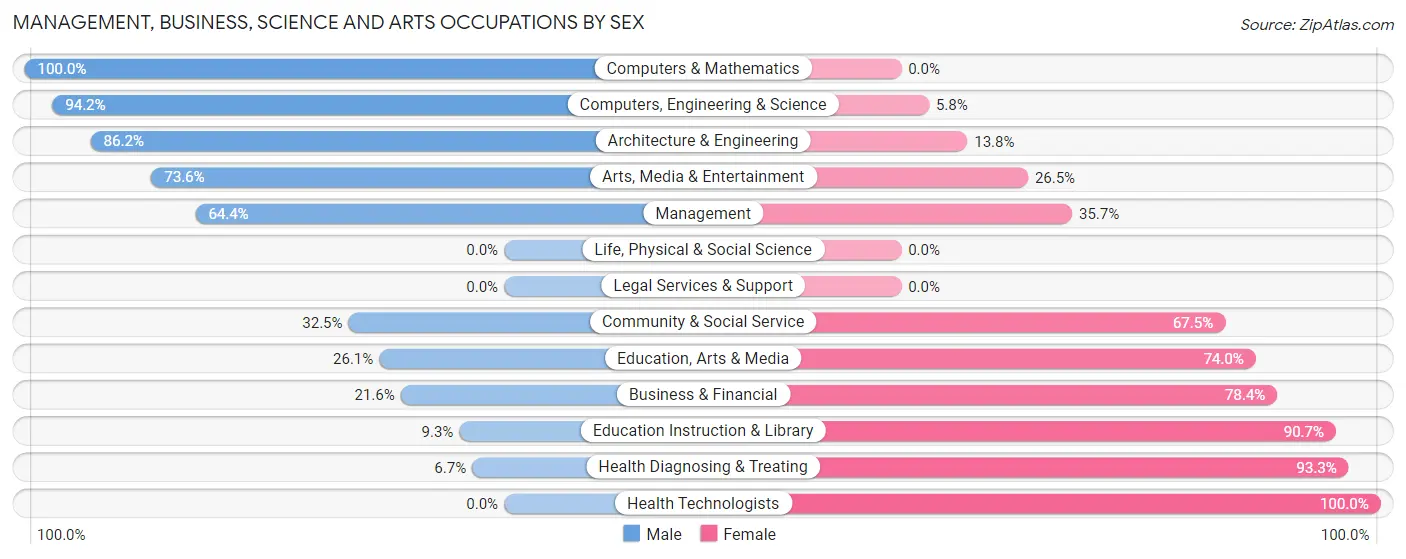
Management, Business, Science and Arts Occupations by Sex
Within the Management, Business, Science and Arts occupations in East Rancho Dominguez, the most male-oriented occupations are Computers & Mathematics (100.0%), Computers, Engineering & Science (94.2%), and Architecture & Engineering (86.2%), while the most female-oriented occupations are Health Technologists (100.0%), Health Diagnosing & Treating (93.3%), and Education Instruction & Library (90.7%).
| Occupation | Male | Female |
| Management | 231 (64.3%) | 128 (35.6%) |
| Business & Financial | 22 (21.6%) | 80 (78.4%) |
| Computers, Engineering & Science | 65 (94.2%) | 4 (5.8%) |
| Computers & Mathematics | 40 (100.0%) | 0 (0.0%) |
| Architecture & Engineering | 25 (86.2%) | 4 (13.8%) |
| Life, Physical & Social Science | 0 (0.0%) | 0 (0.0%) |
| Community & Social Service | 137 (32.5%) | 285 (67.5%) |
| Education, Arts & Media | 31 (26.1%) | 88 (74.0%) |
| Legal Services & Support | 0 (0.0%) | 0 (0.0%) |
| Education Instruction & Library | 17 (9.3%) | 165 (90.7%) |
| Arts, Media & Entertainment | 89 (73.6%) | 32 (26.5%) |
| Health Diagnosing & Treating | 5 (6.7%) | 70 (93.3%) |
| Health Technologists | 0 (0.0%) | 27 (100.0%) |
| Total (Category) | 460 (44.8%) | 567 (55.2%) |
| Total (Overall) | 3,885 (58.2%) | 2,795 (41.8%) |
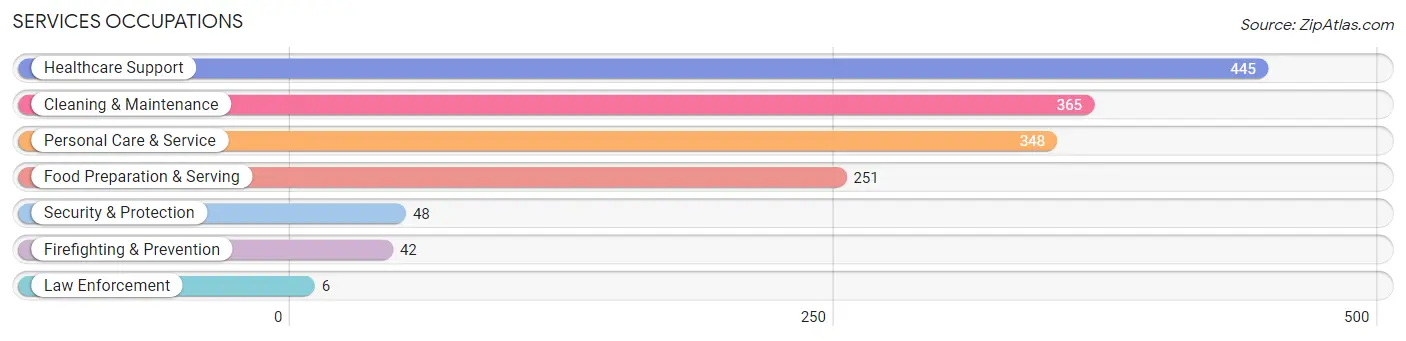
Services Occupations
The most common Services occupations in East Rancho Dominguez are Healthcare Support (445 | 6.7%), Cleaning & Maintenance (365 | 5.5%), Personal Care & Service (348 | 5.2%), Food Preparation & Serving (251 | 3.8%), and Security & Protection (48 | 0.7%).
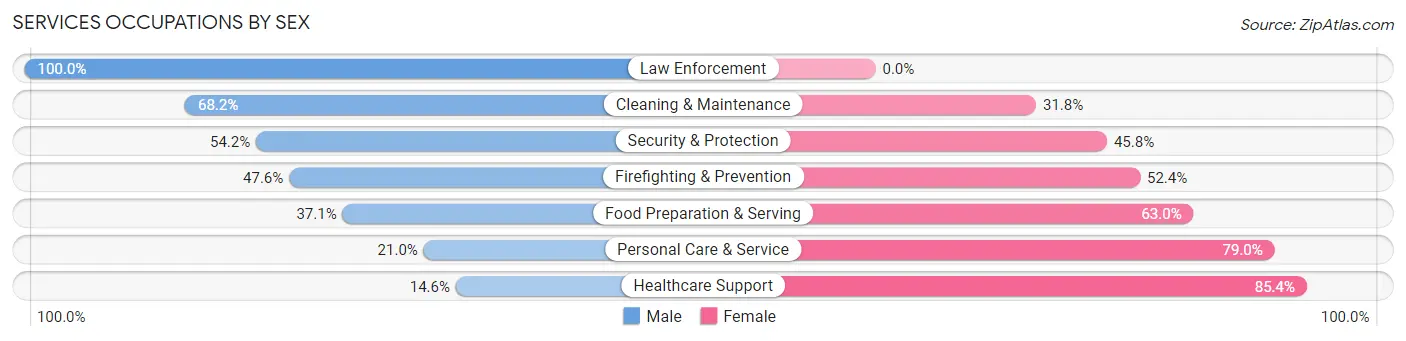
Services Occupations by Sex
Within the Services occupations in East Rancho Dominguez, the most male-oriented occupations are Law Enforcement (100.0%), Cleaning & Maintenance (68.2%), and Security & Protection (54.2%), while the most female-oriented occupations are Healthcare Support (85.4%), Personal Care & Service (79.0%), and Food Preparation & Serving (62.9%).
| Occupation | Male | Female |
| Healthcare Support | 65 (14.6%) | 380 (85.4%) |
| Security & Protection | 26 (54.2%) | 22 (45.8%) |
| Firefighting & Prevention | 20 (47.6%) | 22 (52.4%) |
| Law Enforcement | 6 (100.0%) | 0 (0.0%) |
| Food Preparation & Serving | 93 (37.0%) | 158 (62.9%) |
| Cleaning & Maintenance | 249 (68.2%) | 116 (31.8%) |
| Personal Care & Service | 73 (21.0%) | 275 (79.0%) |
| Total (Category) | 506 (34.7%) | 951 (65.3%) |
| Total (Overall) | 3,885 (58.2%) | 2,795 (41.8%) |
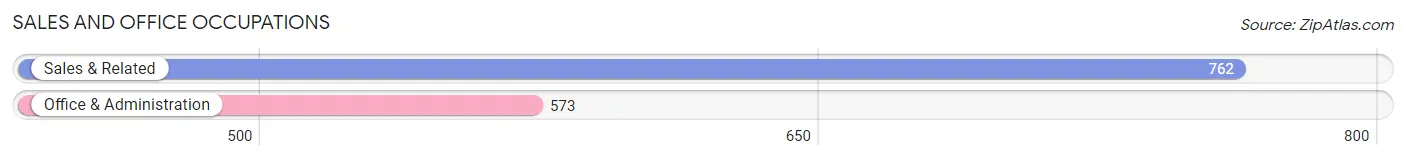
Sales and Office Occupations
The most common Sales and Office occupations in East Rancho Dominguez are Sales & Related (762 | 11.4%), and Office & Administration (573 | 8.6%).
Sales and Office Occupations by Sex
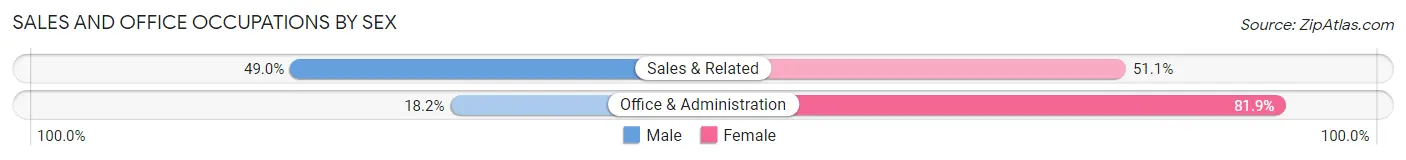
| Occupation | Male | Female |
| Sales & Related | 373 (48.9%) | 389 (51.0%) |
| Office & Administration | 104 (18.1%) | 469 (81.9%) |
| Total (Category) | 477 (35.7%) | 858 (64.3%) |
| Total (Overall) | 3,885 (58.2%) | 2,795 (41.8%) |
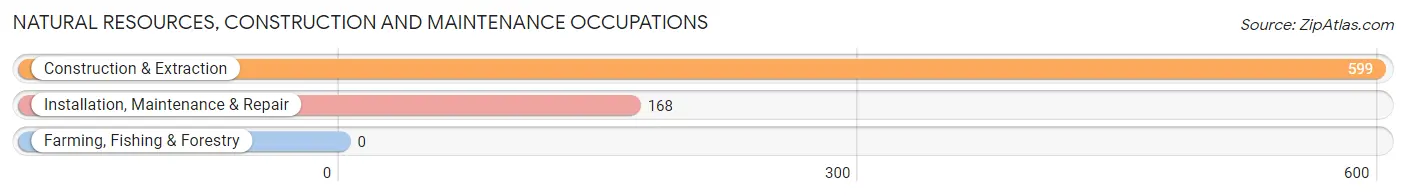
Natural Resources, Construction and Maintenance Occupations
The most common Natural Resources, Construction and Maintenance occupations in East Rancho Dominguez are Construction & Extraction (599 | 9.0%), and Installation, Maintenance & Repair (168 | 2.5%).
Natural Resources, Construction and Maintenance Occupations by Sex
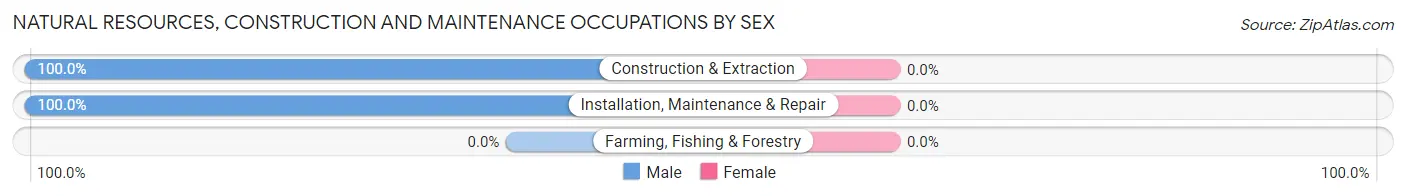
| Occupation | Male | Female |
| Farming, Fishing & Forestry | 0 (0.0%) | 0 (0.0%) |
| Construction & Extraction | 599 (100.0%) | 0 (0.0%) |
| Installation, Maintenance & Repair | 168 (100.0%) | 0 (0.0%) |
| Total (Category) | 767 (100.0%) | 0 (0.0%) |
| Total (Overall) | 3,885 (58.2%) | 2,795 (41.8%) |
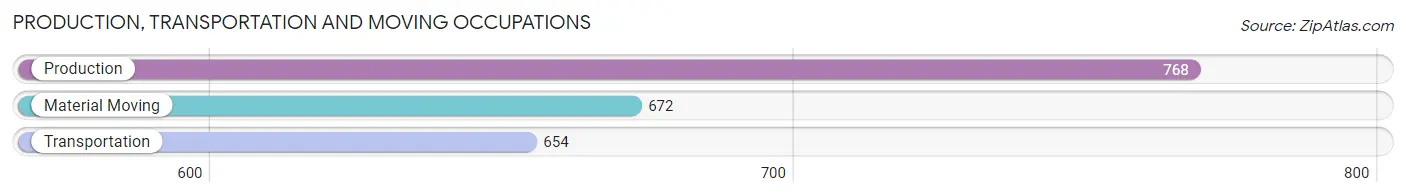
Production, Transportation and Moving Occupations
The most common Production, Transportation and Moving occupations in East Rancho Dominguez are Production (768 | 11.5%), Material Moving (672 | 10.1%), and Transportation (654 | 9.8%).
Production, Transportation and Moving Occupations by Sex
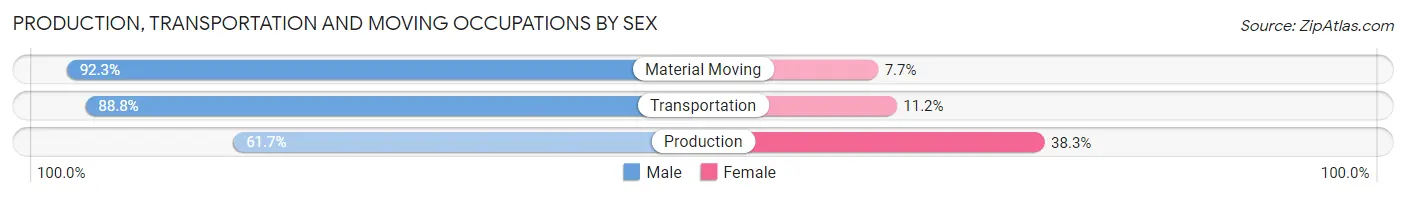
| Occupation | Male | Female |
| Production | 474 (61.7%) | 294 (38.3%) |
| Transportation | 581 (88.8%) | 73 (11.2%) |
| Material Moving | 620 (92.3%) | 52 (7.7%) |
| Total (Category) | 1,675 (80.0%) | 419 (20.0%) |
| Total (Overall) | 3,885 (58.2%) | 2,795 (41.8%) |
Employment Industries by Sex in East Rancho Dominguez
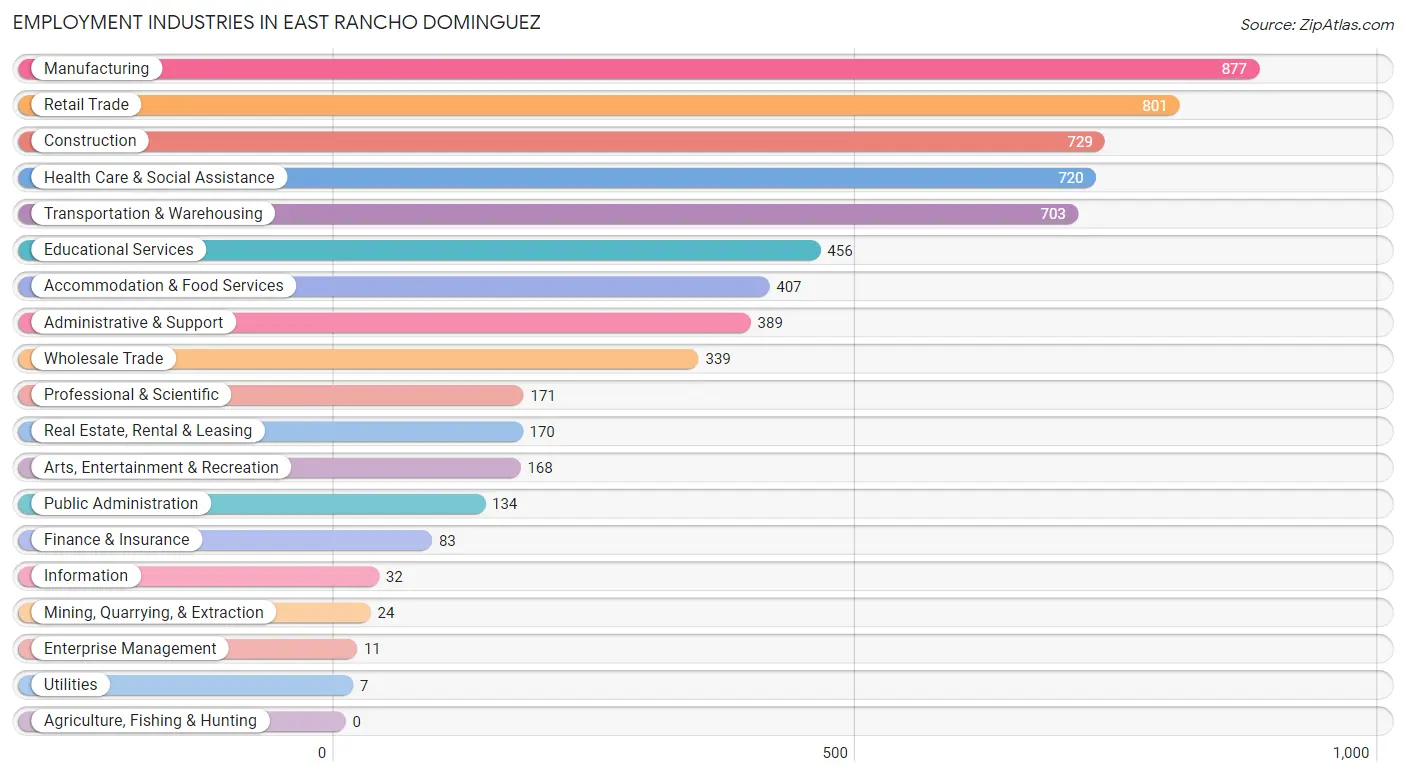
Employment Industries in East Rancho Dominguez
The major employment industries in East Rancho Dominguez include Manufacturing (877 | 13.1%), Retail Trade (801 | 12.0%), Construction (729 | 10.9%), Health Care & Social Assistance (720 | 10.8%), and Transportation & Warehousing (703 | 10.5%).
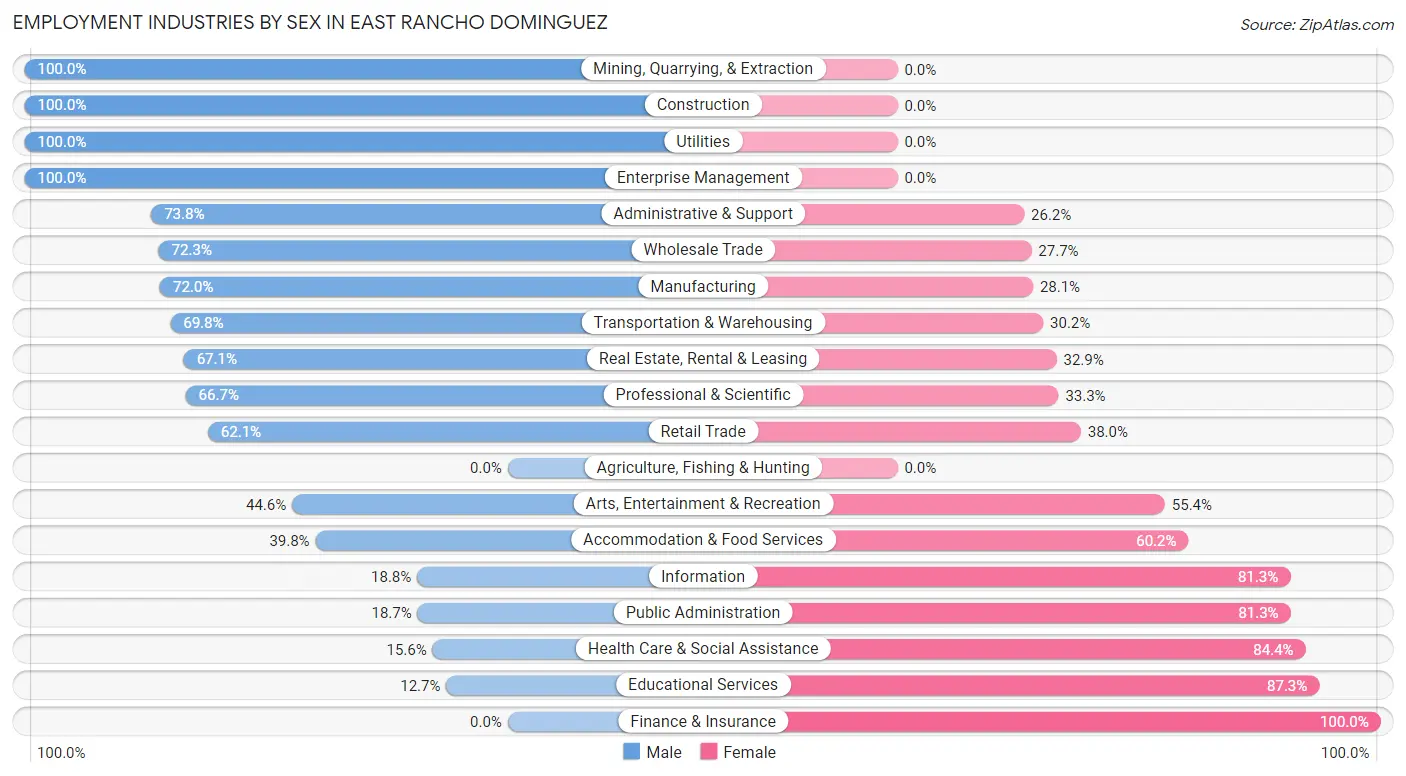
Employment Industries by Sex in East Rancho Dominguez
The East Rancho Dominguez industries that see more men than women are Mining, Quarrying, & Extraction (100.0%), Construction (100.0%), and Utilities (100.0%), whereas the industries that tend to have a higher number of women are Finance & Insurance (100.0%), Educational Services (87.3%), and Health Care & Social Assistance (84.4%).
| Industry | Male | Female |
| Agriculture, Fishing & Hunting | 0 (0.0%) | 0 (0.0%) |
| Mining, Quarrying, & Extraction | 24 (100.0%) | 0 (0.0%) |
| Construction | 729 (100.0%) | 0 (0.0%) |
| Manufacturing | 631 (72.0%) | 246 (28.1%) |
| Wholesale Trade | 245 (72.3%) | 94 (27.7%) |
| Retail Trade | 497 (62.1%) | 304 (38.0%) |
| Transportation & Warehousing | 491 (69.8%) | 212 (30.2%) |
| Utilities | 7 (100.0%) | 0 (0.0%) |
| Information | 6 (18.8%) | 26 (81.2%) |
| Finance & Insurance | 0 (0.0%) | 83 (100.0%) |
| Real Estate, Rental & Leasing | 114 (67.1%) | 56 (32.9%) |
| Professional & Scientific | 114 (66.7%) | 57 (33.3%) |
| Enterprise Management | 11 (100.0%) | 0 (0.0%) |
| Administrative & Support | 287 (73.8%) | 102 (26.2%) |
| Educational Services | 58 (12.7%) | 398 (87.3%) |
| Health Care & Social Assistance | 112 (15.6%) | 608 (84.4%) |
| Arts, Entertainment & Recreation | 75 (44.6%) | 93 (55.4%) |
| Accommodation & Food Services | 162 (39.8%) | 245 (60.2%) |
| Public Administration | 25 (18.7%) | 109 (81.3%) |
| Total | 3,885 (58.2%) | 2,795 (41.8%) |
Education in East Rancho Dominguez
School Enrollment in East Rancho Dominguez
The most common levels of schooling among the 4,332 students in East Rancho Dominguez are middle school (1,121 | 25.9%), high school (1,078 | 24.9%), and college / undergraduate (1,069 | 24.7%).
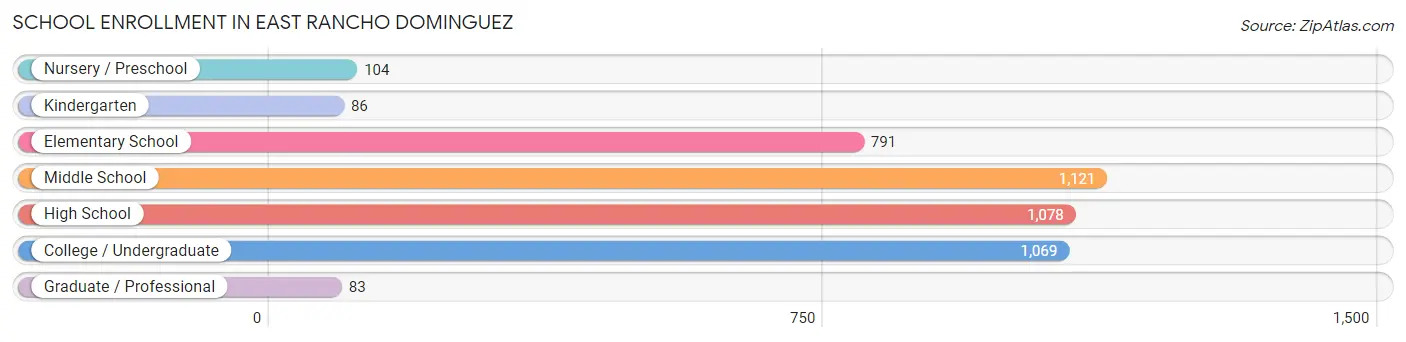
| School Level | # Students | % Students |
| Nursery / Preschool | 104 | 2.4% |
| Kindergarten | 86 | 2.0% |
| Elementary School | 791 | 18.3% |
| Middle School | 1,121 | 25.9% |
| High School | 1,078 | 24.9% |
| College / Undergraduate | 1,069 | 24.7% |
| Graduate / Professional | 83 | 1.9% |
| Total | 4,332 | 100.0% |
School Enrollment by Age by Funding Source in East Rancho Dominguez
Out of a total of 4,332 students who are enrolled in schools in East Rancho Dominguez, 134 (3.1%) attend a private institution, while the remaining 4,198 (96.9%) are enrolled in public schools. The age group of 35 years and over has the highest likelihood of being enrolled in private schools, with 30 (26.3% in the age bracket) enrolled. Conversely, the age group of 15 to 17 year olds has the lowest likelihood of being enrolled in a private school, with 839 (100.0% in the age bracket) attending a public institution.
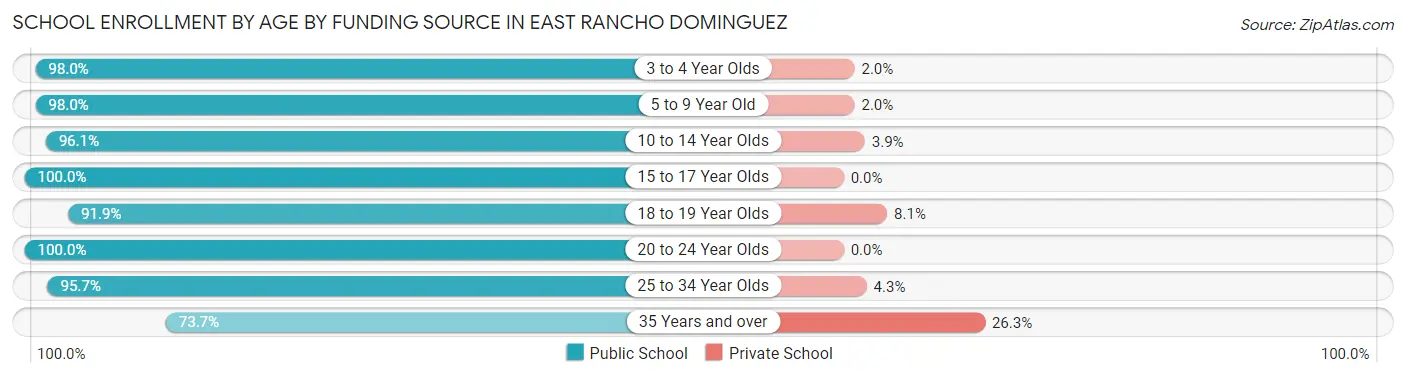
| Age Bracket | Public School | Private School |
| 3 to 4 Year Olds | 97 (98.0%) | 2 (2.0%) |
| 5 to 9 Year Old | 825 (98.0%) | 17 (2.0%) |
| 10 to 14 Year Olds | 1,244 (96.1%) | 51 (3.9%) |
| 15 to 17 Year Olds | 839 (100.0%) | 0 (0.0%) |
| 18 to 19 Year Olds | 227 (91.9%) | 20 (8.1%) |
| 20 to 24 Year Olds | 592 (100.0%) | 0 (0.0%) |
| 25 to 34 Year Olds | 291 (95.7%) | 13 (4.3%) |
| 35 Years and over | 84 (73.7%) | 30 (26.3%) |
| Total | 4,198 (96.9%) | 134 (3.1%) |
Educational Attainment by Field of Study in East Rancho Dominguez
Arts & humanities (145 | 21.3%), social sciences (130 | 19.1%), communications (90 | 13.2%), business (81 | 11.9%), and education (55 | 8.1%) are the most common fields of study among 681 individuals in East Rancho Dominguez who have obtained a bachelor's degree or higher.
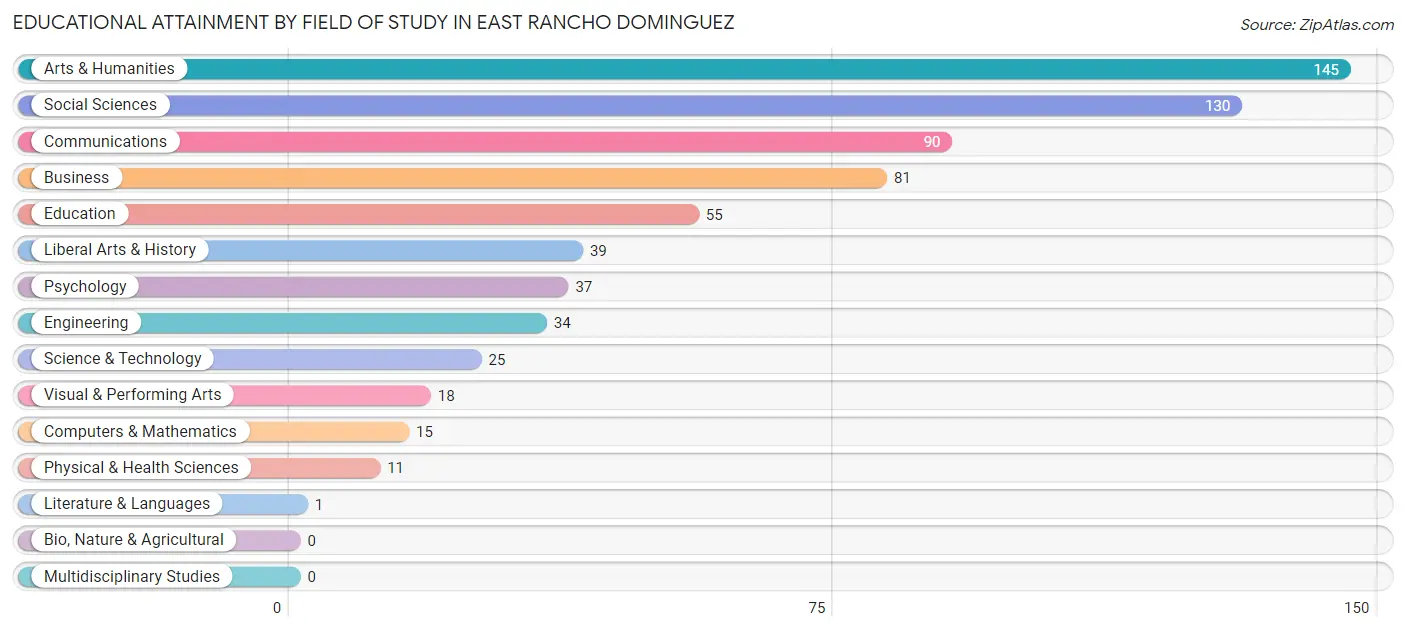
| Field of Study | # Graduates | % Graduates |
| Computers & Mathematics | 15 | 2.2% |
| Bio, Nature & Agricultural | 0 | 0.0% |
| Physical & Health Sciences | 11 | 1.6% |
| Psychology | 37 | 5.4% |
| Social Sciences | 130 | 19.1% |
| Engineering | 34 | 5.0% |
| Multidisciplinary Studies | 0 | 0.0% |
| Science & Technology | 25 | 3.7% |
| Business | 81 | 11.9% |
| Education | 55 | 8.1% |
| Literature & Languages | 1 | 0.2% |
| Liberal Arts & History | 39 | 5.7% |
| Visual & Performing Arts | 18 | 2.6% |
| Communications | 90 | 13.2% |
| Arts & Humanities | 145 | 21.3% |
| Total | 681 | 100.0% |
Transportation & Commute in East Rancho Dominguez
Vehicle Availability by Sex in East Rancho Dominguez
The most prevalent vehicle ownership categories in East Rancho Dominguez are males with 3 vehicles (915, accounting for 23.8%) and females with 3 vehicles (485, making up 33.9%).
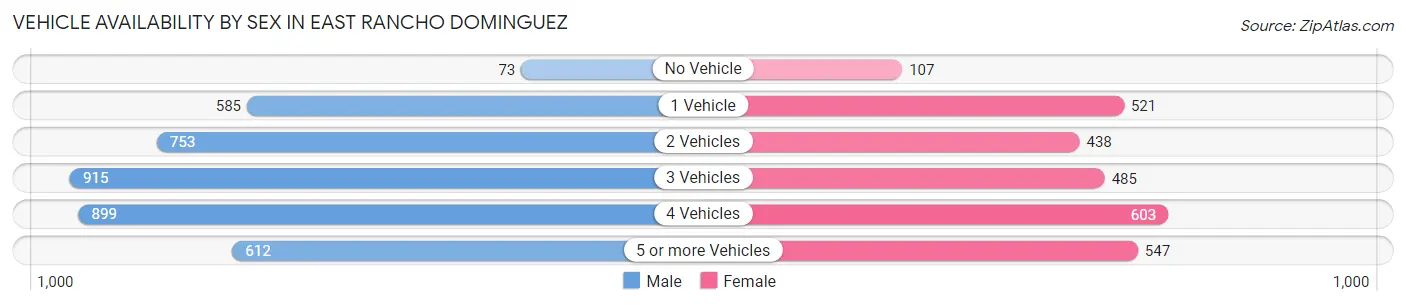
| Vehicles Available | Male | Female |
| No Vehicle | 73 (1.9%) | 107 (4.0%) |
| 1 Vehicle | 585 (15.2%) | 521 (19.3%) |
| 2 Vehicles | 753 (19.6%) | 438 (16.2%) |
| 3 Vehicles | 915 (23.8%) | 485 (18.0%) |
| 4 Vehicles | 899 (23.4%) | 603 (22.3%) |
| 5 or more Vehicles | 612 (16.0%) | 547 (20.3%) |
| Total | 3,837 (100.0%) | 2,701 (100.0%) |
Commute Time in East Rancho Dominguez
The most frequently occuring commute durations in East Rancho Dominguez are 30 to 34 minutes (1,698 commuters, 27.1%), 20 to 24 minutes (1,152 commuters, 18.4%), and 45 to 59 minutes (792 commuters, 12.6%).
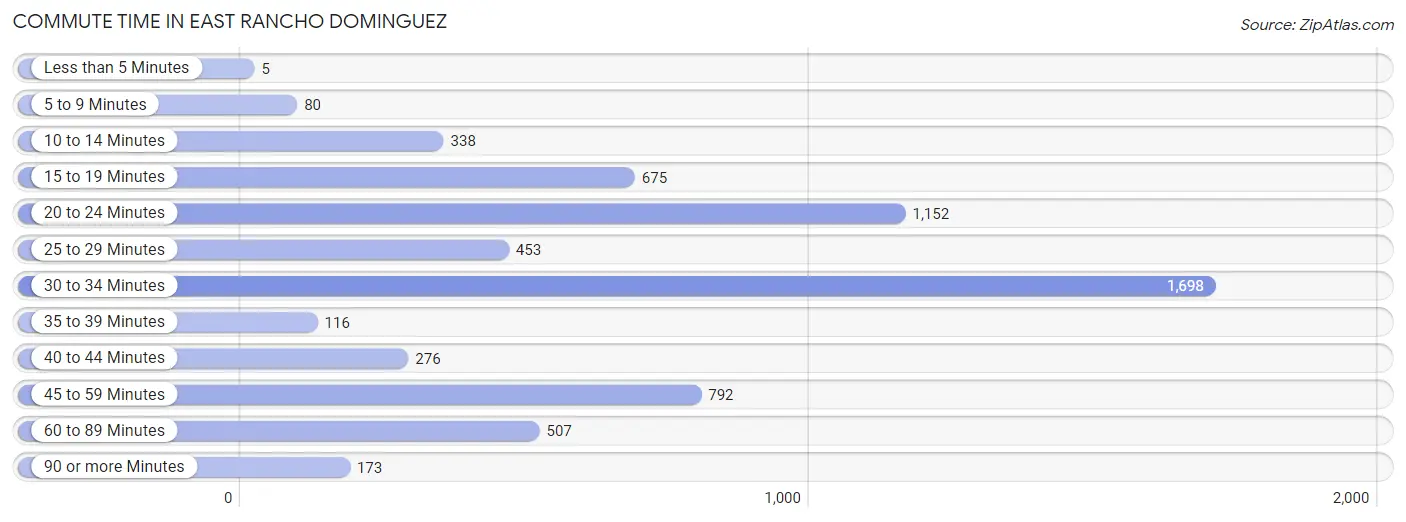
| Commute Time | # Commuters | % Commuters |
| Less than 5 Minutes | 5 | 0.1% |
| 5 to 9 Minutes | 80 | 1.3% |
| 10 to 14 Minutes | 338 | 5.4% |
| 15 to 19 Minutes | 675 | 10.8% |
| 20 to 24 Minutes | 1,152 | 18.4% |
| 25 to 29 Minutes | 453 | 7.2% |
| 30 to 34 Minutes | 1,698 | 27.1% |
| 35 to 39 Minutes | 116 | 1.8% |
| 40 to 44 Minutes | 276 | 4.4% |
| 45 to 59 Minutes | 792 | 12.6% |
| 60 to 89 Minutes | 507 | 8.1% |
| 90 or more Minutes | 173 | 2.8% |
Commute Time by Sex in East Rancho Dominguez
The most common commute times in East Rancho Dominguez are 30 to 34 minutes (809 commuters, 22.0%) for males and 30 to 34 minutes (889 commuters, 34.3%) for females.
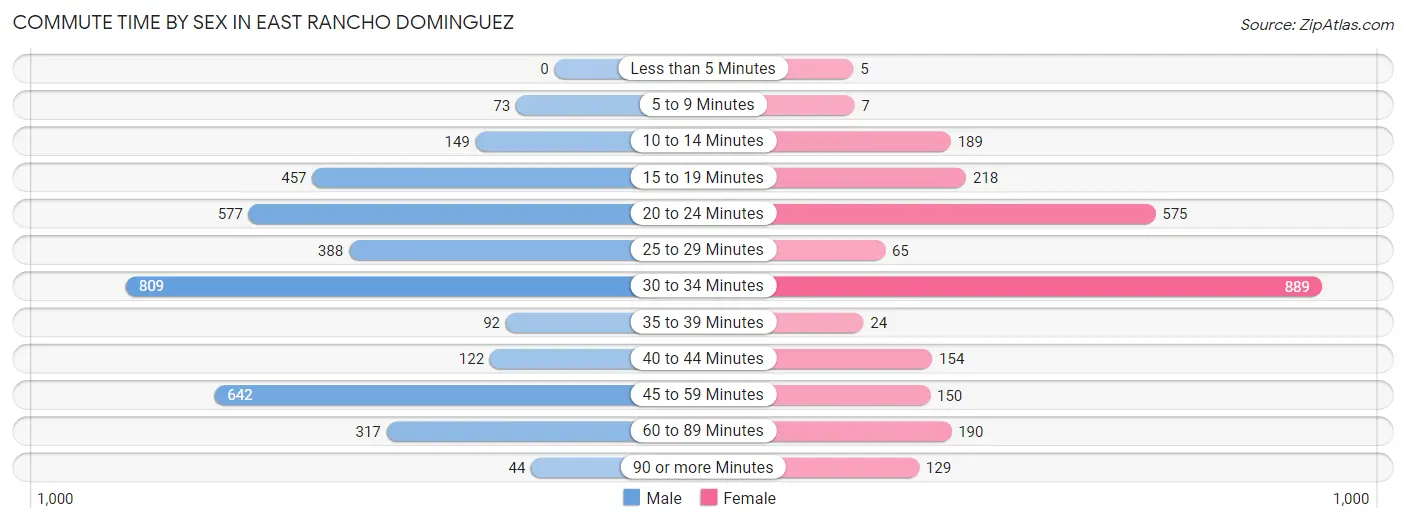
| Commute Time | Male | Female |
| Less than 5 Minutes | 0 (0.0%) | 5 (0.2%) |
| 5 to 9 Minutes | 73 (2.0%) | 7 (0.3%) |
| 10 to 14 Minutes | 149 (4.1%) | 189 (7.3%) |
| 15 to 19 Minutes | 457 (12.4%) | 218 (8.4%) |
| 20 to 24 Minutes | 577 (15.7%) | 575 (22.2%) |
| 25 to 29 Minutes | 388 (10.6%) | 65 (2.5%) |
| 30 to 34 Minutes | 809 (22.0%) | 889 (34.3%) |
| 35 to 39 Minutes | 92 (2.5%) | 24 (0.9%) |
| 40 to 44 Minutes | 122 (3.3%) | 154 (5.9%) |
| 45 to 59 Minutes | 642 (17.5%) | 150 (5.8%) |
| 60 to 89 Minutes | 317 (8.6%) | 190 (7.3%) |
| 90 or more Minutes | 44 (1.2%) | 129 (5.0%) |
Time of Departure to Work by Sex in East Rancho Dominguez
The most frequent times of departure to work in East Rancho Dominguez are 6:00 AM to 6:29 AM (581, 15.8%) for males and 12:00 AM to 4:59 AM (306, 11.8%) for females.
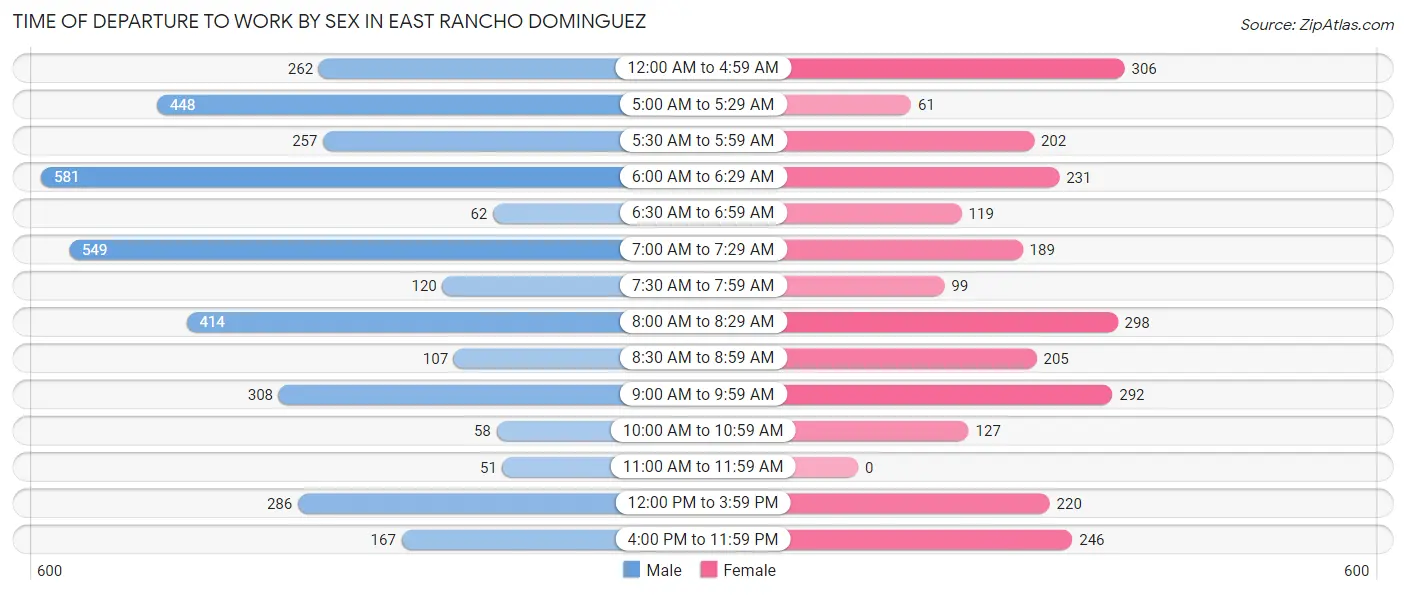
| Time of Departure | Male | Female |
| 12:00 AM to 4:59 AM | 262 (7.1%) | 306 (11.8%) |
| 5:00 AM to 5:29 AM | 448 (12.2%) | 61 (2.4%) |
| 5:30 AM to 5:59 AM | 257 (7.0%) | 202 (7.8%) |
| 6:00 AM to 6:29 AM | 581 (15.8%) | 231 (8.9%) |
| 6:30 AM to 6:59 AM | 62 (1.7%) | 119 (4.6%) |
| 7:00 AM to 7:29 AM | 549 (15.0%) | 189 (7.3%) |
| 7:30 AM to 7:59 AM | 120 (3.3%) | 99 (3.8%) |
| 8:00 AM to 8:29 AM | 414 (11.3%) | 298 (11.5%) |
| 8:30 AM to 8:59 AM | 107 (2.9%) | 205 (7.9%) |
| 9:00 AM to 9:59 AM | 308 (8.4%) | 292 (11.3%) |
| 10:00 AM to 10:59 AM | 58 (1.6%) | 127 (4.9%) |
| 11:00 AM to 11:59 AM | 51 (1.4%) | 0 (0.0%) |
| 12:00 PM to 3:59 PM | 286 (7.8%) | 220 (8.5%) |
| 4:00 PM to 11:59 PM | 167 (4.5%) | 246 (9.5%) |
| Total | 3,670 (100.0%) | 2,595 (100.0%) |
Housing Occupancy in East Rancho Dominguez
Occupancy by Ownership in East Rancho Dominguez
Of the total 3,561 dwellings in East Rancho Dominguez, owner-occupied units account for 1,934 (54.3%), while renter-occupied units make up 1,627 (45.7%).
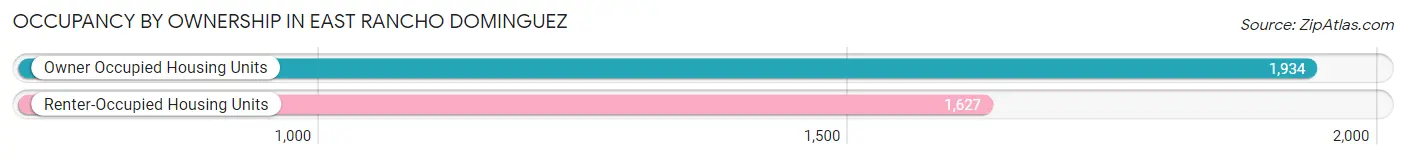
| Occupancy | # Housing Units | % Housing Units |
| Owner Occupied Housing Units | 1,934 | 54.3% |
| Renter-Occupied Housing Units | 1,627 | 45.7% |
| Total Occupied Housing Units | 3,561 | 100.0% |
Occupancy by Household Size in East Rancho Dominguez
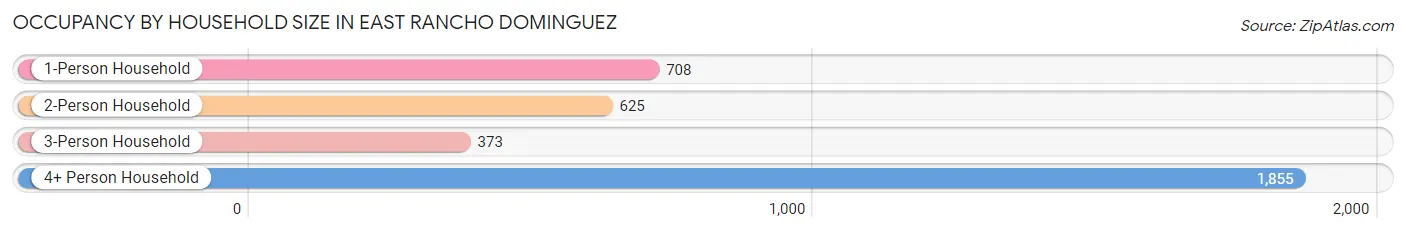
| Household Size | # Housing Units | % Housing Units |
| 1-Person Household | 708 | 19.9% |
| 2-Person Household | 625 | 17.5% |
| 3-Person Household | 373 | 10.5% |
| 4+ Person Household | 1,855 | 52.1% |
| Total Housing Units | 3,561 | 100.0% |
Occupancy by Ownership by Household Size in East Rancho Dominguez
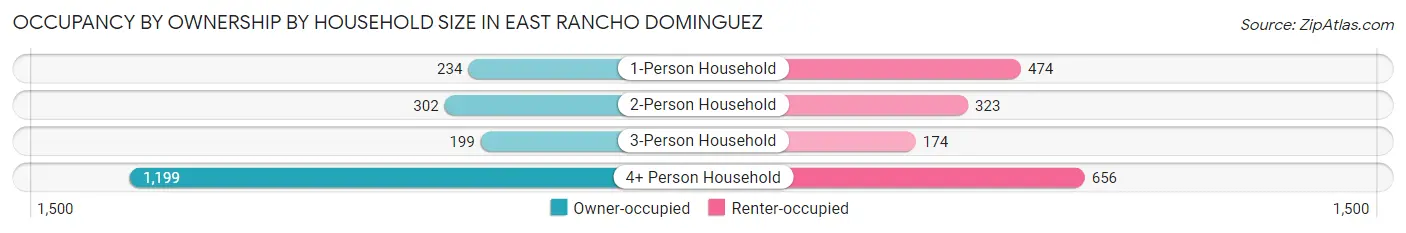
| Household Size | Owner-occupied | Renter-occupied |
| 1-Person Household | 234 (33.1%) | 474 (66.9%) |
| 2-Person Household | 302 (48.3%) | 323 (51.7%) |
| 3-Person Household | 199 (53.3%) | 174 (46.7%) |
| 4+ Person Household | 1,199 (64.6%) | 656 (35.4%) |
| Total Housing Units | 1,934 (54.3%) | 1,627 (45.7%) |
Occupancy by Educational Attainment in East Rancho Dominguez
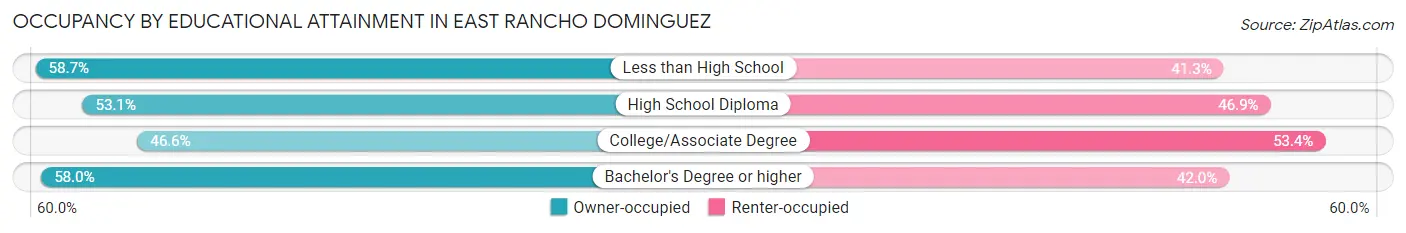
| Household Size | Owner-occupied | Renter-occupied |
| Less than High School | 957 (58.7%) | 674 (41.3%) |
| High School Diploma | 437 (53.1%) | 386 (46.9%) |
| College/Associate Degree | 417 (46.6%) | 478 (53.4%) |
| Bachelor's Degree or higher | 123 (58.0%) | 89 (42.0%) |
Occupancy by Age of Householder in East Rancho Dominguez
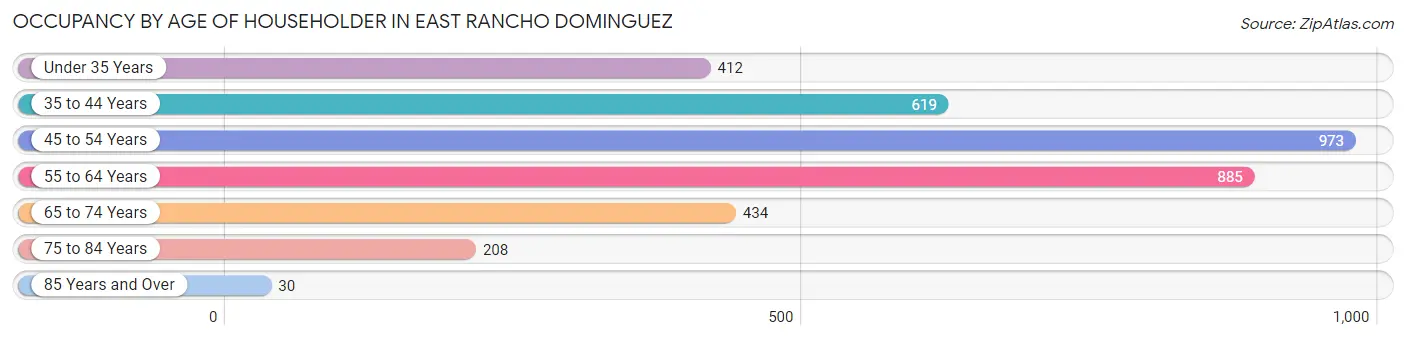
| Age Bracket | # Households | % Households |
| Under 35 Years | 412 | 11.6% |
| 35 to 44 Years | 619 | 17.4% |
| 45 to 54 Years | 973 | 27.3% |
| 55 to 64 Years | 885 | 24.8% |
| 65 to 74 Years | 434 | 12.2% |
| 75 to 84 Years | 208 | 5.8% |
| 85 Years and Over | 30 | 0.8% |
| Total | 3,561 | 100.0% |
Housing Finances in East Rancho Dominguez
Median Income by Occupancy in East Rancho Dominguez
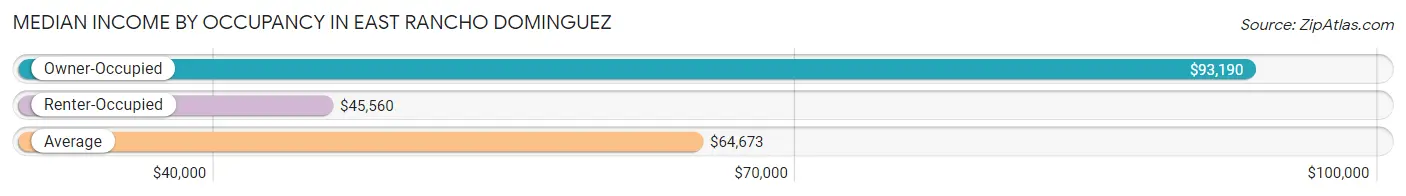
| Occupancy Type | # Households | Median Income |
| Owner-Occupied | 1,934 (54.3%) | $93,190 |
| Renter-Occupied | 1,627 (45.7%) | $45,560 |
| Average | 3,561 (100.0%) | $64,673 |
Occupancy by Householder Income Bracket in East Rancho Dominguez
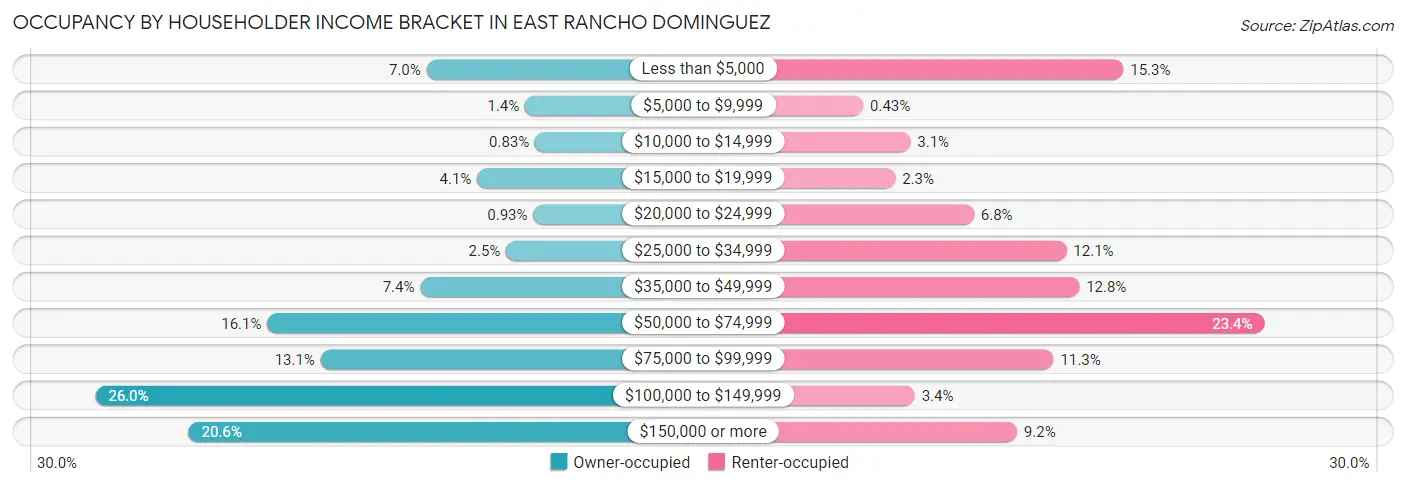
| Income Bracket | Owner-occupied | Renter-occupied |
| Less than $5,000 | 136 (7.0%) | 249 (15.3%) |
| $5,000 to $9,999 | 27 (1.4%) | 7 (0.4%) |
| $10,000 to $14,999 | 16 (0.8%) | 51 (3.1%) |
| $15,000 to $19,999 | 80 (4.1%) | 37 (2.3%) |
| $20,000 to $24,999 | 18 (0.9%) | 110 (6.8%) |
| $25,000 to $34,999 | 48 (2.5%) | 196 (12.0%) |
| $35,000 to $49,999 | 143 (7.4%) | 208 (12.8%) |
| $50,000 to $74,999 | 312 (16.1%) | 380 (23.4%) |
| $75,000 to $99,999 | 253 (13.1%) | 184 (11.3%) |
| $100,000 to $149,999 | 502 (26.0%) | 55 (3.4%) |
| $150,000 or more | 399 (20.6%) | 150 (9.2%) |
| Total | 1,934 (100.0%) | 1,627 (100.0%) |
Monthly Housing Cost Tiers in East Rancho Dominguez
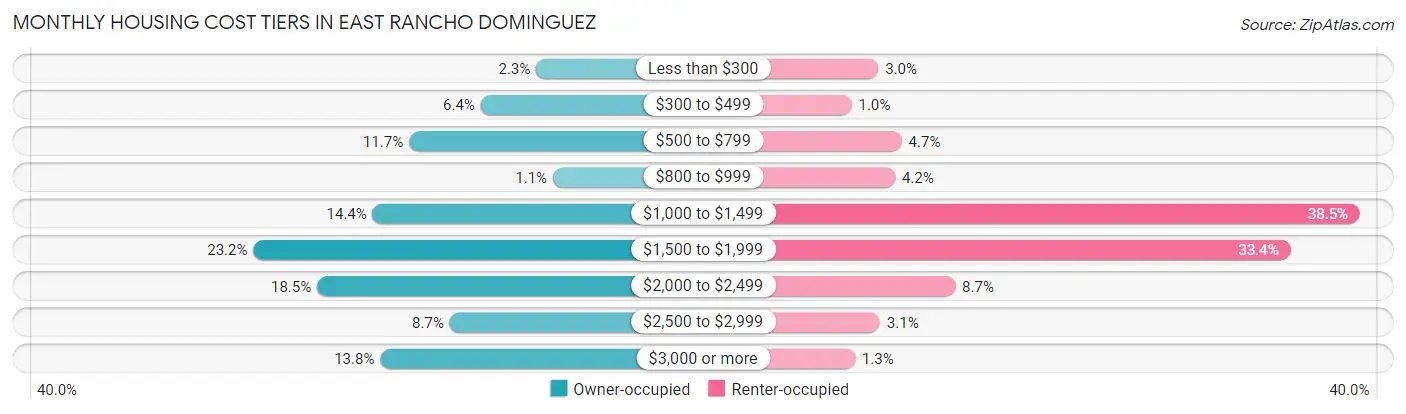
| Monthly Cost | Owner-occupied | Renter-occupied |
| Less than $300 | 45 (2.3%) | 49 (3.0%) |
| $300 to $499 | 124 (6.4%) | 17 (1.0%) |
| $500 to $799 | 226 (11.7%) | 77 (4.7%) |
| $800 to $999 | 21 (1.1%) | 69 (4.2%) |
| $1,000 to $1,499 | 278 (14.4%) | 626 (38.5%) |
| $1,500 to $1,999 | 448 (23.2%) | 543 (33.4%) |
| $2,000 to $2,499 | 357 (18.5%) | 141 (8.7%) |
| $2,500 to $2,999 | 168 (8.7%) | 51 (3.1%) |
| $3,000 or more | 267 (13.8%) | 21 (1.3%) |
| Total | 1,934 (100.0%) | 1,627 (100.0%) |
Physical Housing Characteristics in East Rancho Dominguez
Housing Structures in East Rancho Dominguez
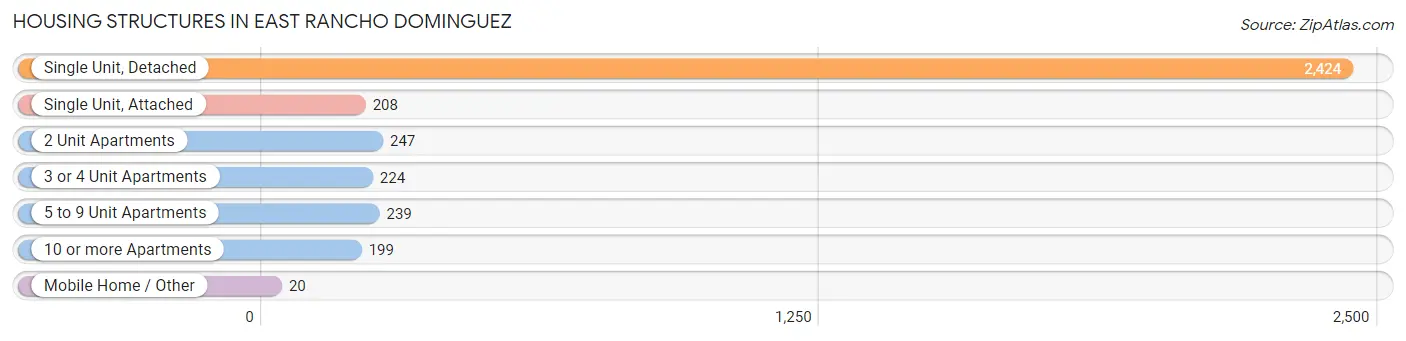
| Structure Type | # Housing Units | % Housing Units |
| Single Unit, Detached | 2,424 | 68.1% |
| Single Unit, Attached | 208 | 5.8% |
| 2 Unit Apartments | 247 | 6.9% |
| 3 or 4 Unit Apartments | 224 | 6.3% |
| 5 to 9 Unit Apartments | 239 | 6.7% |
| 10 or more Apartments | 199 | 5.6% |
| Mobile Home / Other | 20 | 0.6% |
| Total | 3,561 | 100.0% |
Housing Structures by Occupancy in East Rancho Dominguez
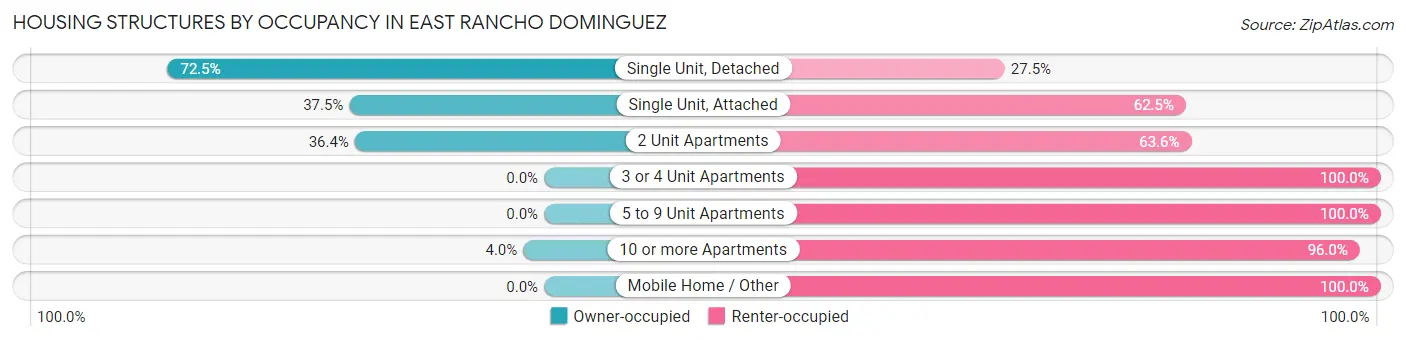
| Structure Type | Owner-occupied | Renter-occupied |
| Single Unit, Detached | 1,758 (72.5%) | 666 (27.5%) |
| Single Unit, Attached | 78 (37.5%) | 130 (62.5%) |
| 2 Unit Apartments | 90 (36.4%) | 157 (63.6%) |
| 3 or 4 Unit Apartments | 0 (0.0%) | 224 (100.0%) |
| 5 to 9 Unit Apartments | 0 (0.0%) | 239 (100.0%) |
| 10 or more Apartments | 8 (4.0%) | 191 (96.0%) |
| Mobile Home / Other | 0 (0.0%) | 20 (100.0%) |
| Total | 1,934 (54.3%) | 1,627 (45.7%) |
Housing Structures by Number of Rooms in East Rancho Dominguez
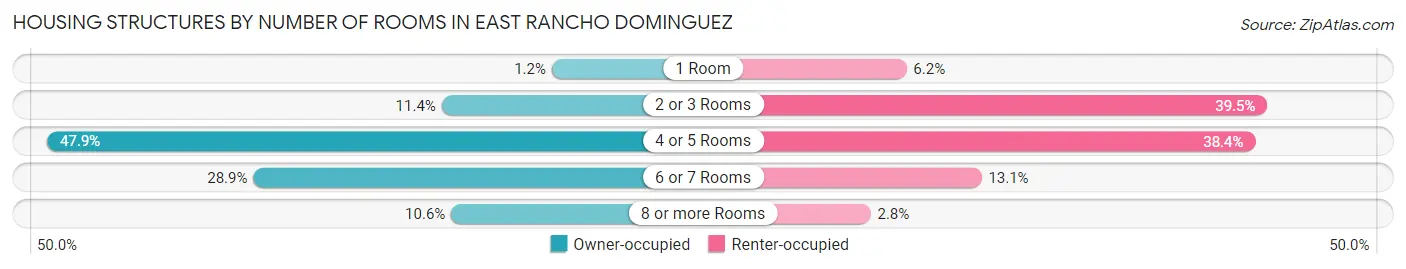
| Number of Rooms | Owner-occupied | Renter-occupied |
| 1 Room | 24 (1.2%) | 100 (6.1%) |
| 2 or 3 Rooms | 221 (11.4%) | 643 (39.5%) |
| 4 or 5 Rooms | 927 (47.9%) | 625 (38.4%) |
| 6 or 7 Rooms | 558 (28.8%) | 213 (13.1%) |
| 8 or more Rooms | 204 (10.5%) | 46 (2.8%) |
| Total | 1,934 (100.0%) | 1,627 (100.0%) |
Housing Structure by Heating Type in East Rancho Dominguez
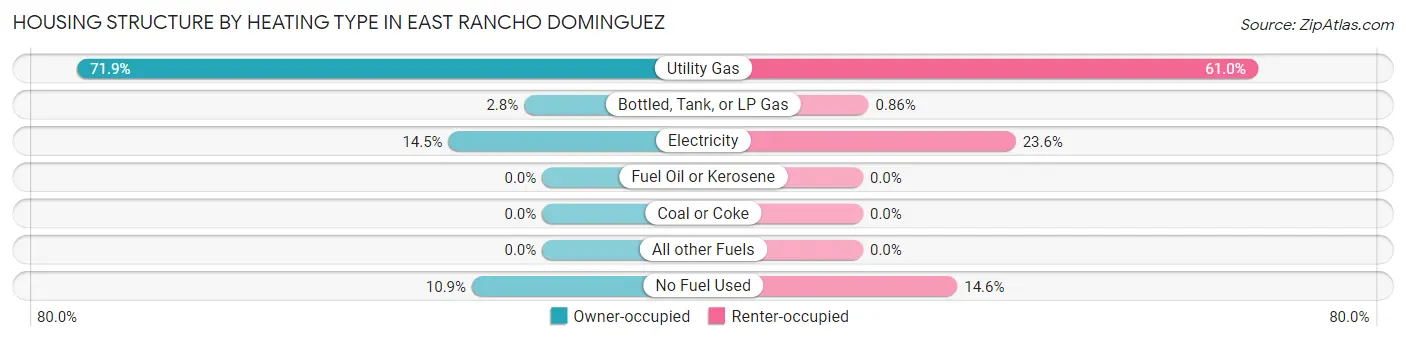
| Heating Type | Owner-occupied | Renter-occupied |
| Utility Gas | 1,390 (71.9%) | 992 (61.0%) |
| Bottled, Tank, or LP Gas | 54 (2.8%) | 14 (0.9%) |
| Electricity | 280 (14.5%) | 384 (23.6%) |
| Fuel Oil or Kerosene | 0 (0.0%) | 0 (0.0%) |
| Coal or Coke | 0 (0.0%) | 0 (0.0%) |
| All other Fuels | 0 (0.0%) | 0 (0.0%) |
| No Fuel Used | 210 (10.9%) | 237 (14.6%) |
| Total | 1,934 (100.0%) | 1,627 (100.0%) |
Household Vehicle Usage in East Rancho Dominguez
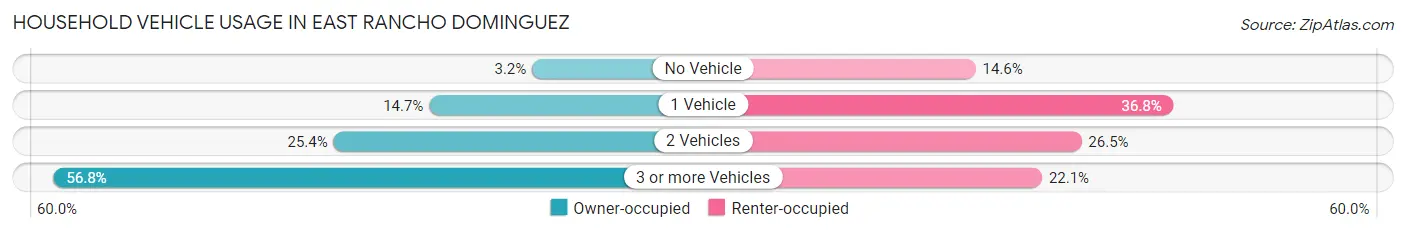
| Vehicles per Household | Owner-occupied | Renter-occupied |
| No Vehicle | 61 (3.2%) | 238 (14.6%) |
| 1 Vehicle | 284 (14.7%) | 599 (36.8%) |
| 2 Vehicles | 491 (25.4%) | 431 (26.5%) |
| 3 or more Vehicles | 1,098 (56.8%) | 359 (22.1%) |
| Total | 1,934 (100.0%) | 1,627 (100.0%) |
Real Estate & Mortgages in East Rancho Dominguez
Real Estate and Mortgage Overview in East Rancho Dominguez
| Characteristic | Without Mortgage | With Mortgage |
| Housing Units | 441 | 1,493 |
| Median Property Value | $457,700 | $485,300 |
| Median Household Income | $91,696 | $334 |
| Monthly Housing Costs | $607 | $259 |
| Real Estate Taxes | $2,849 | $25 |
Property Value by Mortgage Status in East Rancho Dominguez
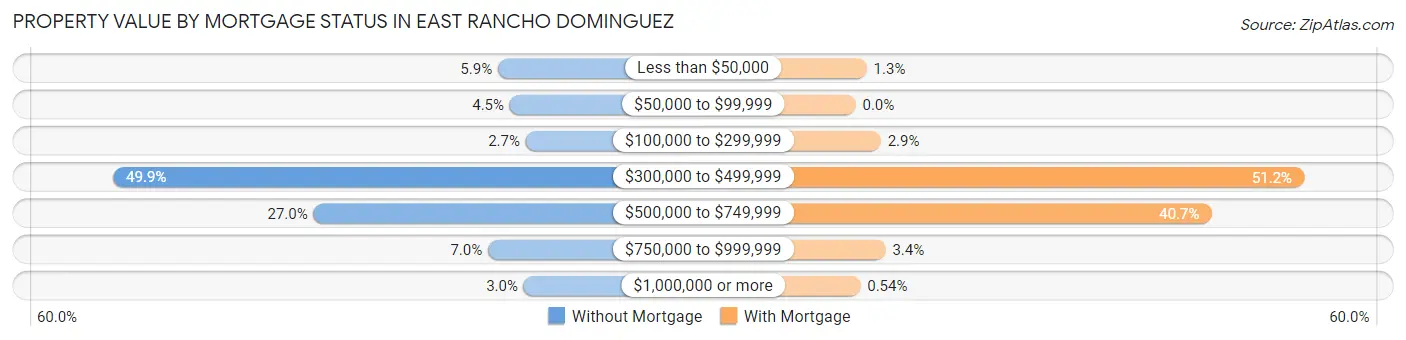
| Property Value | Without Mortgage | With Mortgage |
| Less than $50,000 | 26 (5.9%) | 19 (1.3%) |
| $50,000 to $99,999 | 20 (4.5%) | 0 (0.0%) |
| $100,000 to $299,999 | 12 (2.7%) | 43 (2.9%) |
| $300,000 to $499,999 | 220 (49.9%) | 765 (51.2%) |
| $500,000 to $749,999 | 119 (27.0%) | 607 (40.7%) |
| $750,000 to $999,999 | 31 (7.0%) | 51 (3.4%) |
| $1,000,000 or more | 13 (2.9%) | 8 (0.5%) |
| Total | 441 (100.0%) | 1,493 (100.0%) |
Household Income by Mortgage Status in East Rancho Dominguez
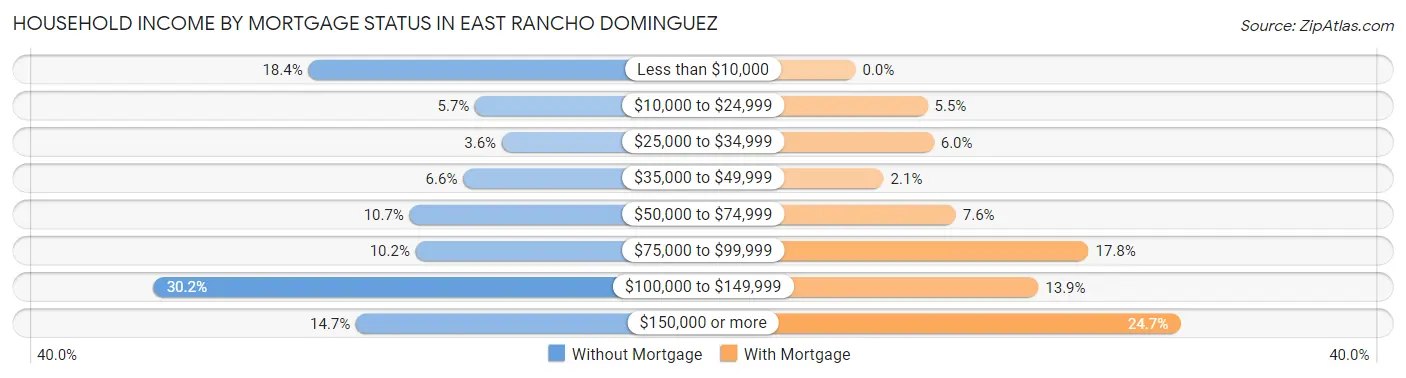
| Household Income | Without Mortgage | With Mortgage |
| Less than $10,000 | 81 (18.4%) | 0 (0.0%) |
| $10,000 to $24,999 | 25 (5.7%) | 82 (5.5%) |
| $25,000 to $34,999 | 16 (3.6%) | 89 (6.0%) |
| $35,000 to $49,999 | 29 (6.6%) | 32 (2.1%) |
| $50,000 to $74,999 | 47 (10.7%) | 114 (7.6%) |
| $75,000 to $99,999 | 45 (10.2%) | 265 (17.7%) |
| $100,000 to $149,999 | 133 (30.2%) | 208 (13.9%) |
| $150,000 or more | 65 (14.7%) | 369 (24.7%) |
| Total | 441 (100.0%) | 1,493 (100.0%) |
Property Value to Household Income Ratio in East Rancho Dominguez
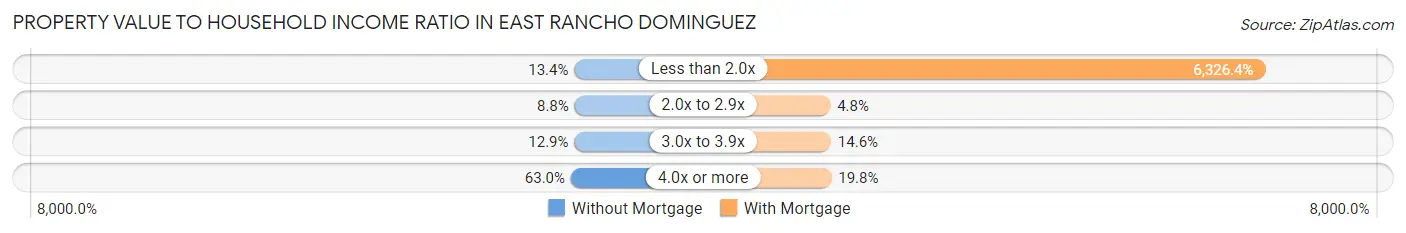
| Value-to-Income Ratio | Without Mortgage | With Mortgage |
| Less than 2.0x | 59 (13.4%) | 94,453 (6,326.4%) |
| 2.0x to 2.9x | 39 (8.8%) | 71 (4.8%) |
| 3.0x to 3.9x | 57 (12.9%) | 218 (14.6%) |
| 4.0x or more | 278 (63.0%) | 296 (19.8%) |
| Total | 441 (100.0%) | 1,493 (100.0%) |
Real Estate Taxes by Mortgage Status in East Rancho Dominguez
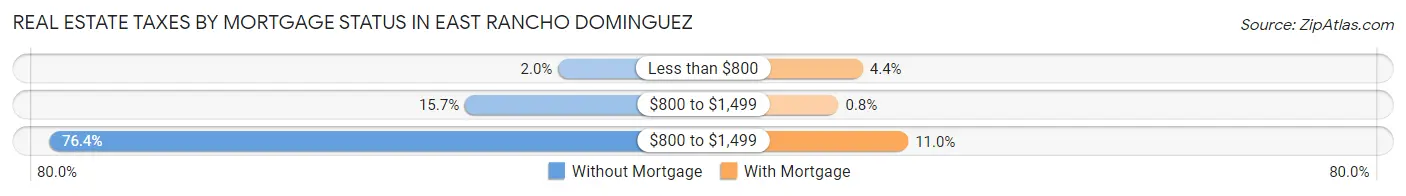
| Property Taxes | Without Mortgage | With Mortgage |
| Less than $800 | 9 (2.0%) | 65 (4.3%) |
| $800 to $1,499 | 69 (15.7%) | 12 (0.8%) |
| $800 to $1,499 | 337 (76.4%) | 164 (11.0%) |
| Total | 441 (100.0%) | 1,493 (100.0%) |
Health & Disability in East Rancho Dominguez
Health Insurance Coverage by Age in East Rancho Dominguez
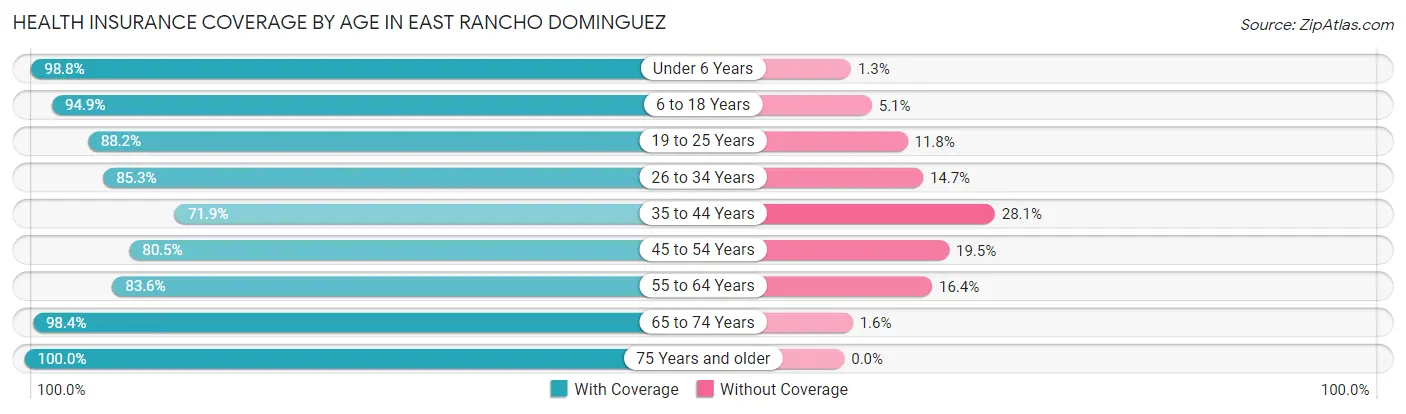
| Age Bracket | With Coverage | Without Coverage |
| Under 6 Years | 791 (98.8%) | 10 (1.3%) |
| 6 to 18 Years | 3,125 (94.9%) | 169 (5.1%) |
| 19 to 25 Years | 1,563 (88.2%) | 209 (11.8%) |
| 26 to 34 Years | 1,774 (85.3%) | 305 (14.7%) |
| 35 to 44 Years | 1,425 (71.9%) | 556 (28.1%) |
| 45 to 54 Years | 1,463 (80.5%) | 355 (19.5%) |
| 55 to 64 Years | 1,604 (83.6%) | 314 (16.4%) |
| 65 to 74 Years | 688 (98.4%) | 11 (1.6%) |
| 75 Years and older | 552 (100.0%) | 0 (0.0%) |
| Total | 12,985 (87.1%) | 1,929 (12.9%) |
Health Insurance Coverage by Citizenship Status in East Rancho Dominguez
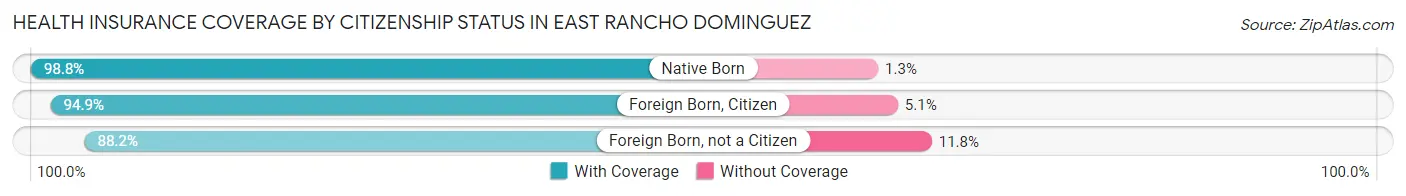
| Citizenship Status | With Coverage | Without Coverage |
| Native Born | 791 (98.8%) | 10 (1.3%) |
| Foreign Born, Citizen | 3,125 (94.9%) | 169 (5.1%) |
| Foreign Born, not a Citizen | 1,563 (88.2%) | 209 (11.8%) |
Health Insurance Coverage by Household Income in East Rancho Dominguez
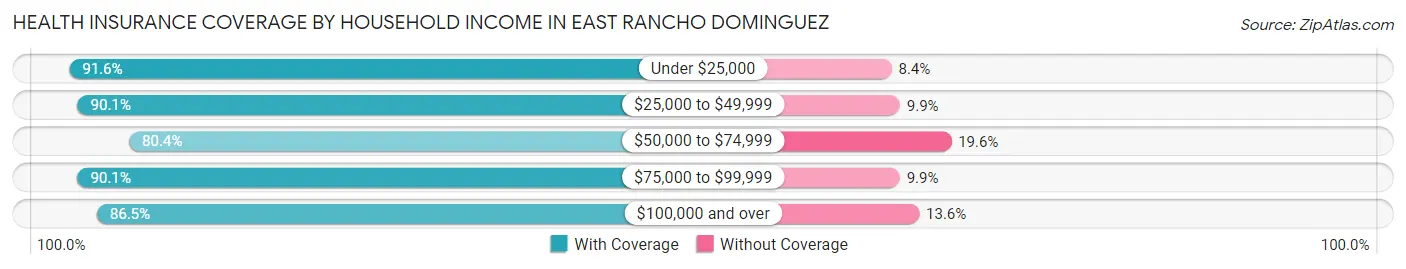
| Household Income | With Coverage | Without Coverage |
| Under $25,000 | 1,814 (91.6%) | 166 (8.4%) |
| $25,000 to $49,999 | 1,467 (90.1%) | 162 (9.9%) |
| $50,000 to $74,999 | 1,871 (80.4%) | 455 (19.6%) |
| $75,000 to $99,999 | 1,698 (90.1%) | 187 (9.9%) |
| $100,000 and over | 6,082 (86.5%) | 953 (13.6%) |
Public vs Private Health Insurance Coverage by Age in East Rancho Dominguez
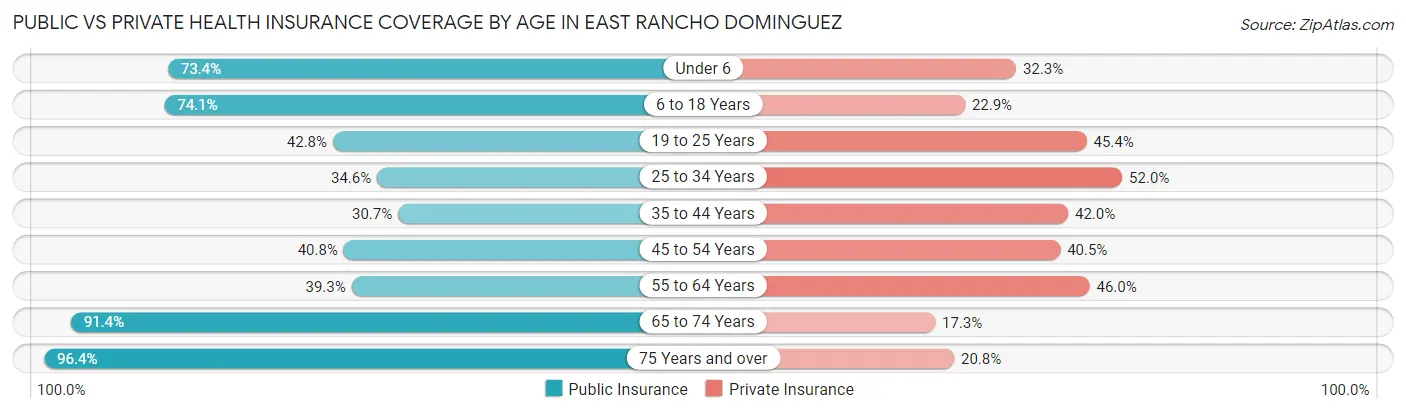
| Age Bracket | Public Insurance | Private Insurance |
| Under 6 | 588 (73.4%) | 259 (32.3%) |
| 6 to 18 Years | 2,440 (74.1%) | 753 (22.9%) |
| 19 to 25 Years | 758 (42.8%) | 805 (45.4%) |
| 25 to 34 Years | 719 (34.6%) | 1,082 (52.0%) |
| 35 to 44 Years | 608 (30.7%) | 832 (42.0%) |
| 45 to 54 Years | 741 (40.8%) | 737 (40.5%) |
| 55 to 64 Years | 754 (39.3%) | 882 (46.0%) |
| 65 to 74 Years | 639 (91.4%) | 121 (17.3%) |
| 75 Years and over | 532 (96.4%) | 115 (20.8%) |
| Total | 7,779 (52.2%) | 5,586 (37.4%) |
Disability Status by Sex by Age in East Rancho Dominguez
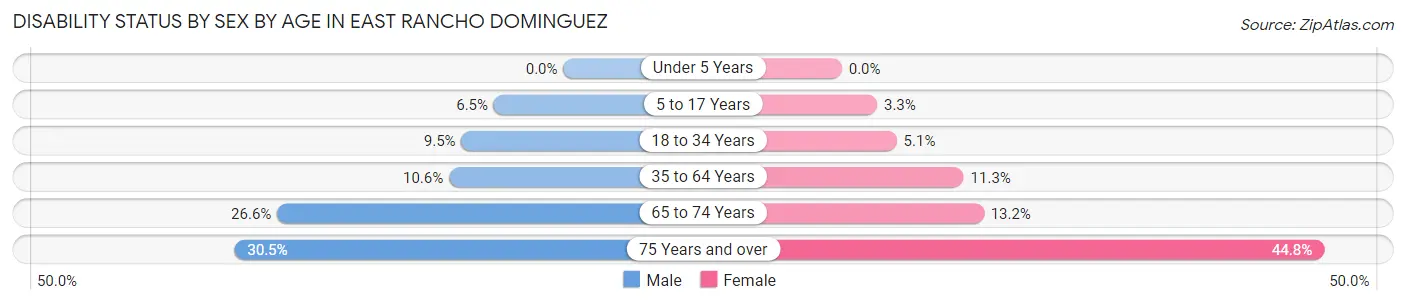
| Age Bracket | Male | Female |
| Under 5 Years | 0 (0.0%) | 0 (0.0%) |
| 5 to 17 Years | 102 (6.5%) | 52 (3.3%) |
| 18 to 34 Years | 220 (9.5%) | 89 (5.1%) |
| 35 to 64 Years | 297 (10.6%) | 330 (11.3%) |
| 65 to 74 Years | 111 (26.6%) | 37 (13.2%) |
| 75 Years and over | 58 (30.5%) | 162 (44.8%) |
Disability Class by Sex by Age in East Rancho Dominguez
Disability Class: Hearing Difficulty
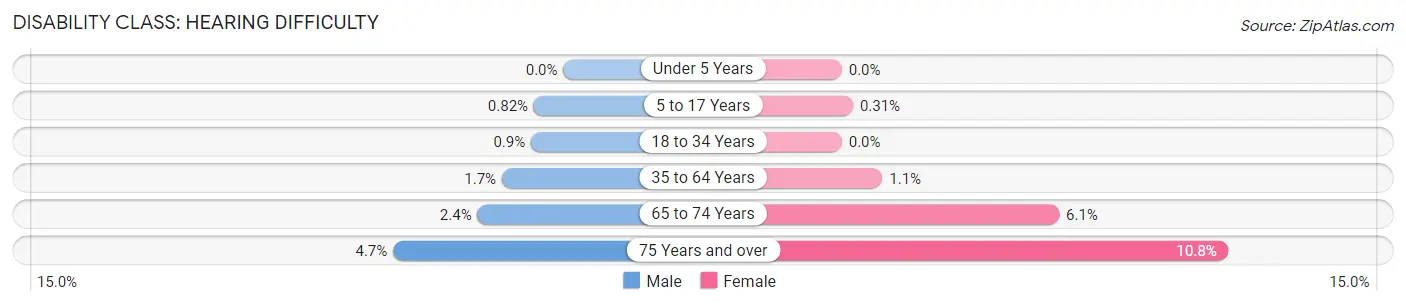
| Age Bracket | Male | Female |
| Under 5 Years | 0 (0.0%) | 0 (0.0%) |
| 5 to 17 Years | 13 (0.8%) | 5 (0.3%) |
| 18 to 34 Years | 21 (0.9%) | 0 (0.0%) |
| 35 to 64 Years | 48 (1.7%) | 33 (1.1%) |
| 65 to 74 Years | 10 (2.4%) | 17 (6.0%) |
| 75 Years and over | 9 (4.7%) | 39 (10.8%) |
Disability Class: Vision Difficulty
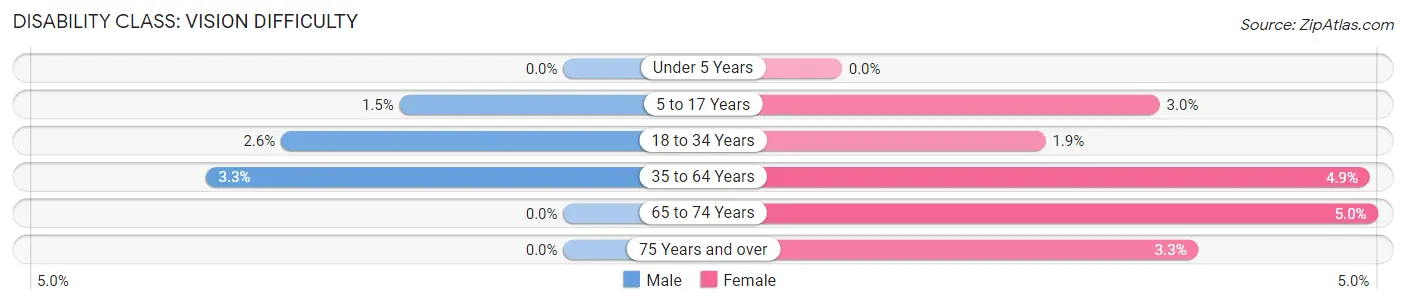
| Age Bracket | Male | Female |
| Under 5 Years | 0 (0.0%) | 0 (0.0%) |
| 5 to 17 Years | 24 (1.5%) | 47 (2.9%) |
| 18 to 34 Years | 61 (2.6%) | 33 (1.9%) |
| 35 to 64 Years | 93 (3.3%) | 143 (4.9%) |
| 65 to 74 Years | 0 (0.0%) | 14 (5.0%) |
| 75 Years and over | 0 (0.0%) | 12 (3.3%) |
Disability Class: Cognitive Difficulty
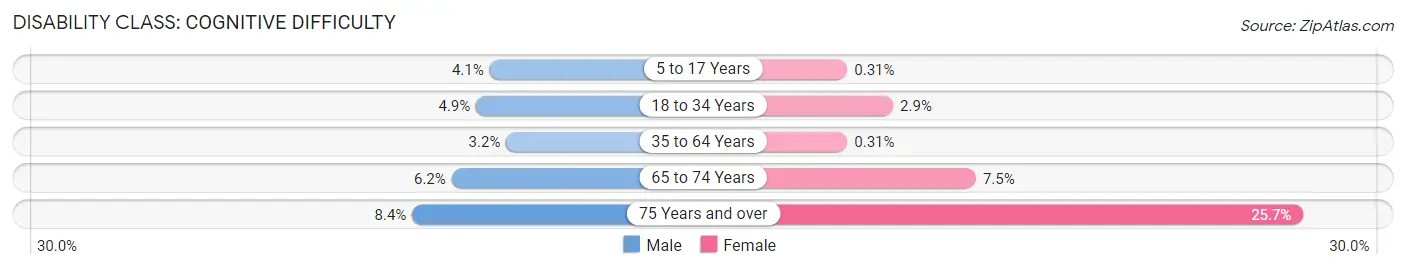
| Age Bracket | Male | Female |
| 5 to 17 Years | 65 (4.1%) | 5 (0.3%) |
| 18 to 34 Years | 113 (4.9%) | 50 (2.9%) |
| 35 to 64 Years | 89 (3.2%) | 9 (0.3%) |
| 65 to 74 Years | 26 (6.2%) | 21 (7.5%) |
| 75 Years and over | 16 (8.4%) | 93 (25.7%) |
Disability Class: Ambulatory Difficulty
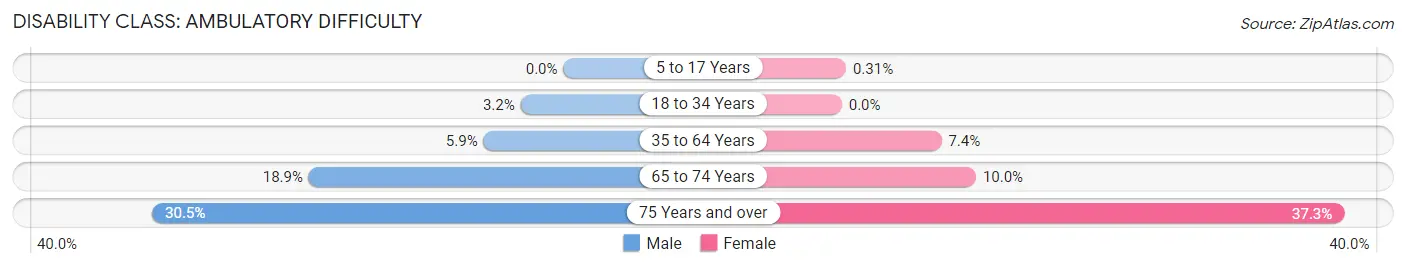
| Age Bracket | Male | Female |
| 5 to 17 Years | 0 (0.0%) | 5 (0.3%) |
| 18 to 34 Years | 74 (3.2%) | 0 (0.0%) |
| 35 to 64 Years | 166 (5.9%) | 216 (7.4%) |
| 65 to 74 Years | 79 (18.9%) | 28 (10.0%) |
| 75 Years and over | 58 (30.5%) | 135 (37.3%) |
Disability Class: Self-Care Difficulty
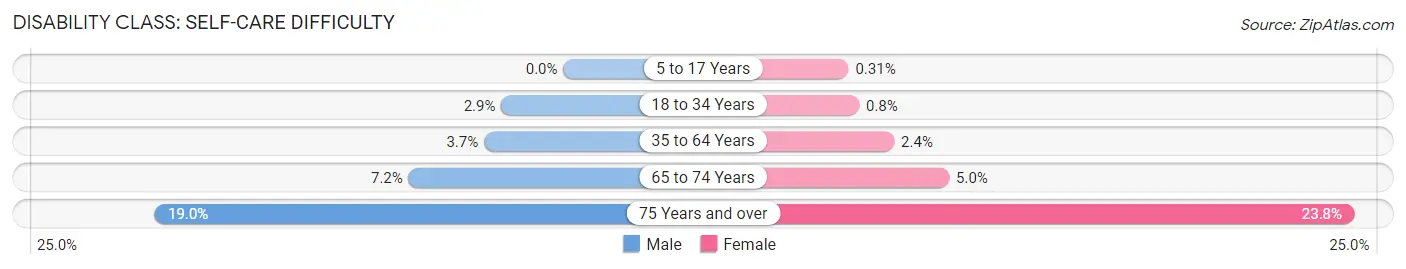
| Age Bracket | Male | Female |
| 5 to 17 Years | 0 (0.0%) | 5 (0.3%) |
| 18 to 34 Years | 67 (2.9%) | 14 (0.8%) |
| 35 to 64 Years | 103 (3.7%) | 71 (2.4%) |
| 65 to 74 Years | 30 (7.2%) | 14 (5.0%) |
| 75 Years and over | 36 (19.0%) | 86 (23.8%) |
Technology Access in East Rancho Dominguez
Computing Device Access in East Rancho Dominguez
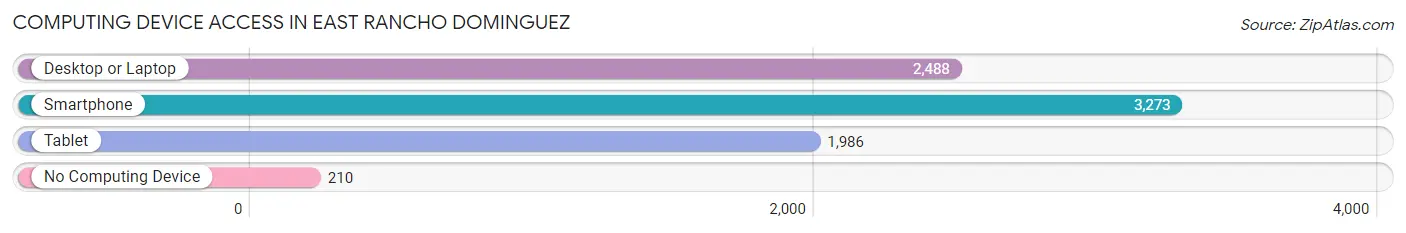
| Device Type | # Households | % Households |
| Desktop or Laptop | 2,488 | 69.9% |
| Smartphone | 3,273 | 91.9% |
| Tablet | 1,986 | 55.8% |
| No Computing Device | 210 | 5.9% |
| Total | 3,561 | 100.0% |
Internet Access in East Rancho Dominguez
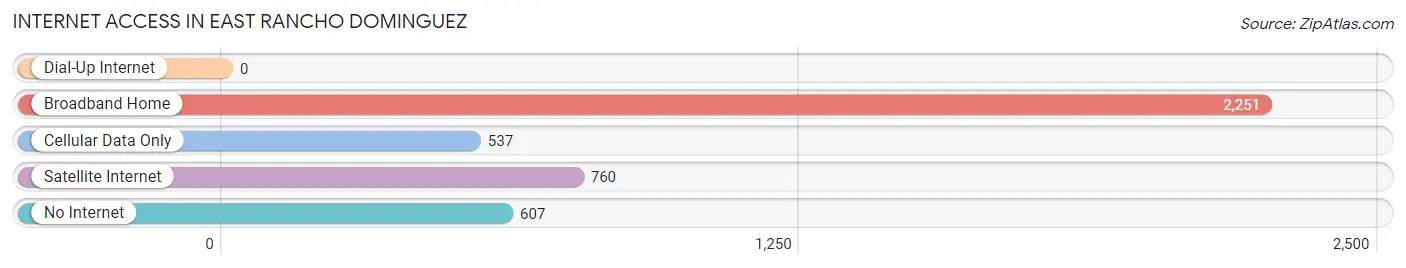
| Internet Type | # Households | % Households |
| Dial-Up Internet | 0 | 0.0% |
| Broadband Home | 2,251 | 63.2% |
| Cellular Data Only | 537 | 15.1% |
| Satellite Internet | 760 | 21.3% |
| No Internet | 607 | 17.1% |
| Total | 3,561 | 100.0% |
East Rancho Dominguez Summary
Rancho Dominguez is a small unincorporated community located in Los Angeles County, California. It is situated in the South Bay region of the Greater Los Angeles Area, and is bordered by the cities of Compton, Long Beach, and Carson. The community is named after the Rancho San Pedro, which was granted to Juan Jose Dominguez in 1784.
History
The area that is now Rancho Dominguez was originally inhabited by the Tongva people, who were the original inhabitants of the Los Angeles Basin. The area was part of the Rancho San Pedro, which was granted to Juan Jose Dominguez in 1784. The rancho was later divided into several smaller ranchos, including Rancho Dominguez.
In the late 19th century, the area was developed as a farming community. The area was home to a number of small farms, as well as a few larger ones. The area was also home to a number of small businesses, including a blacksmith shop, a general store, and a post office.
In the early 20th century, the area began to experience rapid growth due to the development of the oil industry in the region. The area was home to several oil wells, as well as a number of oil refineries. The area also experienced a population boom, as many people moved to the area to work in the oil industry.
In the 1950s, the area began to experience a decline in the oil industry, and many of the businesses and farms in the area closed. The area also experienced a population decline, as many people moved away from the area.
In the late 20th century, the area began to experience a resurgence in population growth, as many people moved to the area to take advantage of the affordable housing and close proximity to Los Angeles. The area also experienced a resurgence in business growth, as many new businesses opened in the area.
Geography
Rancho Dominguez is located in the South Bay region of the Greater Los Angeles Area. It is bordered by the cities of Compton, Long Beach, and Carson. The community is situated on the Rancho San Pedro, which was granted to Juan Jose Dominguez in 1784.
The area is mostly flat, with some rolling hills. The area is home to a number of small creeks and streams, as well as a few larger ones. The area is also home to a number of parks and open spaces, including the Rancho Dominguez Park and the Rancho Dominguez Recreation Center.
Economy
The economy of Rancho Dominguez is largely based on the service industry. The area is home to a number of small businesses, including restaurants, retail stores, and auto repair shops. The area is also home to a number of larger businesses, including a number of manufacturing plants and warehouses.
The area is also home to a number of oil refineries, as well as a number of oil wells. The area is also home to a number of industrial parks, which are home to a number of businesses.
Demographics
As of the 2010 census, the population of Rancho Dominguez was 8,845. The racial makeup of the area was 57.3% White, 16.2% African American, 0.7% Native American, 11.2% Asian, 0.2% Pacific Islander, 11.2% from other races, and 3.4% from two or more races. The median household income in the area was $45,845.
Conclusion
Rancho Dominguez is a small unincorporated community located in Los Angeles County, California. It is situated in the South Bay region of the Greater Los Angeles Area, and is bordered by the cities of Compton, Long Beach, and Carson. The area was originally inhabited by the Tongva people, and was later developed as a farming community. In the early 20th century, the area began to experience rapid growth due to the development of the oil industry in the region. In the late 20th century, the area began to experience a resurgence in population growth, as many people moved to the area to take advantage of the affordable housing and close proximity to Los Angeles. The economy of Rancho Dominguez is largely based on the service industry, and the area is home to a number of small businesses, as well as a number of larger businesses. As of the 2010 census, the population of Rancho Dominguez was 8,845.
Common Questions
What is Per Capita Income in East Rancho Dominguez?
Per Capita income in East Rancho Dominguez is $21,024.
What is the Median Family Income in East Rancho Dominguez?
Median Family Income in East Rancho Dominguez is $69,242.
What is the Median Household income in East Rancho Dominguez?
Median Household Income in East Rancho Dominguez is $64,673.
What is Income or Wage Gap in East Rancho Dominguez?
Income or Wage Gap in East Rancho Dominguez is 11.9%.
Women in East Rancho Dominguez earn 88.1 cents for every dollar earned by a man.
What is Family Income Deficit in East Rancho Dominguez?
Family Income Deficit in East Rancho Dominguez is $15,147.
Families that are below poverty line in East Rancho Dominguez earn $15,147 less on average than the poverty threshold level.
What is Inequality or Gini Index in East Rancho Dominguez?
Inequality or Gini Index in East Rancho Dominguez is 0.45.
What is the Total Population of East Rancho Dominguez?
Total Population of East Rancho Dominguez is 14,924.
What is the Total Male Population of East Rancho Dominguez?
Total Male Population of East Rancho Dominguez is 7,667.
What is the Total Female Population of East Rancho Dominguez?
Total Female Population of East Rancho Dominguez is 7,257.
What is the Ratio of Males per 100 Females in East Rancho Dominguez?
There are 105.65 Males per 100 Females in East Rancho Dominguez.
What is the Ratio of Females per 100 Males in East Rancho Dominguez?
There are 94.65 Females per 100 Males in East Rancho Dominguez.
What is the Median Population Age in East Rancho Dominguez?
Median Population Age in East Rancho Dominguez is 32.4 Years.
What is the Average Family Size in East Rancho Dominguez
Average Family Size in East Rancho Dominguez is 4.7 People.
What is the Average Household Size in East Rancho Dominguez
Average Household Size in East Rancho Dominguez is 4.2 People.
How Large is the Labor Force in East Rancho Dominguez?
There are 7,152 People in the Labor Forcein in East Rancho Dominguez.
What is the Percentage of People in the Labor Force in East Rancho Dominguez?
61.1% of People are in the Labor Force in East Rancho Dominguez.
What is the Unemployment Rate in East Rancho Dominguez?
Unemployment Rate in East Rancho Dominguez is 6.5%.