Dutch Flat, CA Map & Demographics
Dutch Flat Map
Dutch Flat Overview
$42,330
PER CAPITA INCOME
$105,938
AVG FAMILY INCOME
39.0%
WAGE / INCOME GAP [ % ]
61.0¢/ $1
WAGE / INCOME GAP [ $ ]
0.35
INEQUALITY / GINI INDEX
104
TOTAL POPULATION
62
MALE POPULATION
42
FEMALE POPULATION
147.62
MALES / 100 FEMALES
67.74
FEMALES / 100 MALES
56.3
MEDIAN AGE
2.3
AVG FAMILY SIZE
1.8
AVG HOUSEHOLD SIZE
61
LABOR FORCE [ PEOPLE ]
63.5%
PERCENT IN LABOR FORCE
14.8%
UNEMPLOYMENT RATE
Dutch Flat Zip Codes
Income in Dutch Flat
Income Overview in Dutch Flat
| Characteristic | Number | Measure |
| Per Capita Income | 104 | $42,330 |
| Median Family Income | 29 | $105,938 |
| Mean Family Income | 29 | $98,162 |
| Median Household Income | 59 | $0 |
| Mean Household Income | 59 | $75,008 |
| Income Deficit | 29 | $0 |
| Wage / Income Gap (%) | 104 | 38.99% |
| Wage / Income Gap ($) | 104 | 61.01¢ per $1 |
| Gini / Inequality Index | 104 | 0.35 |
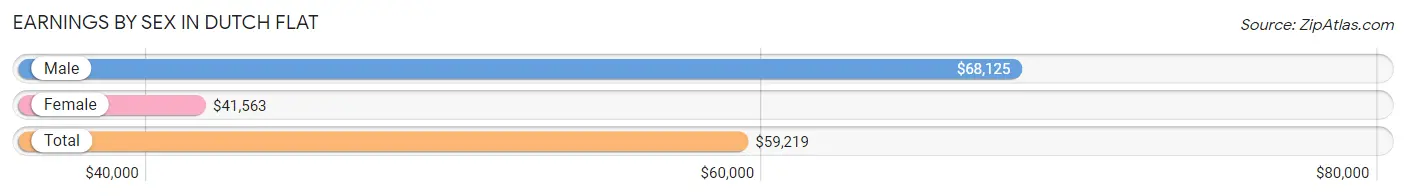
Earnings by Sex in Dutch Flat
Average Earnings in Dutch Flat are $59,219, $68,125 for men and $41,563 for women, a difference of 39.0%.
| Sex | Number | Average Earnings |
| Male | 30 (49.2%) | $68,125 |
| Female | 31 (50.8%) | $41,563 |
| Total | 61 (100.0%) | $59,219 |
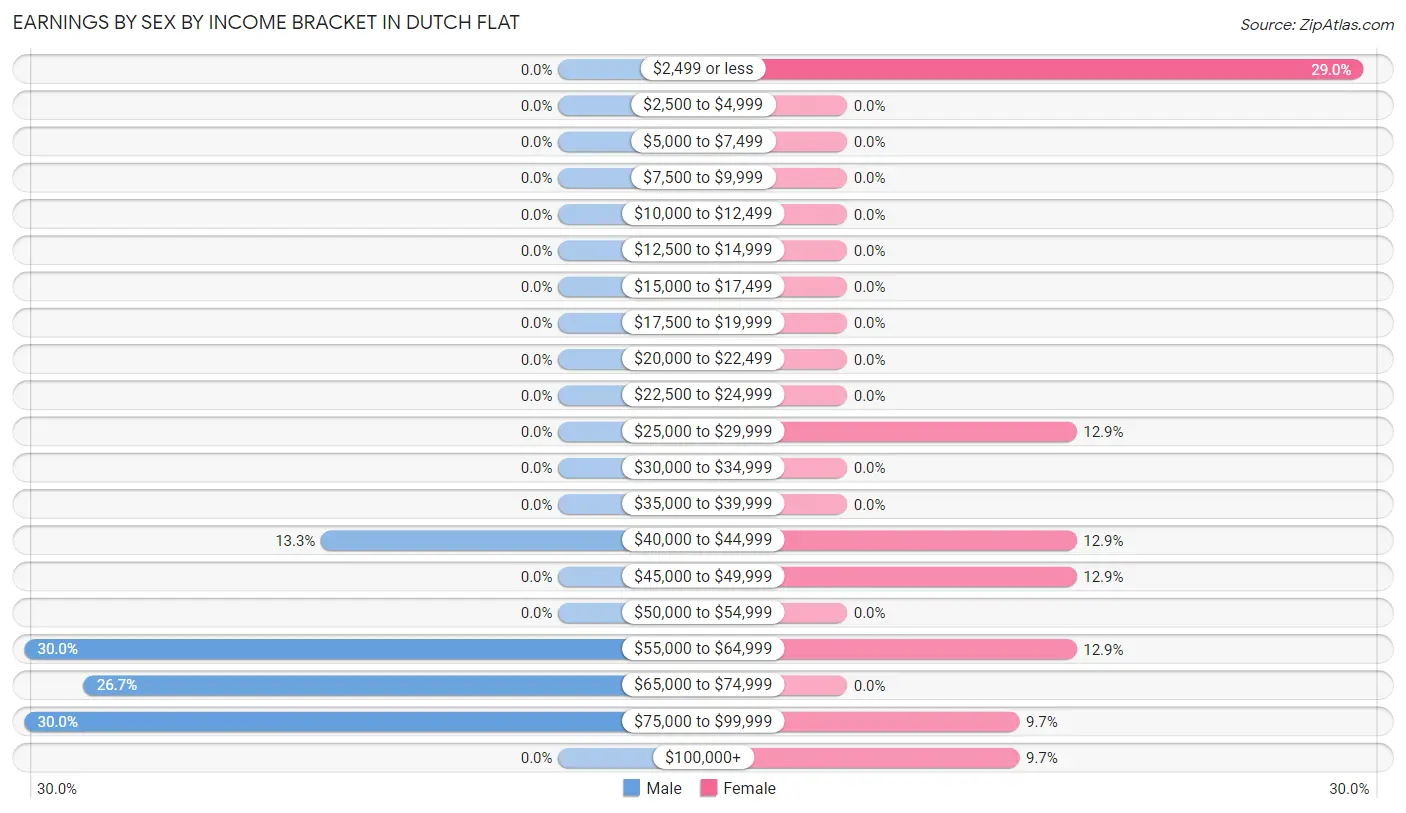
Earnings by Sex by Income Bracket in Dutch Flat
The most common earnings brackets in Dutch Flat are $55,000 to $64,999 for men (9 | 30.0%) and $2,499 or less for women (9 | 29.0%).
| Income | Male | Female |
| $2,499 or less | 0 (0.0%) | 9 (29.0%) |
| $2,500 to $4,999 | 0 (0.0%) | 0 (0.0%) |
| $5,000 to $7,499 | 0 (0.0%) | 0 (0.0%) |
| $7,500 to $9,999 | 0 (0.0%) | 0 (0.0%) |
| $10,000 to $12,499 | 0 (0.0%) | 0 (0.0%) |
| $12,500 to $14,999 | 0 (0.0%) | 0 (0.0%) |
| $15,000 to $17,499 | 0 (0.0%) | 0 (0.0%) |
| $17,500 to $19,999 | 0 (0.0%) | 0 (0.0%) |
| $20,000 to $22,499 | 0 (0.0%) | 0 (0.0%) |
| $22,500 to $24,999 | 0 (0.0%) | 0 (0.0%) |
| $25,000 to $29,999 | 0 (0.0%) | 4 (12.9%) |
| $30,000 to $34,999 | 0 (0.0%) | 0 (0.0%) |
| $35,000 to $39,999 | 0 (0.0%) | 0 (0.0%) |
| $40,000 to $44,999 | 4 (13.3%) | 4 (12.9%) |
| $45,000 to $49,999 | 0 (0.0%) | 4 (12.9%) |
| $50,000 to $54,999 | 0 (0.0%) | 0 (0.0%) |
| $55,000 to $64,999 | 9 (30.0%) | 4 (12.9%) |
| $65,000 to $74,999 | 8 (26.7%) | 0 (0.0%) |
| $75,000 to $99,999 | 9 (30.0%) | 3 (9.7%) |
| $100,000+ | 0 (0.0%) | 3 (9.7%) |
| Total | 30 (100.0%) | 31 (100.0%) |
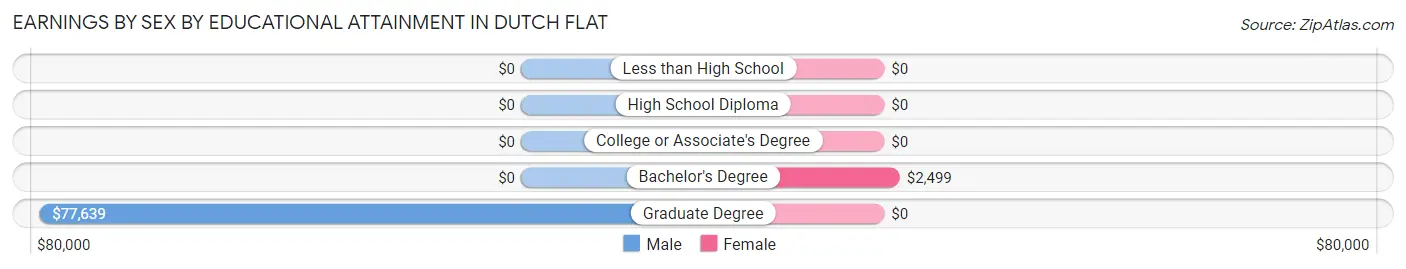
Earnings by Sex by Educational Attainment in Dutch Flat
Average earnings in Dutch Flat are $68,125 for men and $41,563 for women, a difference of 39.0%. Men with an educational attainment of graduate degree enjoy the highest average annual earnings of $77,639, while those with graduate degree education earn the least with $77,639. Women with an educational attainment of bachelor's degree earn the most with the average annual earnings of $2,499, while those with bachelor's degree education have the smallest earnings of $2,499.
| Educational Attainment | Male Income | Female Income |
| Less than High School | - | - |
| High School Diploma | - | - |
| College or Associate's Degree | - | - |
| Bachelor's Degree | - | - |
| Graduate Degree | $77,639 | $0 |
| Total | $68,125 | $41,563 |
Family Income in Dutch Flat
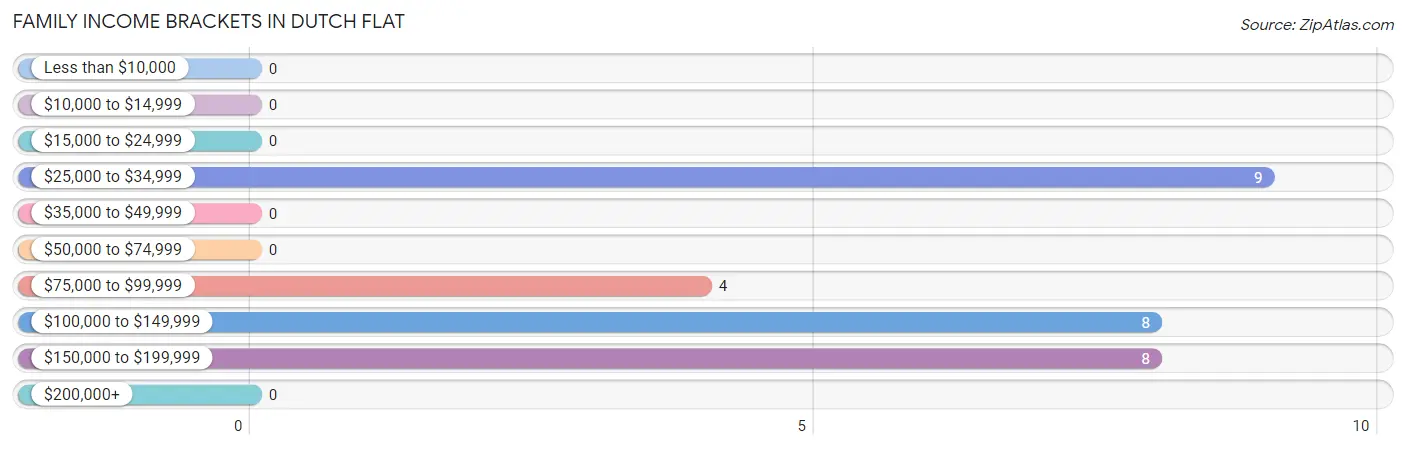
Family Income Brackets in Dutch Flat
According to the Dutch Flat family income data, there are 9 families falling into the $25,000 to $34,999 income range, which is the most common income bracket and makes up 31.0% of all families.
| Income Bracket | # Families | % Families |
| Less than $10,000 | 0 | 0.0% |
| $10,000 to $14,999 | 0 | 0.0% |
| $15,000 to $24,999 | 0 | 0.0% |
| $25,000 to $34,999 | 9 | 31.0% |
| $35,000 to $49,999 | 0 | 0.0% |
| $50,000 to $74,999 | 0 | 0.0% |
| $75,000 to $99,999 | 4 | 13.8% |
| $100,000 to $149,999 | 8 | 27.6% |
| $150,000 to $199,999 | 8 | 27.6% |
| $200,000+ | 0 | 0.0% |
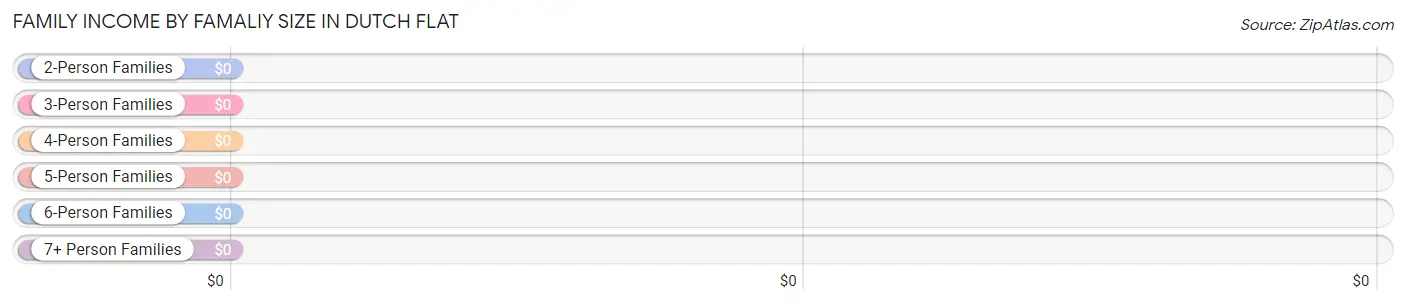
Family Income by Famaliy Size in Dutch Flat
| Income Bracket | # Families | Median Income |
| 2-Person Families | 20 (69.0%) | $0 |
| 3-Person Families | 9 (31.0%) | $0 |
| 4-Person Families | 0 (0.0%) | $0 |
| 5-Person Families | 0 (0.0%) | $0 |
| 6-Person Families | 0 (0.0%) | $0 |
| 7+ Person Families | 0 (0.0%) | $0 |
| Total | 29 (100.0%) | $105,938 |
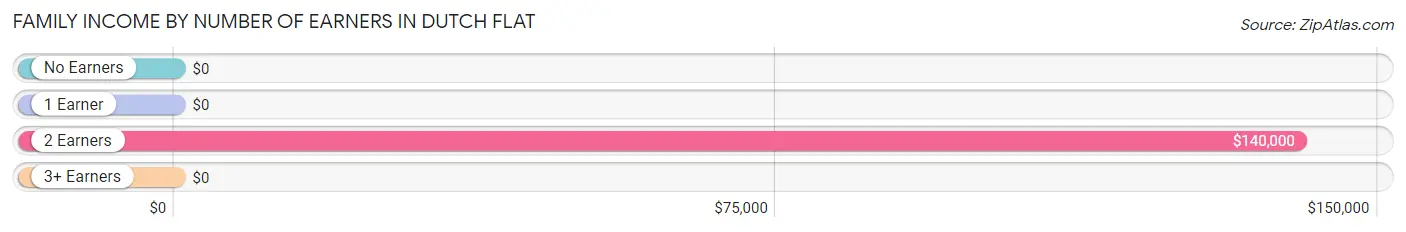
Family Income by Number of Earners in Dutch Flat
| Number of Earners | # Families | Median Income |
| No Earners | 0 (0.0%) | $0 |
| 1 Earner | 13 (44.8%) | $0 |
| 2 Earners | 16 (55.2%) | $140,000 |
| 3+ Earners | 0 (0.0%) | $0 |
| Total | 29 (100.0%) | $105,938 |
Household Income in Dutch Flat
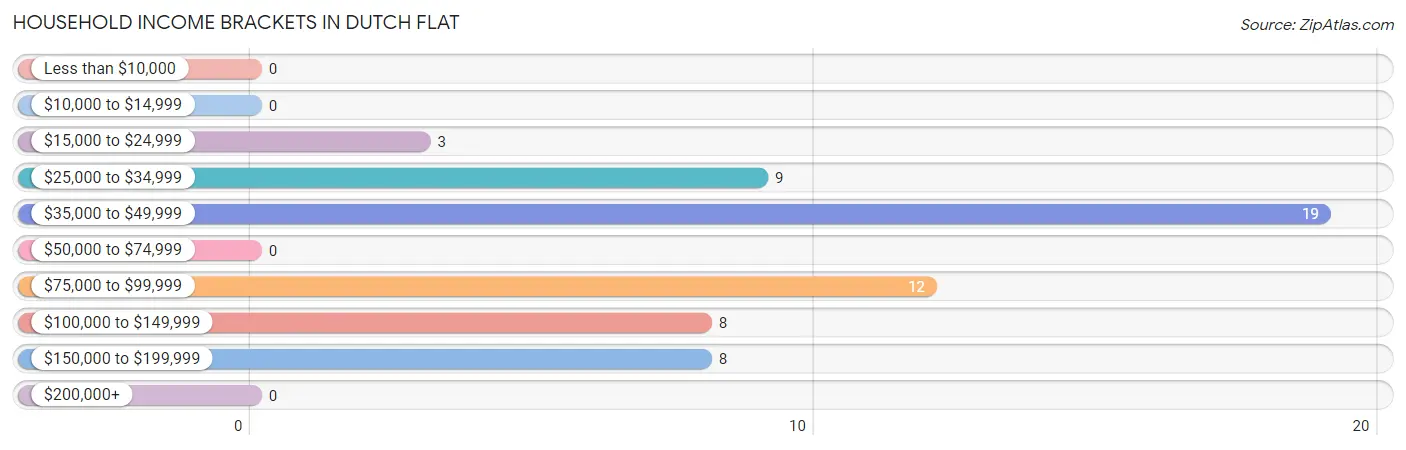
Household Income Brackets in Dutch Flat
With 19 households falling in the category, the $35,000 to $49,999 income range is the most frequent in Dutch Flat, accounting for 32.2% of all households.
| Income Bracket | # Households | % Households |
| Less than $10,000 | 0 | 0.0% |
| $10,000 to $14,999 | 0 | 0.0% |
| $15,000 to $24,999 | 3 | 5.1% |
| $25,000 to $34,999 | 9 | 15.3% |
| $35,000 to $49,999 | 19 | 32.2% |
| $50,000 to $74,999 | 0 | 0.0% |
| $75,000 to $99,999 | 12 | 20.3% |
| $100,000 to $149,999 | 8 | 13.6% |
| $150,000 to $199,999 | 8 | 13.6% |
| $200,000+ | 0 | 0.0% |
Household Income by Householder Age in Dutch Flat
The median household income in Dutch Flat is $0, with the highest median household income of $43,125 found in the 65+ years age bracket for the primary householder. A total of 22 households (37.3%) fall into this category.
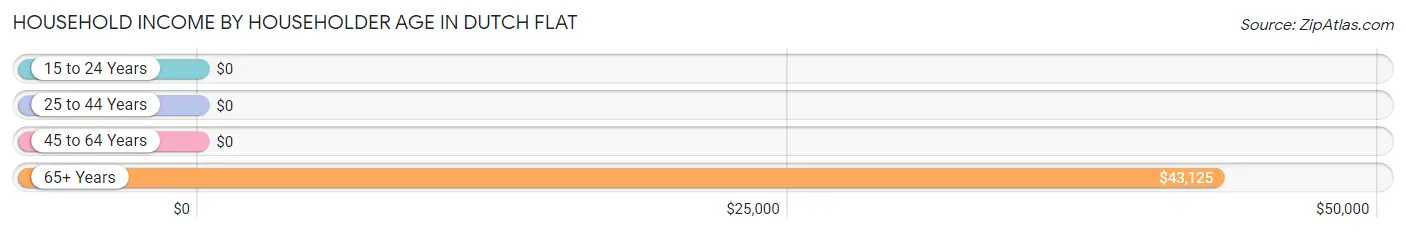
| Income Bracket | # Households | Median Income |
| 15 to 24 Years | 0 (0.0%) | $0 |
| 25 to 44 Years | 21 (35.6%) | $0 |
| 45 to 64 Years | 16 (27.1%) | $0 |
| 65+ Years | 22 (37.3%) | $43,125 |
| Total | 59 (100.0%) | $0 |
Poverty in Dutch Flat
Income Below Poverty by Sex and Age in Dutch Flat
With 11.3% poverty level for males and 7.1% for females among the residents of Dutch Flat, 65 to 74 year old males and 65 to 74 year old females are the most vulnerable to poverty, with 4 males (33.3%) and 3 females (42.9%) in their respective age groups living below the poverty level.
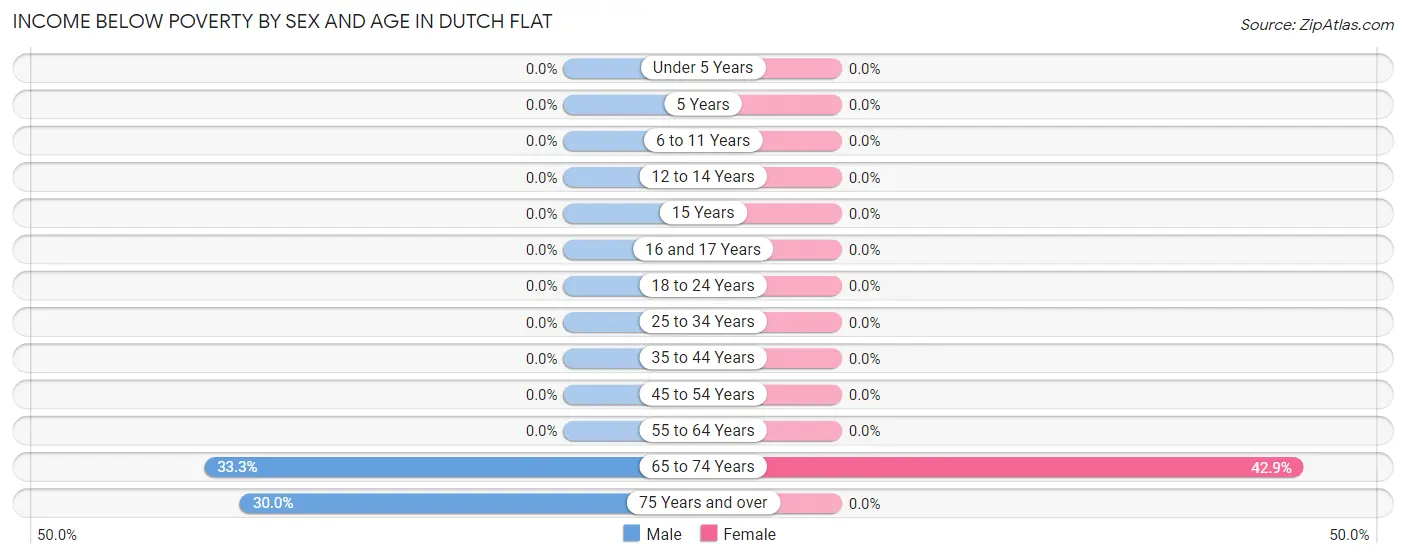
| Age Bracket | Male | Female |
| Under 5 Years | 0 (0.0%) | 0 (0.0%) |
| 5 Years | 0 (0.0%) | 0 (0.0%) |
| 6 to 11 Years | 0 (0.0%) | 0 (0.0%) |
| 12 to 14 Years | 0 (0.0%) | 0 (0.0%) |
| 15 Years | 0 (0.0%) | 0 (0.0%) |
| 16 and 17 Years | 0 (0.0%) | 0 (0.0%) |
| 18 to 24 Years | 0 (0.0%) | 0 (0.0%) |
| 25 to 34 Years | 0 (0.0%) | 0 (0.0%) |
| 35 to 44 Years | 0 (0.0%) | 0 (0.0%) |
| 45 to 54 Years | 0 (0.0%) | 0 (0.0%) |
| 55 to 64 Years | 0 (0.0%) | 0 (0.0%) |
| 65 to 74 Years | 4 (33.3%) | 3 (42.9%) |
| 75 Years and over | 3 (30.0%) | 0 (0.0%) |
| Total | 7 (11.3%) | 3 (7.1%) |
Income Above Poverty by Sex and Age in Dutch Flat
According to the poverty statistics in Dutch Flat, males aged under 5 years and females aged 25 to 34 years are the age groups that are most secure financially, with 100.0% of males and 100.0% of females in these age groups living above the poverty line.
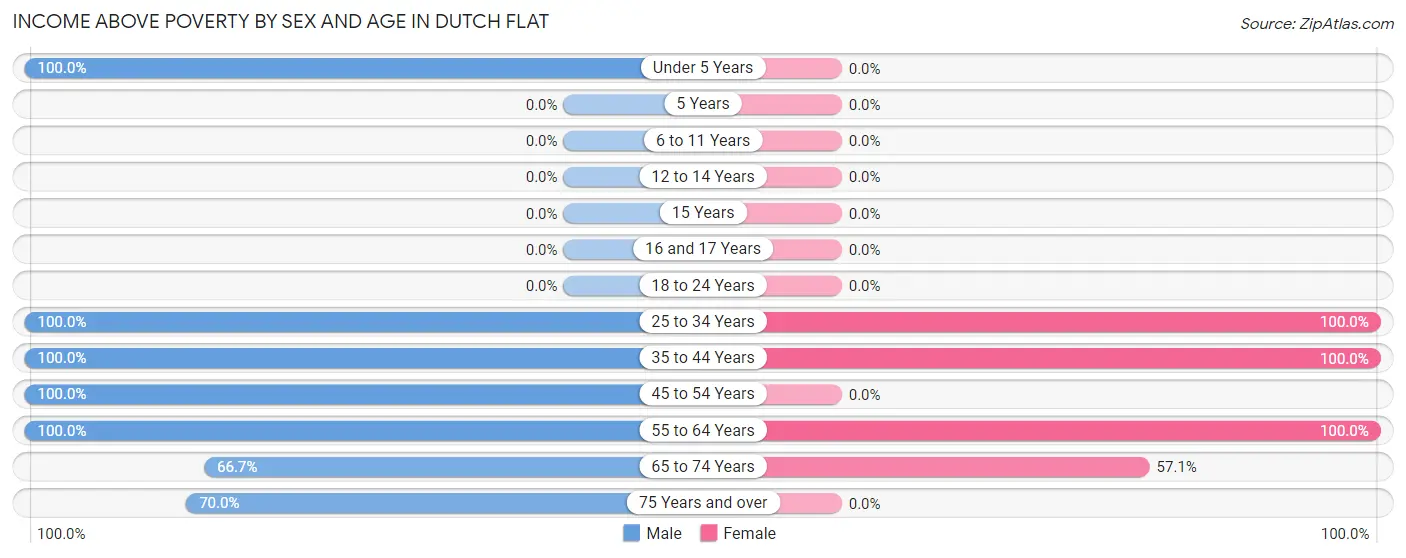
| Age Bracket | Male | Female |
| Under 5 Years | 8 (100.0%) | 0 (0.0%) |
| 5 Years | 0 (0.0%) | 0 (0.0%) |
| 6 to 11 Years | 0 (0.0%) | 0 (0.0%) |
| 12 to 14 Years | 0 (0.0%) | 0 (0.0%) |
| 15 Years | 0 (0.0%) | 0 (0.0%) |
| 16 and 17 Years | 0 (0.0%) | 0 (0.0%) |
| 18 to 24 Years | 0 (0.0%) | 0 (0.0%) |
| 25 to 34 Years | 5 (100.0%) | 7 (100.0%) |
| 35 to 44 Years | 9 (100.0%) | 12 (100.0%) |
| 45 to 54 Years | 10 (100.0%) | 0 (0.0%) |
| 55 to 64 Years | 8 (100.0%) | 16 (100.0%) |
| 65 to 74 Years | 8 (66.7%) | 4 (57.1%) |
| 75 Years and over | 7 (70.0%) | 0 (0.0%) |
| Total | 55 (88.7%) | 39 (92.9%) |
Income Below Poverty Among Married-Couple Families in Dutch Flat
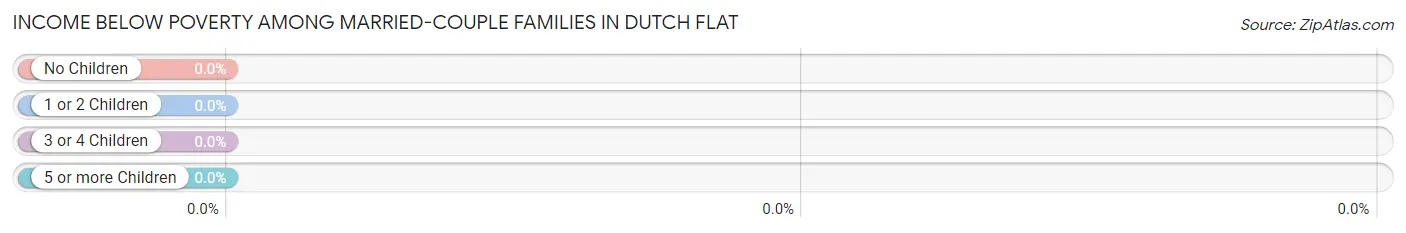
| Children | Above Poverty | Below Poverty |
| No Children | 20 (100.0%) | 0 (0.0%) |
| 1 or 2 Children | 9 (100.0%) | 0 (0.0%) |
| 3 or 4 Children | 0 (0.0%) | 0 (0.0%) |
| 5 or more Children | 0 (0.0%) | 0 (0.0%) |
| Total | 29 (100.0%) | 0 (0.0%) |
Income Below Poverty Among Single-Parent Households in Dutch Flat
| Children | Single Father | Single Mother |
| No Children | 0 (0.0%) | 0 (0.0%) |
| 1 or 2 Children | 0 (0.0%) | 0 (0.0%) |
| 3 or 4 Children | 0 (0.0%) | 0 (0.0%) |
| 5 or more Children | 0 (0.0%) | 0 (0.0%) |
| Total | 0 (0.0%) | 0 (0.0%) |
Income Below Poverty Among Married-Couple vs Single-Parent Households in Dutch Flat
| Children | Married-Couple Families | Single-Parent Households |
| No Children | 0 (0.0%) | 0 (0.0%) |
| 1 or 2 Children | 0 (0.0%) | 0 (0.0%) |
| 3 or 4 Children | 0 (0.0%) | 0 (0.0%) |
| 5 or more Children | 0 (0.0%) | 0 (0.0%) |
| Total | 0 (0.0%) | 0 (0.0%) |
Race in Dutch Flat
The most populous races in Dutch Flat are White / Caucasian (87 | 83.7%), Two or more Races (17 | 16.4%), and Hispanic or Latino (9 | 8.6%).
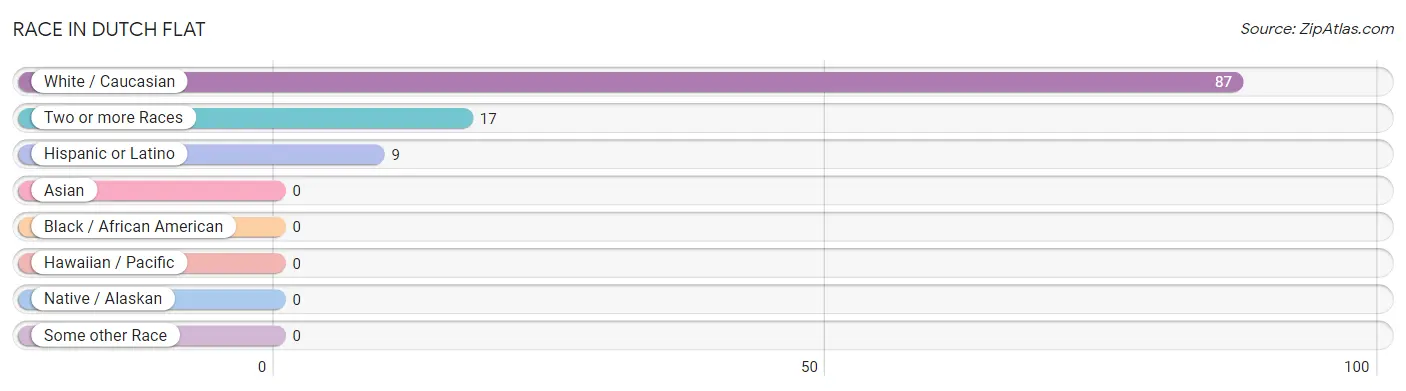
| Race | # Population | % Population |
| Asian | 0 | 0.0% |
| Black / African American | 0 | 0.0% |
| Hawaiian / Pacific | 0 | 0.0% |
| Hispanic or Latino | 9 | 8.6% |
| Native / Alaskan | 0 | 0.0% |
| White / Caucasian | 87 | 83.7% |
| Two or more Races | 17 | 16.4% |
| Some other Race | 0 | 0.0% |
| Total | 104 | 100.0% |
Ancestry in Dutch Flat
The most populous ancestries reported in Dutch Flat are German (27 | 26.0%), Irish (20 | 19.2%), Danish (18 | 17.3%), English (15 | 14.4%), and Korean (10 | 9.6%), together accounting for 86.5% of all Dutch Flat residents.
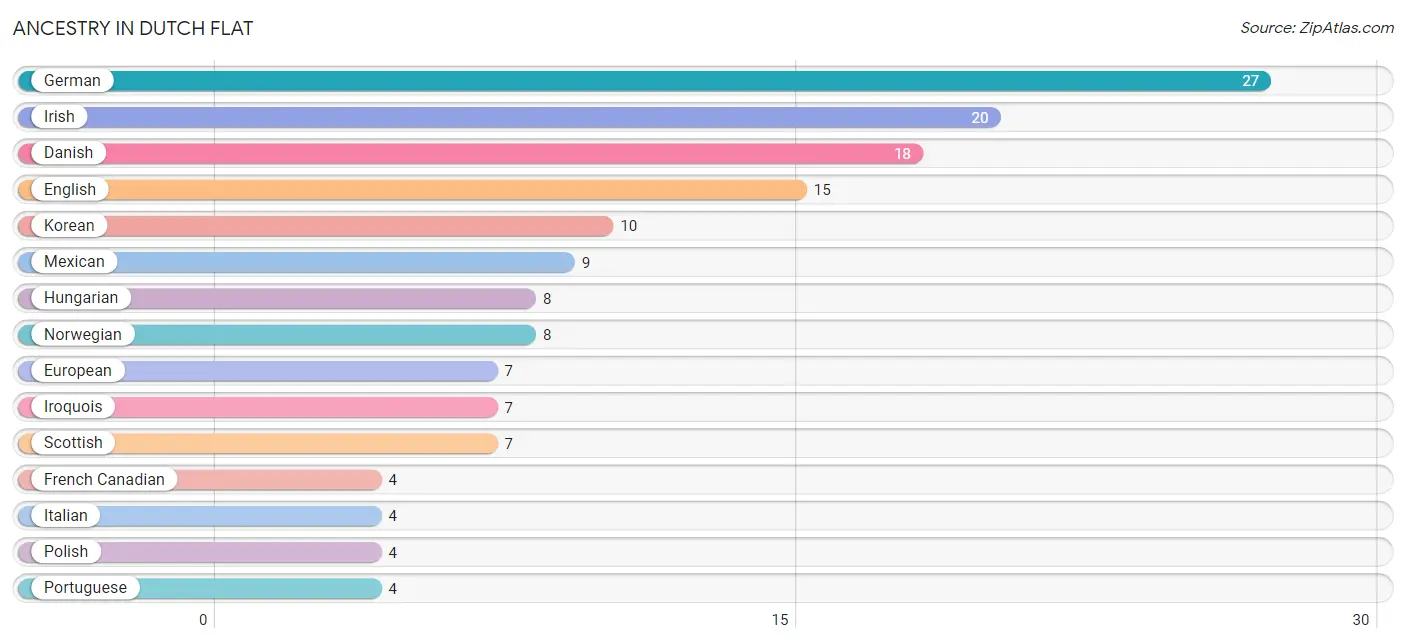
| Ancestry | # Population | % Population |
| Celtic | 3 | 2.9% |
| Danish | 18 | 17.3% |
| English | 15 | 14.4% |
| European | 7 | 6.7% |
| French Canadian | 4 | 3.8% |
| German | 27 | 26.0% |
| Hungarian | 8 | 7.7% |
| Irish | 20 | 19.2% |
| Iroquois | 7 | 6.7% |
| Italian | 4 | 3.8% |
| Korean | 10 | 9.6% |
| Mexican | 9 | 8.6% |
| Northern European | 3 | 2.9% |
| Norwegian | 8 | 7.7% |
| Polish | 4 | 3.8% |
| Portuguese | 4 | 3.8% |
| Scottish | 7 | 6.7% | View All 17 Rows |
Immigrants in Dutch Flat

| Immigration Origin | # Population | % Population | View All 0 Rows |
Sex and Age in Dutch Flat
Sex and Age in Dutch Flat
The most populous age groups in Dutch Flat are 65 to 69 Years (12 | 19.4%) for men and 60 to 64 Years (12 | 28.6%) for women.
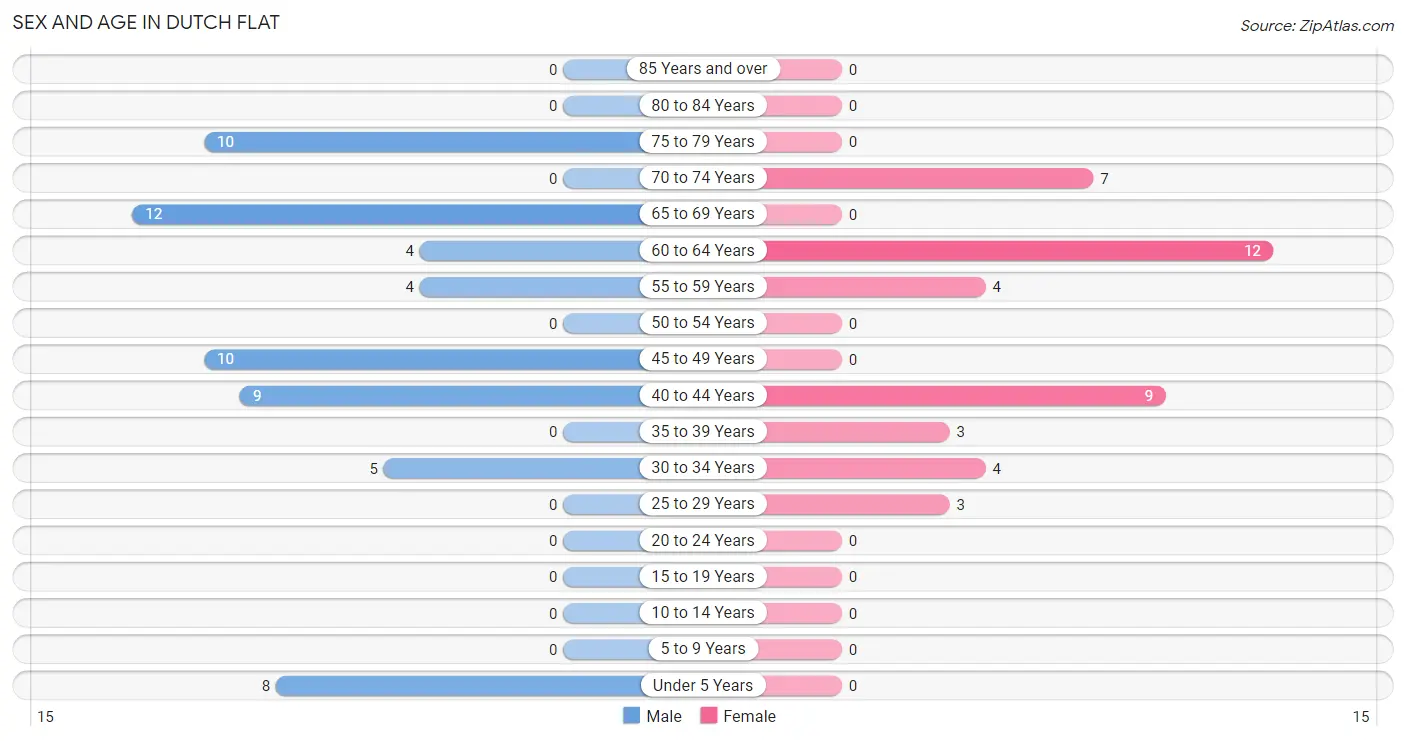
| Age Bracket | Male | Female |
| Under 5 Years | 8 (12.9%) | 0 (0.0%) |
| 5 to 9 Years | 0 (0.0%) | 0 (0.0%) |
| 10 to 14 Years | 0 (0.0%) | 0 (0.0%) |
| 15 to 19 Years | 0 (0.0%) | 0 (0.0%) |
| 20 to 24 Years | 0 (0.0%) | 0 (0.0%) |
| 25 to 29 Years | 0 (0.0%) | 3 (7.1%) |
| 30 to 34 Years | 5 (8.1%) | 4 (9.5%) |
| 35 to 39 Years | 0 (0.0%) | 3 (7.1%) |
| 40 to 44 Years | 9 (14.5%) | 9 (21.4%) |
| 45 to 49 Years | 10 (16.1%) | 0 (0.0%) |
| 50 to 54 Years | 0 (0.0%) | 0 (0.0%) |
| 55 to 59 Years | 4 (6.5%) | 4 (9.5%) |
| 60 to 64 Years | 4 (6.5%) | 12 (28.6%) |
| 65 to 69 Years | 12 (19.4%) | 0 (0.0%) |
| 70 to 74 Years | 0 (0.0%) | 7 (16.7%) |
| 75 to 79 Years | 10 (16.1%) | 0 (0.0%) |
| 80 to 84 Years | 0 (0.0%) | 0 (0.0%) |
| 85 Years and over | 0 (0.0%) | 0 (0.0%) |
| Total | 62 (100.0%) | 42 (100.0%) |
Families and Households in Dutch Flat
Median Family Size in Dutch Flat
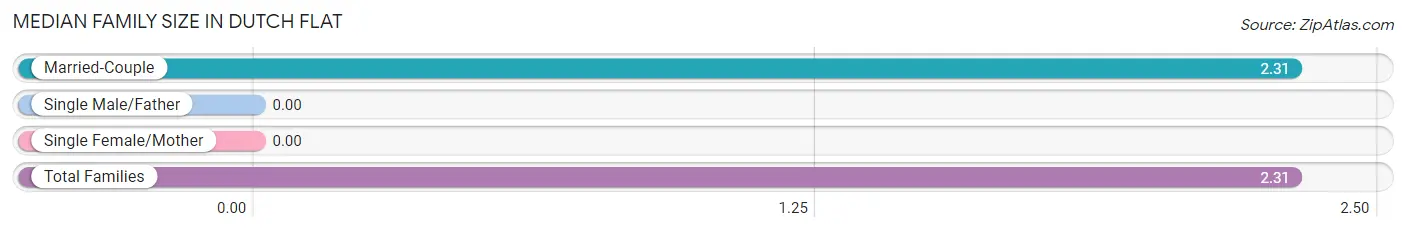
| Family Type | # Families | Family Size |
| Married-Couple | 29 (100.0%) | 2.31 |
| Single Male/Father | 0 (0.0%) | - |
| Single Female/Mother | 0 (0.0%) | - |
| Total Families | 29 (100.0%) | 2.31 |
Median Household Size in Dutch Flat
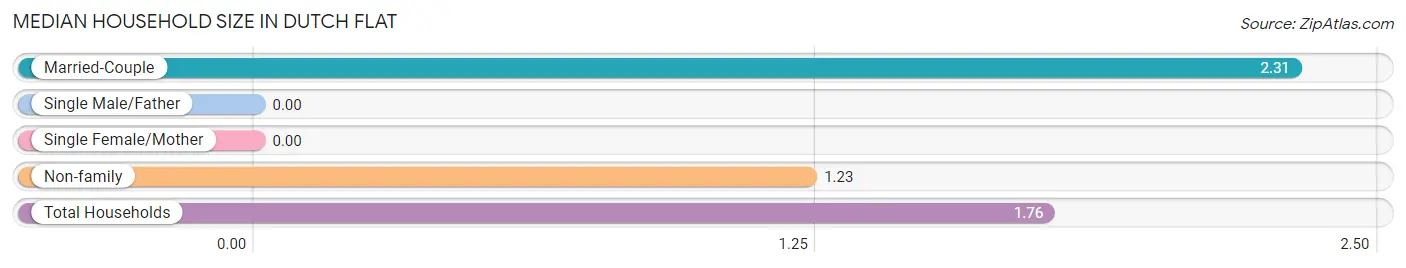
| Household Type | # Households | Household Size |
| Married-Couple | 29 (49.1%) | 2.31 |
| Single Male/Father | 0 (0.0%) | - |
| Single Female/Mother | 0 (0.0%) | - |
| Non-family | 30 (50.8%) | 1.23 |
| Total Households | 59 (100.0%) | 1.76 |
Household Size by Marriage Status in Dutch Flat
Out of a total of 59 households in Dutch Flat, 29 (49.1%) are family households, while 30 (50.8%) are nonfamily households. The most numerous type of family households are 2-person households, comprising 20, and the most common type of nonfamily households are 1-person households, comprising 23.
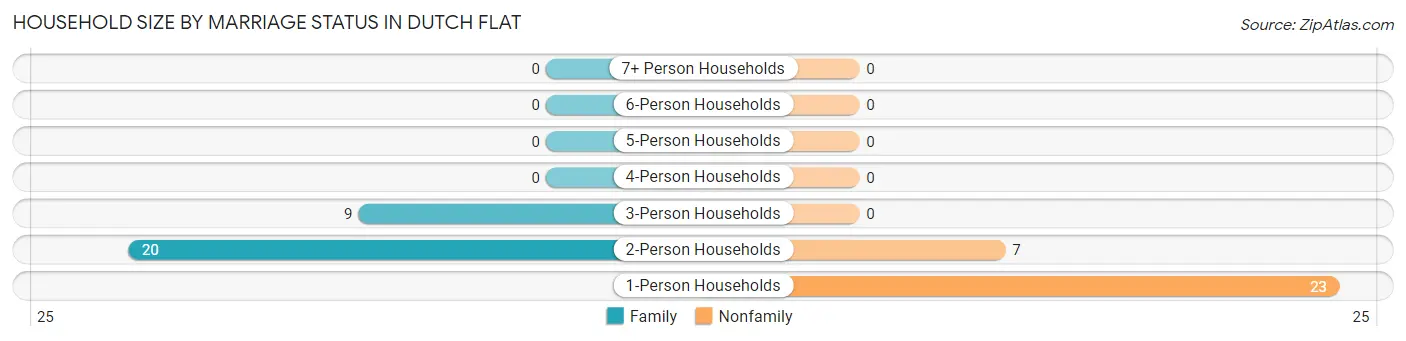
| Household Size | Family Households | Nonfamily Households |
| 1-Person Households | - | 23 (39.0%) |
| 2-Person Households | 20 (33.9%) | 7 (11.9%) |
| 3-Person Households | 9 (15.2%) | 0 (0.0%) |
| 4-Person Households | 0 (0.0%) | 0 (0.0%) |
| 5-Person Households | 0 (0.0%) | 0 (0.0%) |
| 6-Person Households | 0 (0.0%) | 0 (0.0%) |
| 7+ Person Households | 0 (0.0%) | 0 (0.0%) |
| Total | 29 (49.1%) | 30 (50.8%) |
Female Fertility in Dutch Flat
Fertility by Age in Dutch Flat
| Age Bracket | Women with Births | Births / 1,000 Women |
| 15 to 19 years | 0 (0.0%) | 0.0 |
| 20 to 34 years | 0 (0.0%) | 0.0 |
| 35 to 50 years | 0 (0.0%) | 0.0 |
| Total | 0 (0.0%) | 0.0 |
Fertility by Age by Marriage Status in Dutch Flat
| Age Bracket | Married | Unmarried |
| 15 to 19 years | 0 (0.0%) | 0 (0.0%) |
| 20 to 34 years | 0 (0.0%) | 0 (0.0%) |
| 35 to 50 years | 0 (0.0%) | 0 (0.0%) |
| Total | 0 (0.0%) | 0 (0.0%) |
Fertility by Education in Dutch Flat
| Educational Attainment | Women with Births | Births / 1,000 Women |
| Less than High School | 0 (0.0%) | 0.0 |
| High School Diploma | 0 (0.0%) | 0.0 |
| College or Associate's Degree | 0 (0.0%) | 0.0 |
| Bachelor's Degree | 0 (0.0%) | 0.0 |
| Graduate Degree | 0 (0.0%) | 0.0 |
| Total | 0 (0.0%) | 0.0 |
Fertility by Education by Marriage Status in Dutch Flat
| Educational Attainment | Married | Unmarried |
| Less than High School | 0 (0.0%) | 0 (0.0%) |
| High School Diploma | 0 (0.0%) | 0 (0.0%) |
| College or Associate's Degree | 0 (0.0%) | 0 (0.0%) |
| Bachelor's Degree | 0 (0.0%) | 0 (0.0%) |
| Graduate Degree | 0 (0.0%) | 0 (0.0%) |
| Total | 0 (0.0%) | 0 (0.0%) |
Employment Characteristics in Dutch Flat
Employment by Class of Employer in Dutch Flat
Among the 48 employed individuals in Dutch Flat, private company employees (25 | 52.1%), self-employed (not incorporated) (8 | 16.7%), and not-for-profit organizations (7 | 14.6%) make up the most common classes of employment.
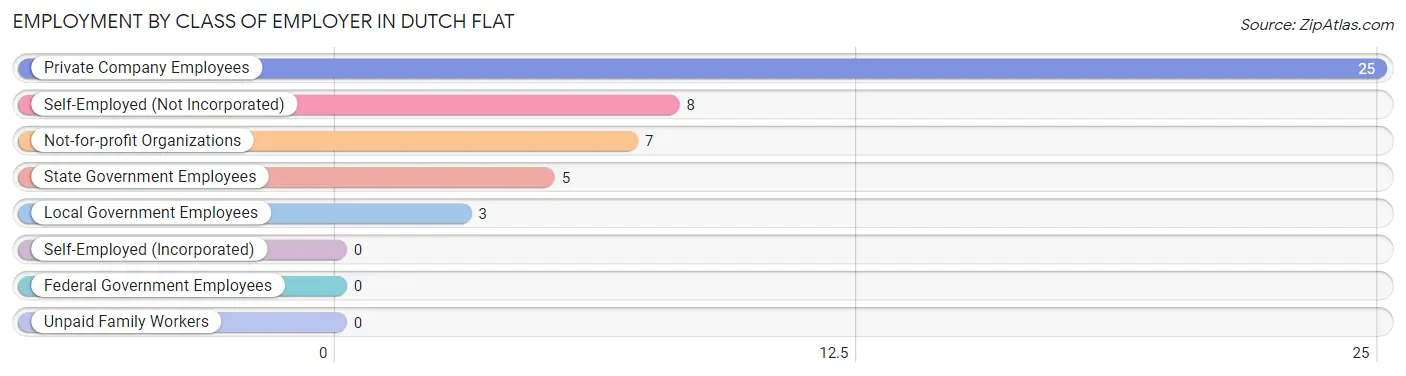
| Employer Class | # Employees | % Employees |
| Private Company Employees | 25 | 52.1% |
| Self-Employed (Incorporated) | 0 | 0.0% |
| Self-Employed (Not Incorporated) | 8 | 16.7% |
| Not-for-profit Organizations | 7 | 14.6% |
| Local Government Employees | 3 | 6.2% |
| State Government Employees | 5 | 10.4% |
| Federal Government Employees | 0 | 0.0% |
| Unpaid Family Workers | 0 | 0.0% |
| Total | 48 | 100.0% |
Employment Status by Age in Dutch Flat
According to the labor force statistics for Dutch Flat, out of the total population over 16 years of age (96), 63.5% or 61 individuals are in the labor force, with 14.8% or 9 of them unemployed. The age group with the highest labor force participation rate is 25 to 29 years, with 100.0% or 3 individuals in the labor force. Within the labor force, the 35 to 44 years age range has the highest percentage of unemployed individuals, with 42.9% or 9 of them being unemployed.
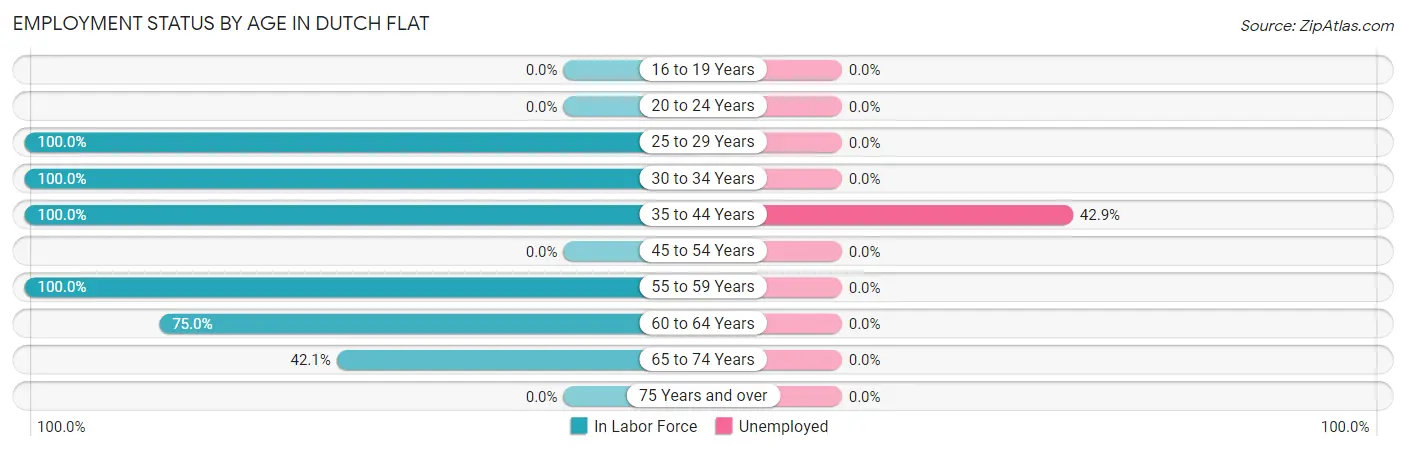
| Age Bracket | In Labor Force | Unemployed |
| 16 to 19 Years | 0 (0.0%) | 0 (0.0%) |
| 20 to 24 Years | 0 (0.0%) | 0 (0.0%) |
| 25 to 29 Years | 3 (100.0%) | 0 (0.0%) |
| 30 to 34 Years | 9 (100.0%) | 0 (0.0%) |
| 35 to 44 Years | 21 (100.0%) | 9 (42.9%) |
| 45 to 54 Years | 0 (0.0%) | 0 (0.0%) |
| 55 to 59 Years | 8 (100.0%) | 0 (0.0%) |
| 60 to 64 Years | 12 (75.0%) | 0 (0.0%) |
| 65 to 74 Years | 8 (42.1%) | 0 (0.0%) |
| 75 Years and over | 0 (0.0%) | 0 (0.0%) |
| Total | 61 (63.5%) | 9 (14.8%) |
Employment Status by Educational Attainment in Dutch Flat
According to labor force statistics for Dutch Flat, 79.1% of individuals (53) out of the total population between 25 and 64 years of age (67) are in the labor force, with 17.0% or 9 of them being unemployed. The group with the highest labor force participation rate are those with the educational attainment of college / associate degree, with 100.0% or 12 individuals in the labor force. Within the labor force, individuals with bachelor's degree or higher education have the highest percentage of unemployment, with 25.0% or 9 of them being unemployed.
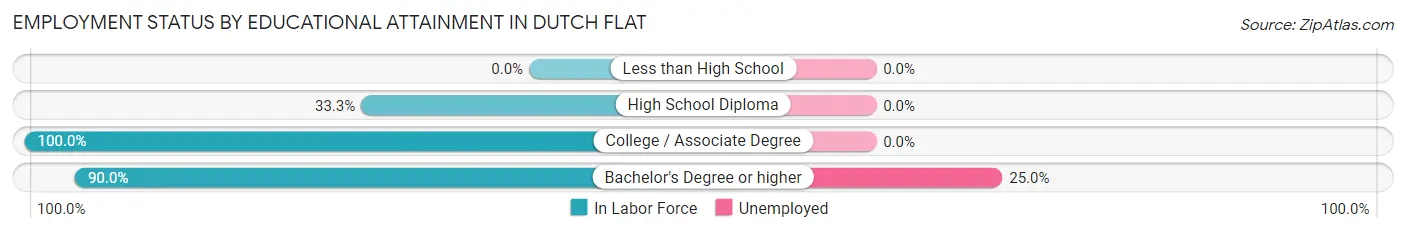
| Educational Attainment | In Labor Force | Unemployed |
| Less than High School | 0 (0.0%) | 0 (0.0%) |
| High School Diploma | 5 (33.3%) | 0 (0.0%) |
| College / Associate Degree | 12 (100.0%) | 0 (0.0%) |
| Bachelor's Degree or higher | 36 (90.0%) | 10 (25.0%) |
| Total | 53 (79.1%) | 11 (17.0%) |
Employment Occupations by Sex in Dutch Flat
Management, Business, Science and Arts Occupations
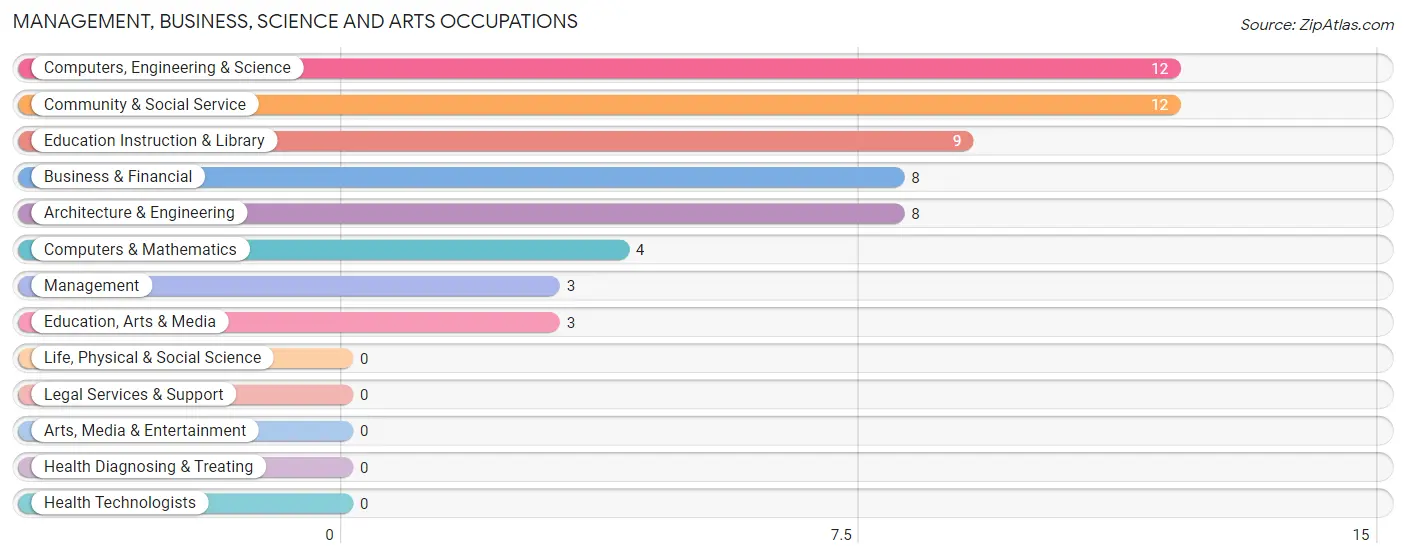
The most common Management, Business, Science and Arts occupations in Dutch Flat are Computers, Engineering & Science (12 | 23.1%), Community & Social Service (12 | 23.1%), Education Instruction & Library (9 | 17.3%), Business & Financial (8 | 15.4%), and Architecture & Engineering (8 | 15.4%).
Management, Business, Science and Arts Occupations by Sex
Within the Management, Business, Science and Arts occupations in Dutch Flat, the most male-oriented occupations are Computers, Engineering & Science (100.0%), Computers & Mathematics (100.0%), and Architecture & Engineering (100.0%), while the most female-oriented occupations are Management (100.0%), Education, Arts & Media (100.0%), and Community & Social Service (58.3%).
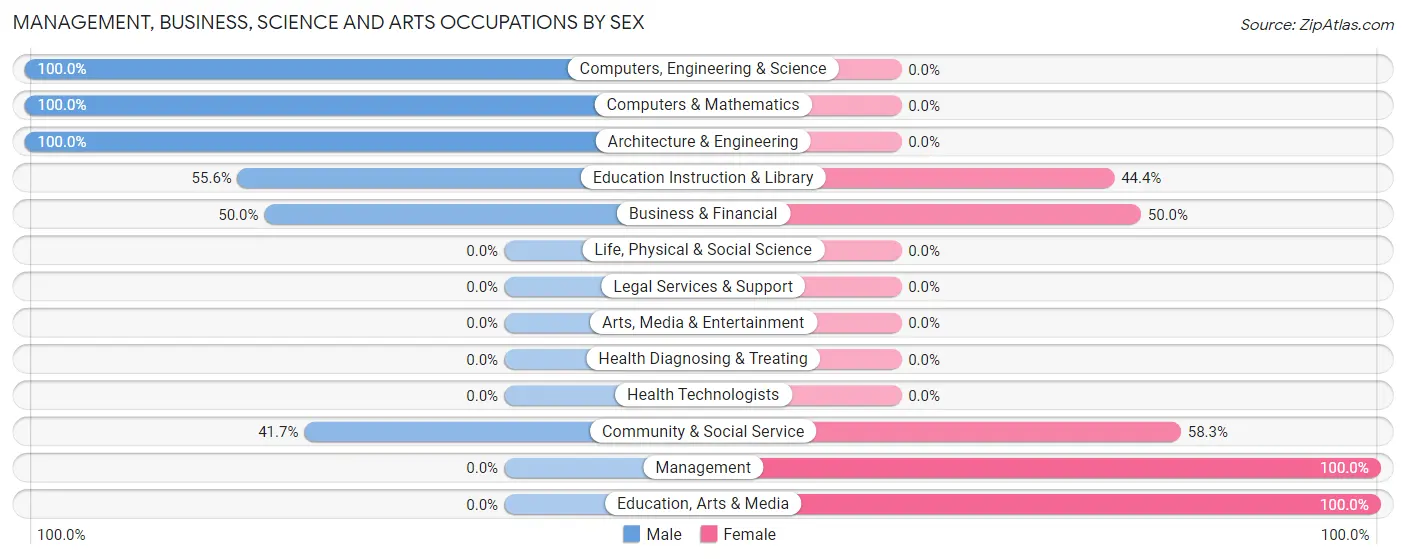
| Occupation | Male | Female |
| Management | 0 (0.0%) | 3 (100.0%) |
| Business & Financial | 4 (50.0%) | 4 (50.0%) |
| Computers, Engineering & Science | 12 (100.0%) | 0 (0.0%) |
| Computers & Mathematics | 4 (100.0%) | 0 (0.0%) |
| Architecture & Engineering | 8 (100.0%) | 0 (0.0%) |
| Life, Physical & Social Science | 0 (0.0%) | 0 (0.0%) |
| Community & Social Service | 5 (41.7%) | 7 (58.3%) |
| Education, Arts & Media | 0 (0.0%) | 3 (100.0%) |
| Legal Services & Support | 0 (0.0%) | 0 (0.0%) |
| Education Instruction & Library | 5 (55.6%) | 4 (44.4%) |
| Arts, Media & Entertainment | 0 (0.0%) | 0 (0.0%) |
| Health Diagnosing & Treating | 0 (0.0%) | 0 (0.0%) |
| Health Technologists | 0 (0.0%) | 0 (0.0%) |
| Total (Category) | 21 (60.0%) | 14 (40.0%) |
| Total (Overall) | 30 (57.7%) | 22 (42.3%) |
Services Occupations
The most common Services occupations in Dutch Flat are , and Cleaning & Maintenance (5 | 9.6%).
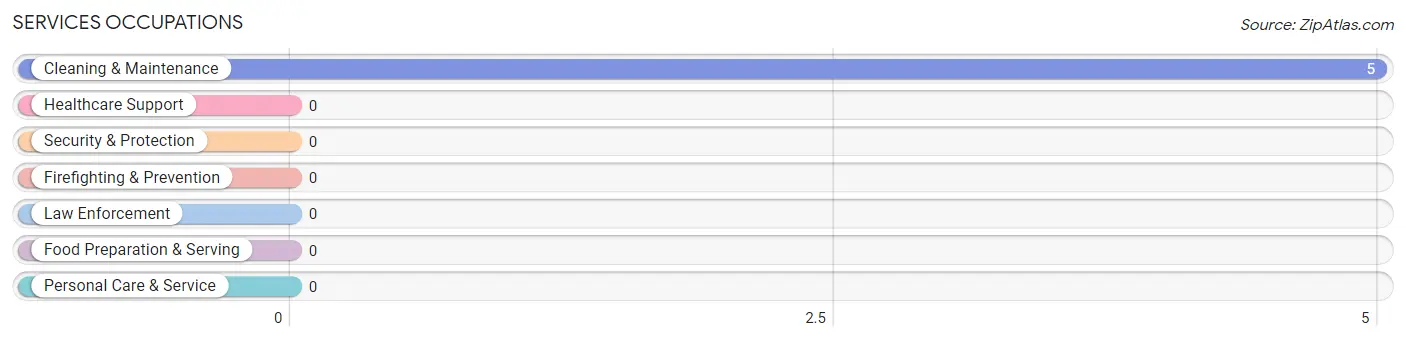
Services Occupations by Sex
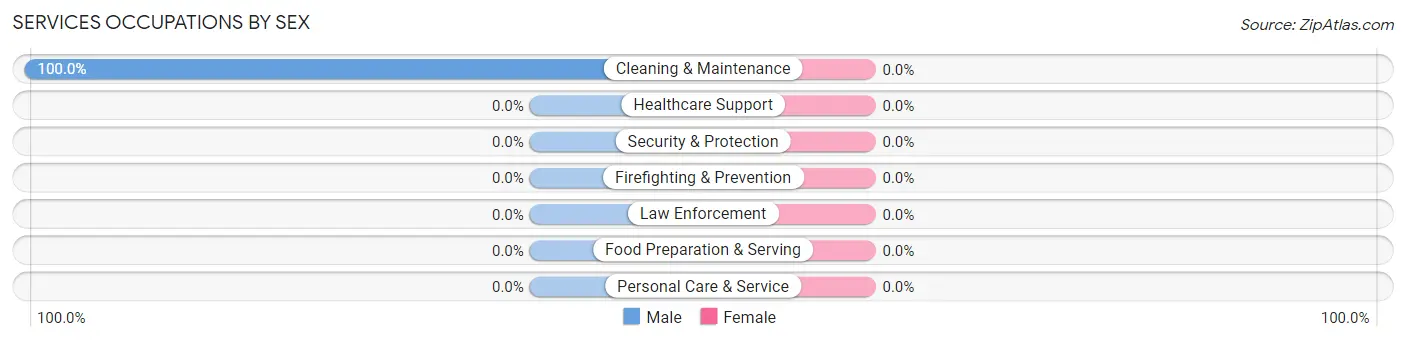
| Occupation | Male | Female |
| Healthcare Support | 0 (0.0%) | 0 (0.0%) |
| Security & Protection | 0 (0.0%) | 0 (0.0%) |
| Firefighting & Prevention | 0 (0.0%) | 0 (0.0%) |
| Law Enforcement | 0 (0.0%) | 0 (0.0%) |
| Food Preparation & Serving | 0 (0.0%) | 0 (0.0%) |
| Cleaning & Maintenance | 5 (100.0%) | 0 (0.0%) |
| Personal Care & Service | 0 (0.0%) | 0 (0.0%) |
| Total (Category) | 5 (100.0%) | 0 (0.0%) |
| Total (Overall) | 30 (57.7%) | 22 (42.3%) |
Sales and Office Occupations
The most common Sales and Office occupations in Dutch Flat are Sales & Related (4 | 7.7%), and Office & Administration (4 | 7.7%).

Sales and Office Occupations by Sex

| Occupation | Male | Female |
| Sales & Related | 4 (100.0%) | 0 (0.0%) |
| Office & Administration | 0 (0.0%) | 4 (100.0%) |
| Total (Category) | 4 (50.0%) | 4 (50.0%) |
| Total (Overall) | 30 (57.7%) | 22 (42.3%) |
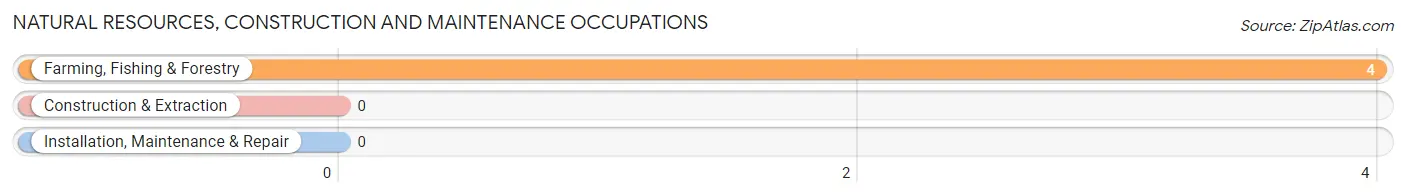
Natural Resources, Construction and Maintenance Occupations
The most common Natural Resources, Construction and Maintenance occupations in Dutch Flat are , and Farming, Fishing & Forestry (4 | 7.7%).
Natural Resources, Construction and Maintenance Occupations by Sex
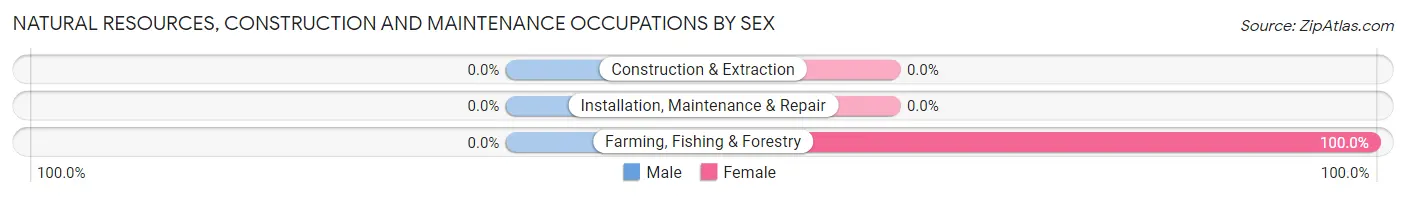
| Occupation | Male | Female |
| Farming, Fishing & Forestry | 0 (0.0%) | 4 (100.0%) |
| Construction & Extraction | 0 (0.0%) | 0 (0.0%) |
| Installation, Maintenance & Repair | 0 (0.0%) | 0 (0.0%) |
| Total (Category) | 0 (0.0%) | 4 (100.0%) |
| Total (Overall) | 30 (57.7%) | 22 (42.3%) |
Production, Transportation and Moving Occupations
Production, Transportation and Moving Occupations by Sex
| Occupation | Male | Female |
| Production | 0 (0.0%) | 0 (0.0%) |
| Transportation | 0 (0.0%) | 0 (0.0%) |
| Material Moving | 0 (0.0%) | 0 (0.0%) |
| Total (Category) | 0 (0.0%) | 0 (0.0%) |
| Total (Overall) | 30 (57.7%) | 22 (42.3%) |
Employment Industries by Sex in Dutch Flat
Employment Industries in Dutch Flat
The major employment industries in Dutch Flat include Professional & Scientific (16 | 30.8%), Educational Services (8 | 15.4%), Health Care & Social Assistance (7 | 13.5%), Administrative & Support (5 | 9.6%), and Agriculture, Fishing & Hunting (4 | 7.7%).
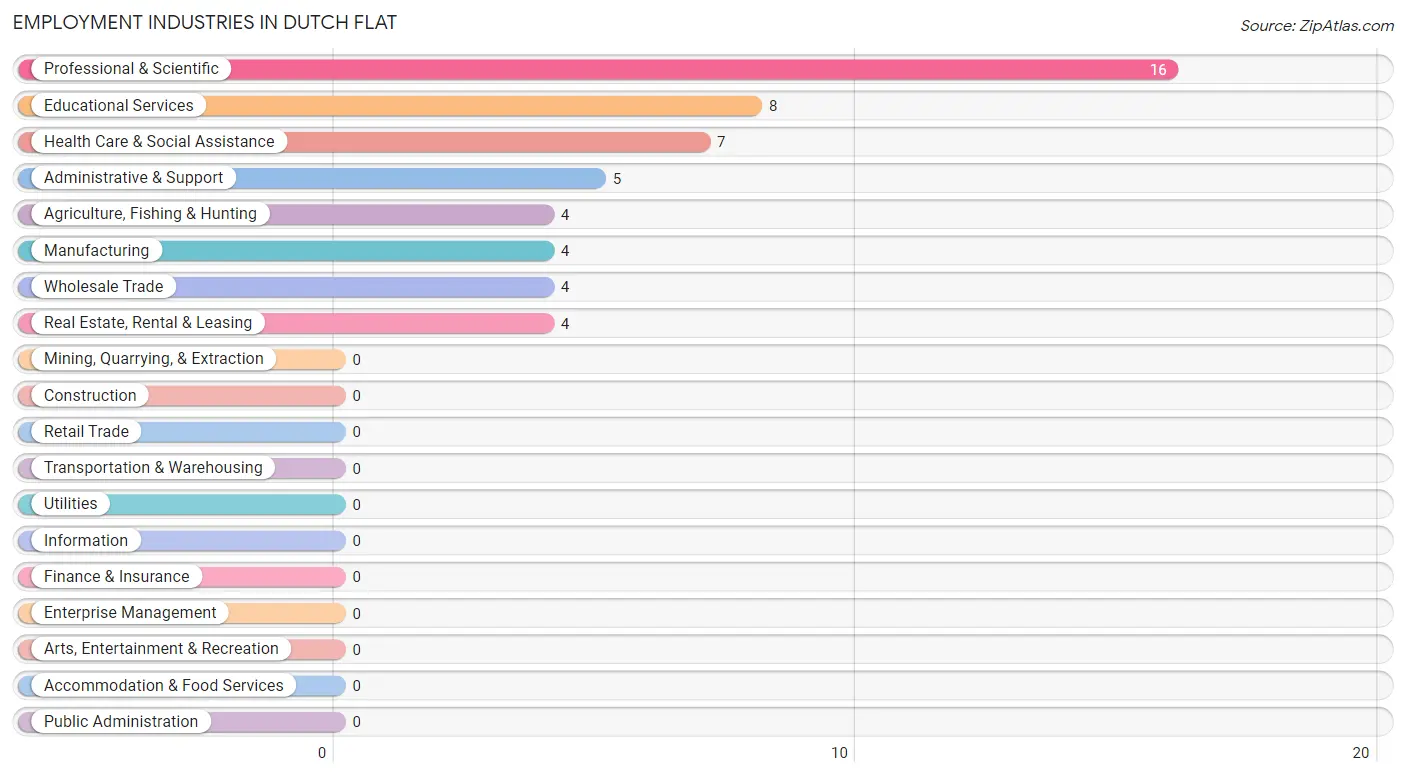
Employment Industries by Sex in Dutch Flat
The Dutch Flat industries that see more men than women are Manufacturing (100.0%), Real Estate, Rental & Leasing (100.0%), and Administrative & Support (100.0%), whereas the industries that tend to have a higher number of women are Agriculture, Fishing & Hunting (100.0%), Wholesale Trade (100.0%), and Health Care & Social Assistance (100.0%).
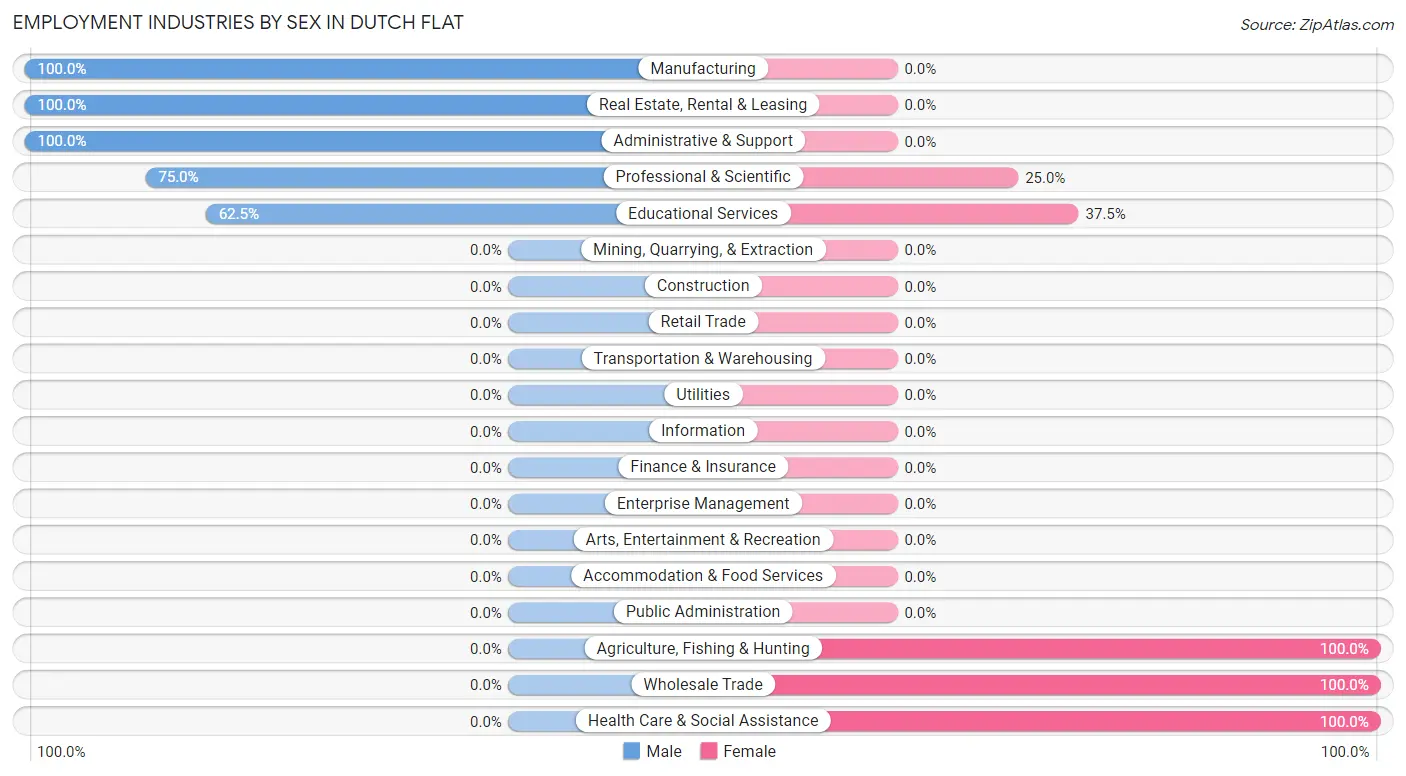
| Industry | Male | Female |
| Agriculture, Fishing & Hunting | 0 (0.0%) | 4 (100.0%) |
| Mining, Quarrying, & Extraction | 0 (0.0%) | 0 (0.0%) |
| Construction | 0 (0.0%) | 0 (0.0%) |
| Manufacturing | 4 (100.0%) | 0 (0.0%) |
| Wholesale Trade | 0 (0.0%) | 4 (100.0%) |
| Retail Trade | 0 (0.0%) | 0 (0.0%) |
| Transportation & Warehousing | 0 (0.0%) | 0 (0.0%) |
| Utilities | 0 (0.0%) | 0 (0.0%) |
| Information | 0 (0.0%) | 0 (0.0%) |
| Finance & Insurance | 0 (0.0%) | 0 (0.0%) |
| Real Estate, Rental & Leasing | 4 (100.0%) | 0 (0.0%) |
| Professional & Scientific | 12 (75.0%) | 4 (25.0%) |
| Enterprise Management | 0 (0.0%) | 0 (0.0%) |
| Administrative & Support | 5 (100.0%) | 0 (0.0%) |
| Educational Services | 5 (62.5%) | 3 (37.5%) |
| Health Care & Social Assistance | 0 (0.0%) | 7 (100.0%) |
| Arts, Entertainment & Recreation | 0 (0.0%) | 0 (0.0%) |
| Accommodation & Food Services | 0 (0.0%) | 0 (0.0%) |
| Public Administration | 0 (0.0%) | 0 (0.0%) |
| Total | 30 (57.7%) | 22 (42.3%) |
Education in Dutch Flat
School Enrollment in Dutch Flat
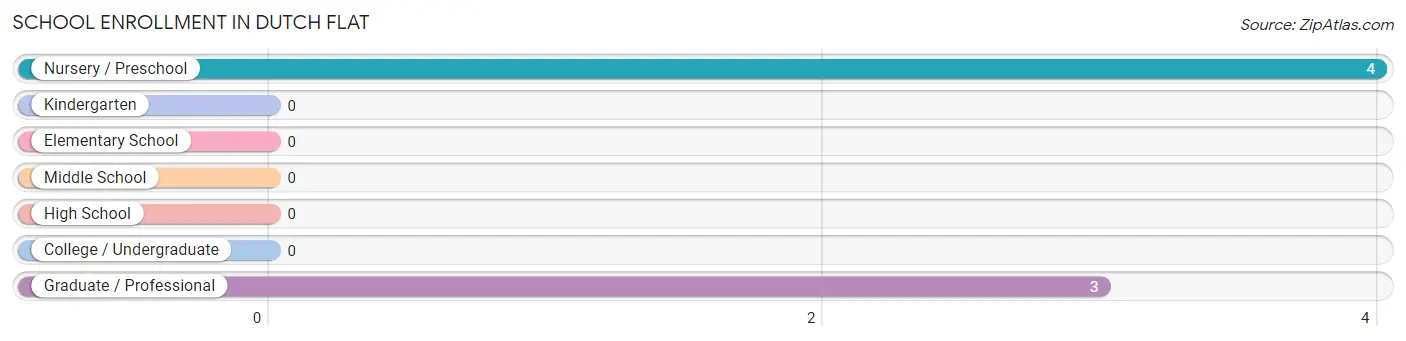
The most common levels of schooling among the 7 students in Dutch Flat are nursery / preschool (4 | 57.1%), and graduate / professional (3 | 42.9%).
| School Level | # Students | % Students |
| Nursery / Preschool | 4 | 57.1% |
| Kindergarten | 0 | 0.0% |
| Elementary School | 0 | 0.0% |
| Middle School | 0 | 0.0% |
| High School | 0 | 0.0% |
| College / Undergraduate | 0 | 0.0% |
| Graduate / Professional | 3 | 42.9% |
| Total | 7 | 100.0% |
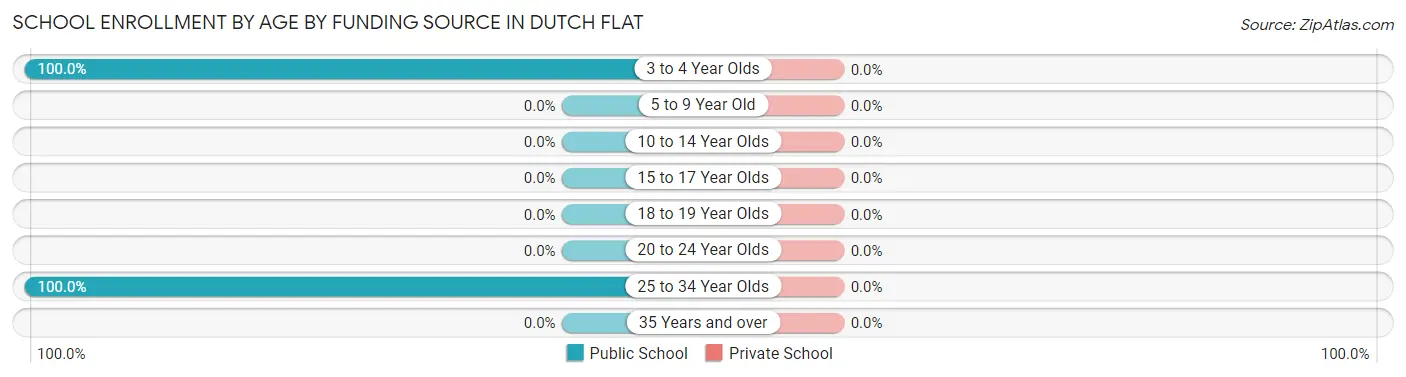
School Enrollment by Age by Funding Source in Dutch Flat
| Age Bracket | Public School | Private School |
| 3 to 4 Year Olds | 4 (100.0%) | 0 (0.0%) |
| 5 to 9 Year Old | 0 (0.0%) | 0 (0.0%) |
| 10 to 14 Year Olds | 0 (0.0%) | 0 (0.0%) |
| 15 to 17 Year Olds | 0 (0.0%) | 0 (0.0%) |
| 18 to 19 Year Olds | 0 (0.0%) | 0 (0.0%) |
| 20 to 24 Year Olds | 0 (0.0%) | 0 (0.0%) |
| 25 to 34 Year Olds | 3 (100.0%) | 0 (0.0%) |
| 35 Years and over | 0 (0.0%) | 0 (0.0%) |
| Total | 7 (100.0%) | 0 (0.0%) |
Educational Attainment by Field of Study in Dutch Flat
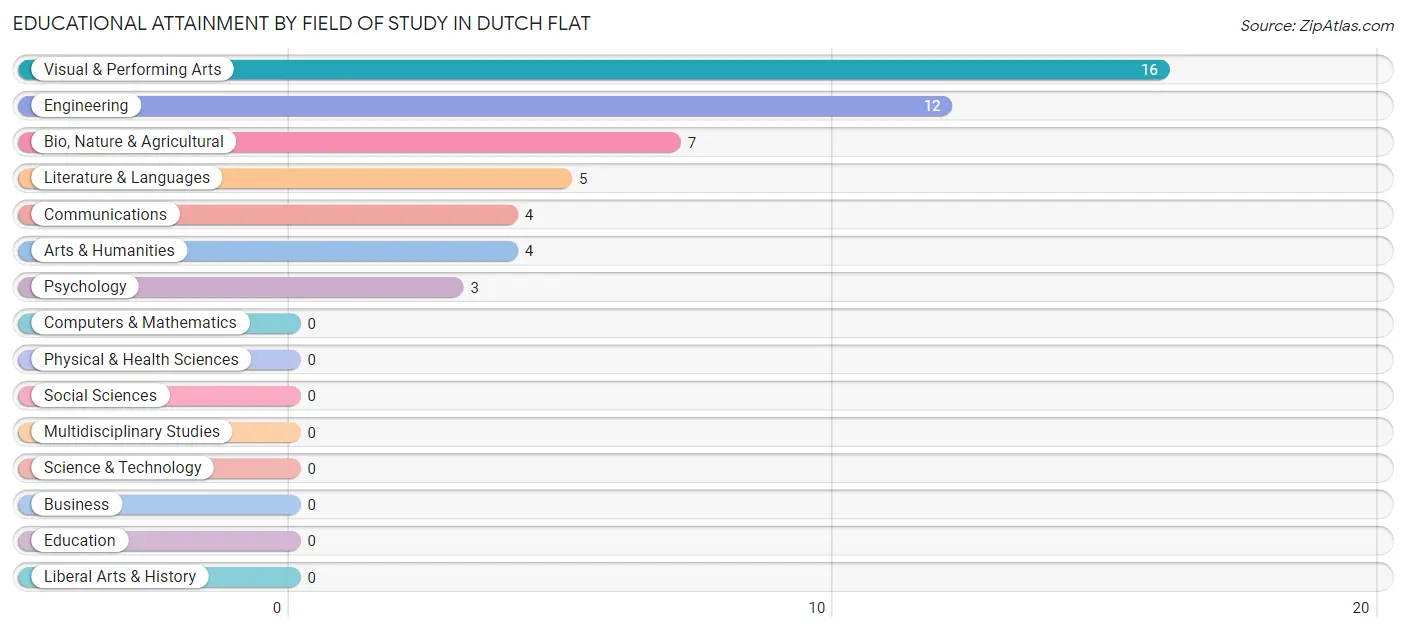
Visual & performing arts (16 | 31.4%), engineering (12 | 23.5%), bio, nature & agricultural (7 | 13.7%), literature & languages (5 | 9.8%), and communications (4 | 7.8%) are the most common fields of study among 51 individuals in Dutch Flat who have obtained a bachelor's degree or higher.
| Field of Study | # Graduates | % Graduates |
| Computers & Mathematics | 0 | 0.0% |
| Bio, Nature & Agricultural | 7 | 13.7% |
| Physical & Health Sciences | 0 | 0.0% |
| Psychology | 3 | 5.9% |
| Social Sciences | 0 | 0.0% |
| Engineering | 12 | 23.5% |
| Multidisciplinary Studies | 0 | 0.0% |
| Science & Technology | 0 | 0.0% |
| Business | 0 | 0.0% |
| Education | 0 | 0.0% |
| Literature & Languages | 5 | 9.8% |
| Liberal Arts & History | 0 | 0.0% |
| Visual & Performing Arts | 16 | 31.4% |
| Communications | 4 | 7.8% |
| Arts & Humanities | 4 | 7.8% |
| Total | 51 | 100.0% |
Transportation & Commute in Dutch Flat
Vehicle Availability by Sex in Dutch Flat
The most prevalent vehicle ownership categories in Dutch Flat are males with 2 vehicles (22, accounting for 73.3%) and females with 2 vehicles (7, making up 122.2%).
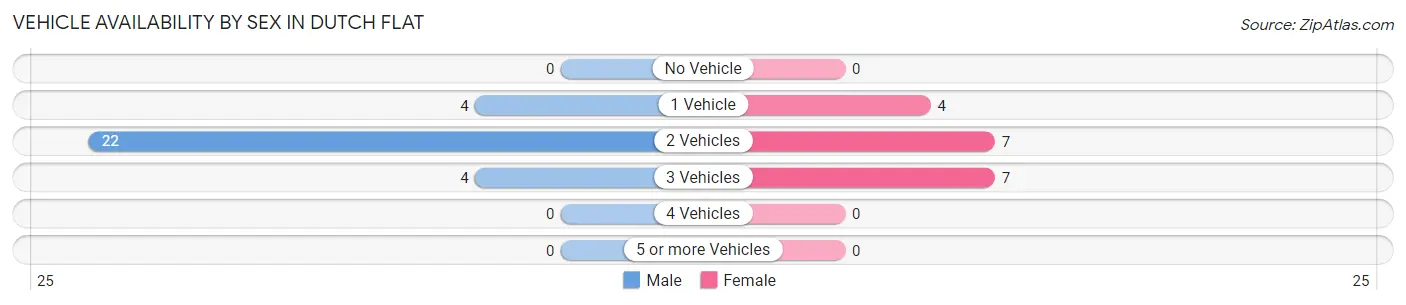
| Vehicles Available | Male | Female |
| No Vehicle | 0 (0.0%) | 0 (0.0%) |
| 1 Vehicle | 4 (13.3%) | 4 (22.2%) |
| 2 Vehicles | 22 (73.3%) | 7 (38.9%) |
| 3 Vehicles | 4 (13.3%) | 7 (38.9%) |
| 4 Vehicles | 0 (0.0%) | 0 (0.0%) |
| 5 or more Vehicles | 0 (0.0%) | 0 (0.0%) |
| Total | 30 (100.0%) | 18 (100.0%) |
Commute Time in Dutch Flat
The most frequently occuring commute durations in Dutch Flat are 45 to 59 minutes (12 commuters, 27.3%), 60 to 89 minutes (12 commuters, 27.3%), and 90 or more minutes (8 commuters, 18.2%).
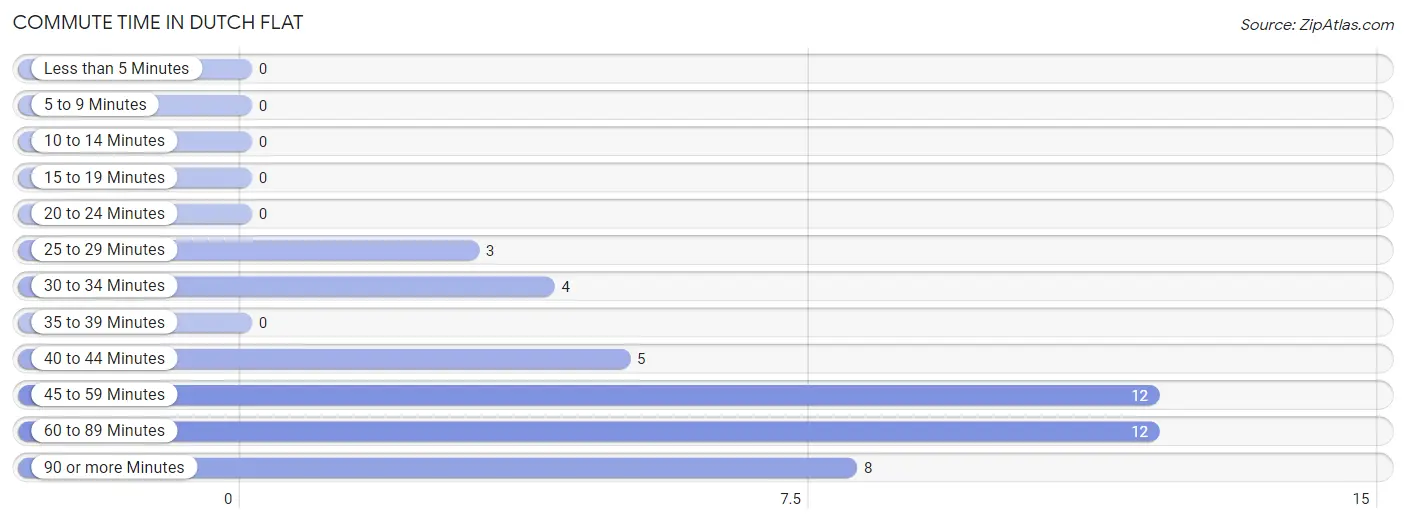
| Commute Time | # Commuters | % Commuters |
| Less than 5 Minutes | 0 | 0.0% |
| 5 to 9 Minutes | 0 | 0.0% |
| 10 to 14 Minutes | 0 | 0.0% |
| 15 to 19 Minutes | 0 | 0.0% |
| 20 to 24 Minutes | 0 | 0.0% |
| 25 to 29 Minutes | 3 | 6.8% |
| 30 to 34 Minutes | 4 | 9.1% |
| 35 to 39 Minutes | 0 | 0.0% |
| 40 to 44 Minutes | 5 | 11.4% |
| 45 to 59 Minutes | 12 | 27.3% |
| 60 to 89 Minutes | 12 | 27.3% |
| 90 or more Minutes | 8 | 18.2% |
Commute Time by Sex in Dutch Flat
The most common commute times in Dutch Flat are 60 to 89 minutes (8 commuters, 30.8%) for males and 45 to 59 minutes (7 commuters, 38.9%) for females.
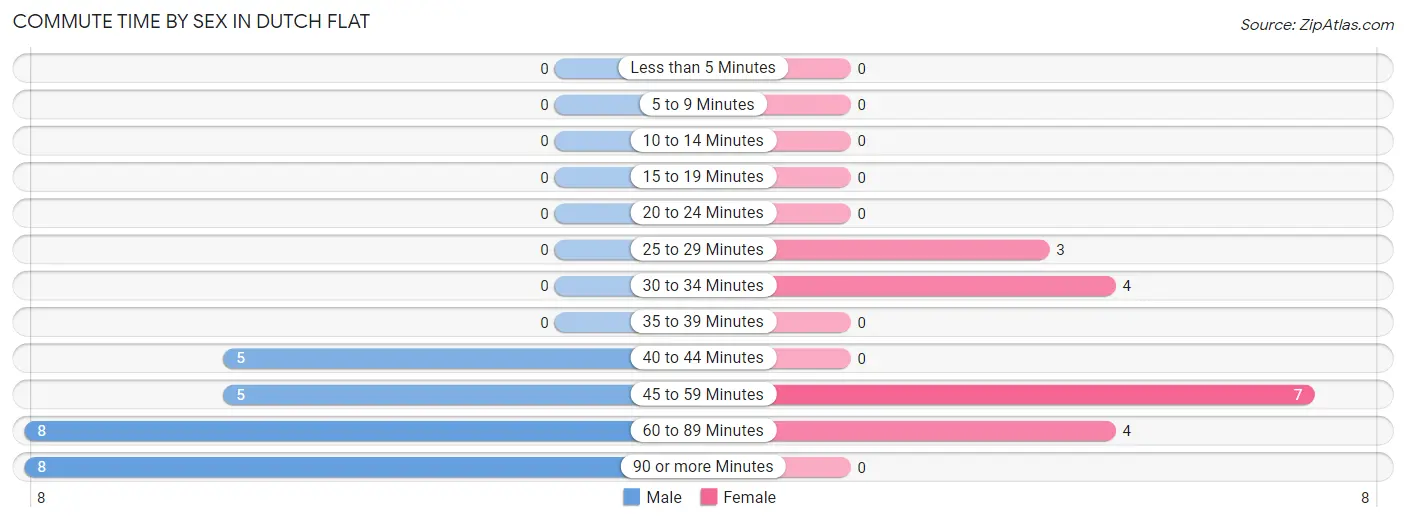
| Commute Time | Male | Female |
| Less than 5 Minutes | 0 (0.0%) | 0 (0.0%) |
| 5 to 9 Minutes | 0 (0.0%) | 0 (0.0%) |
| 10 to 14 Minutes | 0 (0.0%) | 0 (0.0%) |
| 15 to 19 Minutes | 0 (0.0%) | 0 (0.0%) |
| 20 to 24 Minutes | 0 (0.0%) | 0 (0.0%) |
| 25 to 29 Minutes | 0 (0.0%) | 3 (16.7%) |
| 30 to 34 Minutes | 0 (0.0%) | 4 (22.2%) |
| 35 to 39 Minutes | 0 (0.0%) | 0 (0.0%) |
| 40 to 44 Minutes | 5 (19.2%) | 0 (0.0%) |
| 45 to 59 Minutes | 5 (19.2%) | 7 (38.9%) |
| 60 to 89 Minutes | 8 (30.8%) | 4 (22.2%) |
| 90 or more Minutes | 8 (30.8%) | 0 (0.0%) |
Time of Departure to Work by Sex in Dutch Flat
The most frequent times of departure to work in Dutch Flat are 6:00 AM to 6:29 AM (10, 38.5%) for males and 7:00 AM to 7:29 AM (8, 44.4%) for females.
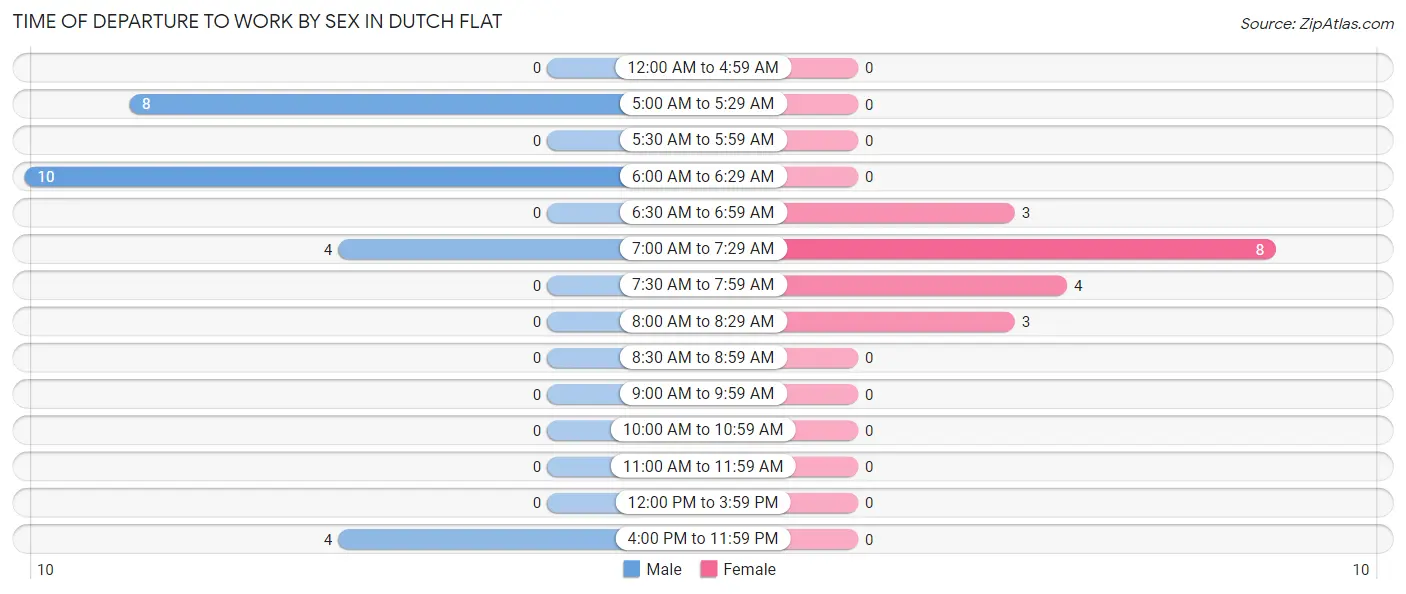
| Time of Departure | Male | Female |
| 12:00 AM to 4:59 AM | 0 (0.0%) | 0 (0.0%) |
| 5:00 AM to 5:29 AM | 8 (30.8%) | 0 (0.0%) |
| 5:30 AM to 5:59 AM | 0 (0.0%) | 0 (0.0%) |
| 6:00 AM to 6:29 AM | 10 (38.5%) | 0 (0.0%) |
| 6:30 AM to 6:59 AM | 0 (0.0%) | 3 (16.7%) |
| 7:00 AM to 7:29 AM | 4 (15.4%) | 8 (44.4%) |
| 7:30 AM to 7:59 AM | 0 (0.0%) | 4 (22.2%) |
| 8:00 AM to 8:29 AM | 0 (0.0%) | 3 (16.7%) |
| 8:30 AM to 8:59 AM | 0 (0.0%) | 0 (0.0%) |
| 9:00 AM to 9:59 AM | 0 (0.0%) | 0 (0.0%) |
| 10:00 AM to 10:59 AM | 0 (0.0%) | 0 (0.0%) |
| 11:00 AM to 11:59 AM | 0 (0.0%) | 0 (0.0%) |
| 12:00 PM to 3:59 PM | 0 (0.0%) | 0 (0.0%) |
| 4:00 PM to 11:59 PM | 4 (15.4%) | 0 (0.0%) |
| Total | 26 (100.0%) | 18 (100.0%) |
Housing Occupancy in Dutch Flat
Occupancy by Ownership in Dutch Flat
Of the total 59 dwellings in Dutch Flat, owner-occupied units account for 50 (84.8%), while renter-occupied units make up 9 (15.2%).
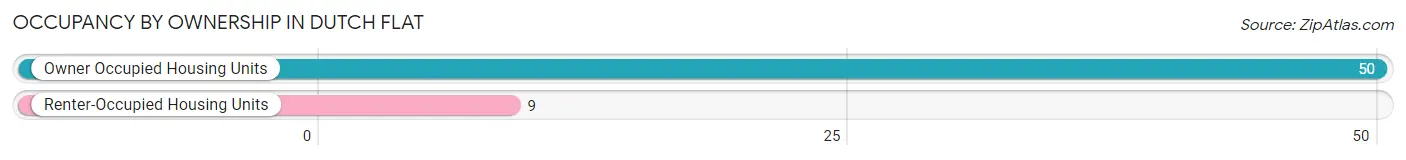
| Occupancy | # Housing Units | % Housing Units |
| Owner Occupied Housing Units | 50 | 84.8% |
| Renter-Occupied Housing Units | 9 | 15.2% |
| Total Occupied Housing Units | 59 | 100.0% |
Occupancy by Household Size in Dutch Flat
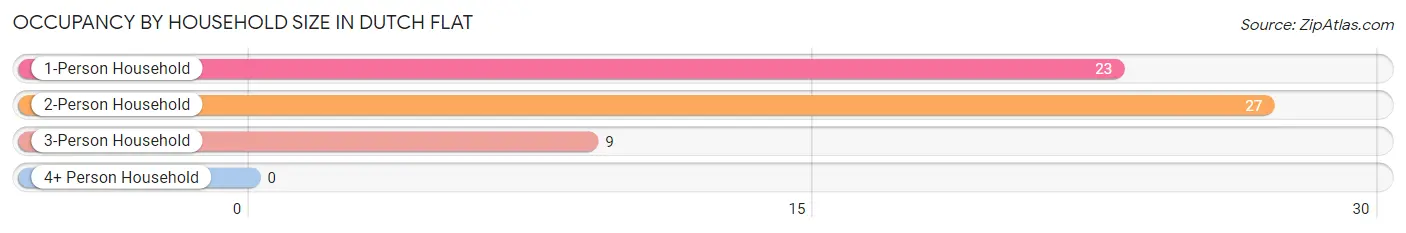
| Household Size | # Housing Units | % Housing Units |
| 1-Person Household | 23 | 39.0% |
| 2-Person Household | 27 | 45.8% |
| 3-Person Household | 9 | 15.2% |
| 4+ Person Household | 0 | 0.0% |
| Total Housing Units | 59 | 100.0% |
Occupancy by Ownership by Household Size in Dutch Flat
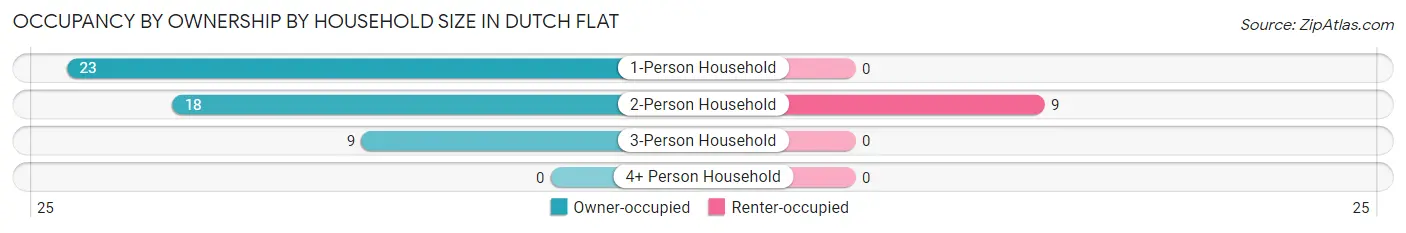
| Household Size | Owner-occupied | Renter-occupied |
| 1-Person Household | 23 (100.0%) | 0 (0.0%) |
| 2-Person Household | 18 (66.7%) | 9 (33.3%) |
| 3-Person Household | 9 (100.0%) | 0 (0.0%) |
| 4+ Person Household | 0 (0.0%) | 0 (0.0%) |
| Total Housing Units | 50 (84.8%) | 9 (15.2%) |
Occupancy by Educational Attainment in Dutch Flat
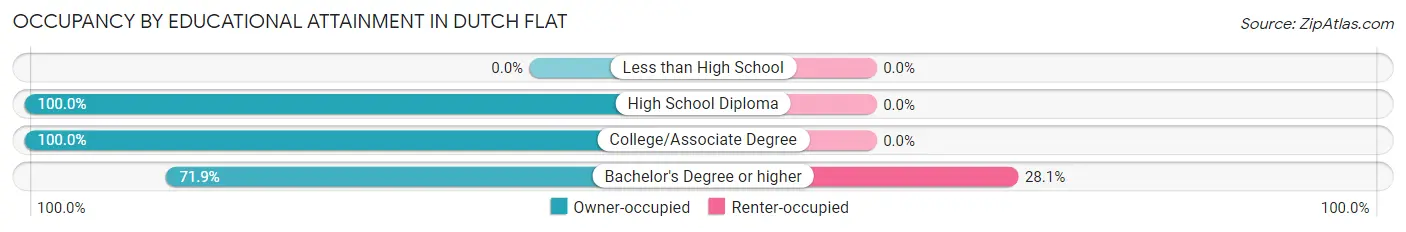
| Household Size | Owner-occupied | Renter-occupied |
| Less than High School | 0 (0.0%) | 0 (0.0%) |
| High School Diploma | 9 (100.0%) | 0 (0.0%) |
| College/Associate Degree | 18 (100.0%) | 0 (0.0%) |
| Bachelor's Degree or higher | 23 (71.9%) | 9 (28.1%) |
Occupancy by Age of Householder in Dutch Flat
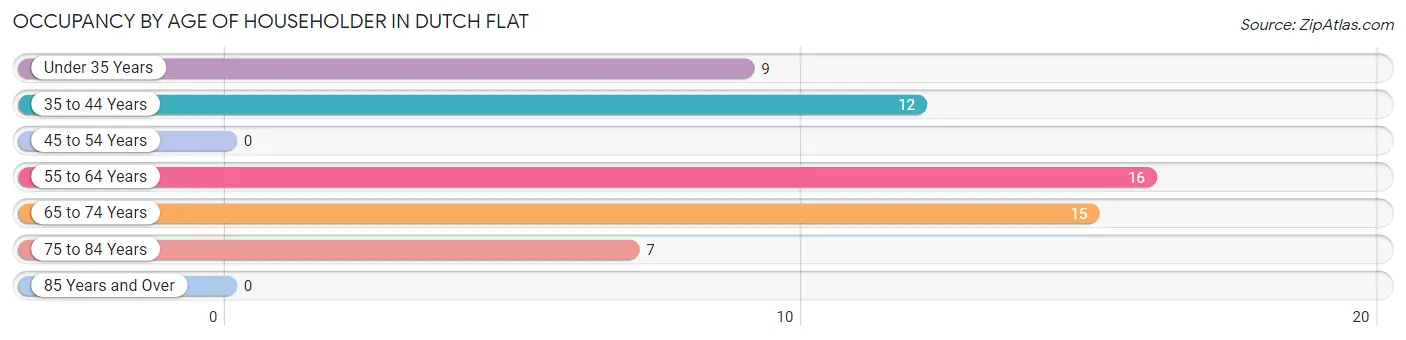
| Age Bracket | # Households | % Households |
| Under 35 Years | 9 | 15.2% |
| 35 to 44 Years | 12 | 20.3% |
| 45 to 54 Years | 0 | 0.0% |
| 55 to 64 Years | 16 | 27.1% |
| 65 to 74 Years | 15 | 25.4% |
| 75 to 84 Years | 7 | 11.9% |
| 85 Years and Over | 0 | 0.0% |
| Total | 59 | 100.0% |
Housing Finances in Dutch Flat
Median Income by Occupancy in Dutch Flat
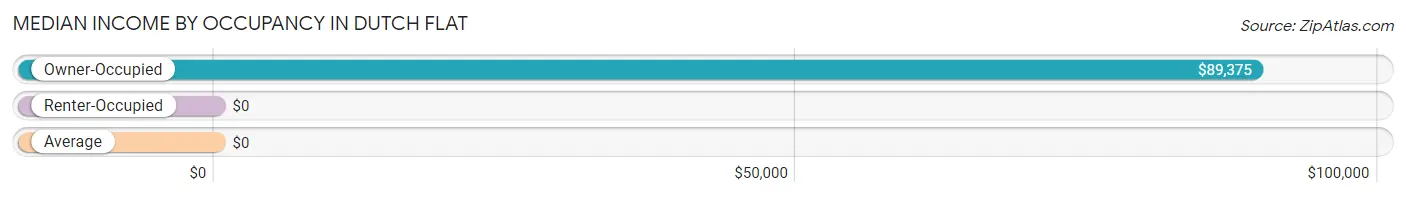
| Occupancy Type | # Households | Median Income |
| Owner-Occupied | 50 (84.8%) | $89,375 |
| Renter-Occupied | 9 (15.2%) | $0 |
| Average | 59 (100.0%) | $0 |
Occupancy by Householder Income Bracket in Dutch Flat
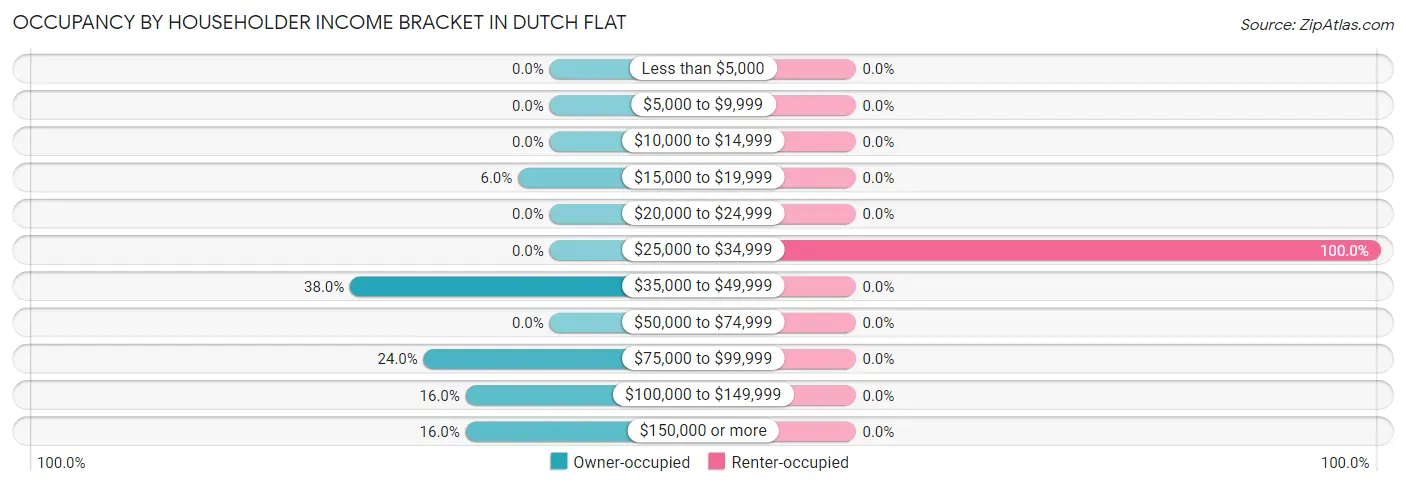
| Income Bracket | Owner-occupied | Renter-occupied |
| Less than $5,000 | 0 (0.0%) | 0 (0.0%) |
| $5,000 to $9,999 | 0 (0.0%) | 0 (0.0%) |
| $10,000 to $14,999 | 0 (0.0%) | 0 (0.0%) |
| $15,000 to $19,999 | 3 (6.0%) | 0 (0.0%) |
| $20,000 to $24,999 | 0 (0.0%) | 0 (0.0%) |
| $25,000 to $34,999 | 0 (0.0%) | 9 (100.0%) |
| $35,000 to $49,999 | 19 (38.0%) | 0 (0.0%) |
| $50,000 to $74,999 | 0 (0.0%) | 0 (0.0%) |
| $75,000 to $99,999 | 12 (24.0%) | 0 (0.0%) |
| $100,000 to $149,999 | 8 (16.0%) | 0 (0.0%) |
| $150,000 or more | 8 (16.0%) | 0 (0.0%) |
| Total | 50 (100.0%) | 9 (100.0%) |
Monthly Housing Cost Tiers in Dutch Flat
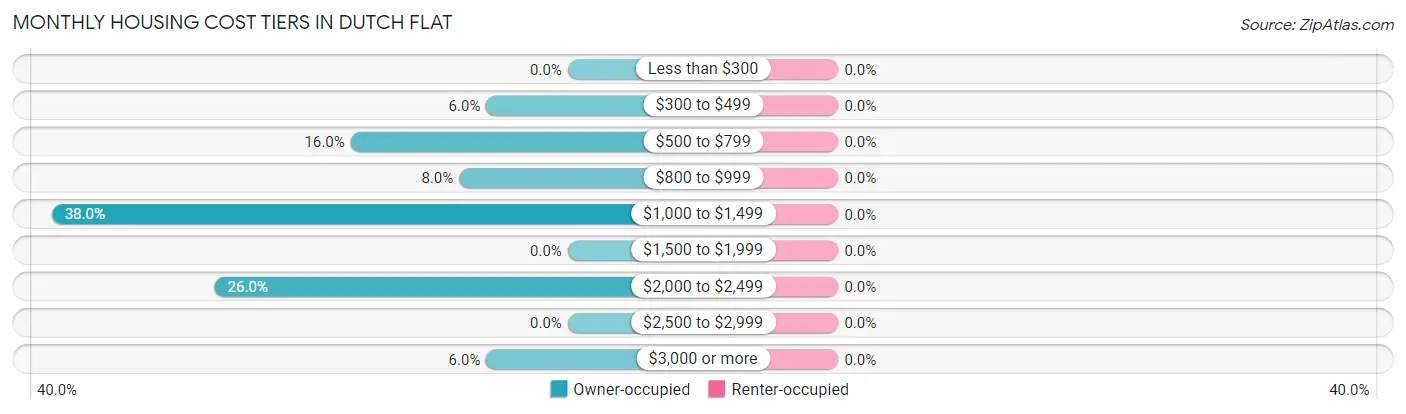
| Monthly Cost | Owner-occupied | Renter-occupied |
| Less than $300 | 0 (0.0%) | 0 (0.0%) |
| $300 to $499 | 3 (6.0%) | 0 (0.0%) |
| $500 to $799 | 8 (16.0%) | 0 (0.0%) |
| $800 to $999 | 4 (8.0%) | 0 (0.0%) |
| $1,000 to $1,499 | 19 (38.0%) | 0 (0.0%) |
| $1,500 to $1,999 | 0 (0.0%) | 0 (0.0%) |
| $2,000 to $2,499 | 13 (26.0%) | 0 (0.0%) |
| $2,500 to $2,999 | 0 (0.0%) | 0 (0.0%) |
| $3,000 or more | 3 (6.0%) | 0 (0.0%) |
| Total | 50 (100.0%) | 9 (100.0%) |
Physical Housing Characteristics in Dutch Flat
Housing Structures in Dutch Flat
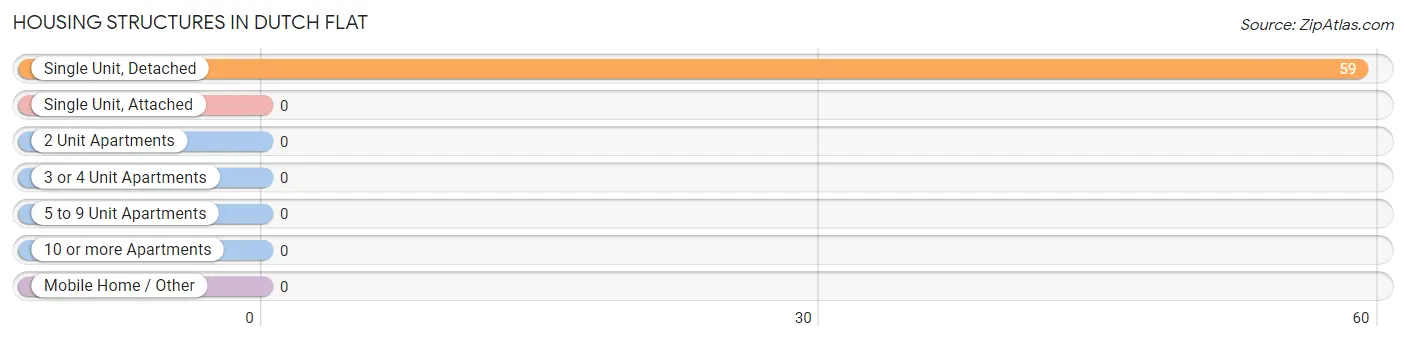
| Structure Type | # Housing Units | % Housing Units |
| Single Unit, Detached | 59 | 100.0% |
| Single Unit, Attached | 0 | 0.0% |
| 2 Unit Apartments | 0 | 0.0% |
| 3 or 4 Unit Apartments | 0 | 0.0% |
| 5 to 9 Unit Apartments | 0 | 0.0% |
| 10 or more Apartments | 0 | 0.0% |
| Mobile Home / Other | 0 | 0.0% |
| Total | 59 | 100.0% |
Housing Structures by Occupancy in Dutch Flat
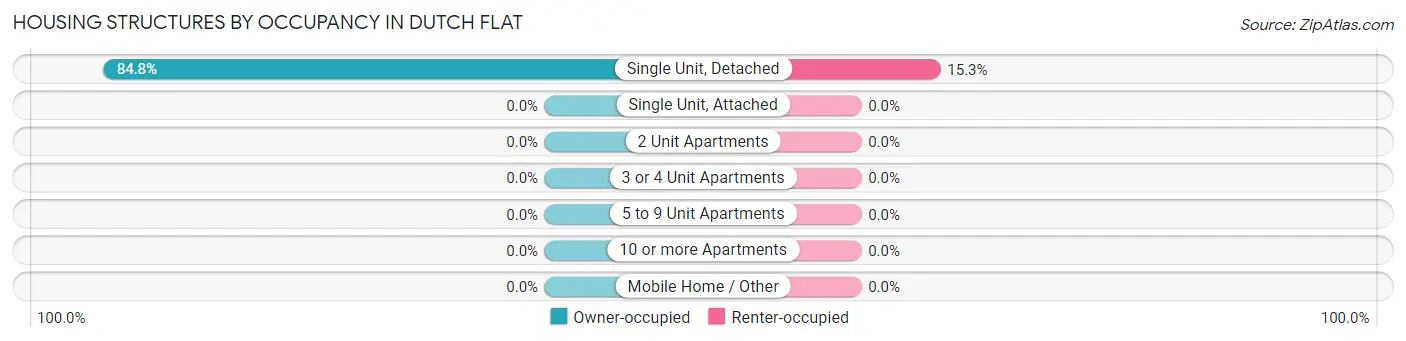
| Structure Type | Owner-occupied | Renter-occupied |
| Single Unit, Detached | 50 (84.8%) | 9 (15.2%) |
| Single Unit, Attached | 0 (0.0%) | 0 (0.0%) |
| 2 Unit Apartments | 0 (0.0%) | 0 (0.0%) |
| 3 or 4 Unit Apartments | 0 (0.0%) | 0 (0.0%) |
| 5 to 9 Unit Apartments | 0 (0.0%) | 0 (0.0%) |
| 10 or more Apartments | 0 (0.0%) | 0 (0.0%) |
| Mobile Home / Other | 0 (0.0%) | 0 (0.0%) |
| Total | 50 (84.8%) | 9 (15.2%) |
Housing Structures by Number of Rooms in Dutch Flat
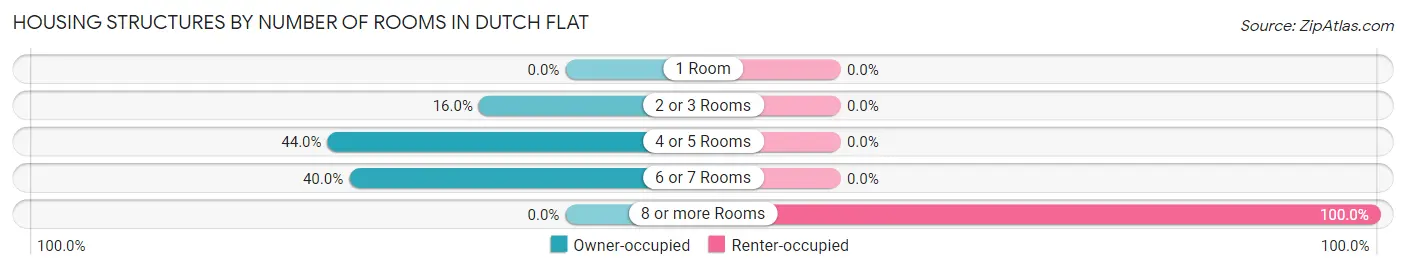
| Number of Rooms | Owner-occupied | Renter-occupied |
| 1 Room | 0 (0.0%) | 0 (0.0%) |
| 2 or 3 Rooms | 8 (16.0%) | 0 (0.0%) |
| 4 or 5 Rooms | 22 (44.0%) | 0 (0.0%) |
| 6 or 7 Rooms | 20 (40.0%) | 0 (0.0%) |
| 8 or more Rooms | 0 (0.0%) | 9 (100.0%) |
| Total | 50 (100.0%) | 9 (100.0%) |
Housing Structure by Heating Type in Dutch Flat
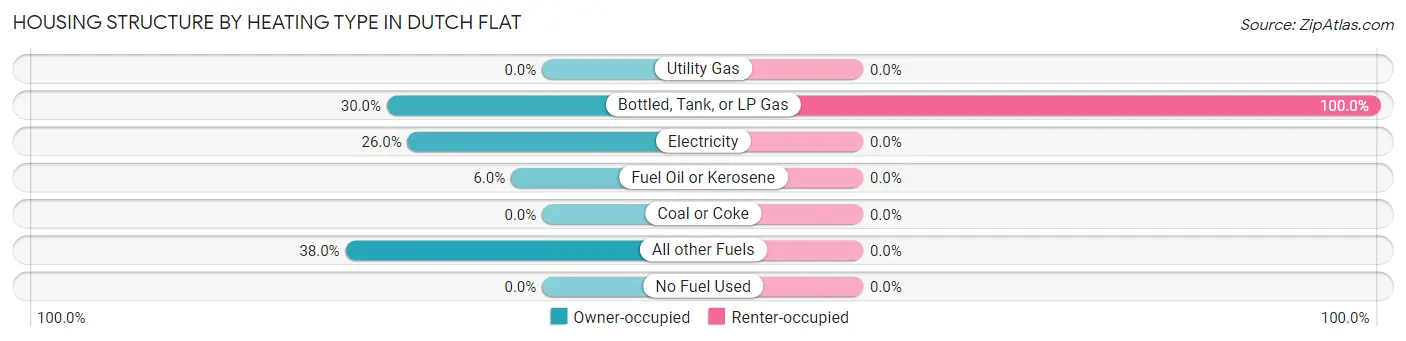
| Heating Type | Owner-occupied | Renter-occupied |
| Utility Gas | 0 (0.0%) | 0 (0.0%) |
| Bottled, Tank, or LP Gas | 15 (30.0%) | 9 (100.0%) |
| Electricity | 13 (26.0%) | 0 (0.0%) |
| Fuel Oil or Kerosene | 3 (6.0%) | 0 (0.0%) |
| Coal or Coke | 0 (0.0%) | 0 (0.0%) |
| All other Fuels | 19 (38.0%) | 0 (0.0%) |
| No Fuel Used | 0 (0.0%) | 0 (0.0%) |
| Total | 50 (100.0%) | 9 (100.0%) |
Household Vehicle Usage in Dutch Flat
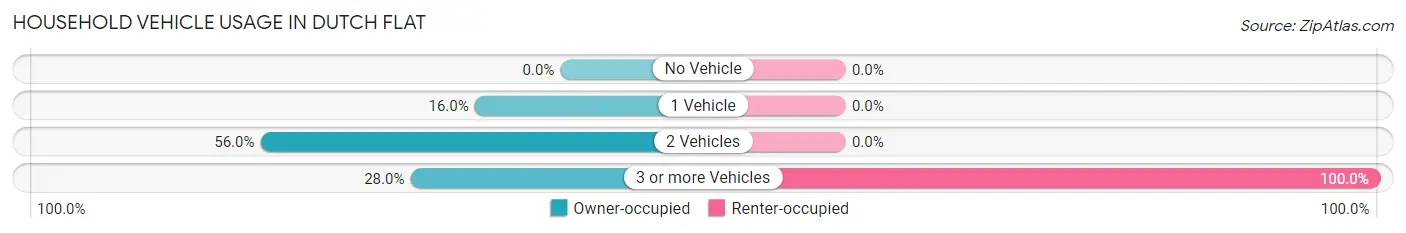
| Vehicles per Household | Owner-occupied | Renter-occupied |
| No Vehicle | 0 (0.0%) | 0 (0.0%) |
| 1 Vehicle | 8 (16.0%) | 0 (0.0%) |
| 2 Vehicles | 28 (56.0%) | 0 (0.0%) |
| 3 or more Vehicles | 14 (28.0%) | 9 (100.0%) |
| Total | 50 (100.0%) | 9 (100.0%) |
Real Estate & Mortgages in Dutch Flat
Real Estate and Mortgage Overview in Dutch Flat
| Characteristic | Without Mortgage | With Mortgage |
| Housing Units | 19 | 31 |
| Median Property Value | $381,300 | $275,000 |
| Median Household Income | $89,063 | $8 |
| Monthly Housing Costs | $781 | $3 |
| Real Estate Taxes | $1,906 | $0 |
Property Value by Mortgage Status in Dutch Flat
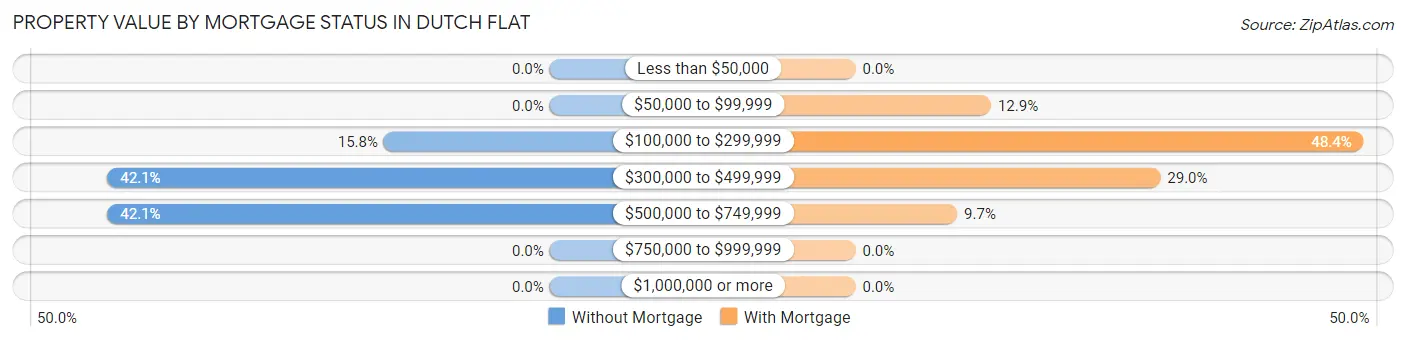
| Property Value | Without Mortgage | With Mortgage |
| Less than $50,000 | 0 (0.0%) | 0 (0.0%) |
| $50,000 to $99,999 | 0 (0.0%) | 4 (12.9%) |
| $100,000 to $299,999 | 3 (15.8%) | 15 (48.4%) |
| $300,000 to $499,999 | 8 (42.1%) | 9 (29.0%) |
| $500,000 to $749,999 | 8 (42.1%) | 3 (9.7%) |
| $750,000 to $999,999 | 0 (0.0%) | 0 (0.0%) |
| $1,000,000 or more | 0 (0.0%) | 0 (0.0%) |
| Total | 19 (100.0%) | 31 (100.0%) |
Household Income by Mortgage Status in Dutch Flat
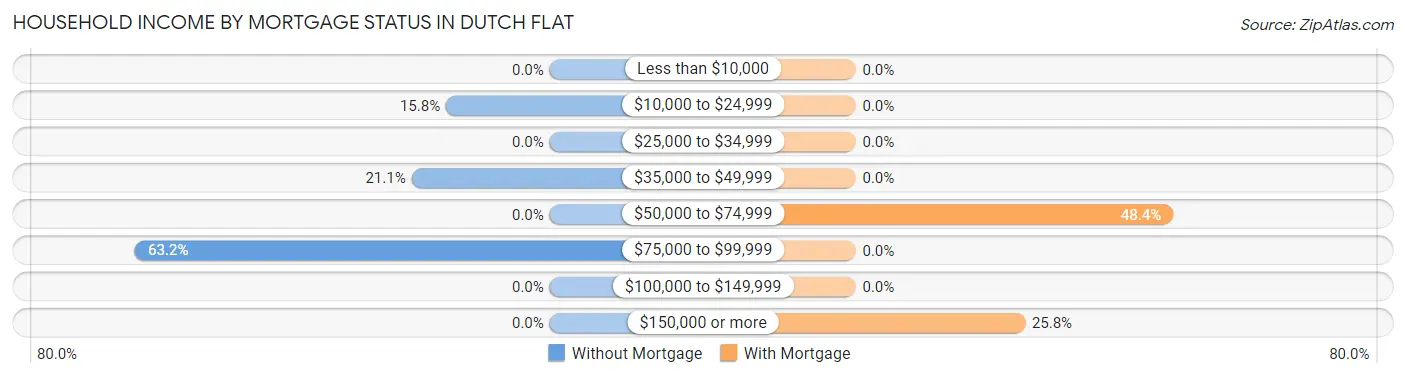
| Household Income | Without Mortgage | With Mortgage |
| Less than $10,000 | 0 (0.0%) | 0 (0.0%) |
| $10,000 to $24,999 | 3 (15.8%) | 0 (0.0%) |
| $25,000 to $34,999 | 0 (0.0%) | 0 (0.0%) |
| $35,000 to $49,999 | 4 (21.0%) | 0 (0.0%) |
| $50,000 to $74,999 | 0 (0.0%) | 15 (48.4%) |
| $75,000 to $99,999 | 12 (63.2%) | 0 (0.0%) |
| $100,000 to $149,999 | 0 (0.0%) | 0 (0.0%) |
| $150,000 or more | 0 (0.0%) | 8 (25.8%) |
| Total | 19 (100.0%) | 31 (100.0%) |
Property Value to Household Income Ratio in Dutch Flat
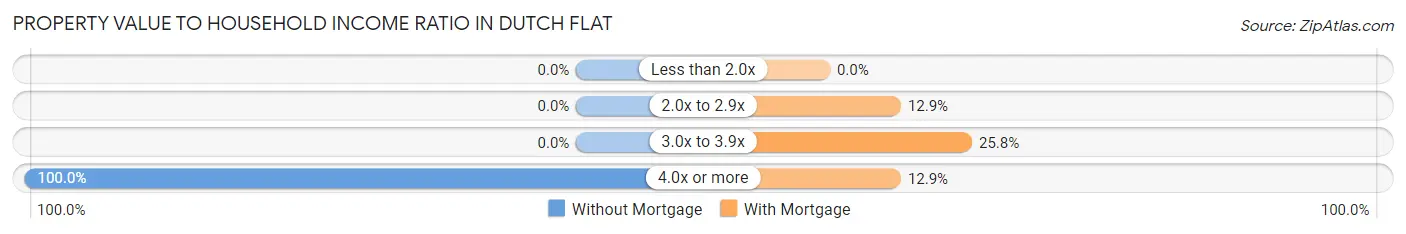
| Value-to-Income Ratio | Without Mortgage | With Mortgage |
| Less than 2.0x | 0 (0.0%) | 0 (0.0%) |
| 2.0x to 2.9x | 0 (0.0%) | 4 (12.9%) |
| 3.0x to 3.9x | 0 (0.0%) | 8 (25.8%) |
| 4.0x or more | 19 (100.0%) | 4 (12.9%) |
| Total | 19 (100.0%) | 31 (100.0%) |
Real Estate Taxes by Mortgage Status in Dutch Flat
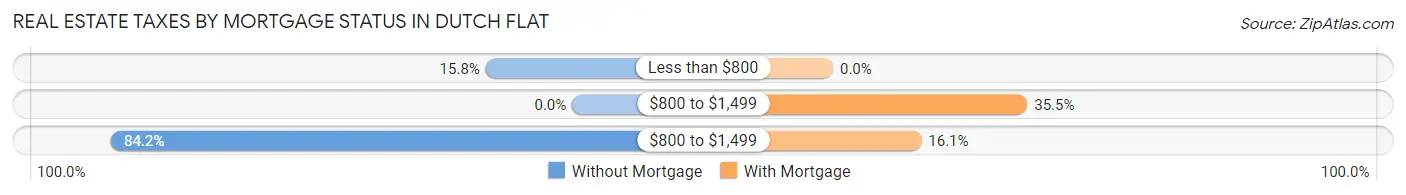
| Property Taxes | Without Mortgage | With Mortgage |
| Less than $800 | 3 (15.8%) | 0 (0.0%) |
| $800 to $1,499 | 0 (0.0%) | 11 (35.5%) |
| $800 to $1,499 | 16 (84.2%) | 5 (16.1%) |
| Total | 19 (100.0%) | 31 (100.0%) |
Health & Disability in Dutch Flat
Health Insurance Coverage by Age in Dutch Flat
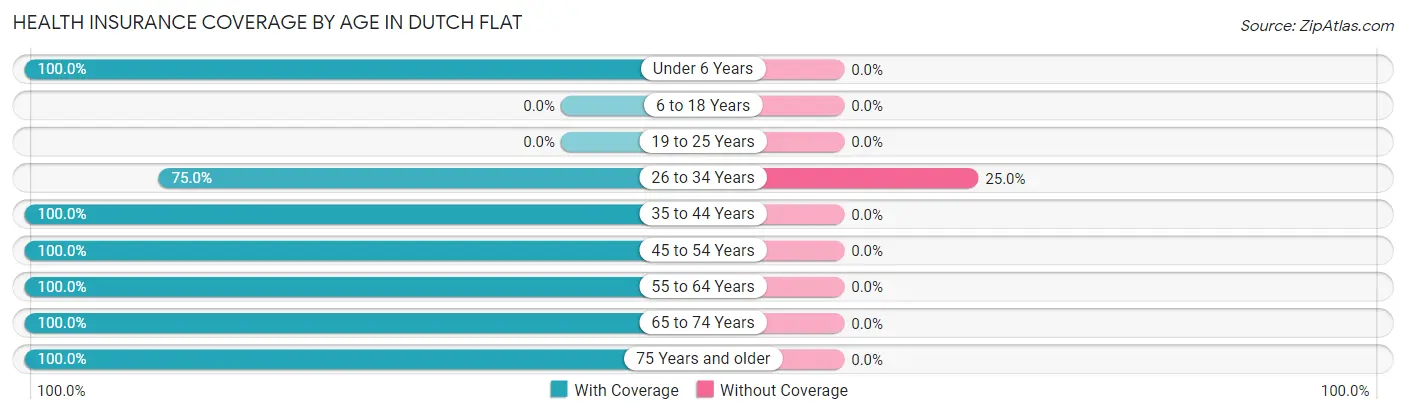
| Age Bracket | With Coverage | Without Coverage |
| Under 6 Years | 8 (100.0%) | 0 (0.0%) |
| 6 to 18 Years | 0 (0.0%) | 0 (0.0%) |
| 19 to 25 Years | 0 (0.0%) | 0 (0.0%) |
| 26 to 34 Years | 9 (75.0%) | 3 (25.0%) |
| 35 to 44 Years | 21 (100.0%) | 0 (0.0%) |
| 45 to 54 Years | 10 (100.0%) | 0 (0.0%) |
| 55 to 64 Years | 24 (100.0%) | 0 (0.0%) |
| 65 to 74 Years | 19 (100.0%) | 0 (0.0%) |
| 75 Years and older | 10 (100.0%) | 0 (0.0%) |
| Total | 101 (97.1%) | 3 (2.9%) |
Health Insurance Coverage by Citizenship Status in Dutch Flat
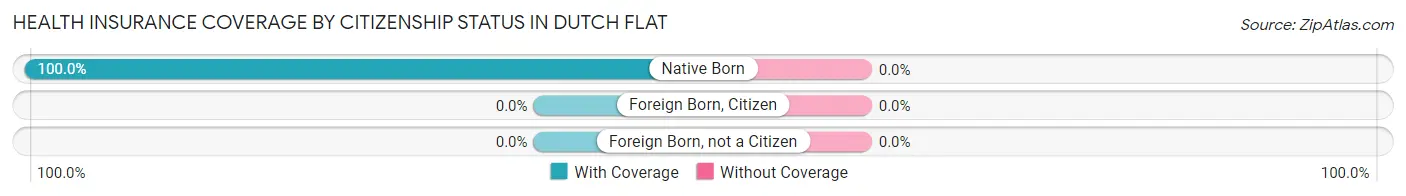
| Citizenship Status | With Coverage | Without Coverage |
| Native Born | 8 (100.0%) | 0 (0.0%) |
| Foreign Born, Citizen | 0 (0.0%) | 0 (0.0%) |
| Foreign Born, not a Citizen | 0 (0.0%) | 0 (0.0%) |
Health Insurance Coverage by Household Income in Dutch Flat
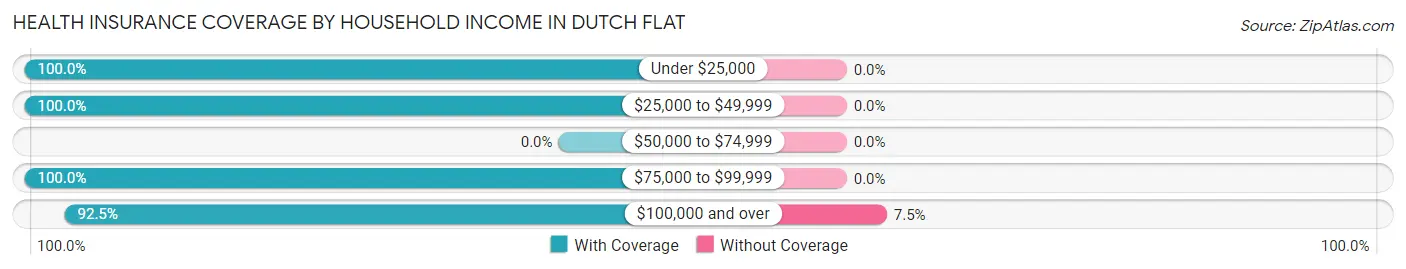
| Household Income | With Coverage | Without Coverage |
| Under $25,000 | 6 (100.0%) | 0 (0.0%) |
| $25,000 to $49,999 | 42 (100.0%) | 0 (0.0%) |
| $50,000 to $74,999 | 0 (0.0%) | 0 (0.0%) |
| $75,000 to $99,999 | 16 (100.0%) | 0 (0.0%) |
| $100,000 and over | 37 (92.5%) | 3 (7.5%) |
Public vs Private Health Insurance Coverage by Age in Dutch Flat
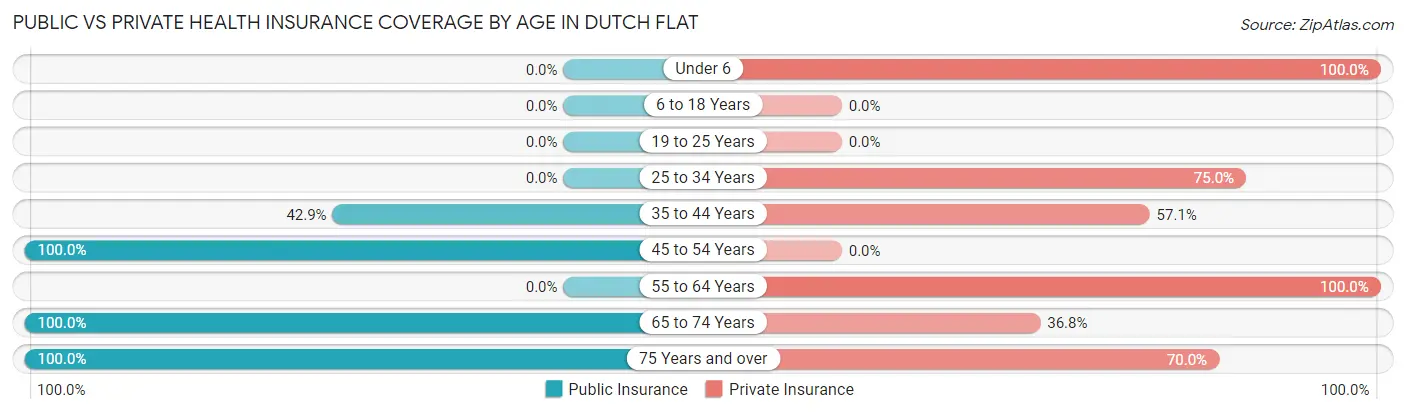
| Age Bracket | Public Insurance | Private Insurance |
| Under 6 | 0 (0.0%) | 8 (100.0%) |
| 6 to 18 Years | 0 (0.0%) | 0 (0.0%) |
| 19 to 25 Years | 0 (0.0%) | 0 (0.0%) |
| 25 to 34 Years | 0 (0.0%) | 9 (75.0%) |
| 35 to 44 Years | 9 (42.9%) | 12 (57.1%) |
| 45 to 54 Years | 10 (100.0%) | 0 (0.0%) |
| 55 to 64 Years | 0 (0.0%) | 24 (100.0%) |
| 65 to 74 Years | 19 (100.0%) | 7 (36.8%) |
| 75 Years and over | 10 (100.0%) | 7 (70.0%) |
| Total | 48 (46.2%) | 67 (64.4%) |
Disability Status by Sex by Age in Dutch Flat
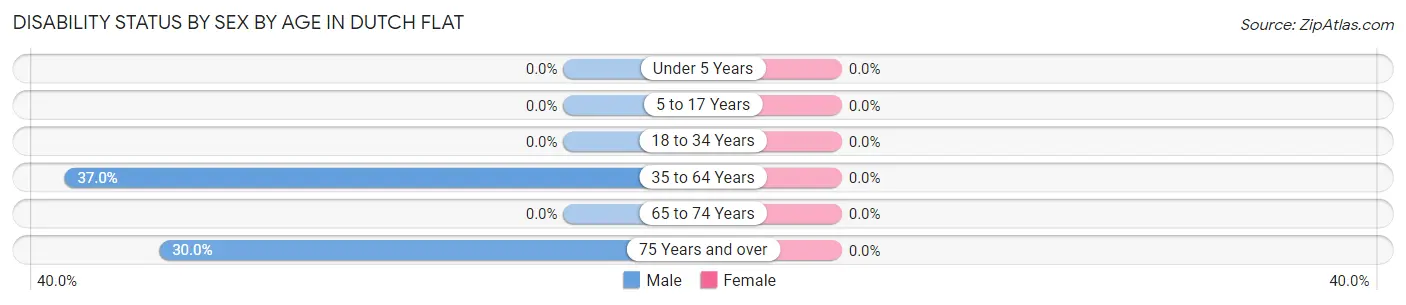
| Age Bracket | Male | Female |
| Under 5 Years | 0 (0.0%) | 0 (0.0%) |
| 5 to 17 Years | 0 (0.0%) | 0 (0.0%) |
| 18 to 34 Years | 0 (0.0%) | 0 (0.0%) |
| 35 to 64 Years | 10 (37.0%) | 0 (0.0%) |
| 65 to 74 Years | 0 (0.0%) | 0 (0.0%) |
| 75 Years and over | 3 (30.0%) | 0 (0.0%) |
Disability Class by Sex by Age in Dutch Flat
Disability Class: Hearing Difficulty
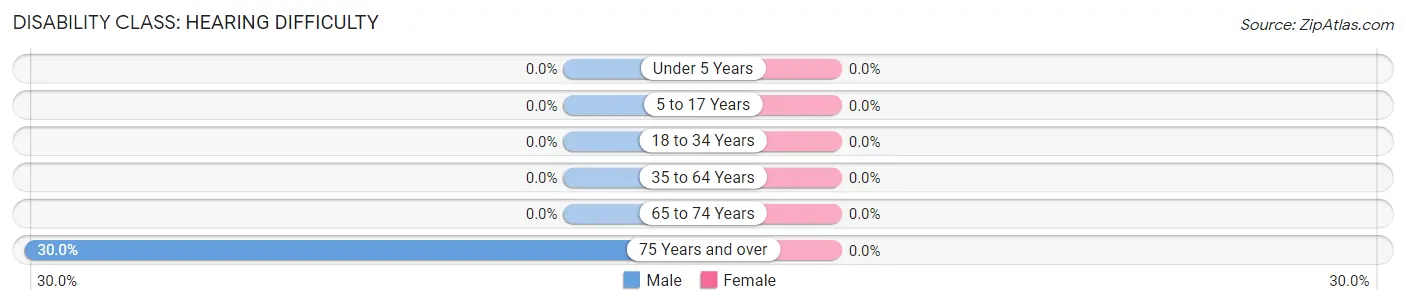
| Age Bracket | Male | Female |
| Under 5 Years | 0 (0.0%) | 0 (0.0%) |
| 5 to 17 Years | 0 (0.0%) | 0 (0.0%) |
| 18 to 34 Years | 0 (0.0%) | 0 (0.0%) |
| 35 to 64 Years | 0 (0.0%) | 0 (0.0%) |
| 65 to 74 Years | 0 (0.0%) | 0 (0.0%) |
| 75 Years and over | 3 (30.0%) | 0 (0.0%) |
Disability Class: Vision Difficulty
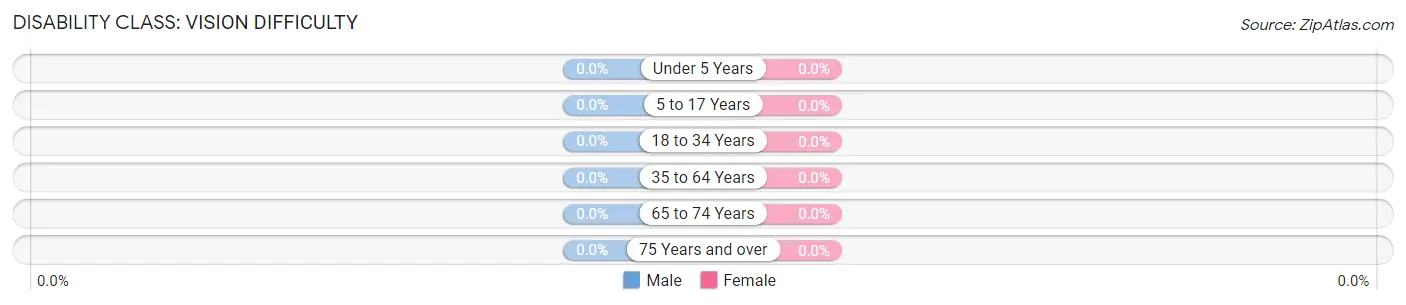
| Age Bracket | Male | Female |
| Under 5 Years | 0 (0.0%) | 0 (0.0%) |
| 5 to 17 Years | 0 (0.0%) | 0 (0.0%) |
| 18 to 34 Years | 0 (0.0%) | 0 (0.0%) |
| 35 to 64 Years | 0 (0.0%) | 0 (0.0%) |
| 65 to 74 Years | 0 (0.0%) | 0 (0.0%) |
| 75 Years and over | 0 (0.0%) | 0 (0.0%) |
Disability Class: Cognitive Difficulty
| Age Bracket | Male | Female |
| 5 to 17 Years | 0 (0.0%) | 0 (0.0%) |
| 18 to 34 Years | 0 (0.0%) | 0 (0.0%) |
| 35 to 64 Years | 0 (0.0%) | 0 (0.0%) |
| 65 to 74 Years | 0 (0.0%) | 0 (0.0%) |
| 75 Years and over | 0 (0.0%) | 0 (0.0%) |
Disability Class: Ambulatory Difficulty
| Age Bracket | Male | Female |
| 5 to 17 Years | 0 (0.0%) | 0 (0.0%) |
| 18 to 34 Years | 0 (0.0%) | 0 (0.0%) |
| 35 to 64 Years | 10 (37.0%) | 0 (0.0%) |
| 65 to 74 Years | 0 (0.0%) | 0 (0.0%) |
| 75 Years and over | 0 (0.0%) | 0 (0.0%) |
Disability Class: Self-Care Difficulty
| Age Bracket | Male | Female |
| 5 to 17 Years | 0 (0.0%) | 0 (0.0%) |
| 18 to 34 Years | 0 (0.0%) | 0 (0.0%) |
| 35 to 64 Years | 10 (37.0%) | 0 (0.0%) |
| 65 to 74 Years | 0 (0.0%) | 0 (0.0%) |
| 75 Years and over | 0 (0.0%) | 0 (0.0%) |
Technology Access in Dutch Flat
Computing Device Access in Dutch Flat
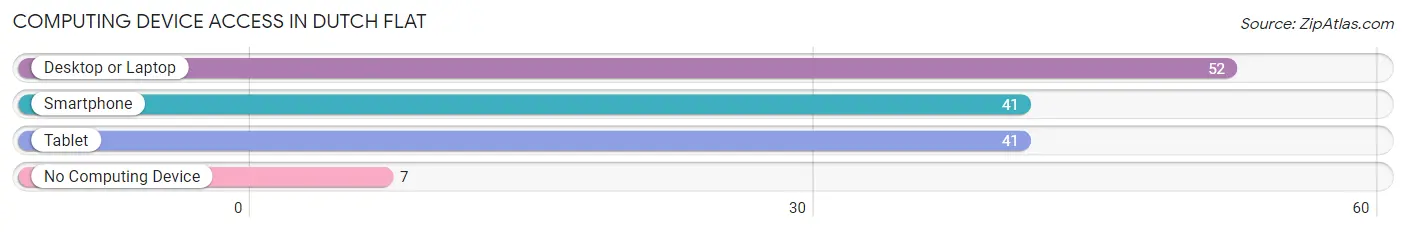
| Device Type | # Households | % Households |
| Desktop or Laptop | 52 | 88.1% |
| Smartphone | 41 | 69.5% |
| Tablet | 41 | 69.5% |
| No Computing Device | 7 | 11.9% |
| Total | 59 | 100.0% |
Internet Access in Dutch Flat
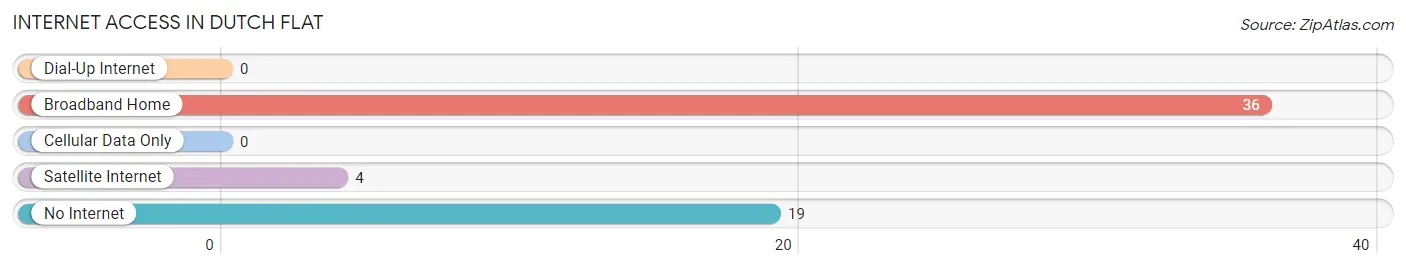
| Internet Type | # Households | % Households |
| Dial-Up Internet | 0 | 0.0% |
| Broadband Home | 36 | 61.0% |
| Cellular Data Only | 0 | 0.0% |
| Satellite Internet | 4 | 6.8% |
| No Internet | 19 | 32.2% |
| Total | 59 | 100.0% |
Dutch Flat Summary
History
The small town of Dutch Flat, California is located in Placer County, about 30 miles northeast of Sacramento. It was founded in 1851 by a group of Dutch miners who had come to the area in search of gold. The town was named after the Dutch miners who had settled there, and it quickly became a popular destination for miners and prospectors.
The town was originally a mining camp, but it soon grew into a bustling community. It had a post office, a school, a hotel, a general store, and several saloons. The town was also home to a number of churches, including the Dutch Reformed Church, which was founded in 1854.
The town was a popular destination for travelers, and it was also a popular stop for stagecoaches. The town was also home to a number of businesses, including a blacksmith, a livery stable, and a brewery.
In the late 1800s, the town began to decline as the gold rush ended and the population began to move away. By the early 1900s, the town was nearly abandoned. However, in the 1950s, the town began to experience a revival as people began to move back to the area.
Today, Dutch Flat is a small, rural community with a population of just over 500 people. It is a popular destination for tourists, and it is home to a number of historic buildings, including the Dutch Reformed Church, which is now a museum.
Geography
Dutch Flat is located in Placer County, California, about 30 miles northeast of Sacramento. It is situated in the Sierra Nevada foothills, at an elevation of 2,500 feet. The town is surrounded by rolling hills and is located near the American River.
The climate in Dutch Flat is mild and temperate, with hot summers and cool winters. The average annual temperature is around 60 degrees Fahrenheit. The town receives an average of 20 inches of precipitation each year.
Economy
The economy of Dutch Flat is largely based on tourism. The town is a popular destination for visitors who are interested in its history and its natural beauty. The town is also home to a number of small businesses, including restaurants, shops, and bed and breakfasts.
The town is also home to a number of wineries, which produce a variety of wines. The town is also home to a number of farms, which produce a variety of fruits and vegetables.
Demographics
As of the 2010 census, the population of Dutch Flat was 514 people. The racial makeup of the town was 94.3% White, 0.6% African American, 0.4% Native American, 0.4% Asian, 0.2% Pacific Islander, and 3.1% from other races. The median household income was $50,000, and the median age was 44.
Conclusion
Dutch Flat, California is a small, rural town located in Placer County, about 30 miles northeast of Sacramento. It was founded in 1851 by a group of Dutch miners, and it quickly became a popular destination for miners and prospectors. Today, the town is a popular destination for tourists, and it is home to a number of historic buildings, including the Dutch Reformed Church, which is now a museum. The economy of Dutch Flat is largely based on tourism, and the town is also home to a number of small businesses, wineries, and farms. As of the 2010 census, the population of Dutch Flat was 514 people.
Common Questions
What is Per Capita Income in Dutch Flat?
Per Capita income in Dutch Flat is $42,330.
What is the Median Family Income in Dutch Flat?
Median Family Income in Dutch Flat is $105,938.
What is Income or Wage Gap in Dutch Flat?
Income or Wage Gap in Dutch Flat is 39.0%.
Women in Dutch Flat earn 61.0 cents for every dollar earned by a man.
What is Inequality or Gini Index in Dutch Flat?
Inequality or Gini Index in Dutch Flat is 0.35.
What is the Total Population of Dutch Flat?
Total Population of Dutch Flat is 104.
What is the Total Male Population of Dutch Flat?
Total Male Population of Dutch Flat is 62.
What is the Total Female Population of Dutch Flat?
Total Female Population of Dutch Flat is 42.
What is the Ratio of Males per 100 Females in Dutch Flat?
There are 147.62 Males per 100 Females in Dutch Flat.
What is the Ratio of Females per 100 Males in Dutch Flat?
There are 67.74 Females per 100 Males in Dutch Flat.
What is the Median Population Age in Dutch Flat?
Median Population Age in Dutch Flat is 56.3 Years.
What is the Average Family Size in Dutch Flat
Average Family Size in Dutch Flat is 2.3 People.
What is the Average Household Size in Dutch Flat
Average Household Size in Dutch Flat is 1.8 People.
How Large is the Labor Force in Dutch Flat?
There are 61 People in the Labor Forcein in Dutch Flat.
What is the Percentage of People in the Labor Force in Dutch Flat?
63.5% of People are in the Labor Force in Dutch Flat.
What is the Unemployment Rate in Dutch Flat?
Unemployment Rate in Dutch Flat is 14.8%.