Zip Codes with the Highest Percentage of Population Employed in Agriculture, Fishing & Hunting in Downey, CA
RELATED REPORTS & OPTIONS
Agriculture, Fishing & Hunting
Downey
Compare Zip Codes
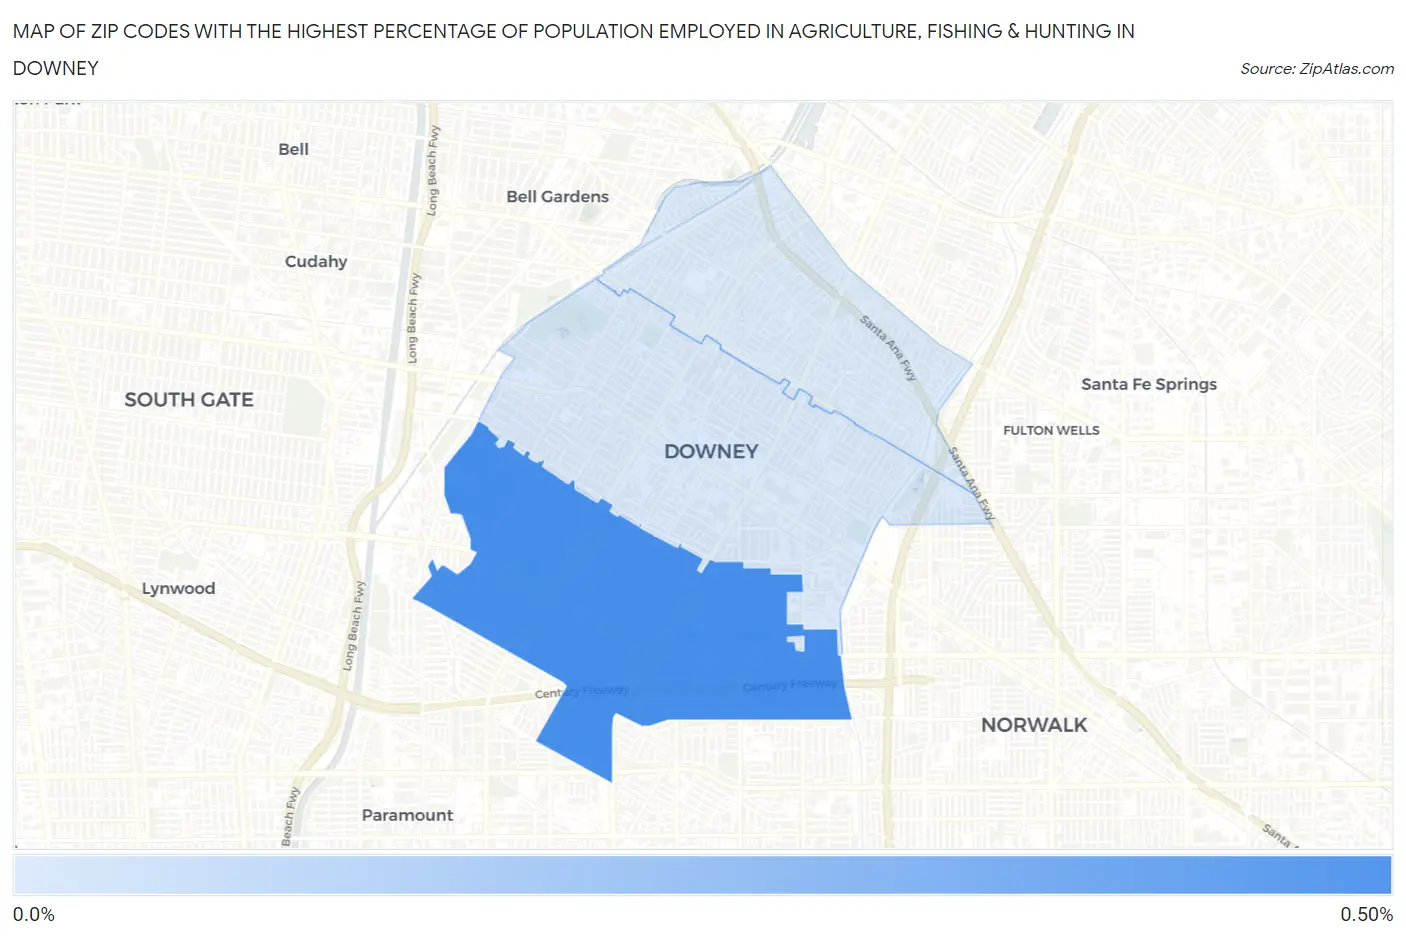
Map of Zip Codes with the Highest Percentage of Population Employed in Agriculture, Fishing & Hunting in Downey
0.0%
0.50%
Zip Codes with the Highest Percentage of Population Employed in Agriculture, Fishing & Hunting in Downey, CA
| Zip Code | % Employed | vs State | vs National | |
| 1. | 90242 | 0.44% | 2.0%(-1.55)#1,015 | 1.2%(-0.762)#19,817 |
| 2. | 90241 | 0.076% | 2.0%(-1.91)#1,367 | 1.2%(-1.12)#24,016 |
| 3. | 90240 | 0.068% | 2.0%(-1.92)#1,373 | 1.2%(-1.13)#24,129 |
1
Common Questions
What are the Top Zip Codes with the Highest Percentage of Population Employed in Agriculture, Fishing & Hunting in Downey, CA?
Top Zip Codes with the Highest Percentage of Population Employed in Agriculture, Fishing & Hunting in Downey, CA are:
What zip code has the Highest Percentage of Population Employed in Agriculture, Fishing & Hunting in Downey, CA?
90242 has the Highest Percentage of Population Employed in Agriculture, Fishing & Hunting in Downey, CA with 0.44%.
What is the Percentage of Population Employed in Agriculture, Fishing & Hunting in Downey, CA?
Percentage of Population Employed in Agriculture, Fishing & Hunting in Downey is 0.21%.
What is the Percentage of Population Employed in Agriculture, Fishing & Hunting in California?
Percentage of Population Employed in Agriculture, Fishing & Hunting in California is 2.0%.
What is the Percentage of Population Employed in Agriculture, Fishing & Hunting in the United States?
Percentage of Population Employed in Agriculture, Fishing & Hunting in the United States is 1.2%.