Dos Palos, CA Map & Demographics
Dos Palos Map
Dos Palos Overview
$24,523
PER CAPITA INCOME
$65,223
AVG FAMILY INCOME
$51,230
AVG HOUSEHOLD INCOME
52.0%
WAGE / INCOME GAP [ % ]
48.0¢/ $1
WAGE / INCOME GAP [ $ ]
0.47
INEQUALITY / GINI INDEX
5,755
TOTAL POPULATION
2,598
MALE POPULATION
3,157
FEMALE POPULATION
82.29
MALES / 100 FEMALES
121.52
FEMALES / 100 MALES
37.5
MEDIAN AGE
3.6
AVG FAMILY SIZE
3.2
AVG HOUSEHOLD SIZE
2,484
LABOR FORCE [ PEOPLE ]
52.0%
PERCENT IN LABOR FORCE
12.8%
UNEMPLOYMENT RATE
Dos Palos Zip Codes
Dos Palos Area Codes
Income in Dos Palos
Income Overview in Dos Palos
Per Capita Income in Dos Palos is $24,523, while median incomes of families and households are $65,223 and $51,230 respectively.
| Characteristic | Number | Measure |
| Per Capita Income | 5,755 | $24,523 |
| Median Family Income | 1,431 | $65,223 |
| Mean Family Income | 1,431 | $84,351 |
| Median Household Income | 1,798 | $51,230 |
| Mean Household Income | 1,798 | $75,307 |
| Income Deficit | 1,431 | $0 |
| Wage / Income Gap (%) | 5,755 | 52.01% |
| Wage / Income Gap ($) | 5,755 | 47.99¢ per $1 |
| Gini / Inequality Index | 5,755 | 0.47 |
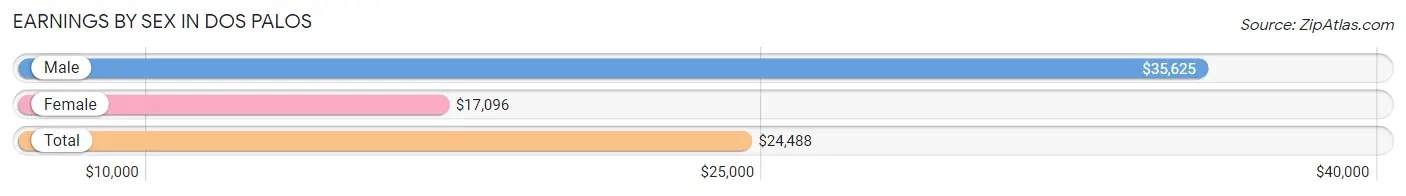
Earnings by Sex in Dos Palos
Average Earnings in Dos Palos are $24,488, $35,625 for men and $17,096 for women, a difference of 52.0%.
| Sex | Number | Average Earnings |
| Male | 1,203 (48.8%) | $35,625 |
| Female | 1,264 (51.2%) | $17,096 |
| Total | 2,467 (100.0%) | $24,488 |
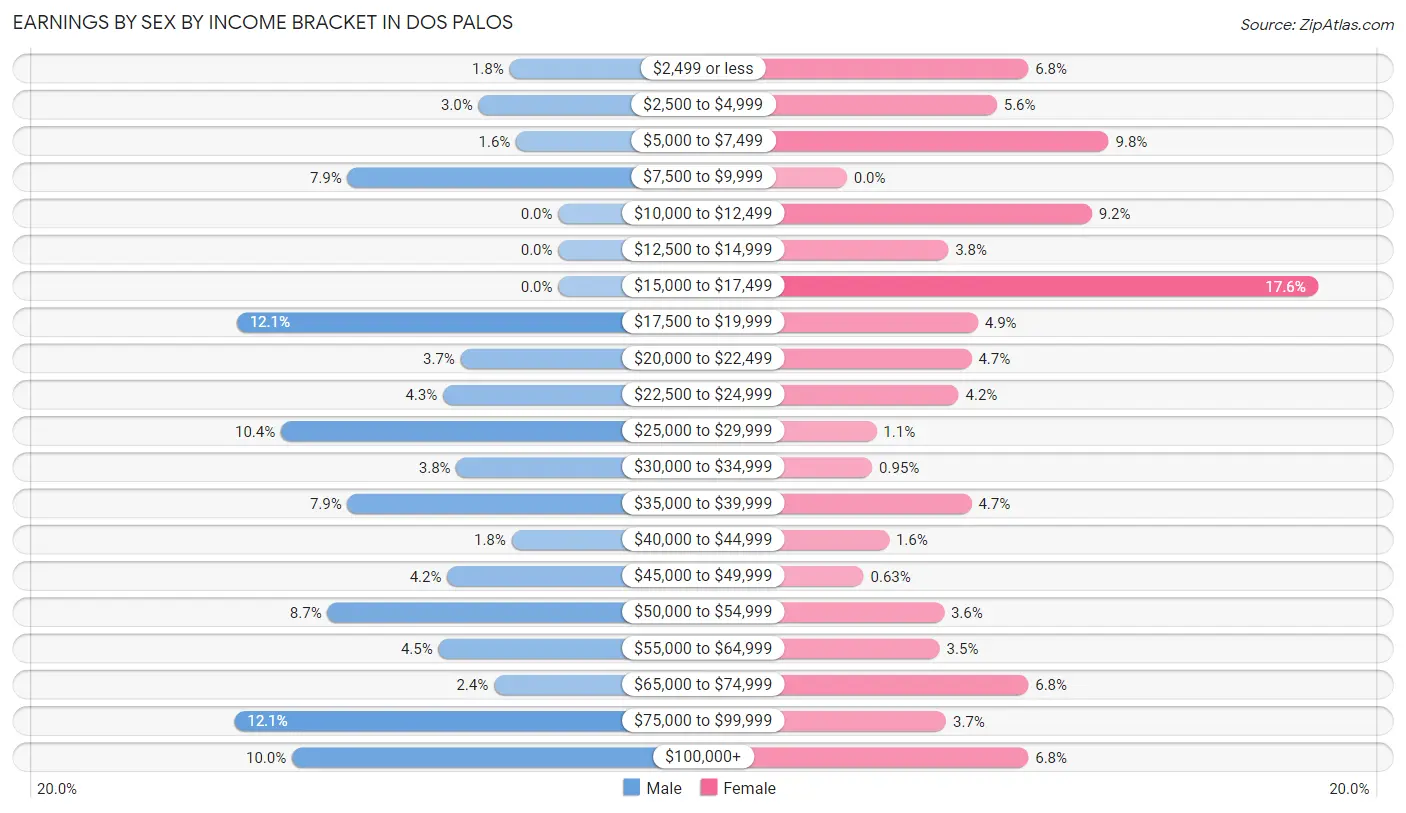
Earnings by Sex by Income Bracket in Dos Palos
The most common earnings brackets in Dos Palos are $75,000 to $99,999 for men (146 | 12.1%) and $15,000 to $17,499 for women (223 | 17.6%).
| Income | Male | Female |
| $2,499 or less | 22 (1.8%) | 86 (6.8%) |
| $2,500 to $4,999 | 36 (3.0%) | 71 (5.6%) |
| $5,000 to $7,499 | 19 (1.6%) | 124 (9.8%) |
| $7,500 to $9,999 | 95 (7.9%) | 0 (0.0%) |
| $10,000 to $12,499 | 0 (0.0%) | 116 (9.2%) |
| $12,500 to $14,999 | 0 (0.0%) | 48 (3.8%) |
| $15,000 to $17,499 | 0 (0.0%) | 223 (17.6%) |
| $17,500 to $19,999 | 145 (12.0%) | 62 (4.9%) |
| $20,000 to $22,499 | 44 (3.7%) | 59 (4.7%) |
| $22,500 to $24,999 | 52 (4.3%) | 53 (4.2%) |
| $25,000 to $29,999 | 125 (10.4%) | 14 (1.1%) |
| $30,000 to $34,999 | 46 (3.8%) | 12 (0.9%) |
| $35,000 to $39,999 | 95 (7.9%) | 59 (4.7%) |
| $40,000 to $44,999 | 21 (1.8%) | 20 (1.6%) |
| $45,000 to $49,999 | 50 (4.2%) | 8 (0.6%) |
| $50,000 to $54,999 | 104 (8.6%) | 46 (3.6%) |
| $55,000 to $64,999 | 54 (4.5%) | 44 (3.5%) |
| $65,000 to $74,999 | 29 (2.4%) | 86 (6.8%) |
| $75,000 to $99,999 | 146 (12.1%) | 47 (3.7%) |
| $100,000+ | 120 (10.0%) | 86 (6.8%) |
| Total | 1,203 (100.0%) | 1,264 (100.0%) |
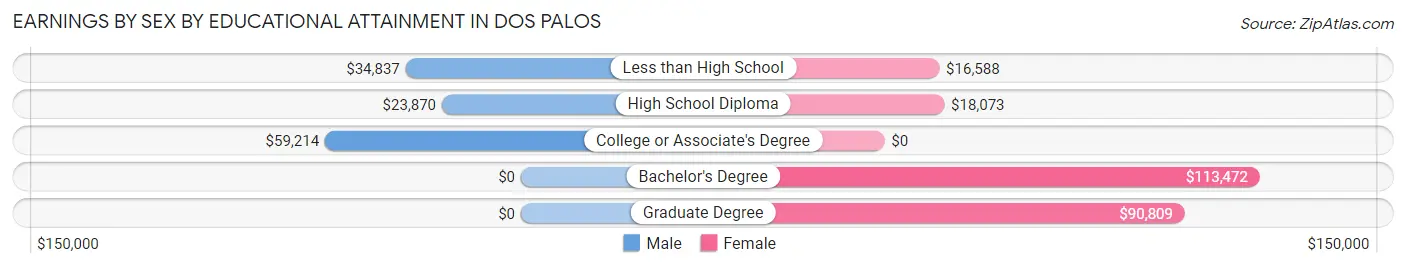
Earnings by Sex by Educational Attainment in Dos Palos
Average earnings in Dos Palos are $37,286 for men and $20,657 for women, a difference of 44.6%. Men with an educational attainment of college or associate's degree enjoy the highest average annual earnings of $59,214, while those with high school diploma education earn the least with $23,870. Women with an educational attainment of bachelor's degree earn the most with the average annual earnings of $113,472, while those with less than high school education have the smallest earnings of $16,588.
| Educational Attainment | Male Income | Female Income |
| Less than High School | $34,837 | $16,588 |
| High School Diploma | $23,870 | $18,073 |
| College or Associate's Degree | $59,214 | $0 |
| Bachelor's Degree | - | - |
| Graduate Degree | - | - |
| Total | $37,286 | $20,657 |
Family Income in Dos Palos
Family Income Brackets in Dos Palos
According to the Dos Palos family income data, there are 296 families falling into the $100,000 to $149,999 income range, which is the most common income bracket and makes up 20.7% of all families. Conversely, the $10,000 to $14,999 income bracket is the least frequent group with only 17 families (1.2%) belonging to this category.
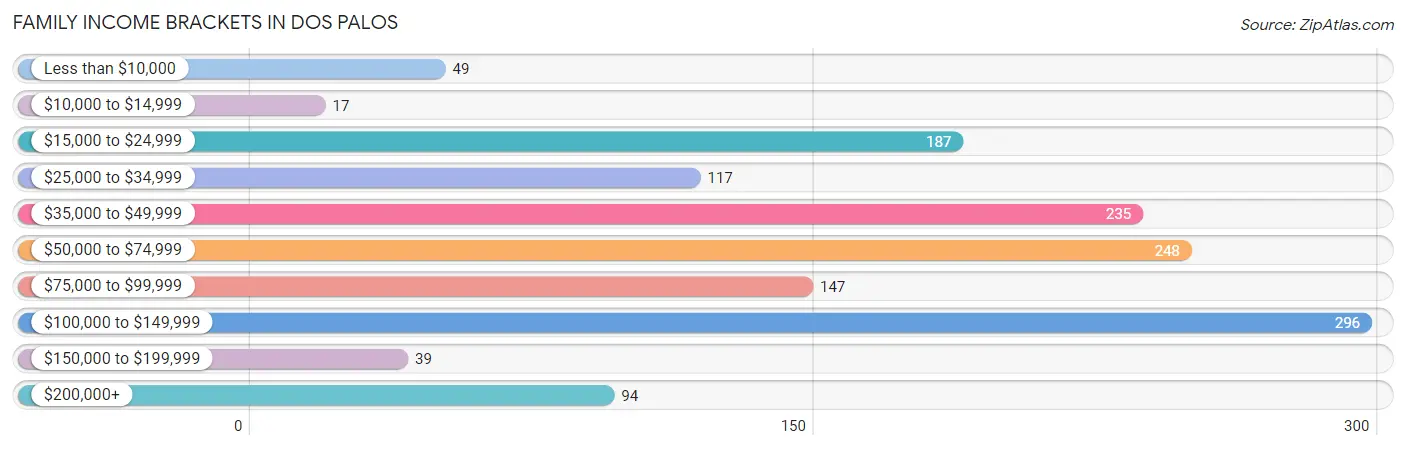
| Income Bracket | # Families | % Families |
| Less than $10,000 | 49 | 3.4% |
| $10,000 to $14,999 | 17 | 1.2% |
| $15,000 to $24,999 | 187 | 13.1% |
| $25,000 to $34,999 | 117 | 8.2% |
| $35,000 to $49,999 | 235 | 16.4% |
| $50,000 to $74,999 | 248 | 17.3% |
| $75,000 to $99,999 | 147 | 10.3% |
| $100,000 to $149,999 | 296 | 20.7% |
| $150,000 to $199,999 | 39 | 2.7% |
| $200,000+ | 94 | 6.6% |
Family Income by Famaliy Size in Dos Palos
5-person families (175 | 12.2%) account for the highest median family income in Dos Palos with $67,202 per family, while 2-person families (617 | 43.1%) have the highest median income of $22,263 per family member.
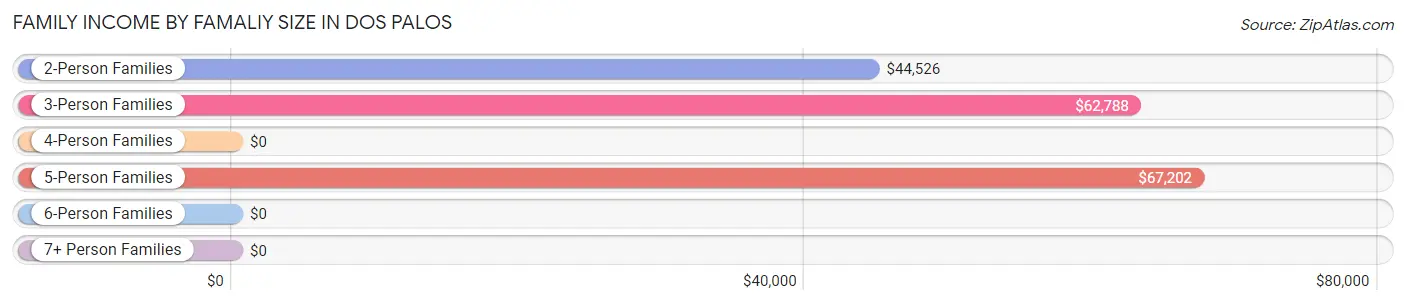
| Income Bracket | # Families | Median Income |
| 2-Person Families | 617 (43.1%) | $44,526 |
| 3-Person Families | 341 (23.8%) | $62,788 |
| 4-Person Families | 163 (11.4%) | $0 |
| 5-Person Families | 175 (12.2%) | $67,202 |
| 6-Person Families | 40 (2.8%) | $0 |
| 7+ Person Families | 95 (6.6%) | $0 |
| Total | 1,431 (100.0%) | $65,223 |
Family Income by Number of Earners in Dos Palos
The median family income in Dos Palos is $65,223, with families comprising 3+ earners (186) having the highest median family income of $113,049, while families with no earners (334) have the lowest median family income of $24,773, accounting for 13.0% and 23.3% of families, respectively.
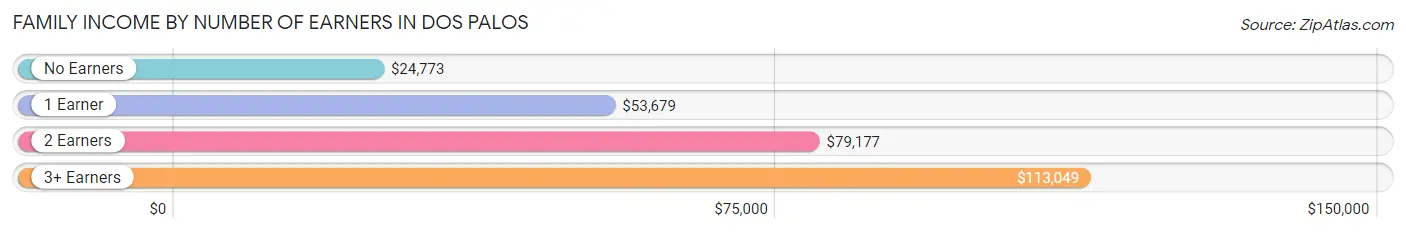
| Number of Earners | # Families | Median Income |
| No Earners | 334 (23.3%) | $24,773 |
| 1 Earner | 621 (43.4%) | $53,679 |
| 2 Earners | 290 (20.3%) | $79,177 |
| 3+ Earners | 186 (13.0%) | $113,049 |
| Total | 1,431 (100.0%) | $65,223 |
Household Income in Dos Palos
Household Income Brackets in Dos Palos
With 333 households falling in the category, the $50,000 to $74,999 income range is the most frequent in Dos Palos, accounting for 18.5% of all households. In contrast, only 31 households (1.7%) fall into the $10,000 to $14,999 income bracket, making it the least populous group.
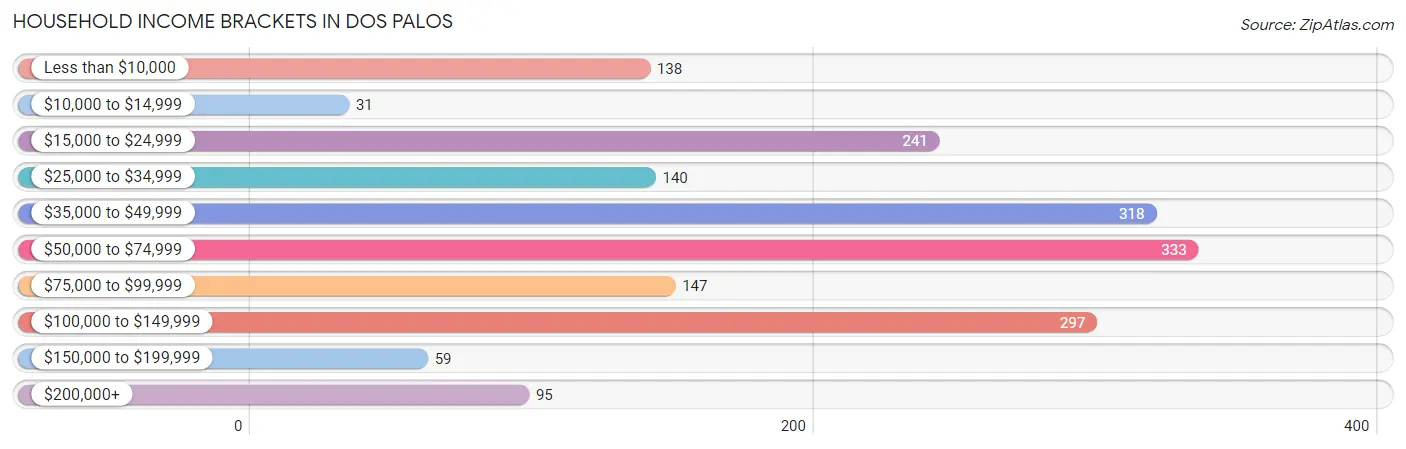
| Income Bracket | # Households | % Households |
| Less than $10,000 | 138 | 7.7% |
| $10,000 to $14,999 | 31 | 1.7% |
| $15,000 to $24,999 | 241 | 13.4% |
| $25,000 to $34,999 | 140 | 7.8% |
| $35,000 to $49,999 | 318 | 17.7% |
| $50,000 to $74,999 | 333 | 18.5% |
| $75,000 to $99,999 | 147 | 8.2% |
| $100,000 to $149,999 | 297 | 16.5% |
| $150,000 to $199,999 | 59 | 3.3% |
| $200,000+ | 95 | 5.3% |
Household Income by Householder Age in Dos Palos
The median household income in Dos Palos is $51,230, with the highest median household income of $66,011 found in the 25 to 44 years age bracket for the primary householder. A total of 512 households (28.5%) fall into this category. Meanwhile, the 15 to 24 years age bracket for the primary householder has the lowest median household income of $0, with 83 households (4.6%) in this group.
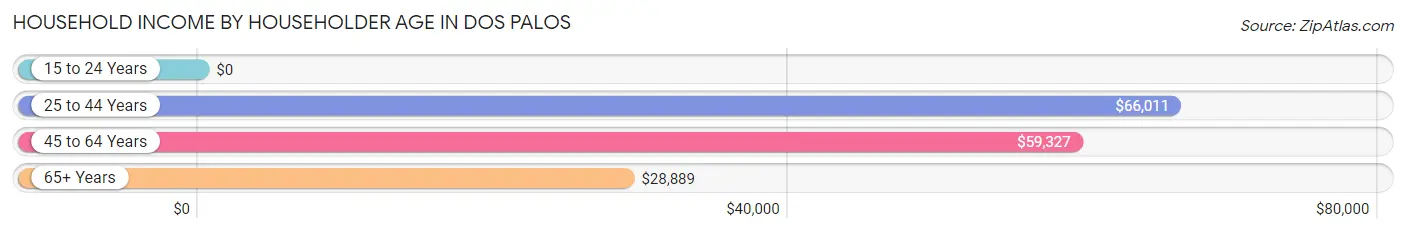
| Income Bracket | # Households | Median Income |
| 15 to 24 Years | 83 (4.6%) | $0 |
| 25 to 44 Years | 512 (28.5%) | $66,011 |
| 45 to 64 Years | 679 (37.8%) | $59,327 |
| 65+ Years | 524 (29.1%) | $28,889 |
| Total | 1,798 (100.0%) | $51,230 |
Poverty in Dos Palos
Income Below Poverty by Sex and Age in Dos Palos
With 9.1% poverty level for males and 13.4% for females among the residents of Dos Palos, 12 to 14 year old males and 12 to 14 year old females are the most vulnerable to poverty, with 17 males (100.0%) and 45 females (39.1%) in their respective age groups living below the poverty level.
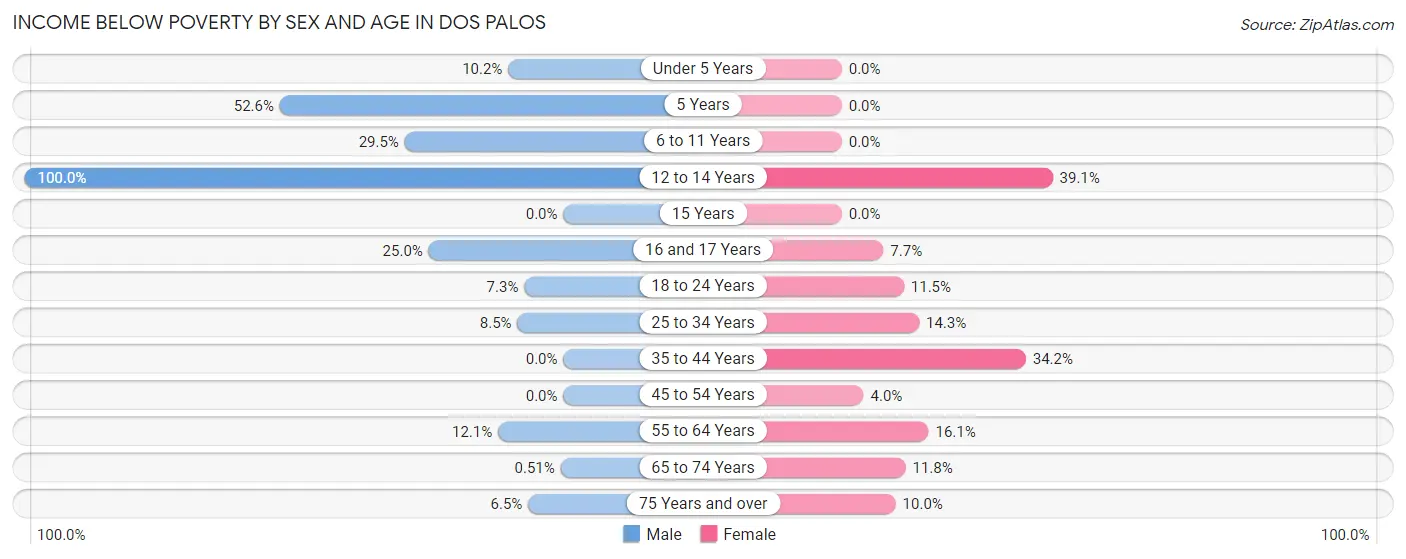
| Age Bracket | Male | Female |
| Under 5 Years | 21 (10.2%) | 0 (0.0%) |
| 5 Years | 20 (52.6%) | 0 (0.0%) |
| 6 to 11 Years | 43 (29.4%) | 0 (0.0%) |
| 12 to 14 Years | 17 (100.0%) | 45 (39.1%) |
| 15 Years | 0 (0.0%) | 0 (0.0%) |
| 16 and 17 Years | 17 (25.0%) | 19 (7.7%) |
| 18 to 24 Years | 13 (7.3%) | 53 (11.5%) |
| 25 to 34 Years | 37 (8.5%) | 36 (14.3%) |
| 35 to 44 Years | 0 (0.0%) | 151 (34.2%) |
| 45 to 54 Years | 0 (0.0%) | 16 (4.0%) |
| 55 to 64 Years | 52 (12.1%) | 38 (16.1%) |
| 65 to 74 Years | 2 (0.5%) | 51 (11.8%) |
| 75 Years and over | 13 (6.5%) | 11 (10.0%) |
| Total | 235 (9.1%) | 420 (13.4%) |
Income Above Poverty by Sex and Age in Dos Palos
According to the poverty statistics in Dos Palos, males aged 35 to 44 years and females aged under 5 years are the age groups that are most secure financially, with 100.0% of males and 100.0% of females in these age groups living above the poverty line.
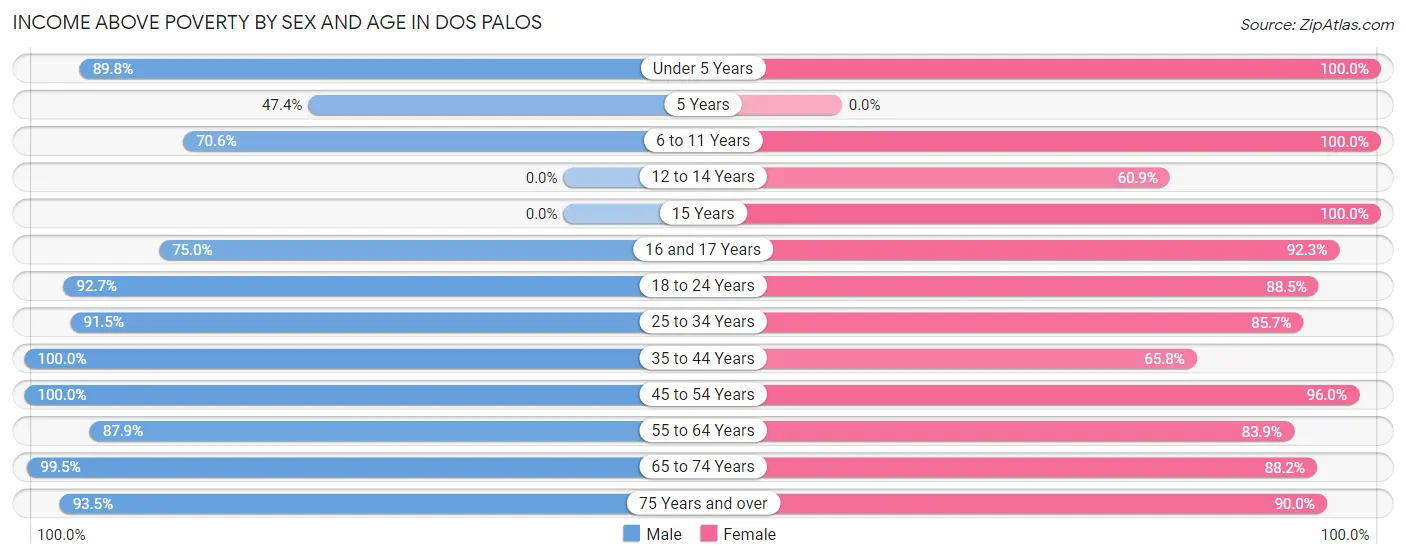
| Age Bracket | Male | Female |
| Under 5 Years | 184 (89.8%) | 199 (100.0%) |
| 5 Years | 18 (47.4%) | 0 (0.0%) |
| 6 to 11 Years | 103 (70.6%) | 234 (100.0%) |
| 12 to 14 Years | 0 (0.0%) | 70 (60.9%) |
| 15 Years | 0 (0.0%) | 19 (100.0%) |
| 16 and 17 Years | 51 (75.0%) | 227 (92.3%) |
| 18 to 24 Years | 166 (92.7%) | 407 (88.5%) |
| 25 to 34 Years | 397 (91.5%) | 215 (85.7%) |
| 35 to 44 Years | 186 (100.0%) | 291 (65.8%) |
| 45 to 54 Years | 295 (100.0%) | 380 (96.0%) |
| 55 to 64 Years | 377 (87.9%) | 198 (83.9%) |
| 65 to 74 Years | 388 (99.5%) | 380 (88.2%) |
| 75 Years and over | 186 (93.5%) | 99 (90.0%) |
| Total | 2,351 (90.9%) | 2,719 (86.6%) |
Income Below Poverty Among Married-Couple Families in Dos Palos
The poverty statistics for married-couple families in Dos Palos show that 1.3% or 13 of the total 989 families live below the poverty line. Families with no children have the highest poverty rate of 2.0%, comprising of 13 families. On the other hand, families with 1 or 2 children have the lowest poverty rate of 0.0%, which includes 0 families.
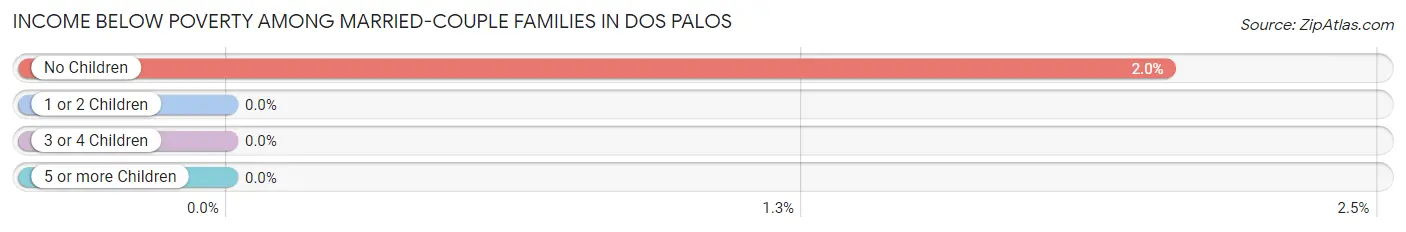
| Children | Above Poverty | Below Poverty |
| No Children | 624 (98.0%) | 13 (2.0%) |
| 1 or 2 Children | 234 (100.0%) | 0 (0.0%) |
| 3 or 4 Children | 118 (100.0%) | 0 (0.0%) |
| 5 or more Children | 0 (0.0%) | 0 (0.0%) |
| Total | 976 (98.7%) | 13 (1.3%) |
Income Below Poverty Among Single-Parent Households in Dos Palos
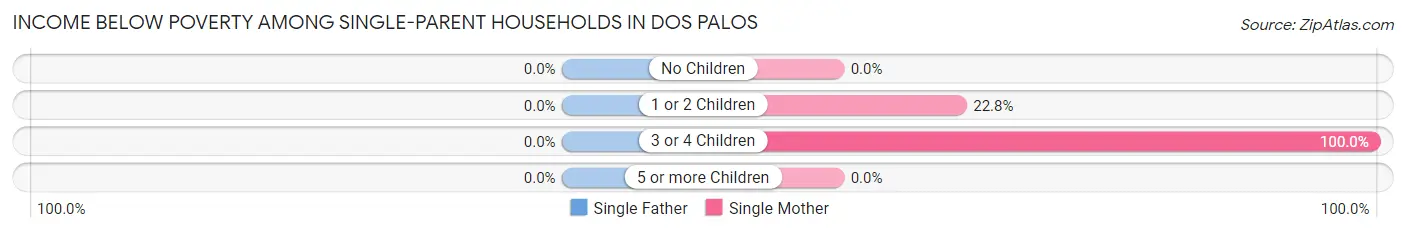
| Children | Single Father | Single Mother |
| No Children | 0 (0.0%) | 0 (0.0%) |
| 1 or 2 Children | 0 (0.0%) | 45 (22.8%) |
| 3 or 4 Children | 0 (0.0%) | 30 (100.0%) |
| 5 or more Children | 0 (0.0%) | 0 (0.0%) |
| Total | 0 (0.0%) | 75 (23.8%) |
Income Below Poverty Among Married-Couple vs Single-Parent Households in Dos Palos
The poverty data for Dos Palos shows that 13 of the married-couple family households (1.3%) and 75 of the single-parent households (17.0%) are living below the poverty level. Within the married-couple family households, those with no children have the highest poverty rate, with 13 households (2.0%) falling below the poverty line. Among the single-parent households, those with 3 or 4 children have the highest poverty rate, with 30 household (60.0%) living below poverty.
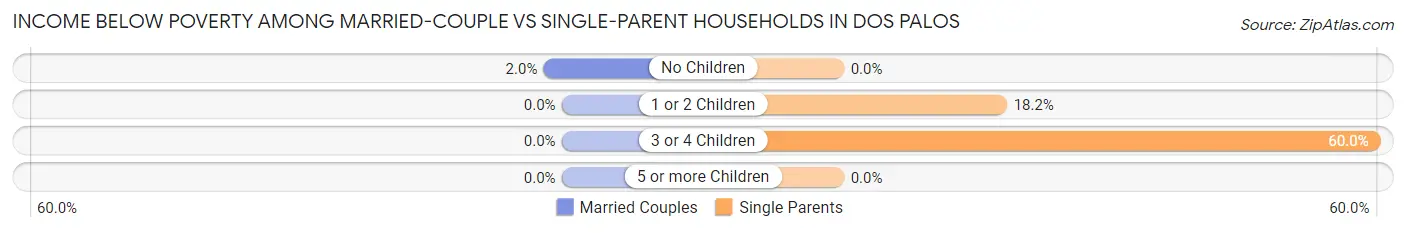
| Children | Married-Couple Families | Single-Parent Households |
| No Children | 13 (2.0%) | 0 (0.0%) |
| 1 or 2 Children | 0 (0.0%) | 45 (18.2%) |
| 3 or 4 Children | 0 (0.0%) | 30 (60.0%) |
| 5 or more Children | 0 (0.0%) | 0 (0.0%) |
| Total | 13 (1.3%) | 75 (17.0%) |
Race in Dos Palos
The most populous races in Dos Palos are Hispanic or Latino (4,381 | 76.1%), White / Caucasian (3,111 | 54.1%), and Some other Race (1,511 | 26.3%).
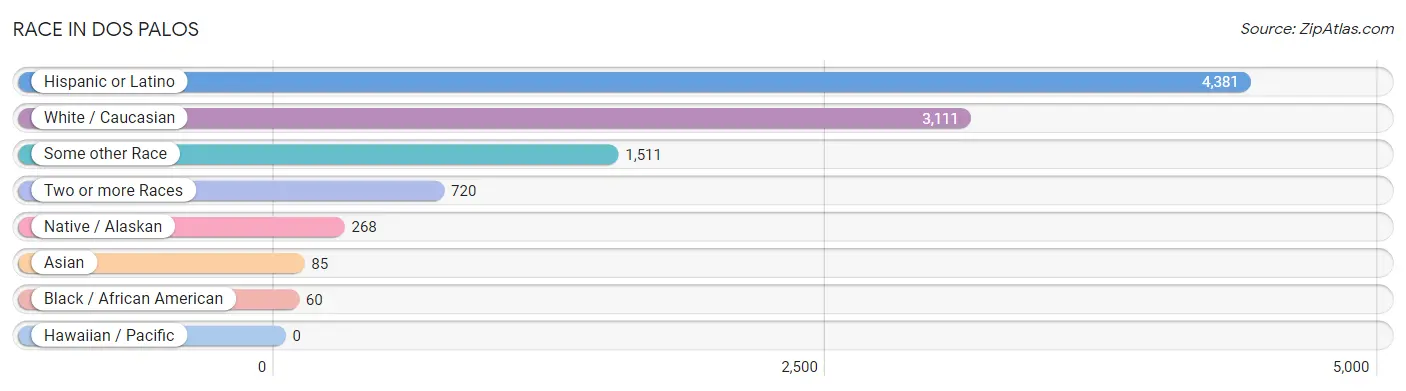
| Race | # Population | % Population |
| Asian | 85 | 1.5% |
| Black / African American | 60 | 1.0% |
| Hawaiian / Pacific | 0 | 0.0% |
| Hispanic or Latino | 4,381 | 76.1% |
| Native / Alaskan | 268 | 4.7% |
| White / Caucasian | 3,111 | 54.1% |
| Two or more Races | 720 | 12.5% |
| Some other Race | 1,511 | 26.3% |
| Total | 5,755 | 100.0% |
Ancestry in Dos Palos
The most populous ancestries reported in Dos Palos are Mexican (4,054 | 70.4%), Portuguese (260 | 4.5%), English (239 | 4.2%), Irish (227 | 3.9%), and European (165 | 2.9%), together accounting for 85.9% of all Dos Palos residents.
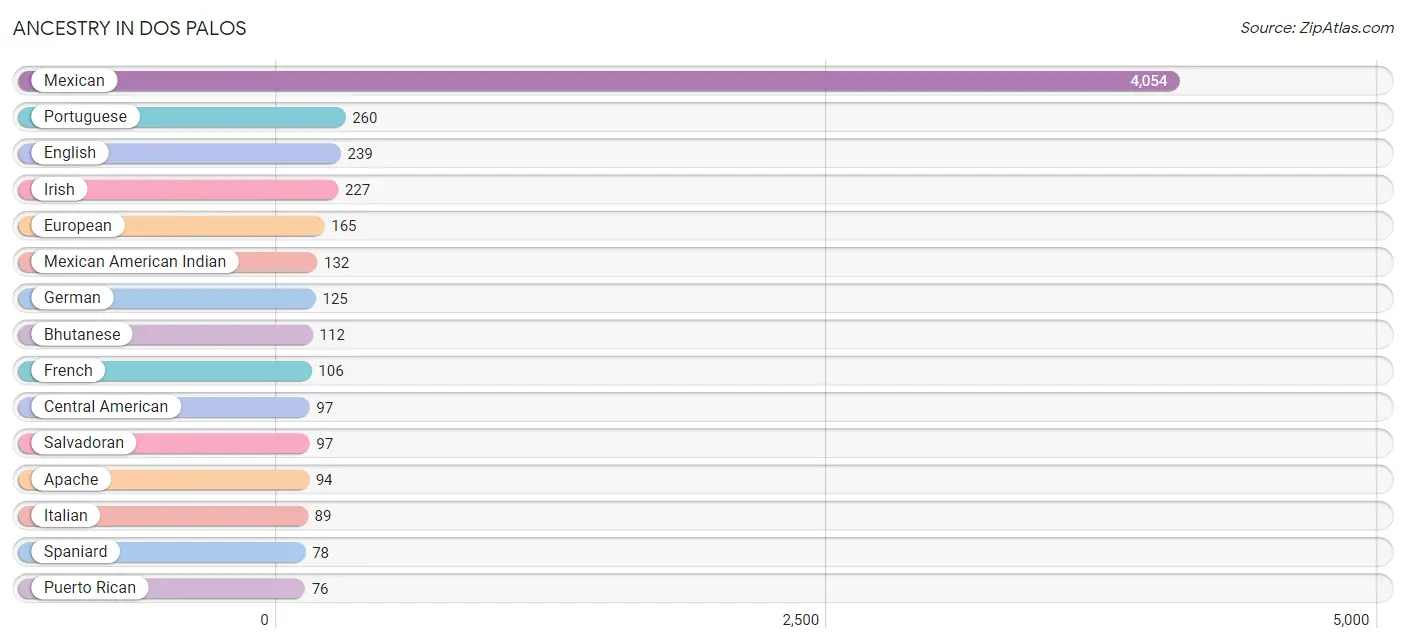
| Ancestry | # Population | % Population |
| African | 14 | 0.2% |
| American | 10 | 0.2% |
| Apache | 94 | 1.6% |
| Argentinean | 64 | 1.1% |
| Austrian | 12 | 0.2% |
| Bhutanese | 112 | 1.9% |
| Central American | 97 | 1.7% |
| Cherokee | 5 | 0.1% |
| Croatian | 10 | 0.2% |
| Dutch | 27 | 0.5% |
| English | 239 | 4.2% |
| European | 165 | 2.9% |
| Filipino | 14 | 0.2% |
| French | 106 | 1.8% |
| German | 125 | 2.2% |
| Irish | 227 | 3.9% |
| Italian | 89 | 1.5% |
| Mexican | 4,054 | 70.4% |
| Mexican American Indian | 132 | 2.3% |
| Norwegian | 8 | 0.1% |
| Portuguese | 260 | 4.5% |
| Puerto Rican | 76 | 1.3% |
| Salvadoran | 97 | 1.7% |
| South American | 64 | 1.1% |
| Spaniard | 78 | 1.4% |
| Subsaharan African | 14 | 0.2% |
| Thai | 56 | 1.0% | View All 27 Rows |
Immigrants in Dos Palos
The most numerous immigrant groups reported in Dos Palos came from Latin America (1,949 | 33.9%), Central America (1,885 | 32.8%), Mexico (1,838 | 31.9%), Europe (137 | 2.4%), and Portugal (137 | 2.4%), together accounting for 103.3% of all Dos Palos residents.
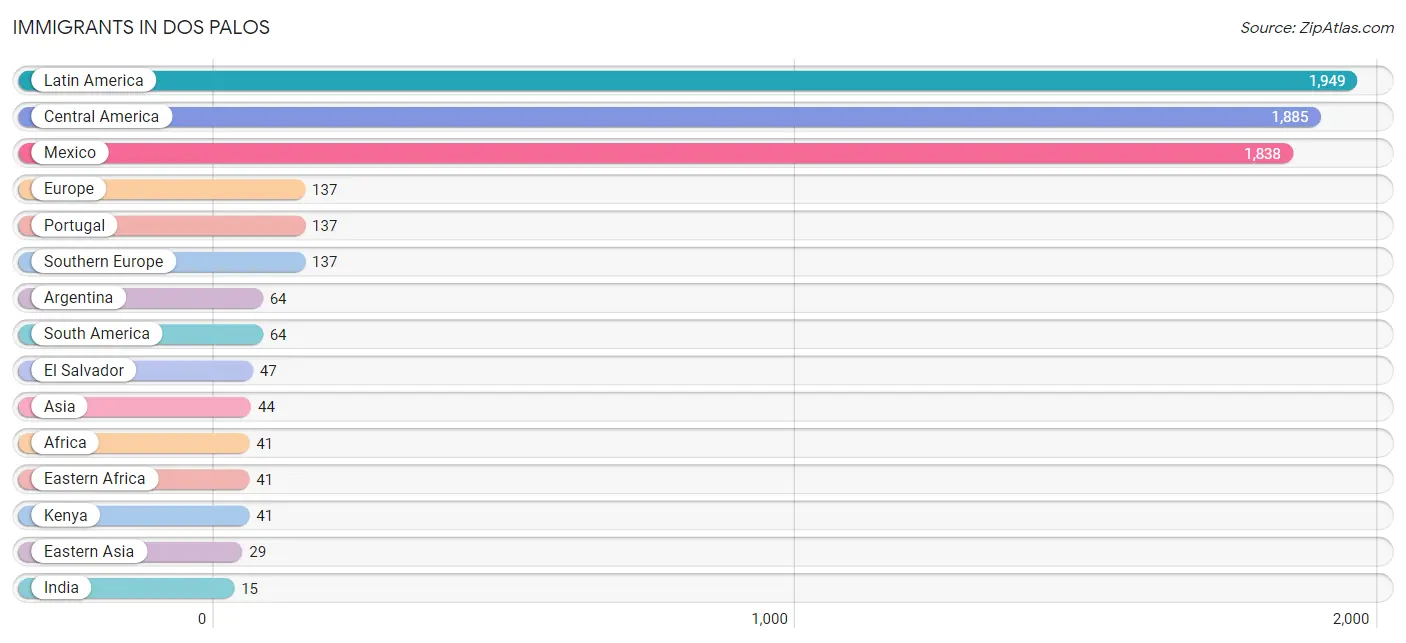
| Immigration Origin | # Population | % Population |
| Africa | 41 | 0.7% |
| Argentina | 64 | 1.1% |
| Asia | 44 | 0.8% |
| Central America | 1,885 | 32.8% |
| China | 14 | 0.2% |
| Eastern Africa | 41 | 0.7% |
| Eastern Asia | 29 | 0.5% |
| El Salvador | 47 | 0.8% |
| Europe | 137 | 2.4% |
| India | 15 | 0.3% |
| Japan | 15 | 0.3% |
| Kenya | 41 | 0.7% |
| Latin America | 1,949 | 33.9% |
| Mexico | 1,838 | 31.9% |
| Portugal | 137 | 2.4% |
| South America | 64 | 1.1% |
| South Central Asia | 15 | 0.3% |
| Southern Europe | 137 | 2.4% |
| Taiwan | 14 | 0.2% | View All 19 Rows |
Sex and Age in Dos Palos
Sex and Age in Dos Palos
The most populous age groups in Dos Palos are 55 to 59 Years (306 | 11.8%) for men and 15 to 19 Years (388 | 12.3%) for women.
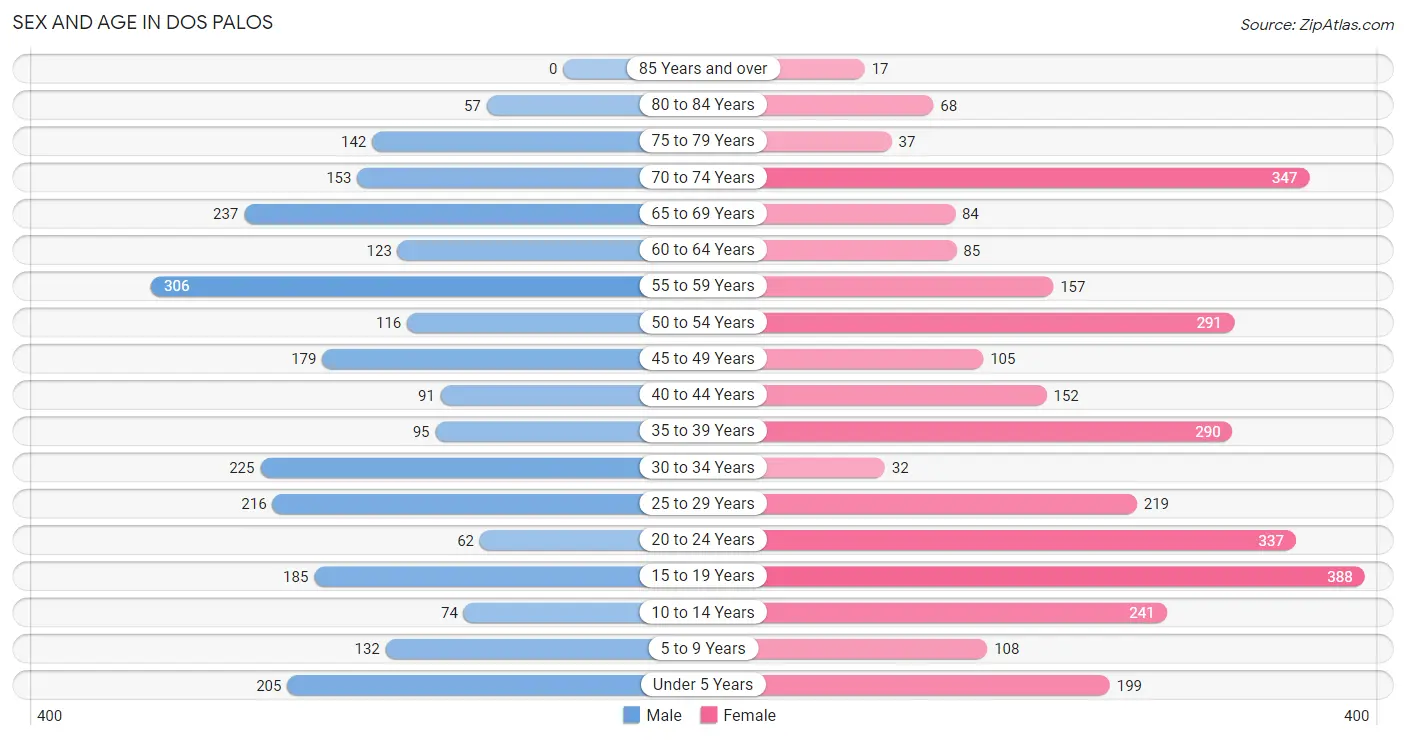
| Age Bracket | Male | Female |
| Under 5 Years | 205 (7.9%) | 199 (6.3%) |
| 5 to 9 Years | 132 (5.1%) | 108 (3.4%) |
| 10 to 14 Years | 74 (2.9%) | 241 (7.6%) |
| 15 to 19 Years | 185 (7.1%) | 388 (12.3%) |
| 20 to 24 Years | 62 (2.4%) | 337 (10.7%) |
| 25 to 29 Years | 216 (8.3%) | 219 (6.9%) |
| 30 to 34 Years | 225 (8.7%) | 32 (1.0%) |
| 35 to 39 Years | 95 (3.7%) | 290 (9.2%) |
| 40 to 44 Years | 91 (3.5%) | 152 (4.8%) |
| 45 to 49 Years | 179 (6.9%) | 105 (3.3%) |
| 50 to 54 Years | 116 (4.5%) | 291 (9.2%) |
| 55 to 59 Years | 306 (11.8%) | 157 (5.0%) |
| 60 to 64 Years | 123 (4.7%) | 85 (2.7%) |
| 65 to 69 Years | 237 (9.1%) | 84 (2.7%) |
| 70 to 74 Years | 153 (5.9%) | 347 (11.0%) |
| 75 to 79 Years | 142 (5.5%) | 37 (1.2%) |
| 80 to 84 Years | 57 (2.2%) | 68 (2.1%) |
| 85 Years and over | 0 (0.0%) | 17 (0.5%) |
| Total | 2,598 (100.0%) | 3,157 (100.0%) |
Families and Households in Dos Palos
Median Family Size in Dos Palos
The median family size in Dos Palos is 3.64 persons per family, with married-couple families (989 | 69.1%) accounting for the largest median family size of 3.75 persons per family. On the other hand, single male/father families (127 | 8.9%) represent the smallest median family size with 3.13 persons per family.
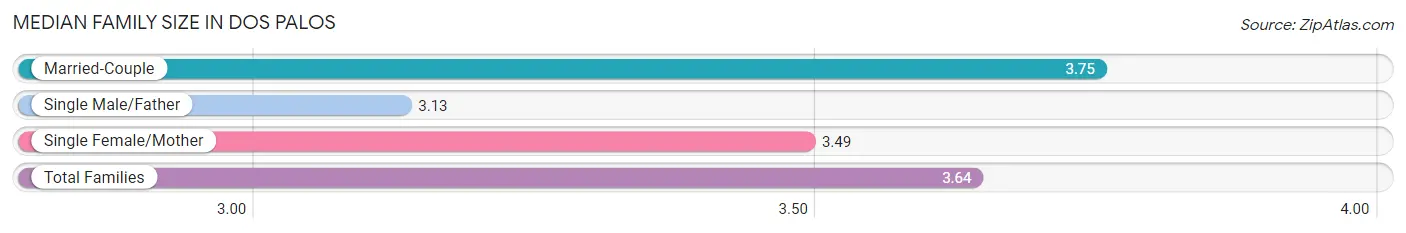
| Family Type | # Families | Family Size |
| Married-Couple | 989 (69.1%) | 3.75 |
| Single Male/Father | 127 (8.9%) | 3.13 |
| Single Female/Mother | 315 (22.0%) | 3.49 |
| Total Families | 1,431 (100.0%) | 3.64 |
Median Household Size in Dos Palos
The median household size in Dos Palos is 3.19 persons per household, with married-couple households (989 | 55.0%) accounting for the largest median household size of 3.75 persons per household. non-family households (367 | 20.4%) represent the smallest median household size with 1.16 persons per household.
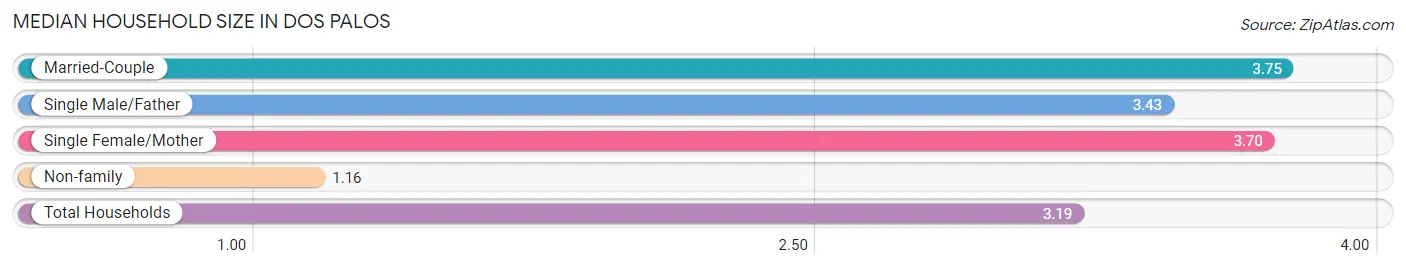
| Household Type | # Households | Household Size |
| Married-Couple | 989 (55.0%) | 3.75 |
| Single Male/Father | 127 (7.1%) | 3.43 |
| Single Female/Mother | 315 (17.5%) | 3.70 |
| Non-family | 367 (20.4%) | 1.16 |
| Total Households | 1,798 (100.0%) | 3.19 |
Household Size by Marriage Status in Dos Palos
Out of a total of 1,798 households in Dos Palos, 1,431 (79.6%) are family households, while 367 (20.4%) are nonfamily households. The most numerous type of family households are 2-person households, comprising 554, and the most common type of nonfamily households are 1-person households, comprising 330.
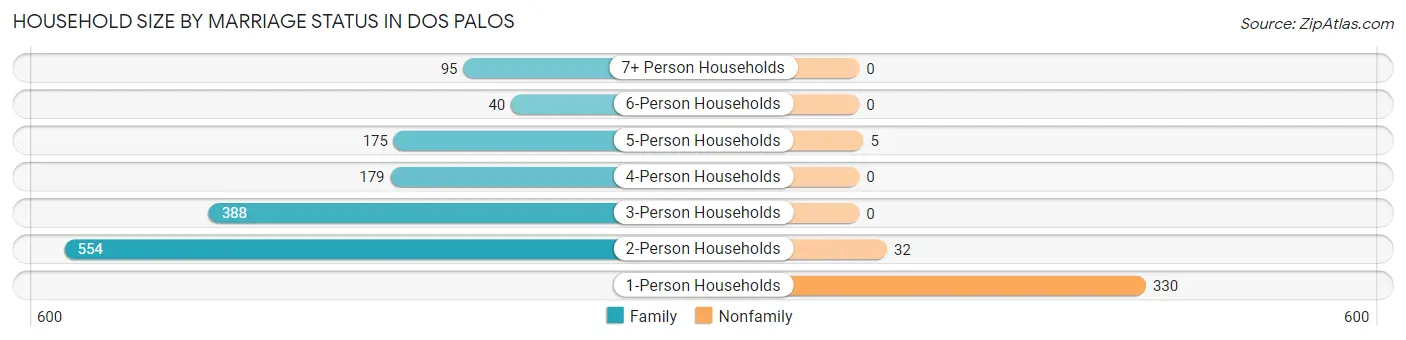
| Household Size | Family Households | Nonfamily Households |
| 1-Person Households | - | 330 (18.3%) |
| 2-Person Households | 554 (30.8%) | 32 (1.8%) |
| 3-Person Households | 388 (21.6%) | 0 (0.0%) |
| 4-Person Households | 179 (10.0%) | 0 (0.0%) |
| 5-Person Households | 175 (9.7%) | 5 (0.3%) |
| 6-Person Households | 40 (2.2%) | 0 (0.0%) |
| 7+ Person Households | 95 (5.3%) | 0 (0.0%) |
| Total | 1,431 (79.6%) | 367 (20.4%) |
Female Fertility in Dos Palos
Fertility by Age in Dos Palos
Average fertility rate in Dos Palos is 90.0 births per 1,000 women. Women in the age bracket of 35 to 50 years have the highest fertility rate with 148.0 births per 1,000 women. Women in the age bracket of 35 to 50 years acount for 59.1% of all women with births.
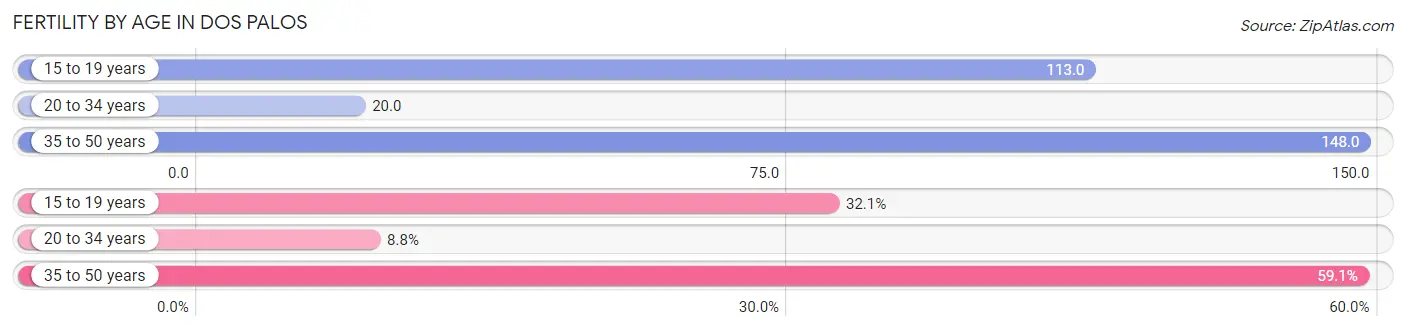
| Age Bracket | Women with Births | Births / 1,000 Women |
| 15 to 19 years | 44 (32.1%) | 113.0 |
| 20 to 34 years | 12 (8.8%) | 20.0 |
| 35 to 50 years | 81 (59.1%) | 148.0 |
| Total | 137 (100.0%) | 90.0 |
Fertility by Age by Marriage Status in Dos Palos
67.9% of women with births (137) in Dos Palos are married. The highest percentage of unmarried women with births falls into 15 to 19 years age bracket with 100.0% of them unmarried at the time of birth, while the lowest percentage of unmarried women with births belong to 20 to 34 years age bracket with 0.0% of them unmarried.
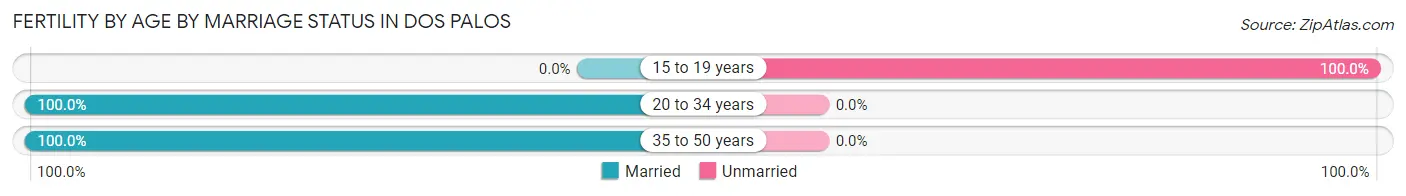
| Age Bracket | Married | Unmarried |
| 15 to 19 years | 0 (0.0%) | 44 (100.0%) |
| 20 to 34 years | 12 (100.0%) | 0 (0.0%) |
| 35 to 50 years | 81 (100.0%) | 0 (0.0%) |
| Total | 93 (67.9%) | 44 (32.1%) |
Fertility by Education in Dos Palos
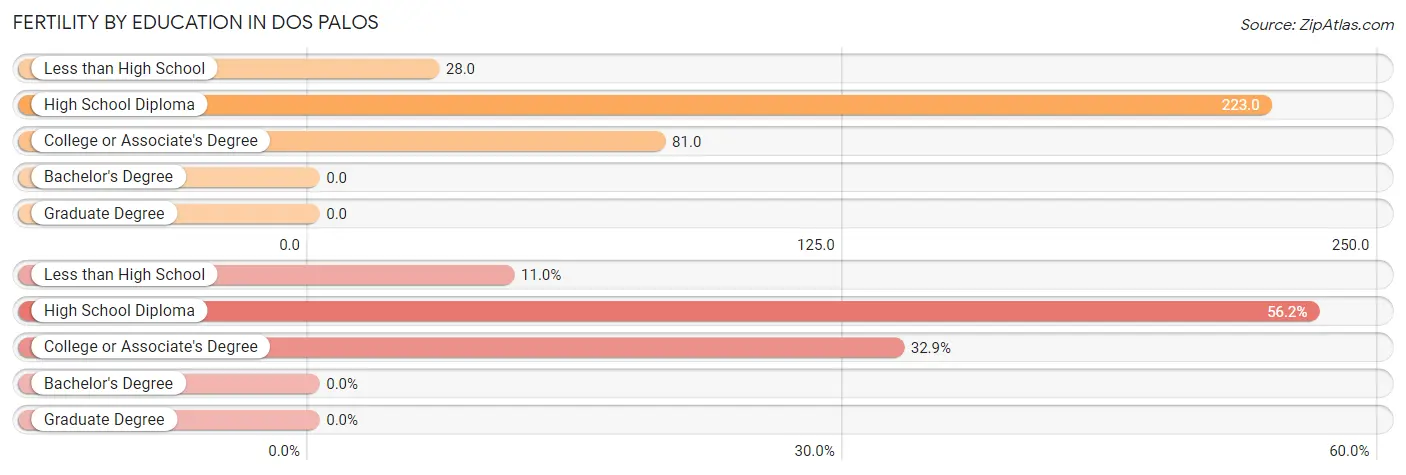
| Educational Attainment | Women with Births | Births / 1,000 Women |
| Less than High School | 15 (11.0%) | 28.0 |
| High School Diploma | 77 (56.2%) | 223.0 |
| College or Associate's Degree | 45 (32.9%) | 81.0 |
| Bachelor's Degree | 0 (0.0%) | 0.0 |
| Graduate Degree | 0 (0.0%) | 0.0 |
| Total | 137 (100.0%) | 90.0 |
Fertility by Education by Marriage Status in Dos Palos
32.1% of women with births in Dos Palos are unmarried. Women with the educational attainment of college or associate's degree are most likely to be married with 100.0% of them married at childbirth, while women with the educational attainment of less than high school are least likely to be married with 100.0% of them unmarried at childbirth.
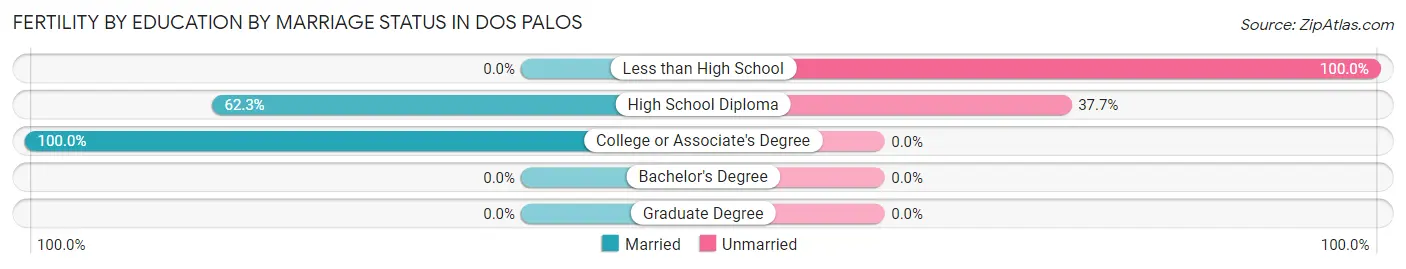
| Educational Attainment | Married | Unmarried |
| Less than High School | 0 (0.0%) | 15 (100.0%) |
| High School Diploma | 48 (62.3%) | 29 (37.7%) |
| College or Associate's Degree | 45 (100.0%) | 0 (0.0%) |
| Bachelor's Degree | 0 (0.0%) | 0 (0.0%) |
| Graduate Degree | 0 (0.0%) | 0 (0.0%) |
| Total | 93 (67.9%) | 44 (32.1%) |
Employment Characteristics in Dos Palos
Employment by Class of Employer in Dos Palos
Among the 2,021 employed individuals in Dos Palos, private company employees (1,472 | 72.8%), local government employees (241 | 11.9%), and self-employed (not incorporated) (122 | 6.0%) make up the most common classes of employment.
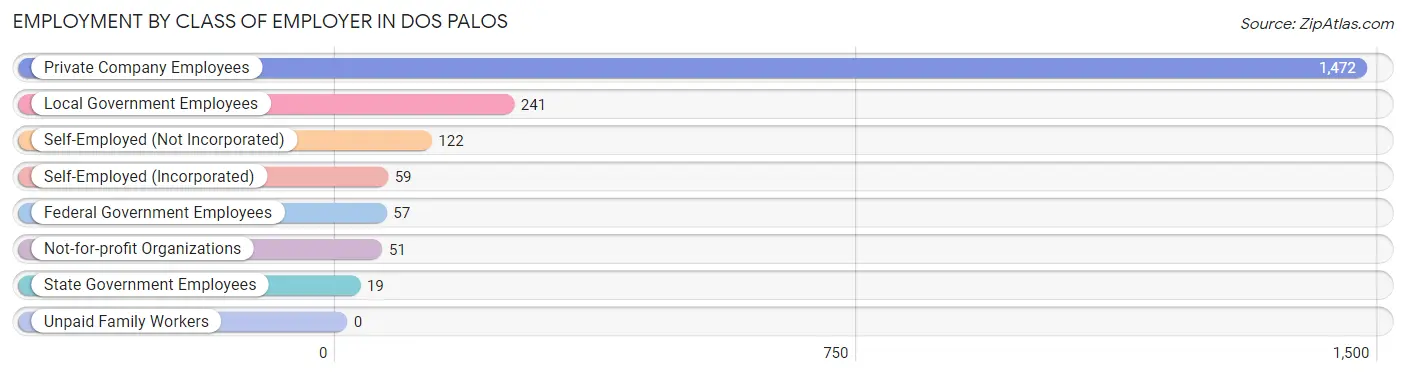
| Employer Class | # Employees | % Employees |
| Private Company Employees | 1,472 | 72.8% |
| Self-Employed (Incorporated) | 59 | 2.9% |
| Self-Employed (Not Incorporated) | 122 | 6.0% |
| Not-for-profit Organizations | 51 | 2.5% |
| Local Government Employees | 241 | 11.9% |
| State Government Employees | 19 | 0.9% |
| Federal Government Employees | 57 | 2.8% |
| Unpaid Family Workers | 0 | 0.0% |
| Total | 2,021 | 100.0% |
Employment Status by Age in Dos Palos
According to the labor force statistics for Dos Palos, out of the total population over 16 years of age (4,777), 52.0% or 2,484 individuals are in the labor force, with 12.8% or 318 of them unemployed. The age group with the highest labor force participation rate is 30 to 34 years, with 100.0% or 257 individuals in the labor force. Within the labor force, the 25 to 29 years age range has the highest percentage of unemployed individuals, with 48.2% or 171 of them being unemployed.
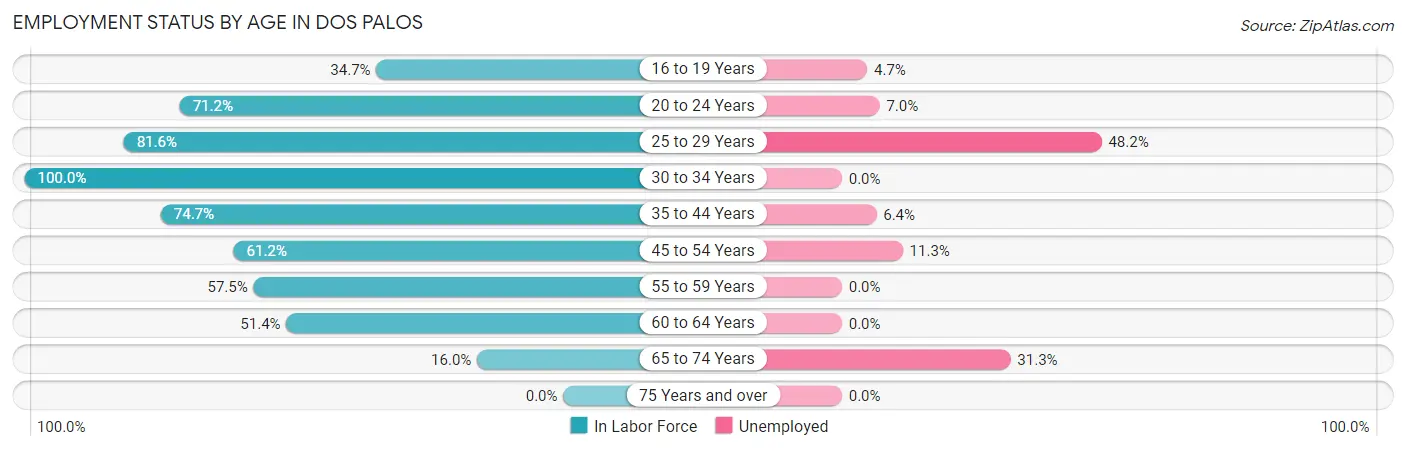
| Age Bracket | In Labor Force | Unemployed |
| 16 to 19 Years | 192 (34.7%) | 9 (4.7%) |
| 20 to 24 Years | 284 (71.2%) | 20 (7.0%) |
| 25 to 29 Years | 355 (81.6%) | 171 (48.2%) |
| 30 to 34 Years | 257 (100.0%) | 0 (0.0%) |
| 35 to 44 Years | 469 (74.7%) | 30 (6.4%) |
| 45 to 54 Years | 423 (61.2%) | 48 (11.3%) |
| 55 to 59 Years | 266 (57.5%) | 0 (0.0%) |
| 60 to 64 Years | 107 (51.4%) | 0 (0.0%) |
| 65 to 74 Years | 131 (16.0%) | 41 (31.3%) |
| 75 Years and over | 0 (0.0%) | 0 (0.0%) |
| Total | 2,484 (52.0%) | 318 (12.8%) |
Employment Status by Educational Attainment in Dos Palos
According to labor force statistics for Dos Palos, 70.0% of individuals (1,877) out of the total population between 25 and 64 years of age (2,682) are in the labor force, with 13.3% or 250 of them being unemployed. The group with the highest labor force participation rate are those with the educational attainment of high school diploma, with 78.4% or 617 individuals in the labor force. Within the labor force, individuals with high school diploma education have the highest percentage of unemployment, with 23.0% or 142 of them being unemployed.
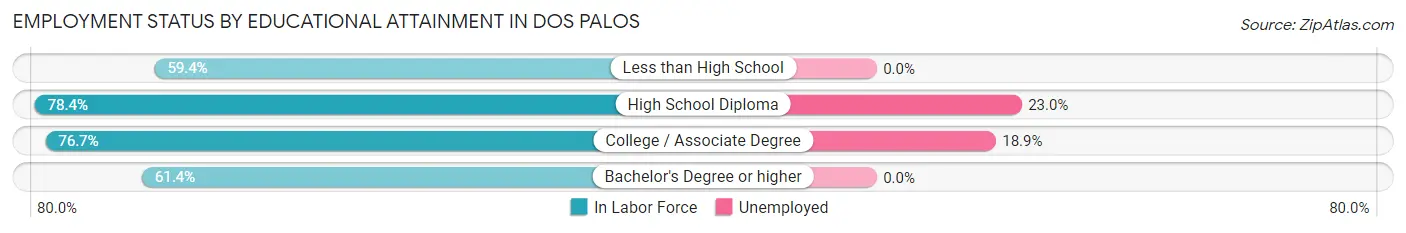
| Educational Attainment | In Labor Force | Unemployed |
| Less than High School | 498 (59.4%) | 0 (0.0%) |
| High School Diploma | 617 (78.4%) | 181 (23.0%) |
| College / Associate Degree | 566 (76.7%) | 139 (18.9%) |
| Bachelor's Degree or higher | 196 (61.4%) | 0 (0.0%) |
| Total | 1,877 (70.0%) | 357 (13.3%) |
Employment Occupations by Sex in Dos Palos
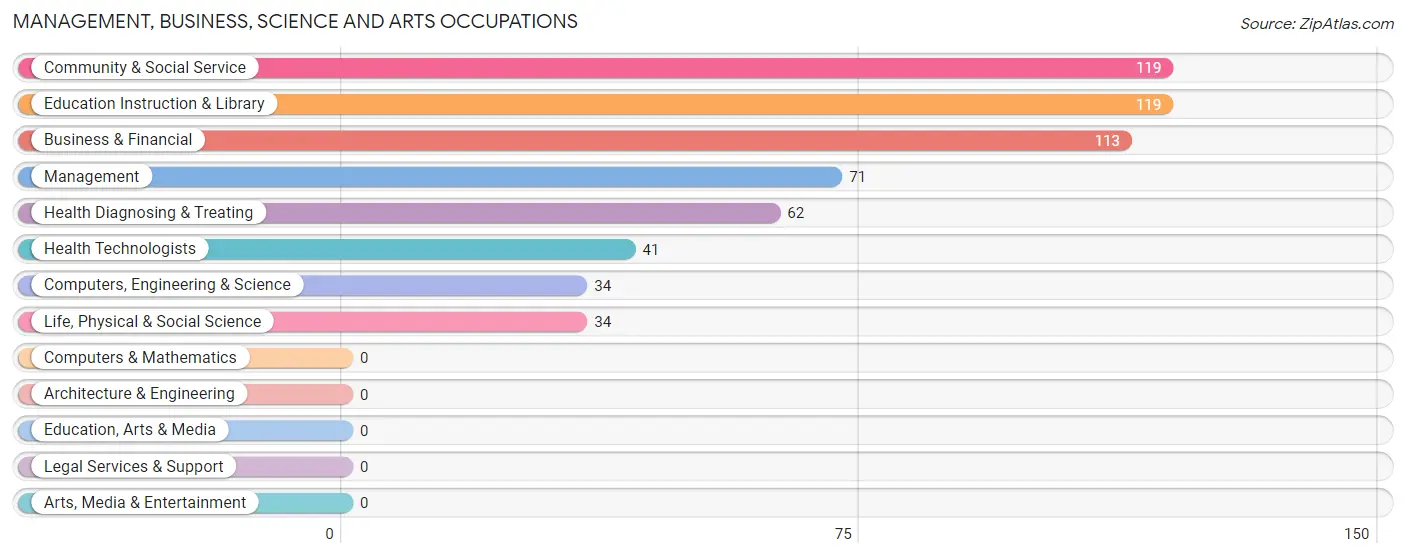
Management, Business, Science and Arts Occupations
The most common Management, Business, Science and Arts occupations in Dos Palos are Community & Social Service (119 | 5.5%), Education Instruction & Library (119 | 5.5%), Business & Financial (113 | 5.2%), Management (71 | 3.3%), and Health Diagnosing & Treating (62 | 2.9%).
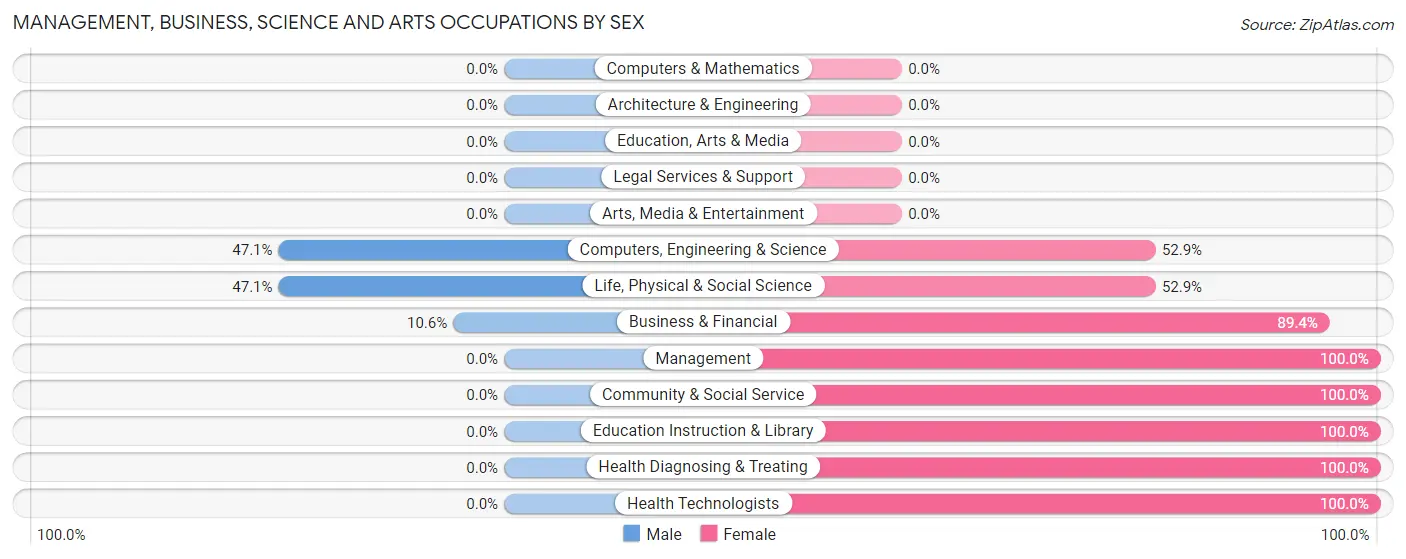
Management, Business, Science and Arts Occupations by Sex
Within the Management, Business, Science and Arts occupations in Dos Palos, the most male-oriented occupations are Computers, Engineering & Science (47.1%), Life, Physical & Social Science (47.1%), and Business & Financial (10.6%), while the most female-oriented occupations are Management (100.0%), Community & Social Service (100.0%), and Education Instruction & Library (100.0%).
| Occupation | Male | Female |
| Management | 0 (0.0%) | 71 (100.0%) |
| Business & Financial | 12 (10.6%) | 101 (89.4%) |
| Computers, Engineering & Science | 16 (47.1%) | 18 (52.9%) |
| Computers & Mathematics | 0 (0.0%) | 0 (0.0%) |
| Architecture & Engineering | 0 (0.0%) | 0 (0.0%) |
| Life, Physical & Social Science | 16 (47.1%) | 18 (52.9%) |
| Community & Social Service | 0 (0.0%) | 119 (100.0%) |
| Education, Arts & Media | 0 (0.0%) | 0 (0.0%) |
| Legal Services & Support | 0 (0.0%) | 0 (0.0%) |
| Education Instruction & Library | 0 (0.0%) | 119 (100.0%) |
| Arts, Media & Entertainment | 0 (0.0%) | 0 (0.0%) |
| Health Diagnosing & Treating | 0 (0.0%) | 62 (100.0%) |
| Health Technologists | 0 (0.0%) | 41 (100.0%) |
| Total (Category) | 28 (7.0%) | 371 (93.0%) |
| Total (Overall) | 1,106 (51.1%) | 1,059 (48.9%) |
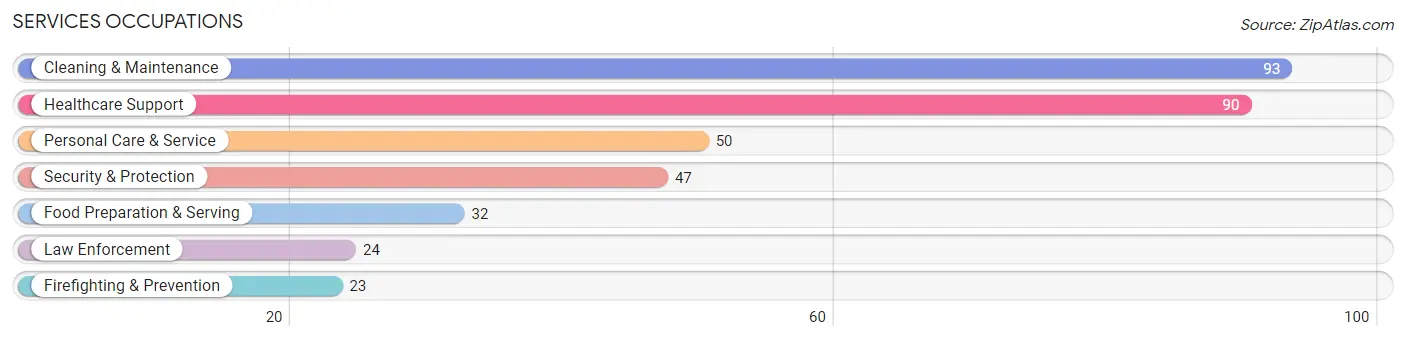
Services Occupations
The most common Services occupations in Dos Palos are Cleaning & Maintenance (93 | 4.3%), Healthcare Support (90 | 4.2%), Personal Care & Service (50 | 2.3%), Security & Protection (47 | 2.2%), and Food Preparation & Serving (32 | 1.5%).
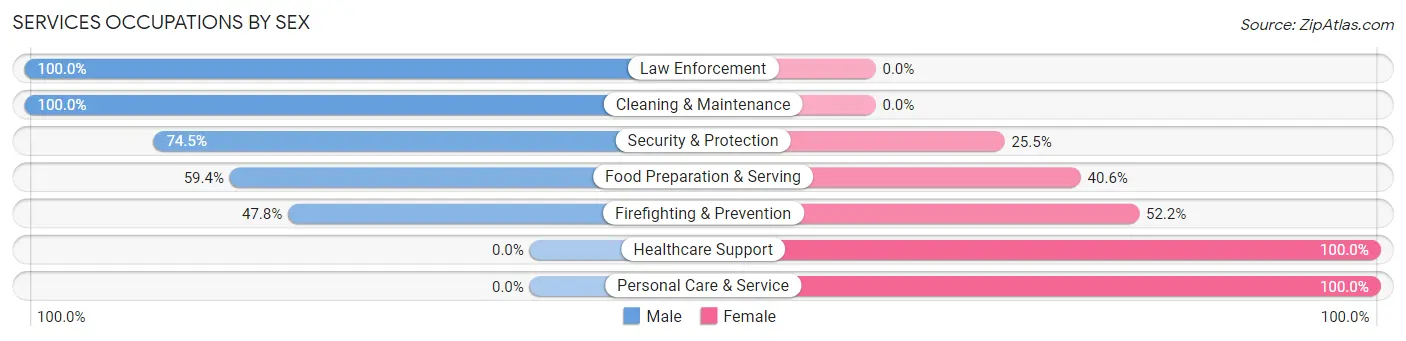
Services Occupations by Sex
Within the Services occupations in Dos Palos, the most male-oriented occupations are Law Enforcement (100.0%), Cleaning & Maintenance (100.0%), and Security & Protection (74.5%), while the most female-oriented occupations are Healthcare Support (100.0%), Personal Care & Service (100.0%), and Firefighting & Prevention (52.2%).
| Occupation | Male | Female |
| Healthcare Support | 0 (0.0%) | 90 (100.0%) |
| Security & Protection | 35 (74.5%) | 12 (25.5%) |
| Firefighting & Prevention | 11 (47.8%) | 12 (52.2%) |
| Law Enforcement | 24 (100.0%) | 0 (0.0%) |
| Food Preparation & Serving | 19 (59.4%) | 13 (40.6%) |
| Cleaning & Maintenance | 93 (100.0%) | 0 (0.0%) |
| Personal Care & Service | 0 (0.0%) | 50 (100.0%) |
| Total (Category) | 147 (47.1%) | 165 (52.9%) |
| Total (Overall) | 1,106 (51.1%) | 1,059 (48.9%) |
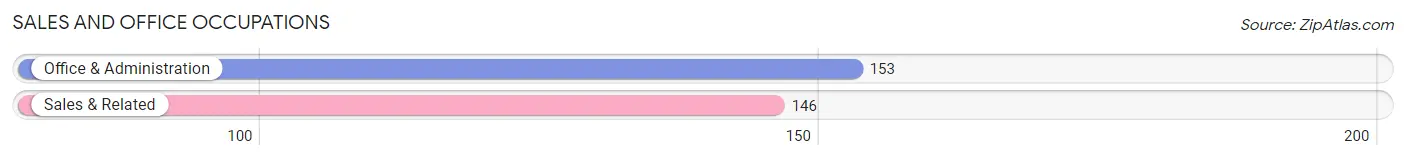
Sales and Office Occupations
The most common Sales and Office occupations in Dos Palos are Office & Administration (153 | 7.1%), and Sales & Related (146 | 6.7%).
Sales and Office Occupations by Sex
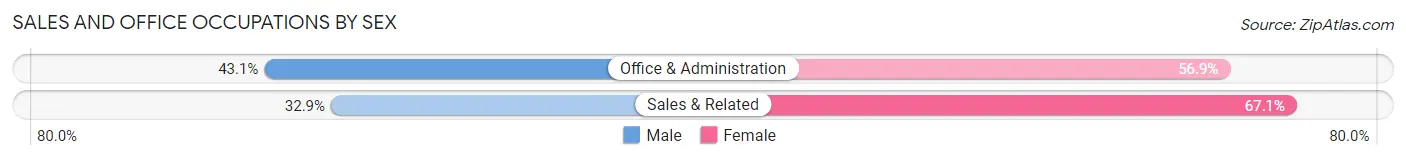
| Occupation | Male | Female |
| Sales & Related | 48 (32.9%) | 98 (67.1%) |
| Office & Administration | 66 (43.1%) | 87 (56.9%) |
| Total (Category) | 114 (38.1%) | 185 (61.9%) |
| Total (Overall) | 1,106 (51.1%) | 1,059 (48.9%) |
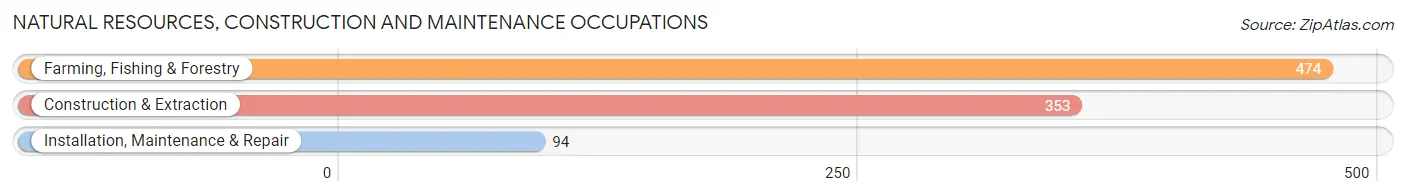
Natural Resources, Construction and Maintenance Occupations
The most common Natural Resources, Construction and Maintenance occupations in Dos Palos are Farming, Fishing & Forestry (474 | 21.9%), Construction & Extraction (353 | 16.3%), and Installation, Maintenance & Repair (94 | 4.3%).
Natural Resources, Construction and Maintenance Occupations by Sex
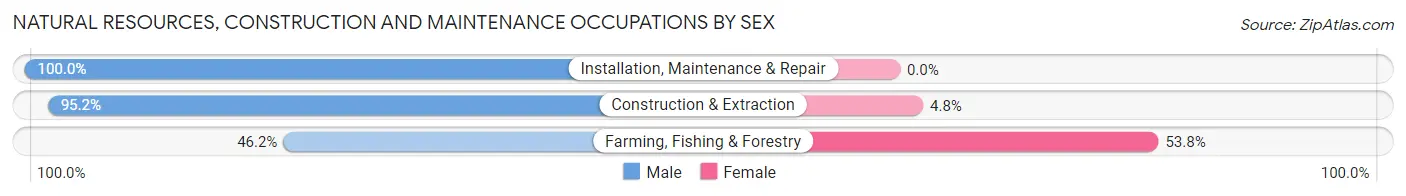
| Occupation | Male | Female |
| Farming, Fishing & Forestry | 219 (46.2%) | 255 (53.8%) |
| Construction & Extraction | 336 (95.2%) | 17 (4.8%) |
| Installation, Maintenance & Repair | 94 (100.0%) | 0 (0.0%) |
| Total (Category) | 649 (70.5%) | 272 (29.5%) |
| Total (Overall) | 1,106 (51.1%) | 1,059 (48.9%) |
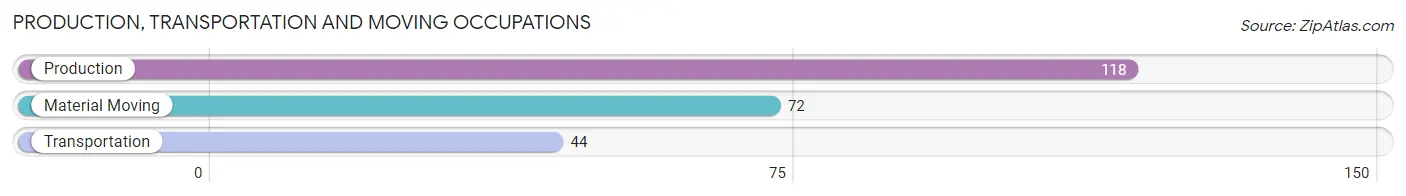
Production, Transportation and Moving Occupations
The most common Production, Transportation and Moving occupations in Dos Palos are Production (118 | 5.4%), Material Moving (72 | 3.3%), and Transportation (44 | 2.0%).
Production, Transportation and Moving Occupations by Sex
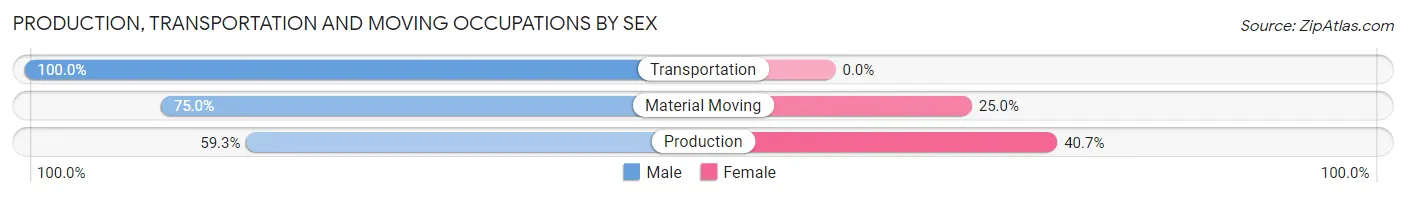
| Occupation | Male | Female |
| Production | 70 (59.3%) | 48 (40.7%) |
| Transportation | 44 (100.0%) | 0 (0.0%) |
| Material Moving | 54 (75.0%) | 18 (25.0%) |
| Total (Category) | 168 (71.8%) | 66 (28.2%) |
| Total (Overall) | 1,106 (51.1%) | 1,059 (48.9%) |
Employment Industries by Sex in Dos Palos
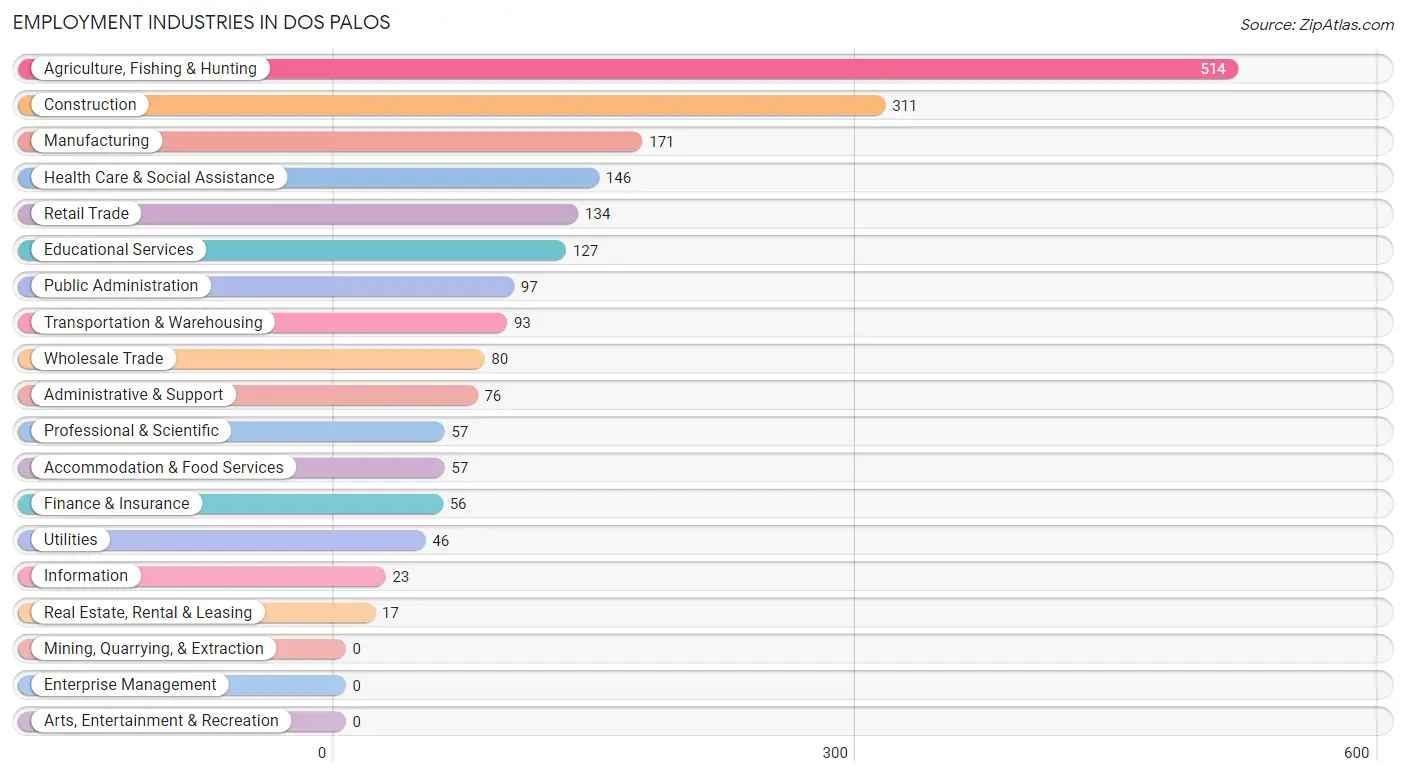
Employment Industries in Dos Palos
The major employment industries in Dos Palos include Agriculture, Fishing & Hunting (514 | 23.7%), Construction (311 | 14.4%), Manufacturing (171 | 7.9%), Health Care & Social Assistance (146 | 6.7%), and Retail Trade (134 | 6.2%).
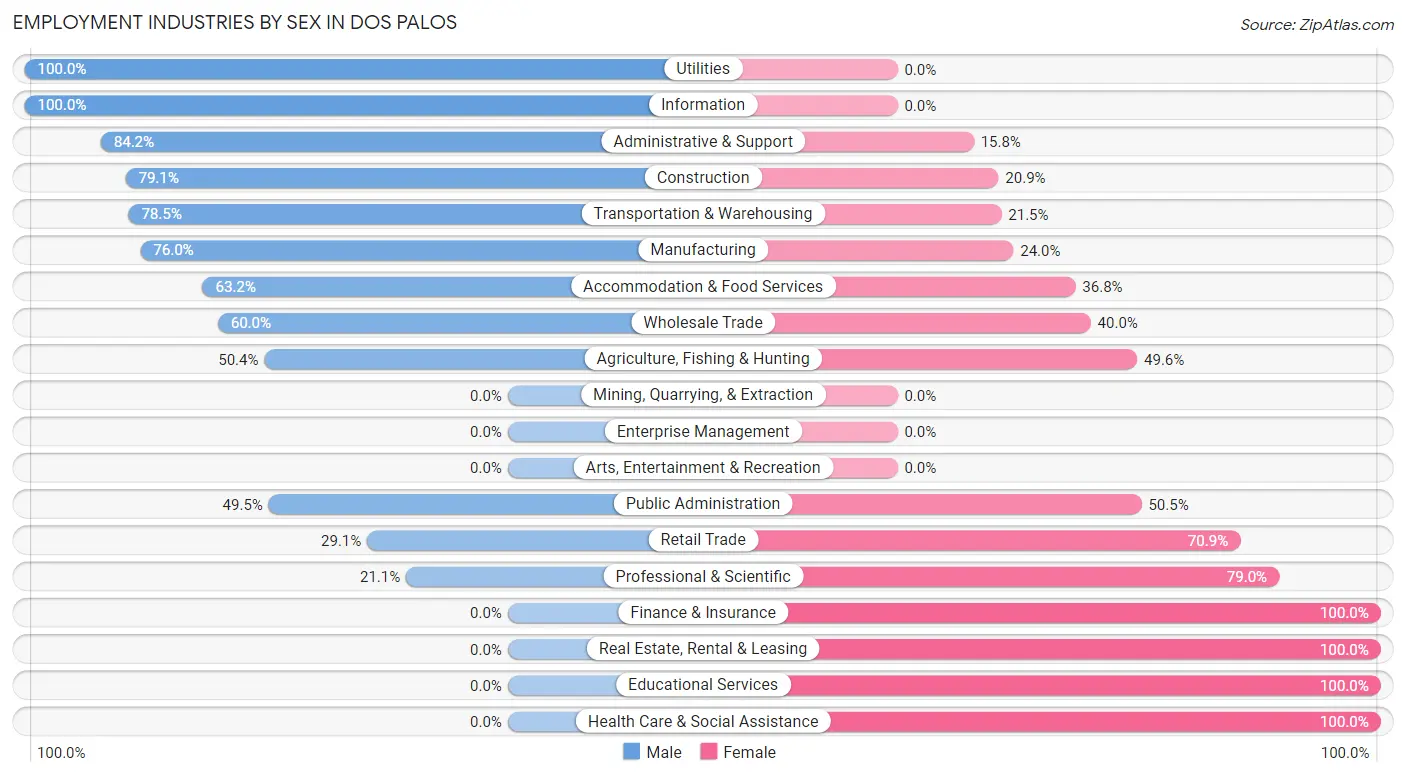
Employment Industries by Sex in Dos Palos
The Dos Palos industries that see more men than women are Utilities (100.0%), Information (100.0%), and Administrative & Support (84.2%), whereas the industries that tend to have a higher number of women are Finance & Insurance (100.0%), Real Estate, Rental & Leasing (100.0%), and Educational Services (100.0%).
| Industry | Male | Female |
| Agriculture, Fishing & Hunting | 259 (50.4%) | 255 (49.6%) |
| Mining, Quarrying, & Extraction | 0 (0.0%) | 0 (0.0%) |
| Construction | 246 (79.1%) | 65 (20.9%) |
| Manufacturing | 130 (76.0%) | 41 (24.0%) |
| Wholesale Trade | 48 (60.0%) | 32 (40.0%) |
| Retail Trade | 39 (29.1%) | 95 (70.9%) |
| Transportation & Warehousing | 73 (78.5%) | 20 (21.5%) |
| Utilities | 46 (100.0%) | 0 (0.0%) |
| Information | 23 (100.0%) | 0 (0.0%) |
| Finance & Insurance | 0 (0.0%) | 56 (100.0%) |
| Real Estate, Rental & Leasing | 0 (0.0%) | 17 (100.0%) |
| Professional & Scientific | 12 (21.0%) | 45 (78.9%) |
| Enterprise Management | 0 (0.0%) | 0 (0.0%) |
| Administrative & Support | 64 (84.2%) | 12 (15.8%) |
| Educational Services | 0 (0.0%) | 127 (100.0%) |
| Health Care & Social Assistance | 0 (0.0%) | 146 (100.0%) |
| Arts, Entertainment & Recreation | 0 (0.0%) | 0 (0.0%) |
| Accommodation & Food Services | 36 (63.2%) | 21 (36.8%) |
| Public Administration | 48 (49.5%) | 49 (50.5%) |
| Total | 1,106 (51.1%) | 1,059 (48.9%) |
Education in Dos Palos
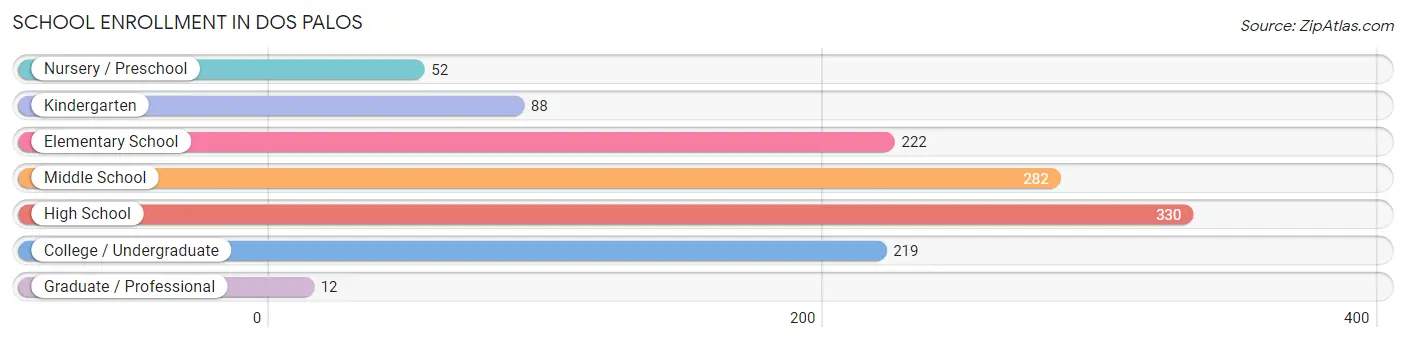
School Enrollment in Dos Palos
The most common levels of schooling among the 1,205 students in Dos Palos are high school (330 | 27.4%), middle school (282 | 23.4%), and elementary school (222 | 18.4%).
| School Level | # Students | % Students |
| Nursery / Preschool | 52 | 4.3% |
| Kindergarten | 88 | 7.3% |
| Elementary School | 222 | 18.4% |
| Middle School | 282 | 23.4% |
| High School | 330 | 27.4% |
| College / Undergraduate | 219 | 18.2% |
| Graduate / Professional | 12 | 1.0% |
| Total | 1,205 | 100.0% |
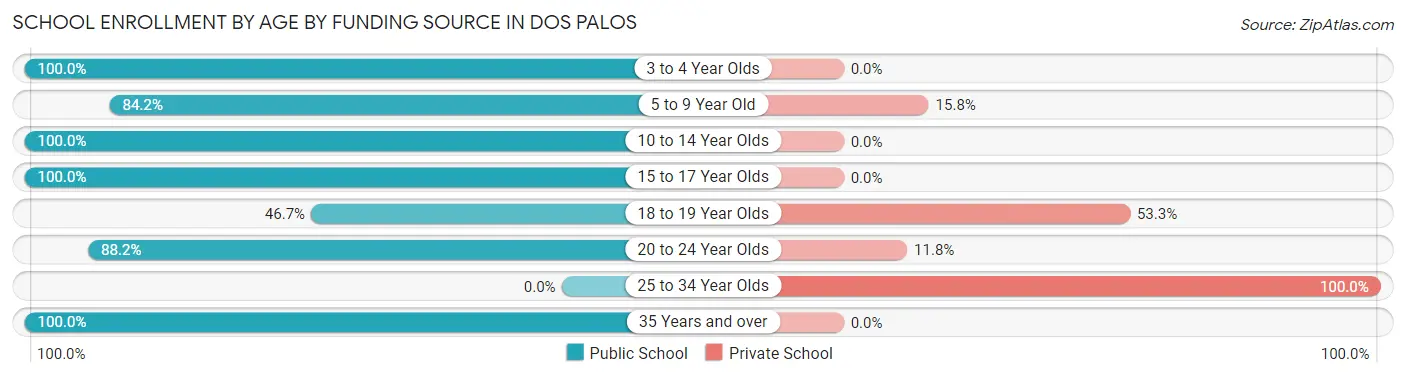
School Enrollment by Age by Funding Source in Dos Palos
Out of a total of 1,205 students who are enrolled in schools in Dos Palos, 96 (8.0%) attend a private institution, while the remaining 1,109 (92.0%) are enrolled in public schools. The age group of 25 to 34 year olds has the highest likelihood of being enrolled in private schools, with 14 (100.0% in the age bracket) enrolled. Conversely, the age group of 3 to 4 year olds has the lowest likelihood of being enrolled in a private school, with 102 (100.0% in the age bracket) attending a public institution.
| Age Bracket | Public School | Private School |
| 3 to 4 Year Olds | 102 (100.0%) | 0 (0.0%) |
| 5 to 9 Year Old | 202 (84.2%) | 38 (15.8%) |
| 10 to 14 Year Olds | 315 (100.0%) | 0 (0.0%) |
| 15 to 17 Year Olds | 308 (100.0%) | 0 (0.0%) |
| 18 to 19 Year Olds | 21 (46.7%) | 24 (53.3%) |
| 20 to 24 Year Olds | 149 (88.2%) | 20 (11.8%) |
| 25 to 34 Year Olds | 0 (0.0%) | 14 (100.0%) |
| 35 Years and over | 12 (100.0%) | 0 (0.0%) |
| Total | 1,109 (92.0%) | 96 (8.0%) |
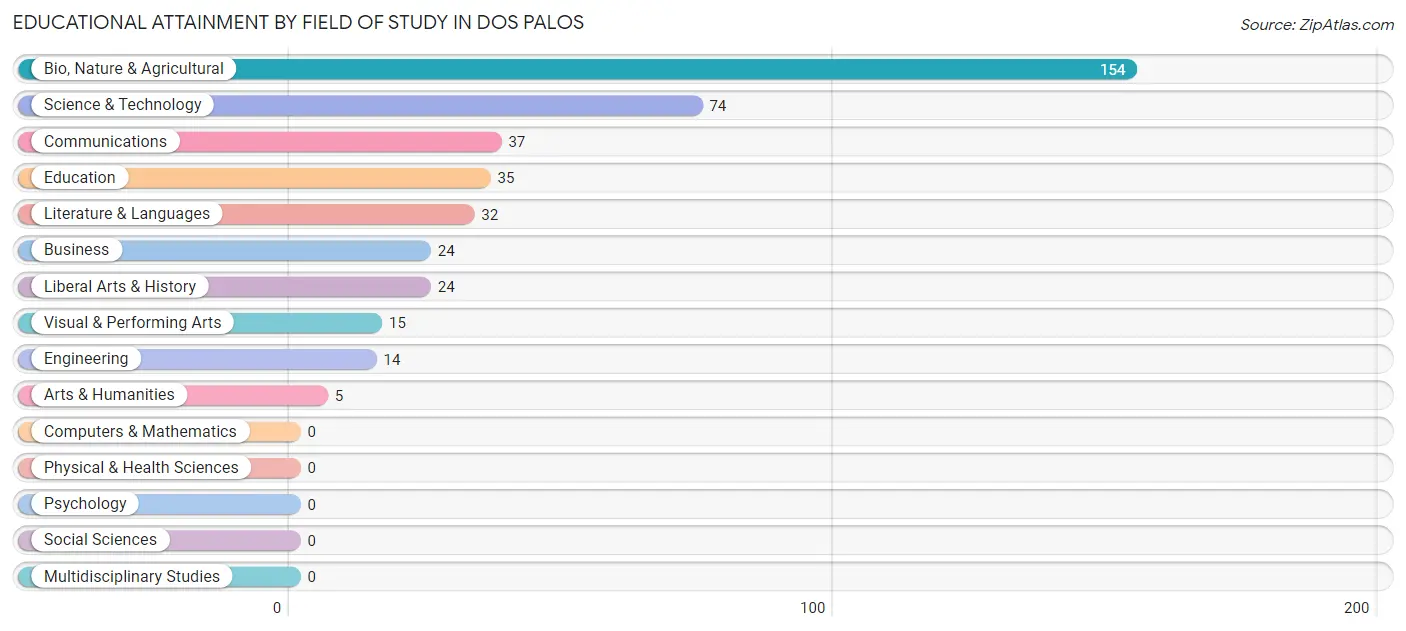
Educational Attainment by Field of Study in Dos Palos
Bio, nature & agricultural (154 | 37.2%), science & technology (74 | 17.9%), communications (37 | 8.9%), education (35 | 8.5%), and literature & languages (32 | 7.7%) are the most common fields of study among 414 individuals in Dos Palos who have obtained a bachelor's degree or higher.
| Field of Study | # Graduates | % Graduates |
| Computers & Mathematics | 0 | 0.0% |
| Bio, Nature & Agricultural | 154 | 37.2% |
| Physical & Health Sciences | 0 | 0.0% |
| Psychology | 0 | 0.0% |
| Social Sciences | 0 | 0.0% |
| Engineering | 14 | 3.4% |
| Multidisciplinary Studies | 0 | 0.0% |
| Science & Technology | 74 | 17.9% |
| Business | 24 | 5.8% |
| Education | 35 | 8.5% |
| Literature & Languages | 32 | 7.7% |
| Liberal Arts & History | 24 | 5.8% |
| Visual & Performing Arts | 15 | 3.6% |
| Communications | 37 | 8.9% |
| Arts & Humanities | 5 | 1.2% |
| Total | 414 | 100.0% |
Transportation & Commute in Dos Palos
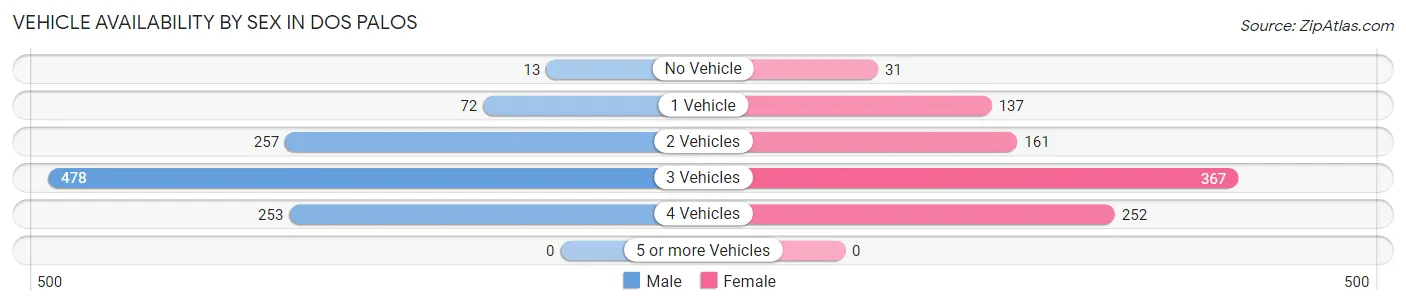
Vehicle Availability by Sex in Dos Palos
The most prevalent vehicle ownership categories in Dos Palos are males with 3 vehicles (478, accounting for 44.6%) and females with 3 vehicles (367, making up 50.4%).
| Vehicles Available | Male | Female |
| No Vehicle | 13 (1.2%) | 31 (3.3%) |
| 1 Vehicle | 72 (6.7%) | 137 (14.4%) |
| 2 Vehicles | 257 (23.9%) | 161 (17.0%) |
| 3 Vehicles | 478 (44.6%) | 367 (38.7%) |
| 4 Vehicles | 253 (23.6%) | 252 (26.6%) |
| 5 or more Vehicles | 0 (0.0%) | 0 (0.0%) |
| Total | 1,073 (100.0%) | 948 (100.0%) |
Commute Time in Dos Palos
The most frequently occuring commute durations in Dos Palos are 30 to 34 minutes (421 commuters, 21.6%), 20 to 24 minutes (330 commuters, 16.9%), and 15 to 19 minutes (274 commuters, 14.0%).
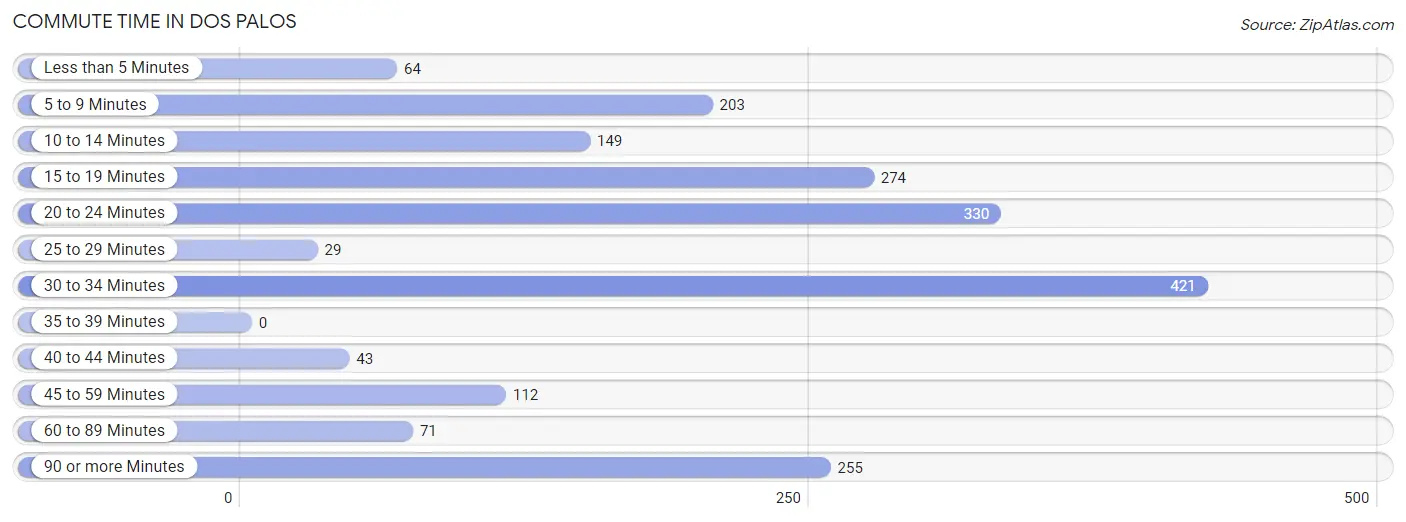
| Commute Time | # Commuters | % Commuters |
| Less than 5 Minutes | 64 | 3.3% |
| 5 to 9 Minutes | 203 | 10.4% |
| 10 to 14 Minutes | 149 | 7.6% |
| 15 to 19 Minutes | 274 | 14.0% |
| 20 to 24 Minutes | 330 | 16.9% |
| 25 to 29 Minutes | 29 | 1.5% |
| 30 to 34 Minutes | 421 | 21.6% |
| 35 to 39 Minutes | 0 | 0.0% |
| 40 to 44 Minutes | 43 | 2.2% |
| 45 to 59 Minutes | 112 | 5.7% |
| 60 to 89 Minutes | 71 | 3.6% |
| 90 or more Minutes | 255 | 13.1% |
Commute Time by Sex in Dos Palos
The most common commute times in Dos Palos are 90 or more minutes (255 commuters, 23.8%) for males and 30 to 34 minutes (350 commuters, 39.9%) for females.
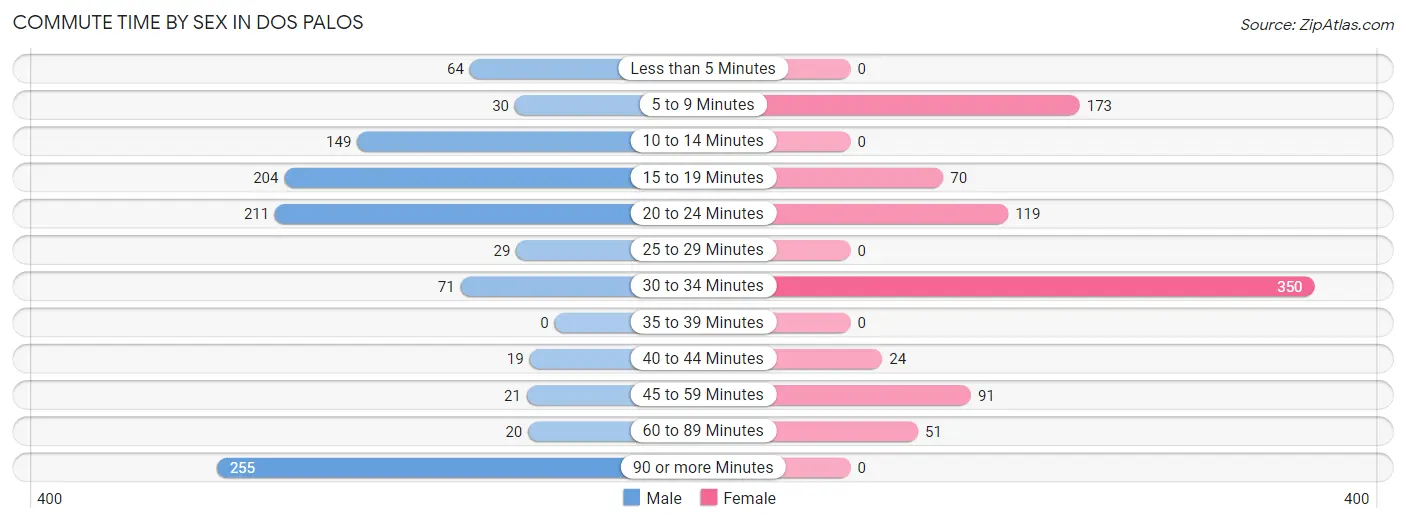
| Commute Time | Male | Female |
| Less than 5 Minutes | 64 (6.0%) | 0 (0.0%) |
| 5 to 9 Minutes | 30 (2.8%) | 173 (19.7%) |
| 10 to 14 Minutes | 149 (13.9%) | 0 (0.0%) |
| 15 to 19 Minutes | 204 (19.0%) | 70 (8.0%) |
| 20 to 24 Minutes | 211 (19.7%) | 119 (13.6%) |
| 25 to 29 Minutes | 29 (2.7%) | 0 (0.0%) |
| 30 to 34 Minutes | 71 (6.6%) | 350 (39.9%) |
| 35 to 39 Minutes | 0 (0.0%) | 0 (0.0%) |
| 40 to 44 Minutes | 19 (1.8%) | 24 (2.7%) |
| 45 to 59 Minutes | 21 (2.0%) | 91 (10.4%) |
| 60 to 89 Minutes | 20 (1.9%) | 51 (5.8%) |
| 90 or more Minutes | 255 (23.8%) | 0 (0.0%) |
Time of Departure to Work by Sex in Dos Palos
The most frequent times of departure to work in Dos Palos are 12:00 AM to 4:59 AM (345, 32.2%) for males and 5:00 AM to 5:29 AM (196, 22.3%) for females.
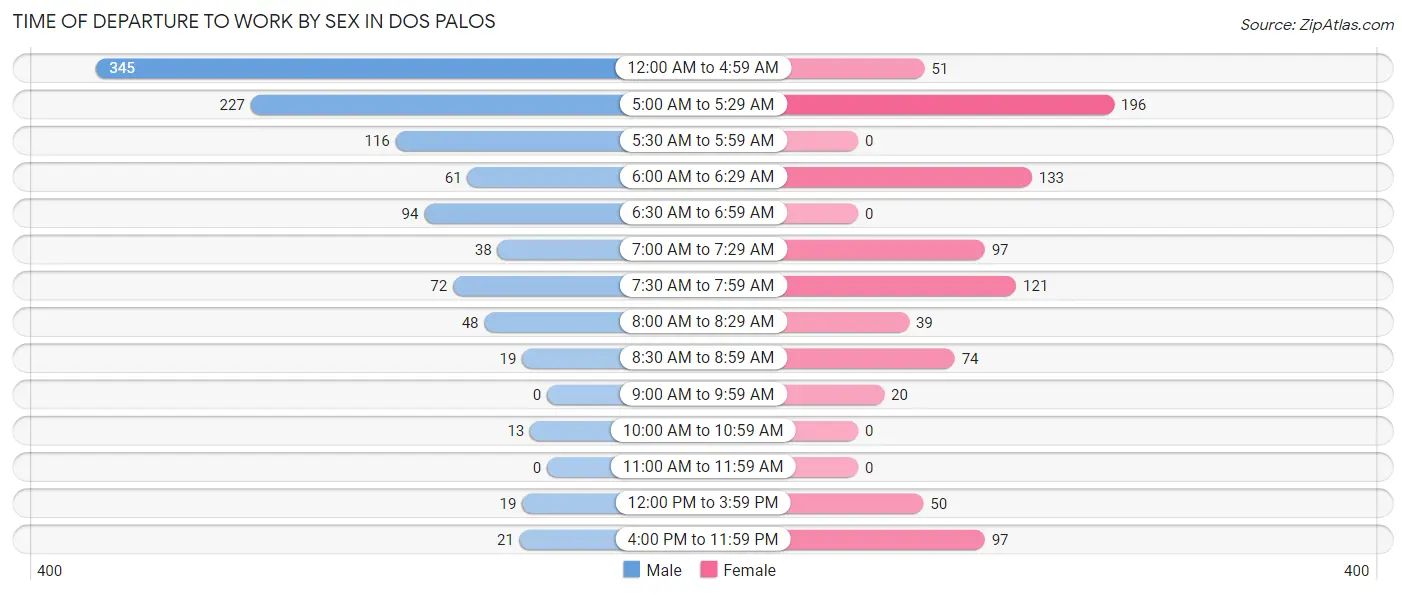
| Time of Departure | Male | Female |
| 12:00 AM to 4:59 AM | 345 (32.2%) | 51 (5.8%) |
| 5:00 AM to 5:29 AM | 227 (21.2%) | 196 (22.3%) |
| 5:30 AM to 5:59 AM | 116 (10.8%) | 0 (0.0%) |
| 6:00 AM to 6:29 AM | 61 (5.7%) | 133 (15.1%) |
| 6:30 AM to 6:59 AM | 94 (8.8%) | 0 (0.0%) |
| 7:00 AM to 7:29 AM | 38 (3.5%) | 97 (11.1%) |
| 7:30 AM to 7:59 AM | 72 (6.7%) | 121 (13.8%) |
| 8:00 AM to 8:29 AM | 48 (4.5%) | 39 (4.4%) |
| 8:30 AM to 8:59 AM | 19 (1.8%) | 74 (8.4%) |
| 9:00 AM to 9:59 AM | 0 (0.0%) | 20 (2.3%) |
| 10:00 AM to 10:59 AM | 13 (1.2%) | 0 (0.0%) |
| 11:00 AM to 11:59 AM | 0 (0.0%) | 0 (0.0%) |
| 12:00 PM to 3:59 PM | 19 (1.8%) | 50 (5.7%) |
| 4:00 PM to 11:59 PM | 21 (2.0%) | 97 (11.1%) |
| Total | 1,073 (100.0%) | 878 (100.0%) |
Housing Occupancy in Dos Palos
Occupancy by Ownership in Dos Palos
Of the total 1,798 dwellings in Dos Palos, owner-occupied units account for 1,085 (60.3%), while renter-occupied units make up 713 (39.7%).
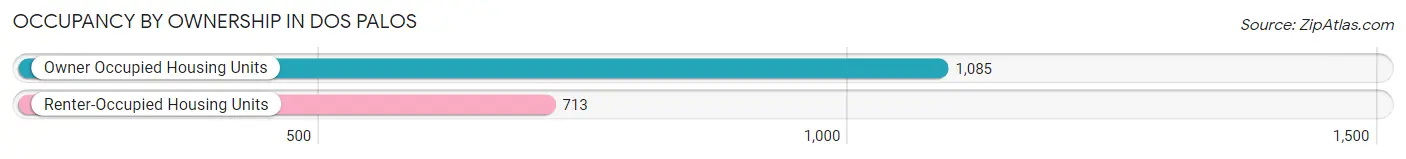
| Occupancy | # Housing Units | % Housing Units |
| Owner Occupied Housing Units | 1,085 | 60.3% |
| Renter-Occupied Housing Units | 713 | 39.7% |
| Total Occupied Housing Units | 1,798 | 100.0% |
Occupancy by Household Size in Dos Palos
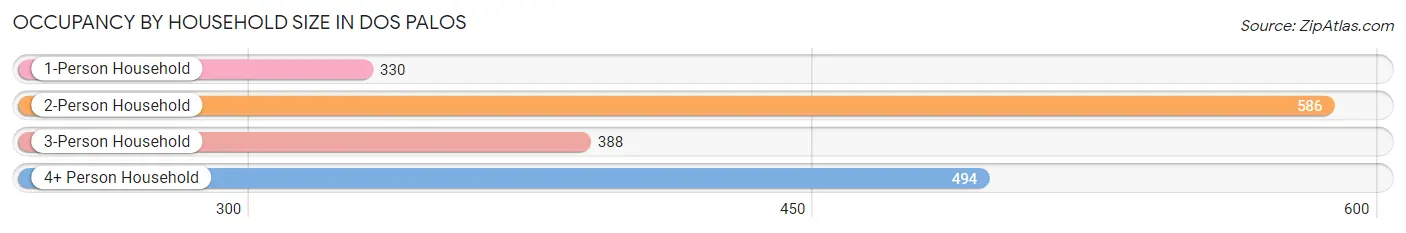
| Household Size | # Housing Units | % Housing Units |
| 1-Person Household | 330 | 18.3% |
| 2-Person Household | 586 | 32.6% |
| 3-Person Household | 388 | 21.6% |
| 4+ Person Household | 494 | 27.5% |
| Total Housing Units | 1,798 | 100.0% |
Occupancy by Ownership by Household Size in Dos Palos
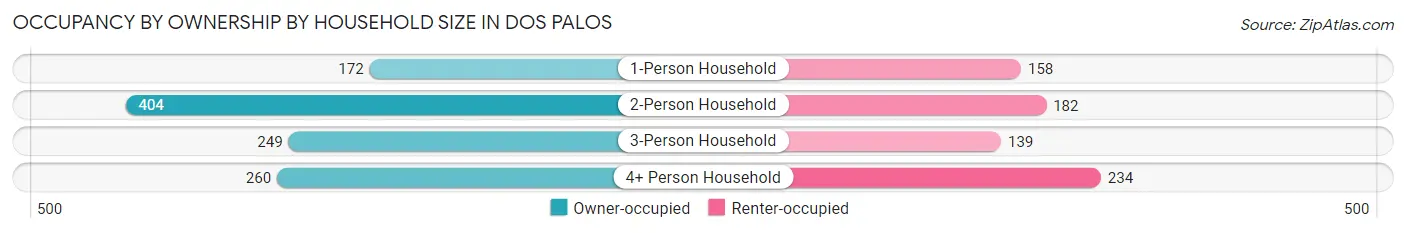
| Household Size | Owner-occupied | Renter-occupied |
| 1-Person Household | 172 (52.1%) | 158 (47.9%) |
| 2-Person Household | 404 (68.9%) | 182 (31.1%) |
| 3-Person Household | 249 (64.2%) | 139 (35.8%) |
| 4+ Person Household | 260 (52.6%) | 234 (47.4%) |
| Total Housing Units | 1,085 (60.3%) | 713 (39.7%) |
Occupancy by Educational Attainment in Dos Palos
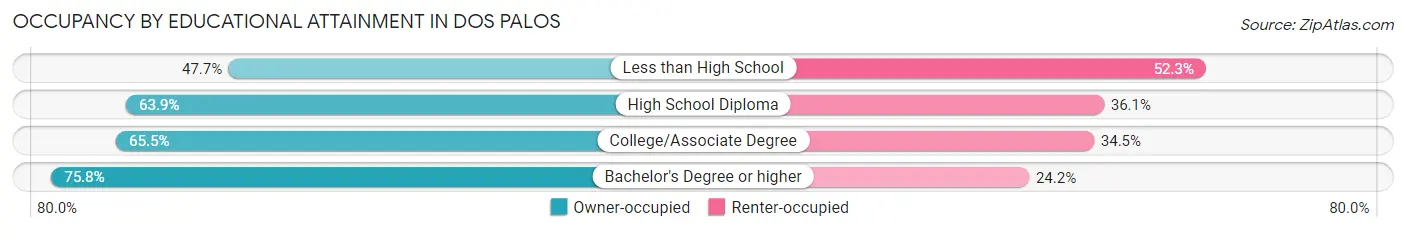
| Household Size | Owner-occupied | Renter-occupied |
| Less than High School | 294 (47.7%) | 322 (52.3%) |
| High School Diploma | 269 (63.9%) | 152 (36.1%) |
| College/Associate Degree | 347 (65.5%) | 183 (34.5%) |
| Bachelor's Degree or higher | 175 (75.8%) | 56 (24.2%) |
Occupancy by Age of Householder in Dos Palos
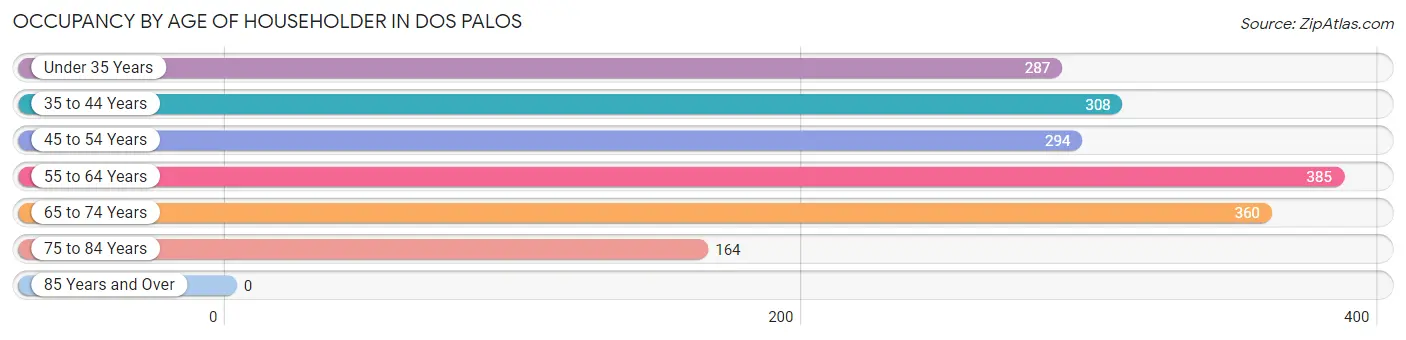
| Age Bracket | # Households | % Households |
| Under 35 Years | 287 | 16.0% |
| 35 to 44 Years | 308 | 17.1% |
| 45 to 54 Years | 294 | 16.4% |
| 55 to 64 Years | 385 | 21.4% |
| 65 to 74 Years | 360 | 20.0% |
| 75 to 84 Years | 164 | 9.1% |
| 85 Years and Over | 0 | 0.0% |
| Total | 1,798 | 100.0% |
Housing Finances in Dos Palos
Median Income by Occupancy in Dos Palos
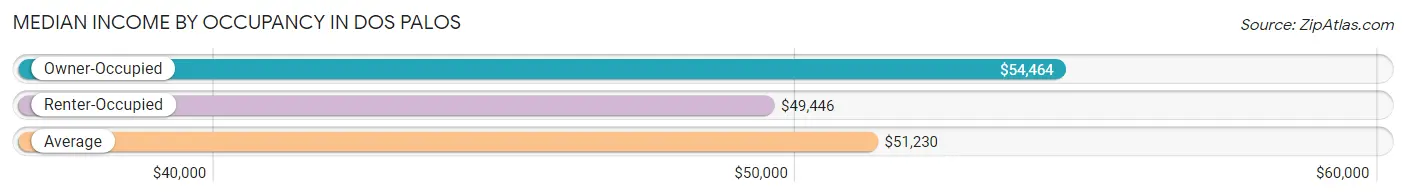
| Occupancy Type | # Households | Median Income |
| Owner-Occupied | 1,085 (60.3%) | $54,464 |
| Renter-Occupied | 713 (39.7%) | $49,446 |
| Average | 1,798 (100.0%) | $51,230 |
Occupancy by Householder Income Bracket in Dos Palos
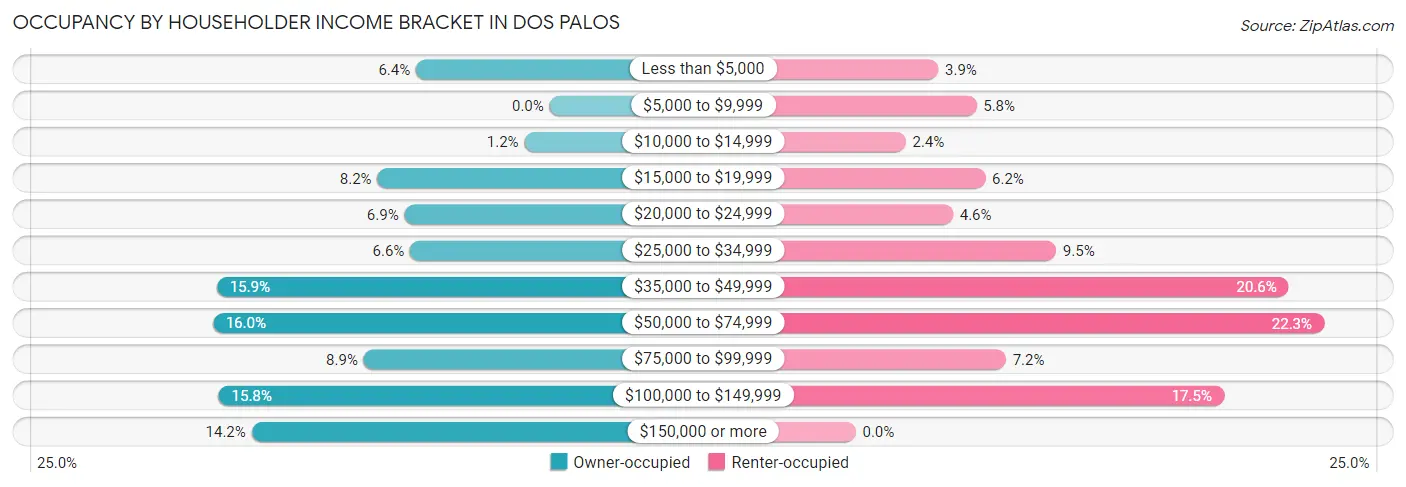
| Income Bracket | Owner-occupied | Renter-occupied |
| Less than $5,000 | 69 (6.4%) | 28 (3.9%) |
| $5,000 to $9,999 | 0 (0.0%) | 41 (5.8%) |
| $10,000 to $14,999 | 13 (1.2%) | 17 (2.4%) |
| $15,000 to $19,999 | 89 (8.2%) | 44 (6.2%) |
| $20,000 to $24,999 | 75 (6.9%) | 33 (4.6%) |
| $25,000 to $34,999 | 72 (6.6%) | 68 (9.5%) |
| $35,000 to $49,999 | 172 (15.9%) | 147 (20.6%) |
| $50,000 to $74,999 | 174 (16.0%) | 159 (22.3%) |
| $75,000 to $99,999 | 96 (8.8%) | 51 (7.1%) |
| $100,000 to $149,999 | 171 (15.8%) | 125 (17.5%) |
| $150,000 or more | 154 (14.2%) | 0 (0.0%) |
| Total | 1,085 (100.0%) | 713 (100.0%) |
Monthly Housing Cost Tiers in Dos Palos
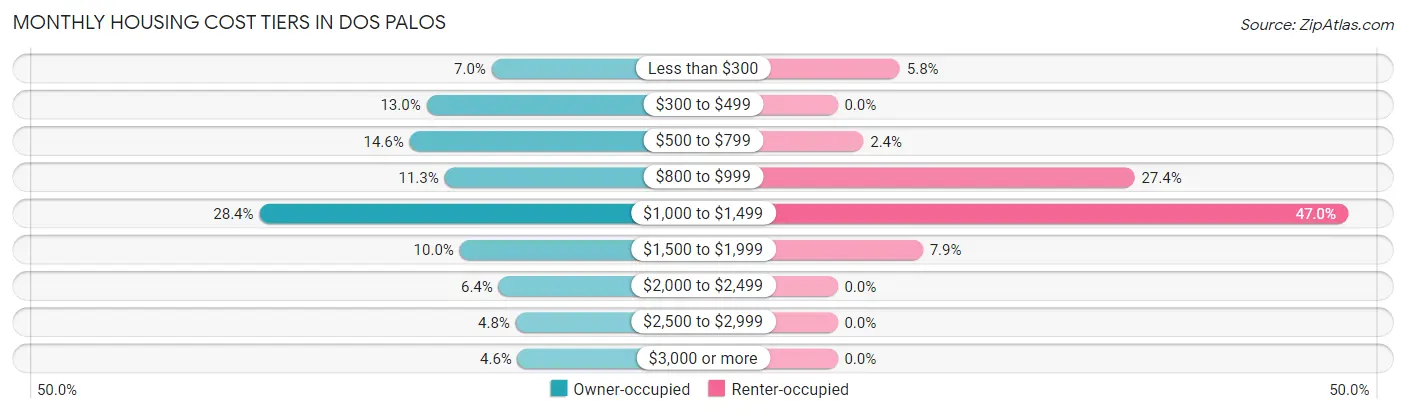
| Monthly Cost | Owner-occupied | Renter-occupied |
| Less than $300 | 76 (7.0%) | 41 (5.8%) |
| $300 to $499 | 141 (13.0%) | 0 (0.0%) |
| $500 to $799 | 158 (14.6%) | 17 (2.4%) |
| $800 to $999 | 123 (11.3%) | 195 (27.4%) |
| $1,000 to $1,499 | 308 (28.4%) | 335 (47.0%) |
| $1,500 to $1,999 | 108 (10.0%) | 56 (7.9%) |
| $2,000 to $2,499 | 69 (6.4%) | 0 (0.0%) |
| $2,500 to $2,999 | 52 (4.8%) | 0 (0.0%) |
| $3,000 or more | 50 (4.6%) | 0 (0.0%) |
| Total | 1,085 (100.0%) | 713 (100.0%) |
Physical Housing Characteristics in Dos Palos
Housing Structures in Dos Palos
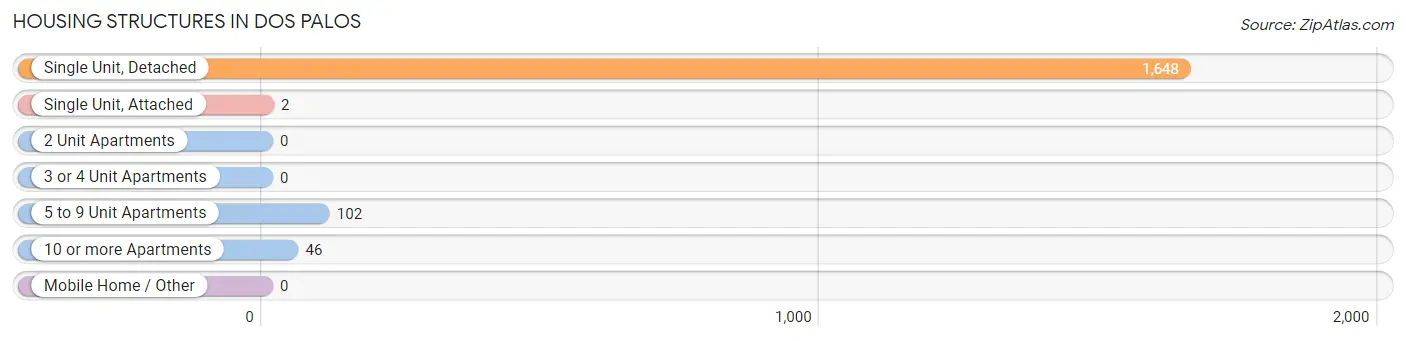
| Structure Type | # Housing Units | % Housing Units |
| Single Unit, Detached | 1,648 | 91.7% |
| Single Unit, Attached | 2 | 0.1% |
| 2 Unit Apartments | 0 | 0.0% |
| 3 or 4 Unit Apartments | 0 | 0.0% |
| 5 to 9 Unit Apartments | 102 | 5.7% |
| 10 or more Apartments | 46 | 2.6% |
| Mobile Home / Other | 0 | 0.0% |
| Total | 1,798 | 100.0% |
Housing Structures by Occupancy in Dos Palos
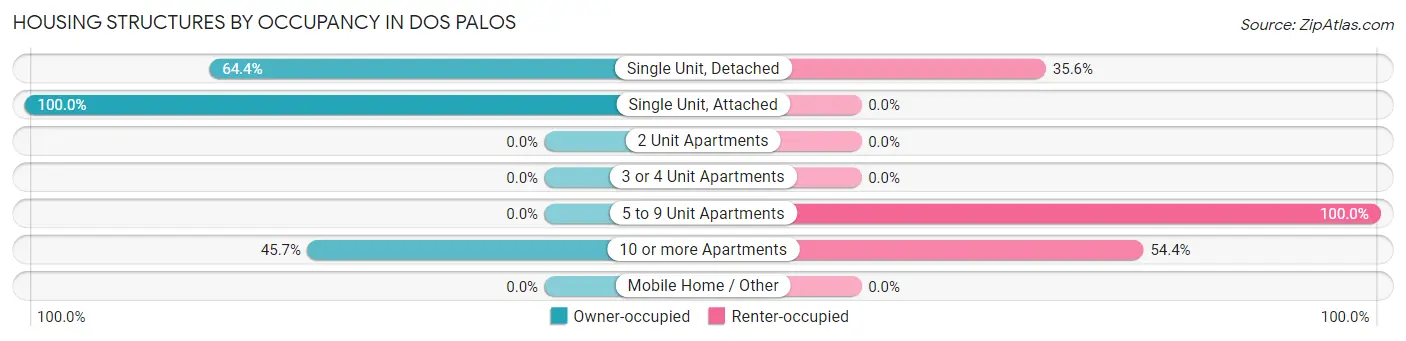
| Structure Type | Owner-occupied | Renter-occupied |
| Single Unit, Detached | 1,062 (64.4%) | 586 (35.6%) |
| Single Unit, Attached | 2 (100.0%) | 0 (0.0%) |
| 2 Unit Apartments | 0 (0.0%) | 0 (0.0%) |
| 3 or 4 Unit Apartments | 0 (0.0%) | 0 (0.0%) |
| 5 to 9 Unit Apartments | 0 (0.0%) | 102 (100.0%) |
| 10 or more Apartments | 21 (45.7%) | 25 (54.3%) |
| Mobile Home / Other | 0 (0.0%) | 0 (0.0%) |
| Total | 1,085 (60.3%) | 713 (39.7%) |
Housing Structures by Number of Rooms in Dos Palos
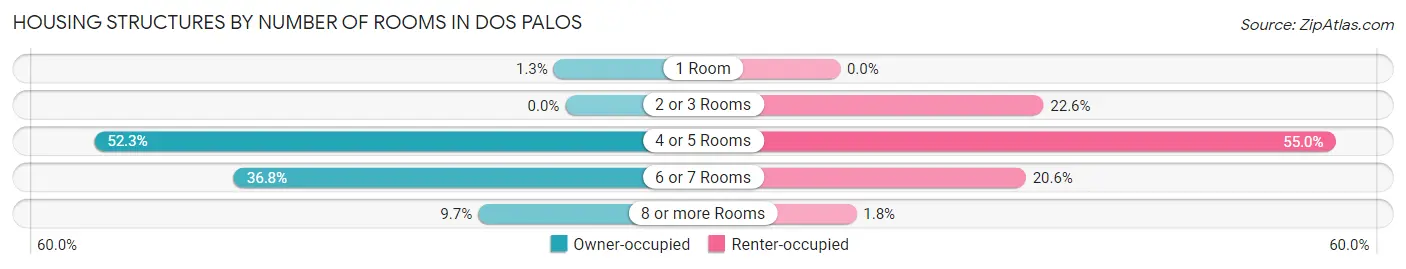
| Number of Rooms | Owner-occupied | Renter-occupied |
| 1 Room | 14 (1.3%) | 0 (0.0%) |
| 2 or 3 Rooms | 0 (0.0%) | 161 (22.6%) |
| 4 or 5 Rooms | 567 (52.3%) | 392 (55.0%) |
| 6 or 7 Rooms | 399 (36.8%) | 147 (20.6%) |
| 8 or more Rooms | 105 (9.7%) | 13 (1.8%) |
| Total | 1,085 (100.0%) | 713 (100.0%) |
Housing Structure by Heating Type in Dos Palos
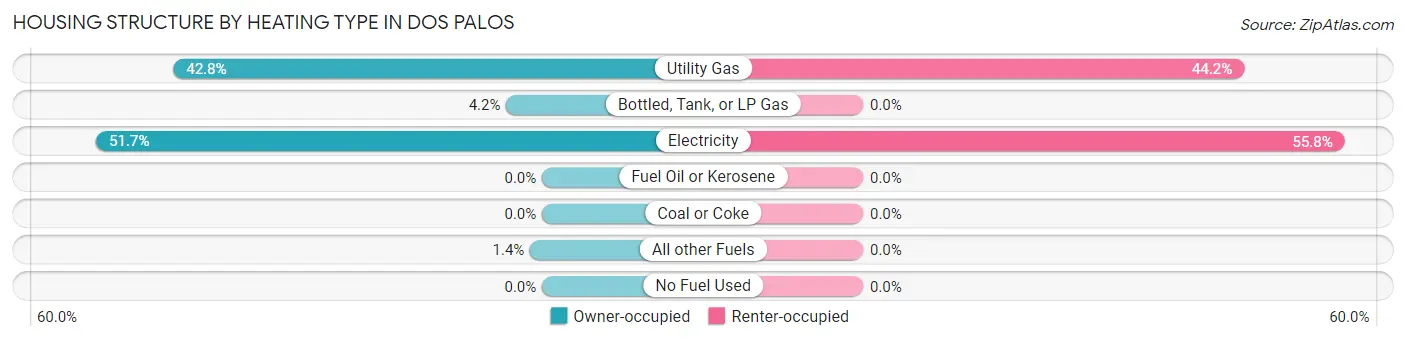
| Heating Type | Owner-occupied | Renter-occupied |
| Utility Gas | 464 (42.8%) | 315 (44.2%) |
| Bottled, Tank, or LP Gas | 45 (4.2%) | 0 (0.0%) |
| Electricity | 561 (51.7%) | 398 (55.8%) |
| Fuel Oil or Kerosene | 0 (0.0%) | 0 (0.0%) |
| Coal or Coke | 0 (0.0%) | 0 (0.0%) |
| All other Fuels | 15 (1.4%) | 0 (0.0%) |
| No Fuel Used | 0 (0.0%) | 0 (0.0%) |
| Total | 1,085 (100.0%) | 713 (100.0%) |
Household Vehicle Usage in Dos Palos
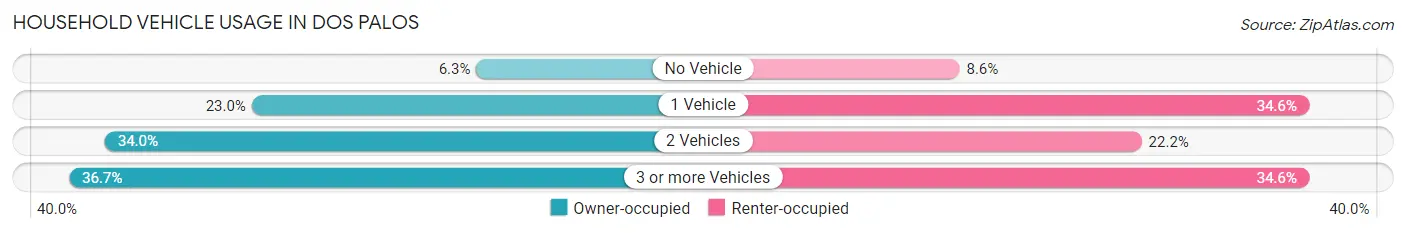
| Vehicles per Household | Owner-occupied | Renter-occupied |
| No Vehicle | 68 (6.3%) | 61 (8.6%) |
| 1 Vehicle | 250 (23.0%) | 247 (34.6%) |
| 2 Vehicles | 369 (34.0%) | 158 (22.2%) |
| 3 or more Vehicles | 398 (36.7%) | 247 (34.6%) |
| Total | 1,085 (100.0%) | 713 (100.0%) |
Real Estate & Mortgages in Dos Palos
Real Estate and Mortgage Overview in Dos Palos
| Characteristic | Without Mortgage | With Mortgage |
| Housing Units | 446 | 639 |
| Median Property Value | $247,400 | $268,700 |
| Median Household Income | $35,238 | $133 |
| Monthly Housing Costs | $508 | $50 |
| Real Estate Taxes | $934 | $0 |
Property Value by Mortgage Status in Dos Palos
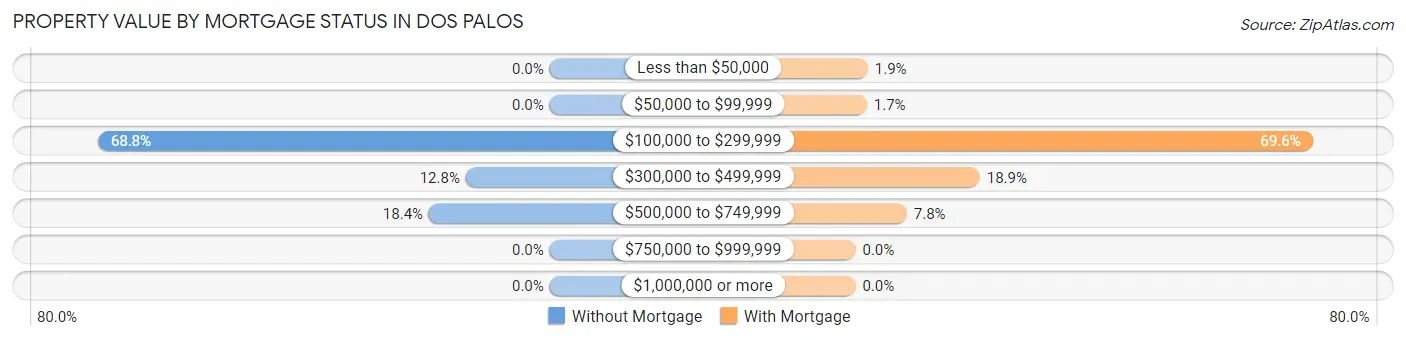
| Property Value | Without Mortgage | With Mortgage |
| Less than $50,000 | 0 (0.0%) | 12 (1.9%) |
| $50,000 to $99,999 | 0 (0.0%) | 11 (1.7%) |
| $100,000 to $299,999 | 307 (68.8%) | 445 (69.6%) |
| $300,000 to $499,999 | 57 (12.8%) | 121 (18.9%) |
| $500,000 to $749,999 | 82 (18.4%) | 50 (7.8%) |
| $750,000 to $999,999 | 0 (0.0%) | 0 (0.0%) |
| $1,000,000 or more | 0 (0.0%) | 0 (0.0%) |
| Total | 446 (100.0%) | 639 (100.0%) |
Household Income by Mortgage Status in Dos Palos
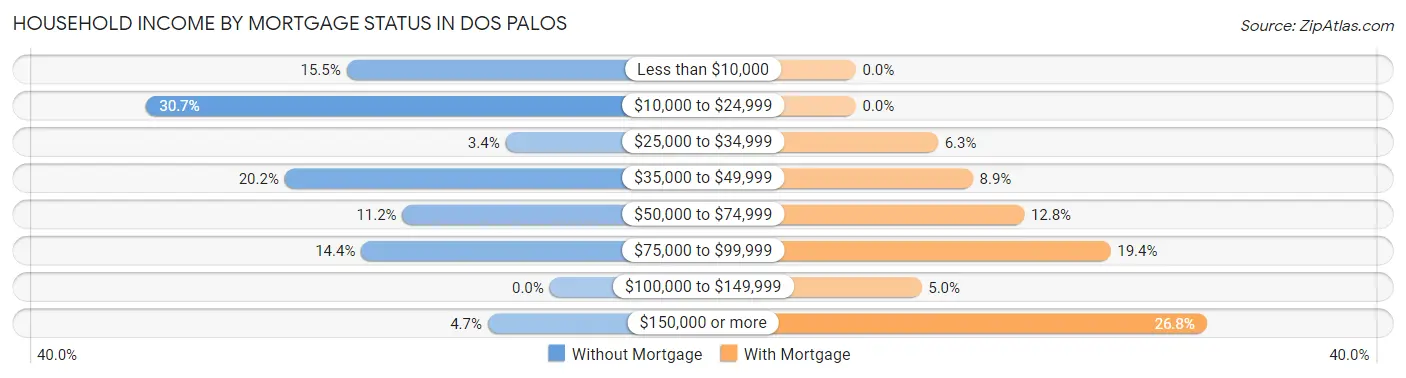
| Household Income | Without Mortgage | With Mortgage |
| Less than $10,000 | 69 (15.5%) | 0 (0.0%) |
| $10,000 to $24,999 | 137 (30.7%) | 0 (0.0%) |
| $25,000 to $34,999 | 15 (3.4%) | 40 (6.3%) |
| $35,000 to $49,999 | 90 (20.2%) | 57 (8.9%) |
| $50,000 to $74,999 | 50 (11.2%) | 82 (12.8%) |
| $75,000 to $99,999 | 64 (14.3%) | 124 (19.4%) |
| $100,000 to $149,999 | 0 (0.0%) | 32 (5.0%) |
| $150,000 or more | 21 (4.7%) | 171 (26.8%) |
| Total | 446 (100.0%) | 639 (100.0%) |
Property Value to Household Income Ratio in Dos Palos
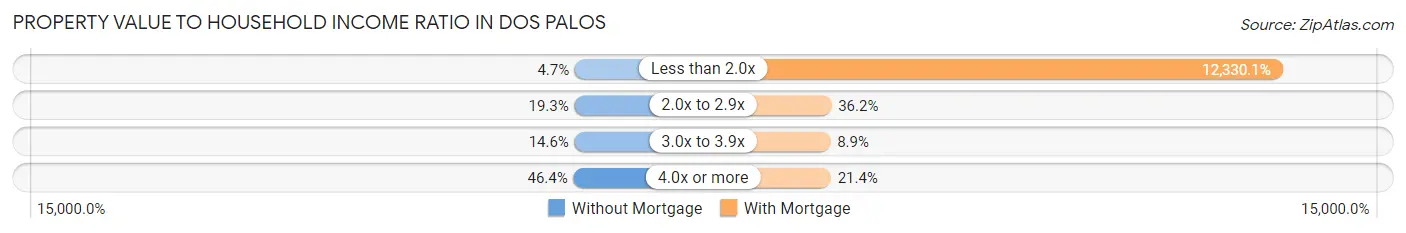
| Value-to-Income Ratio | Without Mortgage | With Mortgage |
| Less than 2.0x | 21 (4.7%) | 78,789 (12,330.0%) |
| 2.0x to 2.9x | 86 (19.3%) | 231 (36.1%) |
| 3.0x to 3.9x | 65 (14.6%) | 57 (8.9%) |
| 4.0x or more | 207 (46.4%) | 137 (21.4%) |
| Total | 446 (100.0%) | 639 (100.0%) |
Real Estate Taxes by Mortgage Status in Dos Palos
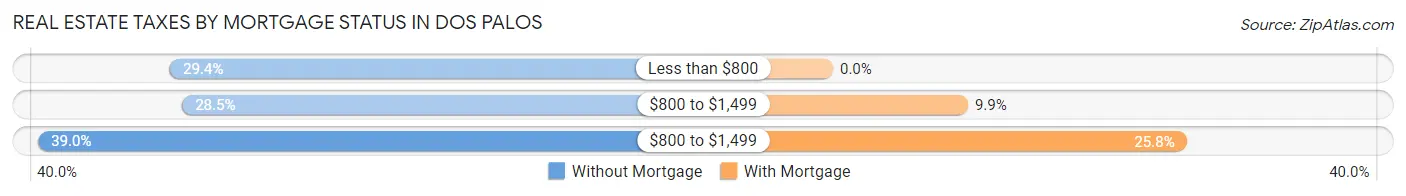
| Property Taxes | Without Mortgage | With Mortgage |
| Less than $800 | 131 (29.4%) | 0 (0.0%) |
| $800 to $1,499 | 127 (28.5%) | 63 (9.9%) |
| $800 to $1,499 | 174 (39.0%) | 165 (25.8%) |
| Total | 446 (100.0%) | 639 (100.0%) |
Health & Disability in Dos Palos
Health Insurance Coverage by Age in Dos Palos
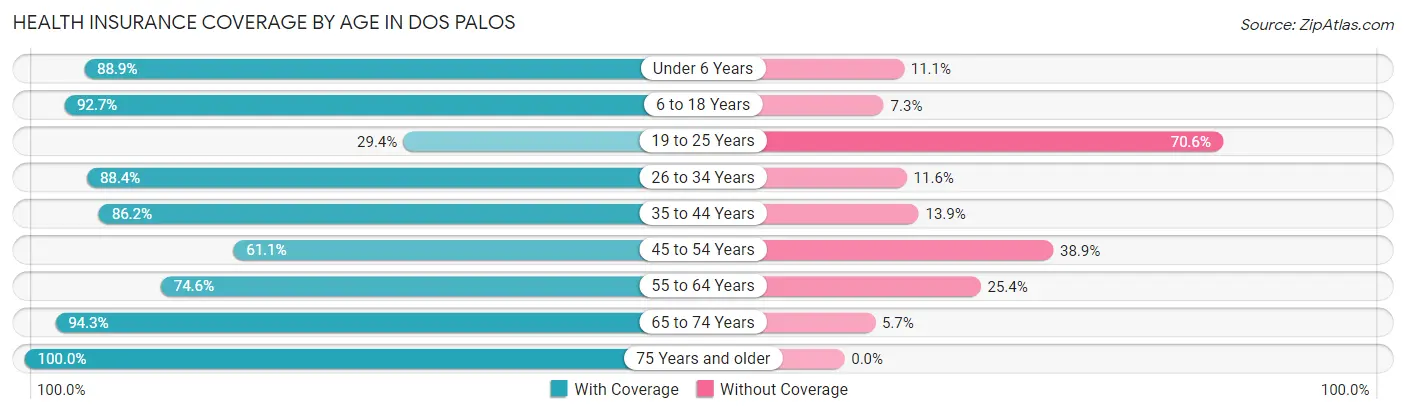
| Age Bracket | With Coverage | Without Coverage |
| Under 6 Years | 393 (88.9%) | 49 (11.1%) |
| 6 to 18 Years | 896 (92.7%) | 71 (7.3%) |
| 19 to 25 Years | 173 (29.4%) | 415 (70.6%) |
| 26 to 34 Years | 547 (88.4%) | 72 (11.6%) |
| 35 to 44 Years | 541 (86.2%) | 87 (13.9%) |
| 45 to 54 Years | 422 (61.1%) | 269 (38.9%) |
| 55 to 64 Years | 496 (74.6%) | 169 (25.4%) |
| 65 to 74 Years | 774 (94.3%) | 47 (5.7%) |
| 75 Years and older | 309 (100.0%) | 0 (0.0%) |
| Total | 4,551 (79.4%) | 1,179 (20.6%) |
Health Insurance Coverage by Citizenship Status in Dos Palos
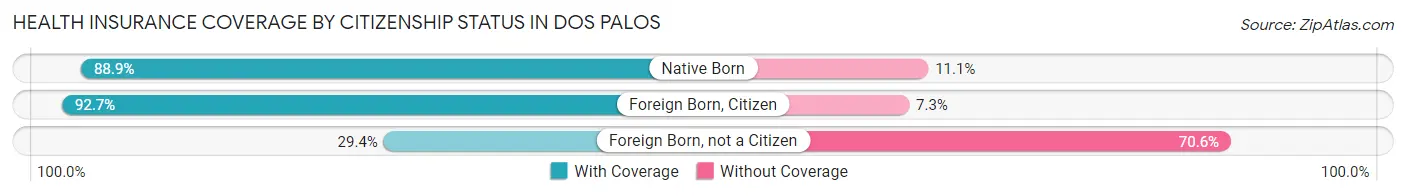
| Citizenship Status | With Coverage | Without Coverage |
| Native Born | 393 (88.9%) | 49 (11.1%) |
| Foreign Born, Citizen | 896 (92.7%) | 71 (7.3%) |
| Foreign Born, not a Citizen | 173 (29.4%) | 415 (70.6%) |
Health Insurance Coverage by Household Income in Dos Palos
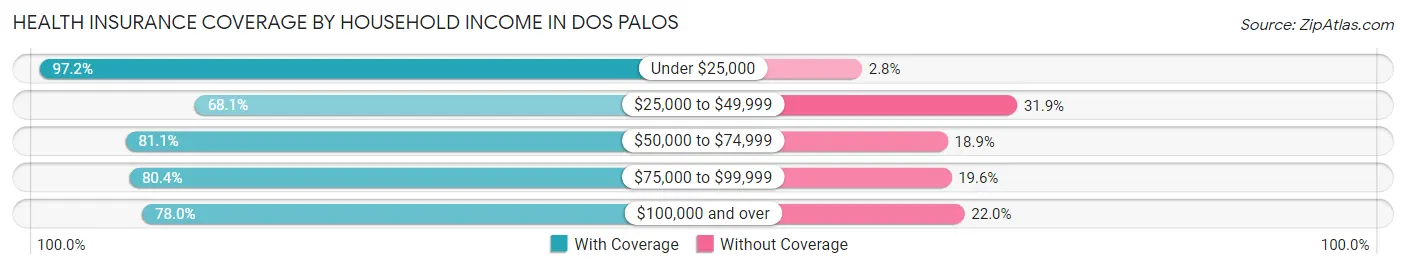
| Household Income | With Coverage | Without Coverage |
| Under $25,000 | 795 (97.2%) | 23 (2.8%) |
| $25,000 to $49,999 | 844 (68.1%) | 395 (31.9%) |
| $50,000 to $74,999 | 901 (81.1%) | 210 (18.9%) |
| $75,000 to $99,999 | 436 (80.4%) | 106 (19.6%) |
| $100,000 and over | 1,575 (78.0%) | 445 (22.0%) |
Public vs Private Health Insurance Coverage by Age in Dos Palos
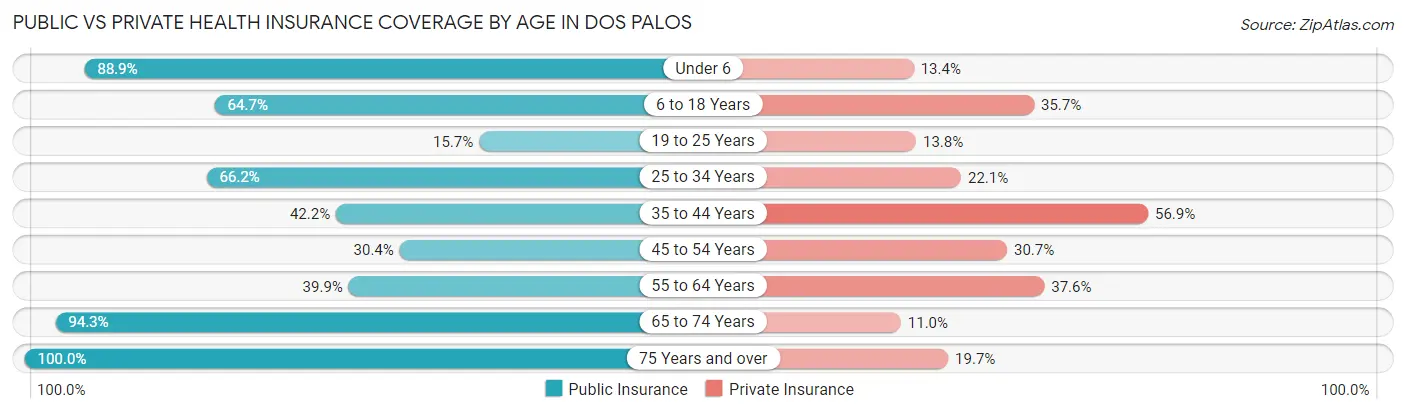
| Age Bracket | Public Insurance | Private Insurance |
| Under 6 | 393 (88.9%) | 59 (13.4%) |
| 6 to 18 Years | 626 (64.7%) | 345 (35.7%) |
| 19 to 25 Years | 92 (15.7%) | 81 (13.8%) |
| 25 to 34 Years | 410 (66.2%) | 137 (22.1%) |
| 35 to 44 Years | 265 (42.2%) | 357 (56.9%) |
| 45 to 54 Years | 210 (30.4%) | 212 (30.7%) |
| 55 to 64 Years | 265 (39.9%) | 250 (37.6%) |
| 65 to 74 Years | 774 (94.3%) | 90 (11.0%) |
| 75 Years and over | 309 (100.0%) | 61 (19.7%) |
| Total | 3,344 (58.4%) | 1,592 (27.8%) |
Disability Status by Sex by Age in Dos Palos
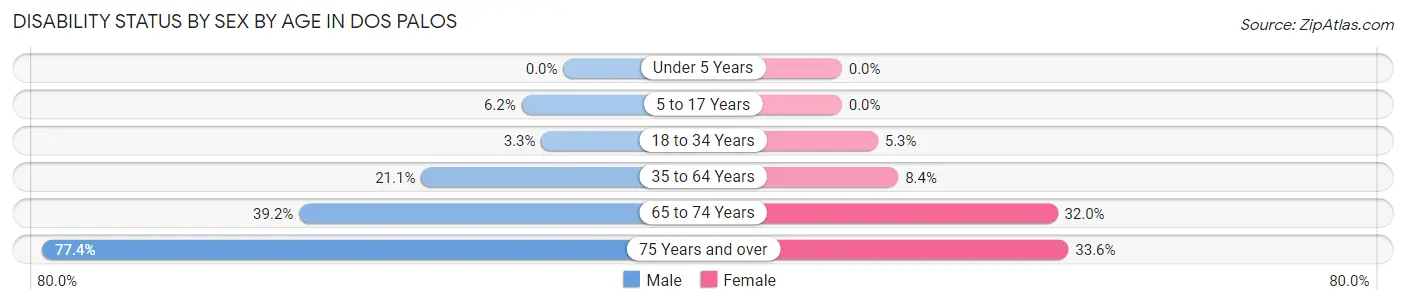
| Age Bracket | Male | Female |
| Under 5 Years | 0 (0.0%) | 0 (0.0%) |
| 5 to 17 Years | 17 (6.2%) | 0 (0.0%) |
| 18 to 34 Years | 20 (3.3%) | 38 (5.3%) |
| 35 to 64 Years | 192 (21.1%) | 90 (8.4%) |
| 65 to 74 Years | 153 (39.2%) | 138 (32.0%) |
| 75 Years and over | 154 (77.4%) | 37 (33.6%) |
Disability Class by Sex by Age in Dos Palos
Disability Class: Hearing Difficulty
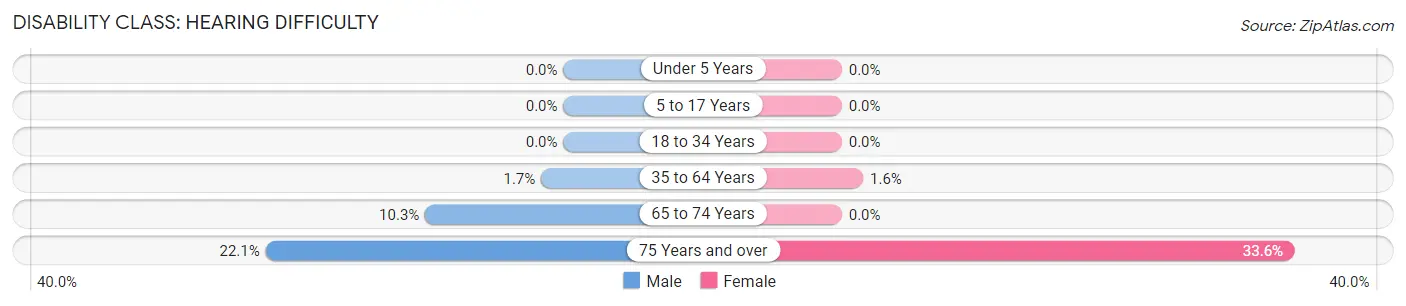
| Age Bracket | Male | Female |
| Under 5 Years | 0 (0.0%) | 0 (0.0%) |
| 5 to 17 Years | 0 (0.0%) | 0 (0.0%) |
| 18 to 34 Years | 0 (0.0%) | 0 (0.0%) |
| 35 to 64 Years | 15 (1.7%) | 17 (1.6%) |
| 65 to 74 Years | 40 (10.3%) | 0 (0.0%) |
| 75 Years and over | 44 (22.1%) | 37 (33.6%) |
Disability Class: Vision Difficulty
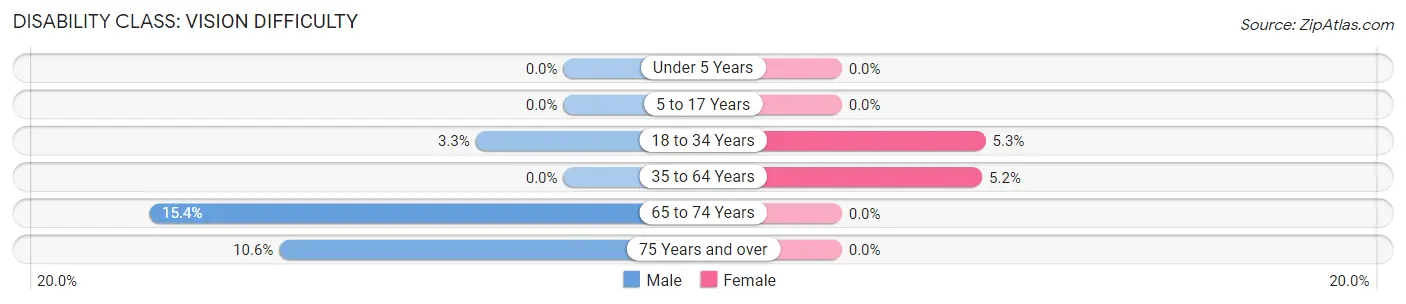
| Age Bracket | Male | Female |
| Under 5 Years | 0 (0.0%) | 0 (0.0%) |
| 5 to 17 Years | 0 (0.0%) | 0 (0.0%) |
| 18 to 34 Years | 20 (3.3%) | 38 (5.3%) |
| 35 to 64 Years | 0 (0.0%) | 56 (5.2%) |
| 65 to 74 Years | 60 (15.4%) | 0 (0.0%) |
| 75 Years and over | 21 (10.5%) | 0 (0.0%) |
Disability Class: Cognitive Difficulty
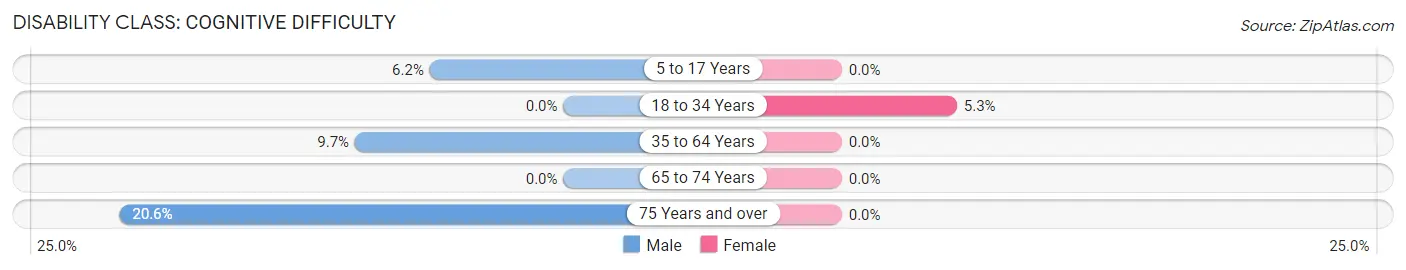
| Age Bracket | Male | Female |
| 5 to 17 Years | 17 (6.2%) | 0 (0.0%) |
| 18 to 34 Years | 0 (0.0%) | 38 (5.3%) |
| 35 to 64 Years | 88 (9.7%) | 0 (0.0%) |
| 65 to 74 Years | 0 (0.0%) | 0 (0.0%) |
| 75 Years and over | 41 (20.6%) | 0 (0.0%) |
Disability Class: Ambulatory Difficulty
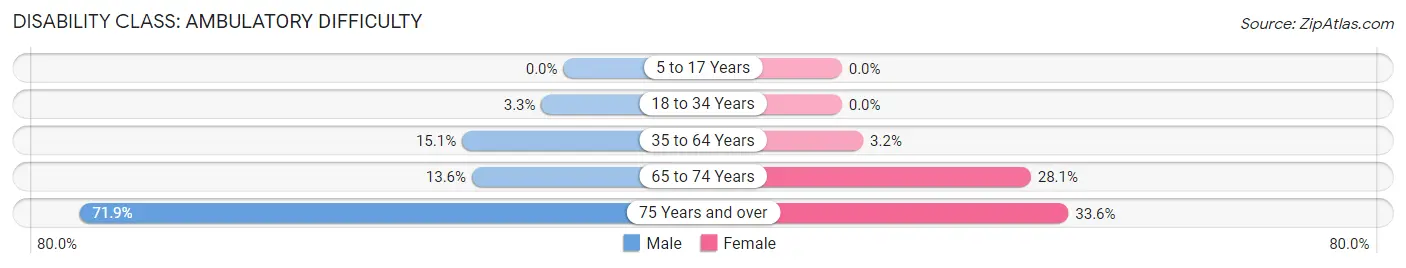
| Age Bracket | Male | Female |
| 5 to 17 Years | 0 (0.0%) | 0 (0.0%) |
| 18 to 34 Years | 20 (3.3%) | 0 (0.0%) |
| 35 to 64 Years | 137 (15.0%) | 34 (3.2%) |
| 65 to 74 Years | 53 (13.6%) | 121 (28.1%) |
| 75 Years and over | 143 (71.9%) | 37 (33.6%) |
Disability Class: Self-Care Difficulty
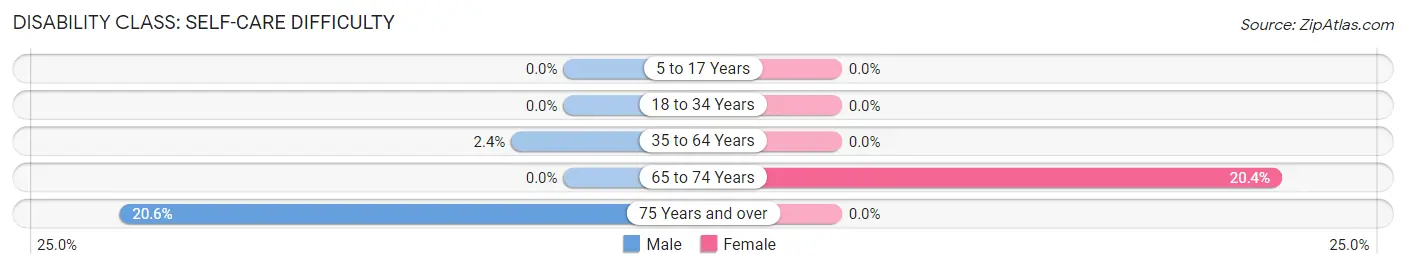
| Age Bracket | Male | Female |
| 5 to 17 Years | 0 (0.0%) | 0 (0.0%) |
| 18 to 34 Years | 0 (0.0%) | 0 (0.0%) |
| 35 to 64 Years | 22 (2.4%) | 0 (0.0%) |
| 65 to 74 Years | 0 (0.0%) | 88 (20.4%) |
| 75 Years and over | 41 (20.6%) | 0 (0.0%) |
Technology Access in Dos Palos
Computing Device Access in Dos Palos
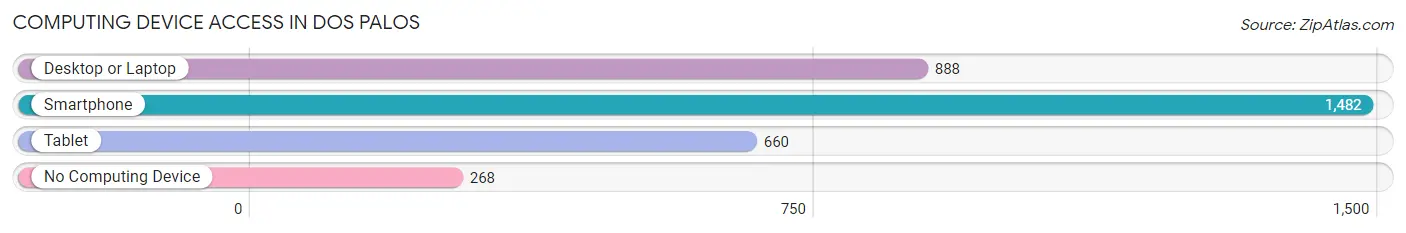
| Device Type | # Households | % Households |
| Desktop or Laptop | 888 | 49.4% |
| Smartphone | 1,482 | 82.4% |
| Tablet | 660 | 36.7% |
| No Computing Device | 268 | 14.9% |
| Total | 1,798 | 100.0% |
Internet Access in Dos Palos
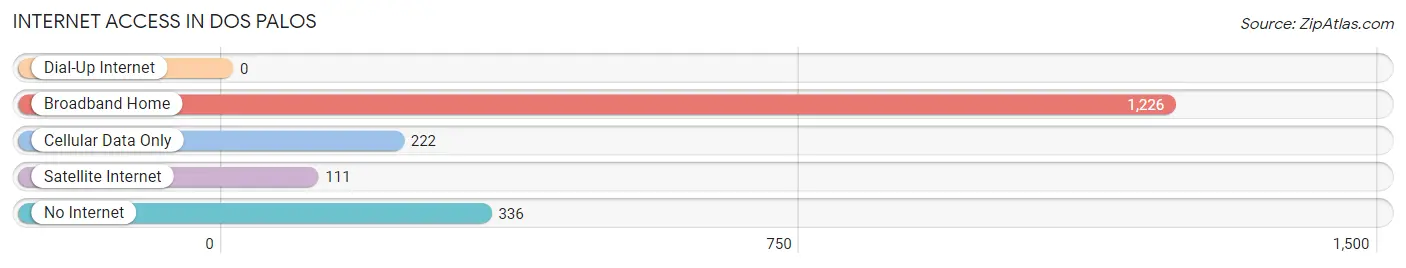
| Internet Type | # Households | % Households |
| Dial-Up Internet | 0 | 0.0% |
| Broadband Home | 1,226 | 68.2% |
| Cellular Data Only | 222 | 12.3% |
| Satellite Internet | 111 | 6.2% |
| No Internet | 336 | 18.7% |
| Total | 1,798 | 100.0% |
Dos Palos Summary
Dos Palos is a small city located in Merced County, California, United States. It is situated in the San Joaquin Valley, approximately 25 miles west of Merced and about 60 miles southeast of San Jose. The city has a population of approximately 4,000 people and is part of the Dos Palos-Oro Loma Joint Unified School District.
History
The area that is now Dos Palos was originally inhabited by the Yokuts people, who were hunter-gatherers. The first Europeans to settle in the area were Spanish missionaries, who established a mission in the area in 1806. The mission was abandoned in 1834, and the area was subsequently settled by ranchers and farmers.
In 1891, the town of Dos Palos was founded by two brothers, John and William Palos. The brothers named the town after their family name, and it quickly became a thriving agricultural center. The town was incorporated in 1921, and the population has grown steadily since then.
Geography
Dos Palos is located in the San Joaquin Valley, approximately 25 miles west of Merced and about 60 miles southeast of San Jose. The city is situated at an elevation of approximately 200 feet above sea level. The climate is generally mild, with hot summers and cool winters.
The city covers an area of approximately 2.5 square miles, and is bordered by the towns of Los Banos to the north, Firebaugh to the east, and Gustine to the south. The city is located on the banks of the San Joaquin River, and is surrounded by agricultural land.
Economy
Dos Palos is primarily an agricultural community, and the economy is largely based on farming and ranching. The city is home to a variety of crops, including almonds, walnuts, tomatoes, and cotton. The city is also home to several dairies, and is a major producer of milk and cheese.
The city is also home to several small businesses, including restaurants, retail stores, and auto repair shops. The city is served by the Dos Palos-Oro Loma Joint Unified School District, which provides educational services to the city’s students.
Demographics
As of the 2010 census, the population of Dos Palos was 4,037. The racial makeup of the city was 57.3% White, 0.7% African American, 1.2% Native American, 0.7% Asian, 0.1% Pacific Islander, 36.2% from other races, and 4.0% from two or more races. Hispanic or Latino of any race were 63.2% of the population.
The median household income in Dos Palos was $37,917, and the median family income was $41,917. The per capita income for the city was $14,917. About 18.2% of families and 22.2% of the population were below the poverty line, including 28.3% of those under age 18 and 11.2% of those age 65 or over.
The population of Dos Palos is largely composed of people of Hispanic or Latino origin. The city is also home to a small number of people of other ethnic backgrounds, including White, African American, Native American, and Asian. The city is served by the Dos Palos-Oro Loma Joint Unified School District, which provides educational services to the city’s students.
Common Questions
What is Per Capita Income in Dos Palos?
Per Capita income in Dos Palos is $24,523.
What is the Median Family Income in Dos Palos?
Median Family Income in Dos Palos is $65,223.
What is the Median Household income in Dos Palos?
Median Household Income in Dos Palos is $51,230.
What is Income or Wage Gap in Dos Palos?
Income or Wage Gap in Dos Palos is 52.0%.
Women in Dos Palos earn 48.0 cents for every dollar earned by a man.
What is Inequality or Gini Index in Dos Palos?
Inequality or Gini Index in Dos Palos is 0.47.
What is the Total Population of Dos Palos?
Total Population of Dos Palos is 5,755.
What is the Total Male Population of Dos Palos?
Total Male Population of Dos Palos is 2,598.
What is the Total Female Population of Dos Palos?
Total Female Population of Dos Palos is 3,157.
What is the Ratio of Males per 100 Females in Dos Palos?
There are 82.29 Males per 100 Females in Dos Palos.
What is the Ratio of Females per 100 Males in Dos Palos?
There are 121.52 Females per 100 Males in Dos Palos.
What is the Median Population Age in Dos Palos?
Median Population Age in Dos Palos is 37.5 Years.
What is the Average Family Size in Dos Palos
Average Family Size in Dos Palos is 3.6 People.
What is the Average Household Size in Dos Palos
Average Household Size in Dos Palos is 3.2 People.
How Large is the Labor Force in Dos Palos?
There are 2,484 People in the Labor Forcein in Dos Palos.
What is the Percentage of People in the Labor Force in Dos Palos?
52.0% of People are in the Labor Force in Dos Palos.
What is the Unemployment Rate in Dos Palos?
Unemployment Rate in Dos Palos is 12.8%.