Zip Codes with the Highest Percentage of Population Employed in Arts, Entertainment & Recreation in Danville, CA
RELATED REPORTS & OPTIONS
Arts, Entertainment & Recreation
Danville
Compare Zip Codes
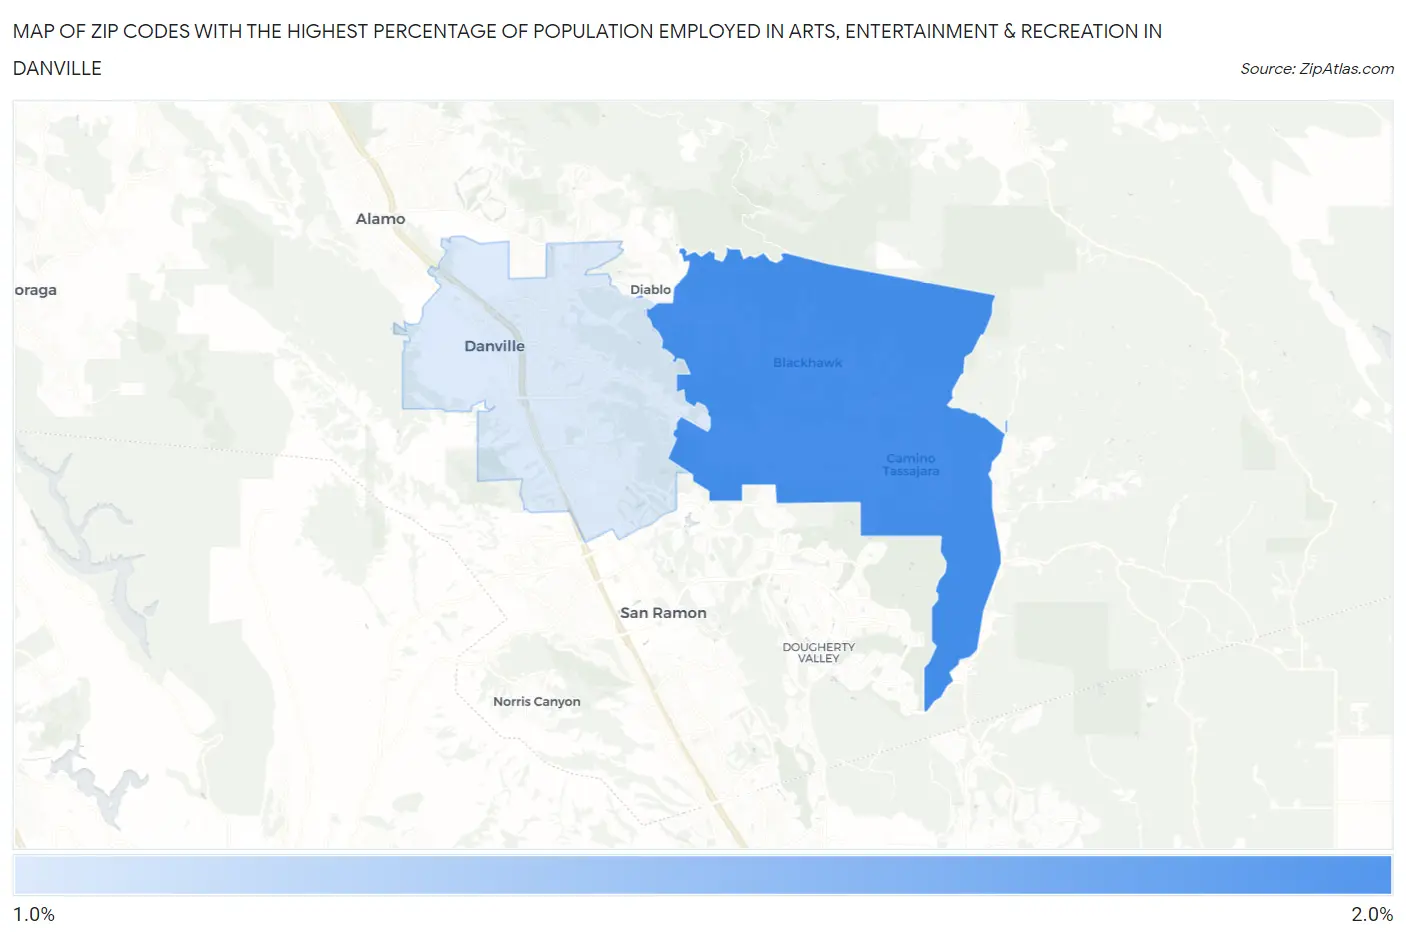
Map of Zip Codes with the Highest Percentage of Population Employed in Arts, Entertainment & Recreation in Danville
1.5%
2.0%
Zip Codes with the Highest Percentage of Population Employed in Arts, Entertainment & Recreation in Danville, CA
| Zip Code | % Employed | vs State | vs National | |
| 1. | 94506 | 2.0% | 2.6%(-0.564)#923 | 2.1%(-0.092)#9,838 |
| 2. | 94526 | 1.5% | 2.6%(-1.08)#1,144 | 2.1%(-0.611)#13,431 |
1
Common Questions
What are the Top Zip Codes with the Highest Percentage of Population Employed in Arts, Entertainment & Recreation in Danville, CA?
Top Zip Codes with the Highest Percentage of Population Employed in Arts, Entertainment & Recreation in Danville, CA are:
What zip code has the Highest Percentage of Population Employed in Arts, Entertainment & Recreation in Danville, CA?
94506 has the Highest Percentage of Population Employed in Arts, Entertainment & Recreation in Danville, CA with 2.0%.
What is the Percentage of Population Employed in Arts, Entertainment & Recreation in Danville, CA?
Percentage of Population Employed in Arts, Entertainment & Recreation in Danville is 1.5%.
What is the Percentage of Population Employed in Arts, Entertainment & Recreation in California?
Percentage of Population Employed in Arts, Entertainment & Recreation in California is 2.6%.
What is the Percentage of Population Employed in Arts, Entertainment & Recreation in the United States?
Percentage of Population Employed in Arts, Entertainment & Recreation in the United States is 2.1%.