Cypress, CA Map & Demographics
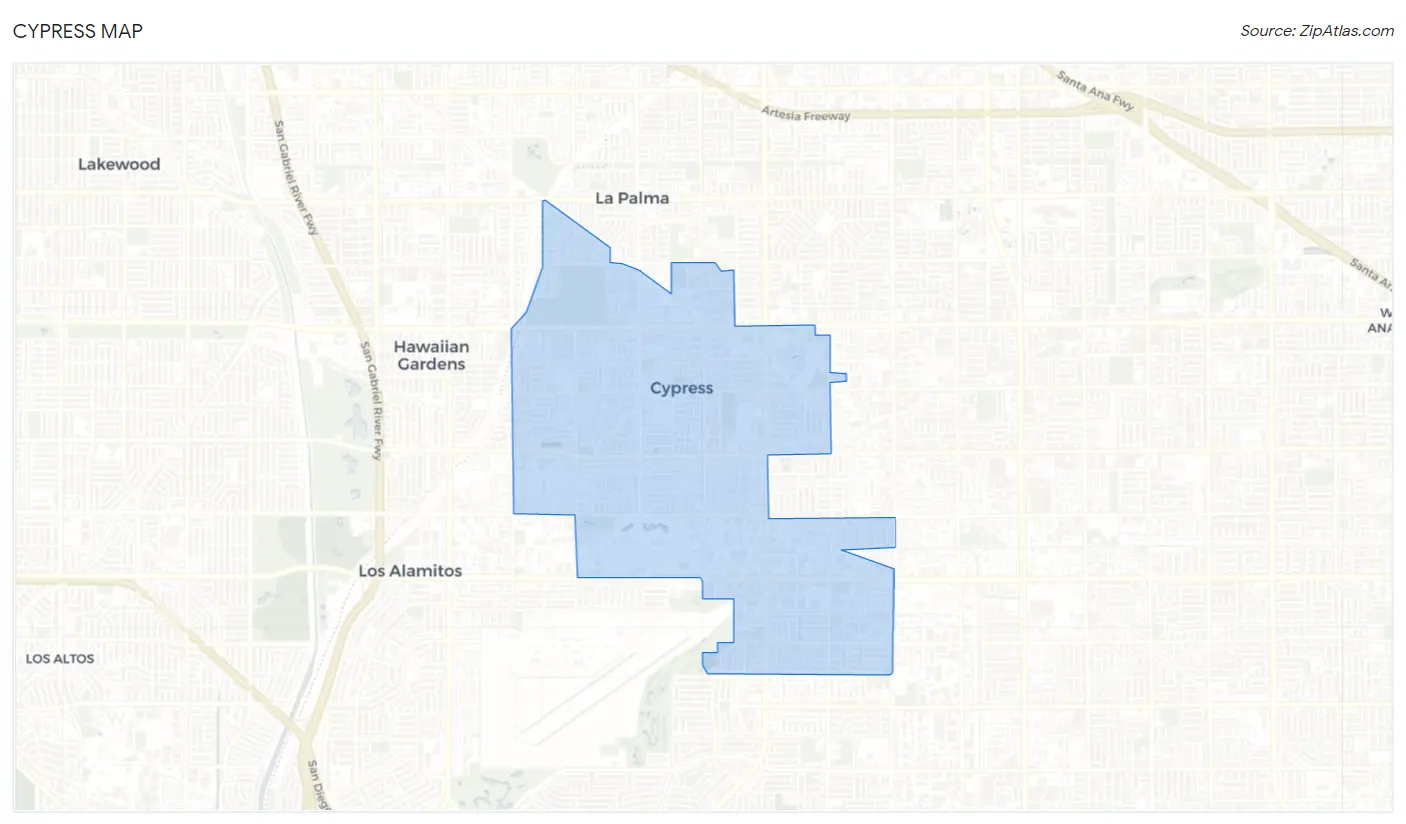
Cypress Map
Cypress Overview
$46,827
PER CAPITA INCOME
$131,332
AVG FAMILY INCOME
$117,461
AVG HOUSEHOLD INCOME
34.5%
WAGE / INCOME GAP [ % ]
65.5¢/ $1
WAGE / INCOME GAP [ $ ]
0.42
INEQUALITY / GINI INDEX
49,955
TOTAL POPULATION
24,270
MALE POPULATION
25,685
FEMALE POPULATION
94.49
MALES / 100 FEMALES
105.83
FEMALES / 100 MALES
41.5
MEDIAN AGE
3.5
AVG FAMILY SIZE
3.1
AVG HOUSEHOLD SIZE
25,339
LABOR FORCE [ PEOPLE ]
63.7%
PERCENT IN LABOR FORCE
5.1%
UNEMPLOYMENT RATE
Cypress Zip Codes
Income in Cypress
Income Overview in Cypress
Per Capita Income in Cypress is $46,827, while median incomes of families and households are $131,332 and $117,461 respectively.
| Characteristic | Number | Measure |
| Per Capita Income | 49,955 | $46,827 |
| Median Family Income | 12,730 | $131,332 |
| Mean Family Income | 12,730 | $158,299 |
| Median Household Income | 16,025 | $117,461 |
| Mean Household Income | 16,025 | $143,080 |
| Income Deficit | 12,730 | $0 |
| Wage / Income Gap (%) | 49,955 | 34.53% |
| Wage / Income Gap ($) | 49,955 | 65.47¢ per $1 |
| Gini / Inequality Index | 49,955 | 0.42 |
Earnings by Sex in Cypress
Average Earnings in Cypress are $53,339, $64,698 for men and $42,360 for women, a difference of 34.5%.
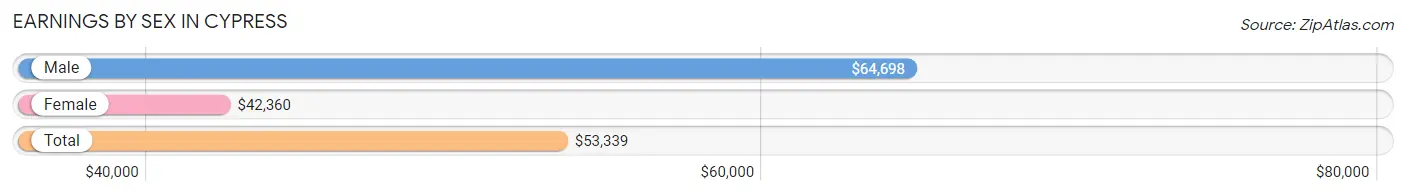
| Sex | Number | Average Earnings |
| Male | 13,838 (53.4%) | $64,698 |
| Female | 12,078 (46.6%) | $42,360 |
| Total | 25,916 (100.0%) | $53,339 |
Earnings by Sex by Income Bracket in Cypress
The most common earnings brackets in Cypress are $100,000+ for men (4,465 | 32.3%) and $100,000+ for women (2,184 | 18.1%).
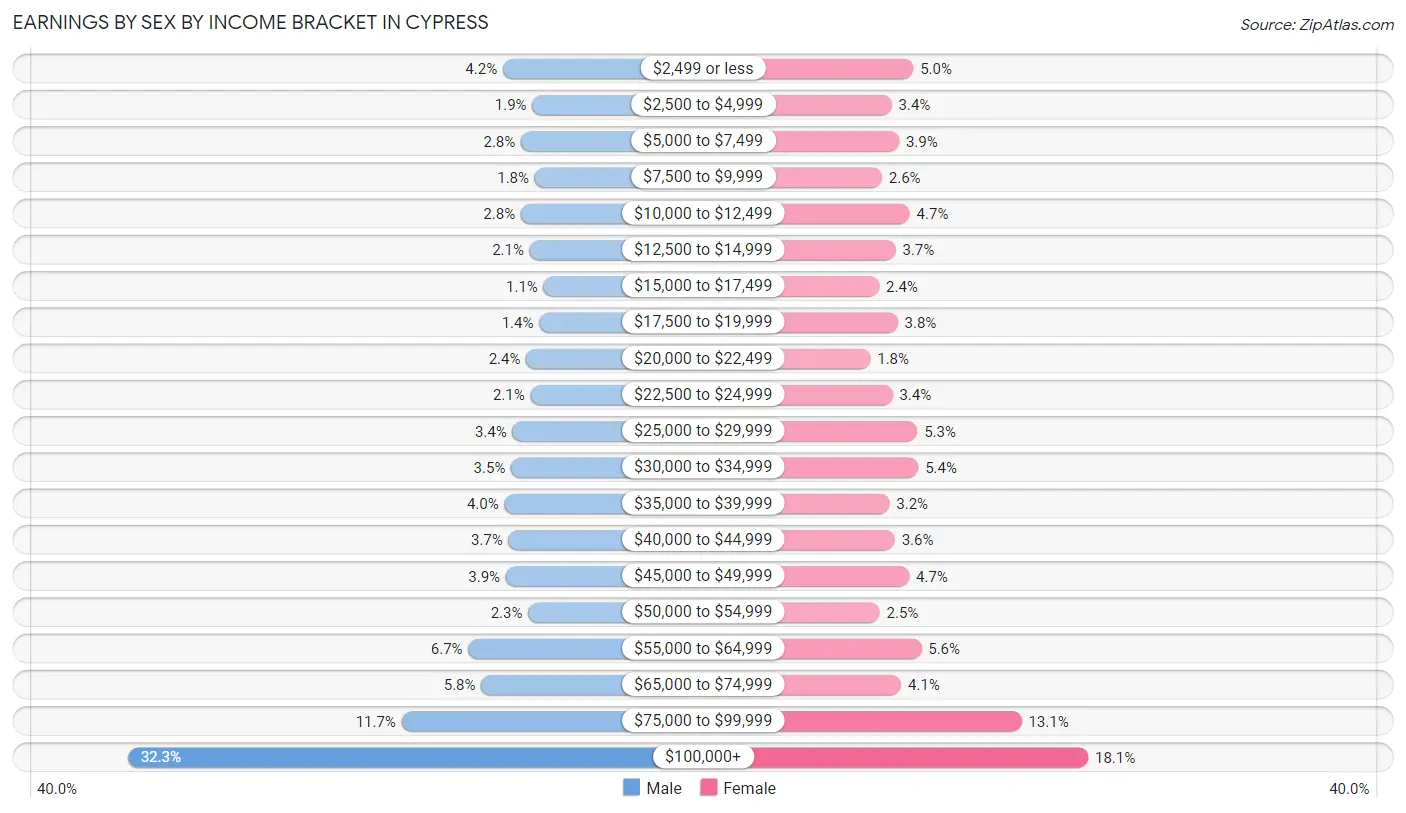
| Income | Male | Female |
| $2,499 or less | 574 (4.2%) | 601 (5.0%) |
| $2,500 to $4,999 | 269 (1.9%) | 406 (3.4%) |
| $5,000 to $7,499 | 386 (2.8%) | 472 (3.9%) |
| $7,500 to $9,999 | 243 (1.8%) | 318 (2.6%) |
| $10,000 to $12,499 | 388 (2.8%) | 569 (4.7%) |
| $12,500 to $14,999 | 296 (2.1%) | 441 (3.6%) |
| $15,000 to $17,499 | 152 (1.1%) | 292 (2.4%) |
| $17,500 to $19,999 | 198 (1.4%) | 460 (3.8%) |
| $20,000 to $22,499 | 332 (2.4%) | 213 (1.8%) |
| $22,500 to $24,999 | 288 (2.1%) | 413 (3.4%) |
| $25,000 to $29,999 | 474 (3.4%) | 638 (5.3%) |
| $30,000 to $34,999 | 489 (3.5%) | 646 (5.3%) |
| $35,000 to $39,999 | 557 (4.0%) | 385 (3.2%) |
| $40,000 to $44,999 | 516 (3.7%) | 433 (3.6%) |
| $45,000 to $49,999 | 544 (3.9%) | 564 (4.7%) |
| $50,000 to $54,999 | 312 (2.2%) | 297 (2.5%) |
| $55,000 to $64,999 | 932 (6.7%) | 674 (5.6%) |
| $65,000 to $74,999 | 799 (5.8%) | 491 (4.1%) |
| $75,000 to $99,999 | 1,624 (11.7%) | 1,581 (13.1%) |
| $100,000+ | 4,465 (32.3%) | 2,184 (18.1%) |
| Total | 13,838 (100.0%) | 12,078 (100.0%) |
Earnings by Sex by Educational Attainment in Cypress
Average earnings in Cypress are $72,809 for men and $49,409 for women, a difference of 32.1%. Men with an educational attainment of graduate degree enjoy the highest average annual earnings of $106,635, while those with less than high school education earn the least with $41,167. Women with an educational attainment of graduate degree earn the most with the average annual earnings of $86,156, while those with less than high school education have the smallest earnings of $20,577.
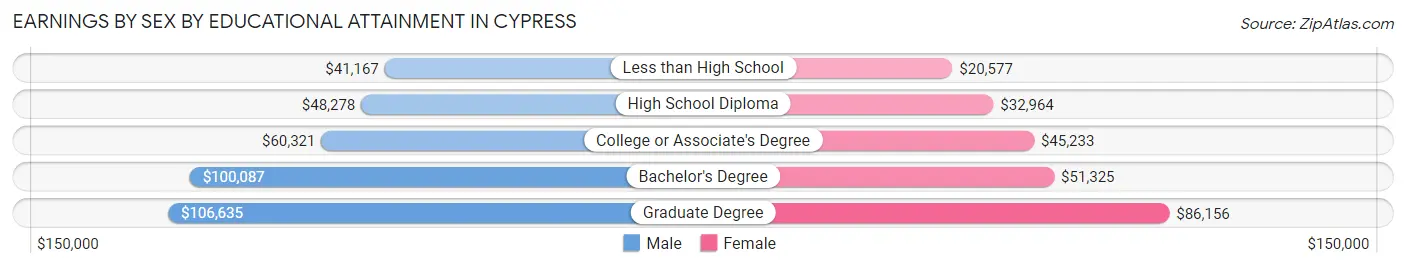
| Educational Attainment | Male Income | Female Income |
| Less than High School | $41,167 | $20,577 |
| High School Diploma | $48,278 | $32,964 |
| College or Associate's Degree | $60,321 | $45,233 |
| Bachelor's Degree | $100,087 | $51,325 |
| Graduate Degree | $106,635 | $86,156 |
| Total | $72,809 | $49,409 |
Family Income in Cypress
Family Income Brackets in Cypress
According to the Cypress family income data, there are 3,144 families falling into the $100,000 to $149,999 income range, which is the most common income bracket and makes up 24.7% of all families. Conversely, the $10,000 to $14,999 income bracket is the least frequent group with only 153 families (1.2%) belonging to this category.
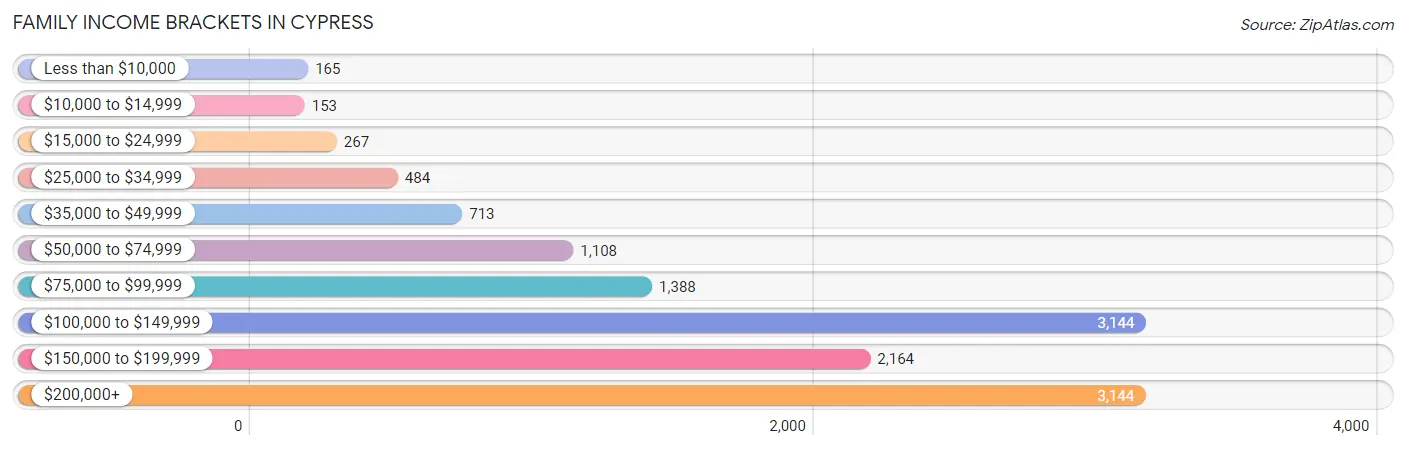
| Income Bracket | # Families | % Families |
| Less than $10,000 | 165 | 1.3% |
| $10,000 to $14,999 | 153 | 1.2% |
| $15,000 to $24,999 | 267 | 2.1% |
| $25,000 to $34,999 | 484 | 3.8% |
| $35,000 to $49,999 | 713 | 5.6% |
| $50,000 to $74,999 | 1,108 | 8.7% |
| $75,000 to $99,999 | 1,388 | 10.9% |
| $100,000 to $149,999 | 3,144 | 24.7% |
| $150,000 to $199,999 | 2,164 | 17.0% |
| $200,000+ | 3,144 | 24.7% |
Family Income by Famaliy Size in Cypress
4-person families (3,189 | 25.1%) account for the highest median family income in Cypress with $153,006 per family, while 2-person families (4,045 | 31.8%) have the highest median income of $51,302 per family member.
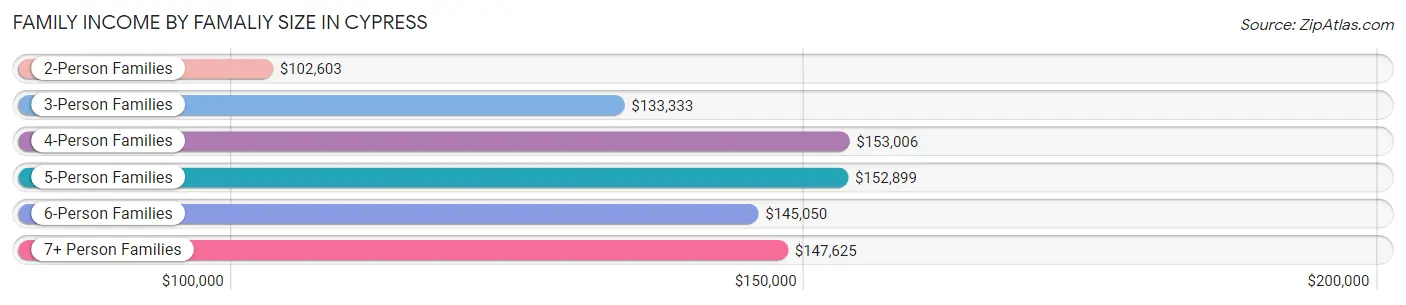
| Income Bracket | # Families | Median Income |
| 2-Person Families | 4,045 (31.8%) | $102,603 |
| 3-Person Families | 3,432 (27.0%) | $133,333 |
| 4-Person Families | 3,189 (25.1%) | $153,006 |
| 5-Person Families | 1,289 (10.1%) | $152,899 |
| 6-Person Families | 503 (4.0%) | $145,050 |
| 7+ Person Families | 272 (2.1%) | $147,625 |
| Total | 12,730 (100.0%) | $131,332 |
Family Income by Number of Earners in Cypress
The median family income in Cypress is $131,332, with families comprising 3+ earners (2,309) having the highest median family income of $165,987, while families with no earners (1,535) have the lowest median family income of $67,083, accounting for 18.1% and 12.1% of families, respectively.
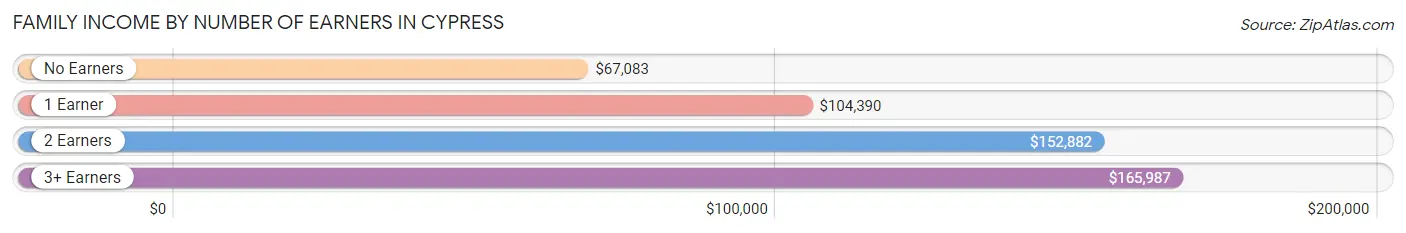
| Number of Earners | # Families | Median Income |
| No Earners | 1,535 (12.1%) | $67,083 |
| 1 Earner | 3,583 (28.1%) | $104,390 |
| 2 Earners | 5,303 (41.7%) | $152,882 |
| 3+ Earners | 2,309 (18.1%) | $165,987 |
| Total | 12,730 (100.0%) | $131,332 |
Household Income in Cypress
Household Income Brackets in Cypress
With 3,493 households falling in the category, the $100,000 to $149,999 income range is the most frequent in Cypress, accounting for 21.8% of all households. In contrast, only 240 households (1.5%) fall into the $10,000 to $14,999 income bracket, making it the least populous group.
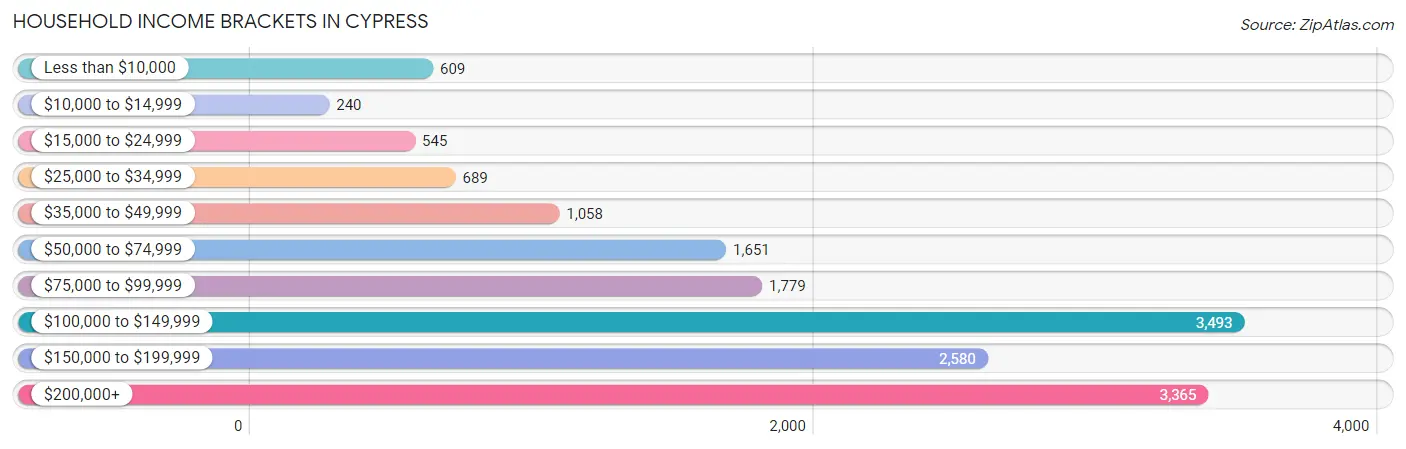
| Income Bracket | # Households | % Households |
| Less than $10,000 | 609 | 3.8% |
| $10,000 to $14,999 | 240 | 1.5% |
| $15,000 to $24,999 | 545 | 3.4% |
| $25,000 to $34,999 | 689 | 4.3% |
| $35,000 to $49,999 | 1,058 | 6.6% |
| $50,000 to $74,999 | 1,651 | 10.3% |
| $75,000 to $99,999 | 1,779 | 11.1% |
| $100,000 to $149,999 | 3,493 | 21.8% |
| $150,000 to $199,999 | 2,580 | 16.1% |
| $200,000+ | 3,365 | 21.0% |
Household Income by Householder Age in Cypress
The median household income in Cypress is $117,461, with the highest median household income of $142,212 found in the 45 to 64 years age bracket for the primary householder. A total of 7,330 households (45.7%) fall into this category. Meanwhile, the 15 to 24 years age bracket for the primary householder has the lowest median household income of $48,977, with 95 households (0.6%) in this group.
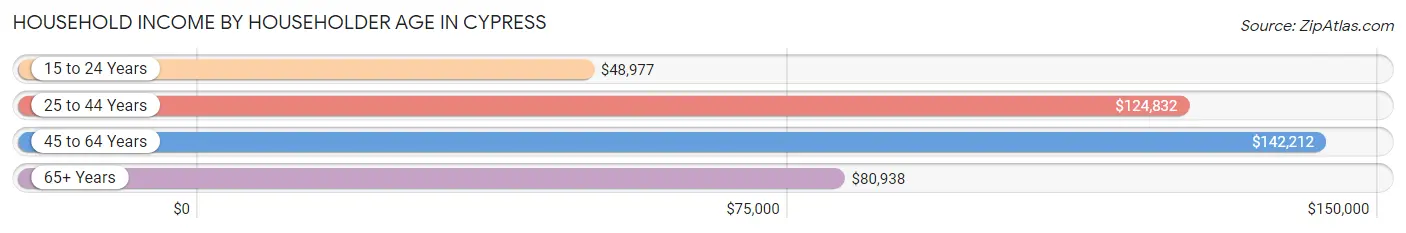
| Income Bracket | # Households | Median Income |
| 15 to 24 Years | 95 (0.6%) | $48,977 |
| 25 to 44 Years | 4,319 (27.0%) | $124,832 |
| 45 to 64 Years | 7,330 (45.7%) | $142,212 |
| 65+ Years | 4,281 (26.7%) | $80,938 |
| Total | 16,025 (100.0%) | $117,461 |
Poverty in Cypress
Income Below Poverty by Sex and Age in Cypress
With 6.9% poverty level for males and 7.6% for females among the residents of Cypress, 25 to 34 year old males and 16 and 17 year old females are the most vulnerable to poverty, with 494 males (18.8%) and 154 females (19.4%) in their respective age groups living below the poverty level.
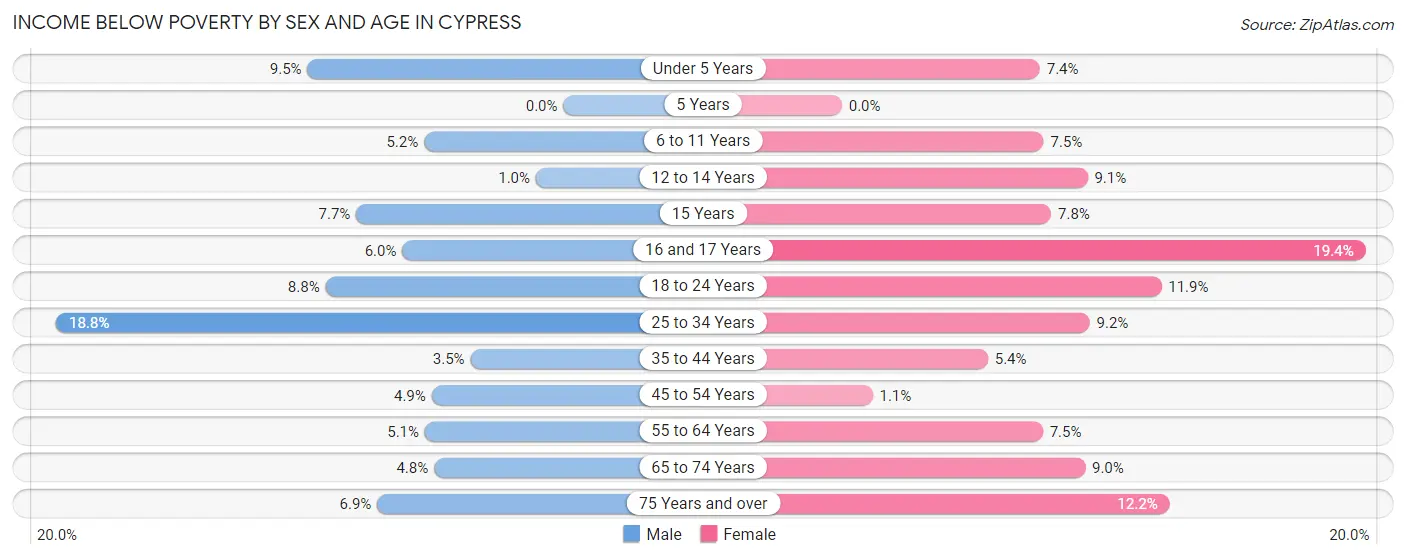
| Age Bracket | Male | Female |
| Under 5 Years | 137 (9.5%) | 118 (7.3%) |
| 5 Years | 0 (0.0%) | 0 (0.0%) |
| 6 to 11 Years | 101 (5.2%) | 162 (7.5%) |
| 12 to 14 Years | 9 (1.0%) | 107 (9.1%) |
| 15 Years | 23 (7.7%) | 16 (7.8%) |
| 16 and 17 Years | 38 (6.0%) | 154 (19.4%) |
| 18 to 24 Years | 191 (8.8%) | 226 (11.9%) |
| 25 to 34 Years | 494 (18.8%) | 240 (9.2%) |
| 35 to 44 Years | 106 (3.5%) | 192 (5.4%) |
| 45 to 54 Years | 192 (4.9%) | 42 (1.1%) |
| 55 to 64 Years | 169 (5.1%) | 261 (7.5%) |
| 65 to 74 Years | 108 (4.8%) | 226 (9.0%) |
| 75 Years and over | 102 (6.9%) | 221 (12.2%) |
| Total | 1,670 (6.9%) | 1,965 (7.6%) |
Income Above Poverty by Sex and Age in Cypress
According to the poverty statistics in Cypress, males aged 5 years and females aged 5 years are the age groups that are most secure financially, with 100.0% of males and 100.0% of females in these age groups living above the poverty line.
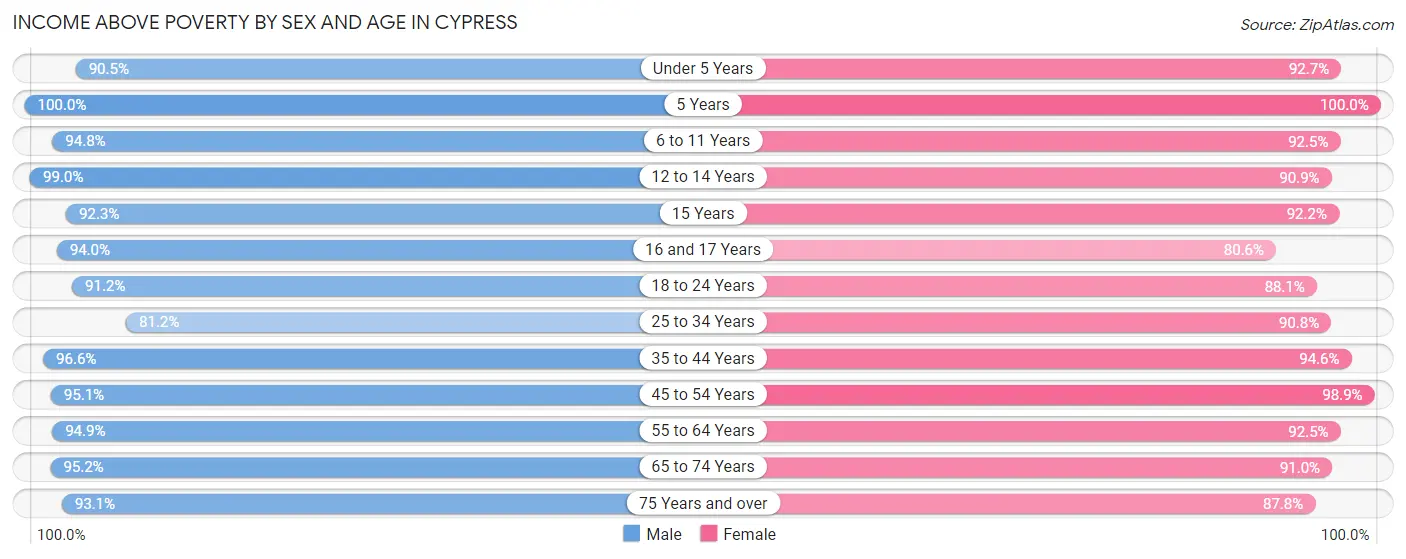
| Age Bracket | Male | Female |
| Under 5 Years | 1,305 (90.5%) | 1,487 (92.6%) |
| 5 Years | 246 (100.0%) | 183 (100.0%) |
| 6 to 11 Years | 1,853 (94.8%) | 2,000 (92.5%) |
| 12 to 14 Years | 873 (99.0%) | 1,066 (90.9%) |
| 15 Years | 276 (92.3%) | 190 (92.2%) |
| 16 and 17 Years | 597 (94.0%) | 638 (80.6%) |
| 18 to 24 Years | 1,972 (91.2%) | 1,679 (88.1%) |
| 25 to 34 Years | 2,129 (81.2%) | 2,370 (90.8%) |
| 35 to 44 Years | 2,966 (96.6%) | 3,348 (94.6%) |
| 45 to 54 Years | 3,738 (95.1%) | 3,631 (98.9%) |
| 55 to 64 Years | 3,119 (94.9%) | 3,240 (92.5%) |
| 65 to 74 Years | 2,142 (95.2%) | 2,278 (91.0%) |
| 75 Years and over | 1,374 (93.1%) | 1,595 (87.8%) |
| Total | 22,590 (93.1%) | 23,705 (92.3%) |
Income Below Poverty Among Married-Couple Families in Cypress
The poverty statistics for married-couple families in Cypress show that 3.2% or 313 of the total 9,795 families live below the poverty line. Families with 3 or 4 children have the highest poverty rate of 4.9%, comprising of 30 families. On the other hand, families with 5 or more children have the lowest poverty rate of 0.0%, which includes 0 families.
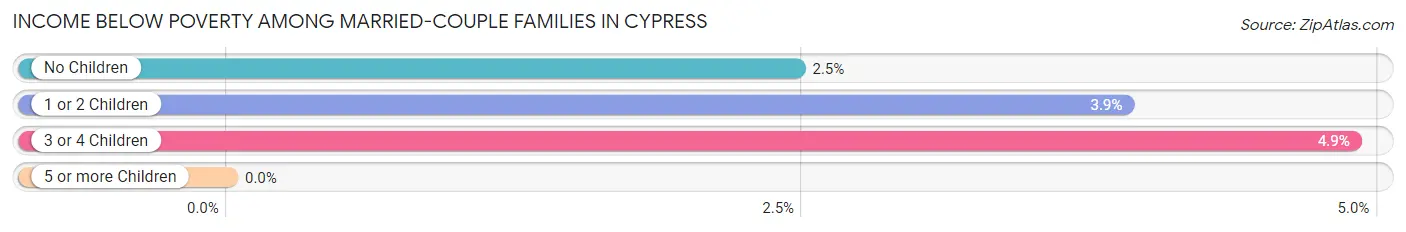
| Children | Above Poverty | Below Poverty |
| No Children | 4,866 (97.5%) | 123 (2.5%) |
| 1 or 2 Children | 3,943 (96.1%) | 160 (3.9%) |
| 3 or 4 Children | 583 (95.1%) | 30 (4.9%) |
| 5 or more Children | 90 (100.0%) | 0 (0.0%) |
| Total | 9,482 (96.8%) | 313 (3.2%) |
Income Below Poverty Among Single-Parent Households in Cypress
According to the poverty data in Cypress, 2.1% or 15 single-father households and 10.8% or 237 single-mother households are living below the poverty line. Among single-father households, those with no children have the highest poverty rate, with 15 households (3.1%) experiencing poverty. Likewise, among single-mother households, those with 5 or more children have the highest poverty rate, with 18 households (100.0%) falling below the poverty line.
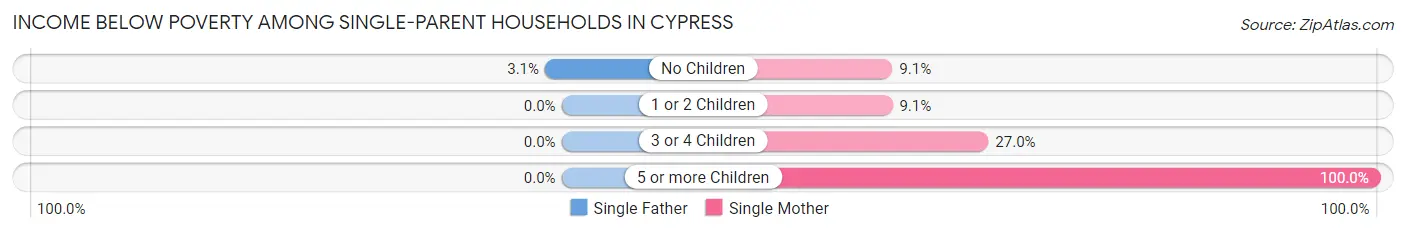
| Children | Single Father | Single Mother |
| No Children | 15 (3.1%) | 116 (9.1%) |
| 1 or 2 Children | 0 (0.0%) | 72 (9.1%) |
| 3 or 4 Children | 0 (0.0%) | 31 (27.0%) |
| 5 or more Children | 0 (0.0%) | 18 (100.0%) |
| Total | 15 (2.1%) | 237 (10.8%) |
Income Below Poverty Among Married-Couple vs Single-Parent Households in Cypress
The poverty data for Cypress shows that 313 of the married-couple family households (3.2%) and 252 of the single-parent households (8.6%) are living below the poverty level. Within the married-couple family households, those with 3 or 4 children have the highest poverty rate, with 30 households (4.9%) falling below the poverty line. Among the single-parent households, those with 5 or more children have the highest poverty rate, with 18 household (100.0%) living below poverty.
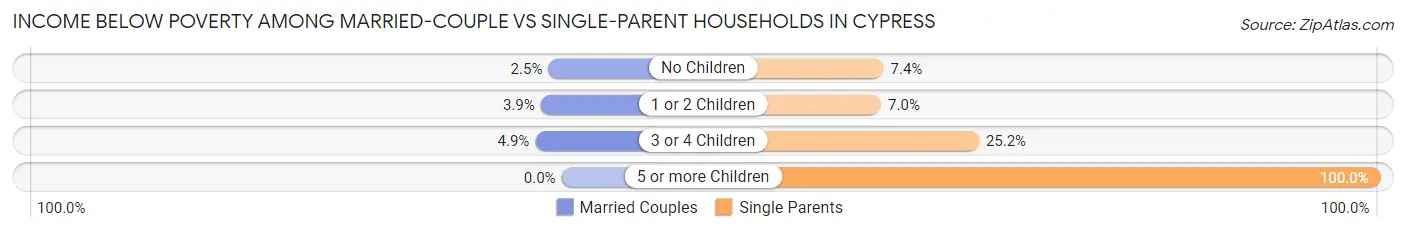
| Children | Married-Couple Families | Single-Parent Households |
| No Children | 123 (2.5%) | 131 (7.4%) |
| 1 or 2 Children | 160 (3.9%) | 72 (7.0%) |
| 3 or 4 Children | 30 (4.9%) | 31 (25.2%) |
| 5 or more Children | 0 (0.0%) | 18 (100.0%) |
| Total | 313 (3.2%) | 252 (8.6%) |
Race in Cypress
The most populous races in Cypress are White / Caucasian (20,526 | 41.1%), Asian (18,546 | 37.1%), and Hispanic or Latino (10,189 | 20.4%).
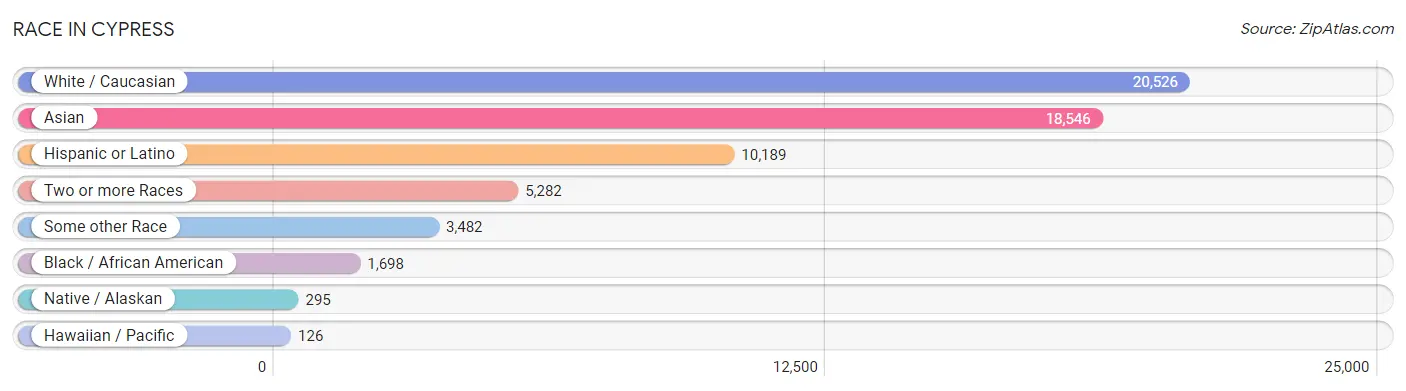
| Race | # Population | % Population |
| Asian | 18,546 | 37.1% |
| Black / African American | 1,698 | 3.4% |
| Hawaiian / Pacific | 126 | 0.3% |
| Hispanic or Latino | 10,189 | 20.4% |
| Native / Alaskan | 295 | 0.6% |
| White / Caucasian | 20,526 | 41.1% |
| Two or more Races | 5,282 | 10.6% |
| Some other Race | 3,482 | 7.0% |
| Total | 49,955 | 100.0% |
Ancestry in Cypress
The most populous ancestries reported in Cypress are Mexican (7,583 | 15.2%), Burmese (6,514 | 13.0%), German (3,480 | 7.0%), Korean (3,300 | 6.6%), and Thai (3,246 | 6.5%), together accounting for 48.3% of all Cypress residents.
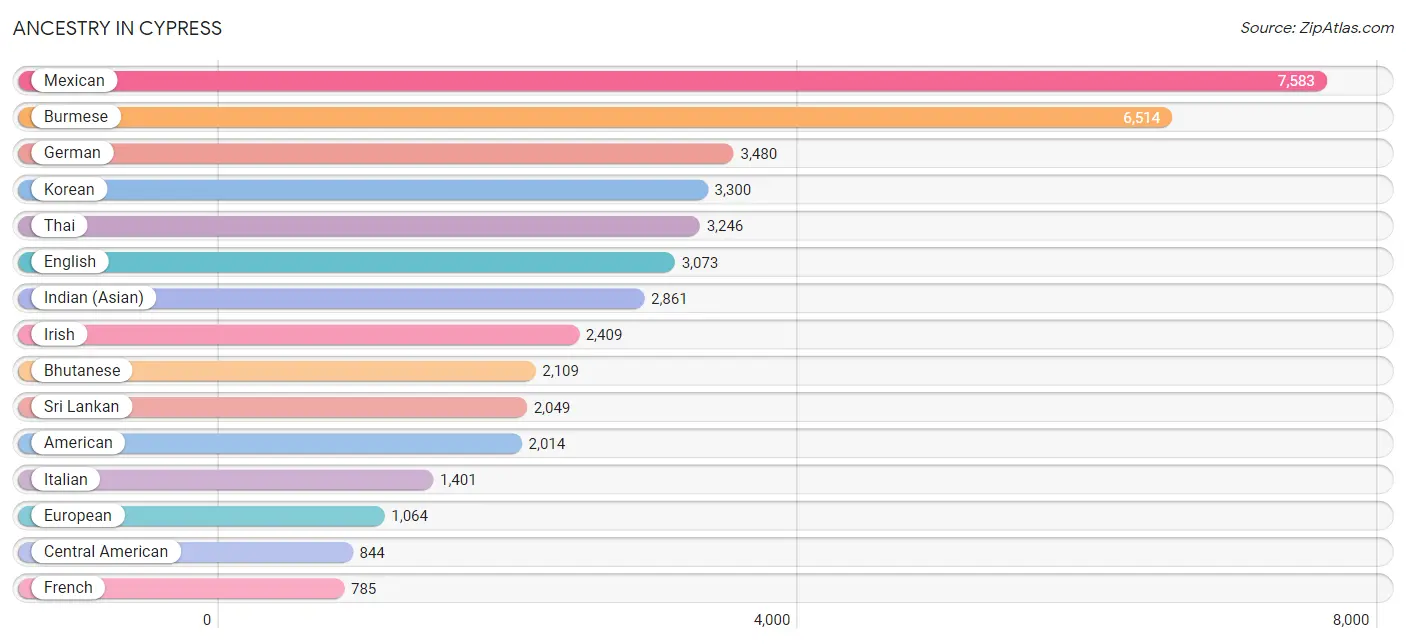
| Ancestry | # Population | % Population |
| Afghan | 26 | 0.1% |
| African | 72 | 0.1% |
| American | 2,014 | 4.0% |
| Apache | 27 | 0.1% |
| Arab | 673 | 1.3% |
| Argentinean | 130 | 0.3% |
| Armenian | 61 | 0.1% |
| Australian | 68 | 0.1% |
| Austrian | 26 | 0.1% |
| Bangladeshi | 39 | 0.1% |
| Belgian | 140 | 0.3% |
| Belizean | 54 | 0.1% |
| Bhutanese | 2,109 | 4.2% |
| Blackfeet | 33 | 0.1% |
| Brazilian | 35 | 0.1% |
| British | 380 | 0.8% |
| Burmese | 6,514 | 13.0% |
| Cambodian | 15 | 0.0% |
| Canadian | 43 | 0.1% |
| Central American | 844 | 1.7% |
| Central American Indian | 4 | 0.0% |
| Cherokee | 125 | 0.3% |
| Chippewa | 18 | 0.0% |
| Choctaw | 33 | 0.1% |
| Colombian | 217 | 0.4% |
| Costa Rican | 65 | 0.1% |
| Cree | 27 | 0.1% |
| Creek | 83 | 0.2% |
| Croatian | 8 | 0.0% |
| Cuban | 176 | 0.4% |
| Czech | 12 | 0.0% |
| Czechoslovakian | 35 | 0.1% |
| Danish | 105 | 0.2% |
| Dominican | 34 | 0.1% |
| Dutch | 741 | 1.5% |
| Eastern European | 61 | 0.1% |
| Ecuadorian | 136 | 0.3% |
| Egyptian | 188 | 0.4% |
| English | 3,073 | 6.1% |
| Ethiopian | 58 | 0.1% |
| European | 1,064 | 2.1% |
| Filipino | 706 | 1.4% |
| Finnish | 6 | 0.0% |
| French | 785 | 1.6% |
| French Canadian | 61 | 0.1% |
| German | 3,480 | 7.0% |
| Greek | 248 | 0.5% |
| Guamanian / Chamorro | 124 | 0.3% |
| Guatemalan | 263 | 0.5% |
| Honduran | 136 | 0.3% |
| Hungarian | 152 | 0.3% |
| Indian (Asian) | 2,861 | 5.7% |
| Iranian | 123 | 0.3% |
| Irish | 2,409 | 4.8% |
| Italian | 1,401 | 2.8% |
| Jamaican | 133 | 0.3% |
| Japanese | 110 | 0.2% |
| Jordanian | 5 | 0.0% |
| Kenyan | 19 | 0.0% |
| Korean | 3,300 | 6.6% |
| Laotian | 143 | 0.3% |
| Latvian | 4 | 0.0% |
| Lebanese | 317 | 0.6% |
| Mexican | 7,583 | 15.2% |
| Mexican American Indian | 100 | 0.2% |
| Mongolian | 8 | 0.0% |
| Moroccan | 16 | 0.0% |
| Native Hawaiian | 98 | 0.2% |
| Navajo | 82 | 0.2% |
| Nicaraguan | 142 | 0.3% |
| Nigerian | 97 | 0.2% |
| Northern European | 111 | 0.2% |
| Norwegian | 315 | 0.6% |
| Osage | 11 | 0.0% |
| Paiute | 5 | 0.0% |
| Pakistani | 174 | 0.4% |
| Palestinian | 75 | 0.2% |
| Pennsylvania German | 13 | 0.0% |
| Peruvian | 127 | 0.3% |
| Polish | 497 | 1.0% |
| Portuguese | 102 | 0.2% |
| Puerto Rican | 149 | 0.3% |
| Romanian | 19 | 0.0% |
| Russian | 278 | 0.6% |
| Salvadoran | 238 | 0.5% |
| Scandinavian | 32 | 0.1% |
| Scotch-Irish | 410 | 0.8% |
| Scottish | 653 | 1.3% |
| Serbian | 6 | 0.0% |
| Sioux | 58 | 0.1% |
| Slavic | 7 | 0.0% |
| Slovak | 18 | 0.0% |
| Slovene | 4 | 0.0% |
| South American | 610 | 1.2% |
| South American Indian | 50 | 0.1% |
| Spaniard | 173 | 0.4% |
| Spanish | 432 | 0.9% |
| Spanish American | 6 | 0.0% |
| Sri Lankan | 2,049 | 4.1% |
| Subsaharan African | 246 | 0.5% |
| Swedish | 588 | 1.2% |
| Swiss | 60 | 0.1% |
| Syrian | 17 | 0.0% |
| Thai | 3,246 | 6.5% |
| Ukrainian | 70 | 0.1% |
| Welsh | 112 | 0.2% | View All 106 Rows |
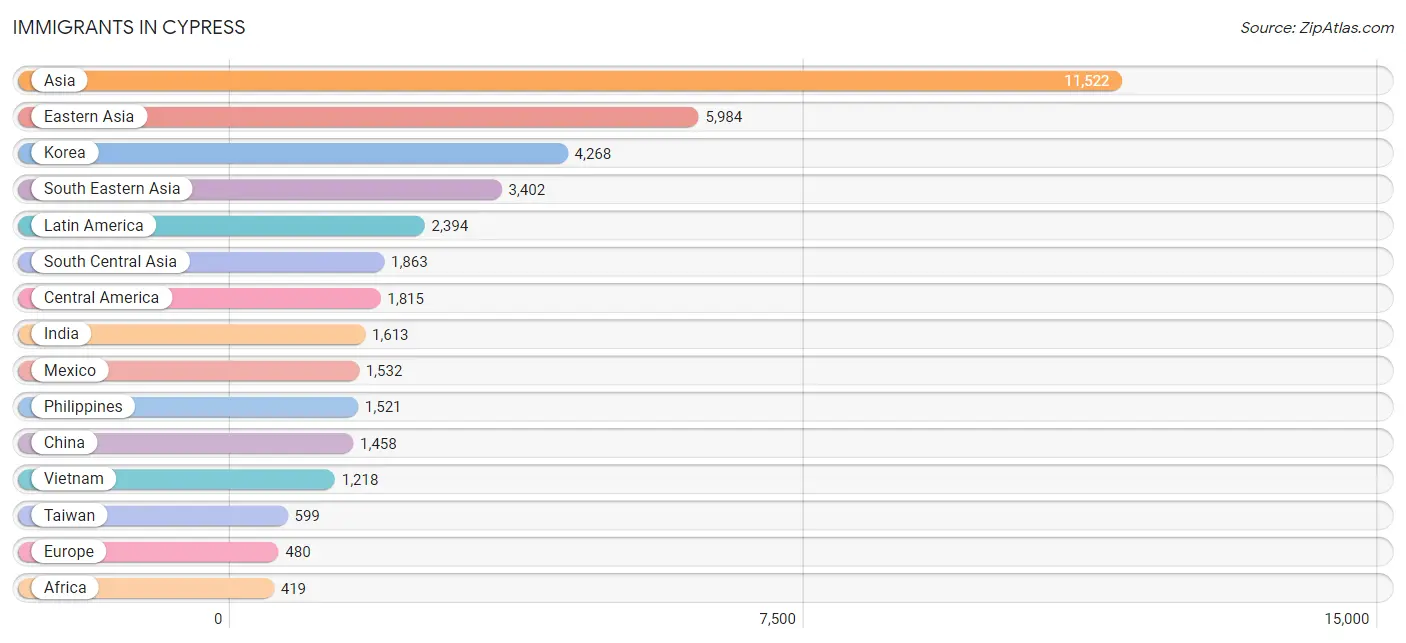
Immigrants in Cypress
The most numerous immigrant groups reported in Cypress came from Asia (11,522 | 23.1%), Eastern Asia (5,984 | 12.0%), Korea (4,268 | 8.5%), South Eastern Asia (3,402 | 6.8%), and Latin America (2,394 | 4.8%), together accounting for 55.2% of all Cypress residents.
| Immigration Origin | # Population | % Population |
| Afghanistan | 15 | 0.0% |
| Africa | 419 | 0.8% |
| Argentina | 84 | 0.2% |
| Asia | 11,522 | 23.1% |
| Barbados | 28 | 0.1% |
| Belize | 25 | 0.1% |
| Bolivia | 12 | 0.0% |
| Brazil | 62 | 0.1% |
| Cambodia | 265 | 0.5% |
| Canada | 100 | 0.2% |
| Caribbean | 165 | 0.3% |
| Central America | 1,815 | 3.6% |
| China | 1,458 | 2.9% |
| Colombia | 85 | 0.2% |
| Costa Rica | 25 | 0.1% |
| Cuba | 46 | 0.1% |
| Eastern Africa | 60 | 0.1% |
| Eastern Asia | 5,984 | 12.0% |
| Eastern Europe | 112 | 0.2% |
| Ecuador | 24 | 0.1% |
| Egypt | 141 | 0.3% |
| El Salvador | 55 | 0.1% |
| England | 84 | 0.2% |
| Eritrea | 9 | 0.0% |
| Ethiopia | 15 | 0.0% |
| Europe | 480 | 1.0% |
| Fiji | 31 | 0.1% |
| Germany | 76 | 0.2% |
| Greece | 28 | 0.1% |
| Guatemala | 61 | 0.1% |
| Guyana | 3 | 0.0% |
| Honduras | 113 | 0.2% |
| Hong Kong | 74 | 0.2% |
| Hungary | 20 | 0.0% |
| India | 1,613 | 3.2% |
| Indonesia | 134 | 0.3% |
| Iran | 124 | 0.3% |
| Ireland | 6 | 0.0% |
| Israel | 43 | 0.1% |
| Italy | 9 | 0.0% |
| Jamaica | 71 | 0.1% |
| Japan | 248 | 0.5% |
| Kenya | 36 | 0.1% |
| Korea | 4,268 | 8.5% |
| Laos | 51 | 0.1% |
| Latin America | 2,394 | 4.8% |
| Lebanon | 164 | 0.3% |
| Lithuania | 12 | 0.0% |
| Malaysia | 16 | 0.0% |
| Mexico | 1,532 | 3.1% |
| Morocco | 8 | 0.0% |
| Nepal | 14 | 0.0% |
| Netherlands | 62 | 0.1% |
| Nigeria | 58 | 0.1% |
| Northern Africa | 149 | 0.3% |
| Northern Europe | 143 | 0.3% |
| Oceania | 31 | 0.1% |
| Pakistan | 63 | 0.1% |
| Panama | 4 | 0.0% |
| Peru | 144 | 0.3% |
| Philippines | 1,521 | 3.0% |
| Poland | 5 | 0.0% |
| Russia | 60 | 0.1% |
| Saudi Arabia | 8 | 0.0% |
| Singapore | 63 | 0.1% |
| South Africa | 25 | 0.1% |
| South America | 414 | 0.8% |
| South Central Asia | 1,863 | 3.7% |
| South Eastern Asia | 3,402 | 6.8% |
| Southern Europe | 78 | 0.2% |
| Spain | 41 | 0.1% |
| Sri Lanka | 34 | 0.1% |
| Sweden | 11 | 0.0% |
| Switzerland | 9 | 0.0% |
| Syria | 17 | 0.0% |
| Taiwan | 599 | 1.2% |
| Thailand | 119 | 0.2% |
| Trinidad and Tobago | 20 | 0.0% |
| Ukraine | 15 | 0.0% |
| Vietnam | 1,218 | 2.4% |
| Western Africa | 58 | 0.1% |
| Western Asia | 232 | 0.5% |
| Western Europe | 147 | 0.3% | View All 83 Rows |
Sex and Age in Cypress
Sex and Age in Cypress
The most populous age groups in Cypress are 45 to 49 Years (2,093 | 8.6%) for men and 40 to 44 Years (1,891 | 7.4%) for women.
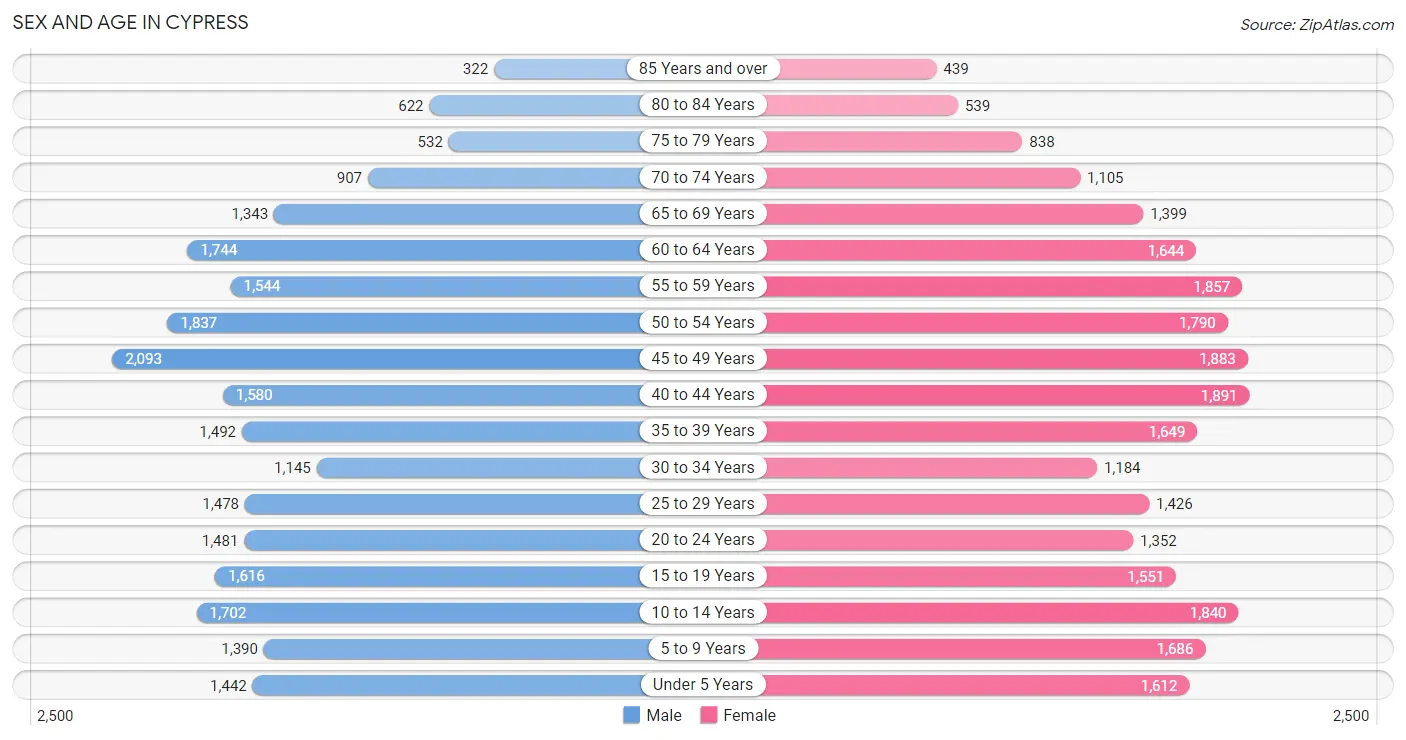
| Age Bracket | Male | Female |
| Under 5 Years | 1,442 (5.9%) | 1,612 (6.3%) |
| 5 to 9 Years | 1,390 (5.7%) | 1,686 (6.6%) |
| 10 to 14 Years | 1,702 (7.0%) | 1,840 (7.2%) |
| 15 to 19 Years | 1,616 (6.7%) | 1,551 (6.0%) |
| 20 to 24 Years | 1,481 (6.1%) | 1,352 (5.3%) |
| 25 to 29 Years | 1,478 (6.1%) | 1,426 (5.6%) |
| 30 to 34 Years | 1,145 (4.7%) | 1,184 (4.6%) |
| 35 to 39 Years | 1,492 (6.1%) | 1,649 (6.4%) |
| 40 to 44 Years | 1,580 (6.5%) | 1,891 (7.4%) |
| 45 to 49 Years | 2,093 (8.6%) | 1,883 (7.3%) |
| 50 to 54 Years | 1,837 (7.6%) | 1,790 (7.0%) |
| 55 to 59 Years | 1,544 (6.4%) | 1,857 (7.2%) |
| 60 to 64 Years | 1,744 (7.2%) | 1,644 (6.4%) |
| 65 to 69 Years | 1,343 (5.5%) | 1,399 (5.4%) |
| 70 to 74 Years | 907 (3.7%) | 1,105 (4.3%) |
| 75 to 79 Years | 532 (2.2%) | 838 (3.3%) |
| 80 to 84 Years | 622 (2.6%) | 539 (2.1%) |
| 85 Years and over | 322 (1.3%) | 439 (1.7%) |
| Total | 24,270 (100.0%) | 25,685 (100.0%) |
Families and Households in Cypress
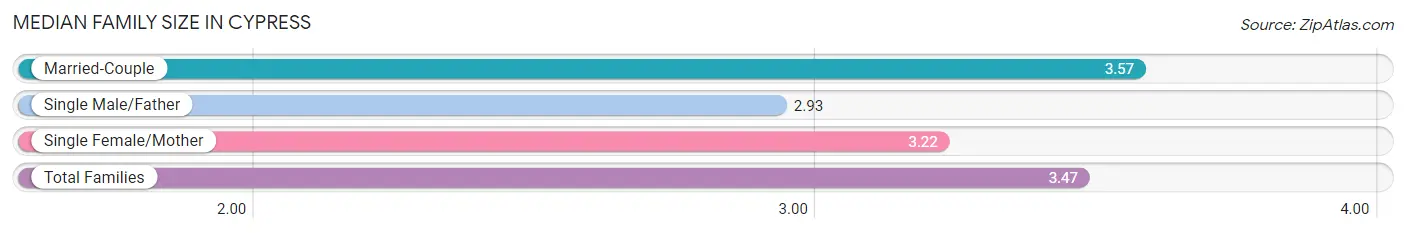
Median Family Size in Cypress
The median family size in Cypress is 3.47 persons per family, with married-couple families (9,795 | 76.9%) accounting for the largest median family size of 3.57 persons per family. On the other hand, single male/father families (732 | 5.8%) represent the smallest median family size with 2.93 persons per family.
| Family Type | # Families | Family Size |
| Married-Couple | 9,795 (76.9%) | 3.57 |
| Single Male/Father | 732 (5.8%) | 2.93 |
| Single Female/Mother | 2,203 (17.3%) | 3.22 |
| Total Families | 12,730 (100.0%) | 3.47 |
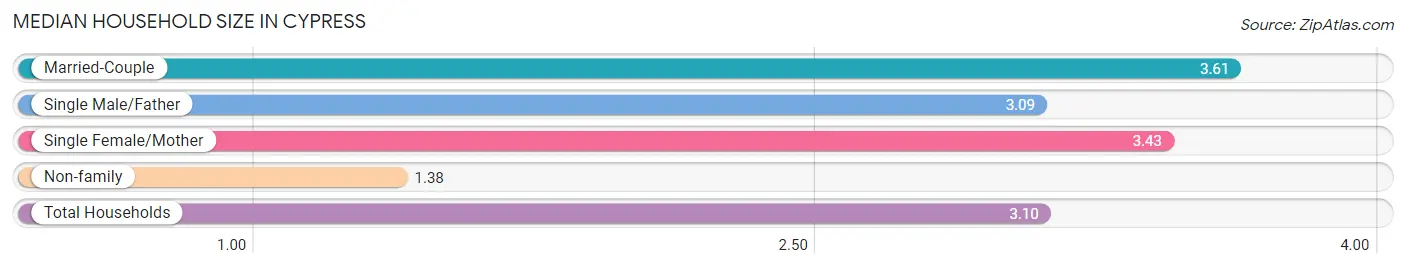
Median Household Size in Cypress
The median household size in Cypress is 3.10 persons per household, with married-couple households (9,795 | 61.1%) accounting for the largest median household size of 3.61 persons per household. non-family households (3,295 | 20.6%) represent the smallest median household size with 1.38 persons per household.
| Household Type | # Households | Household Size |
| Married-Couple | 9,795 (61.1%) | 3.61 |
| Single Male/Father | 732 (4.6%) | 3.09 |
| Single Female/Mother | 2,203 (13.8%) | 3.43 |
| Non-family | 3,295 (20.6%) | 1.38 |
| Total Households | 16,025 (100.0%) | 3.10 |
Household Size by Marriage Status in Cypress
Out of a total of 16,025 households in Cypress, 12,730 (79.4%) are family households, while 3,295 (20.6%) are nonfamily households. The most numerous type of family households are 2-person households, comprising 3,837, and the most common type of nonfamily households are 1-person households, comprising 2,415.
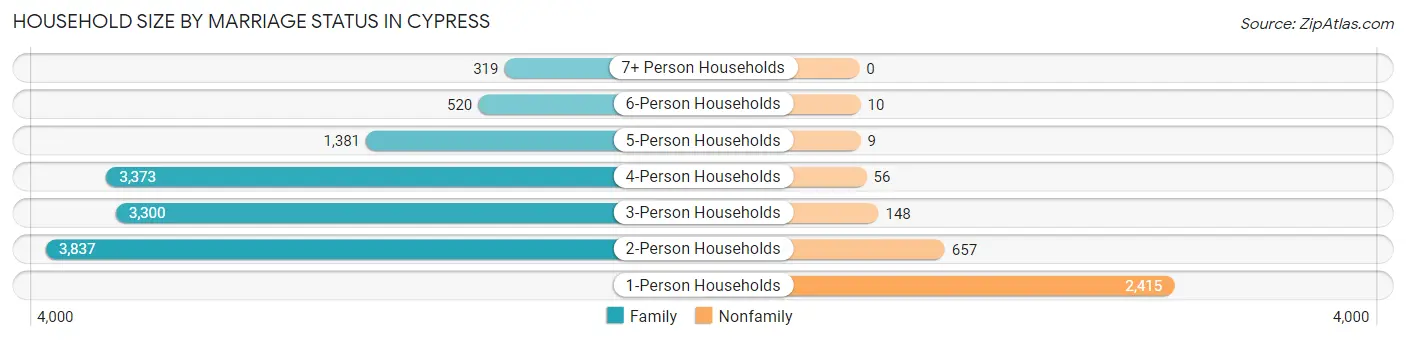
| Household Size | Family Households | Nonfamily Households |
| 1-Person Households | - | 2,415 (15.1%) |
| 2-Person Households | 3,837 (23.9%) | 657 (4.1%) |
| 3-Person Households | 3,300 (20.6%) | 148 (0.9%) |
| 4-Person Households | 3,373 (21.0%) | 56 (0.4%) |
| 5-Person Households | 1,381 (8.6%) | 9 (0.1%) |
| 6-Person Households | 520 (3.2%) | 10 (0.1%) |
| 7+ Person Households | 319 (2.0%) | 0 (0.0%) |
| Total | 12,730 (79.4%) | 3,295 (20.6%) |
Female Fertility in Cypress
Fertility by Age in Cypress
Average fertility rate in Cypress is 28.0 births per 1,000 women. Women in the age bracket of 35 to 50 years have the highest fertility rate with 34.0 births per 1,000 women. Women in the age bracket of 35 to 50 years acount for 59.9% of all women with births.
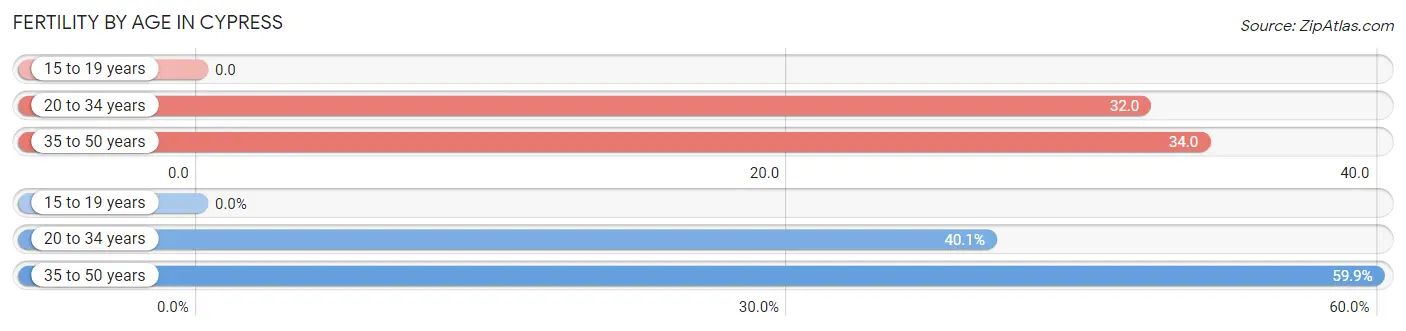
| Age Bracket | Women with Births | Births / 1,000 Women |
| 15 to 19 years | 0 (0.0%) | 0.0 |
| 20 to 34 years | 128 (40.1%) | 32.0 |
| 35 to 50 years | 191 (59.9%) | 34.0 |
| Total | 319 (100.0%) | 28.0 |
Fertility by Age by Marriage Status in Cypress
72.1% of women with births (319) in Cypress are married. The highest percentage of unmarried women with births falls into 20 to 34 years age bracket with 44.5% of them unmarried at the time of birth, while the lowest percentage of unmarried women with births belong to 35 to 50 years age bracket with 16.7% of them unmarried.
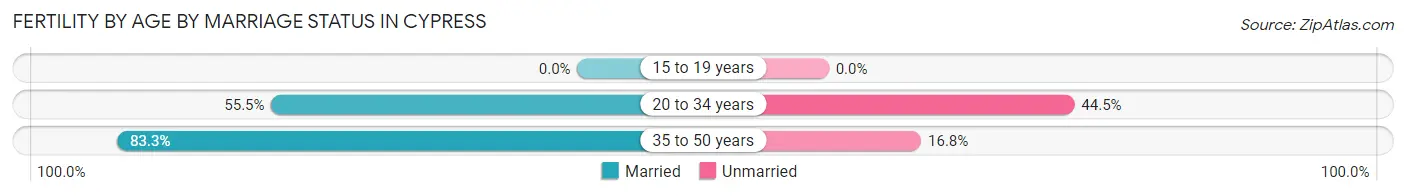
| Age Bracket | Married | Unmarried |
| 15 to 19 years | 0 (0.0%) | 0 (0.0%) |
| 20 to 34 years | 71 (55.5%) | 57 (44.5%) |
| 35 to 50 years | 159 (83.3%) | 32 (16.8%) |
| Total | 230 (72.1%) | 89 (27.9%) |
Fertility by Education in Cypress
Average fertility rate in Cypress is 28.0 births per 1,000 women. Women with the education attainment of less than high school have the highest fertility rate of 48.0 births per 1,000 women, while women with the education attainment of high school diploma have the lowest fertility at 6.0 births per 1,000 women. Women with the education attainment of bachelor's degree represent 38.2% of all women with births.
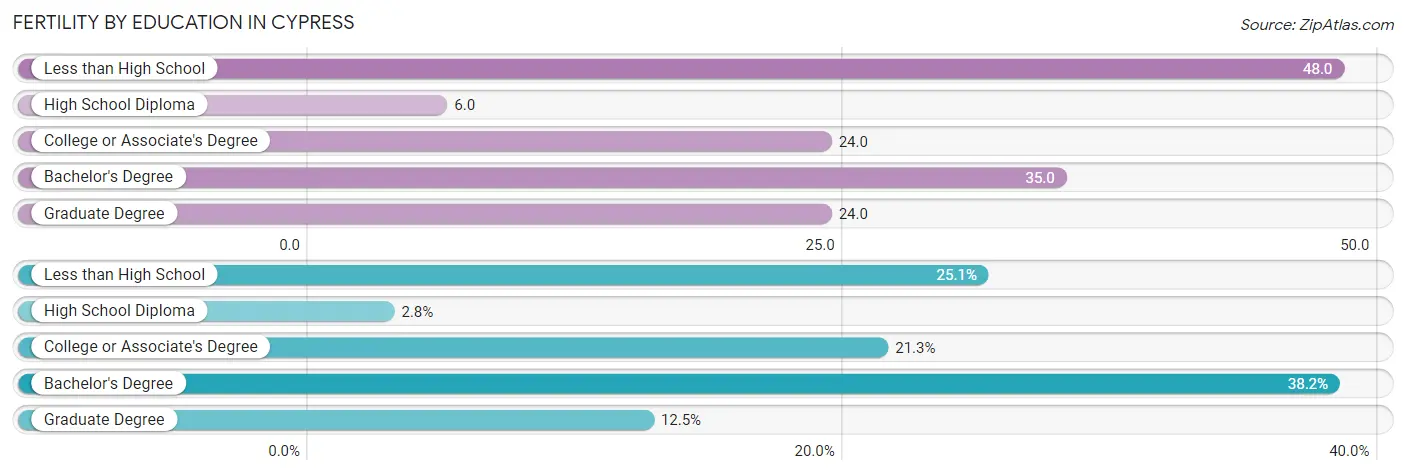
| Educational Attainment | Women with Births | Births / 1,000 Women |
| Less than High School | 80 (25.1%) | 48.0 |
| High School Diploma | 9 (2.8%) | 6.0 |
| College or Associate's Degree | 68 (21.3%) | 24.0 |
| Bachelor's Degree | 122 (38.2%) | 35.0 |
| Graduate Degree | 40 (12.5%) | 24.0 |
| Total | 319 (100.0%) | 28.0 |
Fertility by Education by Marriage Status in Cypress
27.9% of women with births in Cypress are unmarried. Women with the educational attainment of graduate degree are most likely to be married with 100.0% of them married at childbirth, while women with the educational attainment of high school diploma are least likely to be married with 100.0% of them unmarried at childbirth.
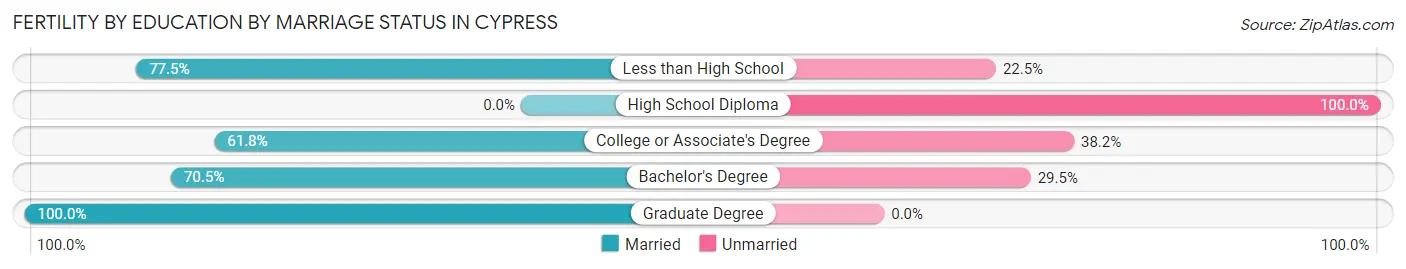
| Educational Attainment | Married | Unmarried |
| Less than High School | 62 (77.5%) | 18 (22.5%) |
| High School Diploma | 0 (0.0%) | 9 (100.0%) |
| College or Associate's Degree | 42 (61.8%) | 26 (38.2%) |
| Bachelor's Degree | 86 (70.5%) | 36 (29.5%) |
| Graduate Degree | 40 (100.0%) | 0 (0.0%) |
| Total | 230 (72.1%) | 89 (27.9%) |
Employment Characteristics in Cypress
Employment by Class of Employer in Cypress
Among the 23,536 employed individuals in Cypress, private company employees (15,693 | 66.7%), local government employees (2,507 | 10.6%), and self-employed (not incorporated) (1,738 | 7.4%) make up the most common classes of employment.
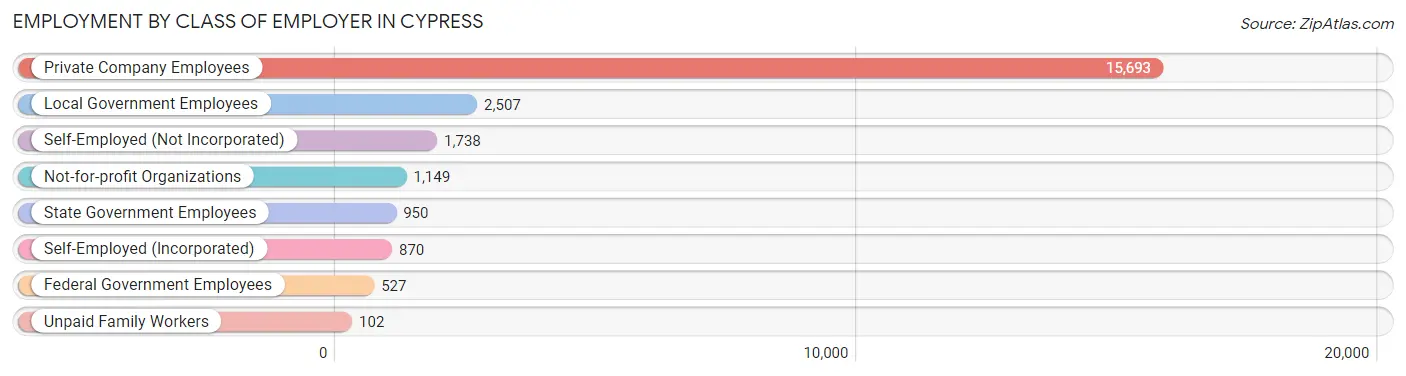
| Employer Class | # Employees | % Employees |
| Private Company Employees | 15,693 | 66.7% |
| Self-Employed (Incorporated) | 870 | 3.7% |
| Self-Employed (Not Incorporated) | 1,738 | 7.4% |
| Not-for-profit Organizations | 1,149 | 4.9% |
| Local Government Employees | 2,507 | 10.6% |
| State Government Employees | 950 | 4.0% |
| Federal Government Employees | 527 | 2.2% |
| Unpaid Family Workers | 102 | 0.4% |
| Total | 23,536 | 100.0% |
Employment Status by Age in Cypress
According to the labor force statistics for Cypress, out of the total population over 16 years of age (39,778), 63.7% or 25,339 individuals are in the labor force, with 5.1% or 1,292 of them unemployed. The age group with the highest labor force participation rate is 25 to 29 years, with 85.6% or 2,486 individuals in the labor force. Within the labor force, the 16 to 19 years age range has the highest percentage of unemployed individuals, with 21.8% or 186 of them being unemployed.
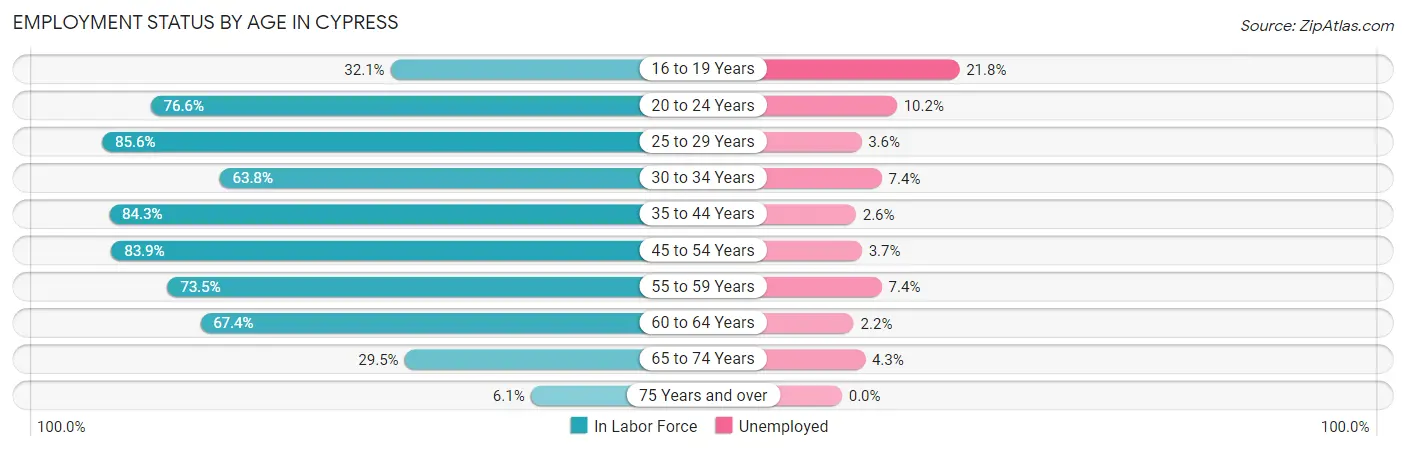
| Age Bracket | In Labor Force | Unemployed |
| 16 to 19 Years | 855 (32.1%) | 186 (21.8%) |
| 20 to 24 Years | 2,170 (76.6%) | 221 (10.2%) |
| 25 to 29 Years | 2,486 (85.6%) | 89 (3.6%) |
| 30 to 34 Years | 1,486 (63.8%) | 110 (7.4%) |
| 35 to 44 Years | 5,574 (84.3%) | 145 (2.6%) |
| 45 to 54 Years | 6,379 (83.9%) | 236 (3.7%) |
| 55 to 59 Years | 2,500 (73.5%) | 185 (7.4%) |
| 60 to 64 Years | 2,284 (67.4%) | 50 (2.2%) |
| 65 to 74 Years | 1,402 (29.5%) | 60 (4.3%) |
| 75 Years and over | 201 (6.1%) | 0 (0.0%) |
| Total | 25,339 (63.7%) | 1,292 (5.1%) |
Employment Status by Educational Attainment in Cypress
According to labor force statistics for Cypress, 78.9% of individuals (20,701) out of the total population between 25 and 64 years of age (26,237) are in the labor force, with 3.9% or 807 of them being unemployed. The group with the highest labor force participation rate are those with the educational attainment of bachelor's degree or higher, with 85.9% or 11,627 individuals in the labor force. Within the labor force, individuals with less than high school education have the highest percentage of unemployment, with 8.3% or 111 of them being unemployed.
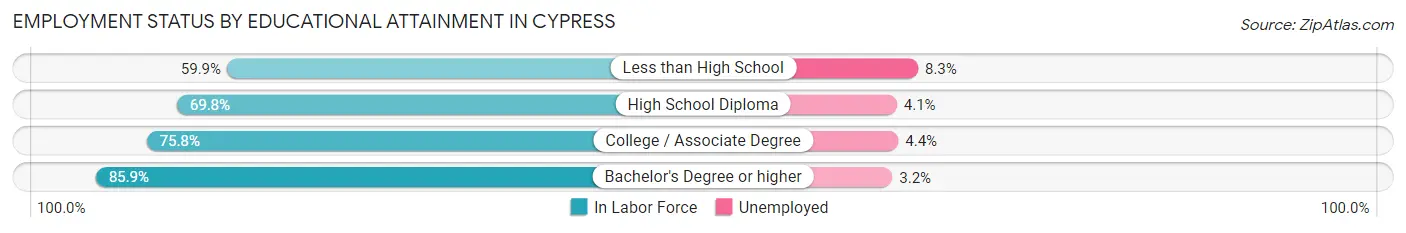
| Educational Attainment | In Labor Force | Unemployed |
| Less than High School | 1,336 (59.9%) | 185 (8.3%) |
| High School Diploma | 2,342 (69.8%) | 138 (4.1%) |
| College / Associate Degree | 5,393 (75.8%) | 313 (4.4%) |
| Bachelor's Degree or higher | 11,627 (85.9%) | 433 (3.2%) |
| Total | 20,701 (78.9%) | 1,023 (3.9%) |
Employment Occupations by Sex in Cypress
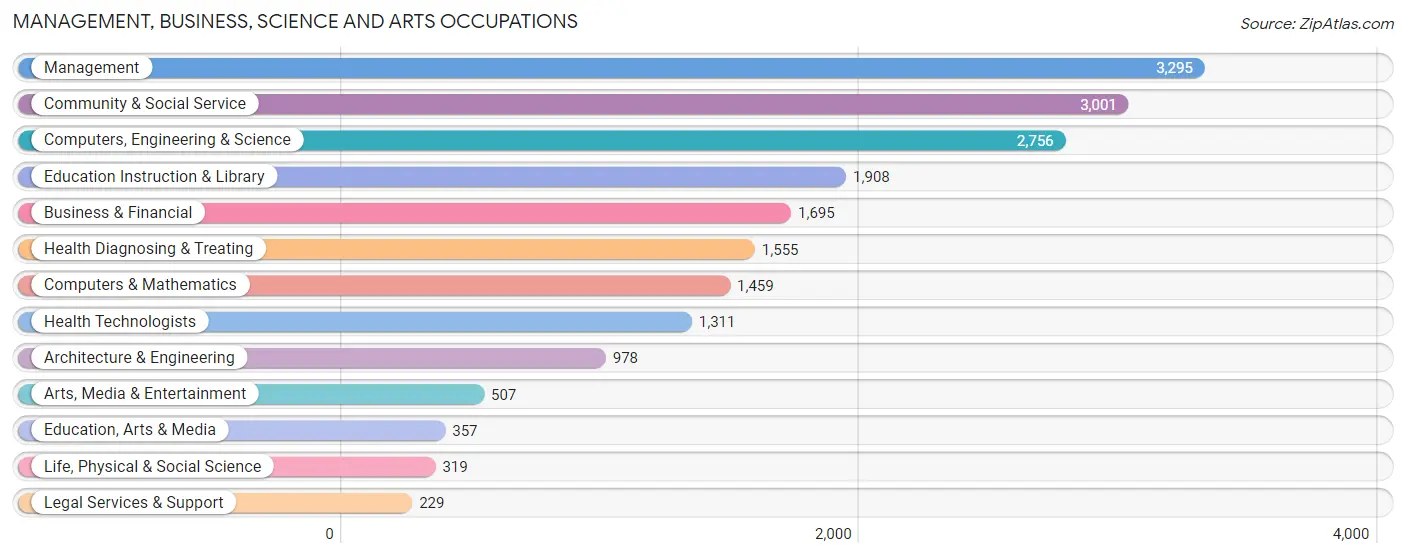
Management, Business, Science and Arts Occupations
The most common Management, Business, Science and Arts occupations in Cypress are Management (3,295 | 13.8%), Community & Social Service (3,001 | 12.5%), Computers, Engineering & Science (2,756 | 11.5%), Education Instruction & Library (1,908 | 8.0%), and Business & Financial (1,695 | 7.1%).
Management, Business, Science and Arts Occupations by Sex
Within the Management, Business, Science and Arts occupations in Cypress, the most male-oriented occupations are Architecture & Engineering (82.6%), Computers & Mathematics (70.2%), and Computers, Engineering & Science (69.1%), while the most female-oriented occupations are Life, Physical & Social Science (77.7%), Legal Services & Support (68.6%), and Education Instruction & Library (63.0%).
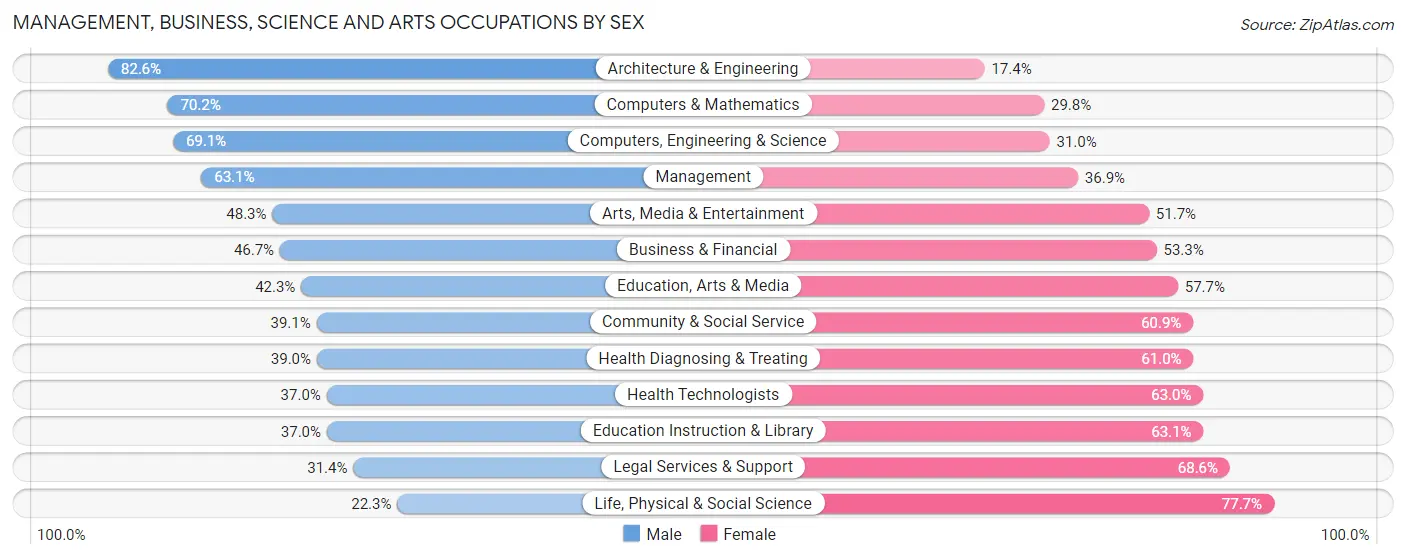
| Occupation | Male | Female |
| Management | 2,080 (63.1%) | 1,215 (36.9%) |
| Business & Financial | 792 (46.7%) | 903 (53.3%) |
| Computers, Engineering & Science | 1,903 (69.1%) | 853 (30.9%) |
| Computers & Mathematics | 1,024 (70.2%) | 435 (29.8%) |
| Architecture & Engineering | 808 (82.6%) | 170 (17.4%) |
| Life, Physical & Social Science | 71 (22.3%) | 248 (77.7%) |
| Community & Social Service | 1,173 (39.1%) | 1,828 (60.9%) |
| Education, Arts & Media | 151 (42.3%) | 206 (57.7%) |
| Legal Services & Support | 72 (31.4%) | 157 (68.6%) |
| Education Instruction & Library | 705 (36.9%) | 1,203 (63.0%) |
| Arts, Media & Entertainment | 245 (48.3%) | 262 (51.7%) |
| Health Diagnosing & Treating | 607 (39.0%) | 948 (61.0%) |
| Health Technologists | 485 (37.0%) | 826 (63.0%) |
| Total (Category) | 6,555 (53.3%) | 5,747 (46.7%) |
| Total (Overall) | 12,821 (53.5%) | 11,147 (46.5%) |
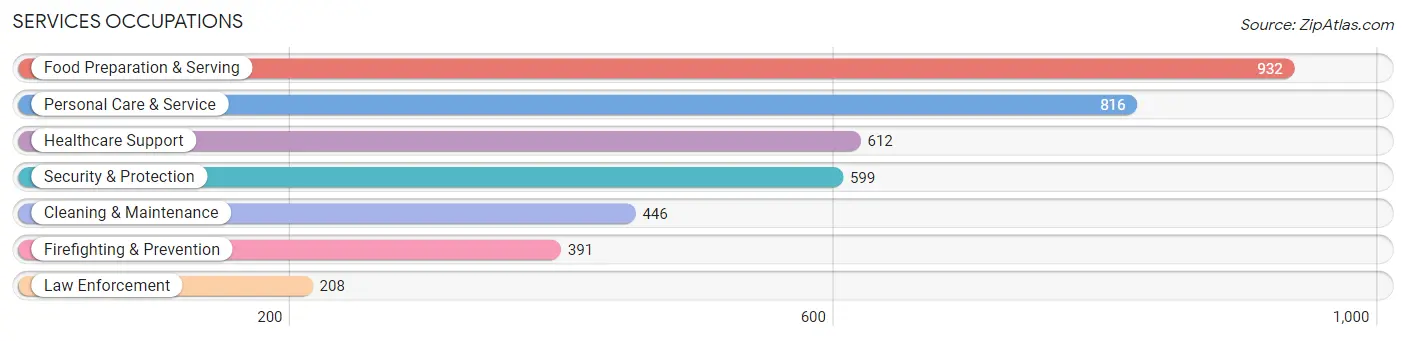
Services Occupations
The most common Services occupations in Cypress are Food Preparation & Serving (932 | 3.9%), Personal Care & Service (816 | 3.4%), Healthcare Support (612 | 2.5%), Security & Protection (599 | 2.5%), and Cleaning & Maintenance (446 | 1.9%).
Services Occupations by Sex
Within the Services occupations in Cypress, the most male-oriented occupations are Firefighting & Prevention (86.7%), Security & Protection (86.3%), and Law Enforcement (85.6%), while the most female-oriented occupations are Healthcare Support (79.9%), Personal Care & Service (71.3%), and Cleaning & Maintenance (59.6%).
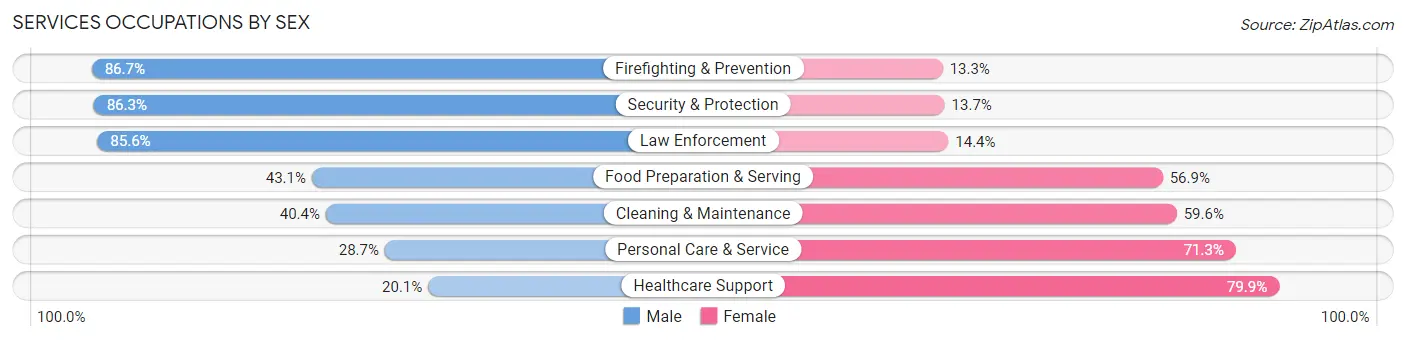
| Occupation | Male | Female |
| Healthcare Support | 123 (20.1%) | 489 (79.9%) |
| Security & Protection | 517 (86.3%) | 82 (13.7%) |
| Firefighting & Prevention | 339 (86.7%) | 52 (13.3%) |
| Law Enforcement | 178 (85.6%) | 30 (14.4%) |
| Food Preparation & Serving | 402 (43.1%) | 530 (56.9%) |
| Cleaning & Maintenance | 180 (40.4%) | 266 (59.6%) |
| Personal Care & Service | 234 (28.7%) | 582 (71.3%) |
| Total (Category) | 1,456 (42.8%) | 1,949 (57.2%) |
| Total (Overall) | 12,821 (53.5%) | 11,147 (46.5%) |
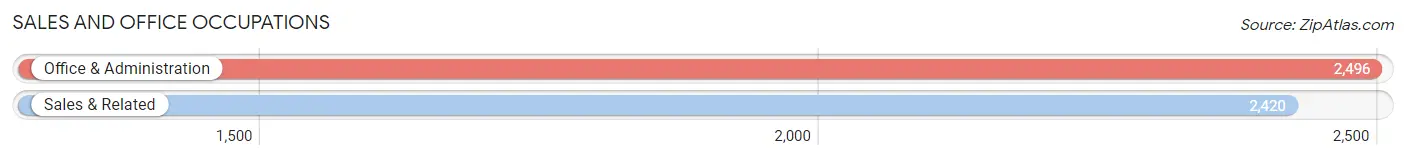
Sales and Office Occupations
The most common Sales and Office occupations in Cypress are Office & Administration (2,496 | 10.4%), and Sales & Related (2,420 | 10.1%).
Sales and Office Occupations by Sex
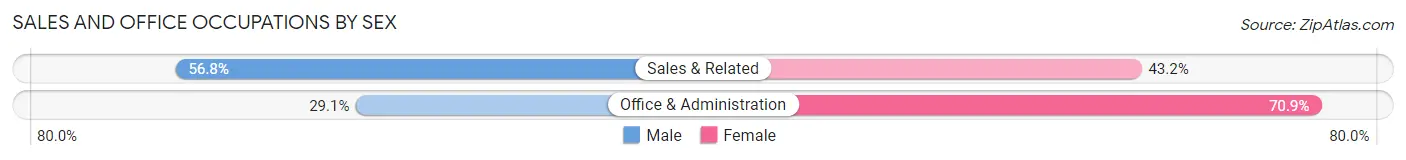
| Occupation | Male | Female |
| Sales & Related | 1,374 (56.8%) | 1,046 (43.2%) |
| Office & Administration | 727 (29.1%) | 1,769 (70.9%) |
| Total (Category) | 2,101 (42.7%) | 2,815 (57.3%) |
| Total (Overall) | 12,821 (53.5%) | 11,147 (46.5%) |
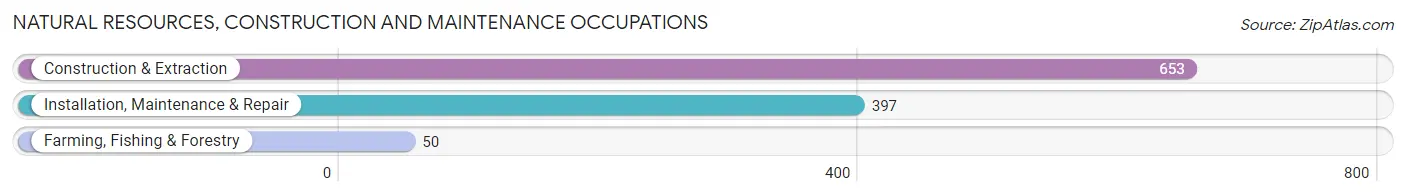
Natural Resources, Construction and Maintenance Occupations
The most common Natural Resources, Construction and Maintenance occupations in Cypress are Construction & Extraction (653 | 2.7%), Installation, Maintenance & Repair (397 | 1.7%), and Farming, Fishing & Forestry (50 | 0.2%).
Natural Resources, Construction and Maintenance Occupations by Sex
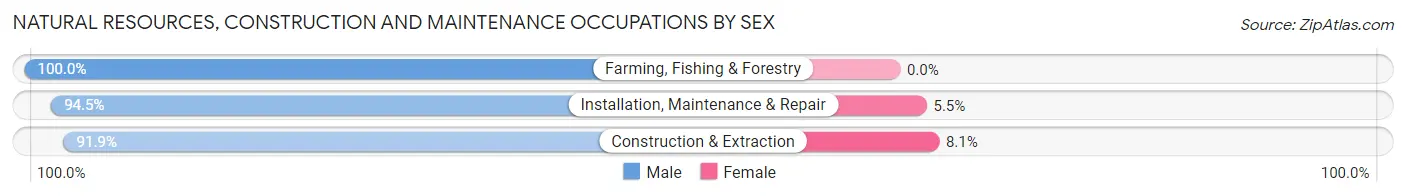
| Occupation | Male | Female |
| Farming, Fishing & Forestry | 50 (100.0%) | 0 (0.0%) |
| Construction & Extraction | 600 (91.9%) | 53 (8.1%) |
| Installation, Maintenance & Repair | 375 (94.5%) | 22 (5.5%) |
| Total (Category) | 1,025 (93.2%) | 75 (6.8%) |
| Total (Overall) | 12,821 (53.5%) | 11,147 (46.5%) |
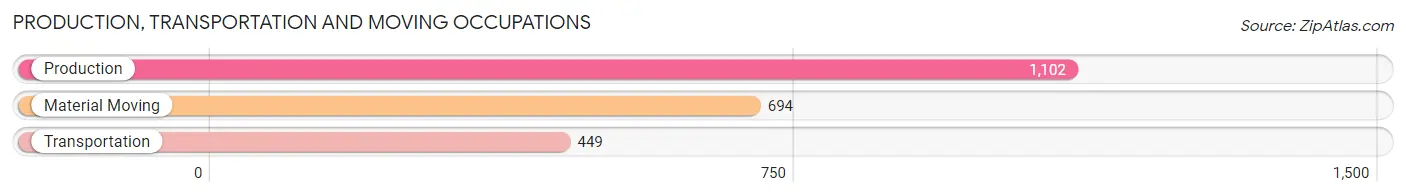
Production, Transportation and Moving Occupations
The most common Production, Transportation and Moving occupations in Cypress are Production (1,102 | 4.6%), Material Moving (694 | 2.9%), and Transportation (449 | 1.9%).
Production, Transportation and Moving Occupations by Sex
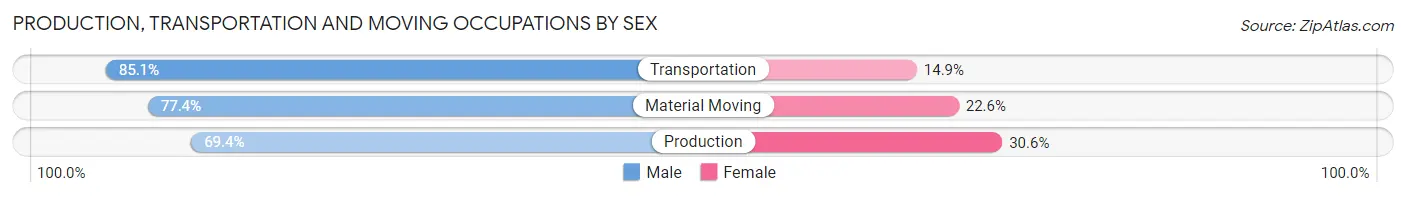
| Occupation | Male | Female |
| Production | 765 (69.4%) | 337 (30.6%) |
| Transportation | 382 (85.1%) | 67 (14.9%) |
| Material Moving | 537 (77.4%) | 157 (22.6%) |
| Total (Category) | 1,684 (75.0%) | 561 (25.0%) |
| Total (Overall) | 12,821 (53.5%) | 11,147 (46.5%) |
Employment Industries by Sex in Cypress
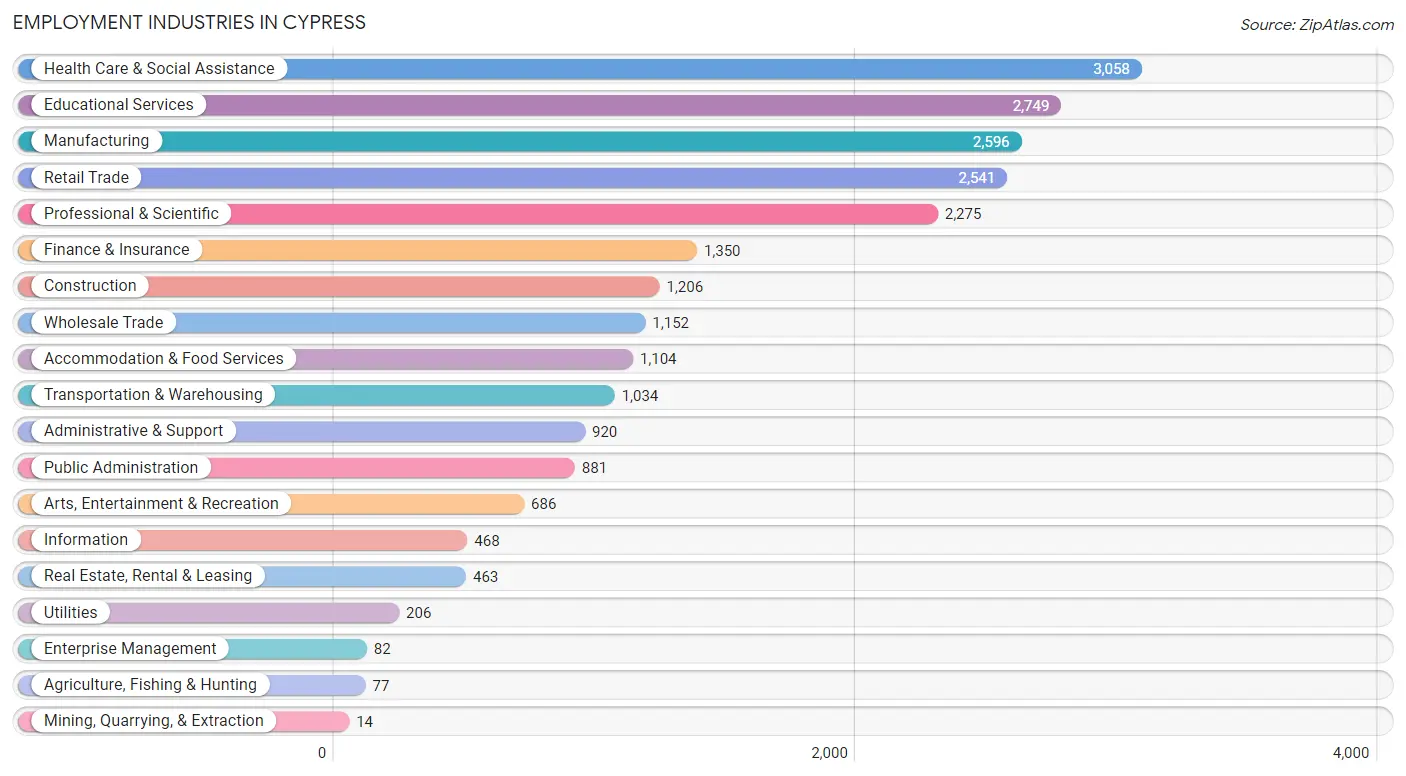
Employment Industries in Cypress
The major employment industries in Cypress include Health Care & Social Assistance (3,058 | 12.8%), Educational Services (2,749 | 11.5%), Manufacturing (2,596 | 10.8%), Retail Trade (2,541 | 10.6%), and Professional & Scientific (2,275 | 9.5%).
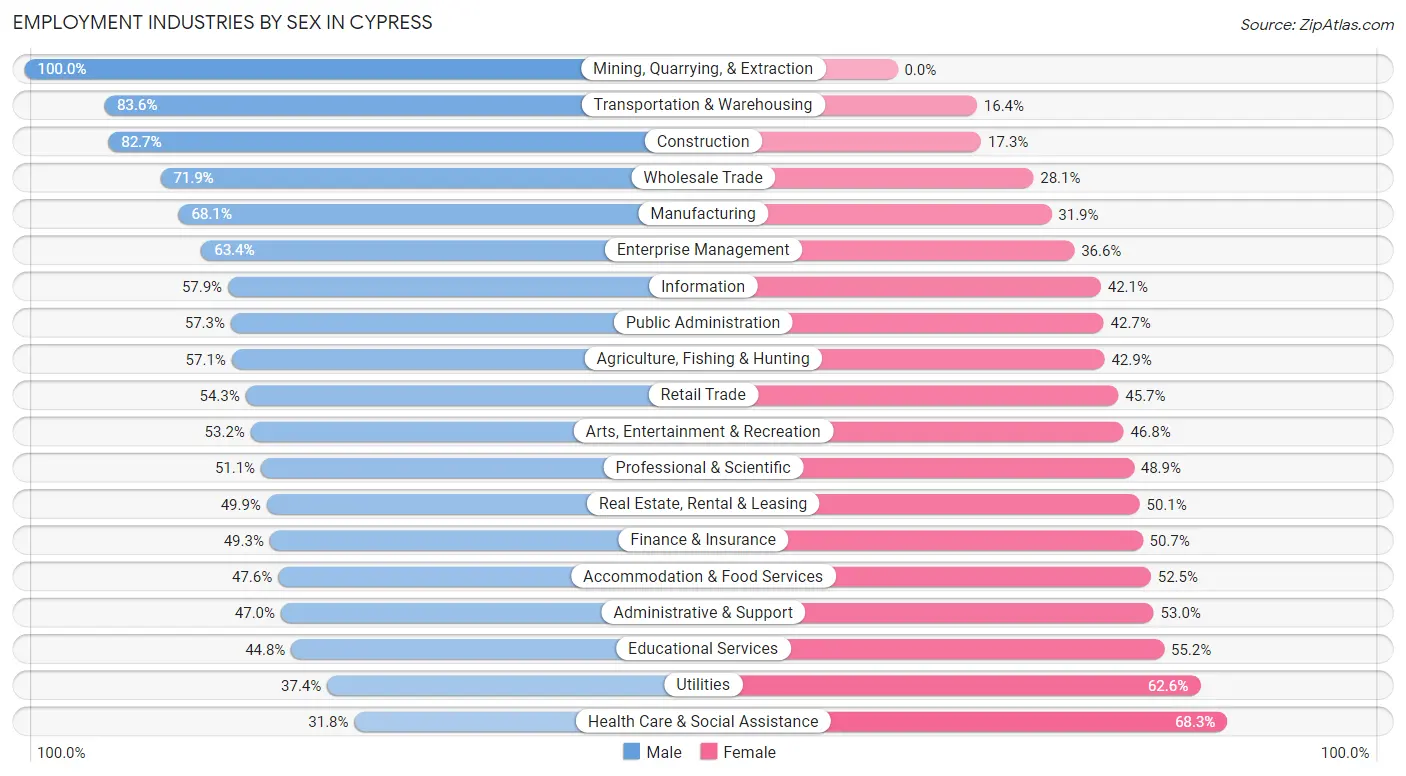
Employment Industries by Sex in Cypress
The Cypress industries that see more men than women are Mining, Quarrying, & Extraction (100.0%), Transportation & Warehousing (83.6%), and Construction (82.7%), whereas the industries that tend to have a higher number of women are Health Care & Social Assistance (68.2%), Utilities (62.6%), and Educational Services (55.2%).
| Industry | Male | Female |
| Agriculture, Fishing & Hunting | 44 (57.1%) | 33 (42.9%) |
| Mining, Quarrying, & Extraction | 14 (100.0%) | 0 (0.0%) |
| Construction | 997 (82.7%) | 209 (17.3%) |
| Manufacturing | 1,769 (68.1%) | 827 (31.9%) |
| Wholesale Trade | 828 (71.9%) | 324 (28.1%) |
| Retail Trade | 1,379 (54.3%) | 1,162 (45.7%) |
| Transportation & Warehousing | 864 (83.6%) | 170 (16.4%) |
| Utilities | 77 (37.4%) | 129 (62.6%) |
| Information | 271 (57.9%) | 197 (42.1%) |
| Finance & Insurance | 665 (49.3%) | 685 (50.7%) |
| Real Estate, Rental & Leasing | 231 (49.9%) | 232 (50.1%) |
| Professional & Scientific | 1,162 (51.1%) | 1,113 (48.9%) |
| Enterprise Management | 52 (63.4%) | 30 (36.6%) |
| Administrative & Support | 432 (47.0%) | 488 (53.0%) |
| Educational Services | 1,232 (44.8%) | 1,517 (55.2%) |
| Health Care & Social Assistance | 971 (31.8%) | 2,087 (68.2%) |
| Arts, Entertainment & Recreation | 365 (53.2%) | 321 (46.8%) |
| Accommodation & Food Services | 525 (47.5%) | 579 (52.4%) |
| Public Administration | 505 (57.3%) | 376 (42.7%) |
| Total | 12,821 (53.5%) | 11,147 (46.5%) |
Education in Cypress
School Enrollment in Cypress
The most common levels of schooling among the 13,130 students in Cypress are college / undergraduate (2,917 | 22.2%), middle school (2,778 | 21.2%), and high school (2,648 | 20.2%).
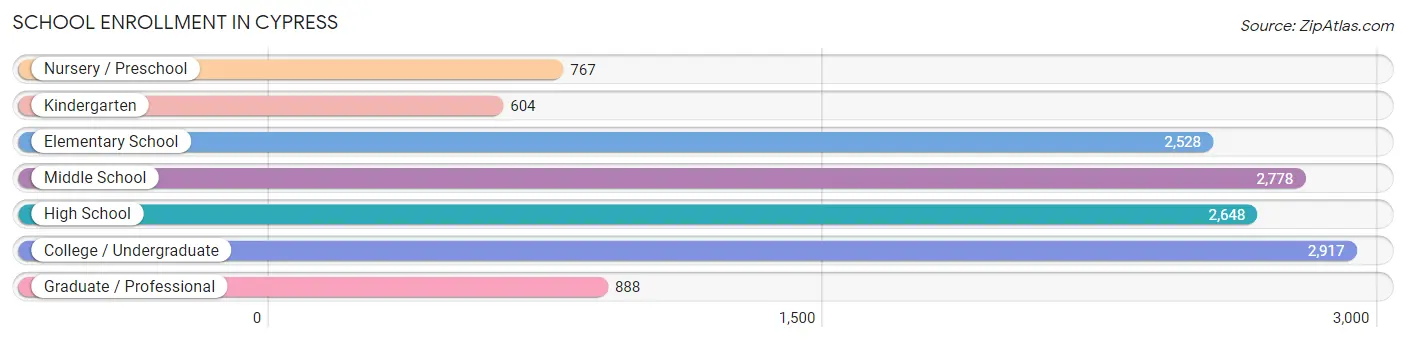
| School Level | # Students | % Students |
| Nursery / Preschool | 767 | 5.8% |
| Kindergarten | 604 | 4.6% |
| Elementary School | 2,528 | 19.3% |
| Middle School | 2,778 | 21.2% |
| High School | 2,648 | 20.2% |
| College / Undergraduate | 2,917 | 22.2% |
| Graduate / Professional | 888 | 6.8% |
| Total | 13,130 | 100.0% |
School Enrollment by Age by Funding Source in Cypress
Out of a total of 13,130 students who are enrolled in schools in Cypress, 1,930 (14.7%) attend a private institution, while the remaining 11,200 (85.3%) are enrolled in public schools. The age group of 3 to 4 year olds has the highest likelihood of being enrolled in private schools, with 435 (59.5% in the age bracket) enrolled. Conversely, the age group of 15 to 17 year olds has the lowest likelihood of being enrolled in a private school, with 1,811 (96.4% in the age bracket) attending a public institution.
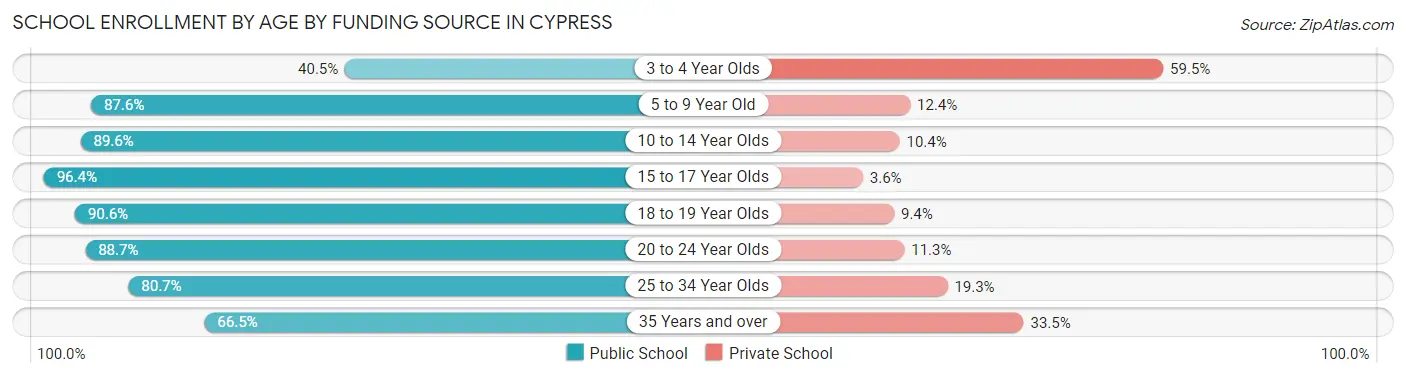
| Age Bracket | Public School | Private School |
| 3 to 4 Year Olds | 296 (40.5%) | 435 (59.5%) |
| 5 to 9 Year Old | 2,523 (87.6%) | 356 (12.4%) |
| 10 to 14 Year Olds | 3,107 (89.6%) | 361 (10.4%) |
| 15 to 17 Year Olds | 1,811 (96.4%) | 67 (3.6%) |
| 18 to 19 Year Olds | 928 (90.6%) | 96 (9.4%) |
| 20 to 24 Year Olds | 1,186 (88.7%) | 151 (11.3%) |
| 25 to 34 Year Olds | 822 (80.7%) | 197 (19.3%) |
| 35 Years and over | 528 (66.5%) | 266 (33.5%) |
| Total | 11,200 (85.3%) | 1,930 (14.7%) |
Educational Attainment by Field of Study in Cypress
Business (3,524 | 20.0%), engineering (2,297 | 13.0%), science & technology (1,605 | 9.1%), social sciences (1,449 | 8.2%), and computers & mathematics (1,284 | 7.3%) are the most common fields of study among 17,620 individuals in Cypress who have obtained a bachelor's degree or higher.
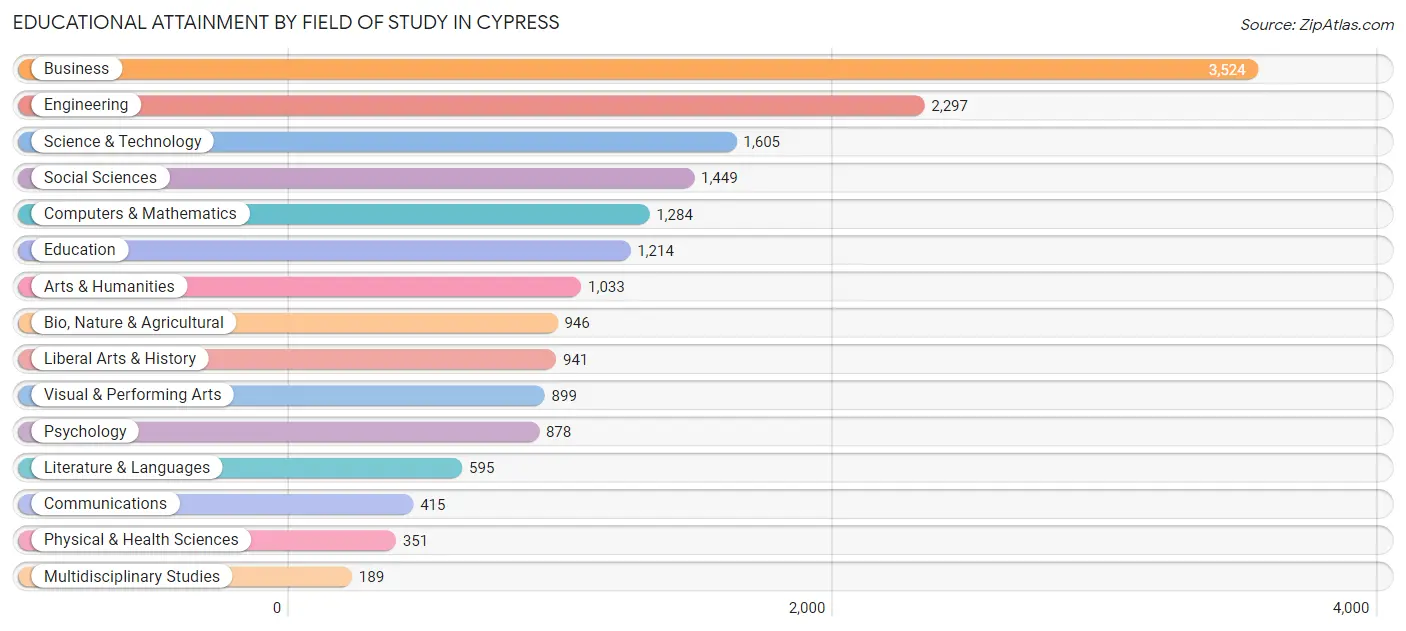
| Field of Study | # Graduates | % Graduates |
| Computers & Mathematics | 1,284 | 7.3% |
| Bio, Nature & Agricultural | 946 | 5.4% |
| Physical & Health Sciences | 351 | 2.0% |
| Psychology | 878 | 5.0% |
| Social Sciences | 1,449 | 8.2% |
| Engineering | 2,297 | 13.0% |
| Multidisciplinary Studies | 189 | 1.1% |
| Science & Technology | 1,605 | 9.1% |
| Business | 3,524 | 20.0% |
| Education | 1,214 | 6.9% |
| Literature & Languages | 595 | 3.4% |
| Liberal Arts & History | 941 | 5.3% |
| Visual & Performing Arts | 899 | 5.1% |
| Communications | 415 | 2.4% |
| Arts & Humanities | 1,033 | 5.9% |
| Total | 17,620 | 100.0% |
Transportation & Commute in Cypress
Vehicle Availability by Sex in Cypress
The most prevalent vehicle ownership categories in Cypress are males with 2 vehicles (5,223, accounting for 41.6%) and females with 2 vehicles (4,143, making up 47.9%).
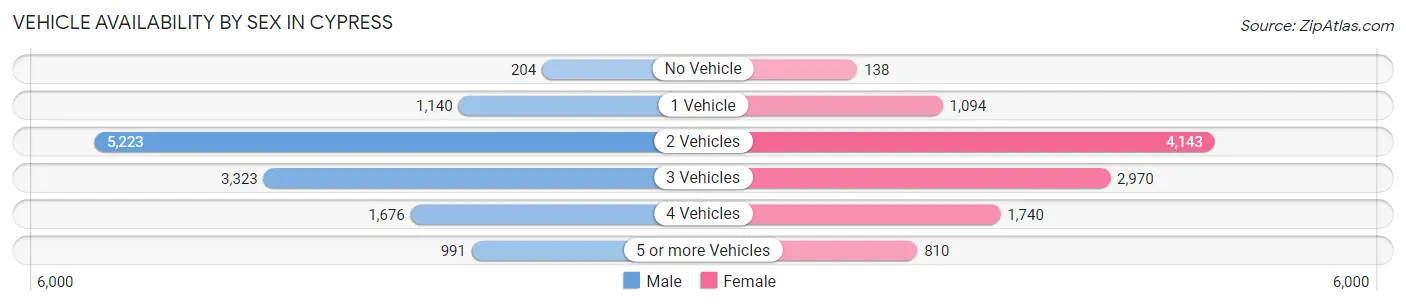
| Vehicles Available | Male | Female |
| No Vehicle | 204 (1.6%) | 138 (1.3%) |
| 1 Vehicle | 1,140 (9.1%) | 1,094 (10.0%) |
| 2 Vehicles | 5,223 (41.6%) | 4,143 (38.0%) |
| 3 Vehicles | 3,323 (26.5%) | 2,970 (27.3%) |
| 4 Vehicles | 1,676 (13.4%) | 1,740 (16.0%) |
| 5 or more Vehicles | 991 (7.9%) | 810 (7.4%) |
| Total | 12,557 (100.0%) | 10,895 (100.0%) |
Commute Time in Cypress
The most frequently occuring commute durations in Cypress are 30 to 34 minutes (3,352 commuters, 17.0%), 20 to 24 minutes (2,647 commuters, 13.4%), and 15 to 19 minutes (2,410 commuters, 12.2%).
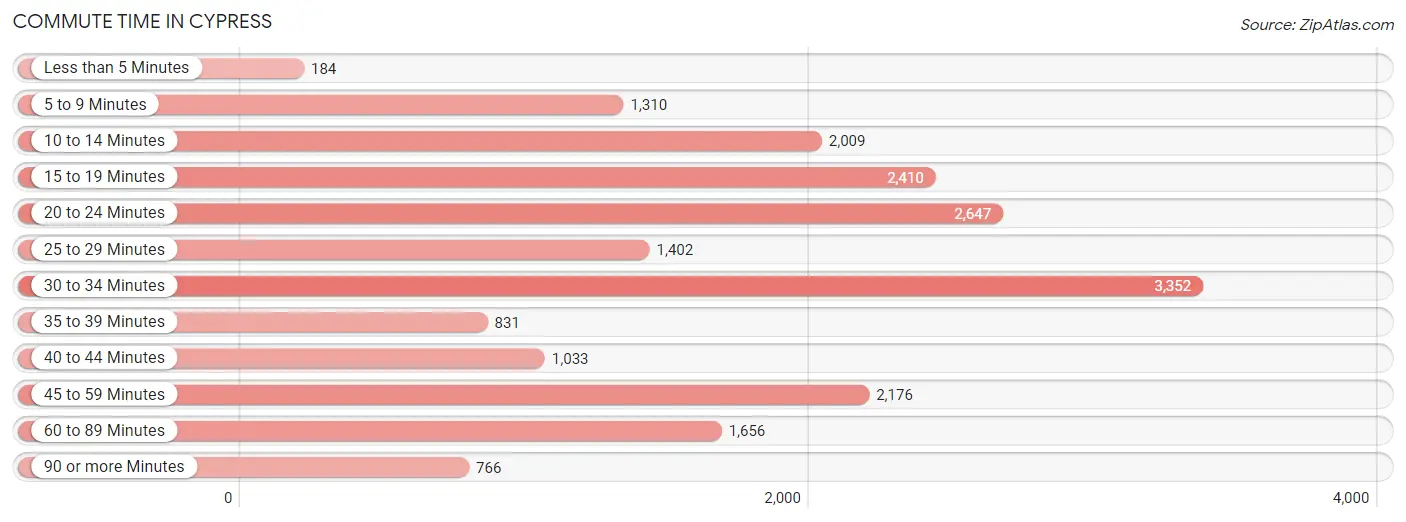
| Commute Time | # Commuters | % Commuters |
| Less than 5 Minutes | 184 | 0.9% |
| 5 to 9 Minutes | 1,310 | 6.6% |
| 10 to 14 Minutes | 2,009 | 10.2% |
| 15 to 19 Minutes | 2,410 | 12.2% |
| 20 to 24 Minutes | 2,647 | 13.4% |
| 25 to 29 Minutes | 1,402 | 7.1% |
| 30 to 34 Minutes | 3,352 | 17.0% |
| 35 to 39 Minutes | 831 | 4.2% |
| 40 to 44 Minutes | 1,033 | 5.2% |
| 45 to 59 Minutes | 2,176 | 11.0% |
| 60 to 89 Minutes | 1,656 | 8.4% |
| 90 or more Minutes | 766 | 3.9% |
Commute Time by Sex in Cypress
The most common commute times in Cypress are 30 to 34 minutes (1,686 commuters, 15.7%) for males and 30 to 34 minutes (1,666 commuters, 18.4%) for females.
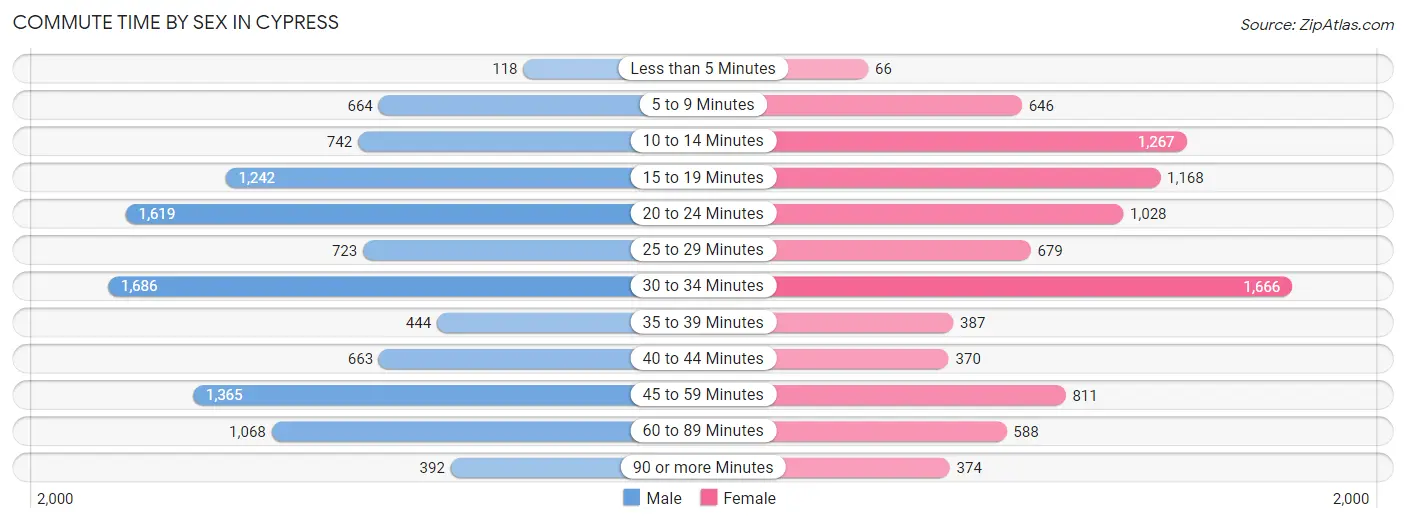
| Commute Time | Male | Female |
| Less than 5 Minutes | 118 (1.1%) | 66 (0.7%) |
| 5 to 9 Minutes | 664 (6.2%) | 646 (7.1%) |
| 10 to 14 Minutes | 742 (6.9%) | 1,267 (14.0%) |
| 15 to 19 Minutes | 1,242 (11.6%) | 1,168 (12.9%) |
| 20 to 24 Minutes | 1,619 (15.1%) | 1,028 (11.4%) |
| 25 to 29 Minutes | 723 (6.7%) | 679 (7.5%) |
| 30 to 34 Minutes | 1,686 (15.7%) | 1,666 (18.4%) |
| 35 to 39 Minutes | 444 (4.1%) | 387 (4.3%) |
| 40 to 44 Minutes | 663 (6.2%) | 370 (4.1%) |
| 45 to 59 Minutes | 1,365 (12.7%) | 811 (9.0%) |
| 60 to 89 Minutes | 1,068 (10.0%) | 588 (6.5%) |
| 90 or more Minutes | 392 (3.6%) | 374 (4.1%) |
Time of Departure to Work by Sex in Cypress
The most frequent times of departure to work in Cypress are 7:00 AM to 7:29 AM (1,644, 15.3%) for males and 7:00 AM to 7:29 AM (1,489, 16.5%) for females.
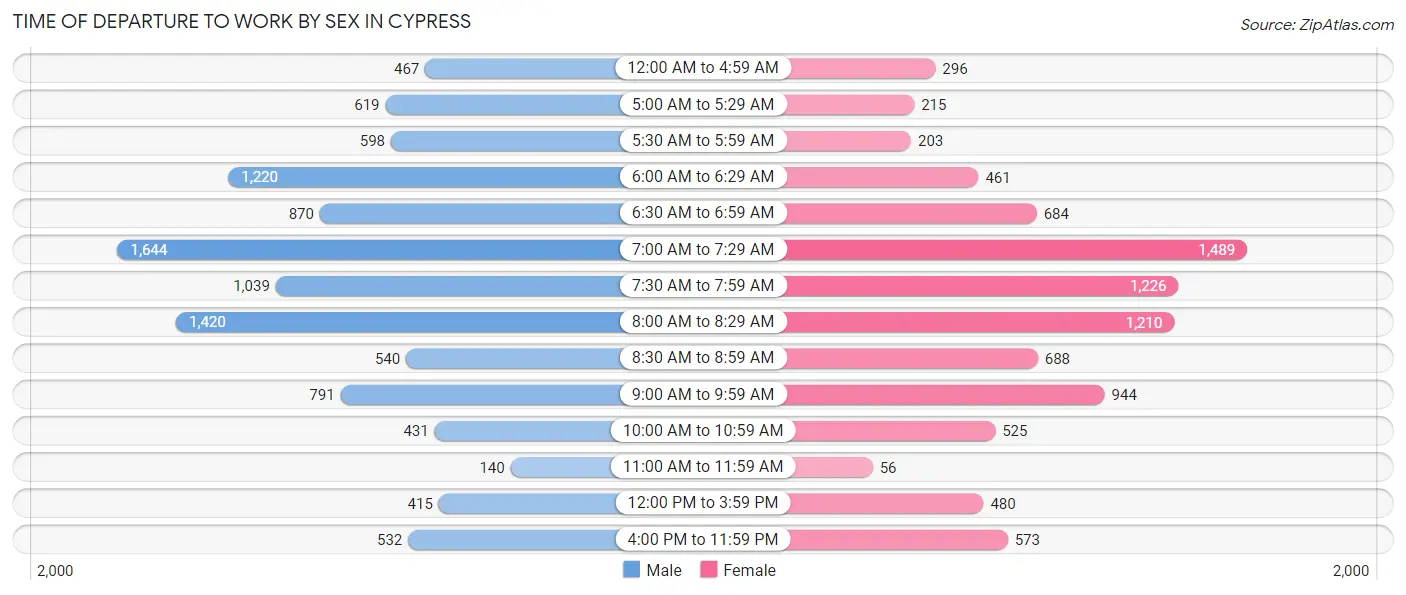
| Time of Departure | Male | Female |
| 12:00 AM to 4:59 AM | 467 (4.3%) | 296 (3.3%) |
| 5:00 AM to 5:29 AM | 619 (5.8%) | 215 (2.4%) |
| 5:30 AM to 5:59 AM | 598 (5.6%) | 203 (2.2%) |
| 6:00 AM to 6:29 AM | 1,220 (11.4%) | 461 (5.1%) |
| 6:30 AM to 6:59 AM | 870 (8.1%) | 684 (7.6%) |
| 7:00 AM to 7:29 AM | 1,644 (15.3%) | 1,489 (16.5%) |
| 7:30 AM to 7:59 AM | 1,039 (9.7%) | 1,226 (13.6%) |
| 8:00 AM to 8:29 AM | 1,420 (13.2%) | 1,210 (13.4%) |
| 8:30 AM to 8:59 AM | 540 (5.0%) | 688 (7.6%) |
| 9:00 AM to 9:59 AM | 791 (7.4%) | 944 (10.4%) |
| 10:00 AM to 10:59 AM | 431 (4.0%) | 525 (5.8%) |
| 11:00 AM to 11:59 AM | 140 (1.3%) | 56 (0.6%) |
| 12:00 PM to 3:59 PM | 415 (3.9%) | 480 (5.3%) |
| 4:00 PM to 11:59 PM | 532 (5.0%) | 573 (6.3%) |
| Total | 10,726 (100.0%) | 9,050 (100.0%) |
Housing Occupancy in Cypress
Occupancy by Ownership in Cypress
Of the total 16,025 dwellings in Cypress, owner-occupied units account for 10,760 (67.1%), while renter-occupied units make up 5,265 (32.9%).
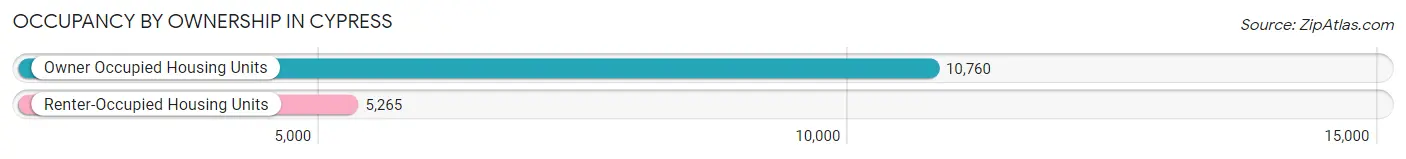
| Occupancy | # Housing Units | % Housing Units |
| Owner Occupied Housing Units | 10,760 | 67.1% |
| Renter-Occupied Housing Units | 5,265 | 32.9% |
| Total Occupied Housing Units | 16,025 | 100.0% |
Occupancy by Household Size in Cypress
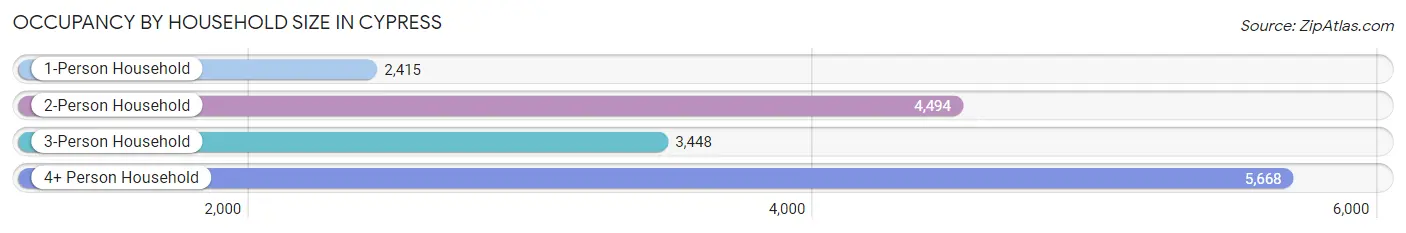
| Household Size | # Housing Units | % Housing Units |
| 1-Person Household | 2,415 | 15.1% |
| 2-Person Household | 4,494 | 28.0% |
| 3-Person Household | 3,448 | 21.5% |
| 4+ Person Household | 5,668 | 35.4% |
| Total Housing Units | 16,025 | 100.0% |
Occupancy by Ownership by Household Size in Cypress
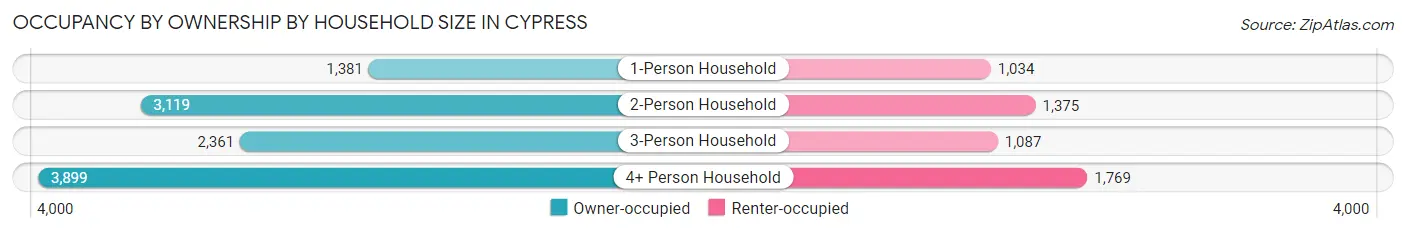
| Household Size | Owner-occupied | Renter-occupied |
| 1-Person Household | 1,381 (57.2%) | 1,034 (42.8%) |
| 2-Person Household | 3,119 (69.4%) | 1,375 (30.6%) |
| 3-Person Household | 2,361 (68.5%) | 1,087 (31.5%) |
| 4+ Person Household | 3,899 (68.8%) | 1,769 (31.2%) |
| Total Housing Units | 10,760 (67.1%) | 5,265 (32.9%) |
Occupancy by Educational Attainment in Cypress
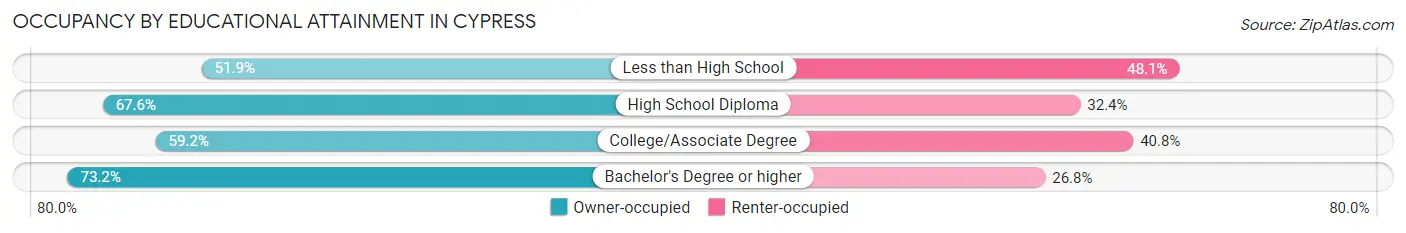
| Household Size | Owner-occupied | Renter-occupied |
| Less than High School | 502 (51.9%) | 465 (48.1%) |
| High School Diploma | 1,192 (67.6%) | 571 (32.4%) |
| College/Associate Degree | 2,817 (59.2%) | 1,939 (40.8%) |
| Bachelor's Degree or higher | 6,249 (73.2%) | 2,290 (26.8%) |
Occupancy by Age of Householder in Cypress
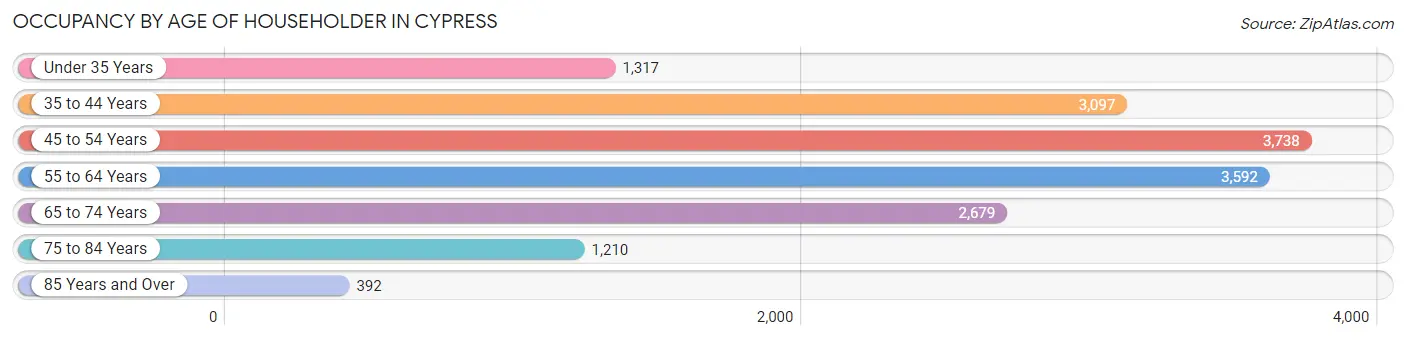
| Age Bracket | # Households | % Households |
| Under 35 Years | 1,317 | 8.2% |
| 35 to 44 Years | 3,097 | 19.3% |
| 45 to 54 Years | 3,738 | 23.3% |
| 55 to 64 Years | 3,592 | 22.4% |
| 65 to 74 Years | 2,679 | 16.7% |
| 75 to 84 Years | 1,210 | 7.5% |
| 85 Years and Over | 392 | 2.5% |
| Total | 16,025 | 100.0% |
Housing Finances in Cypress
Median Income by Occupancy in Cypress
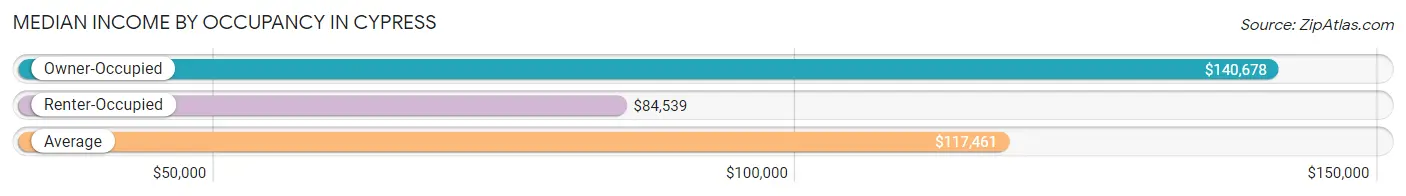
| Occupancy Type | # Households | Median Income |
| Owner-Occupied | 10,760 (67.1%) | $140,678 |
| Renter-Occupied | 5,265 (32.9%) | $84,539 |
| Average | 16,025 (100.0%) | $117,461 |
Occupancy by Householder Income Bracket in Cypress
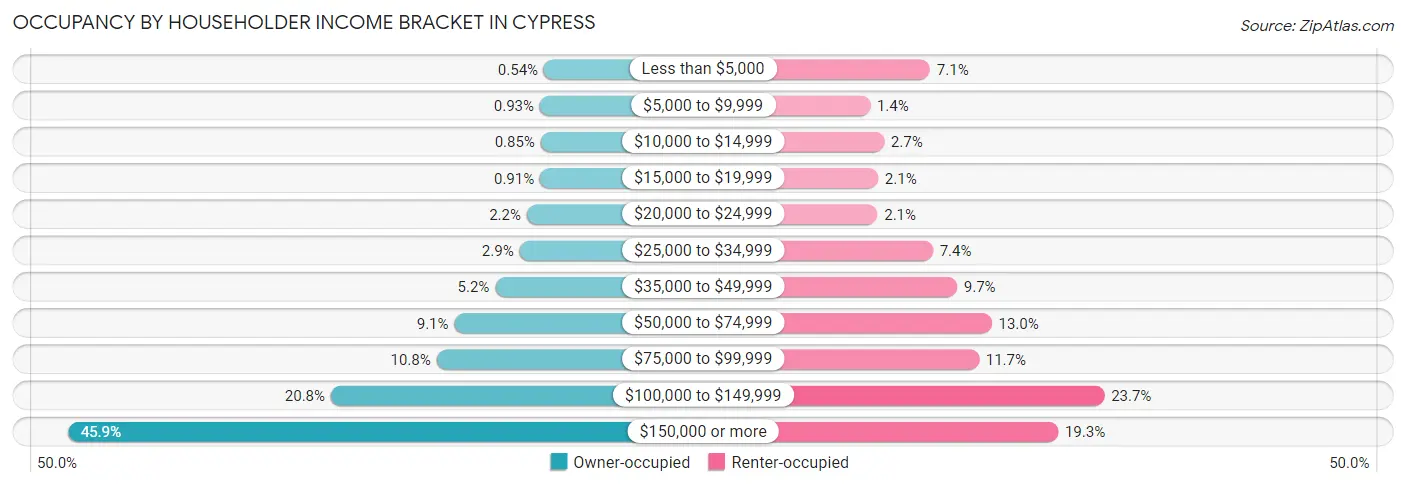
| Income Bracket | Owner-occupied | Renter-occupied |
| Less than $5,000 | 58 (0.5%) | 373 (7.1%) |
| $5,000 to $9,999 | 100 (0.9%) | 72 (1.4%) |
| $10,000 to $14,999 | 91 (0.9%) | 142 (2.7%) |
| $15,000 to $19,999 | 98 (0.9%) | 112 (2.1%) |
| $20,000 to $24,999 | 233 (2.2%) | 109 (2.1%) |
| $25,000 to $34,999 | 309 (2.9%) | 387 (7.3%) |
| $35,000 to $49,999 | 557 (5.2%) | 508 (9.7%) |
| $50,000 to $74,999 | 976 (9.1%) | 682 (13.0%) |
| $75,000 to $99,999 | 1,159 (10.8%) | 618 (11.7%) |
| $100,000 to $149,999 | 2,241 (20.8%) | 1,247 (23.7%) |
| $150,000 or more | 4,938 (45.9%) | 1,015 (19.3%) |
| Total | 10,760 (100.0%) | 5,265 (100.0%) |
Monthly Housing Cost Tiers in Cypress
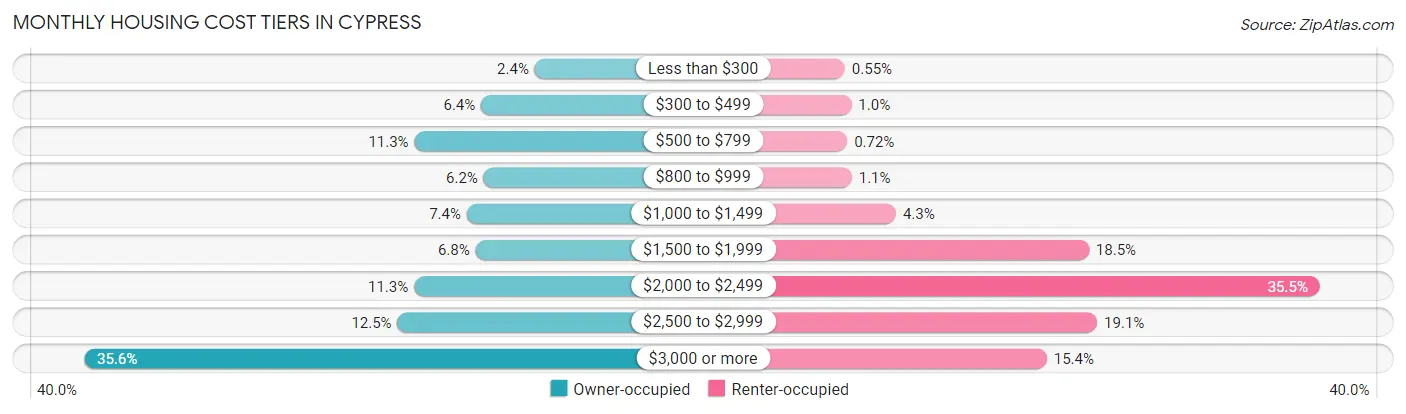
| Monthly Cost | Owner-occupied | Renter-occupied |
| Less than $300 | 262 (2.4%) | 29 (0.5%) |
| $300 to $499 | 687 (6.4%) | 54 (1.0%) |
| $500 to $799 | 1,215 (11.3%) | 38 (0.7%) |
| $800 to $999 | 666 (6.2%) | 56 (1.1%) |
| $1,000 to $1,499 | 799 (7.4%) | 227 (4.3%) |
| $1,500 to $1,999 | 731 (6.8%) | 975 (18.5%) |
| $2,000 to $2,499 | 1,218 (11.3%) | 1,870 (35.5%) |
| $2,500 to $2,999 | 1,349 (12.5%) | 1,007 (19.1%) |
| $3,000 or more | 3,833 (35.6%) | 812 (15.4%) |
| Total | 10,760 (100.0%) | 5,265 (100.0%) |
Physical Housing Characteristics in Cypress
Housing Structures in Cypress
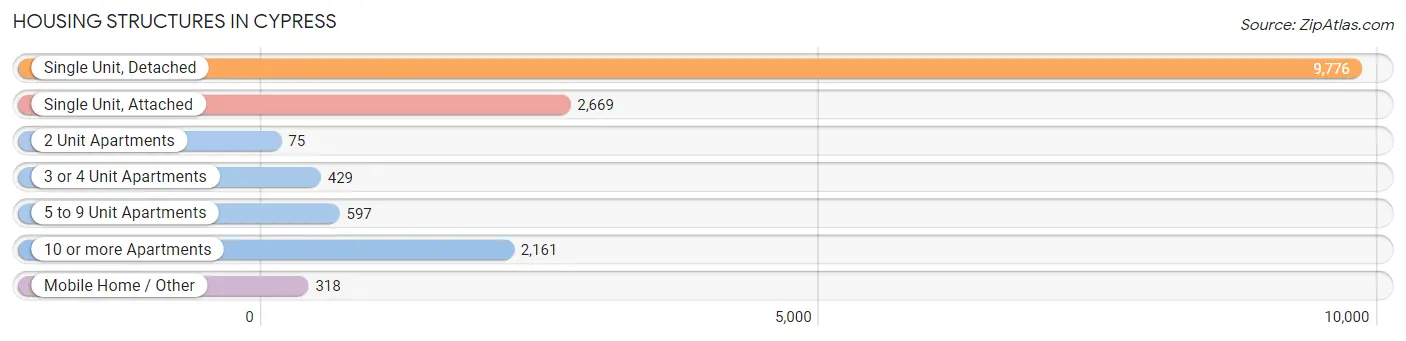
| Structure Type | # Housing Units | % Housing Units |
| Single Unit, Detached | 9,776 | 61.0% |
| Single Unit, Attached | 2,669 | 16.7% |
| 2 Unit Apartments | 75 | 0.5% |
| 3 or 4 Unit Apartments | 429 | 2.7% |
| 5 to 9 Unit Apartments | 597 | 3.7% |
| 10 or more Apartments | 2,161 | 13.5% |
| Mobile Home / Other | 318 | 2.0% |
| Total | 16,025 | 100.0% |
Housing Structures by Occupancy in Cypress
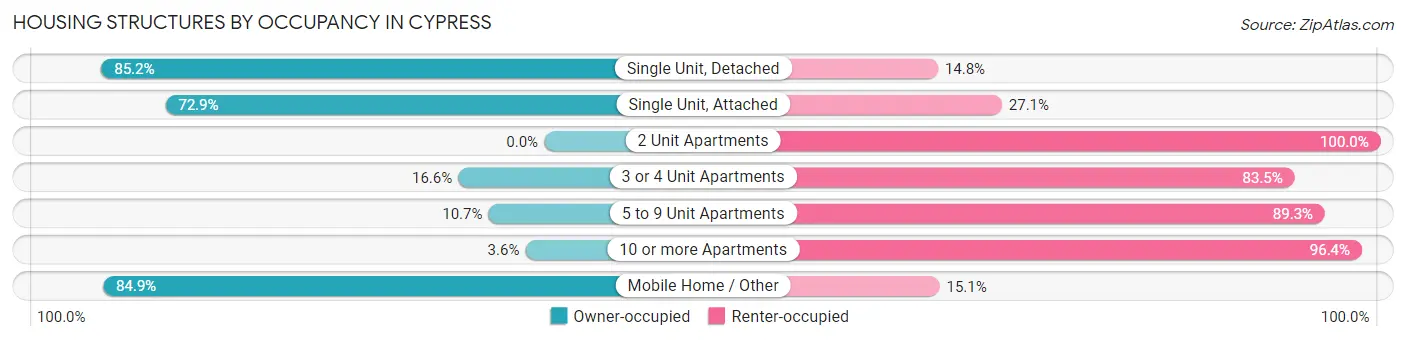
| Structure Type | Owner-occupied | Renter-occupied |
| Single Unit, Detached | 8,331 (85.2%) | 1,445 (14.8%) |
| Single Unit, Attached | 1,946 (72.9%) | 723 (27.1%) |
| 2 Unit Apartments | 0 (0.0%) | 75 (100.0%) |
| 3 or 4 Unit Apartments | 71 (16.6%) | 358 (83.5%) |
| 5 to 9 Unit Apartments | 64 (10.7%) | 533 (89.3%) |
| 10 or more Apartments | 78 (3.6%) | 2,083 (96.4%) |
| Mobile Home / Other | 270 (84.9%) | 48 (15.1%) |
| Total | 10,760 (67.1%) | 5,265 (32.9%) |
Housing Structures by Number of Rooms in Cypress
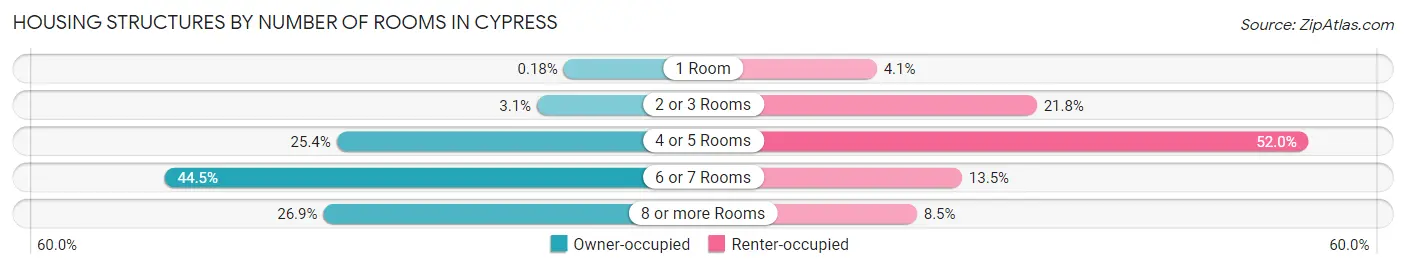
| Number of Rooms | Owner-occupied | Renter-occupied |
| 1 Room | 19 (0.2%) | 215 (4.1%) |
| 2 or 3 Rooms | 338 (3.1%) | 1,150 (21.8%) |
| 4 or 5 Rooms | 2,730 (25.4%) | 2,738 (52.0%) |
| 6 or 7 Rooms | 4,784 (44.5%) | 713 (13.5%) |
| 8 or more Rooms | 2,889 (26.9%) | 449 (8.5%) |
| Total | 10,760 (100.0%) | 5,265 (100.0%) |
Housing Structure by Heating Type in Cypress
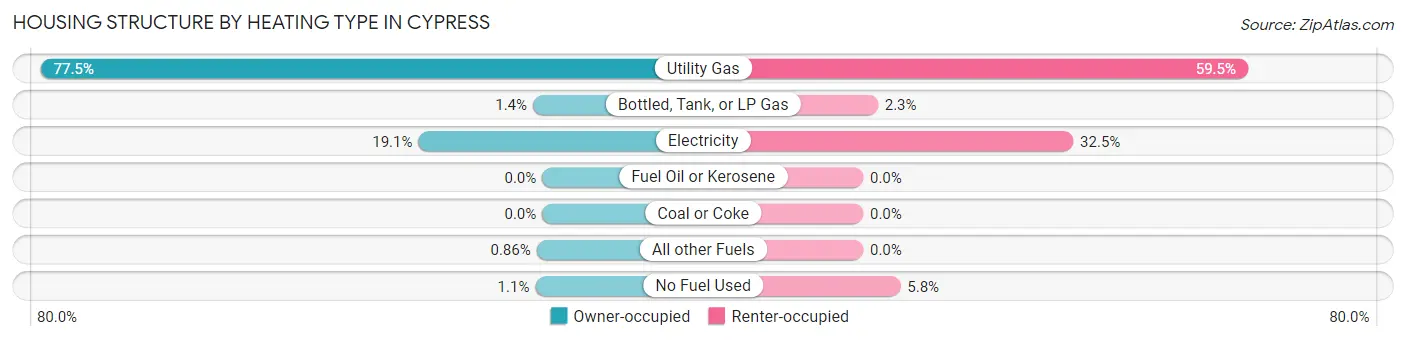
| Heating Type | Owner-occupied | Renter-occupied |
| Utility Gas | 8,341 (77.5%) | 3,131 (59.5%) |
| Bottled, Tank, or LP Gas | 154 (1.4%) | 120 (2.3%) |
| Electricity | 2,059 (19.1%) | 1,710 (32.5%) |
| Fuel Oil or Kerosene | 0 (0.0%) | 0 (0.0%) |
| Coal or Coke | 0 (0.0%) | 0 (0.0%) |
| All other Fuels | 92 (0.9%) | 0 (0.0%) |
| No Fuel Used | 114 (1.1%) | 304 (5.8%) |
| Total | 10,760 (100.0%) | 5,265 (100.0%) |
Household Vehicle Usage in Cypress
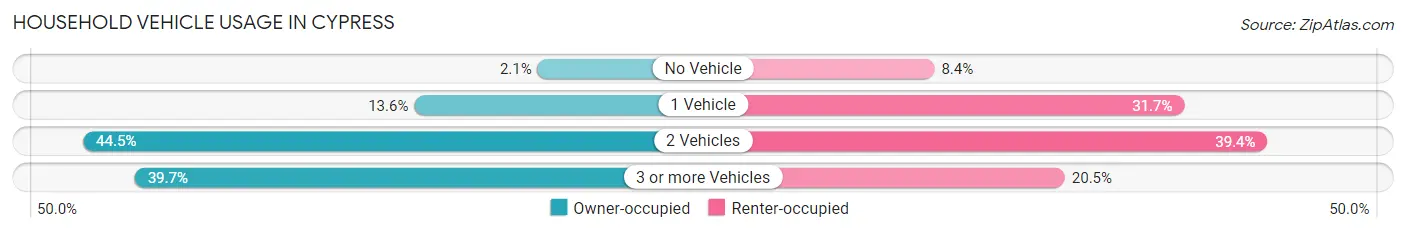
| Vehicles per Household | Owner-occupied | Renter-occupied |
| No Vehicle | 228 (2.1%) | 440 (8.4%) |
| 1 Vehicle | 1,467 (13.6%) | 1,668 (31.7%) |
| 2 Vehicles | 4,791 (44.5%) | 2,076 (39.4%) |
| 3 or more Vehicles | 4,274 (39.7%) | 1,081 (20.5%) |
| Total | 10,760 (100.0%) | 5,265 (100.0%) |
Real Estate & Mortgages in Cypress
Real Estate and Mortgage Overview in Cypress
| Characteristic | Without Mortgage | With Mortgage |
| Housing Units | 3,399 | 7,361 |
| Median Property Value | $801,100 | $835,900 |
| Median Household Income | $98,306 | $3,898 |
| Monthly Housing Costs | $714 | $3,833 |
| Real Estate Taxes | $3,547 | $54 |
Property Value by Mortgage Status in Cypress
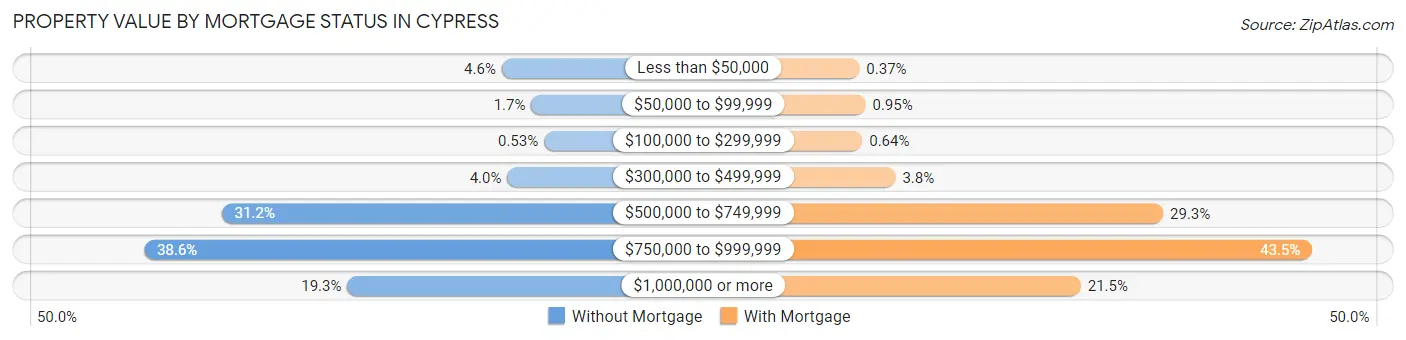
| Property Value | Without Mortgage | With Mortgage |
| Less than $50,000 | 155 (4.6%) | 27 (0.4%) |
| $50,000 to $99,999 | 59 (1.7%) | 70 (0.9%) |
| $100,000 to $299,999 | 18 (0.5%) | 47 (0.6%) |
| $300,000 to $499,999 | 137 (4.0%) | 280 (3.8%) |
| $500,000 to $749,999 | 1,062 (31.2%) | 2,156 (29.3%) |
| $750,000 to $999,999 | 1,313 (38.6%) | 3,202 (43.5%) |
| $1,000,000 or more | 655 (19.3%) | 1,579 (21.4%) |
| Total | 3,399 (100.0%) | 7,361 (100.0%) |
Household Income by Mortgage Status in Cypress
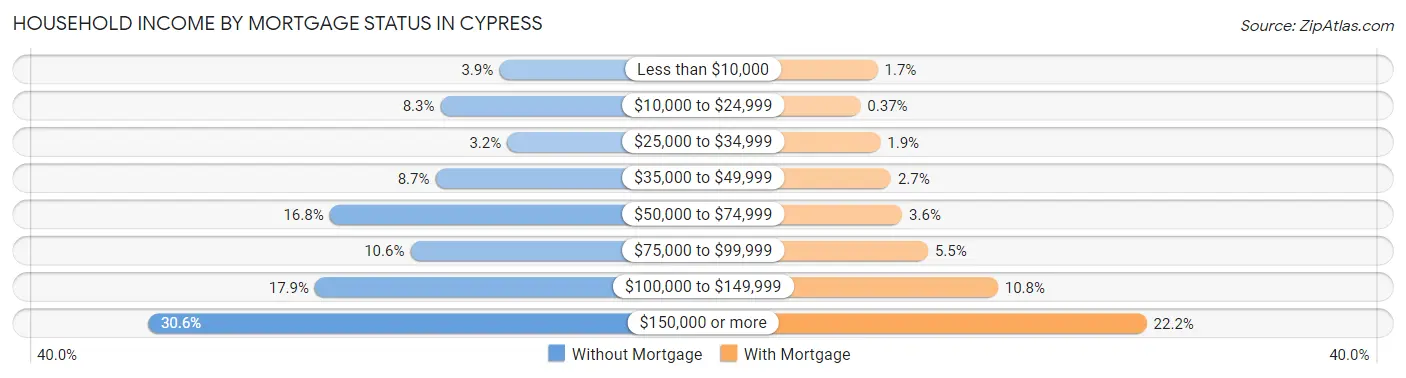
| Household Income | Without Mortgage | With Mortgage |
| Less than $10,000 | 131 (3.8%) | 124 (1.7%) |
| $10,000 to $24,999 | 283 (8.3%) | 27 (0.4%) |
| $25,000 to $34,999 | 110 (3.2%) | 139 (1.9%) |
| $35,000 to $49,999 | 296 (8.7%) | 199 (2.7%) |
| $50,000 to $74,999 | 570 (16.8%) | 261 (3.5%) |
| $75,000 to $99,999 | 361 (10.6%) | 406 (5.5%) |
| $100,000 to $149,999 | 608 (17.9%) | 798 (10.8%) |
| $150,000 or more | 1,040 (30.6%) | 1,633 (22.2%) |
| Total | 3,399 (100.0%) | 7,361 (100.0%) |
Property Value to Household Income Ratio in Cypress
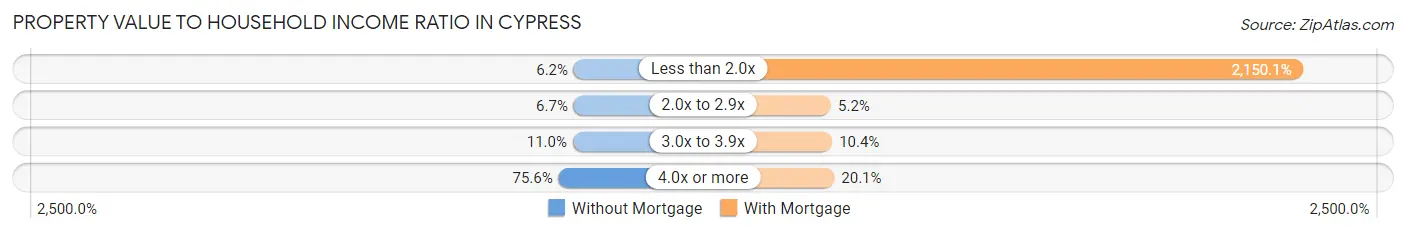
| Value-to-Income Ratio | Without Mortgage | With Mortgage |
| Less than 2.0x | 211 (6.2%) | 158,267 (2,150.1%) |
| 2.0x to 2.9x | 228 (6.7%) | 384 (5.2%) |
| 3.0x to 3.9x | 373 (11.0%) | 762 (10.3%) |
| 4.0x or more | 2,571 (75.6%) | 1,478 (20.1%) |
| Total | 3,399 (100.0%) | 7,361 (100.0%) |
Real Estate Taxes by Mortgage Status in Cypress
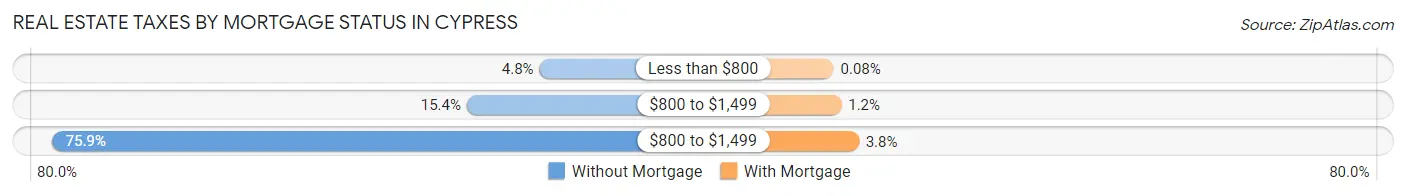
| Property Taxes | Without Mortgage | With Mortgage |
| Less than $800 | 162 (4.8%) | 6 (0.1%) |
| $800 to $1,499 | 523 (15.4%) | 88 (1.2%) |
| $800 to $1,499 | 2,580 (75.9%) | 276 (3.7%) |
| Total | 3,399 (100.0%) | 7,361 (100.0%) |
Health & Disability in Cypress
Health Insurance Coverage by Age in Cypress
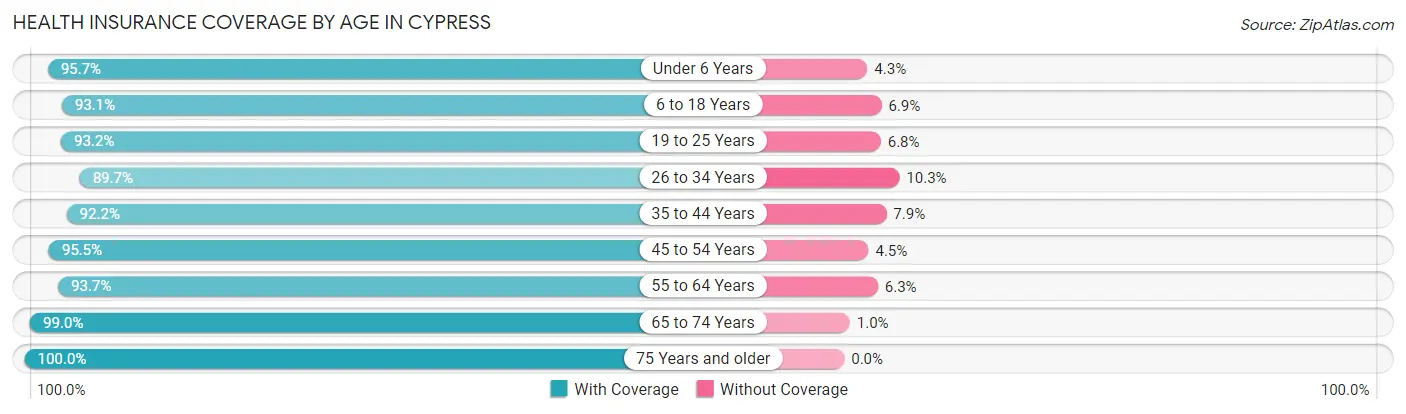
| Age Bracket | With Coverage | Without Coverage |
| Under 6 Years | 3,333 (95.7%) | 150 (4.3%) |
| 6 to 18 Years | 8,196 (93.1%) | 611 (6.9%) |
| 19 to 25 Years | 3,984 (93.2%) | 291 (6.8%) |
| 26 to 34 Years | 3,856 (89.7%) | 442 (10.3%) |
| 35 to 44 Years | 6,048 (92.1%) | 515 (7.9%) |
| 45 to 54 Years | 7,259 (95.5%) | 344 (4.5%) |
| 55 to 64 Years | 6,364 (93.7%) | 425 (6.3%) |
| 65 to 74 Years | 4,705 (99.0%) | 49 (1.0%) |
| 75 Years and older | 3,292 (100.0%) | 0 (0.0%) |
| Total | 47,037 (94.3%) | 2,827 (5.7%) |
Health Insurance Coverage by Citizenship Status in Cypress
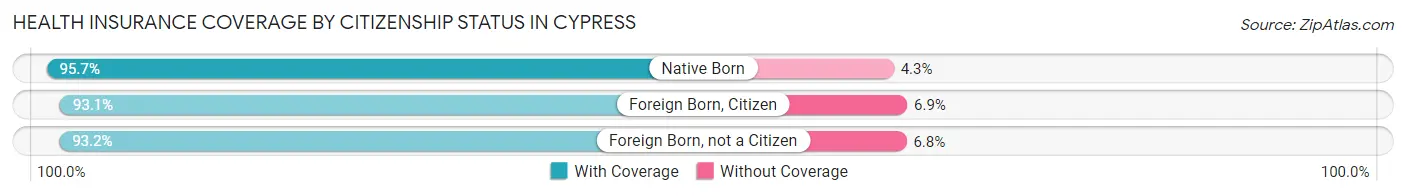
| Citizenship Status | With Coverage | Without Coverage |
| Native Born | 3,333 (95.7%) | 150 (4.3%) |
| Foreign Born, Citizen | 8,196 (93.1%) | 611 (6.9%) |
| Foreign Born, not a Citizen | 3,984 (93.2%) | 291 (6.8%) |
Health Insurance Coverage by Household Income in Cypress
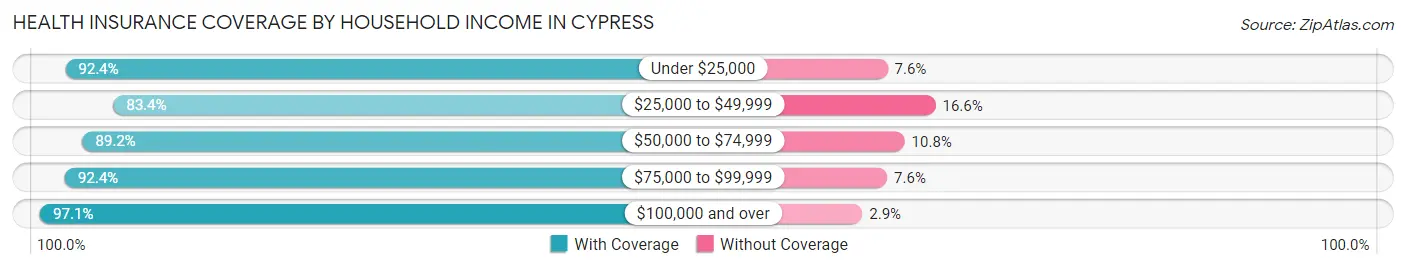
| Household Income | With Coverage | Without Coverage |
| Under $25,000 | 2,454 (92.4%) | 203 (7.6%) |
| $25,000 to $49,999 | 3,945 (83.4%) | 787 (16.6%) |
| $50,000 to $74,999 | 3,627 (89.2%) | 441 (10.8%) |
| $75,000 to $99,999 | 4,794 (92.4%) | 392 (7.6%) |
| $100,000 and over | 32,027 (97.1%) | 965 (2.9%) |
Public vs Private Health Insurance Coverage by Age in Cypress
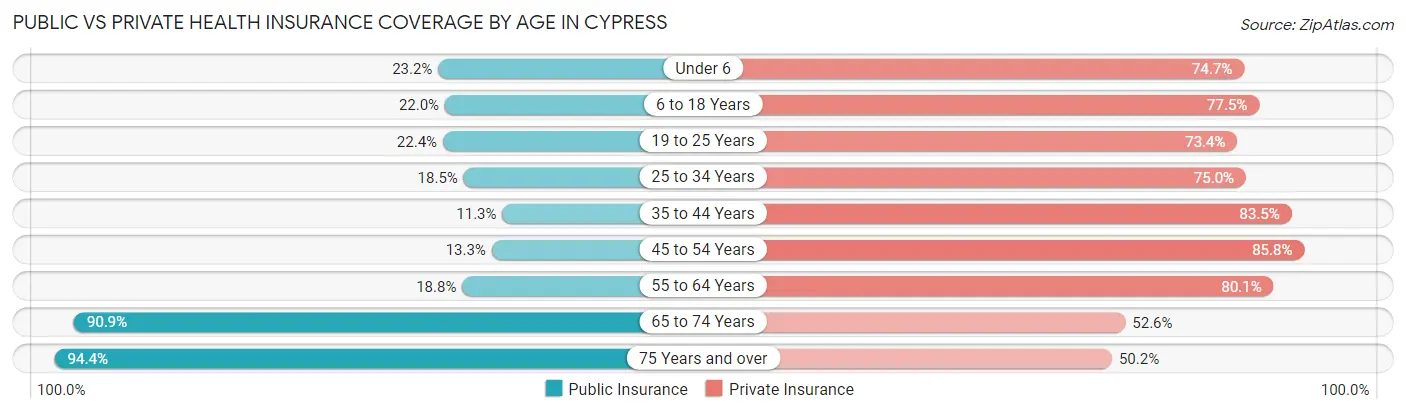
| Age Bracket | Public Insurance | Private Insurance |
| Under 6 | 809 (23.2%) | 2,601 (74.7%) |
| 6 to 18 Years | 1,936 (22.0%) | 6,822 (77.5%) |
| 19 to 25 Years | 956 (22.4%) | 3,138 (73.4%) |
| 25 to 34 Years | 795 (18.5%) | 3,224 (75.0%) |
| 35 to 44 Years | 743 (11.3%) | 5,479 (83.5%) |
| 45 to 54 Years | 1,011 (13.3%) | 6,526 (85.8%) |
| 55 to 64 Years | 1,274 (18.8%) | 5,441 (80.1%) |
| 65 to 74 Years | 4,319 (90.8%) | 2,502 (52.6%) |
| 75 Years and over | 3,108 (94.4%) | 1,651 (50.1%) |
| Total | 14,951 (30.0%) | 37,384 (75.0%) |
Disability Status by Sex by Age in Cypress
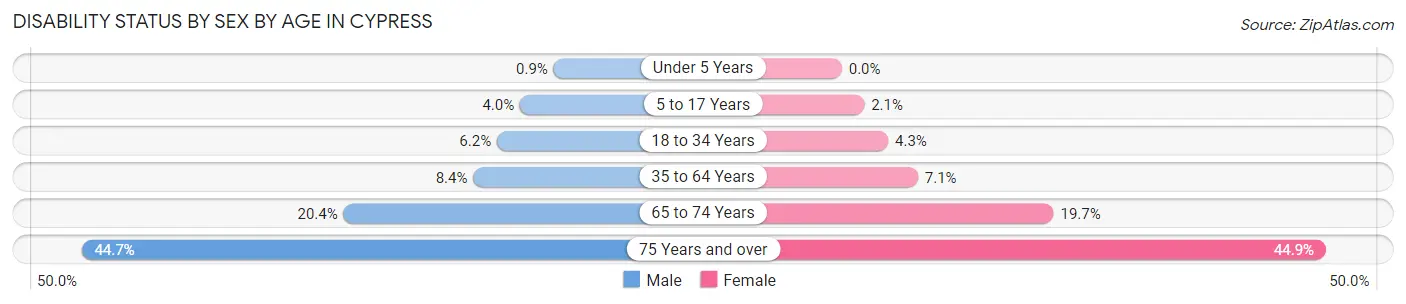
| Age Bracket | Male | Female |
| Under 5 Years | 13 (0.9%) | 0 (0.0%) |
| 5 to 17 Years | 162 (4.0%) | 94 (2.1%) |
| 18 to 34 Years | 292 (6.2%) | 194 (4.3%) |
| 35 to 64 Years | 860 (8.4%) | 754 (7.1%) |
| 65 to 74 Years | 459 (20.4%) | 492 (19.7%) |
| 75 Years and over | 660 (44.7%) | 816 (44.9%) |
Disability Class by Sex by Age in Cypress
Disability Class: Hearing Difficulty
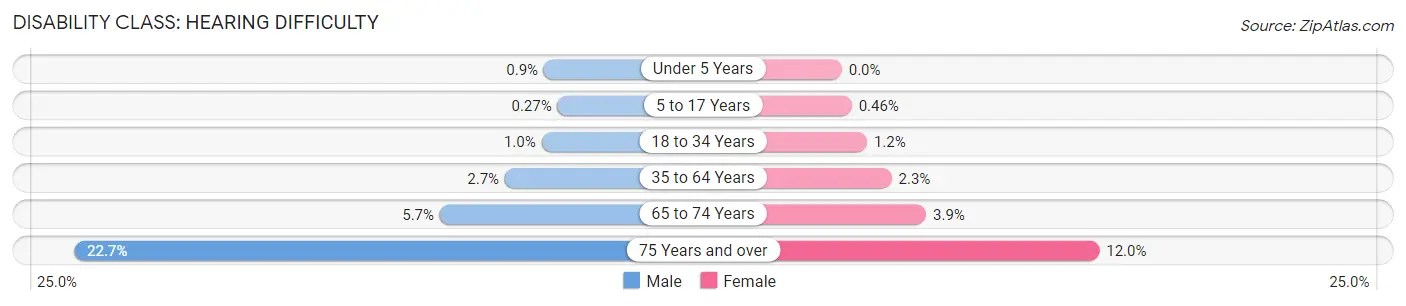
| Age Bracket | Male | Female |
| Under 5 Years | 13 (0.9%) | 0 (0.0%) |
| 5 to 17 Years | 11 (0.3%) | 21 (0.5%) |
| 18 to 34 Years | 48 (1.0%) | 53 (1.2%) |
| 35 to 64 Years | 279 (2.7%) | 247 (2.3%) |
| 65 to 74 Years | 129 (5.7%) | 98 (3.9%) |
| 75 Years and over | 335 (22.7%) | 217 (11.9%) |
Disability Class: Vision Difficulty
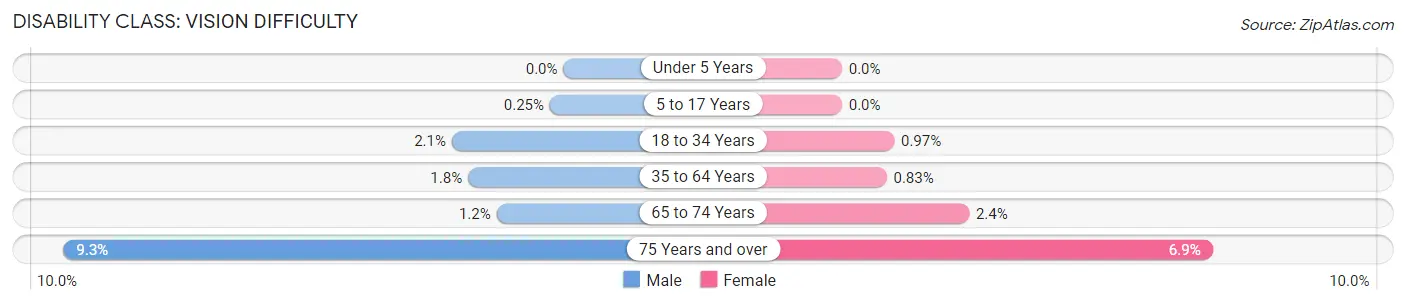
| Age Bracket | Male | Female |
| Under 5 Years | 0 (0.0%) | 0 (0.0%) |
| 5 to 17 Years | 10 (0.3%) | 0 (0.0%) |
| 18 to 34 Years | 98 (2.1%) | 44 (1.0%) |
| 35 to 64 Years | 182 (1.8%) | 89 (0.8%) |
| 65 to 74 Years | 28 (1.2%) | 59 (2.4%) |
| 75 Years and over | 137 (9.3%) | 125 (6.9%) |
Disability Class: Cognitive Difficulty
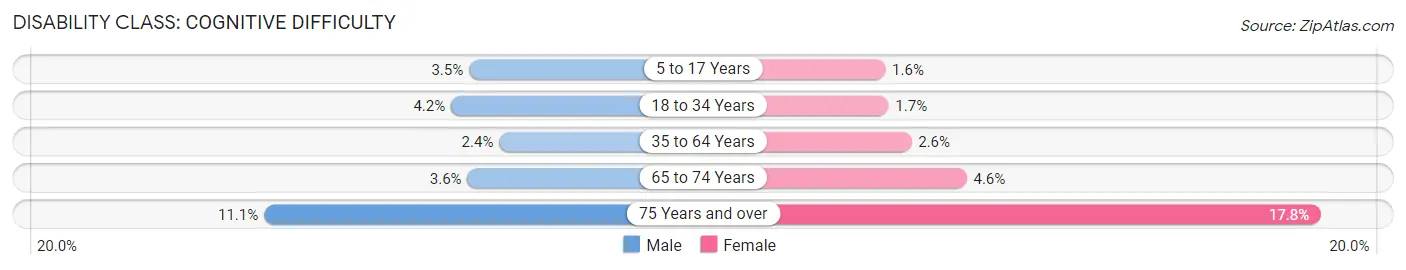
| Age Bracket | Male | Female |
| 5 to 17 Years | 141 (3.5%) | 73 (1.6%) |
| 18 to 34 Years | 198 (4.2%) | 78 (1.7%) |
| 35 to 64 Years | 245 (2.4%) | 275 (2.6%) |
| 65 to 74 Years | 80 (3.6%) | 116 (4.6%) |
| 75 Years and over | 164 (11.1%) | 323 (17.8%) |
Disability Class: Ambulatory Difficulty
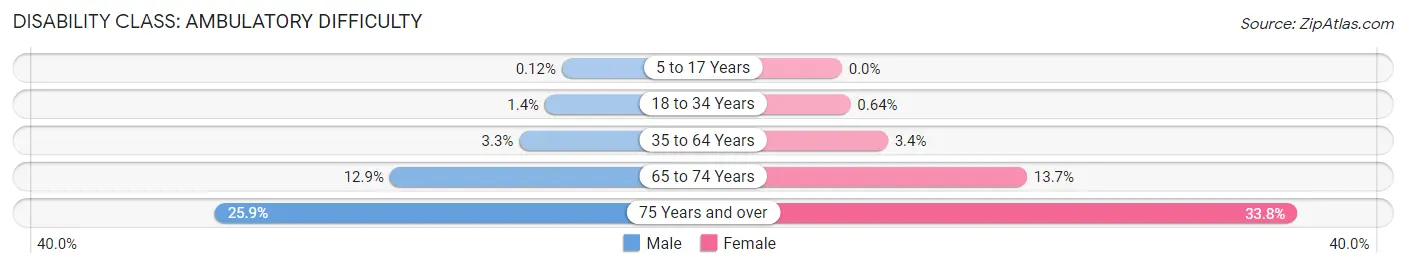
| Age Bracket | Male | Female |
| 5 to 17 Years | 5 (0.1%) | 0 (0.0%) |
| 18 to 34 Years | 65 (1.4%) | 29 (0.6%) |
| 35 to 64 Years | 337 (3.3%) | 364 (3.4%) |
| 65 to 74 Years | 290 (12.9%) | 344 (13.7%) |
| 75 Years and over | 382 (25.9%) | 614 (33.8%) |
Disability Class: Self-Care Difficulty
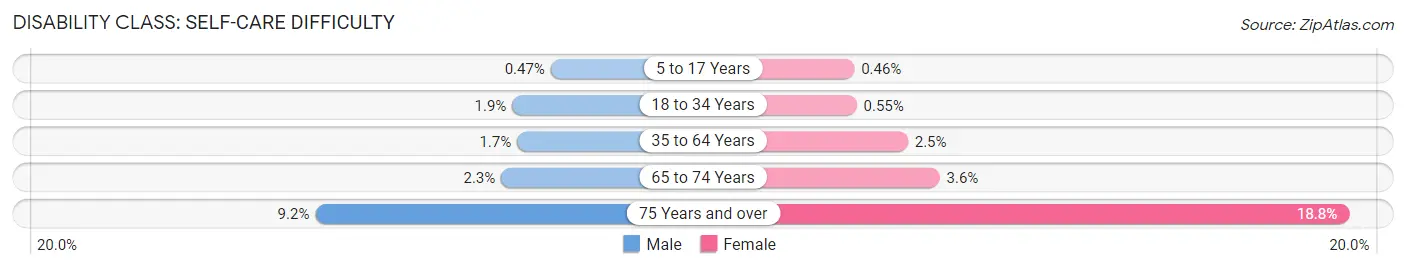
| Age Bracket | Male | Female |
| 5 to 17 Years | 19 (0.5%) | 21 (0.5%) |
| 18 to 34 Years | 90 (1.9%) | 25 (0.5%) |
| 35 to 64 Years | 177 (1.7%) | 262 (2.5%) |
| 65 to 74 Years | 52 (2.3%) | 91 (3.6%) |
| 75 Years and over | 136 (9.2%) | 342 (18.8%) |
Technology Access in Cypress
Computing Device Access in Cypress
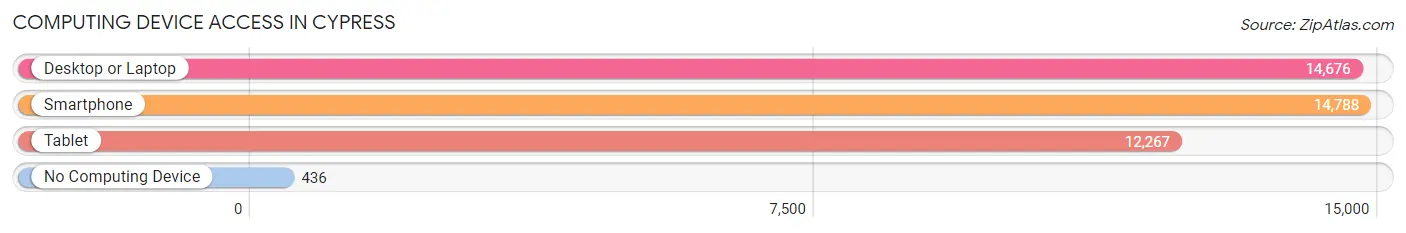
| Device Type | # Households | % Households |
| Desktop or Laptop | 14,676 | 91.6% |
| Smartphone | 14,788 | 92.3% |
| Tablet | 12,267 | 76.5% |
| No Computing Device | 436 | 2.7% |
| Total | 16,025 | 100.0% |
Internet Access in Cypress
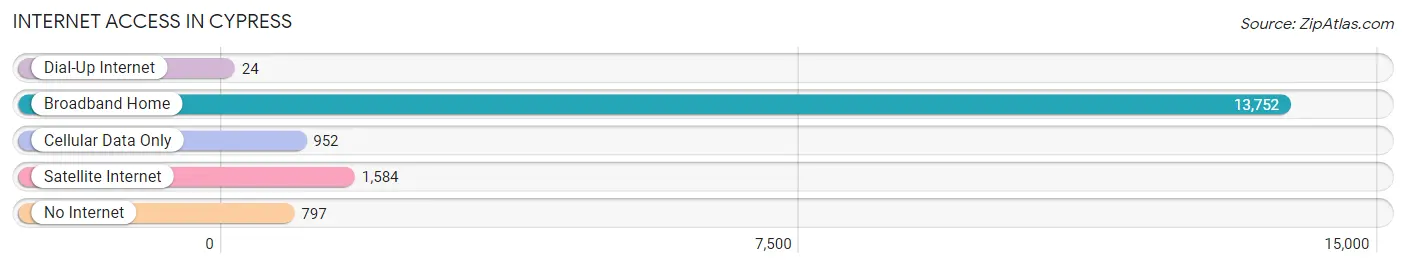
| Internet Type | # Households | % Households |
| Dial-Up Internet | 24 | 0.2% |
| Broadband Home | 13,752 | 85.8% |
| Cellular Data Only | 952 | 5.9% |
| Satellite Internet | 1,584 | 9.9% |
| No Internet | 797 | 5.0% |
| Total | 16,025 | 100.0% |
Cypress Summary
Cypress, California is a city located in Orange County, California, United States. It is situated in the northwest corner of the county, between the cities of Los Angeles and San Diego. The population of Cypress was 47,802 at the 2010 census.
Geography
Cypress is located at 33°48'55" North, 118°2'15" West (33.815, -118.037). According to the United States Census Bureau, the city has a total area of 6.1 square miles (15.8 km2), all of it land.
Cypress is bordered by the cities of La Palma to the north, Buena Park to the east, Anaheim to the southeast, and Long Beach to the southwest. The San Gabriel River Freeway (I-605) runs through the city's northern section, and the Garden Grove Freeway (CA-22) runs through the city's southern section.
History
The area now known as Cypress was originally inhabited by the Tongva people, who were later displaced by Spanish settlers in the late 18th century. The area was part of the Rancho Los Alamitos, which was granted to the Machado and Talamantes families in 1834. In the late 19th century, the area was known as Dairy Valley because of the preponderance of dairy farms in the area.
The city of Cypress was incorporated in 1956 and the population has grown steadily since then
Economy
Cypress is home to a variety of businesses, including manufacturing, retail, and service industries. The city is also home to several corporate headquarters, including Mitsubishi Motors North America, Inc., and the Cypress-based headquarters of the Los Angeles Angels of Anaheim baseball team.
The city is also home to several shopping centers, including the Cypress Towne Center, the Cypress Village Shopping Center, and the Cypress Marketplace.
Demographics
As of the 2010 census, there were 47,802 people, 15,845 households, and 12,845 families residing in the city. The population density was 7,837.3 people per square mile (3,026.2/km2). There were 16,845 housing units at an average density of 2,766.2 per square mile (1,068.2/km2). The racial makeup of the city was 57.2% White, 2.3% African American, 0.6% Native American, 20.3% Asian, 0.1% Pacific Islander, 14.4% from other races, and 5.2% from two or more races. Hispanic or Latino of any race were 28.7% of the population.
The median income for a household in the city was $71,837, and the median income for a family was $81,856. Males had a median income of $56,945 versus $41,945 for females. The per capita income for the city was $30,945. About 4.3% of families and 6.2% of the population were below the poverty line, including 8.2% of those under age 18 and 4.7% of those age 65 or over.
Common Questions
What is Per Capita Income in Cypress?
Per Capita income in Cypress is $46,827.
What is the Median Family Income in Cypress?
Median Family Income in Cypress is $131,332.
What is the Median Household income in Cypress?
Median Household Income in Cypress is $117,461.
What is Income or Wage Gap in Cypress?
Income or Wage Gap in Cypress is 34.5%.
Women in Cypress earn 65.5 cents for every dollar earned by a man.
What is Inequality or Gini Index in Cypress?
Inequality or Gini Index in Cypress is 0.42.
What is the Total Population of Cypress?
Total Population of Cypress is 49,955.
What is the Total Male Population of Cypress?
Total Male Population of Cypress is 24,270.
What is the Total Female Population of Cypress?
Total Female Population of Cypress is 25,685.
What is the Ratio of Males per 100 Females in Cypress?
There are 94.49 Males per 100 Females in Cypress.
What is the Ratio of Females per 100 Males in Cypress?
There are 105.83 Females per 100 Males in Cypress.
What is the Median Population Age in Cypress?
Median Population Age in Cypress is 41.5 Years.
What is the Average Family Size in Cypress
Average Family Size in Cypress is 3.5 People.
What is the Average Household Size in Cypress
Average Household Size in Cypress is 3.1 People.
How Large is the Labor Force in Cypress?
There are 25,339 People in the Labor Forcein in Cypress.
What is the Percentage of People in the Labor Force in Cypress?
63.7% of People are in the Labor Force in Cypress.
What is the Unemployment Rate in Cypress?
Unemployment Rate in Cypress is 5.1%.