Culver City, CA Map & Demographics
Culver City Map
Culver City Overview
$75,245
PER CAPITA INCOME
$161,652
AVG FAMILY INCOME
$114,429
AVG HOUSEHOLD INCOME
24.3%
WAGE / INCOME GAP [ % ]
75.7¢/ $1
WAGE / INCOME GAP [ $ ]
$5,977
FAMILY INCOME DEFICIT
0.49
INEQUALITY / GINI INDEX
40,357
TOTAL POPULATION
19,155
MALE POPULATION
21,202
FEMALE POPULATION
90.35
MALES / 100 FEMALES
110.69
FEMALES / 100 MALES
41.5
MEDIAN AGE
3.1
AVG FAMILY SIZE
2.3
AVG HOUSEHOLD SIZE
23,051
LABOR FORCE [ PEOPLE ]
69.4%
PERCENT IN LABOR FORCE
5.2%
UNEMPLOYMENT RATE
Income in Culver City
Income Overview in Culver City
Per Capita Income in Culver City is $75,245, while median incomes of families and households are $161,652 and $114,429 respectively.
| Characteristic | Number | Measure |
| Per Capita Income | 40,357 | $75,245 |
| Median Family Income | 9,741 | $161,652 |
| Mean Family Income | 9,741 | $220,290 |
| Median Household Income | 17,691 | $114,429 |
| Mean Household Income | 17,691 | $169,145 |
| Income Deficit | 9,741 | $5,977 |
| Wage / Income Gap (%) | 40,357 | 24.32% |
| Wage / Income Gap ($) | 40,357 | 75.68¢ per $1 |
| Gini / Inequality Index | 40,357 | 0.49 |
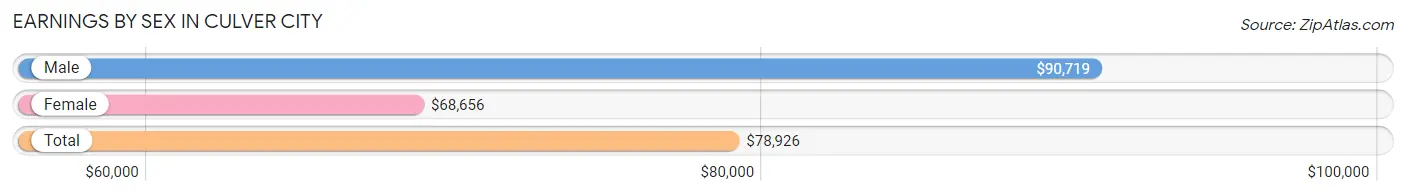
Earnings by Sex in Culver City
Average Earnings in Culver City are $78,926, $90,719 for men and $68,656 for women, a difference of 24.3%.
| Sex | Number | Average Earnings |
| Male | 11,718 (49.6%) | $90,719 |
| Female | 11,890 (50.4%) | $68,656 |
| Total | 23,608 (100.0%) | $78,926 |
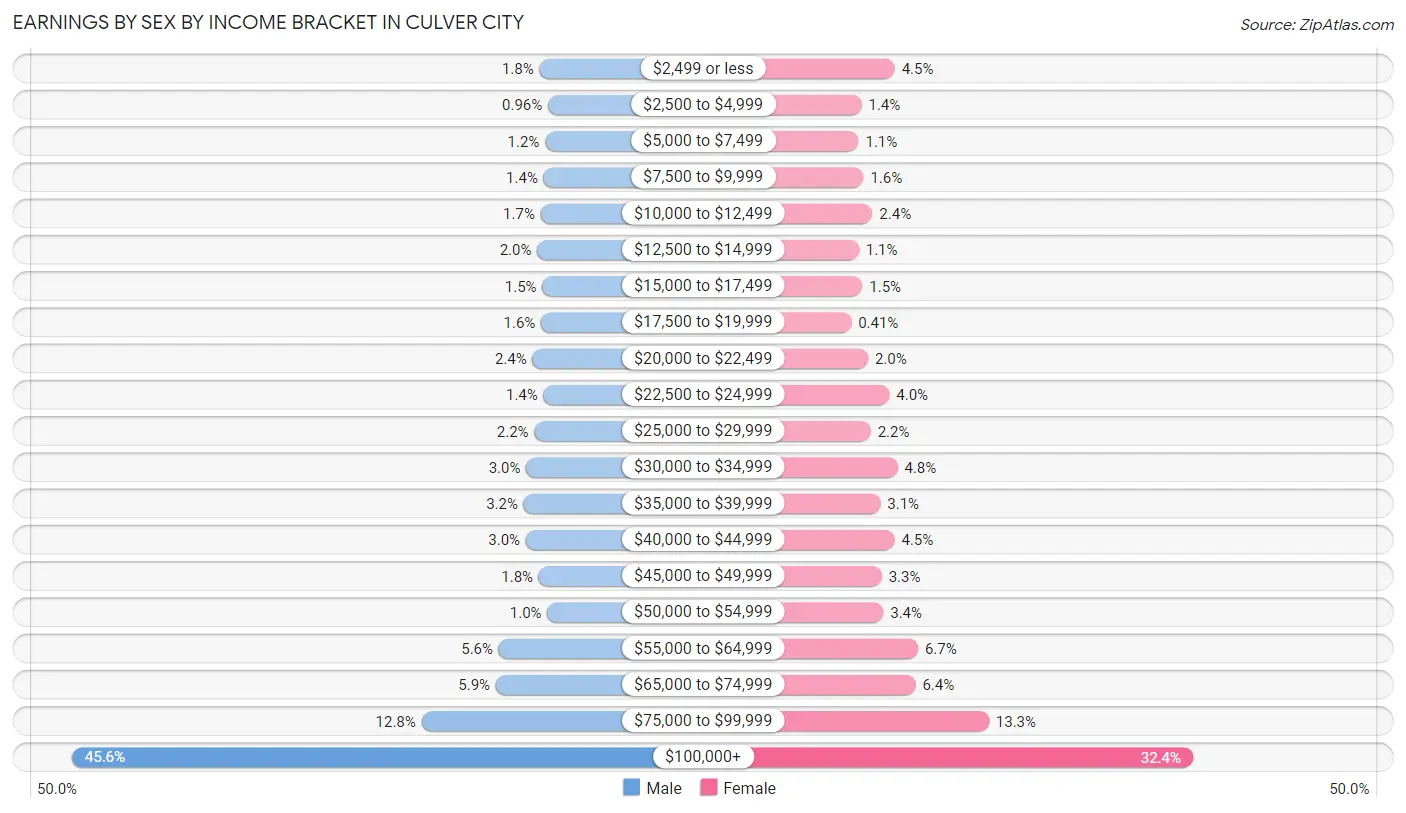
Earnings by Sex by Income Bracket in Culver City
The most common earnings brackets in Culver City are $100,000+ for men (5,340 | 45.6%) and $100,000+ for women (3,853 | 32.4%).
| Income | Male | Female |
| $2,499 or less | 206 (1.8%) | 534 (4.5%) |
| $2,500 to $4,999 | 113 (1.0%) | 164 (1.4%) |
| $5,000 to $7,499 | 144 (1.2%) | 131 (1.1%) |
| $7,500 to $9,999 | 161 (1.4%) | 186 (1.6%) |
| $10,000 to $12,499 | 193 (1.7%) | 285 (2.4%) |
| $12,500 to $14,999 | 231 (2.0%) | 133 (1.1%) |
| $15,000 to $17,499 | 175 (1.5%) | 174 (1.5%) |
| $17,500 to $19,999 | 189 (1.6%) | 49 (0.4%) |
| $20,000 to $22,499 | 283 (2.4%) | 235 (2.0%) |
| $22,500 to $24,999 | 162 (1.4%) | 474 (4.0%) |
| $25,000 to $29,999 | 262 (2.2%) | 266 (2.2%) |
| $30,000 to $34,999 | 351 (3.0%) | 565 (4.8%) |
| $35,000 to $39,999 | 380 (3.2%) | 373 (3.1%) |
| $40,000 to $44,999 | 356 (3.0%) | 531 (4.5%) |
| $45,000 to $49,999 | 213 (1.8%) | 389 (3.3%) |
| $50,000 to $54,999 | 119 (1.0%) | 407 (3.4%) |
| $55,000 to $64,999 | 653 (5.6%) | 793 (6.7%) |
| $65,000 to $74,999 | 686 (5.9%) | 765 (6.4%) |
| $75,000 to $99,999 | 1,501 (12.8%) | 1,583 (13.3%) |
| $100,000+ | 5,340 (45.6%) | 3,853 (32.4%) |
| Total | 11,718 (100.0%) | 11,890 (100.0%) |
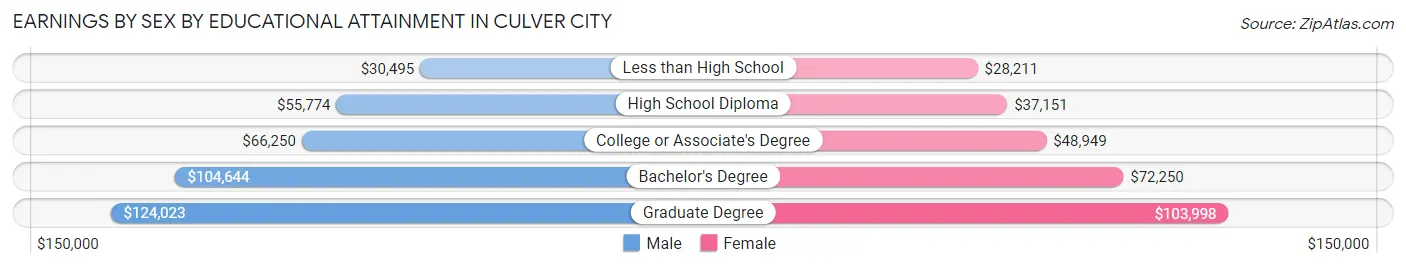
Earnings by Sex by Educational Attainment in Culver City
Average earnings in Culver City are $95,000 for men and $71,582 for women, a difference of 24.6%. Men with an educational attainment of graduate degree enjoy the highest average annual earnings of $124,023, while those with less than high school education earn the least with $30,495. Women with an educational attainment of graduate degree earn the most with the average annual earnings of $103,998, while those with less than high school education have the smallest earnings of $28,211.
| Educational Attainment | Male Income | Female Income |
| Less than High School | $30,495 | $28,211 |
| High School Diploma | $55,774 | $37,151 |
| College or Associate's Degree | $66,250 | $48,949 |
| Bachelor's Degree | $104,644 | $72,250 |
| Graduate Degree | $124,023 | $103,998 |
| Total | $95,000 | $71,582 |
Family Income in Culver City
Family Income Brackets in Culver City
According to the Culver City family income data, there are 3,731 families falling into the $200,000+ income range, which is the most common income bracket and makes up 38.3% of all families. Conversely, the $10,000 to $14,999 income bracket is the least frequent group with only 10 families (0.1%) belonging to this category.
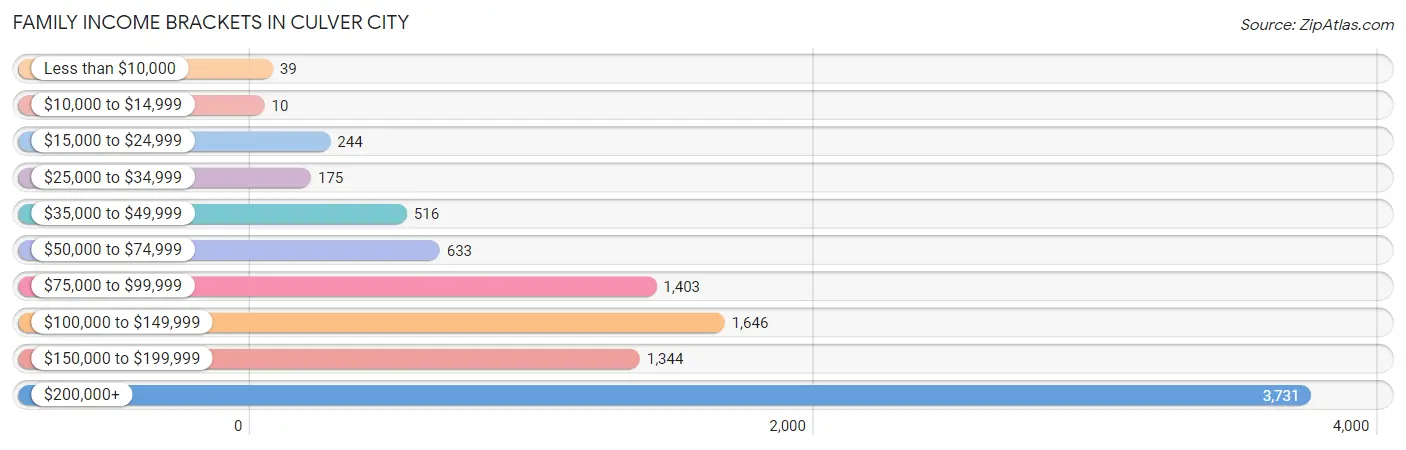
| Income Bracket | # Families | % Families |
| Less than $10,000 | 39 | 0.4% |
| $10,000 to $14,999 | 10 | 0.1% |
| $15,000 to $24,999 | 244 | 2.5% |
| $25,000 to $34,999 | 175 | 1.8% |
| $35,000 to $49,999 | 516 | 5.3% |
| $50,000 to $74,999 | 633 | 6.5% |
| $75,000 to $99,999 | 1,403 | 14.4% |
| $100,000 to $149,999 | 1,646 | 16.9% |
| $150,000 to $199,999 | 1,344 | 13.8% |
| $200,000+ | 3,731 | 38.3% |
Family Income by Famaliy Size in Culver City
4-person families (2,014 | 20.7%) account for the highest median family income in Culver City with $225,143 per family, while 2-person families (4,248 | 43.6%) have the highest median income of $60,357 per family member.
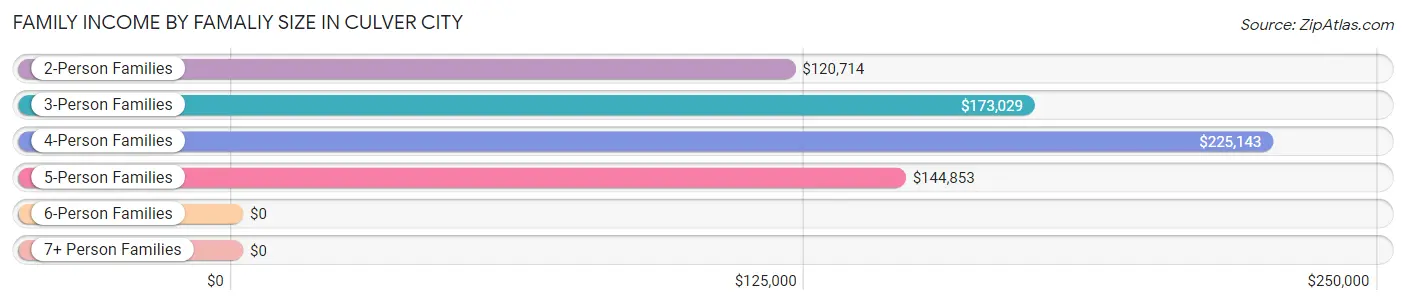
| Income Bracket | # Families | Median Income |
| 2-Person Families | 4,248 (43.6%) | $120,714 |
| 3-Person Families | 2,788 (28.6%) | $173,029 |
| 4-Person Families | 2,014 (20.7%) | $225,143 |
| 5-Person Families | 572 (5.9%) | $144,853 |
| 6-Person Families | 76 (0.8%) | $0 |
| 7+ Person Families | 43 (0.4%) | $0 |
| Total | 9,741 (100.0%) | $161,652 |
Family Income by Number of Earners in Culver City
The median family income in Culver City is $161,652, with families comprising 2 earners (5,265) having the highest median family income of $203,972, while families with no earners (914) have the lowest median family income of $57,917, accounting for 54.0% and 9.4% of families, respectively.
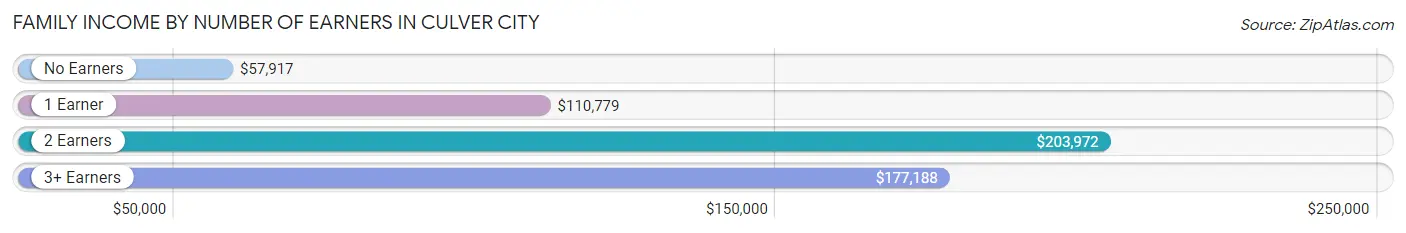
| Number of Earners | # Families | Median Income |
| No Earners | 914 (9.4%) | $57,917 |
| 1 Earner | 2,782 (28.6%) | $110,779 |
| 2 Earners | 5,265 (54.0%) | $203,972 |
| 3+ Earners | 780 (8.0%) | $177,188 |
| Total | 9,741 (100.0%) | $161,652 |
Household Income in Culver City
Household Income Brackets in Culver City
With 4,812 households falling in the category, the $200,000+ income range is the most frequent in Culver City, accounting for 27.2% of all households. In contrast, only 301 households (1.7%) fall into the $10,000 to $14,999 income bracket, making it the least populous group.
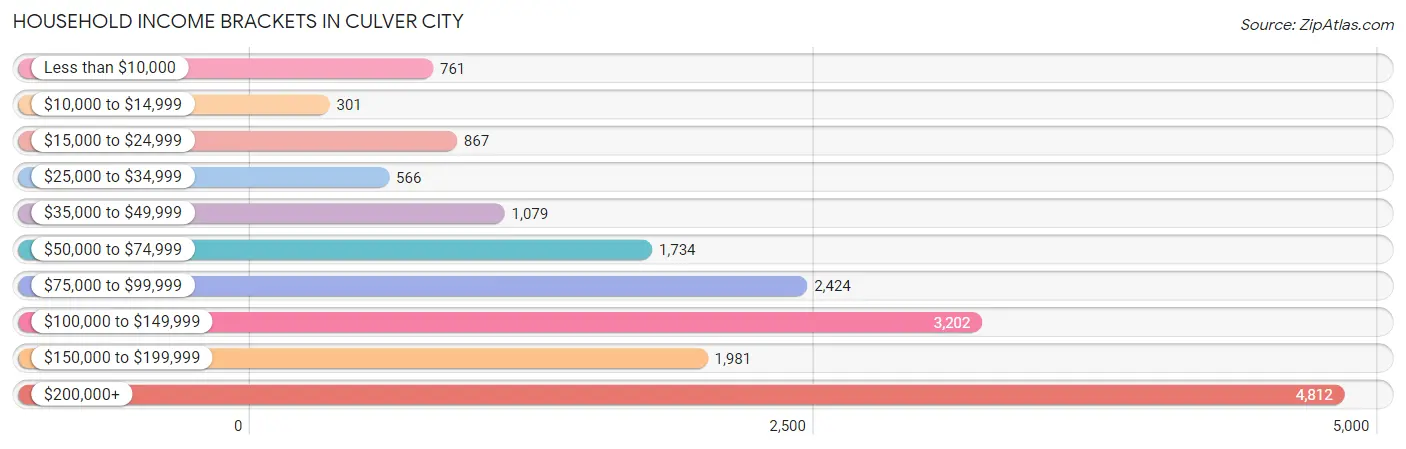
| Income Bracket | # Households | % Households |
| Less than $10,000 | 761 | 4.3% |
| $10,000 to $14,999 | 301 | 1.7% |
| $15,000 to $24,999 | 867 | 4.9% |
| $25,000 to $34,999 | 566 | 3.2% |
| $35,000 to $49,999 | 1,079 | 6.1% |
| $50,000 to $74,999 | 1,734 | 9.8% |
| $75,000 to $99,999 | 2,424 | 13.7% |
| $100,000 to $149,999 | 3,202 | 18.1% |
| $150,000 to $199,999 | 1,981 | 11.2% |
| $200,000+ | 4,812 | 27.2% |
Household Income by Householder Age in Culver City
The median household income in Culver City is $114,429, with the highest median household income of $147,579 found in the 25 to 44 years age bracket for the primary householder. A total of 6,603 households (37.3%) fall into this category. Meanwhile, the 15 to 24 years age bracket for the primary householder has the lowest median household income of $57,143, with 268 households (1.5%) in this group.
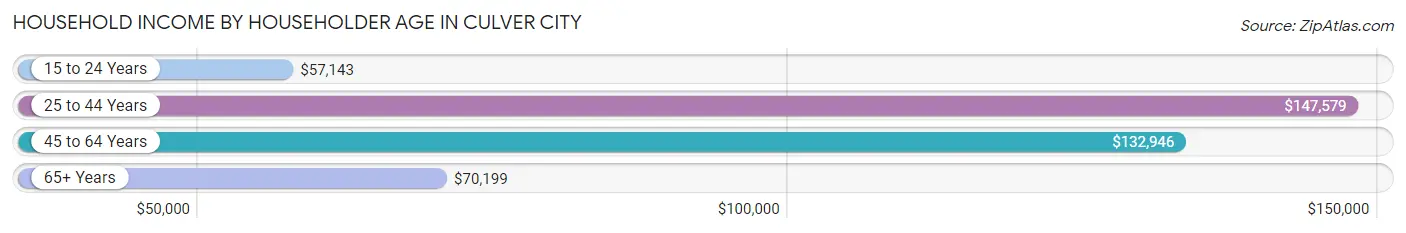
| Income Bracket | # Households | Median Income |
| 15 to 24 Years | 268 (1.5%) | $57,143 |
| 25 to 44 Years | 6,603 (37.3%) | $147,579 |
| 45 to 64 Years | 6,223 (35.2%) | $132,946 |
| 65+ Years | 4,597 (26.0%) | $70,199 |
| Total | 17,691 (100.0%) | $114,429 |
Poverty in Culver City
Income Below Poverty by Sex and Age in Culver City
With 4.8% poverty level for males and 7.0% for females among the residents of Culver City, 16 and 17 year old males and 75 year old and over females are the most vulnerable to poverty, with 81 males (27.2%) and 474 females (23.2%) in their respective age groups living below the poverty level.
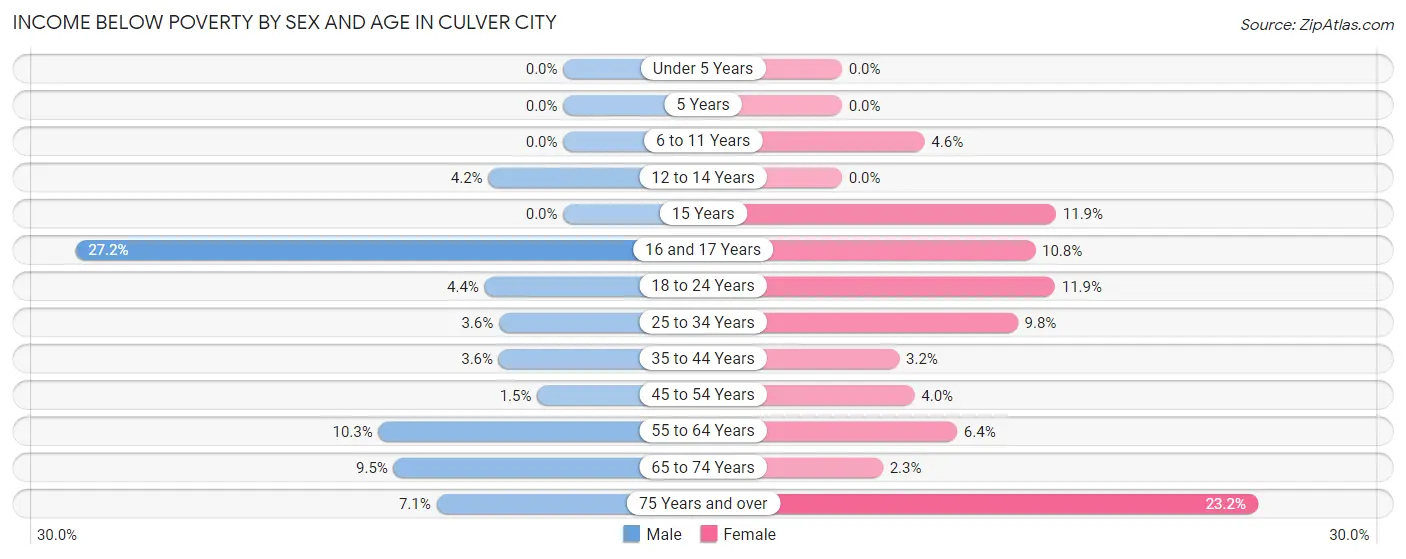
| Age Bracket | Male | Female |
| Under 5 Years | 0 (0.0%) | 0 (0.0%) |
| 5 Years | 0 (0.0%) | 0 (0.0%) |
| 6 to 11 Years | 0 (0.0%) | 64 (4.6%) |
| 12 to 14 Years | 31 (4.2%) | 0 (0.0%) |
| 15 Years | 0 (0.0%) | 18 (11.9%) |
| 16 and 17 Years | 81 (27.2%) | 37 (10.8%) |
| 18 to 24 Years | 43 (4.4%) | 91 (11.9%) |
| 25 to 34 Years | 116 (3.6%) | 341 (9.8%) |
| 35 to 44 Years | 103 (3.6%) | 100 (3.2%) |
| 45 to 54 Years | 39 (1.5%) | 125 (4.0%) |
| 55 to 64 Years | 290 (10.3%) | 158 (6.4%) |
| 65 to 74 Years | 143 (9.5%) | 54 (2.3%) |
| 75 Years and over | 61 (7.1%) | 474 (23.2%) |
| Total | 907 (4.8%) | 1,462 (7.0%) |
Income Above Poverty by Sex and Age in Culver City
According to the poverty statistics in Culver City, males aged under 5 years and females aged under 5 years are the age groups that are most secure financially, with 100.0% of males and 100.0% of females in these age groups living above the poverty line.
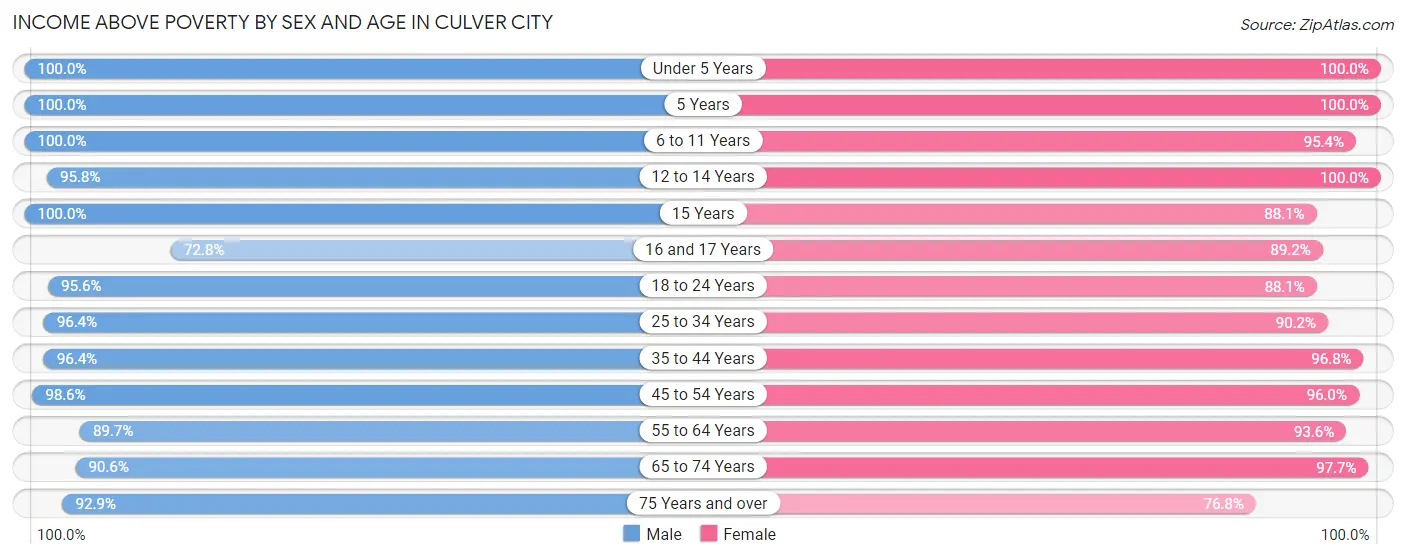
| Age Bracket | Male | Female |
| Under 5 Years | 1,259 (100.0%) | 1,092 (100.0%) |
| 5 Years | 249 (100.0%) | 128 (100.0%) |
| 6 to 11 Years | 1,376 (100.0%) | 1,328 (95.4%) |
| 12 to 14 Years | 713 (95.8%) | 582 (100.0%) |
| 15 Years | 96 (100.0%) | 133 (88.1%) |
| 16 and 17 Years | 217 (72.8%) | 307 (89.2%) |
| 18 to 24 Years | 939 (95.6%) | 676 (88.1%) |
| 25 to 34 Years | 3,128 (96.4%) | 3,141 (90.2%) |
| 35 to 44 Years | 2,768 (96.4%) | 3,035 (96.8%) |
| 45 to 54 Years | 2,646 (98.6%) | 2,967 (96.0%) |
| 55 to 64 Years | 2,529 (89.7%) | 2,306 (93.6%) |
| 65 to 74 Years | 1,370 (90.5%) | 2,315 (97.7%) |
| 75 Years and over | 803 (92.9%) | 1,573 (76.8%) |
| Total | 18,093 (95.2%) | 19,583 (93.0%) |
Income Below Poverty Among Married-Couple Families in Culver City
The poverty statistics for married-couple families in Culver City show that 1.2% or 97 of the total 7,813 families live below the poverty line. Families with 1 or 2 children have the highest poverty rate of 1.8%, comprising of 63 families. On the other hand, families with 3 or 4 children have the lowest poverty rate of 0.0%, which includes 0 families.
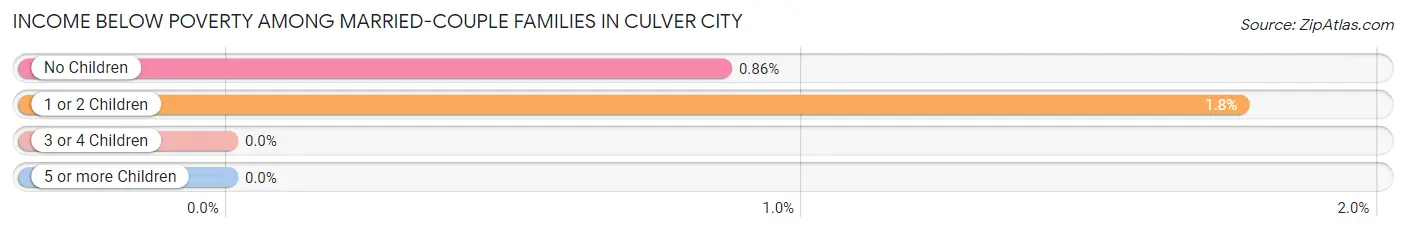
| Children | Above Poverty | Below Poverty |
| No Children | 3,926 (99.1%) | 34 (0.9%) |
| 1 or 2 Children | 3,508 (98.2%) | 63 (1.8%) |
| 3 or 4 Children | 264 (100.0%) | 0 (0.0%) |
| 5 or more Children | 18 (100.0%) | 0 (0.0%) |
| Total | 7,716 (98.8%) | 97 (1.2%) |
Income Below Poverty Among Single-Parent Households in Culver City
According to the poverty data in Culver City, 12.9% or 75 single-father households and 3.8% or 51 single-mother households are living below the poverty line. Among single-father households, those with 1 or 2 children have the highest poverty rate, with 35 households (18.5%) experiencing poverty. Likewise, among single-mother households, those with 1 or 2 children have the highest poverty rate, with 41 households (7.5%) falling below the poverty line.
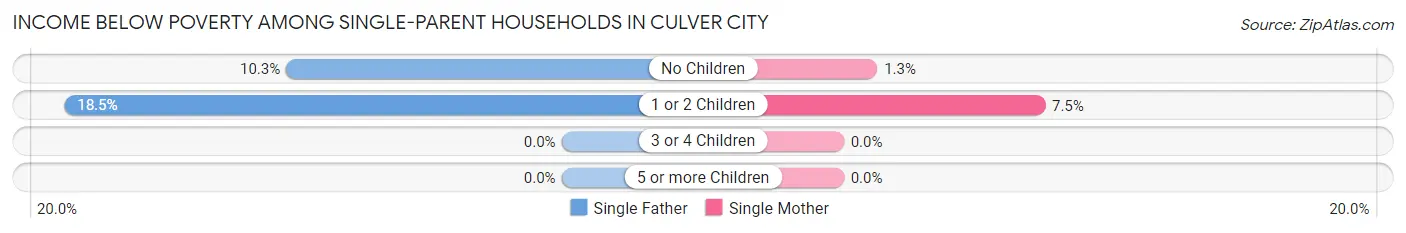
| Children | Single Father | Single Mother |
| No Children | 40 (10.3%) | 10 (1.3%) |
| 1 or 2 Children | 35 (18.5%) | 41 (7.5%) |
| 3 or 4 Children | 0 (0.0%) | 0 (0.0%) |
| 5 or more Children | 0 (0.0%) | 0 (0.0%) |
| Total | 75 (12.9%) | 51 (3.8%) |
Income Below Poverty Among Married-Couple vs Single-Parent Households in Culver City
The poverty data for Culver City shows that 97 of the married-couple family households (1.2%) and 126 of the single-parent households (6.5%) are living below the poverty level. Within the married-couple family households, those with 1 or 2 children have the highest poverty rate, with 63 households (1.8%) falling below the poverty line. Among the single-parent households, those with 1 or 2 children have the highest poverty rate, with 76 household (10.3%) living below poverty.
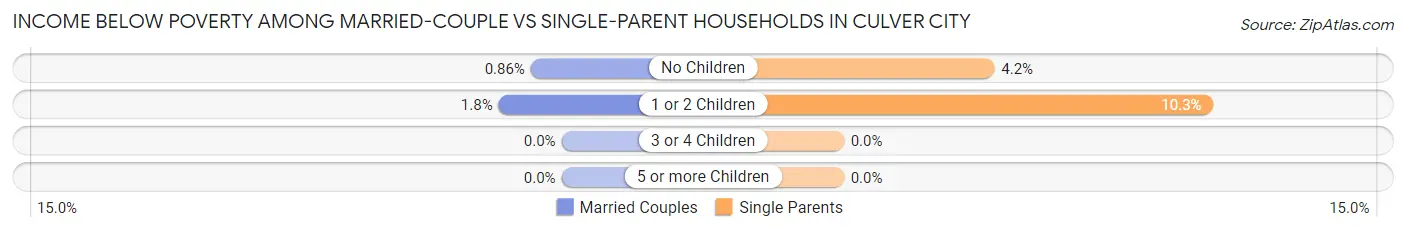
| Children | Married-Couple Families | Single-Parent Households |
| No Children | 34 (0.9%) | 50 (4.2%) |
| 1 or 2 Children | 63 (1.8%) | 76 (10.3%) |
| 3 or 4 Children | 0 (0.0%) | 0 (0.0%) |
| 5 or more Children | 0 (0.0%) | 0 (0.0%) |
| Total | 97 (1.2%) | 126 (6.5%) |
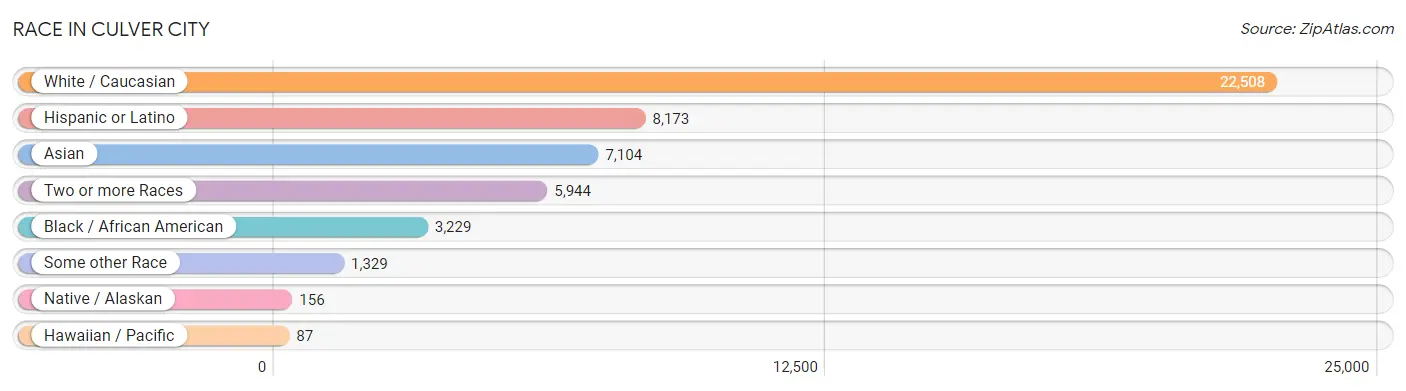
Race in Culver City
The most populous races in Culver City are White / Caucasian (22,508 | 55.8%), Hispanic or Latino (8,173 | 20.3%), and Asian (7,104 | 17.6%).
| Race | # Population | % Population |
| Asian | 7,104 | 17.6% |
| Black / African American | 3,229 | 8.0% |
| Hawaiian / Pacific | 87 | 0.2% |
| Hispanic or Latino | 8,173 | 20.3% |
| Native / Alaskan | 156 | 0.4% |
| White / Caucasian | 22,508 | 55.8% |
| Two or more Races | 5,944 | 14.7% |
| Some other Race | 1,329 | 3.3% |
| Total | 40,357 | 100.0% |
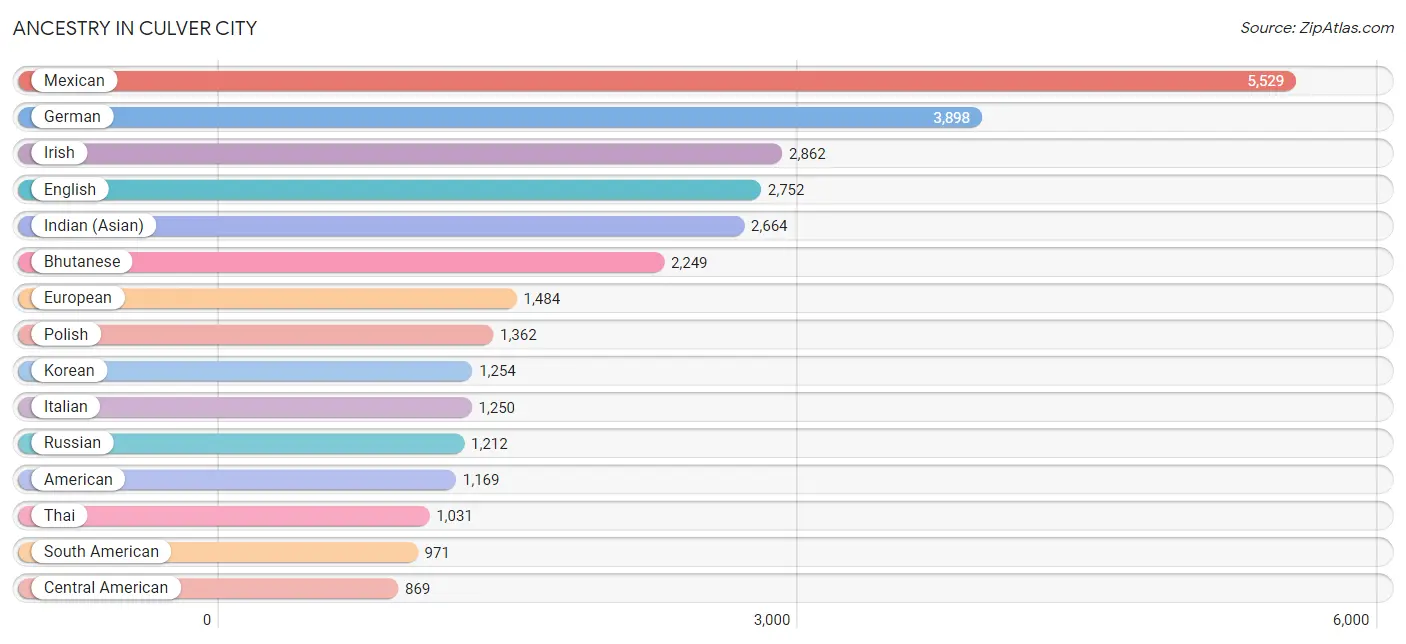
Ancestry in Culver City
The most populous ancestries reported in Culver City are Mexican (5,529 | 13.7%), German (3,898 | 9.7%), Irish (2,862 | 7.1%), English (2,752 | 6.8%), and Indian (Asian) (2,664 | 6.6%), together accounting for 43.9% of all Culver City residents.
| Ancestry | # Population | % Population |
| African | 259 | 0.6% |
| American | 1,169 | 2.9% |
| Arab | 621 | 1.5% |
| Argentinean | 242 | 0.6% |
| Armenian | 78 | 0.2% |
| Assyrian / Chaldean / Syriac | 60 | 0.2% |
| Australian | 62 | 0.2% |
| Austrian | 127 | 0.3% |
| Bangladeshi | 6 | 0.0% |
| Basque | 19 | 0.1% |
| Belgian | 47 | 0.1% |
| Belizean | 13 | 0.0% |
| Bhutanese | 2,249 | 5.6% |
| Blackfeet | 1 | 0.0% |
| Bolivian | 18 | 0.0% |
| Brazilian | 104 | 0.3% |
| British | 484 | 1.2% |
| Bulgarian | 34 | 0.1% |
| Burmese | 787 | 1.9% |
| Cajun | 13 | 0.0% |
| Cambodian | 6 | 0.0% |
| Canadian | 338 | 0.8% |
| Central American | 869 | 2.1% |
| Central American Indian | 65 | 0.2% |
| Chickasaw | 11 | 0.0% |
| Chilean | 3 | 0.0% |
| Chippewa | 30 | 0.1% |
| Choctaw | 26 | 0.1% |
| Colombian | 250 | 0.6% |
| Costa Rican | 44 | 0.1% |
| Creek | 10 | 0.0% |
| Croatian | 142 | 0.4% |
| Cuban | 111 | 0.3% |
| Czech | 255 | 0.6% |
| Czechoslovakian | 7 | 0.0% |
| Danish | 233 | 0.6% |
| Dutch | 267 | 0.7% |
| Eastern European | 458 | 1.1% |
| Egyptian | 223 | 0.5% |
| English | 2,752 | 6.8% |
| Estonian | 14 | 0.0% |
| Ethiopian | 226 | 0.6% |
| European | 1,484 | 3.7% |
| Fijian | 24 | 0.1% |
| Filipino | 290 | 0.7% |
| Finnish | 115 | 0.3% |
| French | 711 | 1.8% |
| French Canadian | 151 | 0.4% |
| German | 3,898 | 9.7% |
| Ghanaian | 8 | 0.0% |
| Greek | 217 | 0.5% |
| Guatemalan | 257 | 0.6% |
| Guyanese | 44 | 0.1% |
| Haitian | 25 | 0.1% |
| Honduran | 195 | 0.5% |
| Hungarian | 127 | 0.3% |
| Indian (Asian) | 2,664 | 6.6% |
| Indonesian | 210 | 0.5% |
| Iranian | 473 | 1.2% |
| Irish | 2,862 | 7.1% |
| Israeli | 207 | 0.5% |
| Italian | 1,250 | 3.1% |
| Jamaican | 63 | 0.2% |
| Japanese | 42 | 0.1% |
| Korean | 1,254 | 3.1% |
| Laotian | 215 | 0.5% |
| Latvian | 103 | 0.3% |
| Lebanese | 75 | 0.2% |
| Lithuanian | 95 | 0.2% |
| Malaysian | 45 | 0.1% |
| Mexican | 5,529 | 13.7% |
| Moroccan | 6 | 0.0% |
| Native Hawaiian | 79 | 0.2% |
| Nicaraguan | 57 | 0.1% |
| Nigerian | 156 | 0.4% |
| Northern European | 55 | 0.1% |
| Norwegian | 460 | 1.1% |
| Osage | 37 | 0.1% |
| Pakistani | 205 | 0.5% |
| Pennsylvania German | 10 | 0.0% |
| Peruvian | 122 | 0.3% |
| Polish | 1,362 | 3.4% |
| Portuguese | 63 | 0.2% |
| Pueblo | 8 | 0.0% |
| Puerto Rican | 161 | 0.4% |
| Romanian | 103 | 0.3% |
| Russian | 1,212 | 3.0% |
| Salvadoran | 316 | 0.8% |
| Samoan | 14 | 0.0% |
| Scandinavian | 80 | 0.2% |
| Scotch-Irish | 232 | 0.6% |
| Scottish | 359 | 0.9% |
| Serbian | 66 | 0.2% |
| Sioux | 43 | 0.1% |
| Slavic | 38 | 0.1% |
| Slovak | 50 | 0.1% |
| South American | 971 | 2.4% |
| Spaniard | 434 | 1.1% |
| Spanish | 6 | 0.0% |
| Sri Lankan | 102 | 0.3% |
| Subsaharan African | 738 | 1.8% |
| Swedish | 523 | 1.3% |
| Swiss | 116 | 0.3% |
| Syrian | 33 | 0.1% |
| Thai | 1,031 | 2.5% |
| Trinidadian and Tobagonian | 25 | 0.1% |
| Turkish | 77 | 0.2% |
| Ukrainian | 187 | 0.5% |
| Uruguayan | 10 | 0.0% |
| Venezuelan | 326 | 0.8% |
| Welsh | 217 | 0.5% |
| West Indian | 107 | 0.3% |
| Yugoslavian | 22 | 0.1% | View All 113 Rows |
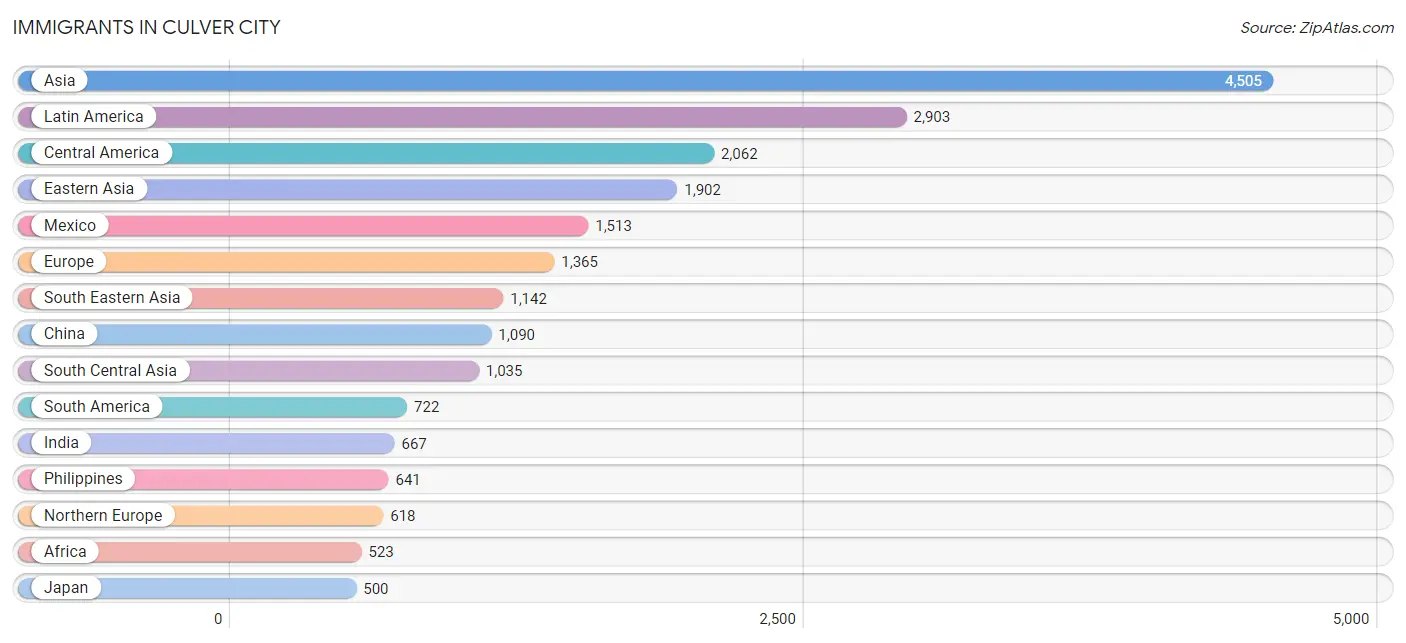
Immigrants in Culver City
The most numerous immigrant groups reported in Culver City came from Asia (4,505 | 11.2%), Latin America (2,903 | 7.2%), Central America (2,062 | 5.1%), Eastern Asia (1,902 | 4.7%), and Mexico (1,513 | 3.7%), together accounting for 31.9% of all Culver City residents.
| Immigration Origin | # Population | % Population |
| Africa | 523 | 1.3% |
| Argentina | 119 | 0.3% |
| Asia | 4,505 | 11.2% |
| Australia | 42 | 0.1% |
| Austria | 19 | 0.1% |
| Bangladesh | 1 | 0.0% |
| Barbados | 9 | 0.0% |
| Belize | 57 | 0.1% |
| Brazil | 175 | 0.4% |
| Bulgaria | 15 | 0.0% |
| Cambodia | 21 | 0.1% |
| Cameroon | 15 | 0.0% |
| Canada | 300 | 0.7% |
| Caribbean | 119 | 0.3% |
| Central America | 2,062 | 5.1% |
| Chile | 3 | 0.0% |
| China | 1,090 | 2.7% |
| Colombia | 185 | 0.5% |
| Congo | 67 | 0.2% |
| Cuba | 17 | 0.0% |
| Czechoslovakia | 15 | 0.0% |
| Denmark | 87 | 0.2% |
| Eastern Africa | 182 | 0.4% |
| Eastern Asia | 1,902 | 4.7% |
| Eastern Europe | 223 | 0.5% |
| Egypt | 221 | 0.5% |
| El Salvador | 186 | 0.5% |
| England | 90 | 0.2% |
| Ethiopia | 160 | 0.4% |
| Europe | 1,365 | 3.4% |
| Fiji | 94 | 0.2% |
| France | 119 | 0.3% |
| Germany | 197 | 0.5% |
| Ghana | 8 | 0.0% |
| Greece | 32 | 0.1% |
| Guatemala | 149 | 0.4% |
| Guyana | 33 | 0.1% |
| Honduras | 113 | 0.3% |
| Hong Kong | 48 | 0.1% |
| Hungary | 14 | 0.0% |
| India | 667 | 1.7% |
| Indonesia | 98 | 0.2% |
| Iran | 264 | 0.6% |
| Ireland | 42 | 0.1% |
| Israel | 310 | 0.8% |
| Italy | 36 | 0.1% |
| Jamaica | 16 | 0.0% |
| Japan | 500 | 1.2% |
| Jordan | 6 | 0.0% |
| Kazakhstan | 30 | 0.1% |
| Korea | 306 | 0.8% |
| Latin America | 2,903 | 7.2% |
| Lebanon | 31 | 0.1% |
| Mexico | 1,513 | 3.7% |
| Middle Africa | 82 | 0.2% |
| Nepal | 13 | 0.0% |
| Netherlands | 62 | 0.2% |
| Nicaragua | 44 | 0.1% |
| Nigeria | 17 | 0.0% |
| Northern Africa | 221 | 0.5% |
| Northern Europe | 618 | 1.5% |
| Oceania | 148 | 0.4% |
| Pakistan | 48 | 0.1% |
| Peru | 28 | 0.1% |
| Philippines | 641 | 1.6% |
| Poland | 30 | 0.1% |
| Russia | 67 | 0.2% |
| Senegal | 4 | 0.0% |
| Singapore | 12 | 0.0% |
| South Africa | 9 | 0.0% |
| South America | 722 | 1.8% |
| South Central Asia | 1,035 | 2.6% |
| South Eastern Asia | 1,142 | 2.8% |
| Southern Europe | 111 | 0.3% |
| Spain | 43 | 0.1% |
| Sweden | 19 | 0.1% |
| Switzerland | 16 | 0.0% |
| Taiwan | 196 | 0.5% |
| Thailand | 80 | 0.2% |
| Trinidad and Tobago | 62 | 0.2% |
| Turkey | 61 | 0.2% |
| Ukraine | 82 | 0.2% |
| Venezuela | 168 | 0.4% |
| Vietnam | 85 | 0.2% |
| West Indies | 3 | 0.0% |
| Western Africa | 29 | 0.1% |
| Western Asia | 426 | 1.1% |
| Western Europe | 413 | 1.0% | View All 88 Rows |
Sex and Age in Culver City
Sex and Age in Culver City
The most populous age groups in Culver City are 30 to 34 Years (1,982 | 10.3%) for men and 30 to 34 Years (2,350 | 11.1%) for women.

| Age Bracket | Male | Female |
| Under 5 Years | 1,311 (6.8%) | 1,092 (5.1%) |
| 5 to 9 Years | 954 (5.0%) | 1,190 (5.6%) |
| 10 to 14 Years | 1,437 (7.5%) | 912 (4.3%) |
| 15 to 19 Years | 563 (2.9%) | 581 (2.7%) |
| 20 to 24 Years | 813 (4.2%) | 681 (3.2%) |
| 25 to 29 Years | 1,268 (6.6%) | 1,132 (5.3%) |
| 30 to 34 Years | 1,982 (10.3%) | 2,350 (11.1%) |
| 35 to 39 Years | 1,390 (7.3%) | 1,390 (6.6%) |
| 40 to 44 Years | 1,481 (7.7%) | 1,749 (8.3%) |
| 45 to 49 Years | 1,448 (7.6%) | 1,783 (8.4%) |
| 50 to 54 Years | 1,255 (6.6%) | 1,309 (6.2%) |
| 55 to 59 Years | 1,250 (6.5%) | 1,126 (5.3%) |
| 60 to 64 Years | 1,580 (8.3%) | 1,343 (6.3%) |
| 65 to 69 Years | 868 (4.5%) | 1,453 (6.9%) |
| 70 to 74 Years | 669 (3.5%) | 932 (4.4%) |
| 75 to 79 Years | 368 (1.9%) | 651 (3.1%) |
| 80 to 84 Years | 293 (1.5%) | 639 (3.0%) |
| 85 Years and over | 225 (1.2%) | 889 (4.2%) |
| Total | 19,155 (100.0%) | 21,202 (100.0%) |
Families and Households in Culver City
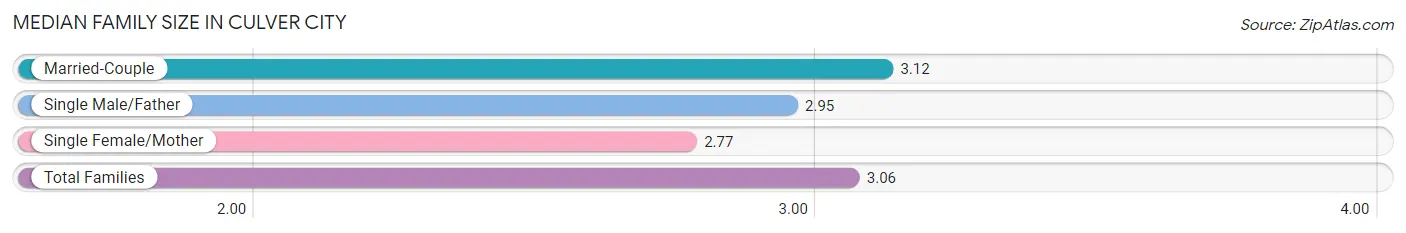
Median Family Size in Culver City
The median family size in Culver City is 3.06 persons per family, with married-couple families (7,813 | 80.2%) accounting for the largest median family size of 3.12 persons per family. On the other hand, single female/mother families (1,345 | 13.8%) represent the smallest median family size with 2.77 persons per family.
| Family Type | # Families | Family Size |
| Married-Couple | 7,813 (80.2%) | 3.12 |
| Single Male/Father | 583 (6.0%) | 2.95 |
| Single Female/Mother | 1,345 (13.8%) | 2.77 |
| Total Families | 9,741 (100.0%) | 3.06 |
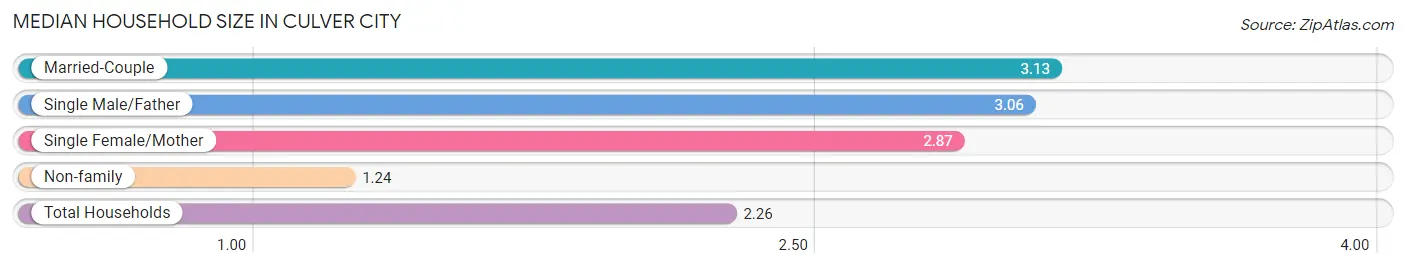
Median Household Size in Culver City
The median household size in Culver City is 2.26 persons per household, with married-couple households (7,813 | 44.2%) accounting for the largest median household size of 3.13 persons per household. non-family households (7,950 | 44.9%) represent the smallest median household size with 1.24 persons per household.
| Household Type | # Households | Household Size |
| Married-Couple | 7,813 (44.2%) | 3.13 |
| Single Male/Father | 583 (3.3%) | 3.06 |
| Single Female/Mother | 1,345 (7.6%) | 2.87 |
| Non-family | 7,950 (44.9%) | 1.24 |
| Total Households | 17,691 (100.0%) | 2.26 |
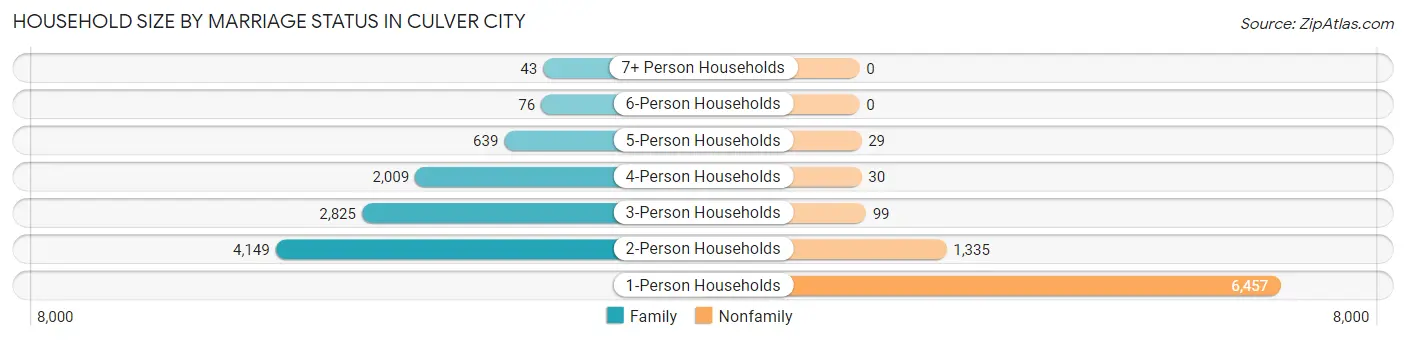
Household Size by Marriage Status in Culver City
Out of a total of 17,691 households in Culver City, 9,741 (55.1%) are family households, while 7,950 (44.9%) are nonfamily households. The most numerous type of family households are 2-person households, comprising 4,149, and the most common type of nonfamily households are 1-person households, comprising 6,457.
| Household Size | Family Households | Nonfamily Households |
| 1-Person Households | - | 6,457 (36.5%) |
| 2-Person Households | 4,149 (23.4%) | 1,335 (7.5%) |
| 3-Person Households | 2,825 (16.0%) | 99 (0.6%) |
| 4-Person Households | 2,009 (11.4%) | 30 (0.2%) |
| 5-Person Households | 639 (3.6%) | 29 (0.2%) |
| 6-Person Households | 76 (0.4%) | 0 (0.0%) |
| 7+ Person Households | 43 (0.2%) | 0 (0.0%) |
| Total | 9,741 (55.1%) | 7,950 (44.9%) |
Female Fertility in Culver City
Fertility by Age in Culver City
Average fertility rate in Culver City is 34.0 births per 1,000 women. Women in the age bracket of 20 to 34 years have the highest fertility rate with 52.0 births per 1,000 women. Women in the age bracket of 20 to 34 years acount for 64.3% of all women with births.
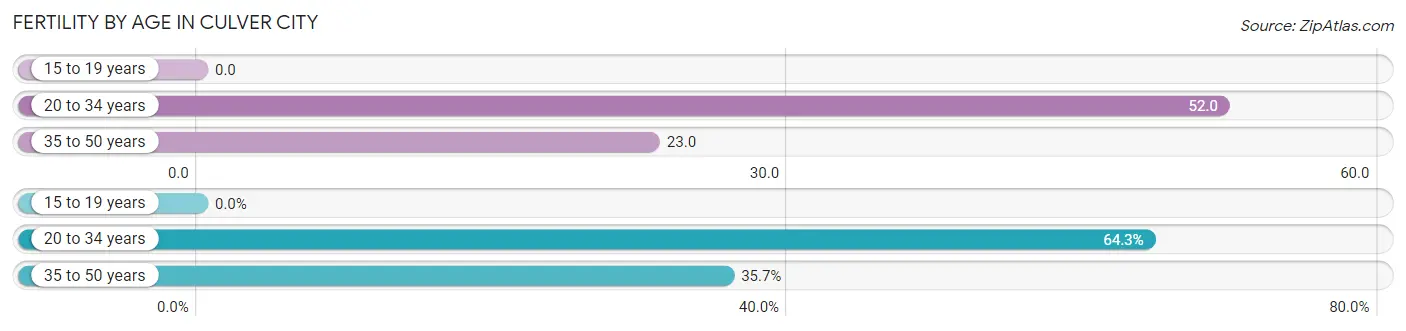
| Age Bracket | Women with Births | Births / 1,000 Women |
| 15 to 19 years | 0 (0.0%) | 0.0 |
| 20 to 34 years | 216 (64.3%) | 52.0 |
| 35 to 50 years | 120 (35.7%) | 23.0 |
| Total | 336 (100.0%) | 34.0 |
Fertility by Age by Marriage Status in Culver City
82.7% of women with births (336) in Culver City are married. The highest percentage of unmarried women with births falls into 20 to 34 years age bracket with 19.9% of them unmarried at the time of birth, while the lowest percentage of unmarried women with births belong to 35 to 50 years age bracket with 12.5% of them unmarried.
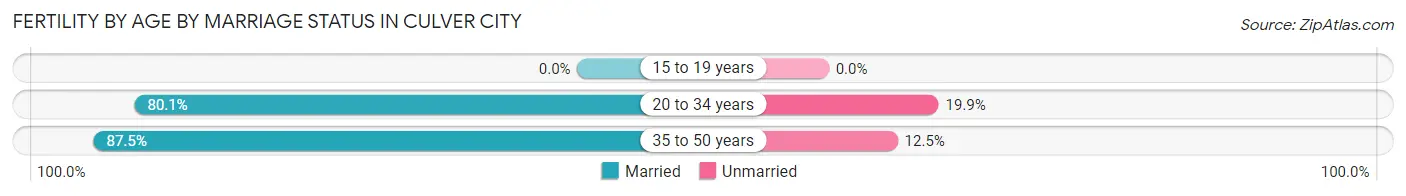
| Age Bracket | Married | Unmarried |
| 15 to 19 years | 0 (0.0%) | 0 (0.0%) |
| 20 to 34 years | 173 (80.1%) | 43 (19.9%) |
| 35 to 50 years | 105 (87.5%) | 15 (12.5%) |
| Total | 278 (82.7%) | 58 (17.3%) |
Fertility by Education in Culver City
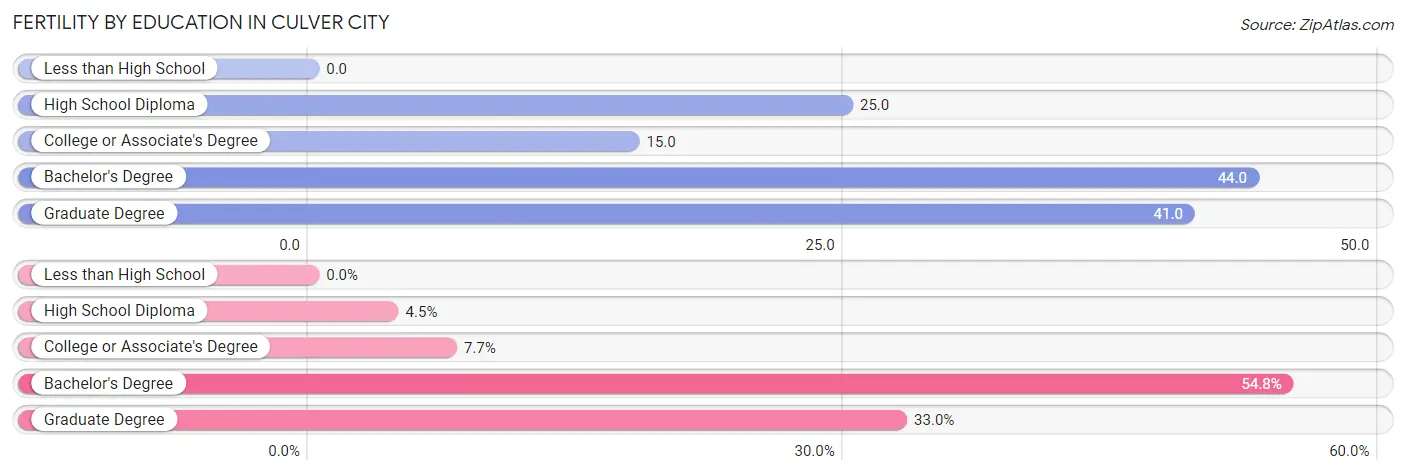
| Educational Attainment | Women with Births | Births / 1,000 Women |
| Less than High School | 0 (0.0%) | 0.0 |
| High School Diploma | 15 (4.5%) | 25.0 |
| College or Associate's Degree | 26 (7.7%) | 15.0 |
| Bachelor's Degree | 184 (54.8%) | 44.0 |
| Graduate Degree | 111 (33.0%) | 41.0 |
| Total | 336 (100.0%) | 34.0 |
Fertility by Education by Marriage Status in Culver City
17.3% of women with births in Culver City are unmarried. Women with the educational attainment of bachelor's degree are most likely to be married with 100.0% of them married at childbirth, while women with the educational attainment of high school diploma are least likely to be married with 100.0% of them unmarried at childbirth.
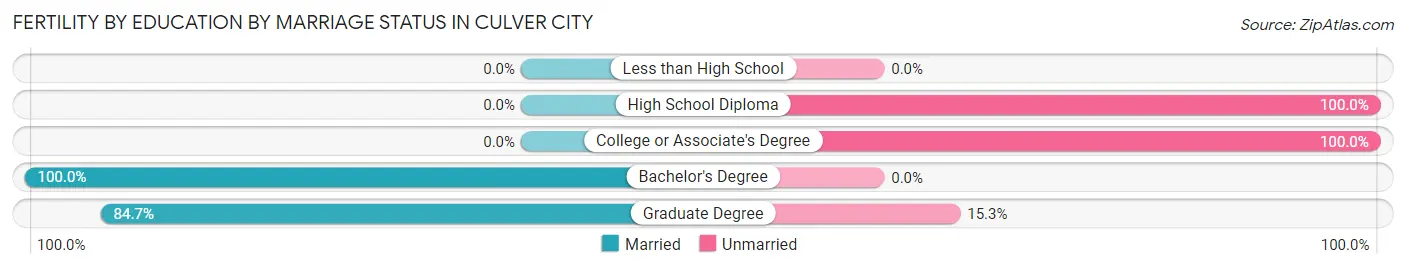
| Educational Attainment | Married | Unmarried |
| Less than High School | 0 (0.0%) | 0 (0.0%) |
| High School Diploma | 0 (0.0%) | 15 (100.0%) |
| College or Associate's Degree | 0 (0.0%) | 26 (100.0%) |
| Bachelor's Degree | 184 (100.0%) | 0 (0.0%) |
| Graduate Degree | 94 (84.7%) | 17 (15.3%) |
| Total | 278 (82.7%) | 58 (17.3%) |
Employment Characteristics in Culver City
Employment by Class of Employer in Culver City
Among the 21,523 employed individuals in Culver City, private company employees (13,327 | 61.9%), not-for-profit organizations (2,107 | 9.8%), and self-employed (not incorporated) (1,773 | 8.2%) make up the most common classes of employment.
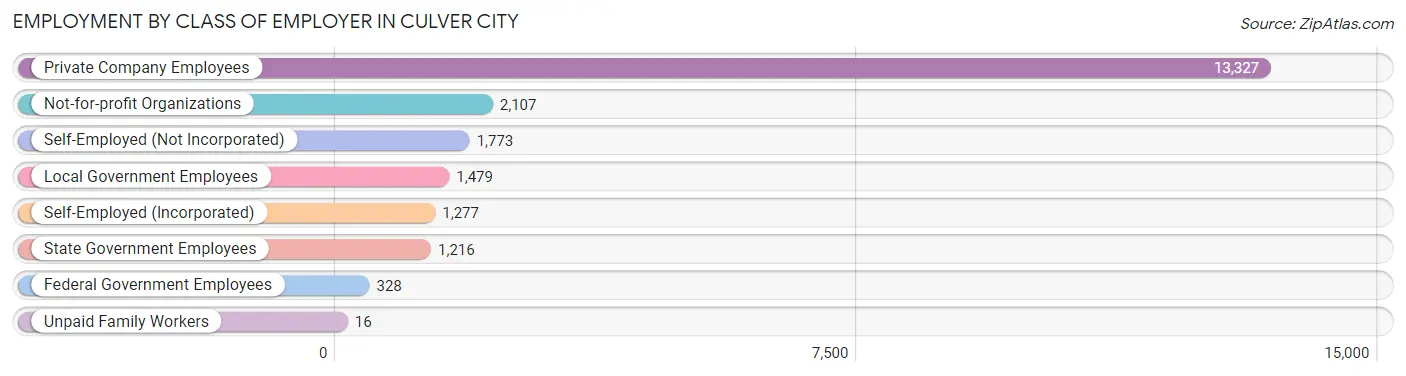
| Employer Class | # Employees | % Employees |
| Private Company Employees | 13,327 | 61.9% |
| Self-Employed (Incorporated) | 1,277 | 5.9% |
| Self-Employed (Not Incorporated) | 1,773 | 8.2% |
| Not-for-profit Organizations | 2,107 | 9.8% |
| Local Government Employees | 1,479 | 6.9% |
| State Government Employees | 1,216 | 5.7% |
| Federal Government Employees | 328 | 1.5% |
| Unpaid Family Workers | 16 | 0.1% |
| Total | 21,523 | 100.0% |
Employment Status by Age in Culver City
According to the labor force statistics for Culver City, out of the total population over 16 years of age (33,214), 69.4% or 23,051 individuals are in the labor force, with 5.2% or 1,199 of them unemployed. The age group with the highest labor force participation rate is 30 to 34 years, with 91.6% or 3,968 individuals in the labor force. Within the labor force, the 16 to 19 years age range has the highest percentage of unemployed individuals, with 18.1% or 21 of them being unemployed.
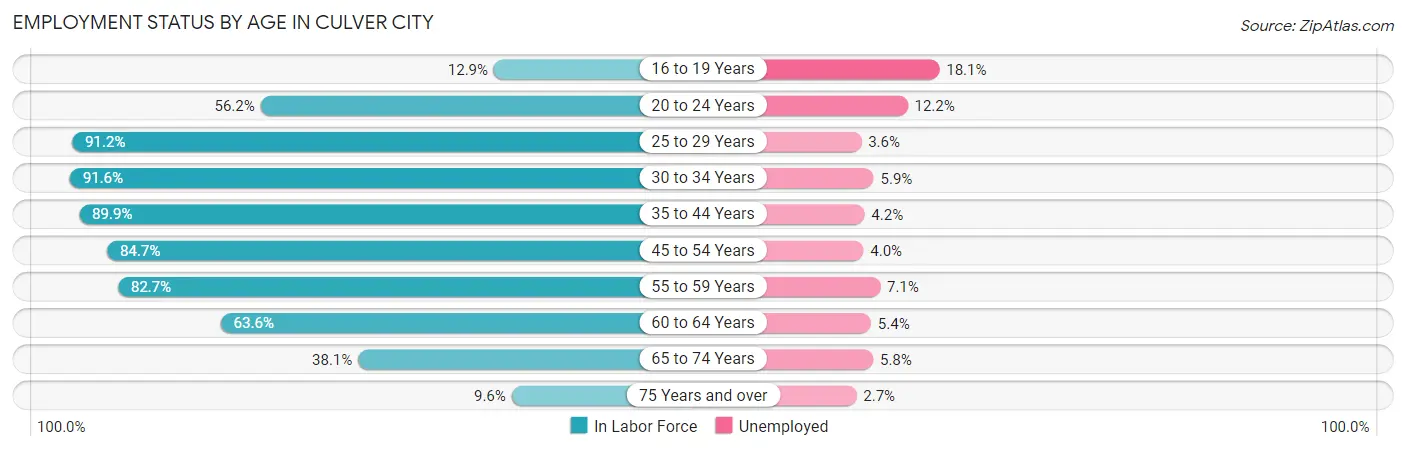
| Age Bracket | In Labor Force | Unemployed |
| 16 to 19 Years | 116 (12.9%) | 21 (18.1%) |
| 20 to 24 Years | 840 (56.2%) | 102 (12.2%) |
| 25 to 29 Years | 2,189 (91.2%) | 79 (3.6%) |
| 30 to 34 Years | 3,968 (91.6%) | 234 (5.9%) |
| 35 to 44 Years | 5,403 (89.9%) | 227 (4.2%) |
| 45 to 54 Years | 4,908 (84.7%) | 196 (4.0%) |
| 55 to 59 Years | 1,965 (82.7%) | 140 (7.1%) |
| 60 to 64 Years | 1,859 (63.6%) | 100 (5.4%) |
| 65 to 74 Years | 1,494 (38.1%) | 87 (5.8%) |
| 75 Years and over | 294 (9.6%) | 8 (2.7%) |
| Total | 23,051 (69.4%) | 1,199 (5.2%) |
Employment Status by Educational Attainment in Culver City
According to labor force statistics for Culver City, 85.1% of individuals (20,284) out of the total population between 25 and 64 years of age (23,836) are in the labor force, with 4.8% or 974 of them being unemployed. The group with the highest labor force participation rate are those with the educational attainment of bachelor's degree or higher, with 88.7% or 14,187 individuals in the labor force. Within the labor force, individuals with bachelor's degree or higher education have the highest percentage of unemployment, with 5.1% or 724 of them being unemployed.
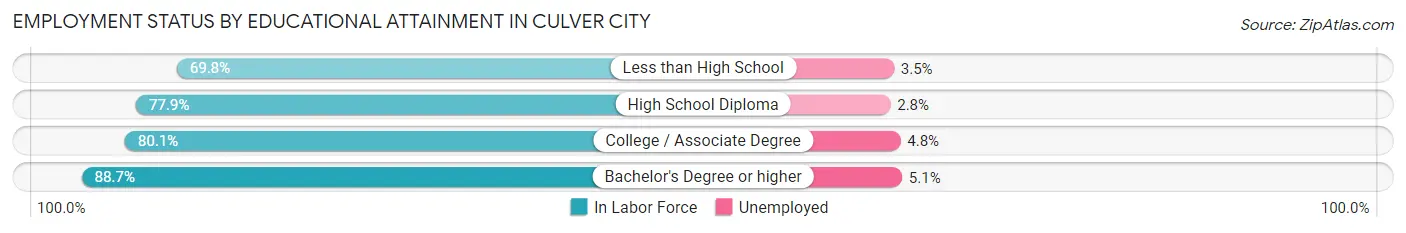
| Educational Attainment | In Labor Force | Unemployed |
| Less than High School | 889 (69.8%) | 45 (3.5%) |
| High School Diploma | 1,662 (77.9%) | 60 (2.8%) |
| College / Associate Degree | 3,552 (80.1%) | 213 (4.8%) |
| Bachelor's Degree or higher | 14,187 (88.7%) | 816 (5.1%) |
| Total | 20,284 (85.1%) | 1,144 (4.8%) |
Employment Occupations by Sex in Culver City
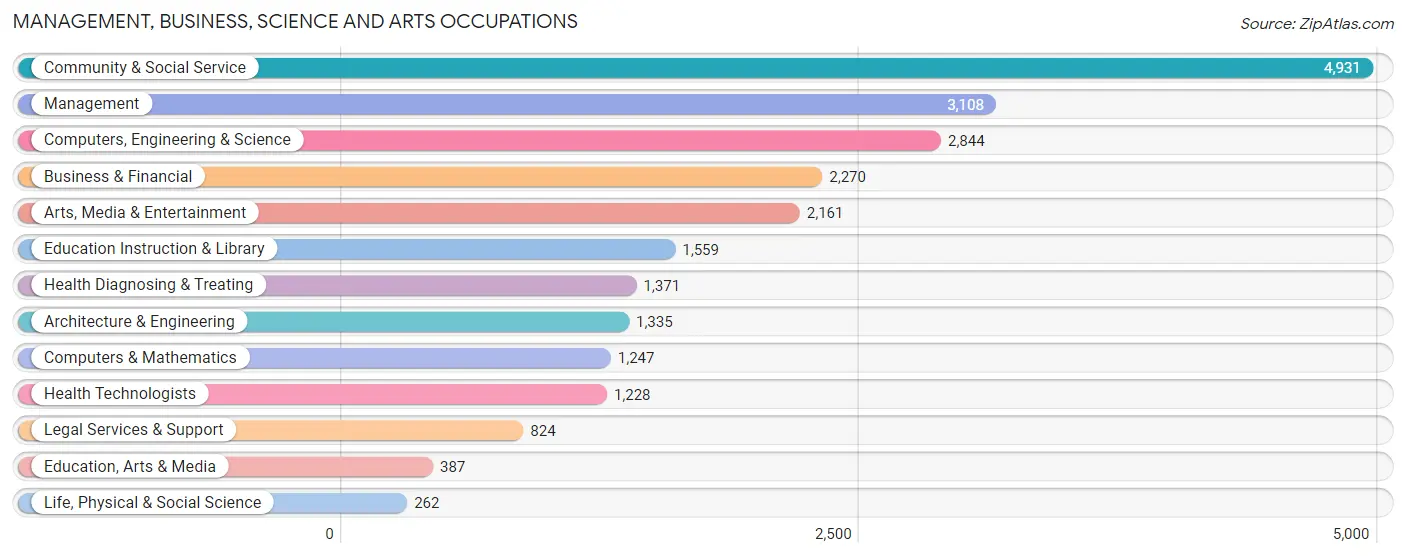
Management, Business, Science and Arts Occupations
The most common Management, Business, Science and Arts occupations in Culver City are Community & Social Service (4,931 | 22.6%), Management (3,108 | 14.2%), Computers, Engineering & Science (2,844 | 13.0%), Business & Financial (2,270 | 10.4%), and Arts, Media & Entertainment (2,161 | 9.9%).
Management, Business, Science and Arts Occupations by Sex
Within the Management, Business, Science and Arts occupations in Culver City, the most male-oriented occupations are Life, Physical & Social Science (81.7%), Architecture & Engineering (75.8%), and Computers, Engineering & Science (64.1%), while the most female-oriented occupations are Health Technologists (71.1%), Health Diagnosing & Treating (69.2%), and Education, Arts & Media (66.7%).
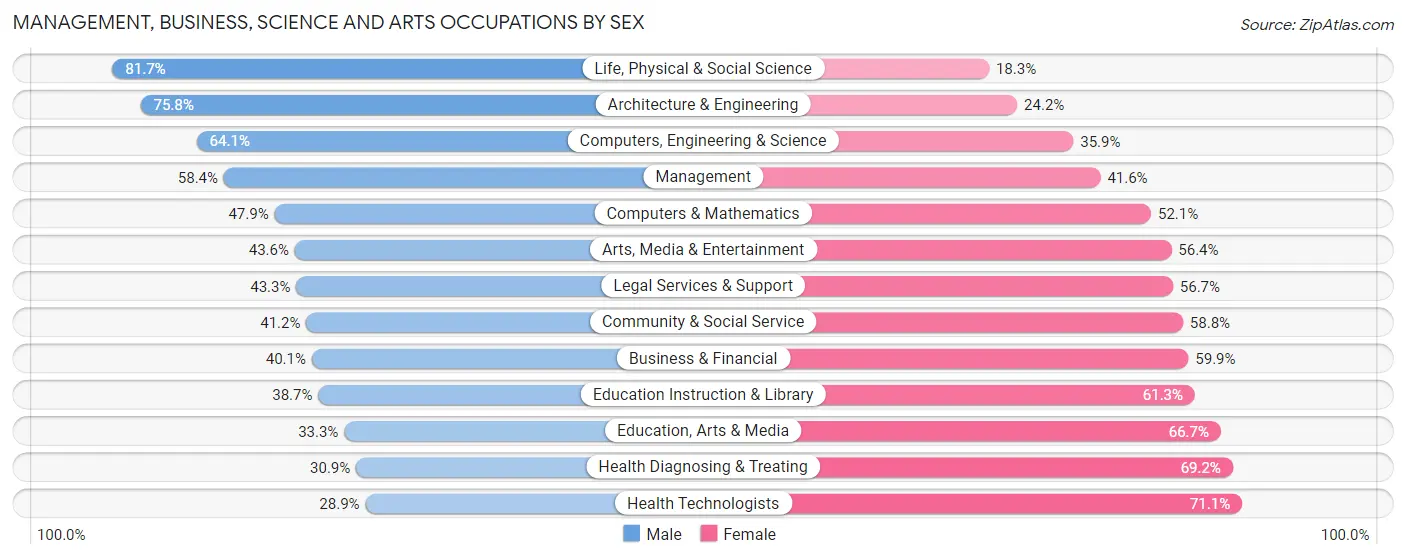
| Occupation | Male | Female |
| Management | 1,816 (58.4%) | 1,292 (41.6%) |
| Business & Financial | 910 (40.1%) | 1,360 (59.9%) |
| Computers, Engineering & Science | 1,823 (64.1%) | 1,021 (35.9%) |
| Computers & Mathematics | 597 (47.9%) | 650 (52.1%) |
| Architecture & Engineering | 1,012 (75.8%) | 323 (24.2%) |
| Life, Physical & Social Science | 214 (81.7%) | 48 (18.3%) |
| Community & Social Service | 2,033 (41.2%) | 2,898 (58.8%) |
| Education, Arts & Media | 129 (33.3%) | 258 (66.7%) |
| Legal Services & Support | 357 (43.3%) | 467 (56.7%) |
| Education Instruction & Library | 604 (38.7%) | 955 (61.3%) |
| Arts, Media & Entertainment | 943 (43.6%) | 1,218 (56.4%) |
| Health Diagnosing & Treating | 423 (30.8%) | 948 (69.2%) |
| Health Technologists | 355 (28.9%) | 873 (71.1%) |
| Total (Category) | 7,005 (48.2%) | 7,519 (51.8%) |
| Total (Overall) | 10,860 (49.7%) | 10,988 (50.3%) |
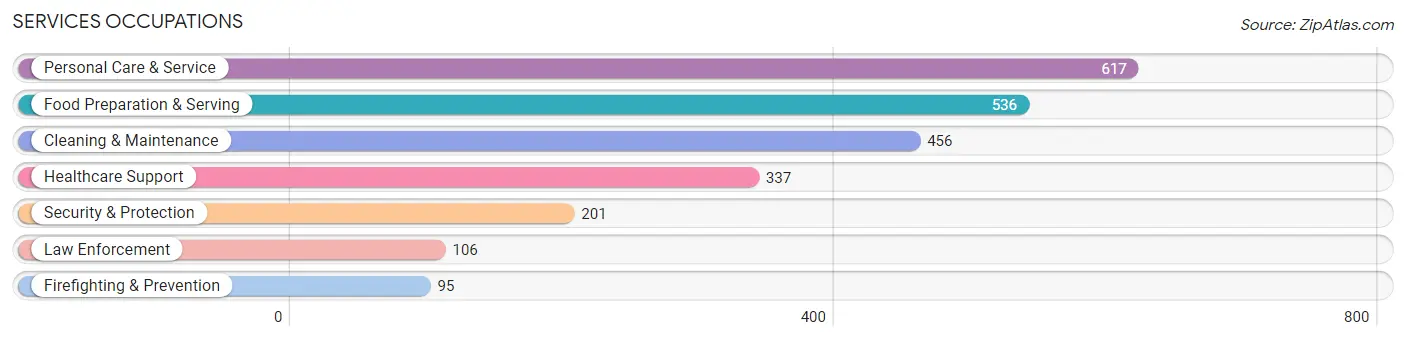
Services Occupations
The most common Services occupations in Culver City are Personal Care & Service (617 | 2.8%), Food Preparation & Serving (536 | 2.5%), Cleaning & Maintenance (456 | 2.1%), Healthcare Support (337 | 1.5%), and Security & Protection (201 | 0.9%).
Services Occupations by Sex
Within the Services occupations in Culver City, the most male-oriented occupations are Law Enforcement (100.0%), Security & Protection (92.0%), and Firefighting & Prevention (83.2%), while the most female-oriented occupations are Healthcare Support (95.0%), Cleaning & Maintenance (80.7%), and Personal Care & Service (75.8%).
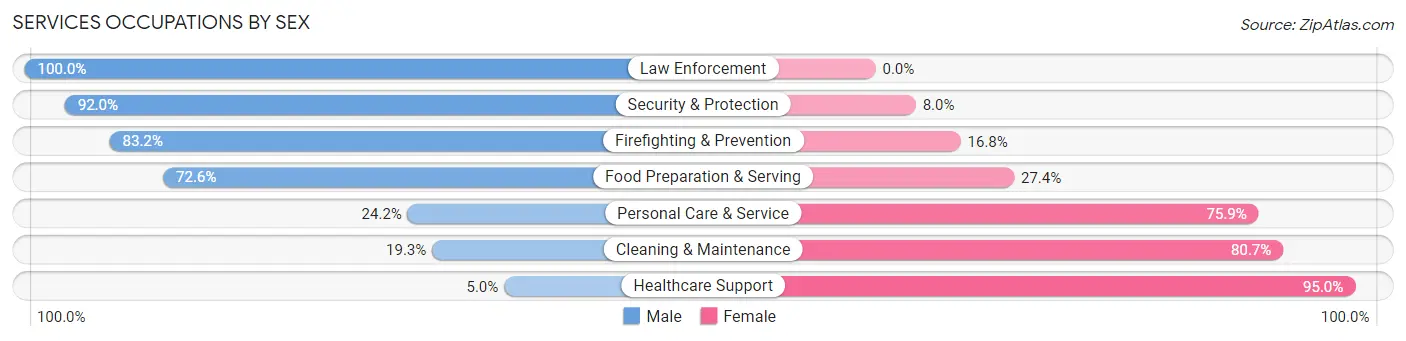
| Occupation | Male | Female |
| Healthcare Support | 17 (5.0%) | 320 (95.0%) |
| Security & Protection | 185 (92.0%) | 16 (8.0%) |
| Firefighting & Prevention | 79 (83.2%) | 16 (16.8%) |
| Law Enforcement | 106 (100.0%) | 0 (0.0%) |
| Food Preparation & Serving | 389 (72.6%) | 147 (27.4%) |
| Cleaning & Maintenance | 88 (19.3%) | 368 (80.7%) |
| Personal Care & Service | 149 (24.1%) | 468 (75.8%) |
| Total (Category) | 828 (38.6%) | 1,319 (61.4%) |
| Total (Overall) | 10,860 (49.7%) | 10,988 (50.3%) |
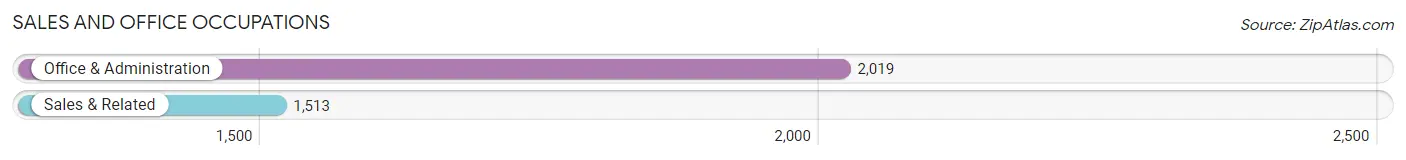
Sales and Office Occupations
The most common Sales and Office occupations in Culver City are Office & Administration (2,019 | 9.2%), and Sales & Related (1,513 | 6.9%).
Sales and Office Occupations by Sex
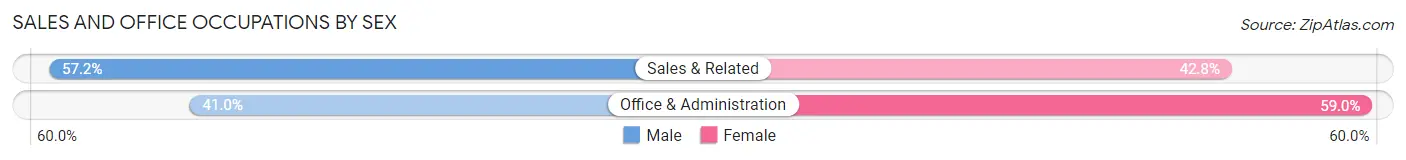
| Occupation | Male | Female |
| Sales & Related | 865 (57.2%) | 648 (42.8%) |
| Office & Administration | 827 (41.0%) | 1,192 (59.0%) |
| Total (Category) | 1,692 (47.9%) | 1,840 (52.1%) |
| Total (Overall) | 10,860 (49.7%) | 10,988 (50.3%) |
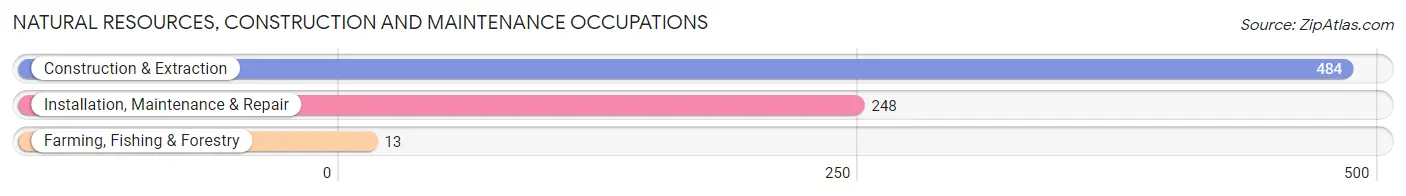
Natural Resources, Construction and Maintenance Occupations
The most common Natural Resources, Construction and Maintenance occupations in Culver City are Construction & Extraction (484 | 2.2%), Installation, Maintenance & Repair (248 | 1.1%), and Farming, Fishing & Forestry (13 | 0.1%).
Natural Resources, Construction and Maintenance Occupations by Sex
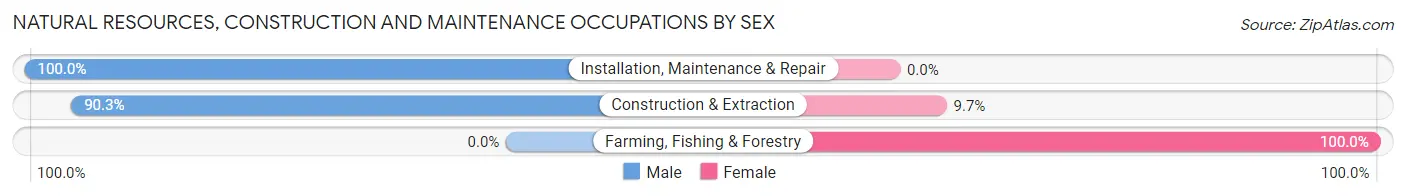
| Occupation | Male | Female |
| Farming, Fishing & Forestry | 0 (0.0%) | 13 (100.0%) |
| Construction & Extraction | 437 (90.3%) | 47 (9.7%) |
| Installation, Maintenance & Repair | 248 (100.0%) | 0 (0.0%) |
| Total (Category) | 685 (91.9%) | 60 (8.1%) |
| Total (Overall) | 10,860 (49.7%) | 10,988 (50.3%) |
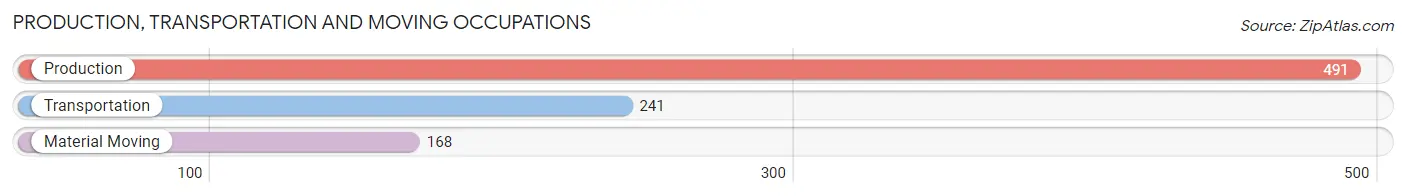
Production, Transportation and Moving Occupations
The most common Production, Transportation and Moving occupations in Culver City are Production (491 | 2.2%), Transportation (241 | 1.1%), and Material Moving (168 | 0.8%).
Production, Transportation and Moving Occupations by Sex
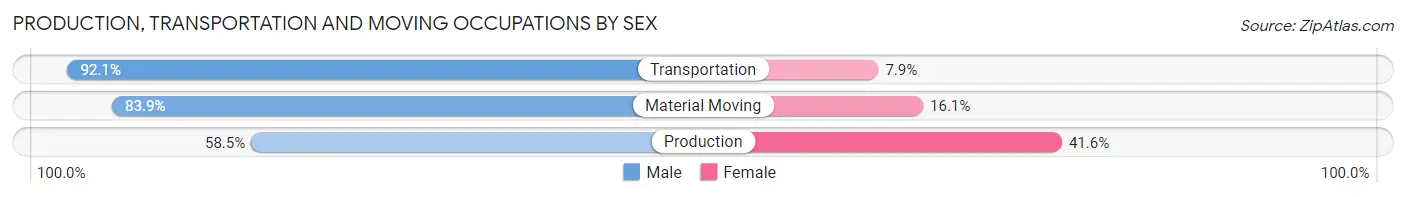
| Occupation | Male | Female |
| Production | 287 (58.5%) | 204 (41.5%) |
| Transportation | 222 (92.1%) | 19 (7.9%) |
| Material Moving | 141 (83.9%) | 27 (16.1%) |
| Total (Category) | 650 (72.2%) | 250 (27.8%) |
| Total (Overall) | 10,860 (49.7%) | 10,988 (50.3%) |
Employment Industries by Sex in Culver City
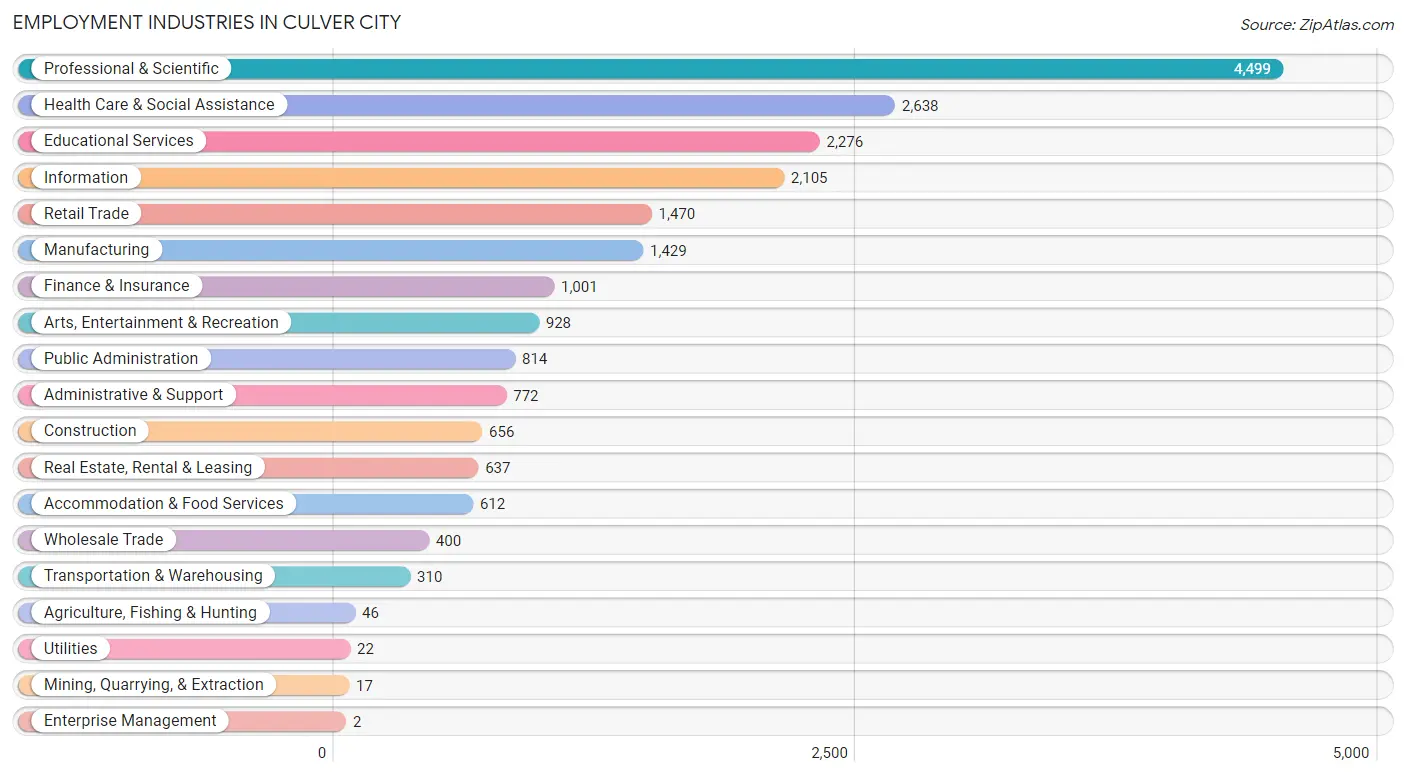
Employment Industries in Culver City
The major employment industries in Culver City include Professional & Scientific (4,499 | 20.6%), Health Care & Social Assistance (2,638 | 12.1%), Educational Services (2,276 | 10.4%), Information (2,105 | 9.6%), and Retail Trade (1,470 | 6.7%).
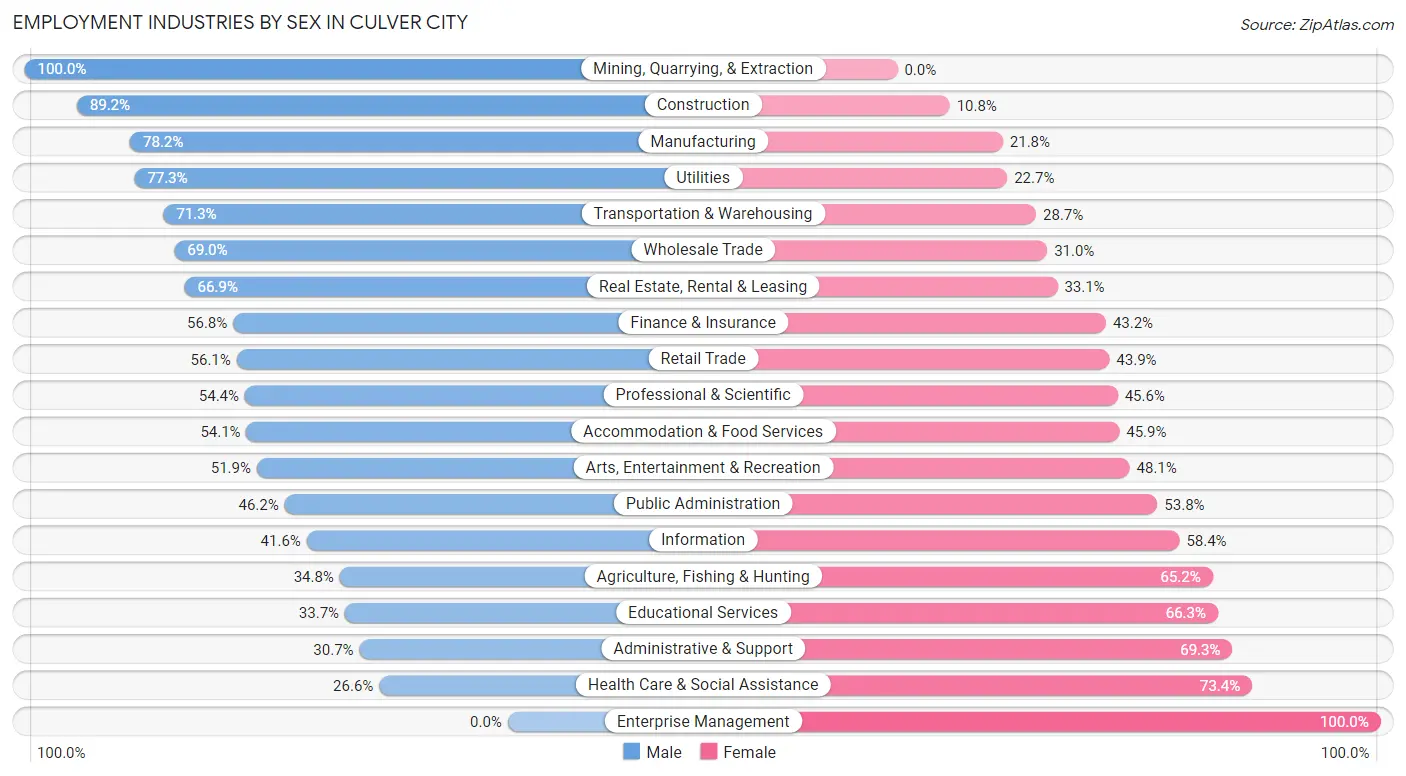
Employment Industries by Sex in Culver City
The Culver City industries that see more men than women are Mining, Quarrying, & Extraction (100.0%), Construction (89.2%), and Manufacturing (78.2%), whereas the industries that tend to have a higher number of women are Enterprise Management (100.0%), Health Care & Social Assistance (73.4%), and Administrative & Support (69.3%).
| Industry | Male | Female |
| Agriculture, Fishing & Hunting | 16 (34.8%) | 30 (65.2%) |
| Mining, Quarrying, & Extraction | 17 (100.0%) | 0 (0.0%) |
| Construction | 585 (89.2%) | 71 (10.8%) |
| Manufacturing | 1,117 (78.2%) | 312 (21.8%) |
| Wholesale Trade | 276 (69.0%) | 124 (31.0%) |
| Retail Trade | 825 (56.1%) | 645 (43.9%) |
| Transportation & Warehousing | 221 (71.3%) | 89 (28.7%) |
| Utilities | 17 (77.3%) | 5 (22.7%) |
| Information | 876 (41.6%) | 1,229 (58.4%) |
| Finance & Insurance | 569 (56.8%) | 432 (43.2%) |
| Real Estate, Rental & Leasing | 426 (66.9%) | 211 (33.1%) |
| Professional & Scientific | 2,448 (54.4%) | 2,051 (45.6%) |
| Enterprise Management | 0 (0.0%) | 2 (100.0%) |
| Administrative & Support | 237 (30.7%) | 535 (69.3%) |
| Educational Services | 767 (33.7%) | 1,509 (66.3%) |
| Health Care & Social Assistance | 702 (26.6%) | 1,936 (73.4%) |
| Arts, Entertainment & Recreation | 482 (51.9%) | 446 (48.1%) |
| Accommodation & Food Services | 331 (54.1%) | 281 (45.9%) |
| Public Administration | 376 (46.2%) | 438 (53.8%) |
| Total | 10,860 (49.7%) | 10,988 (50.3%) |
Education in Culver City
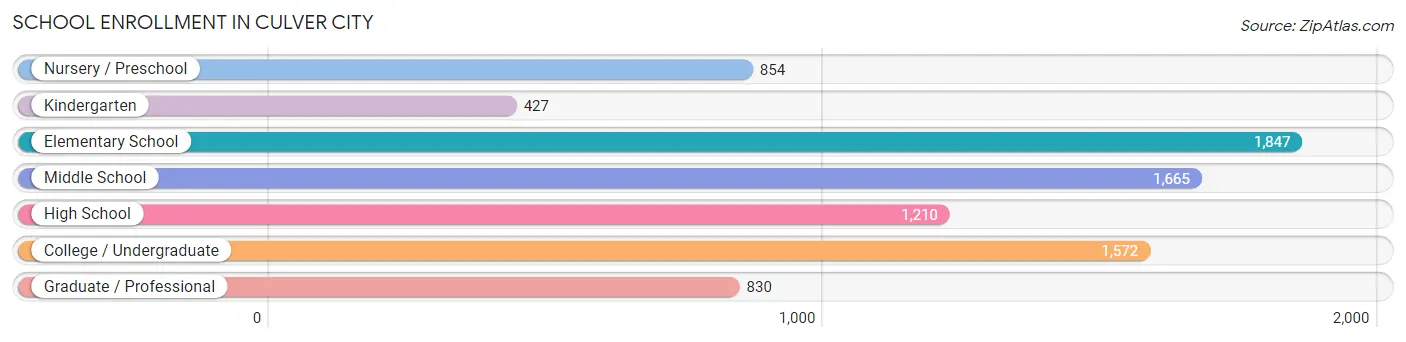
School Enrollment in Culver City
The most common levels of schooling among the 8,405 students in Culver City are elementary school (1,847 | 22.0%), middle school (1,665 | 19.8%), and college / undergraduate (1,572 | 18.7%).
| School Level | # Students | % Students |
| Nursery / Preschool | 854 | 10.2% |
| Kindergarten | 427 | 5.1% |
| Elementary School | 1,847 | 22.0% |
| Middle School | 1,665 | 19.8% |
| High School | 1,210 | 14.4% |
| College / Undergraduate | 1,572 | 18.7% |
| Graduate / Professional | 830 | 9.9% |
| Total | 8,405 | 100.0% |
School Enrollment by Age by Funding Source in Culver City
Out of a total of 8,405 students who are enrolled in schools in Culver City, 1,950 (23.2%) attend a private institution, while the remaining 6,455 (76.8%) are enrolled in public schools. The age group of 3 to 4 year olds has the highest likelihood of being enrolled in private schools, with 516 (67.5% in the age bracket) enrolled. Conversely, the age group of 20 to 24 year olds has the lowest likelihood of being enrolled in a private school, with 677 (84.7% in the age bracket) attending a public institution.
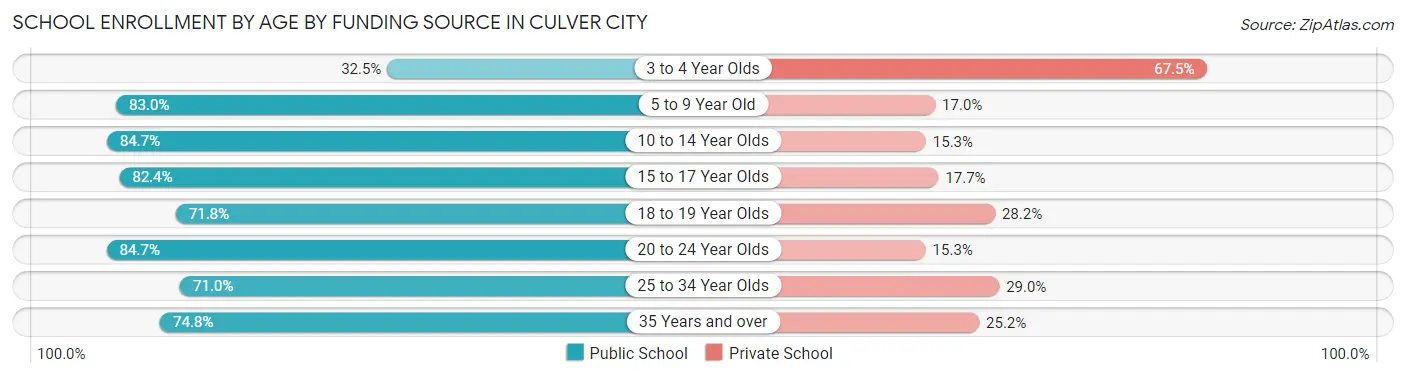
| Age Bracket | Public School | Private School |
| 3 to 4 Year Olds | 248 (32.5%) | 516 (67.5%) |
| 5 to 9 Year Old | 1,724 (83.0%) | 354 (17.0%) |
| 10 to 14 Year Olds | 1,908 (84.7%) | 345 (15.3%) |
| 15 to 17 Year Olds | 681 (82.4%) | 146 (17.6%) |
| 18 to 19 Year Olds | 158 (71.8%) | 62 (28.2%) |
| 20 to 24 Year Olds | 677 (84.7%) | 122 (15.3%) |
| 25 to 34 Year Olds | 657 (71.0%) | 268 (29.0%) |
| 35 Years and over | 403 (74.8%) | 136 (25.2%) |
| Total | 6,455 (76.8%) | 1,950 (23.2%) |
Educational Attainment by Field of Study in Culver City
Business (3,023 | 14.4%), social sciences (2,626 | 12.5%), visual & performing arts (2,345 | 11.2%), engineering (1,527 | 7.3%), and communications (1,466 | 7.0%) are the most common fields of study among 20,969 individuals in Culver City who have obtained a bachelor's degree or higher.
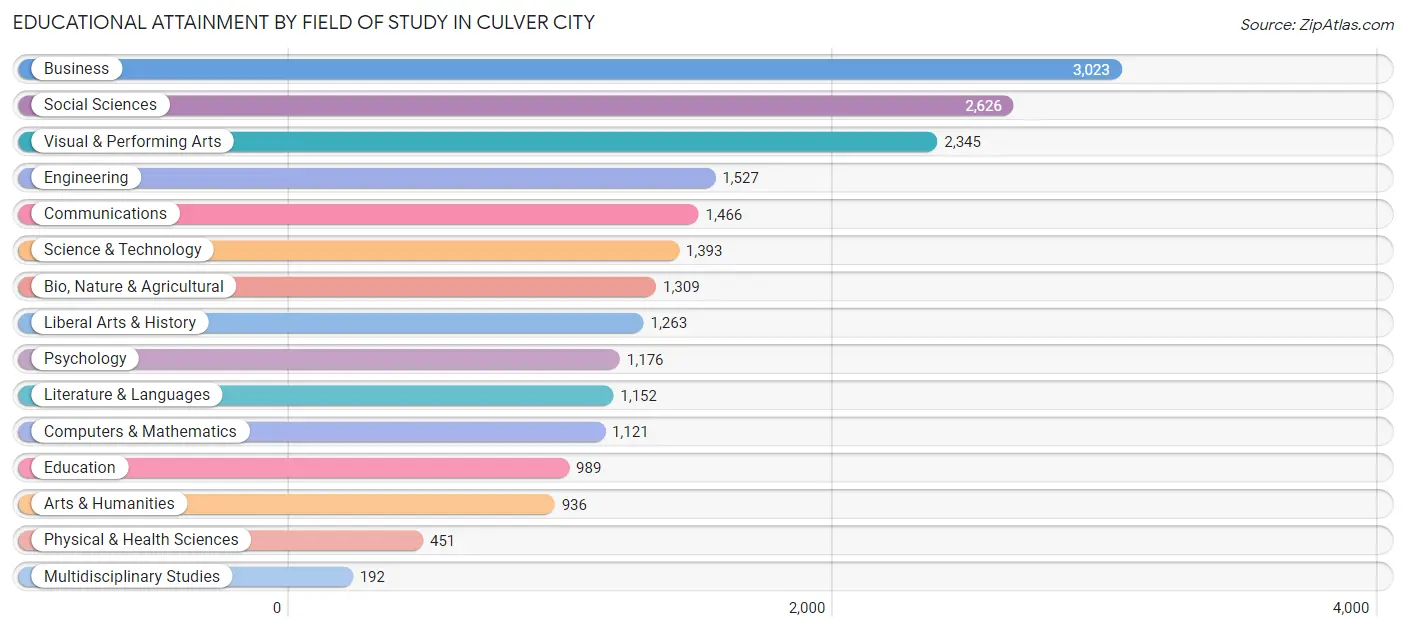
| Field of Study | # Graduates | % Graduates |
| Computers & Mathematics | 1,121 | 5.3% |
| Bio, Nature & Agricultural | 1,309 | 6.2% |
| Physical & Health Sciences | 451 | 2.1% |
| Psychology | 1,176 | 5.6% |
| Social Sciences | 2,626 | 12.5% |
| Engineering | 1,527 | 7.3% |
| Multidisciplinary Studies | 192 | 0.9% |
| Science & Technology | 1,393 | 6.6% |
| Business | 3,023 | 14.4% |
| Education | 989 | 4.7% |
| Literature & Languages | 1,152 | 5.5% |
| Liberal Arts & History | 1,263 | 6.0% |
| Visual & Performing Arts | 2,345 | 11.2% |
| Communications | 1,466 | 7.0% |
| Arts & Humanities | 936 | 4.5% |
| Total | 20,969 | 100.0% |
Transportation & Commute in Culver City
Vehicle Availability by Sex in Culver City
The most prevalent vehicle ownership categories in Culver City are males with 2 vehicles (5,541, accounting for 51.8%) and females with 2 vehicles (5,697, making up 51.3%).
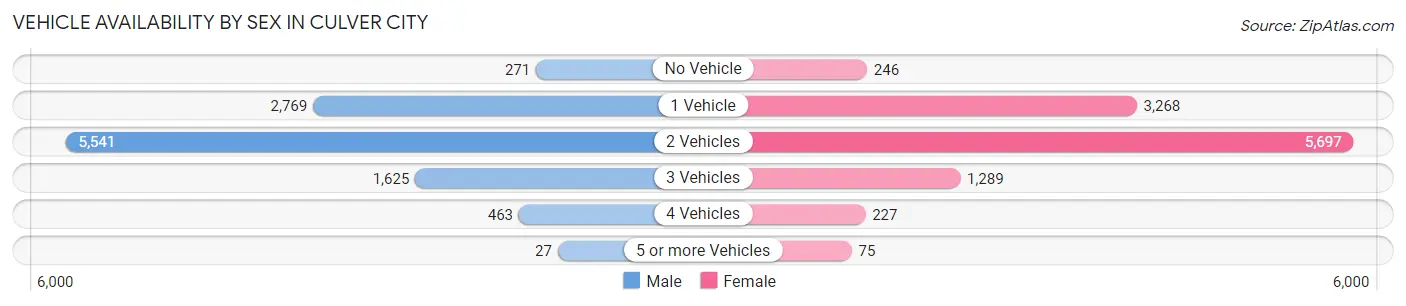
| Vehicles Available | Male | Female |
| No Vehicle | 271 (2.5%) | 246 (2.3%) |
| 1 Vehicle | 2,769 (25.9%) | 3,268 (30.2%) |
| 2 Vehicles | 5,541 (51.8%) | 5,697 (52.7%) |
| 3 Vehicles | 1,625 (15.2%) | 1,289 (11.9%) |
| 4 Vehicles | 463 (4.3%) | 227 (2.1%) |
| 5 or more Vehicles | 27 (0.3%) | 75 (0.7%) |
| Total | 10,696 (100.0%) | 10,802 (100.0%) |
Commute Time in Culver City
The most frequently occuring commute durations in Culver City are 30 to 34 minutes (4,000 commuters, 25.1%), 20 to 24 minutes (2,417 commuters, 15.2%), and 15 to 19 minutes (2,123 commuters, 13.3%).
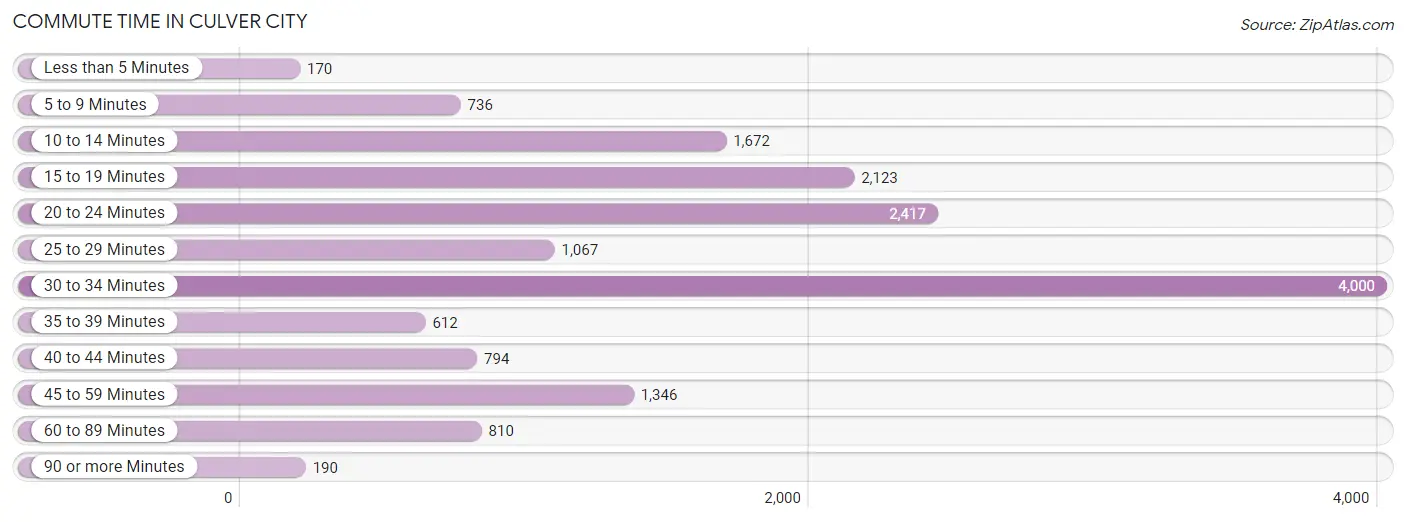
| Commute Time | # Commuters | % Commuters |
| Less than 5 Minutes | 170 | 1.1% |
| 5 to 9 Minutes | 736 | 4.6% |
| 10 to 14 Minutes | 1,672 | 10.5% |
| 15 to 19 Minutes | 2,123 | 13.3% |
| 20 to 24 Minutes | 2,417 | 15.2% |
| 25 to 29 Minutes | 1,067 | 6.7% |
| 30 to 34 Minutes | 4,000 | 25.1% |
| 35 to 39 Minutes | 612 | 3.8% |
| 40 to 44 Minutes | 794 | 5.0% |
| 45 to 59 Minutes | 1,346 | 8.5% |
| 60 to 89 Minutes | 810 | 5.1% |
| 90 or more Minutes | 190 | 1.2% |
Commute Time by Sex in Culver City
The most common commute times in Culver City are 30 to 34 minutes (1,903 commuters, 23.2%) for males and 30 to 34 minutes (2,097 commuters, 27.1%) for females.
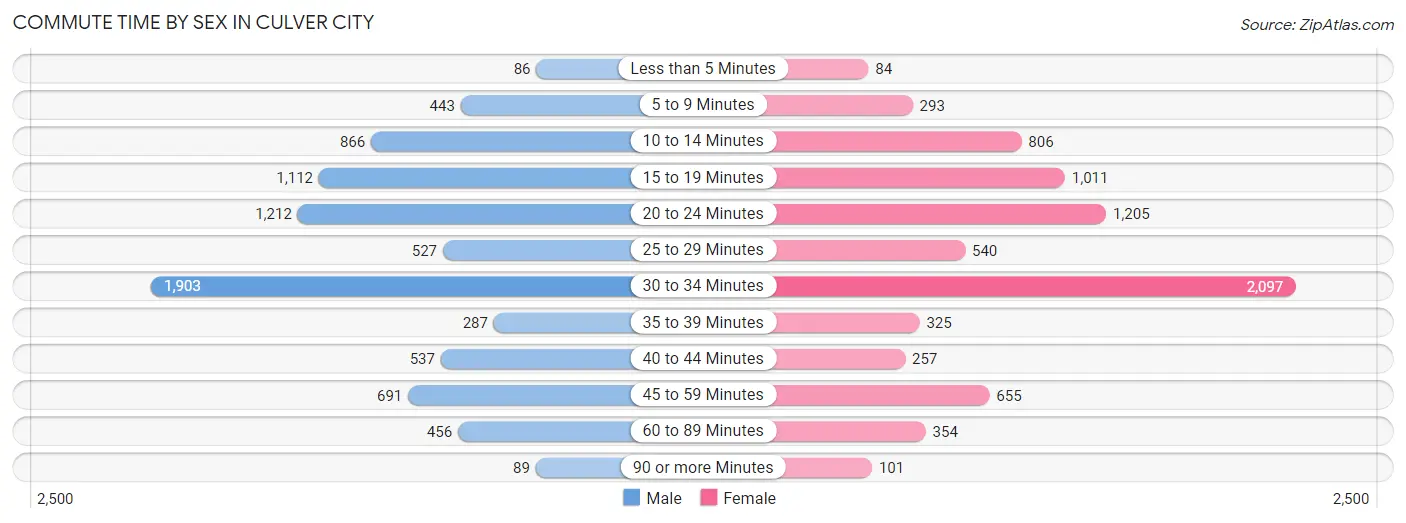
| Commute Time | Male | Female |
| Less than 5 Minutes | 86 (1.1%) | 84 (1.1%) |
| 5 to 9 Minutes | 443 (5.4%) | 293 (3.8%) |
| 10 to 14 Minutes | 866 (10.5%) | 806 (10.4%) |
| 15 to 19 Minutes | 1,112 (13.6%) | 1,011 (13.1%) |
| 20 to 24 Minutes | 1,212 (14.8%) | 1,205 (15.6%) |
| 25 to 29 Minutes | 527 (6.4%) | 540 (7.0%) |
| 30 to 34 Minutes | 1,903 (23.2%) | 2,097 (27.1%) |
| 35 to 39 Minutes | 287 (3.5%) | 325 (4.2%) |
| 40 to 44 Minutes | 537 (6.5%) | 257 (3.3%) |
| 45 to 59 Minutes | 691 (8.4%) | 655 (8.5%) |
| 60 to 89 Minutes | 456 (5.6%) | 354 (4.6%) |
| 90 or more Minutes | 89 (1.1%) | 101 (1.3%) |
Time of Departure to Work by Sex in Culver City
The most frequent times of departure to work in Culver City are 9:00 AM to 9:59 AM (2,259, 27.5%) for males and 9:00 AM to 9:59 AM (1,715, 22.2%) for females.
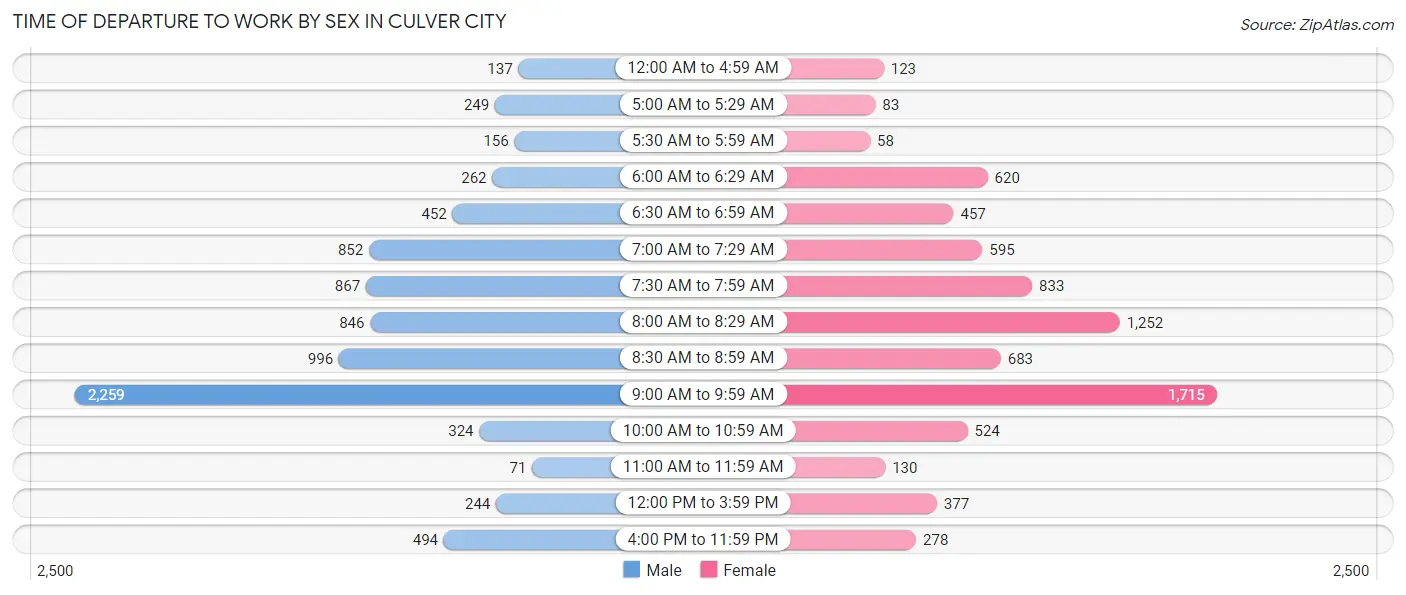
| Time of Departure | Male | Female |
| 12:00 AM to 4:59 AM | 137 (1.7%) | 123 (1.6%) |
| 5:00 AM to 5:29 AM | 249 (3.0%) | 83 (1.1%) |
| 5:30 AM to 5:59 AM | 156 (1.9%) | 58 (0.7%) |
| 6:00 AM to 6:29 AM | 262 (3.2%) | 620 (8.0%) |
| 6:30 AM to 6:59 AM | 452 (5.5%) | 457 (5.9%) |
| 7:00 AM to 7:29 AM | 852 (10.4%) | 595 (7.7%) |
| 7:30 AM to 7:59 AM | 867 (10.6%) | 833 (10.8%) |
| 8:00 AM to 8:29 AM | 846 (10.3%) | 1,252 (16.2%) |
| 8:30 AM to 8:59 AM | 996 (12.1%) | 683 (8.8%) |
| 9:00 AM to 9:59 AM | 2,259 (27.5%) | 1,715 (22.2%) |
| 10:00 AM to 10:59 AM | 324 (4.0%) | 524 (6.8%) |
| 11:00 AM to 11:59 AM | 71 (0.9%) | 130 (1.7%) |
| 12:00 PM to 3:59 PM | 244 (3.0%) | 377 (4.9%) |
| 4:00 PM to 11:59 PM | 494 (6.0%) | 278 (3.6%) |
| Total | 8,209 (100.0%) | 7,728 (100.0%) |
Housing Occupancy in Culver City
Occupancy by Ownership in Culver City
Of the total 17,691 dwellings in Culver City, owner-occupied units account for 9,890 (55.9%), while renter-occupied units make up 7,801 (44.1%).
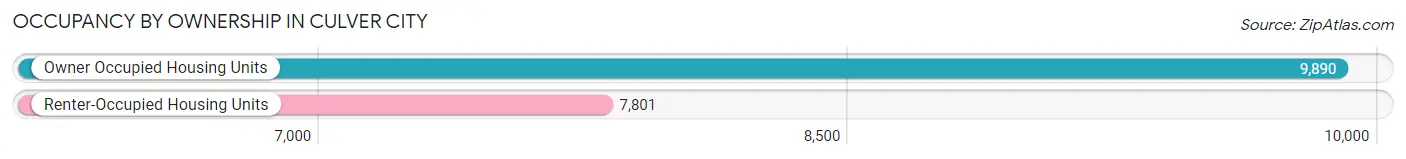
| Occupancy | # Housing Units | % Housing Units |
| Owner Occupied Housing Units | 9,890 | 55.9% |
| Renter-Occupied Housing Units | 7,801 | 44.1% |
| Total Occupied Housing Units | 17,691 | 100.0% |
Occupancy by Household Size in Culver City
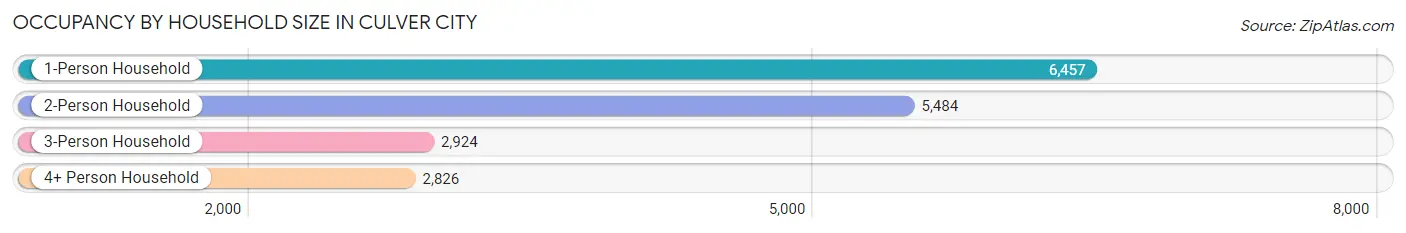
| Household Size | # Housing Units | % Housing Units |
| 1-Person Household | 6,457 | 36.5% |
| 2-Person Household | 5,484 | 31.0% |
| 3-Person Household | 2,924 | 16.5% |
| 4+ Person Household | 2,826 | 16.0% |
| Total Housing Units | 17,691 | 100.0% |
Occupancy by Ownership by Household Size in Culver City
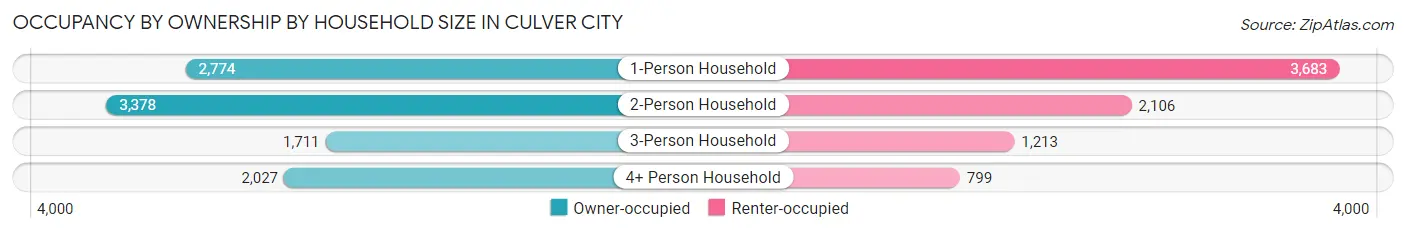
| Household Size | Owner-occupied | Renter-occupied |
| 1-Person Household | 2,774 (43.0%) | 3,683 (57.0%) |
| 2-Person Household | 3,378 (61.6%) | 2,106 (38.4%) |
| 3-Person Household | 1,711 (58.5%) | 1,213 (41.5%) |
| 4+ Person Household | 2,027 (71.7%) | 799 (28.3%) |
| Total Housing Units | 9,890 (55.9%) | 7,801 (44.1%) |
Occupancy by Educational Attainment in Culver City
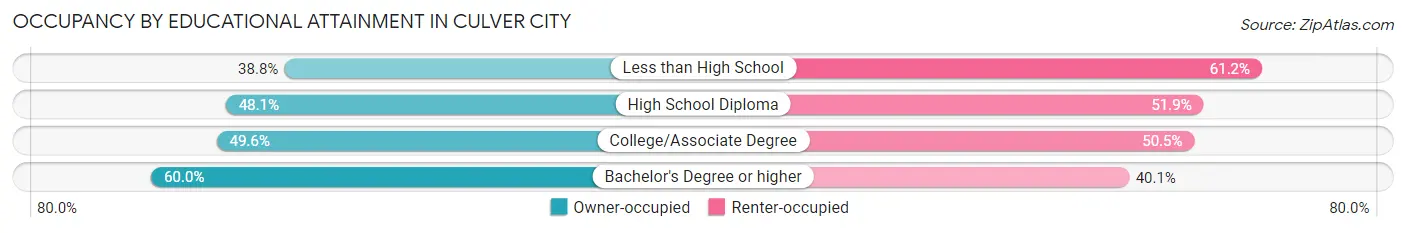
| Household Size | Owner-occupied | Renter-occupied |
| Less than High School | 285 (38.8%) | 449 (61.2%) |
| High School Diploma | 631 (48.1%) | 681 (51.9%) |
| College/Associate Degree | 1,929 (49.5%) | 1,964 (50.4%) |
| Bachelor's Degree or higher | 7,045 (60.0%) | 4,707 (40.1%) |
Occupancy by Age of Householder in Culver City
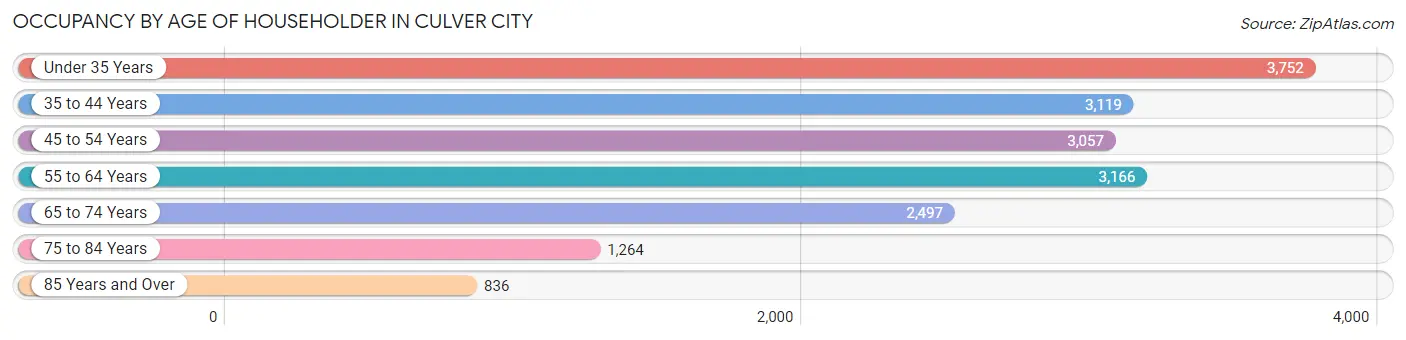
| Age Bracket | # Households | % Households |
| Under 35 Years | 3,752 | 21.2% |
| 35 to 44 Years | 3,119 | 17.6% |
| 45 to 54 Years | 3,057 | 17.3% |
| 55 to 64 Years | 3,166 | 17.9% |
| 65 to 74 Years | 2,497 | 14.1% |
| 75 to 84 Years | 1,264 | 7.1% |
| 85 Years and Over | 836 | 4.7% |
| Total | 17,691 | 100.0% |
Housing Finances in Culver City
Median Income by Occupancy in Culver City
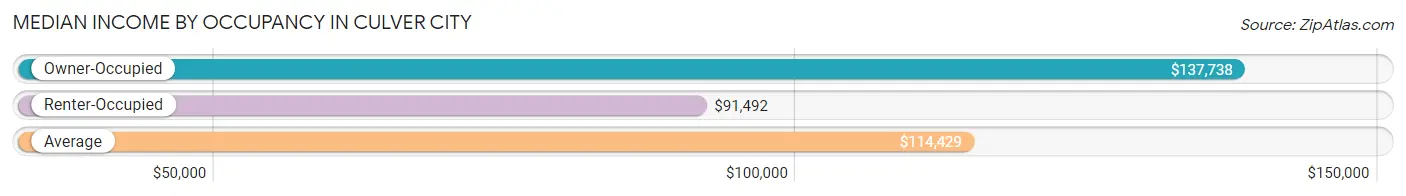
| Occupancy Type | # Households | Median Income |
| Owner-Occupied | 9,890 (55.9%) | $137,738 |
| Renter-Occupied | 7,801 (44.1%) | $91,492 |
| Average | 17,691 (100.0%) | $114,429 |
Occupancy by Householder Income Bracket in Culver City
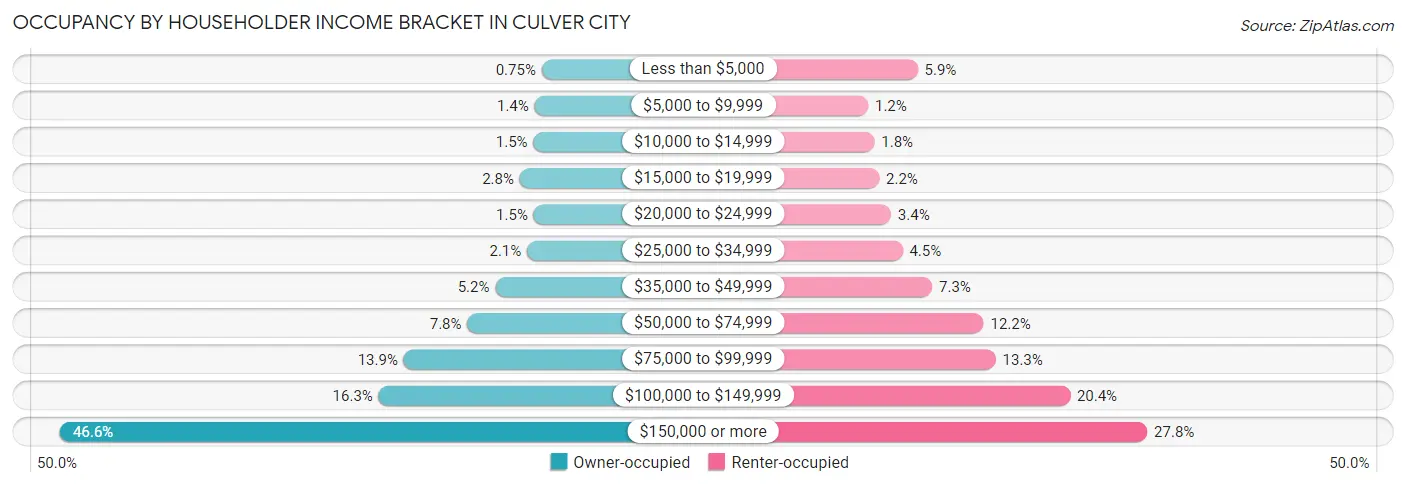
| Income Bracket | Owner-occupied | Renter-occupied |
| Less than $5,000 | 74 (0.7%) | 461 (5.9%) |
| $5,000 to $9,999 | 141 (1.4%) | 93 (1.2%) |
| $10,000 to $14,999 | 152 (1.5%) | 140 (1.8%) |
| $15,000 to $19,999 | 281 (2.8%) | 175 (2.2%) |
| $20,000 to $24,999 | 149 (1.5%) | 263 (3.4%) |
| $25,000 to $34,999 | 212 (2.1%) | 349 (4.5%) |
| $35,000 to $49,999 | 511 (5.2%) | 569 (7.3%) |
| $50,000 to $74,999 | 774 (7.8%) | 951 (12.2%) |
| $75,000 to $99,999 | 1,374 (13.9%) | 1,041 (13.3%) |
| $100,000 to $149,999 | 1,610 (16.3%) | 1,593 (20.4%) |
| $150,000 or more | 4,612 (46.6%) | 2,166 (27.8%) |
| Total | 9,890 (100.0%) | 7,801 (100.0%) |
Monthly Housing Cost Tiers in Culver City
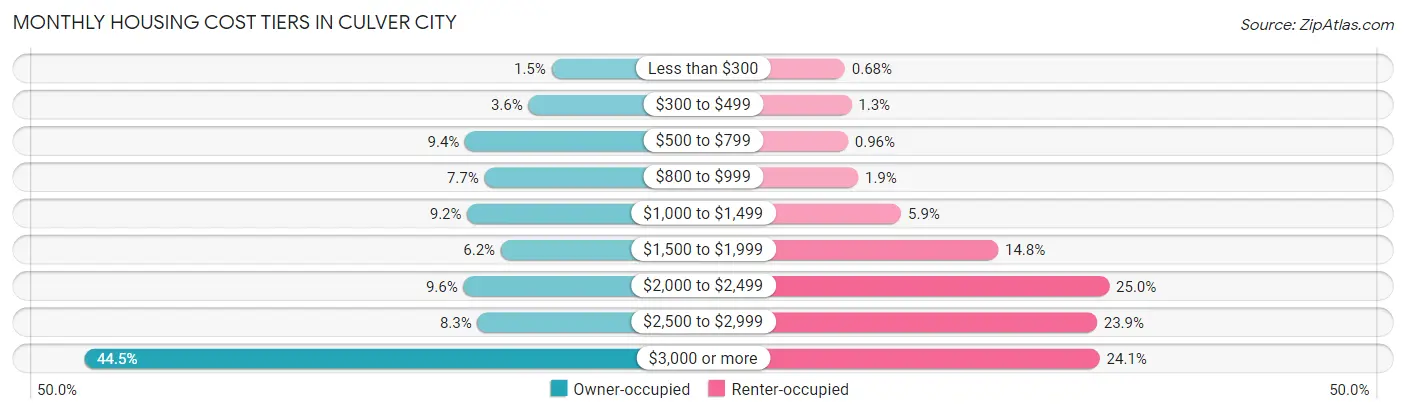
| Monthly Cost | Owner-occupied | Renter-occupied |
| Less than $300 | 146 (1.5%) | 53 (0.7%) |
| $300 to $499 | 357 (3.6%) | 100 (1.3%) |
| $500 to $799 | 934 (9.4%) | 75 (1.0%) |
| $800 to $999 | 758 (7.7%) | 148 (1.9%) |
| $1,000 to $1,499 | 914 (9.2%) | 457 (5.9%) |
| $1,500 to $1,999 | 608 (6.1%) | 1,154 (14.8%) |
| $2,000 to $2,499 | 948 (9.6%) | 1,951 (25.0%) |
| $2,500 to $2,999 | 821 (8.3%) | 1,863 (23.9%) |
| $3,000 or more | 4,404 (44.5%) | 1,883 (24.1%) |
| Total | 9,890 (100.0%) | 7,801 (100.0%) |
Physical Housing Characteristics in Culver City
Housing Structures in Culver City
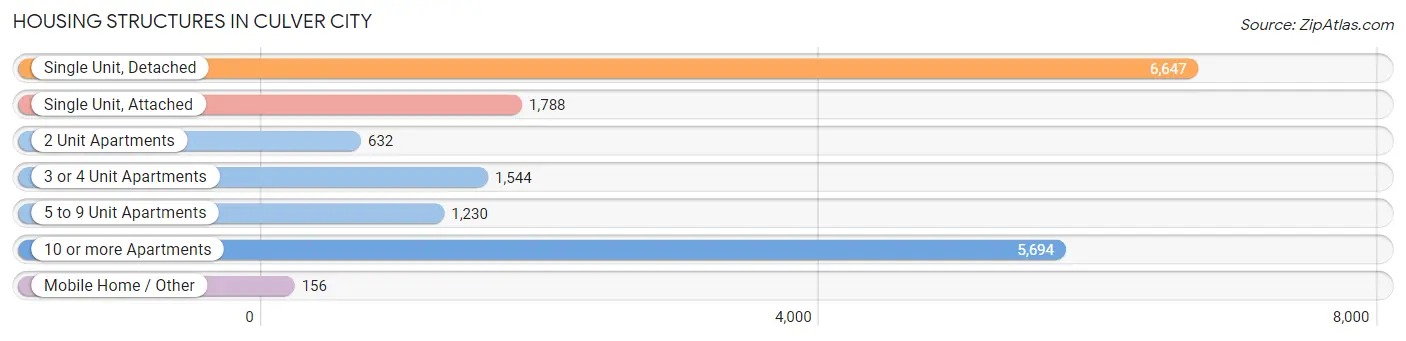
| Structure Type | # Housing Units | % Housing Units |
| Single Unit, Detached | 6,647 | 37.6% |
| Single Unit, Attached | 1,788 | 10.1% |
| 2 Unit Apartments | 632 | 3.6% |
| 3 or 4 Unit Apartments | 1,544 | 8.7% |
| 5 to 9 Unit Apartments | 1,230 | 7.0% |
| 10 or more Apartments | 5,694 | 32.2% |
| Mobile Home / Other | 156 | 0.9% |
| Total | 17,691 | 100.0% |
Housing Structures by Occupancy in Culver City
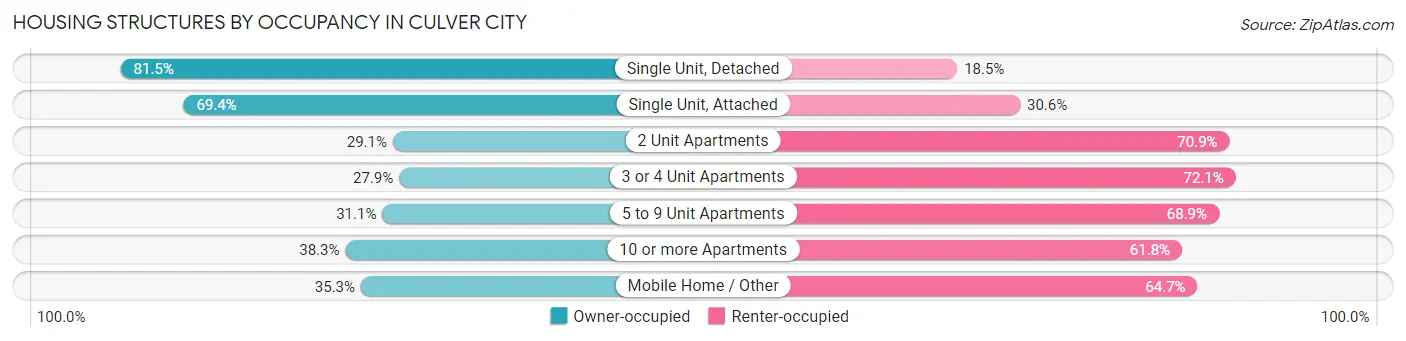
| Structure Type | Owner-occupied | Renter-occupied |
| Single Unit, Detached | 5,418 (81.5%) | 1,229 (18.5%) |
| Single Unit, Attached | 1,241 (69.4%) | 547 (30.6%) |
| 2 Unit Apartments | 184 (29.1%) | 448 (70.9%) |
| 3 or 4 Unit Apartments | 431 (27.9%) | 1,113 (72.1%) |
| 5 to 9 Unit Apartments | 383 (31.1%) | 847 (68.9%) |
| 10 or more Apartments | 2,178 (38.3%) | 3,516 (61.8%) |
| Mobile Home / Other | 55 (35.3%) | 101 (64.7%) |
| Total | 9,890 (55.9%) | 7,801 (44.1%) |
Housing Structures by Number of Rooms in Culver City
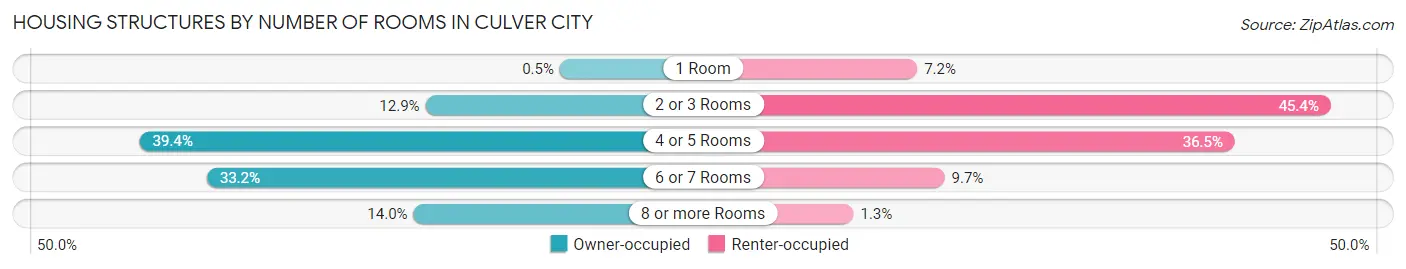
| Number of Rooms | Owner-occupied | Renter-occupied |
| 1 Room | 49 (0.5%) | 558 (7.1%) |
| 2 or 3 Rooms | 1,279 (12.9%) | 3,541 (45.4%) |
| 4 or 5 Rooms | 3,894 (39.4%) | 2,849 (36.5%) |
| 6 or 7 Rooms | 3,279 (33.2%) | 755 (9.7%) |
| 8 or more Rooms | 1,389 (14.0%) | 98 (1.3%) |
| Total | 9,890 (100.0%) | 7,801 (100.0%) |
Housing Structure by Heating Type in Culver City
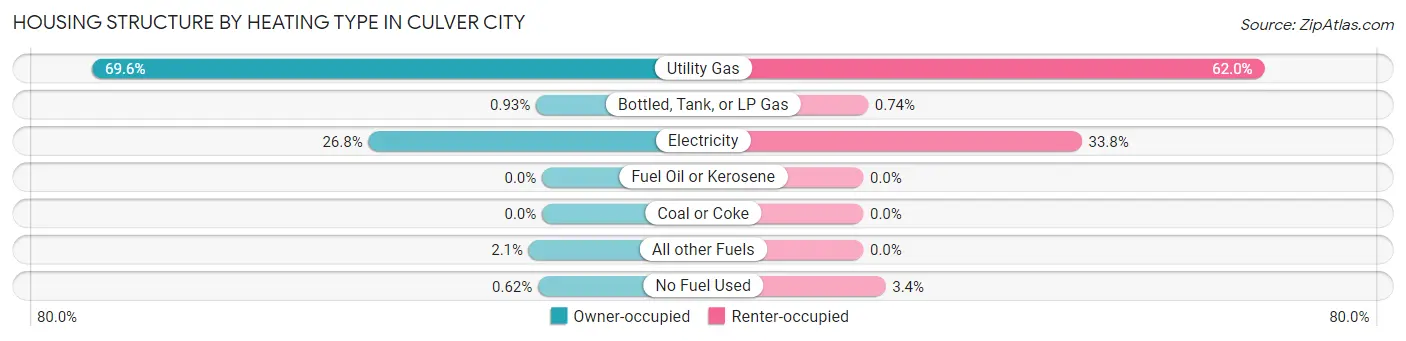
| Heating Type | Owner-occupied | Renter-occupied |
| Utility Gas | 6,880 (69.6%) | 4,840 (62.0%) |
| Bottled, Tank, or LP Gas | 92 (0.9%) | 58 (0.7%) |
| Electricity | 2,654 (26.8%) | 2,635 (33.8%) |
| Fuel Oil or Kerosene | 0 (0.0%) | 0 (0.0%) |
| Coal or Coke | 0 (0.0%) | 0 (0.0%) |
| All other Fuels | 203 (2.1%) | 0 (0.0%) |
| No Fuel Used | 61 (0.6%) | 268 (3.4%) |
| Total | 9,890 (100.0%) | 7,801 (100.0%) |
Household Vehicle Usage in Culver City
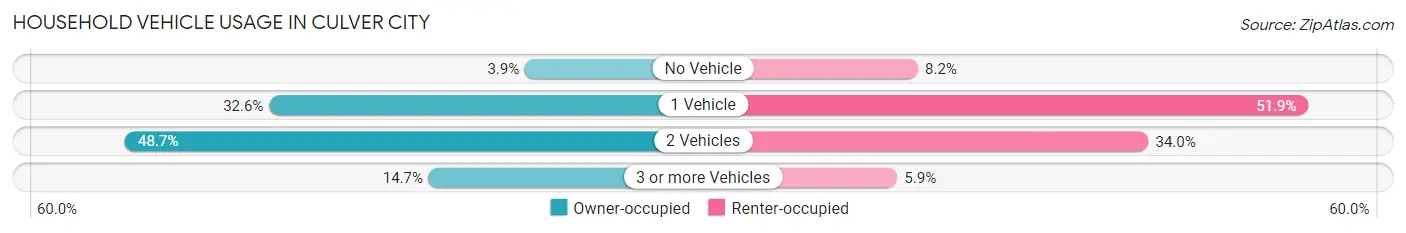
| Vehicles per Household | Owner-occupied | Renter-occupied |
| No Vehicle | 390 (3.9%) | 640 (8.2%) |
| 1 Vehicle | 3,224 (32.6%) | 4,049 (51.9%) |
| 2 Vehicles | 4,820 (48.7%) | 2,653 (34.0%) |
| 3 or more Vehicles | 1,456 (14.7%) | 459 (5.9%) |
| Total | 9,890 (100.0%) | 7,801 (100.0%) |
Real Estate & Mortgages in Culver City
Real Estate and Mortgage Overview in Culver City
| Characteristic | Without Mortgage | With Mortgage |
| Housing Units | 3,075 | 6,815 |
| Median Property Value | $995,700 | $1,169,900 |
| Median Household Income | $81,458 | $3,776 |
| Monthly Housing Costs | $879 | $4,395 |
| Real Estate Taxes | $4,519 | $122 |
Property Value by Mortgage Status in Culver City
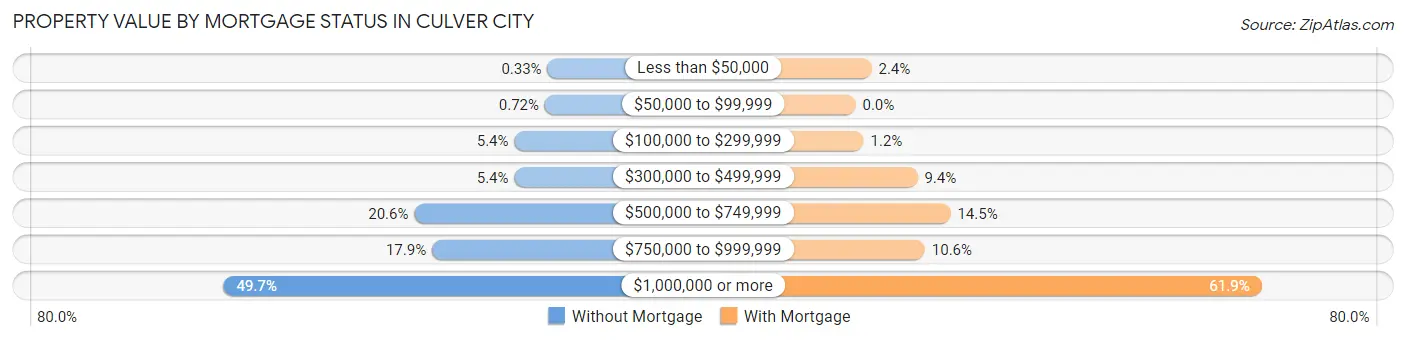
| Property Value | Without Mortgage | With Mortgage |
| Less than $50,000 | 10 (0.3%) | 166 (2.4%) |
| $50,000 to $99,999 | 22 (0.7%) | 0 (0.0%) |
| $100,000 to $299,999 | 165 (5.4%) | 84 (1.2%) |
| $300,000 to $499,999 | 165 (5.4%) | 643 (9.4%) |
| $500,000 to $749,999 | 634 (20.6%) | 986 (14.5%) |
| $750,000 to $999,999 | 551 (17.9%) | 720 (10.6%) |
| $1,000,000 or more | 1,528 (49.7%) | 4,216 (61.9%) |
| Total | 3,075 (100.0%) | 6,815 (100.0%) |
Household Income by Mortgage Status in Culver City
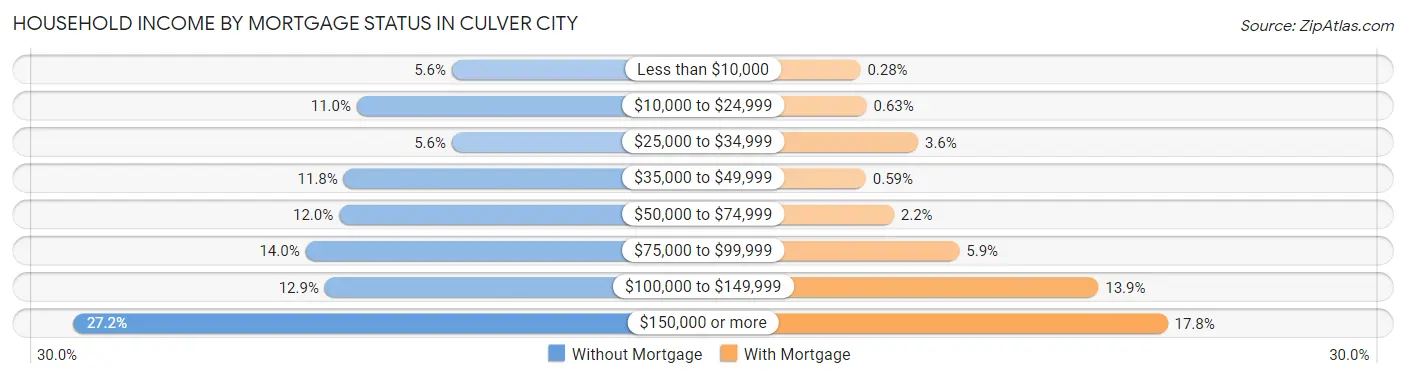
| Household Income | Without Mortgage | With Mortgage |
| Less than $10,000 | 172 (5.6%) | 19 (0.3%) |
| $10,000 to $24,999 | 339 (11.0%) | 43 (0.6%) |
| $25,000 to $34,999 | 172 (5.6%) | 243 (3.6%) |
| $35,000 to $49,999 | 362 (11.8%) | 40 (0.6%) |
| $50,000 to $74,999 | 370 (12.0%) | 149 (2.2%) |
| $75,000 to $99,999 | 429 (14.0%) | 404 (5.9%) |
| $100,000 to $149,999 | 395 (12.9%) | 945 (13.9%) |
| $150,000 or more | 836 (27.2%) | 1,215 (17.8%) |
| Total | 3,075 (100.0%) | 6,815 (100.0%) |
Property Value to Household Income Ratio in Culver City
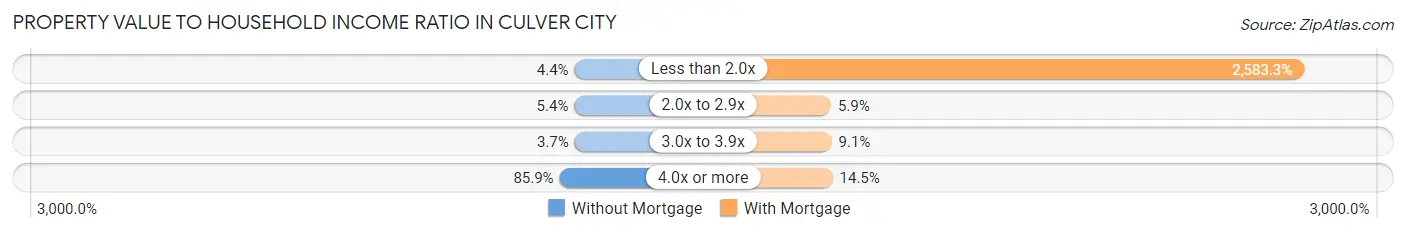
| Value-to-Income Ratio | Without Mortgage | With Mortgage |
| Less than 2.0x | 136 (4.4%) | 176,050 (2,583.3%) |
| 2.0x to 2.9x | 167 (5.4%) | 404 (5.9%) |
| 3.0x to 3.9x | 115 (3.7%) | 617 (9.0%) |
| 4.0x or more | 2,642 (85.9%) | 989 (14.5%) |
| Total | 3,075 (100.0%) | 6,815 (100.0%) |
Real Estate Taxes by Mortgage Status in Culver City
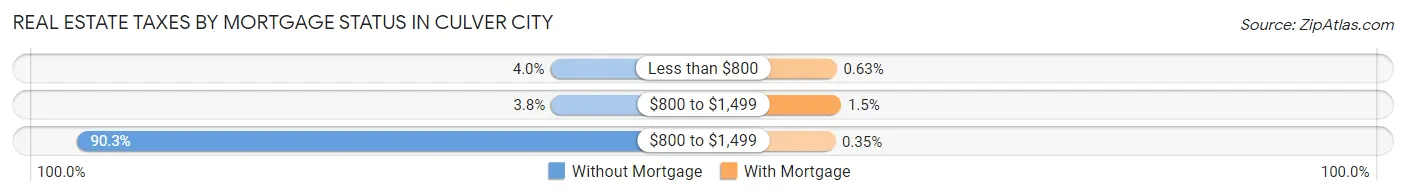
| Property Taxes | Without Mortgage | With Mortgage |
| Less than $800 | 122 (4.0%) | 43 (0.6%) |
| $800 to $1,499 | 118 (3.8%) | 99 (1.5%) |
| $800 to $1,499 | 2,778 (90.3%) | 24 (0.4%) |
| Total | 3,075 (100.0%) | 6,815 (100.0%) |
Health & Disability in Culver City
Health Insurance Coverage by Age in Culver City
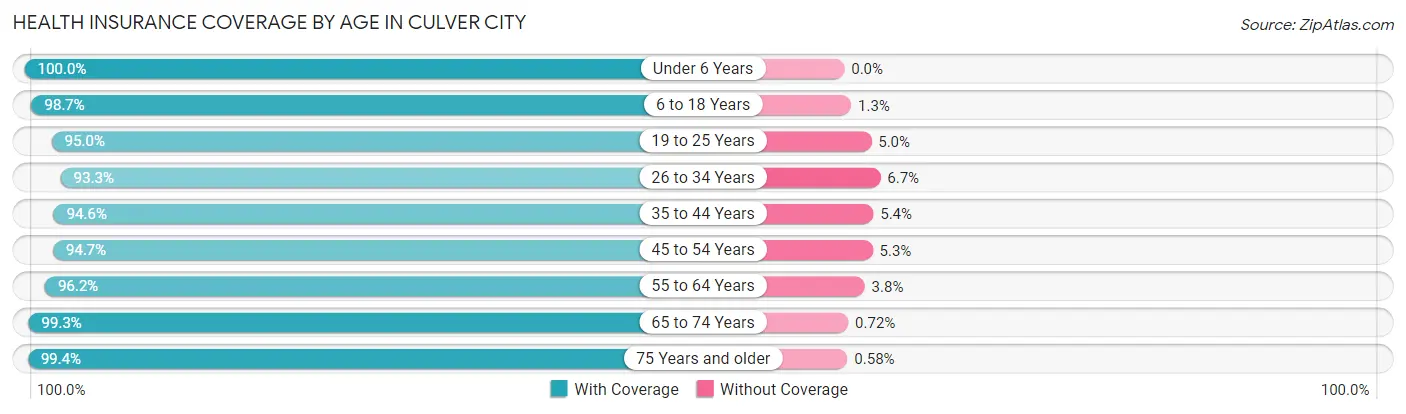
| Age Bracket | With Coverage | Without Coverage |
| Under 6 Years | 2,780 (100.0%) | 0 (0.0%) |
| 6 to 18 Years | 5,129 (98.7%) | 66 (1.3%) |
| 19 to 25 Years | 1,925 (95.0%) | 102 (5.0%) |
| 26 to 34 Years | 5,837 (93.3%) | 421 (6.7%) |
| 35 to 44 Years | 5,681 (94.6%) | 325 (5.4%) |
| 45 to 54 Years | 5,472 (94.7%) | 305 (5.3%) |
| 55 to 64 Years | 5,082 (96.2%) | 201 (3.8%) |
| 65 to 74 Years | 3,854 (99.3%) | 28 (0.7%) |
| 75 Years and older | 2,894 (99.4%) | 17 (0.6%) |
| Total | 38,654 (96.4%) | 1,465 (3.6%) |
Health Insurance Coverage by Citizenship Status in Culver City
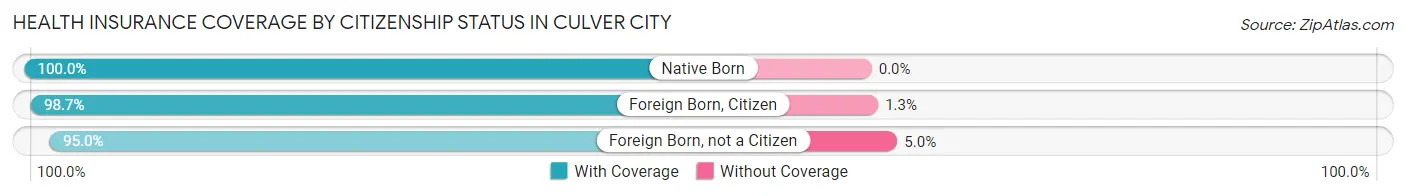
| Citizenship Status | With Coverage | Without Coverage |
| Native Born | 2,780 (100.0%) | 0 (0.0%) |
| Foreign Born, Citizen | 5,129 (98.7%) | 66 (1.3%) |
| Foreign Born, not a Citizen | 1,925 (95.0%) | 102 (5.0%) |
Health Insurance Coverage by Household Income in Culver City
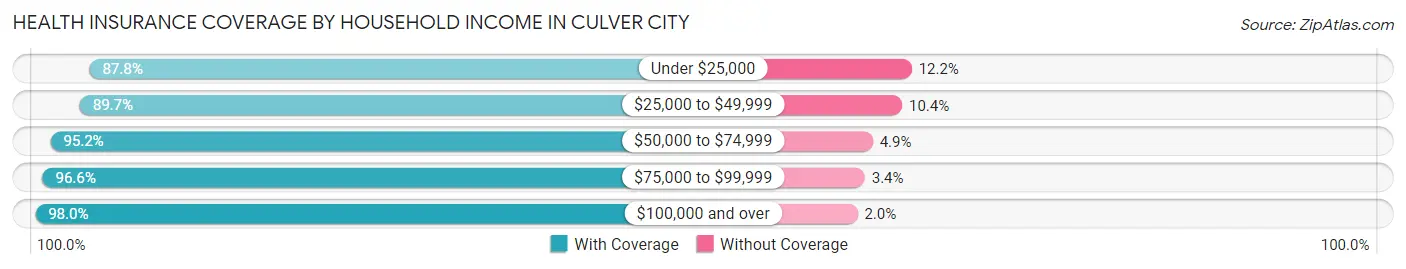
| Household Income | With Coverage | Without Coverage |
| Under $25,000 | 2,189 (87.8%) | 303 (12.2%) |
| $25,000 to $49,999 | 2,632 (89.6%) | 304 (10.3%) |
| $50,000 to $74,999 | 2,942 (95.2%) | 150 (4.9%) |
| $75,000 to $99,999 | 5,214 (96.6%) | 182 (3.4%) |
| $100,000 and over | 25,486 (98.0%) | 521 (2.0%) |
Public vs Private Health Insurance Coverage by Age in Culver City
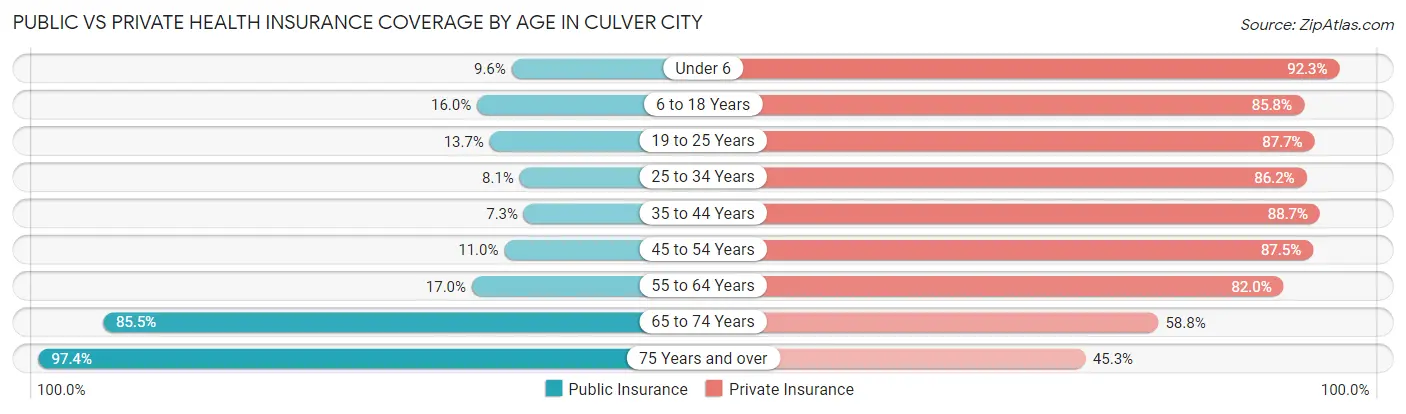
| Age Bracket | Public Insurance | Private Insurance |
| Under 6 | 267 (9.6%) | 2,567 (92.3%) |
| 6 to 18 Years | 832 (16.0%) | 4,455 (85.8%) |
| 19 to 25 Years | 277 (13.7%) | 1,778 (87.7%) |
| 25 to 34 Years | 507 (8.1%) | 5,396 (86.2%) |
| 35 to 44 Years | 440 (7.3%) | 5,329 (88.7%) |
| 45 to 54 Years | 633 (11.0%) | 5,052 (87.5%) |
| 55 to 64 Years | 897 (17.0%) | 4,331 (82.0%) |
| 65 to 74 Years | 3,317 (85.5%) | 2,282 (58.8%) |
| 75 Years and over | 2,835 (97.4%) | 1,319 (45.3%) |
| Total | 10,005 (24.9%) | 32,509 (81.0%) |
Disability Status by Sex by Age in Culver City
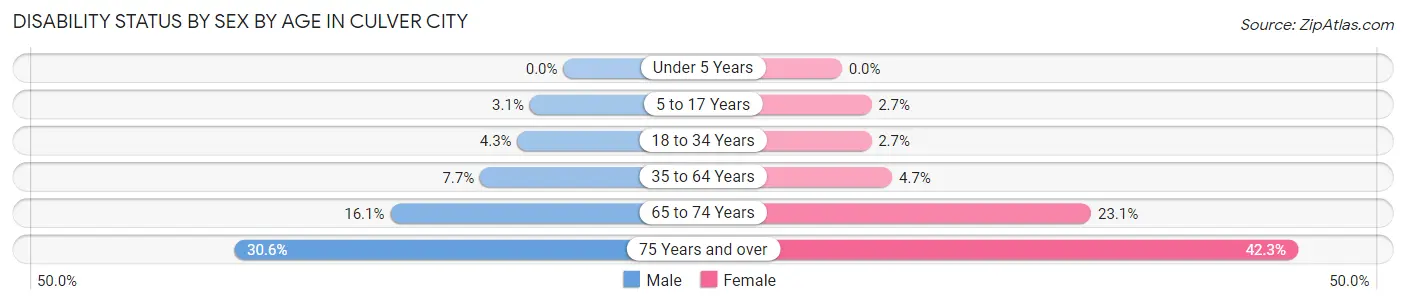
| Age Bracket | Male | Female |
| Under 5 Years | 0 (0.0%) | 0 (0.0%) |
| 5 to 17 Years | 87 (3.1%) | 71 (2.7%) |
| 18 to 34 Years | 180 (4.3%) | 116 (2.7%) |
| 35 to 64 Years | 647 (7.7%) | 406 (4.7%) |
| 65 to 74 Years | 243 (16.1%) | 548 (23.1%) |
| 75 Years and over | 264 (30.6%) | 866 (42.3%) |
Disability Class by Sex by Age in Culver City
Disability Class: Hearing Difficulty
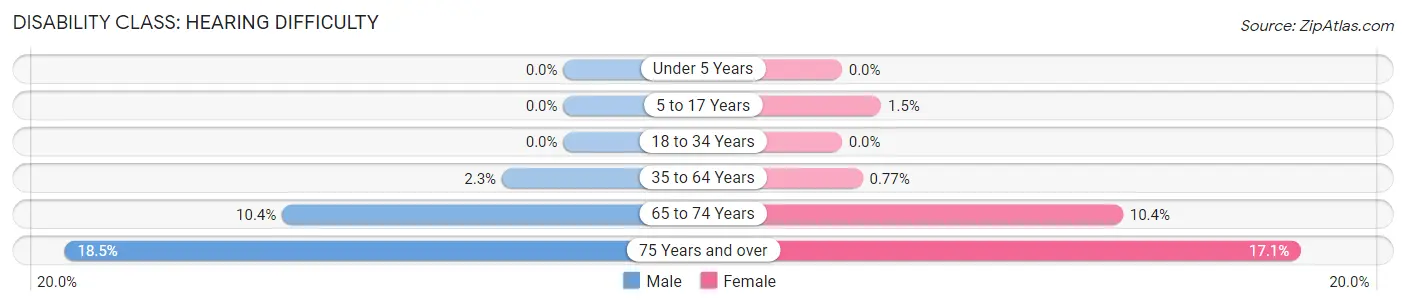
| Age Bracket | Male | Female |
| Under 5 Years | 0 (0.0%) | 0 (0.0%) |
| 5 to 17 Years | 0 (0.0%) | 38 (1.5%) |
| 18 to 34 Years | 0 (0.0%) | 0 (0.0%) |
| 35 to 64 Years | 191 (2.3%) | 67 (0.8%) |
| 65 to 74 Years | 158 (10.4%) | 247 (10.4%) |
| 75 Years and over | 160 (18.5%) | 349 (17.1%) |
Disability Class: Vision Difficulty
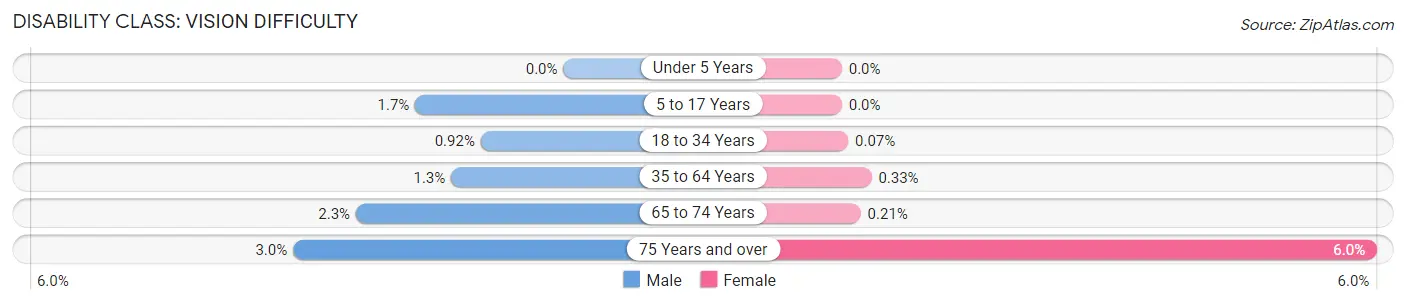
| Age Bracket | Male | Female |
| Under 5 Years | 0 (0.0%) | 0 (0.0%) |
| 5 to 17 Years | 46 (1.7%) | 0 (0.0%) |
| 18 to 34 Years | 39 (0.9%) | 3 (0.1%) |
| 35 to 64 Years | 105 (1.3%) | 29 (0.3%) |
| 65 to 74 Years | 35 (2.3%) | 5 (0.2%) |
| 75 Years and over | 26 (3.0%) | 122 (6.0%) |
Disability Class: Cognitive Difficulty
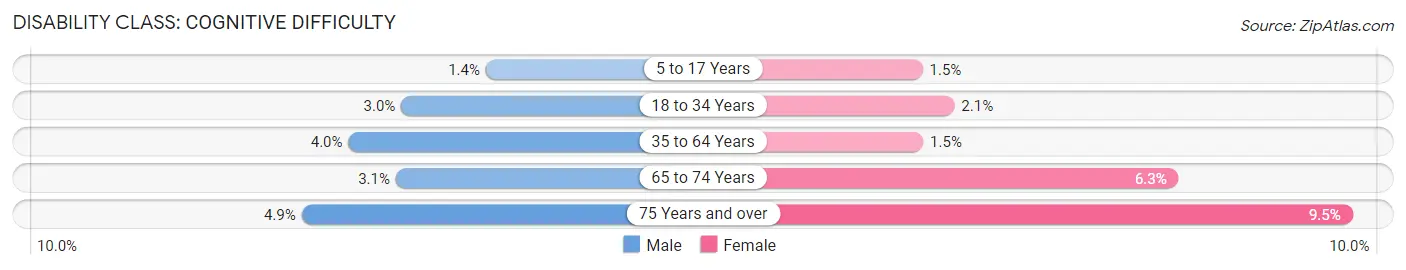
| Age Bracket | Male | Female |
| 5 to 17 Years | 40 (1.4%) | 39 (1.5%) |
| 18 to 34 Years | 127 (3.0%) | 89 (2.1%) |
| 35 to 64 Years | 334 (4.0%) | 131 (1.5%) |
| 65 to 74 Years | 47 (3.1%) | 148 (6.2%) |
| 75 Years and over | 42 (4.9%) | 194 (9.5%) |
Disability Class: Ambulatory Difficulty
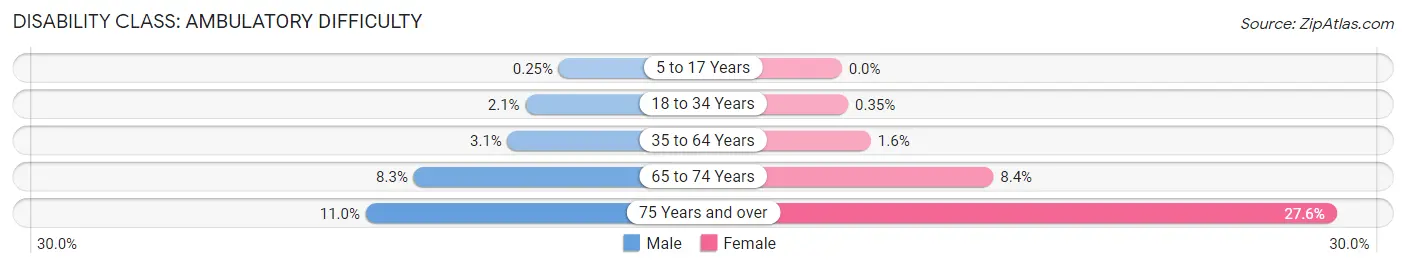
| Age Bracket | Male | Female |
| 5 to 17 Years | 7 (0.3%) | 0 (0.0%) |
| 18 to 34 Years | 89 (2.1%) | 15 (0.4%) |
| 35 to 64 Years | 260 (3.1%) | 141 (1.6%) |
| 65 to 74 Years | 126 (8.3%) | 200 (8.4%) |
| 75 Years and over | 95 (11.0%) | 564 (27.6%) |
Disability Class: Self-Care Difficulty
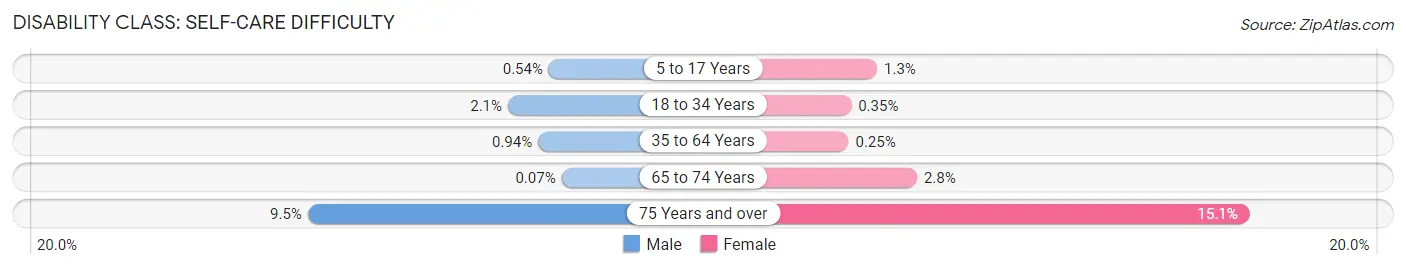
| Age Bracket | Male | Female |
| 5 to 17 Years | 15 (0.5%) | 34 (1.3%) |
| 18 to 34 Years | 87 (2.1%) | 15 (0.4%) |
| 35 to 64 Years | 79 (0.9%) | 22 (0.3%) |
| 65 to 74 Years | 1 (0.1%) | 66 (2.8%) |
| 75 Years and over | 82 (9.5%) | 310 (15.1%) |
Technology Access in Culver City
Computing Device Access in Culver City
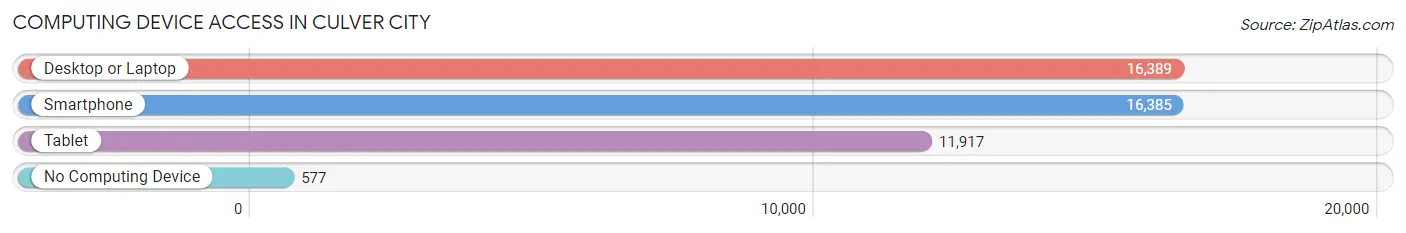
| Device Type | # Households | % Households |
| Desktop or Laptop | 16,389 | 92.6% |
| Smartphone | 16,385 | 92.6% |
| Tablet | 11,917 | 67.4% |
| No Computing Device | 577 | 3.3% |
| Total | 17,691 | 100.0% |
Internet Access in Culver City
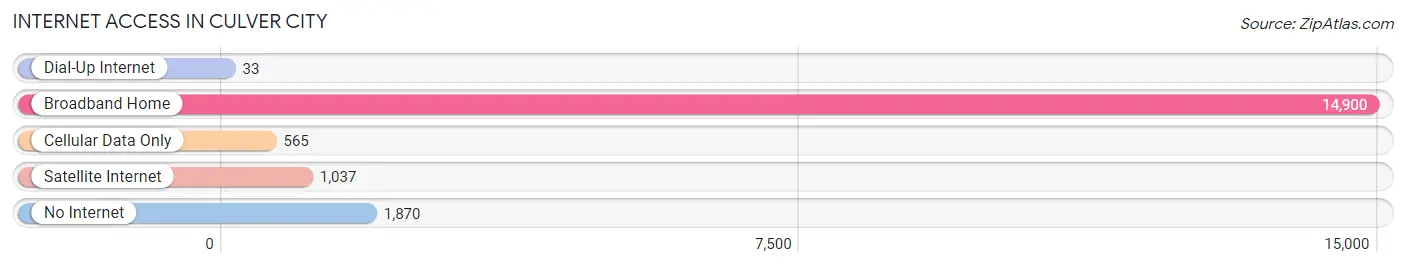
| Internet Type | # Households | % Households |
| Dial-Up Internet | 33 | 0.2% |
| Broadband Home | 14,900 | 84.2% |
| Cellular Data Only | 565 | 3.2% |
| Satellite Internet | 1,037 | 5.9% |
| No Internet | 1,870 | 10.6% |
| Total | 17,691 | 100.0% |
Culver City Summary
Culver City is a city located in Los Angeles County, California, United States. It is situated in the southwestern part of the county, just south of the city of Los Angeles. The city is bordered by the cities of Los Angeles, Beverly Hills, and West Hollywood. Culver City is home to Sony Pictures Entertainment, the NFL Network, and the headquarters of the National Football League.
Geography
Culver City is located at 34°1′37″N 118°24′44″W (34.02694, -118.41222). According to the United States Census Bureau, the city has a total area of 5.1 square miles (13.2 km2), all of it land.
Culver City is bordered by the cities of Los Angeles, Beverly Hills, and West Hollywood. It is located in the southwestern part of Los Angeles County, just south of the city of Los Angeles.
Demographics
As of the census of 2000, there were 38,816 people, 18,097 households, and 9,711 families residing in the city. The population density was 7,569.2 people per square mile (2,919.2/km2). There were 18,743 housing units at an average density of 3,663.6 per square mile (1,411.3/km2). The racial makeup of the city was 72.09% White, 6.14% African American, 0.36% Native American, 11.35% Asian, 0.06% Pacific Islander, 6.01% from other races, and 4.09% from two or more races. Hispanic or Latino of any race were 13.65% of the population.
Economy
Culver City is home to many major businesses and corporations, including Sony Pictures Entertainment, the NFL Network, and the headquarters of the National Football League. The city is also home to a number of smaller businesses, including restaurants, retail stores, and professional services.
Culver City is also home to a number of technology companies, including Google, Microsoft, and Yahoo. The city is also home to a number of media companies, including NBCUniversal, CBS, and ABC.
History
Culver City was founded in 1913 by Harry Culver, a real estate developer. The city was originally named "Culver City" after its founder.
In the 1920s, Culver City became a popular filming location for Hollywood movies. The city was home to several major movie studios, including MGM, RKO, and Columbia Pictures.
In the 1950s, Culver City became a major center for aerospace research and development. The city was home to several major aerospace companies, including Hughes Aircraft, Northrop Grumman, and Lockheed Martin.
In the 1960s, Culver City became a major center for the television industry. The city was home to several major television studios, including CBS Television City, NBC Studios, and ABC Television Center.
In the 1970s, Culver City became a major center for the music industry. The city was home to several major record labels, including A&M Records, Capitol Records, and Motown Records.
In the 1980s, Culver City became a major center for the video game industry. The city was home to several major video game companies, including Activision, Electronic Arts, and Sega.
In the 1990s, Culver City became a major center for the internet industry. The city was home to several major internet companies, including Yahoo, Google, and Microsoft.
Today, Culver City is a vibrant and diverse city with a thriving economy. The city is home to a number of major businesses and corporations, as well as a number of smaller businesses, restaurants, retail stores, and professional services.
Common Questions
What is Per Capita Income in Culver City?
Per Capita income in Culver City is $75,245.
What is the Median Family Income in Culver City?
Median Family Income in Culver City is $161,652.
What is the Median Household income in Culver City?
Median Household Income in Culver City is $114,429.
What is Income or Wage Gap in Culver City?
Income or Wage Gap in Culver City is 24.3%.
Women in Culver City earn 75.7 cents for every dollar earned by a man.
What is Family Income Deficit in Culver City?
Family Income Deficit in Culver City is $5,977.
Families that are below poverty line in Culver City earn $5,977 less on average than the poverty threshold level.
What is Inequality or Gini Index in Culver City?
Inequality or Gini Index in Culver City is 0.49.
What is the Total Population of Culver City?
Total Population of Culver City is 40,357.
What is the Total Male Population of Culver City?
Total Male Population of Culver City is 19,155.
What is the Total Female Population of Culver City?
Total Female Population of Culver City is 21,202.
What is the Ratio of Males per 100 Females in Culver City?
There are 90.35 Males per 100 Females in Culver City.
What is the Ratio of Females per 100 Males in Culver City?
There are 110.69 Females per 100 Males in Culver City.
What is the Median Population Age in Culver City?
Median Population Age in Culver City is 41.5 Years.
What is the Average Family Size in Culver City
Average Family Size in Culver City is 3.1 People.
What is the Average Household Size in Culver City
Average Household Size in Culver City is 2.3 People.
How Large is the Labor Force in Culver City?
There are 23,051 People in the Labor Forcein in Culver City.
What is the Percentage of People in the Labor Force in Culver City?
69.4% of People are in the Labor Force in Culver City.
What is the Unemployment Rate in Culver City?
Unemployment Rate in Culver City is 5.2%.