Crockett, CA Map & Demographics
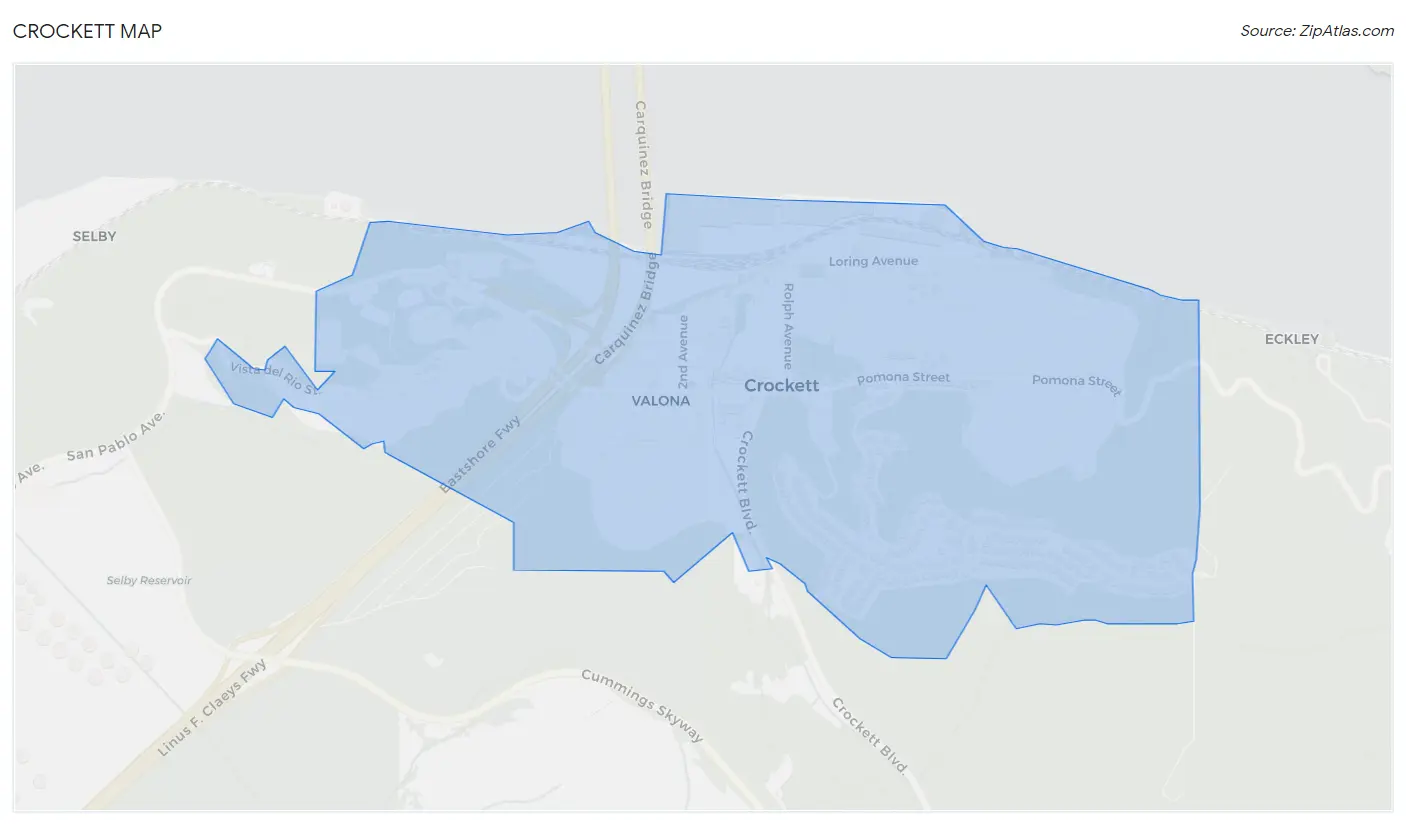
Crockett Map
Crockett Overview
$57,577
PER CAPITA INCOME
$116,146
AVG FAMILY INCOME
$94,167
AVG HOUSEHOLD INCOME
25.8%
WAGE / INCOME GAP [ % ]
74.2¢/ $1
WAGE / INCOME GAP [ $ ]
0.47
INEQUALITY / GINI INDEX
3,574
TOTAL POPULATION
1,643
MALE POPULATION
1,931
FEMALE POPULATION
85.09
MALES / 100 FEMALES
117.53
FEMALES / 100 MALES
49.3
MEDIAN AGE
2.8
AVG FAMILY SIZE
2.1
AVG HOUSEHOLD SIZE
2,063
LABOR FORCE [ PEOPLE ]
62.9%
PERCENT IN LABOR FORCE
7.7%
UNEMPLOYMENT RATE
Crockett Zip Codes
Crockett Area Codes
Income in Crockett
Income Overview in Crockett
Per Capita Income in Crockett is $57,577, while median incomes of families and households are $116,146 and $94,167 respectively.
| Characteristic | Number | Measure |
| Per Capita Income | 3,574 | $57,577 |
| Median Family Income | 903 | $116,146 |
| Mean Family Income | 903 | $152,417 |
| Median Household Income | 1,674 | $94,167 |
| Mean Household Income | 1,674 | $121,999 |
| Income Deficit | 903 | $0 |
| Wage / Income Gap (%) | 3,574 | 25.81% |
| Wage / Income Gap ($) | 3,574 | 74.19¢ per $1 |
| Gini / Inequality Index | 3,574 | 0.47 |
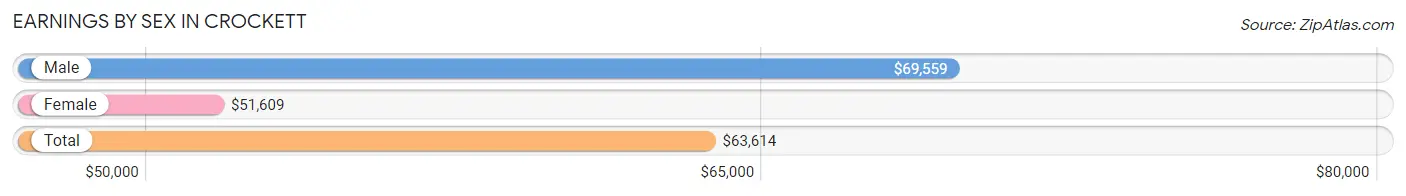
Earnings by Sex in Crockett
Average Earnings in Crockett are $63,614, $69,559 for men and $51,609 for women, a difference of 25.8%.
| Sex | Number | Average Earnings |
| Male | 956 (47.6%) | $69,559 |
| Female | 1,051 (52.4%) | $51,609 |
| Total | 2,007 (100.0%) | $63,614 |
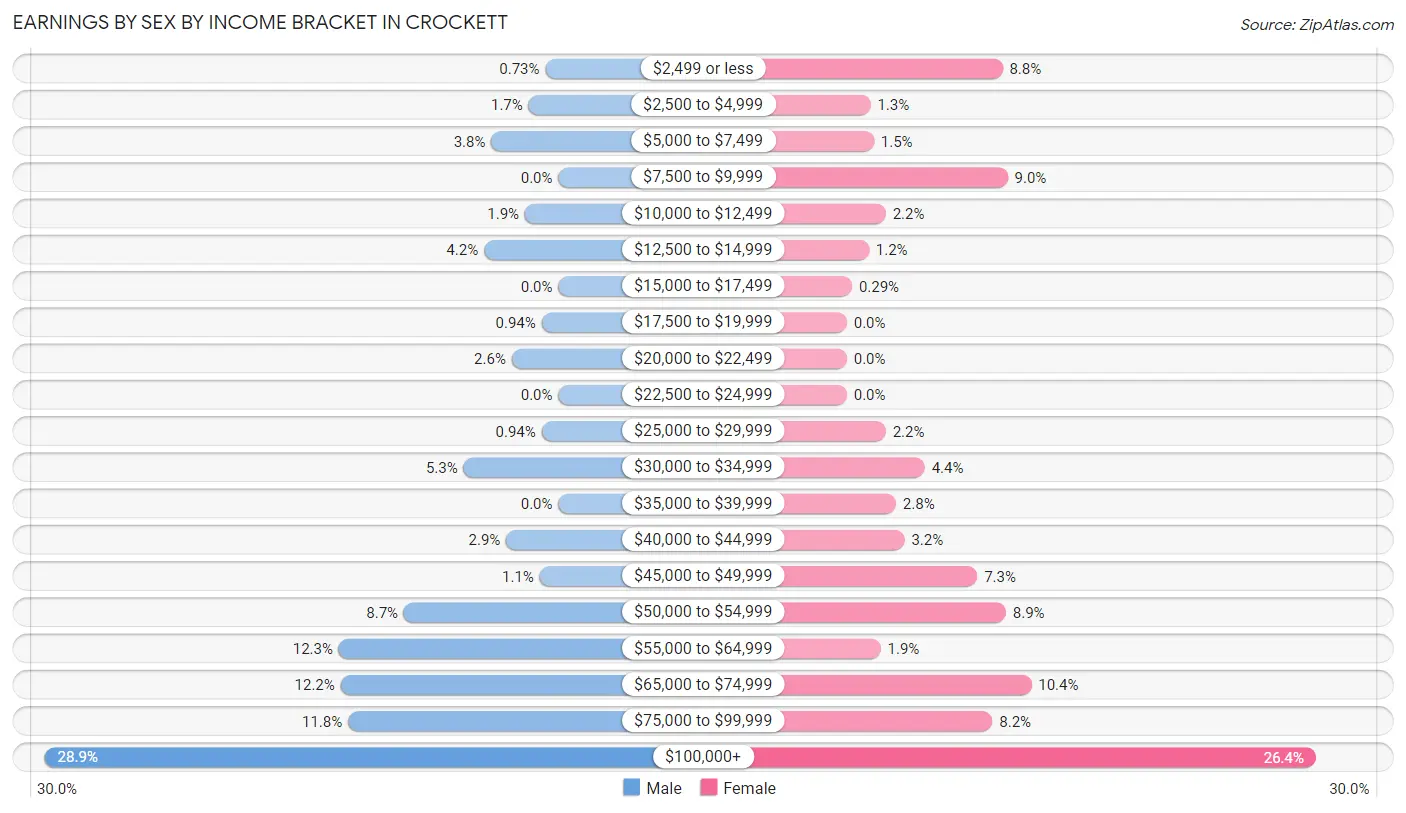
Earnings by Sex by Income Bracket in Crockett
The most common earnings brackets in Crockett are $100,000+ for men (276 | 28.9%) and $100,000+ for women (277 | 26.4%).
| Income | Male | Female |
| $2,499 or less | 7 (0.7%) | 92 (8.7%) |
| $2,500 to $4,999 | 16 (1.7%) | 14 (1.3%) |
| $5,000 to $7,499 | 36 (3.8%) | 16 (1.5%) |
| $7,500 to $9,999 | 0 (0.0%) | 95 (9.0%) |
| $10,000 to $12,499 | 18 (1.9%) | 23 (2.2%) |
| $12,500 to $14,999 | 40 (4.2%) | 13 (1.2%) |
| $15,000 to $17,499 | 0 (0.0%) | 3 (0.3%) |
| $17,500 to $19,999 | 9 (0.9%) | 0 (0.0%) |
| $20,000 to $22,499 | 25 (2.6%) | 0 (0.0%) |
| $22,500 to $24,999 | 0 (0.0%) | 0 (0.0%) |
| $25,000 to $29,999 | 9 (0.9%) | 23 (2.2%) |
| $30,000 to $34,999 | 51 (5.3%) | 46 (4.4%) |
| $35,000 to $39,999 | 0 (0.0%) | 29 (2.8%) |
| $40,000 to $44,999 | 28 (2.9%) | 34 (3.2%) |
| $45,000 to $49,999 | 10 (1.1%) | 77 (7.3%) |
| $50,000 to $54,999 | 83 (8.7%) | 94 (8.9%) |
| $55,000 to $64,999 | 118 (12.3%) | 20 (1.9%) |
| $65,000 to $74,999 | 117 (12.2%) | 109 (10.4%) |
| $75,000 to $99,999 | 113 (11.8%) | 86 (8.2%) |
| $100,000+ | 276 (28.9%) | 277 (26.4%) |
| Total | 956 (100.0%) | 1,051 (100.0%) |
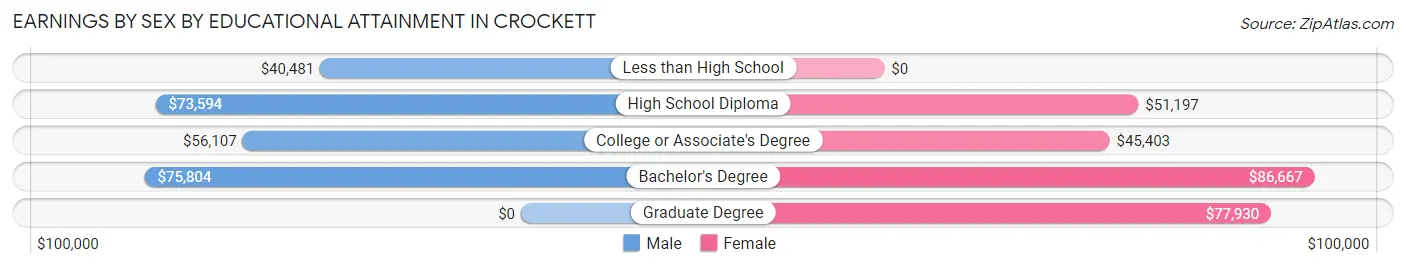
Earnings by Sex by Educational Attainment in Crockett
Average earnings in Crockett are $71,579 for men and $55,455 for women, a difference of 22.5%. Men with an educational attainment of bachelor's degree enjoy the highest average annual earnings of $75,804, while those with less than high school education earn the least with $40,481. Women with an educational attainment of bachelor's degree earn the most with the average annual earnings of $86,667, while those with college or associate's degree education have the smallest earnings of $45,403.
| Educational Attainment | Male Income | Female Income |
| Less than High School | $40,481 | $0 |
| High School Diploma | $73,594 | $51,197 |
| College or Associate's Degree | $56,107 | $45,403 |
| Bachelor's Degree | $75,804 | $86,667 |
| Graduate Degree | - | - |
| Total | $71,579 | $55,455 |
Family Income in Crockett
Family Income Brackets in Crockett
According to the Crockett family income data, there are 248 families falling into the $200,000+ income range, which is the most common income bracket and makes up 27.5% of all families.
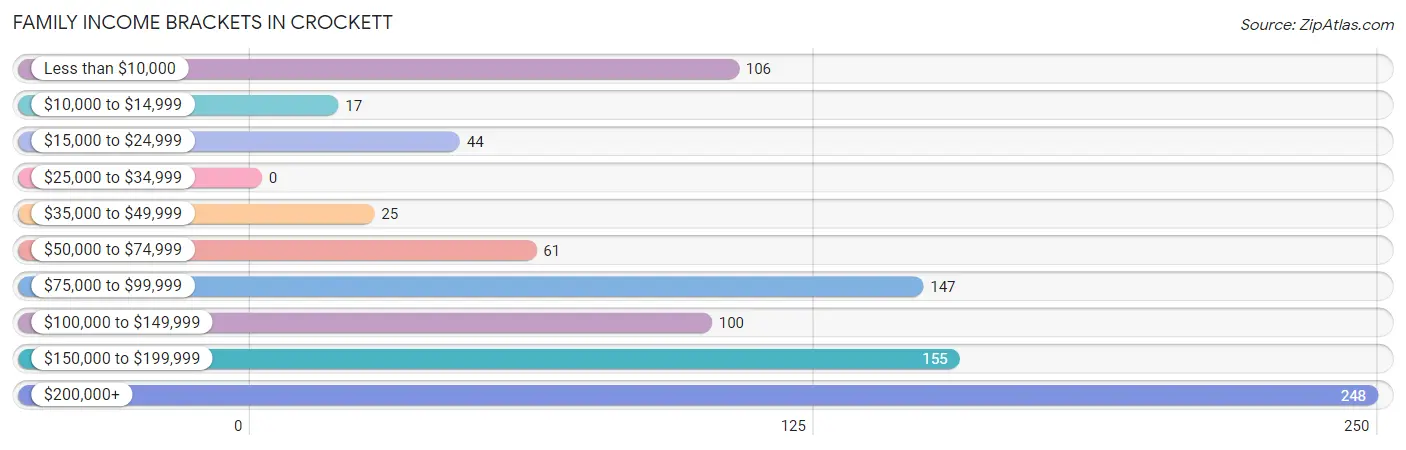
| Income Bracket | # Families | % Families |
| Less than $10,000 | 106 | 11.7% |
| $10,000 to $14,999 | 17 | 1.9% |
| $15,000 to $24,999 | 44 | 4.9% |
| $25,000 to $34,999 | 0 | 0.0% |
| $35,000 to $49,999 | 25 | 2.8% |
| $50,000 to $74,999 | 61 | 6.8% |
| $75,000 to $99,999 | 147 | 16.3% |
| $100,000 to $149,999 | 100 | 11.1% |
| $150,000 to $199,999 | 155 | 17.2% |
| $200,000+ | 248 | 27.5% |
Family Income by Famaliy Size in Crockett
4-person families (99 | 11.0%) account for the highest median family income in Crockett with $155,625 per family, while 3-person families (230 | 25.5%) have the highest median income of $50,662 per family member.
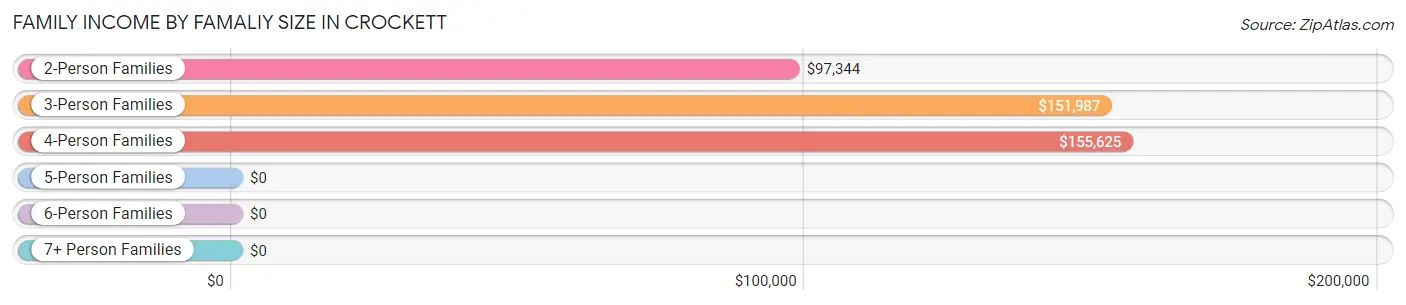
| Income Bracket | # Families | Median Income |
| 2-Person Families | 511 (56.6%) | $97,344 |
| 3-Person Families | 230 (25.5%) | $151,987 |
| 4-Person Families | 99 (11.0%) | $155,625 |
| 5-Person Families | 51 (5.7%) | $0 |
| 6-Person Families | 12 (1.3%) | $0 |
| 7+ Person Families | 0 (0.0%) | $0 |
| Total | 903 (100.0%) | $116,146 |
Family Income by Number of Earners in Crockett
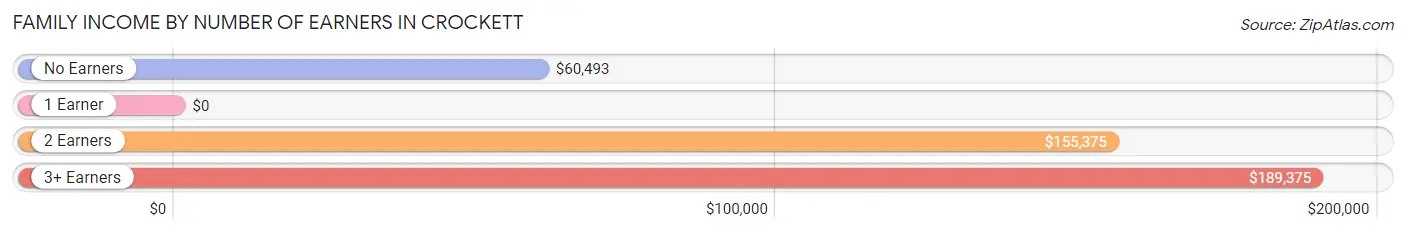
| Number of Earners | # Families | Median Income |
| No Earners | 145 (16.1%) | $60,493 |
| 1 Earner | 267 (29.6%) | $0 |
| 2 Earners | 379 (42.0%) | $155,375 |
| 3+ Earners | 112 (12.4%) | $189,375 |
| Total | 903 (100.0%) | $116,146 |
Household Income in Crockett
Household Income Brackets in Crockett
With 280 households falling in the category, the $100,000 to $149,999 income range is the most frequent in Crockett, accounting for 16.7% of all households. In contrast, only 49 households (2.9%) fall into the $10,000 to $14,999 income bracket, making it the least populous group.
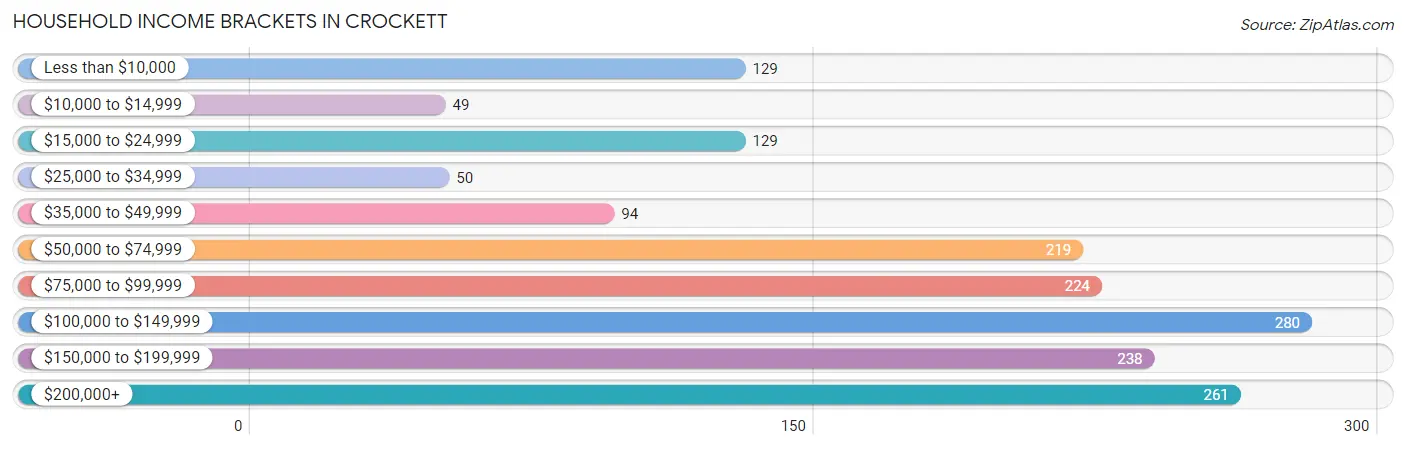
| Income Bracket | # Households | % Households |
| Less than $10,000 | 129 | 7.7% |
| $10,000 to $14,999 | 49 | 2.9% |
| $15,000 to $24,999 | 129 | 7.7% |
| $25,000 to $34,999 | 50 | 3.0% |
| $35,000 to $49,999 | 94 | 5.6% |
| $50,000 to $74,999 | 219 | 13.1% |
| $75,000 to $99,999 | 224 | 13.4% |
| $100,000 to $149,999 | 280 | 16.7% |
| $150,000 to $199,999 | 238 | 14.2% |
| $200,000+ | 261 | 15.6% |
Household Income by Householder Age in Crockett
The median household income in Crockett is $94,167, with the highest median household income of $114,103 found in the 25 to 44 years age bracket for the primary householder. A total of 369 households (22.0%) fall into this category.
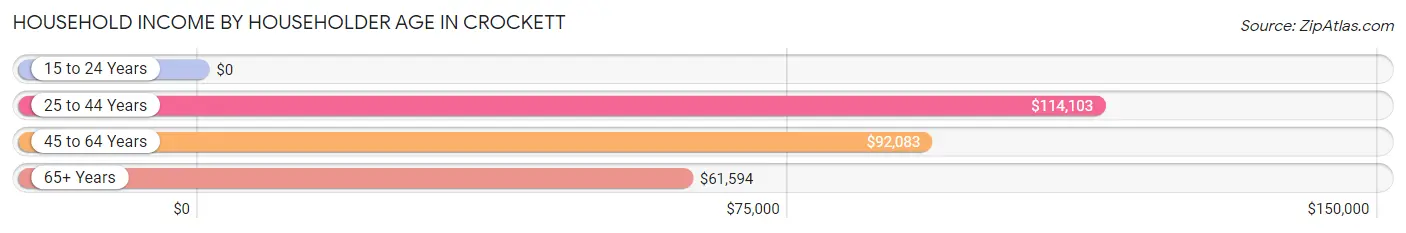
| Income Bracket | # Households | Median Income |
| 15 to 24 Years | 0 (0.0%) | $0 |
| 25 to 44 Years | 369 (22.0%) | $114,103 |
| 45 to 64 Years | 771 (46.1%) | $92,083 |
| 65+ Years | 534 (31.9%) | $61,594 |
| Total | 1,674 (100.0%) | $94,167 |
Poverty in Crockett
Income Below Poverty by Sex and Age in Crockett
With 5.6% poverty level for males and 17.4% for females among the residents of Crockett, 16 and 17 year old males and 16 and 17 year old females are the most vulnerable to poverty, with 14 males (19.4%) and 100 females (75.8%) in their respective age groups living below the poverty level.
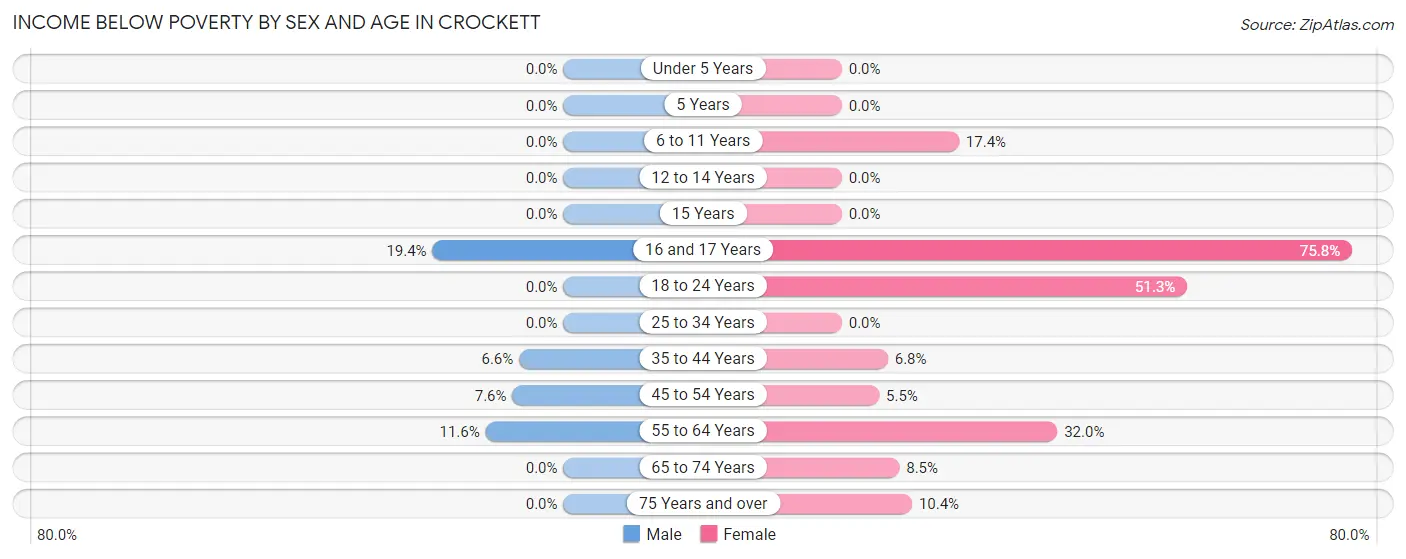
| Age Bracket | Male | Female |
| Under 5 Years | 0 (0.0%) | 0 (0.0%) |
| 5 Years | 0 (0.0%) | 0 (0.0%) |
| 6 to 11 Years | 0 (0.0%) | 16 (17.4%) |
| 12 to 14 Years | 0 (0.0%) | 0 (0.0%) |
| 15 Years | 0 (0.0%) | 0 (0.0%) |
| 16 and 17 Years | 14 (19.4%) | 100 (75.8%) |
| 18 to 24 Years | 0 (0.0%) | 20 (51.3%) |
| 25 to 34 Years | 0 (0.0%) | 0 (0.0%) |
| 35 to 44 Years | 18 (6.6%) | 17 (6.8%) |
| 45 to 54 Years | 19 (7.6%) | 17 (5.5%) |
| 55 to 64 Years | 41 (11.6%) | 127 (32.0%) |
| 65 to 74 Years | 0 (0.0%) | 24 (8.5%) |
| 75 Years and over | 0 (0.0%) | 15 (10.4%) |
| Total | 92 (5.6%) | 336 (17.4%) |
Income Above Poverty by Sex and Age in Crockett
According to the poverty statistics in Crockett, males aged under 5 years and females aged under 5 years are the age groups that are most secure financially, with 100.0% of males and 100.0% of females in these age groups living above the poverty line.
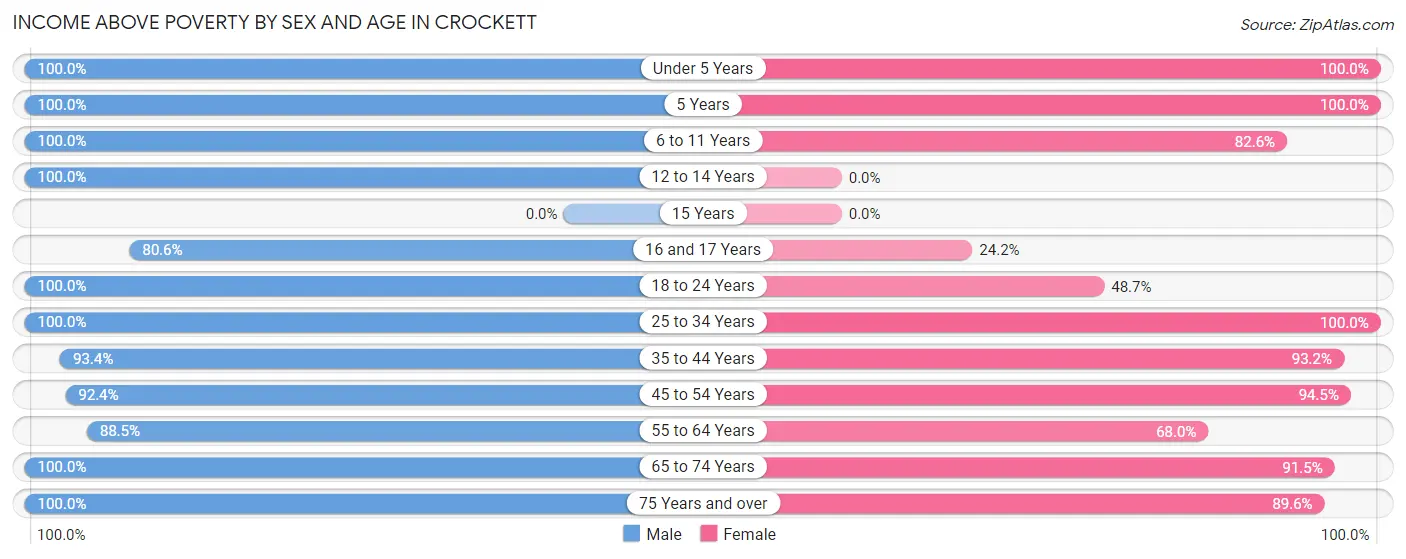
| Age Bracket | Male | Female |
| Under 5 Years | 24 (100.0%) | 41 (100.0%) |
| 5 Years | 16 (100.0%) | 23 (100.0%) |
| 6 to 11 Years | 85 (100.0%) | 76 (82.6%) |
| 12 to 14 Years | 13 (100.0%) | 0 (0.0%) |
| 15 Years | 0 (0.0%) | 0 (0.0%) |
| 16 and 17 Years | 58 (80.6%) | 32 (24.2%) |
| 18 to 24 Years | 137 (100.0%) | 19 (48.7%) |
| 25 to 34 Years | 144 (100.0%) | 226 (100.0%) |
| 35 to 44 Years | 256 (93.4%) | 232 (93.2%) |
| 45 to 54 Years | 232 (92.4%) | 290 (94.5%) |
| 55 to 64 Years | 314 (88.4%) | 270 (68.0%) |
| 65 to 74 Years | 180 (100.0%) | 257 (91.5%) |
| 75 Years and over | 92 (100.0%) | 129 (89.6%) |
| Total | 1,551 (94.4%) | 1,595 (82.6%) |
Income Below Poverty Among Married-Couple Families in Crockett
The poverty statistics for married-couple families in Crockett show that 2.5% or 17 of the total 672 families live below the poverty line. Families with 1 or 2 children have the highest poverty rate of 7.9%, comprising of 17 families. On the other hand, families with no children have the lowest poverty rate of 0.0%, which includes 0 families.
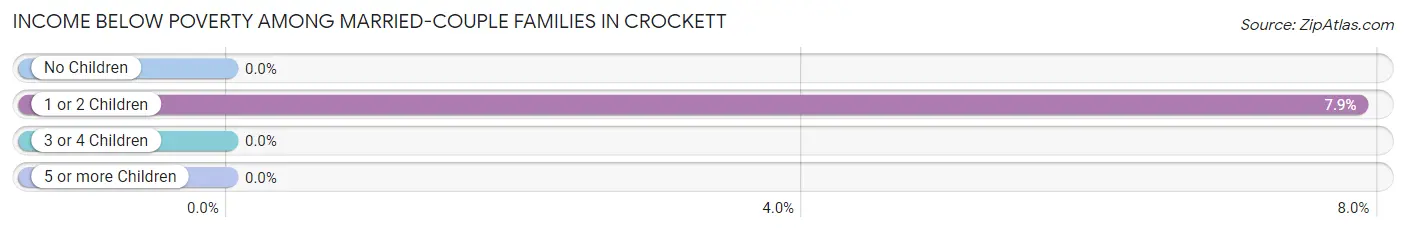
| Children | Above Poverty | Below Poverty |
| No Children | 444 (100.0%) | 0 (0.0%) |
| 1 or 2 Children | 199 (92.1%) | 17 (7.9%) |
| 3 or 4 Children | 12 (100.0%) | 0 (0.0%) |
| 5 or more Children | 0 (0.0%) | 0 (0.0%) |
| Total | 655 (97.5%) | 17 (2.5%) |
Income Below Poverty Among Single-Parent Households in Crockett
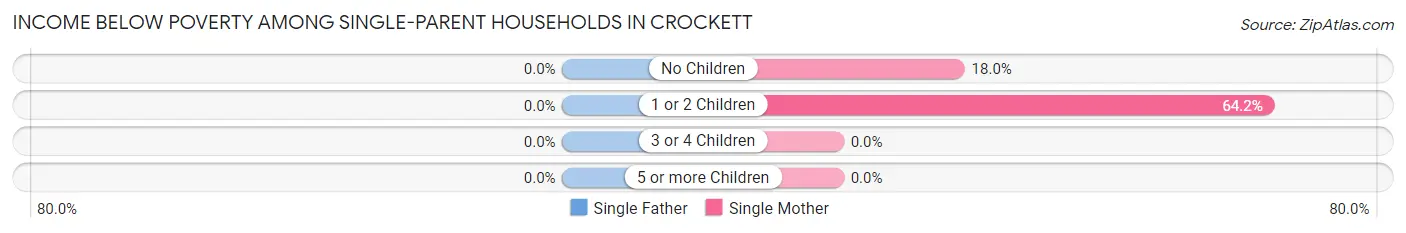
| Children | Single Father | Single Mother |
| No Children | 0 (0.0%) | 11 (18.0%) |
| 1 or 2 Children | 0 (0.0%) | 95 (64.2%) |
| 3 or 4 Children | 0 (0.0%) | 0 (0.0%) |
| 5 or more Children | 0 (0.0%) | 0 (0.0%) |
| Total | 0 (0.0%) | 106 (50.7%) |
Income Below Poverty Among Married-Couple vs Single-Parent Households in Crockett
The poverty data for Crockett shows that 17 of the married-couple family households (2.5%) and 106 of the single-parent households (45.9%) are living below the poverty level. Within the married-couple family households, those with 1 or 2 children have the highest poverty rate, with 17 households (7.9%) falling below the poverty line. Among the single-parent households, those with 1 or 2 children have the highest poverty rate, with 95 household (64.2%) living below poverty.
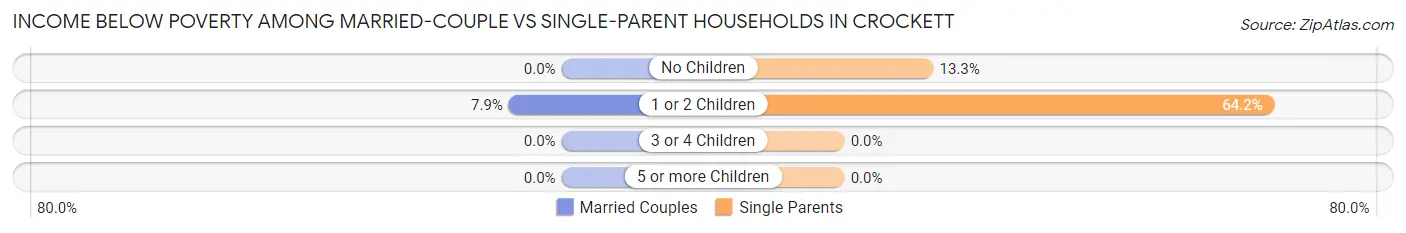
| Children | Married-Couple Families | Single-Parent Households |
| No Children | 0 (0.0%) | 11 (13.3%) |
| 1 or 2 Children | 17 (7.9%) | 95 (64.2%) |
| 3 or 4 Children | 0 (0.0%) | 0 (0.0%) |
| 5 or more Children | 0 (0.0%) | 0 (0.0%) |
| Total | 17 (2.5%) | 106 (45.9%) |
Race in Crockett
The most populous races in Crockett are White / Caucasian (2,422 | 67.8%), Hispanic or Latino (665 | 18.6%), and Black / African American (363 | 10.2%).
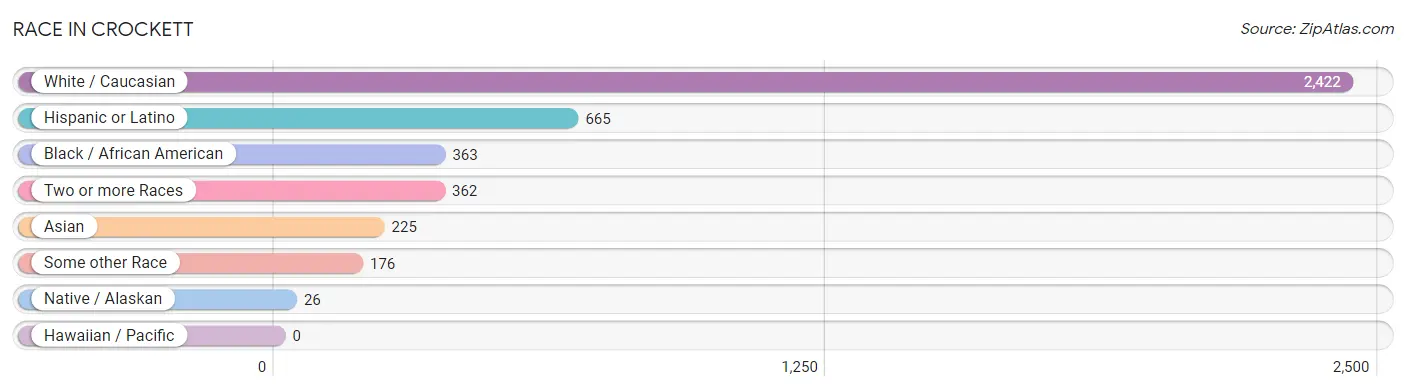
| Race | # Population | % Population |
| Asian | 225 | 6.3% |
| Black / African American | 363 | 10.2% |
| Hawaiian / Pacific | 0 | 0.0% |
| Hispanic or Latino | 665 | 18.6% |
| Native / Alaskan | 26 | 0.7% |
| White / Caucasian | 2,422 | 67.8% |
| Two or more Races | 362 | 10.1% |
| Some other Race | 176 | 4.9% |
| Total | 3,574 | 100.0% |
Ancestry in Crockett
The most populous ancestries reported in Crockett are Mexican (534 | 14.9%), English (514 | 14.4%), Irish (406 | 11.4%), German (313 | 8.8%), and European (308 | 8.6%), together accounting for 58.1% of all Crockett residents.
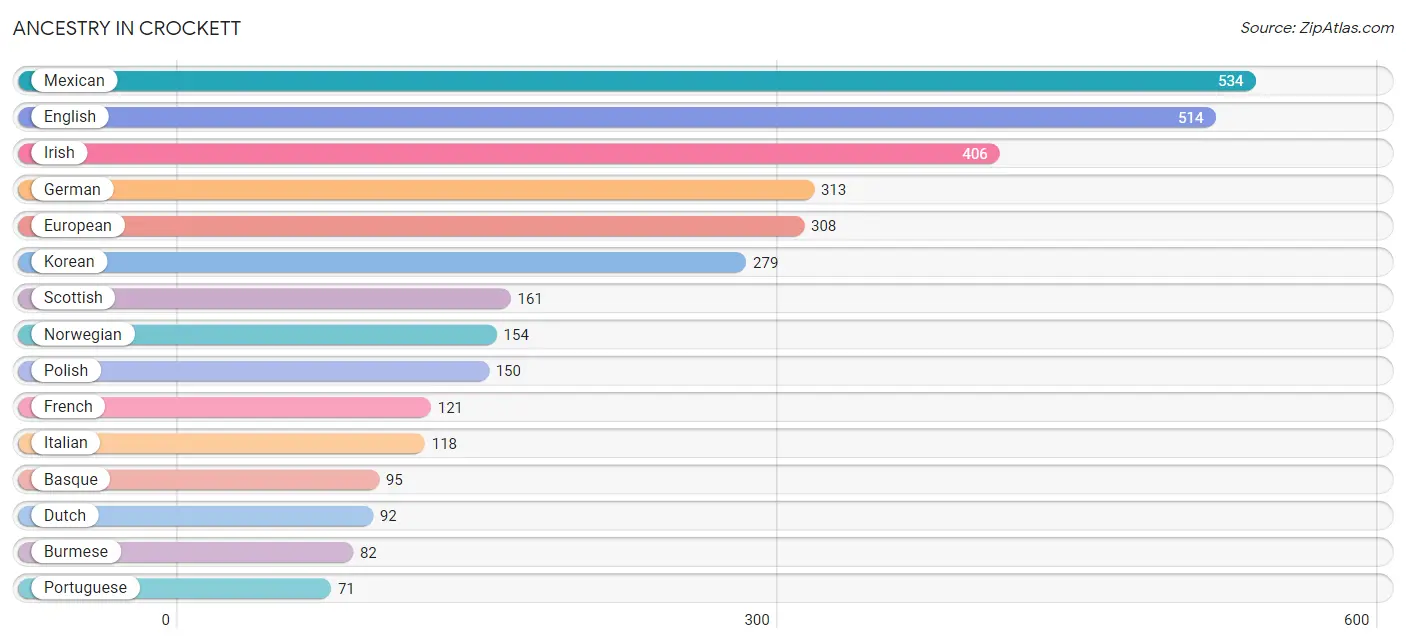
| Ancestry | # Population | % Population |
| African | 30 | 0.8% |
| Apache | 10 | 0.3% |
| Austrian | 24 | 0.7% |
| Basque | 95 | 2.7% |
| Bhutanese | 14 | 0.4% |
| British | 28 | 0.8% |
| Burmese | 82 | 2.3% |
| Canadian | 20 | 0.6% |
| Central American | 67 | 1.9% |
| Chickasaw | 11 | 0.3% |
| Chippewa | 33 | 0.9% |
| Colombian | 22 | 0.6% |
| Croatian | 10 | 0.3% |
| Czech | 9 | 0.3% |
| Czechoslovakian | 31 | 0.9% |
| Danish | 52 | 1.5% |
| Dutch | 92 | 2.6% |
| Eastern European | 10 | 0.3% |
| English | 514 | 14.4% |
| European | 308 | 8.6% |
| Finnish | 49 | 1.4% |
| French | 121 | 3.4% |
| French American Indian | 8 | 0.2% |
| French Canadian | 19 | 0.5% |
| German | 313 | 8.8% |
| Greek | 8 | 0.2% |
| Irish | 406 | 11.4% |
| Italian | 118 | 3.3% |
| Korean | 279 | 7.8% |
| Mexican | 534 | 14.9% |
| Navajo | 10 | 0.3% |
| Northern European | 64 | 1.8% |
| Norwegian | 154 | 4.3% |
| Pakistani | 8 | 0.2% |
| Peruvian | 18 | 0.5% |
| Polish | 150 | 4.2% |
| Portuguese | 71 | 2.0% |
| Romanian | 6 | 0.2% |
| Russian | 55 | 1.5% |
| Salvadoran | 67 | 1.9% |
| Samoan | 36 | 1.0% |
| Scandinavian | 42 | 1.2% |
| Scotch-Irish | 22 | 0.6% |
| Scottish | 161 | 4.5% |
| Seminole | 10 | 0.3% |
| South American | 45 | 1.3% |
| Spaniard | 9 | 0.3% |
| Spanish | 2 | 0.1% |
| Subsaharan African | 30 | 0.8% |
| Swedish | 51 | 1.4% |
| Swiss | 22 | 0.6% |
| Ukrainian | 11 | 0.3% |
| Venezuelan | 5 | 0.1% | View All 53 Rows |
Immigrants in Crockett
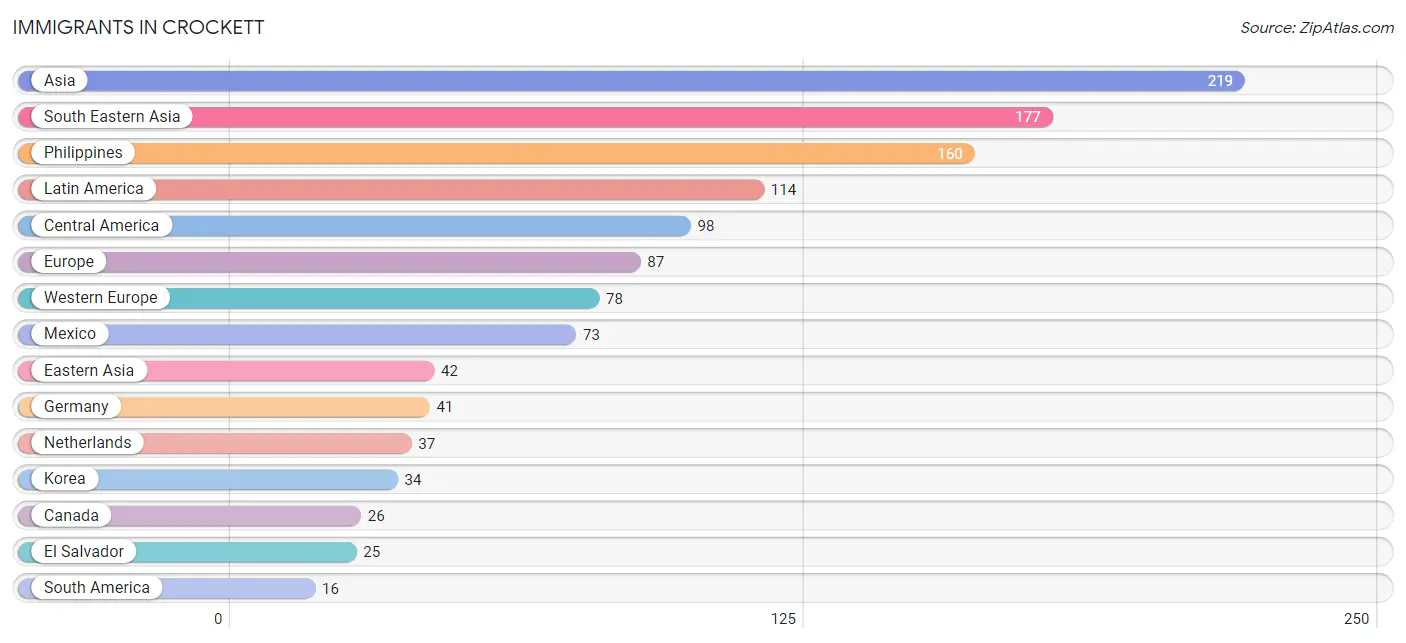
The most numerous immigrant groups reported in Crockett came from Asia (219 | 6.1%), South Eastern Asia (177 | 5.0%), Philippines (160 | 4.5%), Latin America (114 | 3.2%), and Central America (98 | 2.7%), together accounting for 21.5% of all Crockett residents.
| Immigration Origin | # Population | % Population |
| Asia | 219 | 6.1% |
| Canada | 26 | 0.7% |
| Central America | 98 | 2.7% |
| Colombia | 11 | 0.3% |
| Eastern Asia | 42 | 1.2% |
| El Salvador | 25 | 0.7% |
| Europe | 87 | 2.4% |
| Germany | 41 | 1.1% |
| Italy | 9 | 0.3% |
| Japan | 8 | 0.2% |
| Korea | 34 | 0.9% |
| Latin America | 114 | 3.2% |
| Mexico | 73 | 2.0% |
| Netherlands | 37 | 1.0% |
| Philippines | 160 | 4.5% |
| South America | 16 | 0.4% |
| South Eastern Asia | 177 | 5.0% |
| Southern Europe | 9 | 0.3% |
| Thailand | 8 | 0.2% |
| Venezuela | 5 | 0.1% |
| Western Europe | 78 | 2.2% | View All 21 Rows |
Sex and Age in Crockett
Sex and Age in Crockett
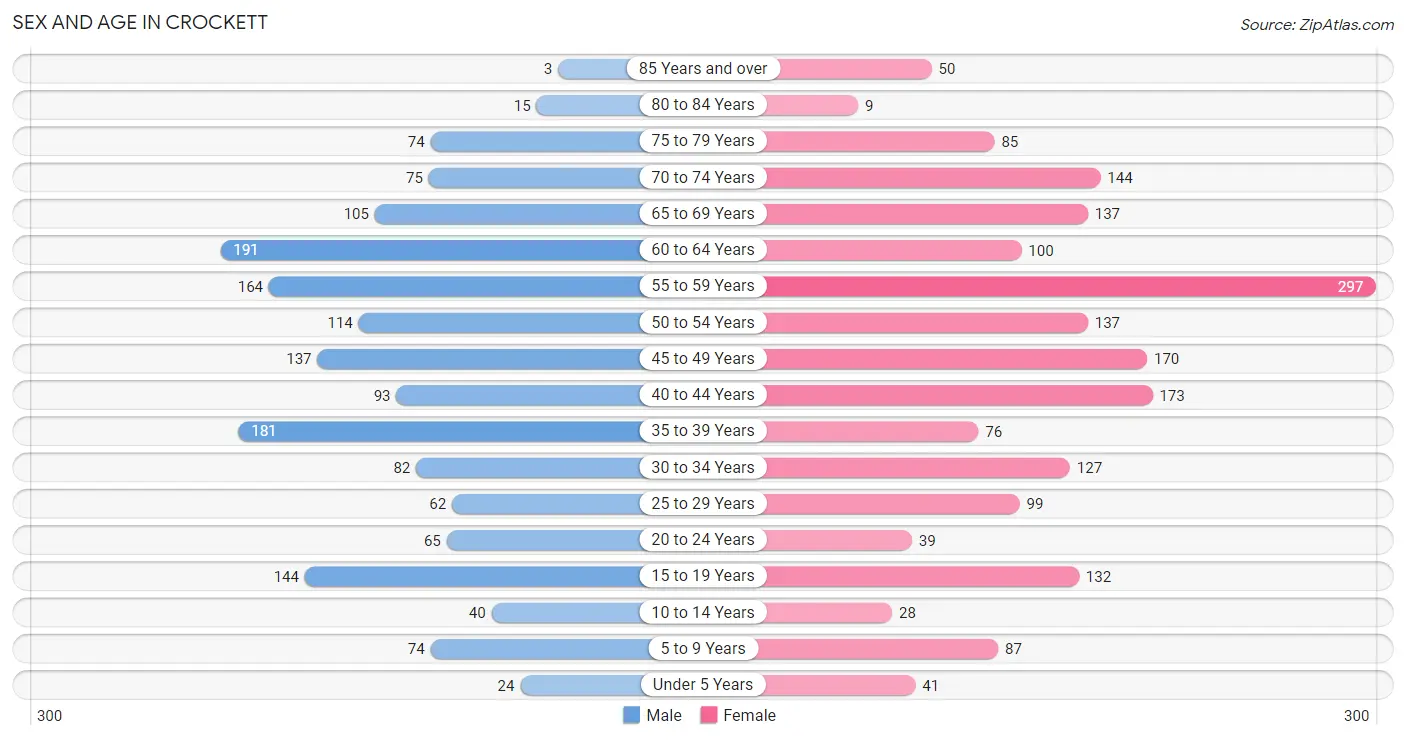
The most populous age groups in Crockett are 60 to 64 Years (191 | 11.6%) for men and 55 to 59 Years (297 | 15.4%) for women.
| Age Bracket | Male | Female |
| Under 5 Years | 24 (1.5%) | 41 (2.1%) |
| 5 to 9 Years | 74 (4.5%) | 87 (4.5%) |
| 10 to 14 Years | 40 (2.4%) | 28 (1.5%) |
| 15 to 19 Years | 144 (8.8%) | 132 (6.8%) |
| 20 to 24 Years | 65 (4.0%) | 39 (2.0%) |
| 25 to 29 Years | 62 (3.8%) | 99 (5.1%) |
| 30 to 34 Years | 82 (5.0%) | 127 (6.6%) |
| 35 to 39 Years | 181 (11.0%) | 76 (3.9%) |
| 40 to 44 Years | 93 (5.7%) | 173 (9.0%) |
| 45 to 49 Years | 137 (8.3%) | 170 (8.8%) |
| 50 to 54 Years | 114 (6.9%) | 137 (7.1%) |
| 55 to 59 Years | 164 (10.0%) | 297 (15.4%) |
| 60 to 64 Years | 191 (11.6%) | 100 (5.2%) |
| 65 to 69 Years | 105 (6.4%) | 137 (7.1%) |
| 70 to 74 Years | 75 (4.6%) | 144 (7.5%) |
| 75 to 79 Years | 74 (4.5%) | 85 (4.4%) |
| 80 to 84 Years | 15 (0.9%) | 9 (0.5%) |
| 85 Years and over | 3 (0.2%) | 50 (2.6%) |
| Total | 1,643 (100.0%) | 1,931 (100.0%) |
Families and Households in Crockett
Median Family Size in Crockett
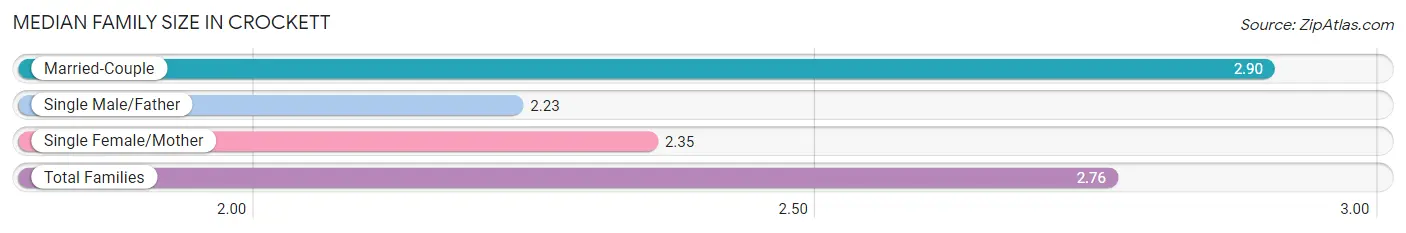
The median family size in Crockett is 2.76 persons per family, with married-couple families (672 | 74.4%) accounting for the largest median family size of 2.9 persons per family. On the other hand, single male/father families (22 | 2.4%) represent the smallest median family size with 2.23 persons per family.
| Family Type | # Families | Family Size |
| Married-Couple | 672 (74.4%) | 2.90 |
| Single Male/Father | 22 (2.4%) | 2.23 |
| Single Female/Mother | 209 (23.2%) | 2.35 |
| Total Families | 903 (100.0%) | 2.76 |
Median Household Size in Crockett
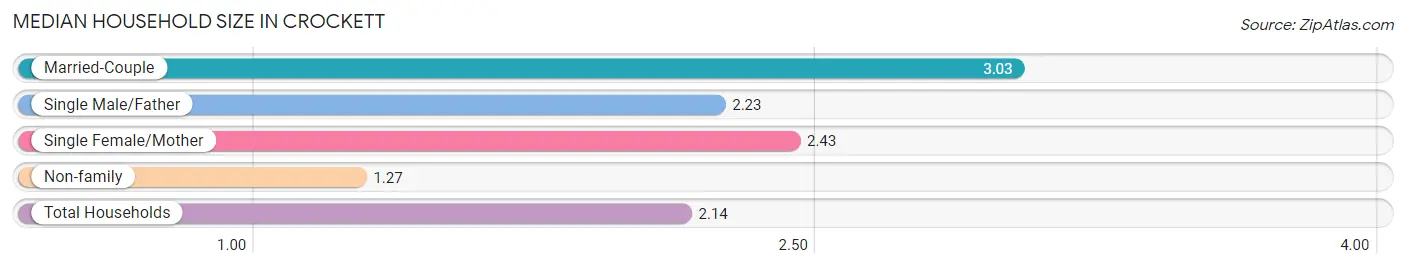
The median household size in Crockett is 2.14 persons per household, with married-couple households (672 | 40.1%) accounting for the largest median household size of 3.03 persons per household. non-family households (771 | 46.1%) represent the smallest median household size with 1.27 persons per household.
| Household Type | # Households | Household Size |
| Married-Couple | 672 (40.1%) | 3.03 |
| Single Male/Father | 22 (1.3%) | 2.23 |
| Single Female/Mother | 209 (12.5%) | 2.43 |
| Non-family | 771 (46.1%) | 1.27 |
| Total Households | 1,674 (100.0%) | 2.14 |
Household Size by Marriage Status in Crockett
Out of a total of 1,674 households in Crockett, 903 (53.9%) are family households, while 771 (46.1%) are nonfamily households. The most numerous type of family households are 2-person households, comprising 504, and the most common type of nonfamily households are 1-person households, comprising 642.
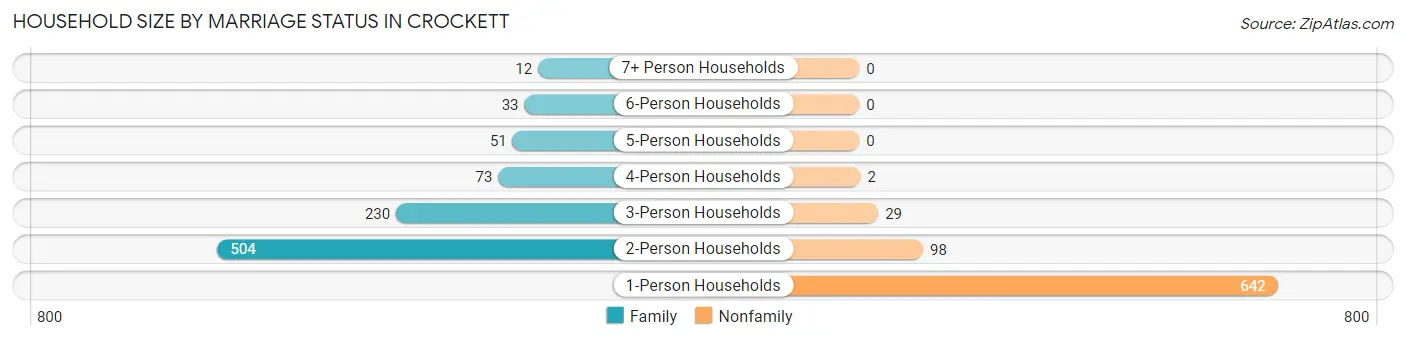
| Household Size | Family Households | Nonfamily Households |
| 1-Person Households | - | 642 (38.4%) |
| 2-Person Households | 504 (30.1%) | 98 (5.9%) |
| 3-Person Households | 230 (13.7%) | 29 (1.7%) |
| 4-Person Households | 73 (4.4%) | 2 (0.1%) |
| 5-Person Households | 51 (3.0%) | 0 (0.0%) |
| 6-Person Households | 33 (2.0%) | 0 (0.0%) |
| 7+ Person Households | 12 (0.7%) | 0 (0.0%) |
| Total | 903 (53.9%) | 771 (46.1%) |
Female Fertility in Crockett
Fertility by Age in Crockett
Average fertility rate in Crockett is 41.0 births per 1,000 women. Women in the age bracket of 20 to 34 years have the highest fertility rate with 128.0 births per 1,000 women. Women in the age bracket of 20 to 34 years acount for 100.0% of all women with births.
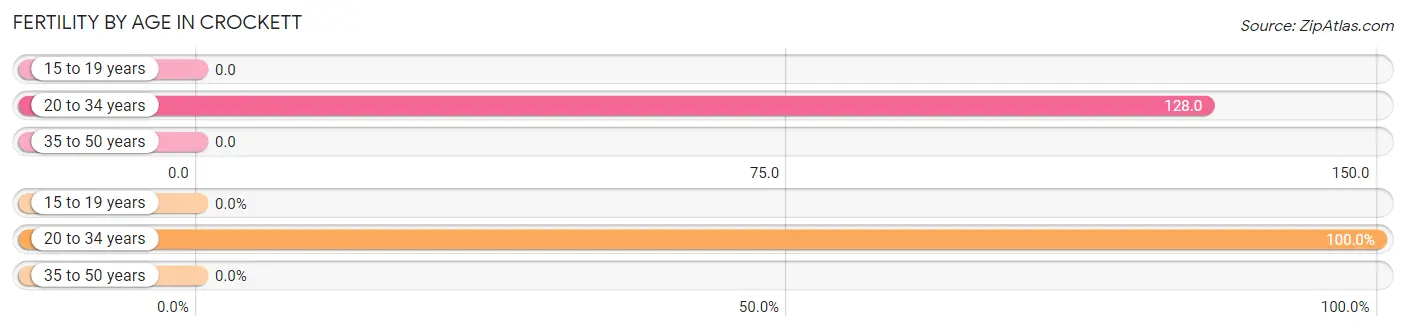
| Age Bracket | Women with Births | Births / 1,000 Women |
| 15 to 19 years | 0 (0.0%) | 0.0 |
| 20 to 34 years | 34 (100.0%) | 128.0 |
| 35 to 50 years | 0 (0.0%) | 0.0 |
| Total | 34 (100.0%) | 41.0 |
Fertility by Age by Marriage Status in Crockett
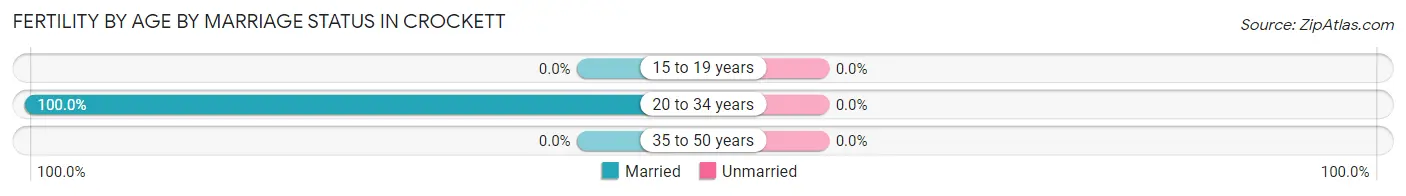
| Age Bracket | Married | Unmarried |
| 15 to 19 years | 0 (0.0%) | 0 (0.0%) |
| 20 to 34 years | 34 (100.0%) | 0 (0.0%) |
| 35 to 50 years | 0 (0.0%) | 0 (0.0%) |
| Total | 34 (100.0%) | 0 (0.0%) |
Fertility by Education in Crockett
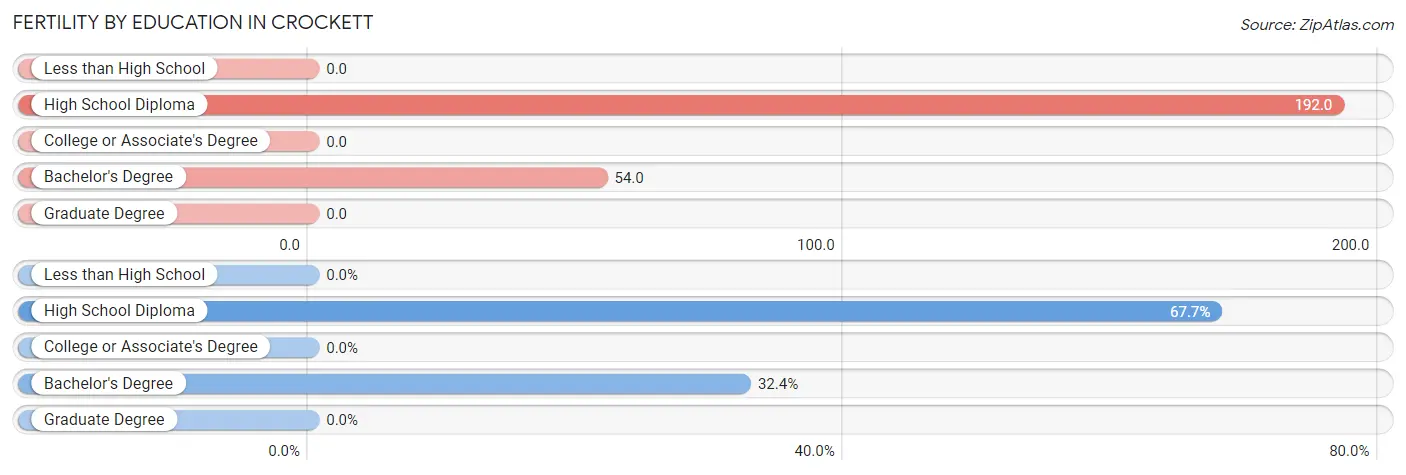
| Educational Attainment | Women with Births | Births / 1,000 Women |
| Less than High School | 0 (0.0%) | 0.0 |
| High School Diploma | 23 (67.6%) | 192.0 |
| College or Associate's Degree | 0 (0.0%) | 0.0 |
| Bachelor's Degree | 11 (32.4%) | 54.0 |
| Graduate Degree | 0 (0.0%) | 0.0 |
| Total | 34 (100.0%) | 41.0 |
Fertility by Education by Marriage Status in Crockett
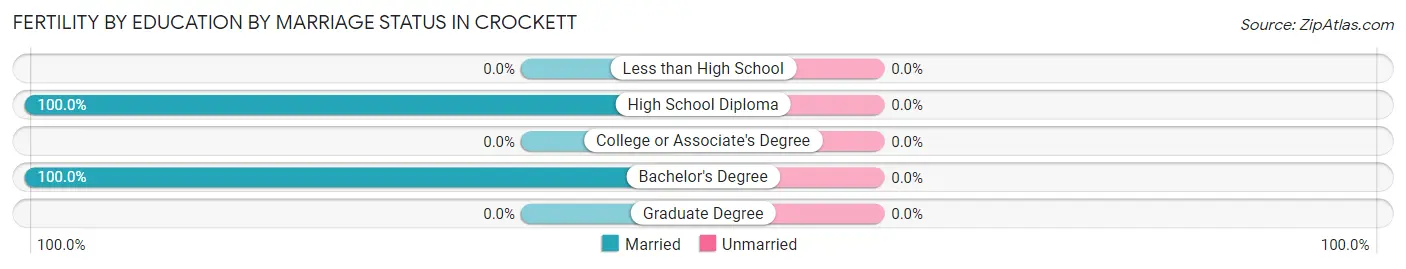
| Educational Attainment | Married | Unmarried |
| Less than High School | 0 (0.0%) | 0 (0.0%) |
| High School Diploma | 23 (100.0%) | 0 (0.0%) |
| College or Associate's Degree | 0 (0.0%) | 0 (0.0%) |
| Bachelor's Degree | 11 (100.0%) | 0 (0.0%) |
| Graduate Degree | 0 (0.0%) | 0 (0.0%) |
| Total | 34 (100.0%) | 0 (0.0%) |
Employment Characteristics in Crockett
Employment by Class of Employer in Crockett
Among the 1,903 employed individuals in Crockett, private company employees (1,132 | 59.5%), local government employees (203 | 10.7%), and state government employees (181 | 9.5%) make up the most common classes of employment.
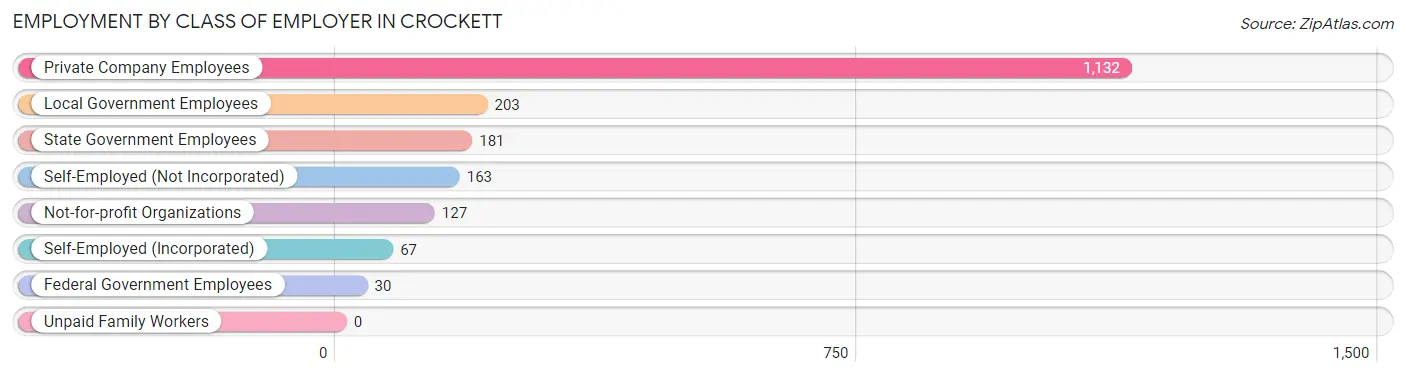
| Employer Class | # Employees | % Employees |
| Private Company Employees | 1,132 | 59.5% |
| Self-Employed (Incorporated) | 67 | 3.5% |
| Self-Employed (Not Incorporated) | 163 | 8.6% |
| Not-for-profit Organizations | 127 | 6.7% |
| Local Government Employees | 203 | 10.7% |
| State Government Employees | 181 | 9.5% |
| Federal Government Employees | 30 | 1.6% |
| Unpaid Family Workers | 0 | 0.0% |
| Total | 1,903 | 100.0% |
Employment Status by Age in Crockett
According to the labor force statistics for Crockett, out of the total population over 16 years of age (3,280), 62.9% or 2,063 individuals are in the labor force, with 7.7% or 159 of them unemployed. The age group with the highest labor force participation rate is 55 to 59 years, with 93.1% or 429 individuals in the labor force. Within the labor force, the 45 to 54 years age range has the highest percentage of unemployed individuals, with 23.5% or 115 of them being unemployed.
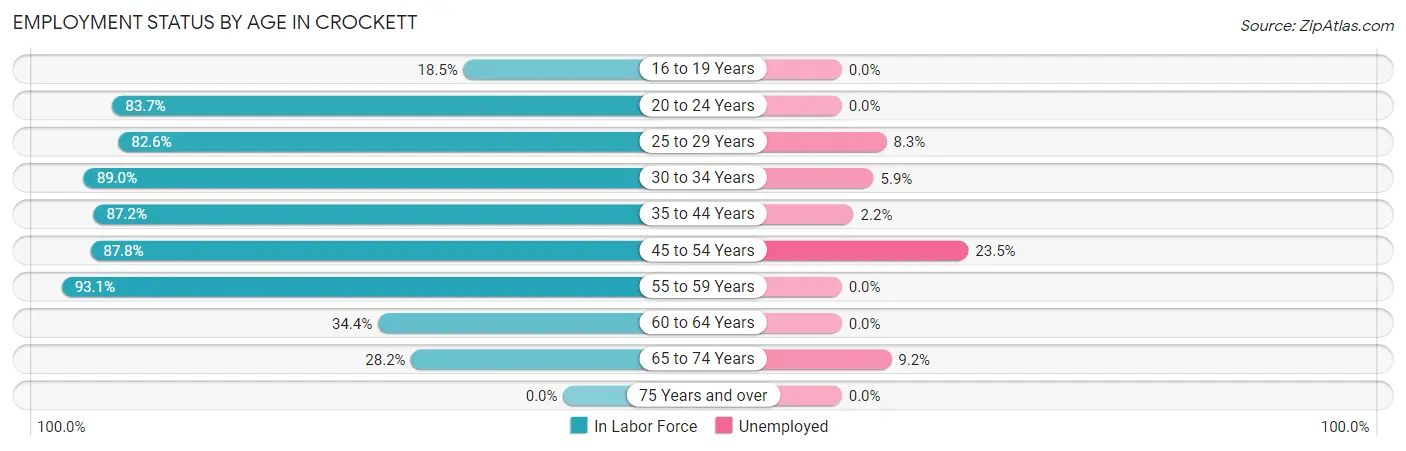
| Age Bracket | In Labor Force | Unemployed |
| 16 to 19 Years | 51 (18.5%) | 0 (0.0%) |
| 20 to 24 Years | 87 (83.7%) | 0 (0.0%) |
| 25 to 29 Years | 133 (82.6%) | 11 (8.3%) |
| 30 to 34 Years | 186 (89.0%) | 11 (5.9%) |
| 35 to 44 Years | 456 (87.2%) | 10 (2.2%) |
| 45 to 54 Years | 490 (87.8%) | 115 (23.5%) |
| 55 to 59 Years | 429 (93.1%) | 0 (0.0%) |
| 60 to 64 Years | 100 (34.4%) | 0 (0.0%) |
| 65 to 74 Years | 130 (28.2%) | 12 (9.2%) |
| 75 Years and over | 0 (0.0%) | 0 (0.0%) |
| Total | 2,063 (62.9%) | 159 (7.7%) |
Employment Status by Educational Attainment in Crockett
According to labor force statistics for Crockett, 81.4% of individuals (1,793) out of the total population between 25 and 64 years of age (2,203) are in the labor force, with 8.2% or 147 of them being unemployed. The group with the highest labor force participation rate are those with the educational attainment of bachelor's degree or higher, with 87.0% or 786 individuals in the labor force. Within the labor force, individuals with college / associate degree education have the highest percentage of unemployment, with 15.1% or 110 of them being unemployed.
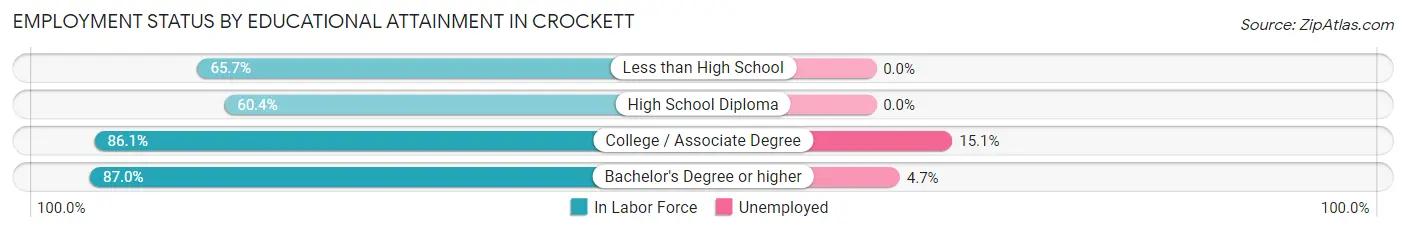
| Educational Attainment | In Labor Force | Unemployed |
| Less than High School | 67 (65.7%) | 0 (0.0%) |
| High School Diploma | 212 (60.4%) | 0 (0.0%) |
| College / Associate Degree | 729 (86.1%) | 128 (15.1%) |
| Bachelor's Degree or higher | 786 (87.0%) | 42 (4.7%) |
| Total | 1,793 (81.4%) | 181 (8.2%) |
Employment Occupations by Sex in Crockett
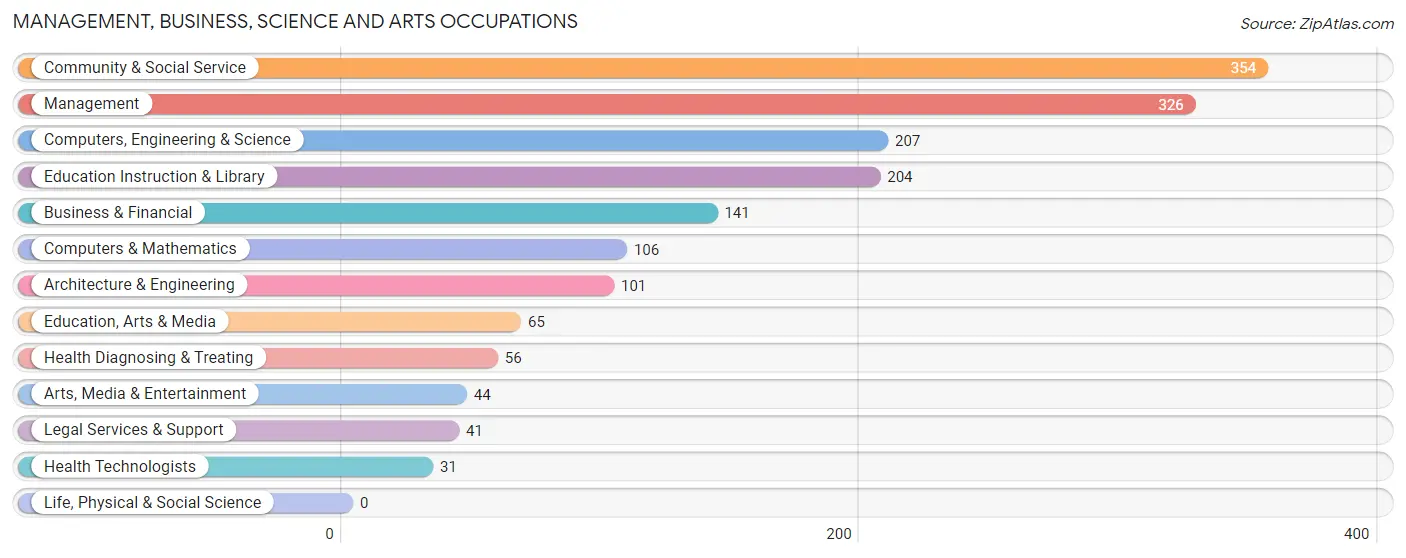
Management, Business, Science and Arts Occupations
The most common Management, Business, Science and Arts occupations in Crockett are Community & Social Service (354 | 18.6%), Management (326 | 17.1%), Computers, Engineering & Science (207 | 10.9%), Education Instruction & Library (204 | 10.7%), and Business & Financial (141 | 7.4%).
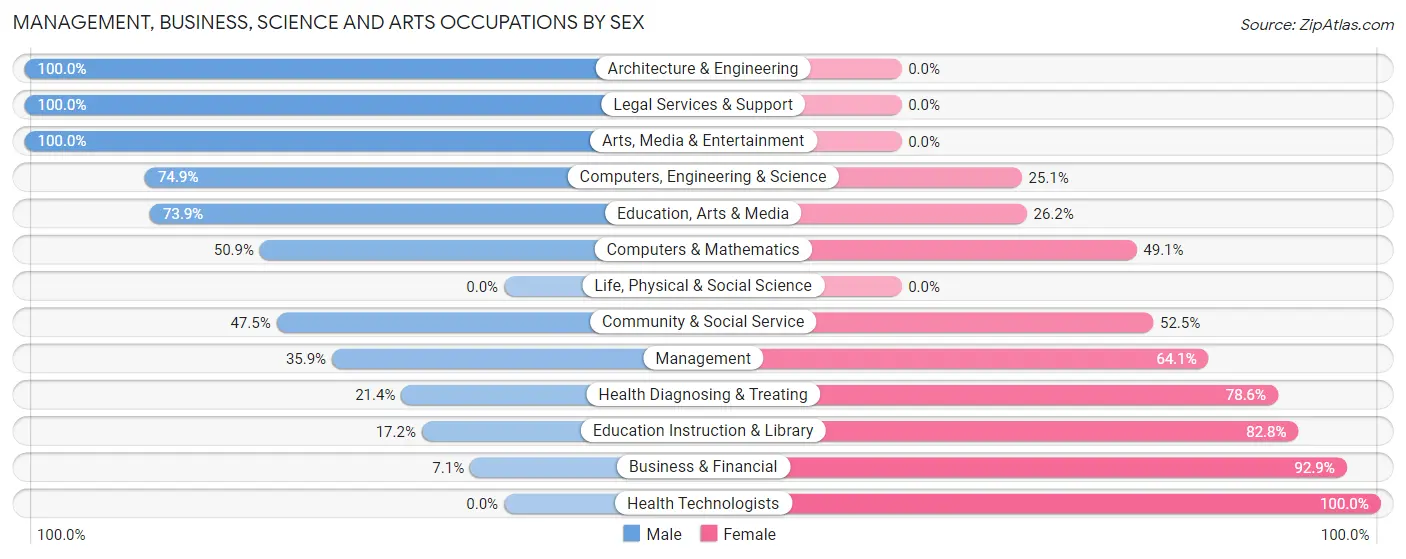
Management, Business, Science and Arts Occupations by Sex
Within the Management, Business, Science and Arts occupations in Crockett, the most male-oriented occupations are Architecture & Engineering (100.0%), Legal Services & Support (100.0%), and Arts, Media & Entertainment (100.0%), while the most female-oriented occupations are Health Technologists (100.0%), Business & Financial (92.9%), and Education Instruction & Library (82.8%).
| Occupation | Male | Female |
| Management | 117 (35.9%) | 209 (64.1%) |
| Business & Financial | 10 (7.1%) | 131 (92.9%) |
| Computers, Engineering & Science | 155 (74.9%) | 52 (25.1%) |
| Computers & Mathematics | 54 (50.9%) | 52 (49.1%) |
| Architecture & Engineering | 101 (100.0%) | 0 (0.0%) |
| Life, Physical & Social Science | 0 (0.0%) | 0 (0.0%) |
| Community & Social Service | 168 (47.5%) | 186 (52.5%) |
| Education, Arts & Media | 48 (73.9%) | 17 (26.2%) |
| Legal Services & Support | 41 (100.0%) | 0 (0.0%) |
| Education Instruction & Library | 35 (17.2%) | 169 (82.8%) |
| Arts, Media & Entertainment | 44 (100.0%) | 0 (0.0%) |
| Health Diagnosing & Treating | 12 (21.4%) | 44 (78.6%) |
| Health Technologists | 0 (0.0%) | 31 (100.0%) |
| Total (Category) | 462 (42.6%) | 622 (57.4%) |
| Total (Overall) | 927 (48.7%) | 976 (51.3%) |
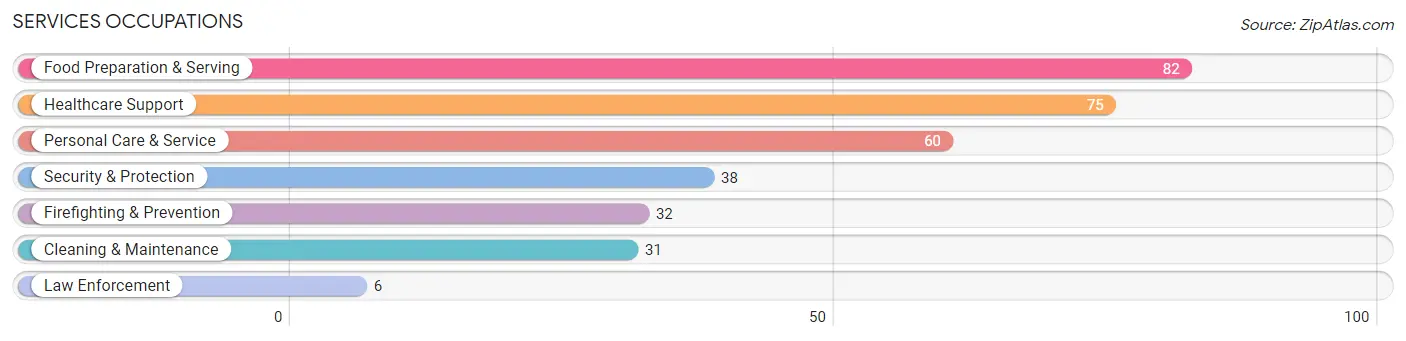
Services Occupations
The most common Services occupations in Crockett are Food Preparation & Serving (82 | 4.3%), Healthcare Support (75 | 3.9%), Personal Care & Service (60 | 3.2%), Security & Protection (38 | 2.0%), and Firefighting & Prevention (32 | 1.7%).
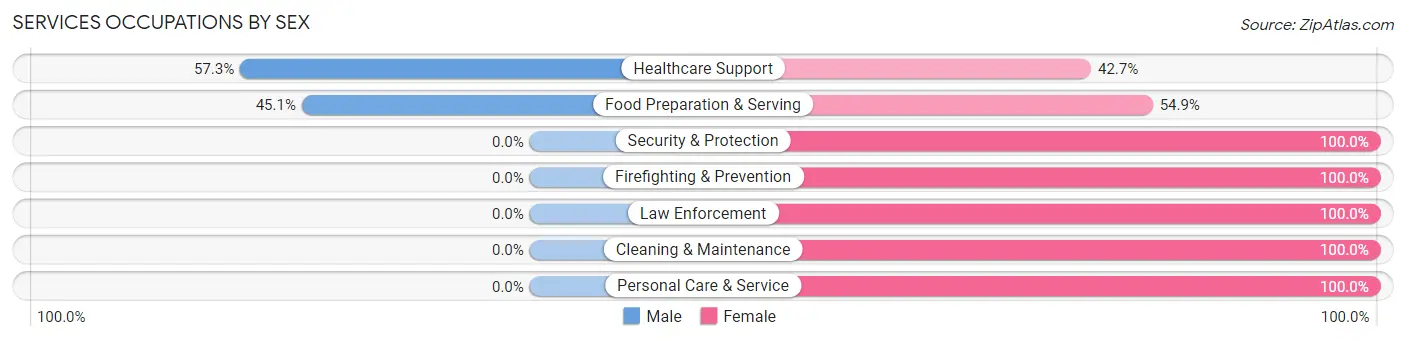
Services Occupations by Sex
Within the Services occupations in Crockett, the most male-oriented occupations are Healthcare Support (57.3%), and Food Preparation & Serving (45.1%), while the most female-oriented occupations are Security & Protection (100.0%), Firefighting & Prevention (100.0%), and Law Enforcement (100.0%).
| Occupation | Male | Female |
| Healthcare Support | 43 (57.3%) | 32 (42.7%) |
| Security & Protection | 0 (0.0%) | 38 (100.0%) |
| Firefighting & Prevention | 0 (0.0%) | 32 (100.0%) |
| Law Enforcement | 0 (0.0%) | 6 (100.0%) |
| Food Preparation & Serving | 37 (45.1%) | 45 (54.9%) |
| Cleaning & Maintenance | 0 (0.0%) | 31 (100.0%) |
| Personal Care & Service | 0 (0.0%) | 60 (100.0%) |
| Total (Category) | 80 (28.0%) | 206 (72.0%) |
| Total (Overall) | 927 (48.7%) | 976 (51.3%) |
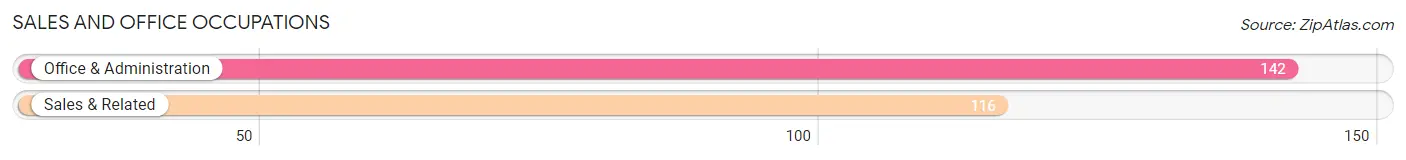
Sales and Office Occupations
The most common Sales and Office occupations in Crockett are Office & Administration (142 | 7.5%), and Sales & Related (116 | 6.1%).
Sales and Office Occupations by Sex
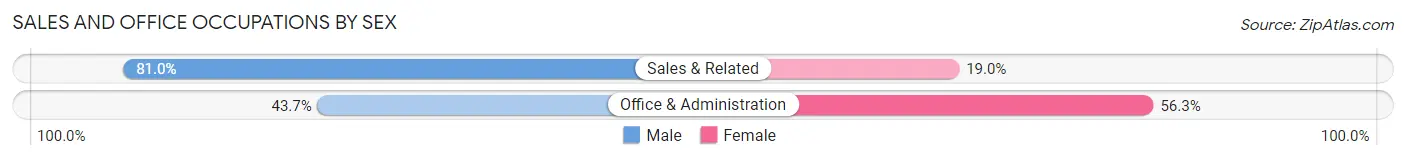
| Occupation | Male | Female |
| Sales & Related | 94 (81.0%) | 22 (19.0%) |
| Office & Administration | 62 (43.7%) | 80 (56.3%) |
| Total (Category) | 156 (60.5%) | 102 (39.5%) |
| Total (Overall) | 927 (48.7%) | 976 (51.3%) |
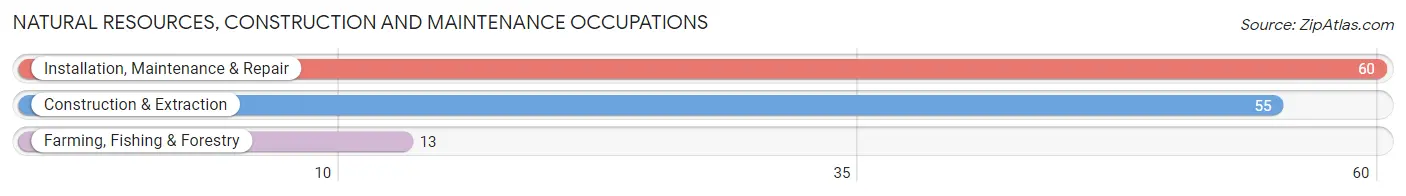
Natural Resources, Construction and Maintenance Occupations
The most common Natural Resources, Construction and Maintenance occupations in Crockett are Installation, Maintenance & Repair (60 | 3.2%), Construction & Extraction (55 | 2.9%), and Farming, Fishing & Forestry (13 | 0.7%).
Natural Resources, Construction and Maintenance Occupations by Sex
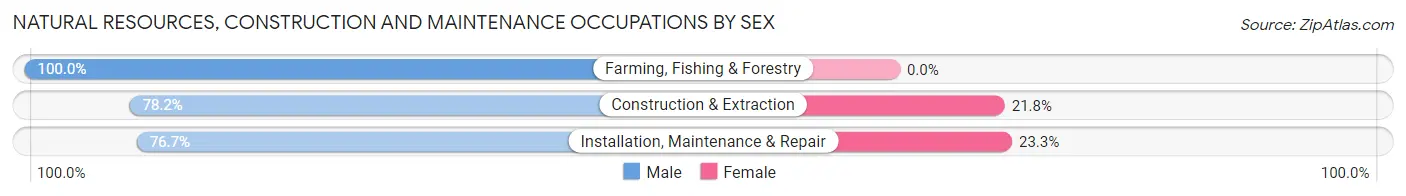
| Occupation | Male | Female |
| Farming, Fishing & Forestry | 13 (100.0%) | 0 (0.0%) |
| Construction & Extraction | 43 (78.2%) | 12 (21.8%) |
| Installation, Maintenance & Repair | 46 (76.7%) | 14 (23.3%) |
| Total (Category) | 102 (79.7%) | 26 (20.3%) |
| Total (Overall) | 927 (48.7%) | 976 (51.3%) |
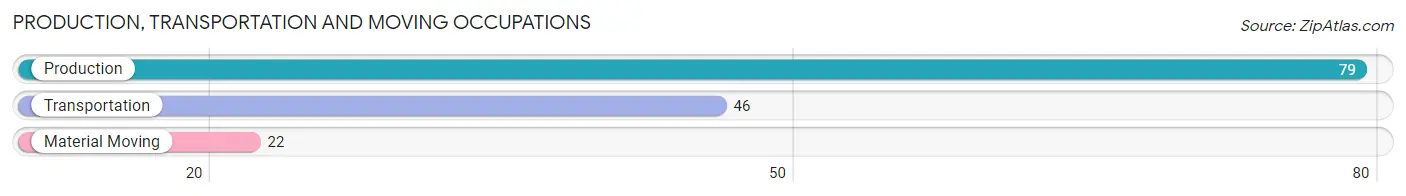
Production, Transportation and Moving Occupations
The most common Production, Transportation and Moving occupations in Crockett are Production (79 | 4.2%), Transportation (46 | 2.4%), and Material Moving (22 | 1.2%).
Production, Transportation and Moving Occupations by Sex
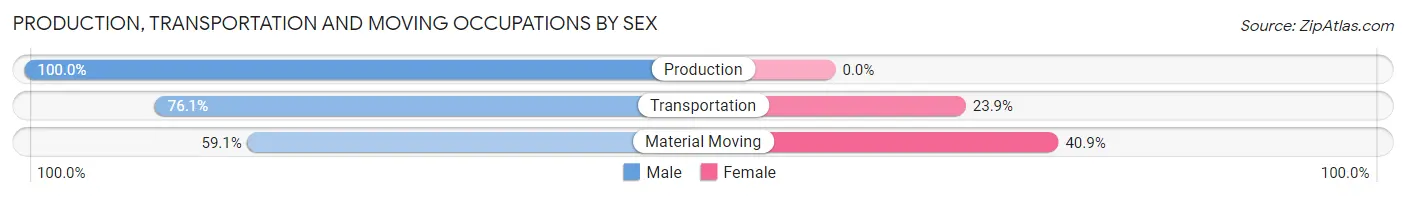
| Occupation | Male | Female |
| Production | 79 (100.0%) | 0 (0.0%) |
| Transportation | 35 (76.1%) | 11 (23.9%) |
| Material Moving | 13 (59.1%) | 9 (40.9%) |
| Total (Category) | 127 (86.4%) | 20 (13.6%) |
| Total (Overall) | 927 (48.7%) | 976 (51.3%) |
Employment Industries by Sex in Crockett
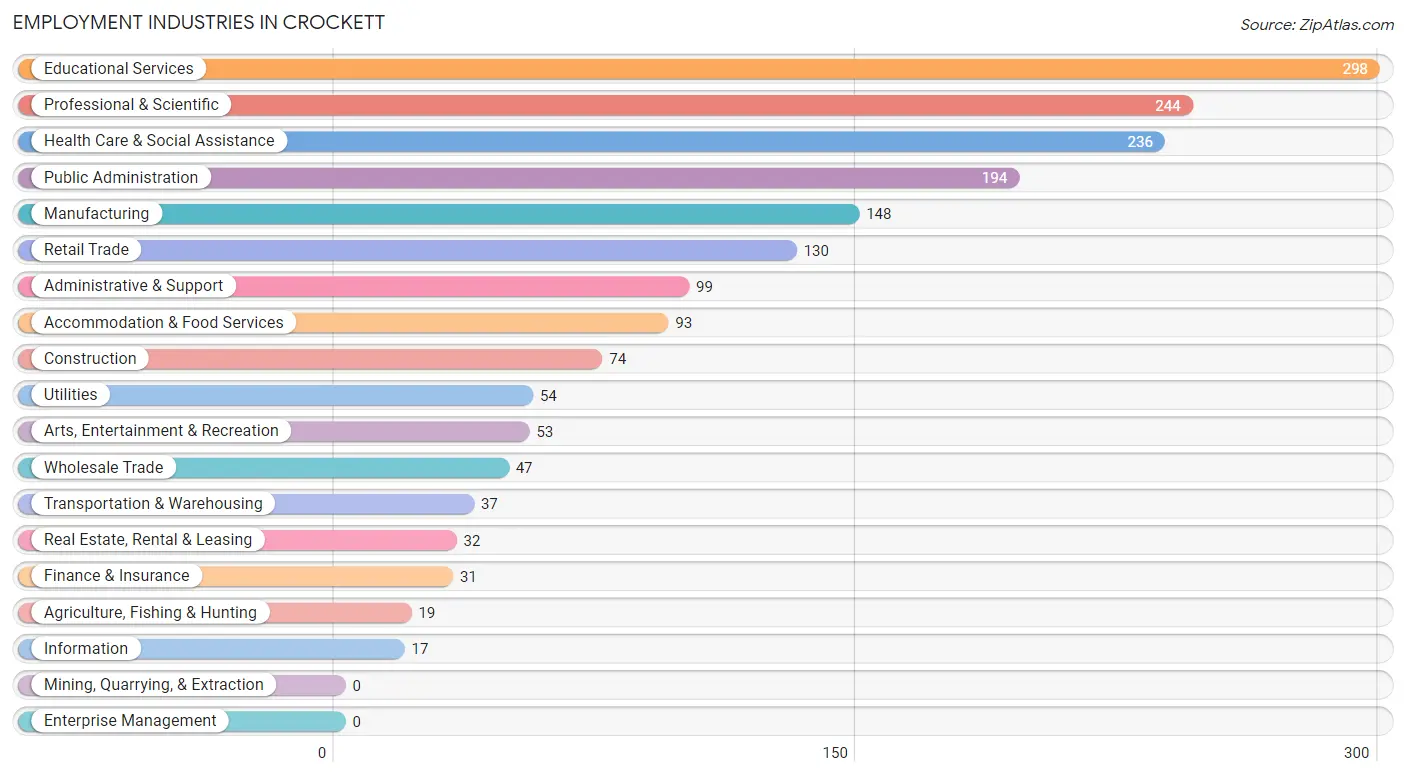
Employment Industries in Crockett
The major employment industries in Crockett include Educational Services (298 | 15.7%), Professional & Scientific (244 | 12.8%), Health Care & Social Assistance (236 | 12.4%), Public Administration (194 | 10.2%), and Manufacturing (148 | 7.8%).
Employment Industries by Sex in Crockett
The Crockett industries that see more men than women are Agriculture, Fishing & Hunting (100.0%), Wholesale Trade (100.0%), and Construction (83.8%), whereas the industries that tend to have a higher number of women are Information (100.0%), Finance & Insurance (100.0%), and Transportation & Warehousing (75.7%).
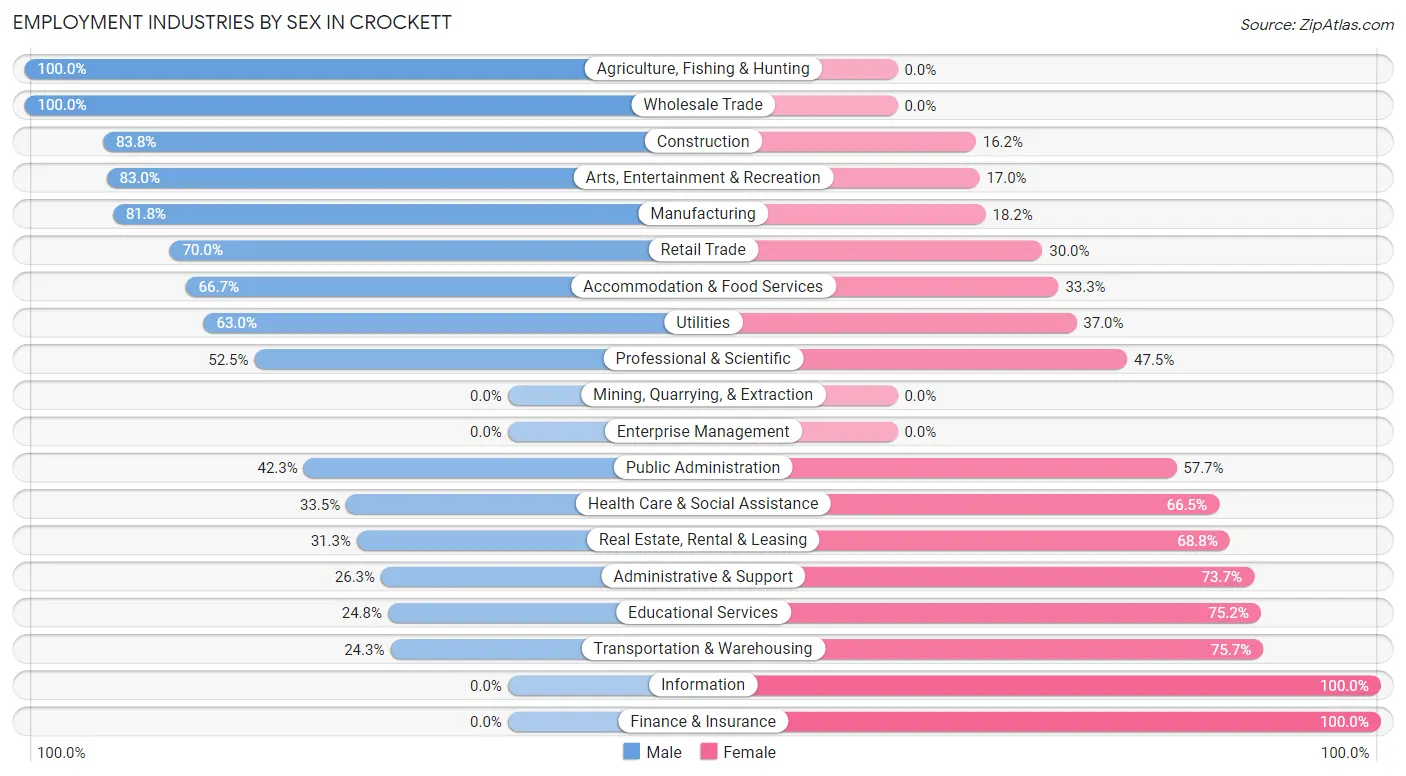
| Industry | Male | Female |
| Agriculture, Fishing & Hunting | 19 (100.0%) | 0 (0.0%) |
| Mining, Quarrying, & Extraction | 0 (0.0%) | 0 (0.0%) |
| Construction | 62 (83.8%) | 12 (16.2%) |
| Manufacturing | 121 (81.8%) | 27 (18.2%) |
| Wholesale Trade | 47 (100.0%) | 0 (0.0%) |
| Retail Trade | 91 (70.0%) | 39 (30.0%) |
| Transportation & Warehousing | 9 (24.3%) | 28 (75.7%) |
| Utilities | 34 (63.0%) | 20 (37.0%) |
| Information | 0 (0.0%) | 17 (100.0%) |
| Finance & Insurance | 0 (0.0%) | 31 (100.0%) |
| Real Estate, Rental & Leasing | 10 (31.2%) | 22 (68.8%) |
| Professional & Scientific | 128 (52.5%) | 116 (47.5%) |
| Enterprise Management | 0 (0.0%) | 0 (0.0%) |
| Administrative & Support | 26 (26.3%) | 73 (73.7%) |
| Educational Services | 74 (24.8%) | 224 (75.2%) |
| Health Care & Social Assistance | 79 (33.5%) | 157 (66.5%) |
| Arts, Entertainment & Recreation | 44 (83.0%) | 9 (17.0%) |
| Accommodation & Food Services | 62 (66.7%) | 31 (33.3%) |
| Public Administration | 82 (42.3%) | 112 (57.7%) |
| Total | 927 (48.7%) | 976 (51.3%) |
Education in Crockett
School Enrollment in Crockett
The most common levels of schooling among the 683 students in Crockett are high school (213 | 31.2%), college / undergraduate (185 | 27.1%), and elementary school (122 | 17.9%).
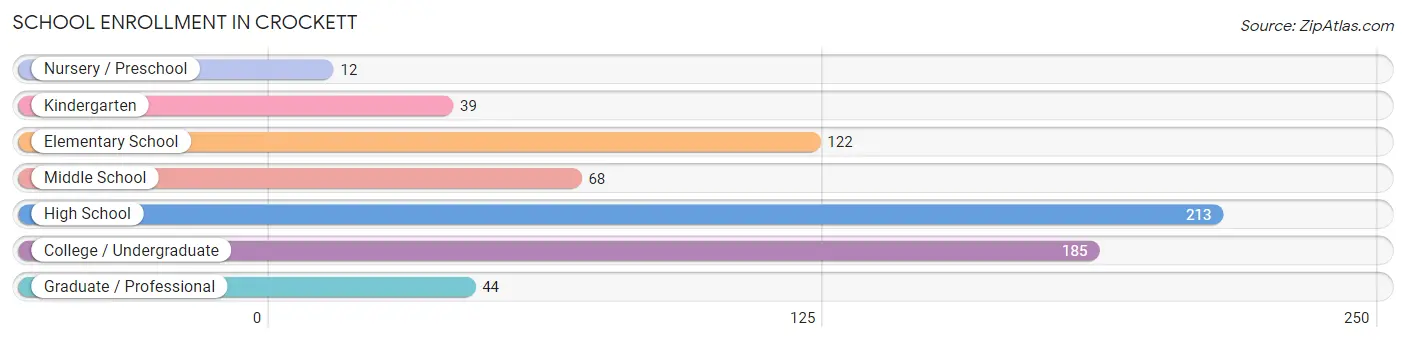
| School Level | # Students | % Students |
| Nursery / Preschool | 12 | 1.8% |
| Kindergarten | 39 | 5.7% |
| Elementary School | 122 | 17.9% |
| Middle School | 68 | 10.0% |
| High School | 213 | 31.2% |
| College / Undergraduate | 185 | 27.1% |
| Graduate / Professional | 44 | 6.4% |
| Total | 683 | 100.0% |
School Enrollment by Age by Funding Source in Crockett
Out of a total of 683 students who are enrolled in schools in Crockett, 108 (15.8%) attend a private institution, while the remaining 575 (84.2%) are enrolled in public schools. The age group of 3 to 4 year olds has the highest likelihood of being enrolled in private schools, with 12 (100.0% in the age bracket) enrolled. Conversely, the age group of 18 to 19 year olds has the lowest likelihood of being enrolled in a private school, with 9 (100.0% in the age bracket) attending a public institution.
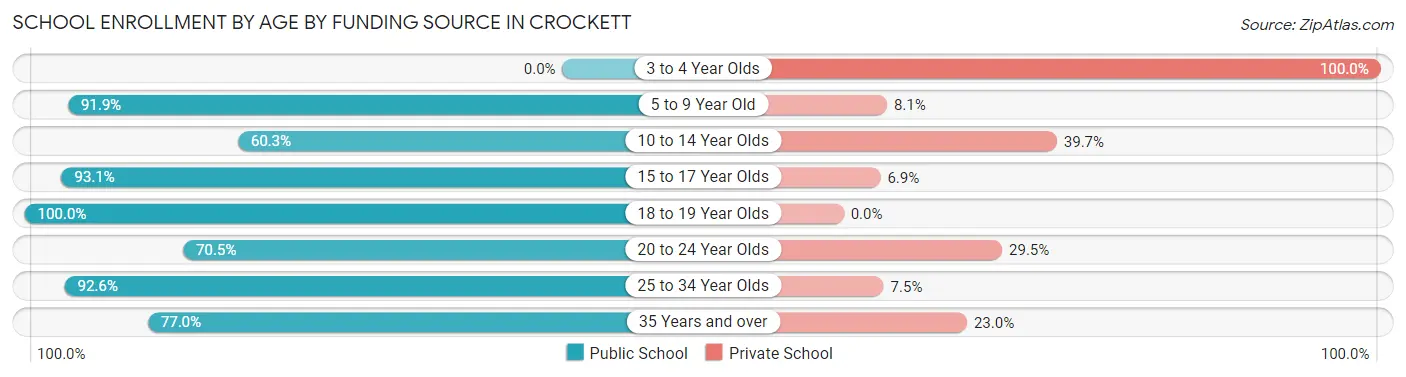
| Age Bracket | Public School | Private School |
| 3 to 4 Year Olds | 0 (0.0%) | 12 (100.0%) |
| 5 to 9 Year Old | 148 (91.9%) | 13 (8.1%) |
| 10 to 14 Year Olds | 41 (60.3%) | 27 (39.7%) |
| 15 to 17 Year Olds | 190 (93.1%) | 14 (6.9%) |
| 18 to 19 Year Olds | 9 (100.0%) | 0 (0.0%) |
| 20 to 24 Year Olds | 43 (70.5%) | 18 (29.5%) |
| 25 to 34 Year Olds | 87 (92.5%) | 7 (7.4%) |
| 35 Years and over | 57 (77.0%) | 17 (23.0%) |
| Total | 575 (84.2%) | 108 (15.8%) |
Educational Attainment by Field of Study in Crockett
Business (189 | 16.0%), liberal arts & history (159 | 13.4%), education (145 | 12.2%), social sciences (132 | 11.2%), and engineering (114 | 9.6%) are the most common fields of study among 1,184 individuals in Crockett who have obtained a bachelor's degree or higher.
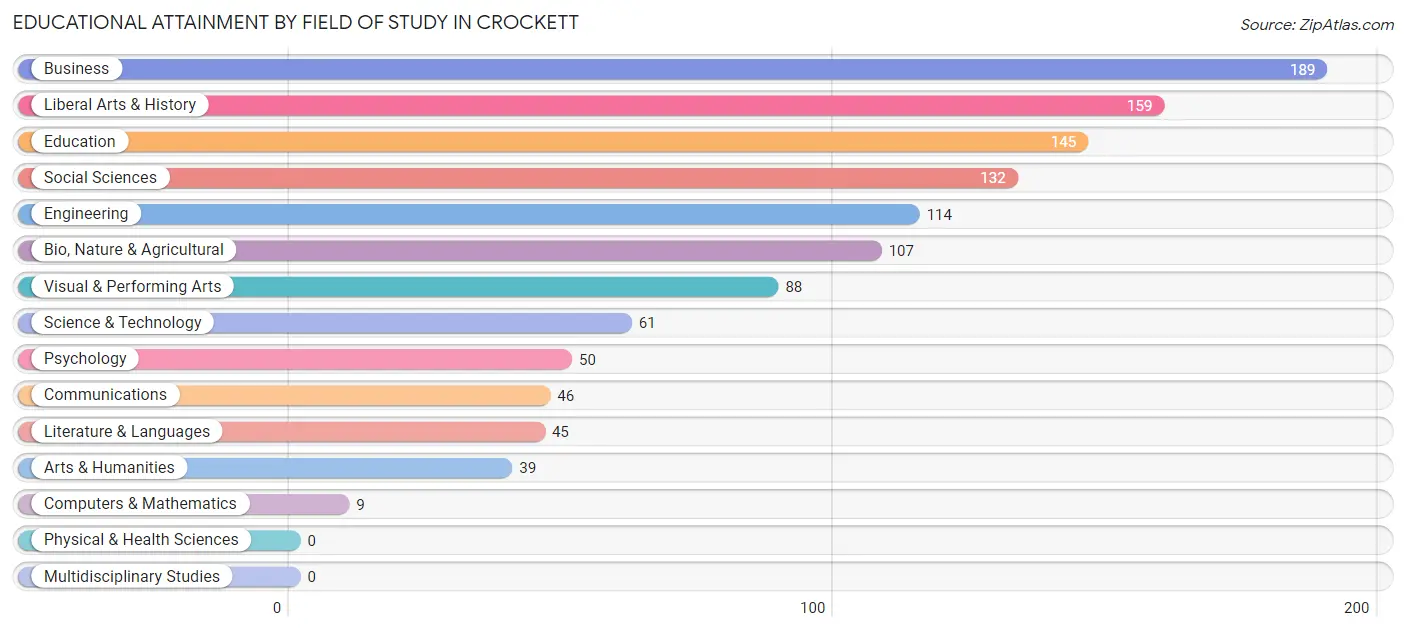
| Field of Study | # Graduates | % Graduates |
| Computers & Mathematics | 9 | 0.8% |
| Bio, Nature & Agricultural | 107 | 9.0% |
| Physical & Health Sciences | 0 | 0.0% |
| Psychology | 50 | 4.2% |
| Social Sciences | 132 | 11.2% |
| Engineering | 114 | 9.6% |
| Multidisciplinary Studies | 0 | 0.0% |
| Science & Technology | 61 | 5.1% |
| Business | 189 | 16.0% |
| Education | 145 | 12.2% |
| Literature & Languages | 45 | 3.8% |
| Liberal Arts & History | 159 | 13.4% |
| Visual & Performing Arts | 88 | 7.4% |
| Communications | 46 | 3.9% |
| Arts & Humanities | 39 | 3.3% |
| Total | 1,184 | 100.0% |
Transportation & Commute in Crockett
Vehicle Availability by Sex in Crockett
The most prevalent vehicle ownership categories in Crockett are males with 2 vehicles (421, accounting for 45.4%) and females with 2 vehicles (275, making up 43.1%).
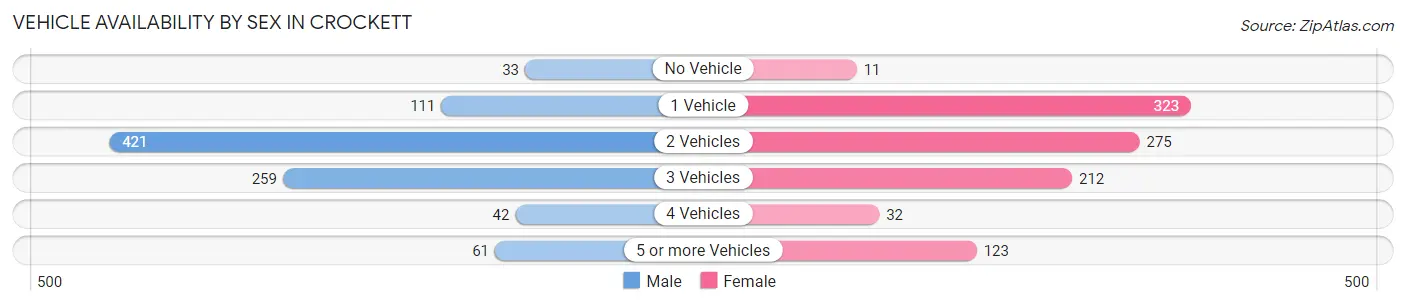
| Vehicles Available | Male | Female |
| No Vehicle | 33 (3.6%) | 11 (1.1%) |
| 1 Vehicle | 111 (12.0%) | 323 (33.1%) |
| 2 Vehicles | 421 (45.4%) | 275 (28.2%) |
| 3 Vehicles | 259 (27.9%) | 212 (21.7%) |
| 4 Vehicles | 42 (4.5%) | 32 (3.3%) |
| 5 or more Vehicles | 61 (6.6%) | 123 (12.6%) |
| Total | 927 (100.0%) | 976 (100.0%) |
Commute Time in Crockett
The most frequently occuring commute durations in Crockett are 30 to 34 minutes (278 commuters, 18.2%), 90 or more minutes (229 commuters, 15.0%), and 60 to 89 minutes (202 commuters, 13.2%).
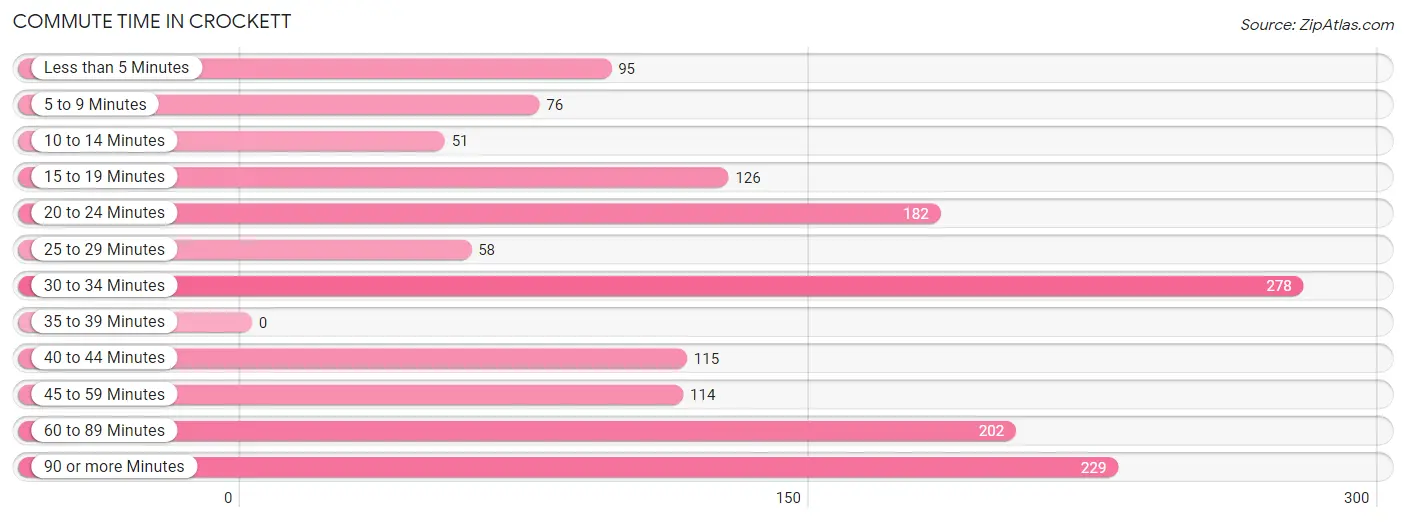
| Commute Time | # Commuters | % Commuters |
| Less than 5 Minutes | 95 | 6.2% |
| 5 to 9 Minutes | 76 | 5.0% |
| 10 to 14 Minutes | 51 | 3.3% |
| 15 to 19 Minutes | 126 | 8.3% |
| 20 to 24 Minutes | 182 | 11.9% |
| 25 to 29 Minutes | 58 | 3.8% |
| 30 to 34 Minutes | 278 | 18.2% |
| 35 to 39 Minutes | 0 | 0.0% |
| 40 to 44 Minutes | 115 | 7.5% |
| 45 to 59 Minutes | 114 | 7.5% |
| 60 to 89 Minutes | 202 | 13.2% |
| 90 or more Minutes | 229 | 15.0% |
Commute Time by Sex in Crockett
The most common commute times in Crockett are 60 to 89 minutes (119 commuters, 16.7%) for males and 90 or more minutes (186 commuters, 22.9%) for females.
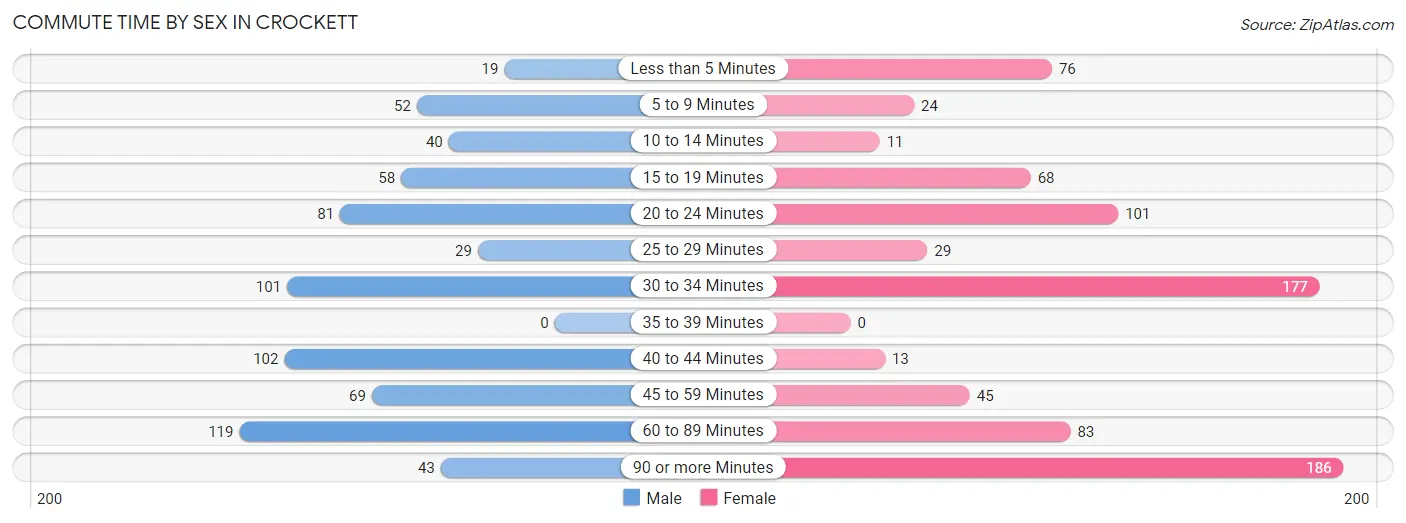
| Commute Time | Male | Female |
| Less than 5 Minutes | 19 (2.7%) | 76 (9.3%) |
| 5 to 9 Minutes | 52 (7.3%) | 24 (2.9%) |
| 10 to 14 Minutes | 40 (5.6%) | 11 (1.3%) |
| 15 to 19 Minutes | 58 (8.1%) | 68 (8.4%) |
| 20 to 24 Minutes | 81 (11.4%) | 101 (12.4%) |
| 25 to 29 Minutes | 29 (4.1%) | 29 (3.6%) |
| 30 to 34 Minutes | 101 (14.2%) | 177 (21.8%) |
| 35 to 39 Minutes | 0 (0.0%) | 0 (0.0%) |
| 40 to 44 Minutes | 102 (14.3%) | 13 (1.6%) |
| 45 to 59 Minutes | 69 (9.7%) | 45 (5.5%) |
| 60 to 89 Minutes | 119 (16.7%) | 83 (10.2%) |
| 90 or more Minutes | 43 (6.0%) | 186 (22.9%) |
Time of Departure to Work by Sex in Crockett
The most frequent times of departure to work in Crockett are 7:00 AM to 7:29 AM (115, 16.1%) for males and 7:30 AM to 7:59 AM (157, 19.3%) for females.
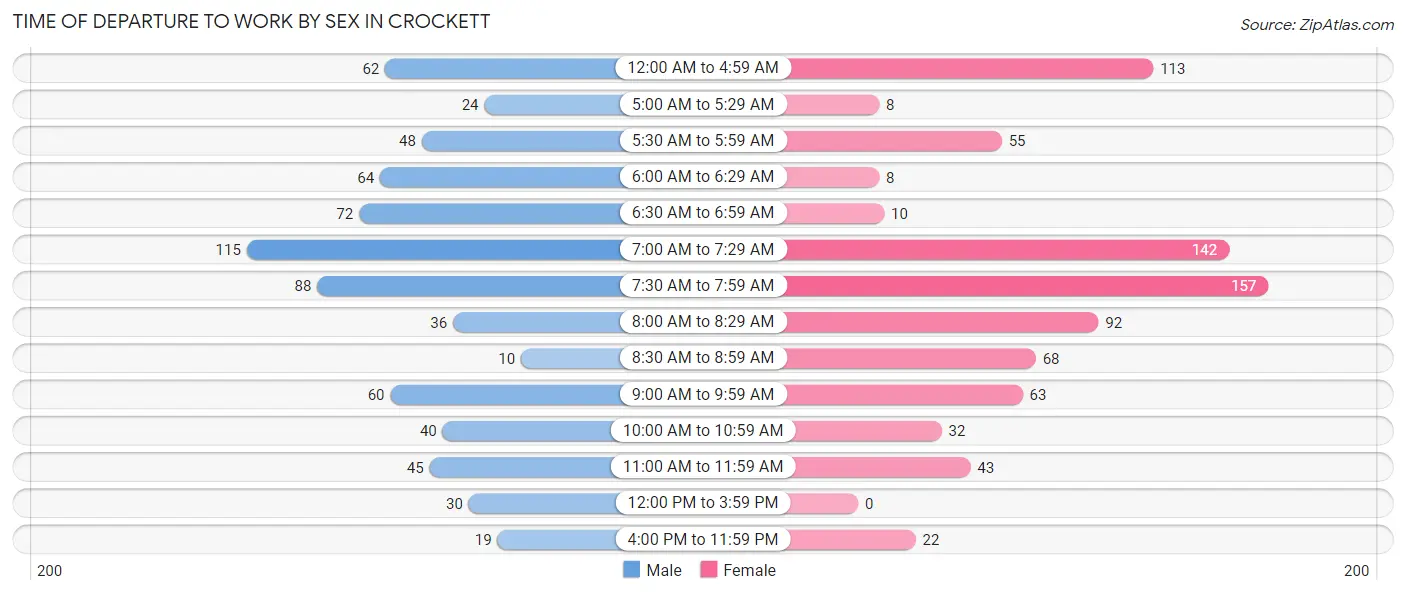
| Time of Departure | Male | Female |
| 12:00 AM to 4:59 AM | 62 (8.7%) | 113 (13.9%) |
| 5:00 AM to 5:29 AM | 24 (3.4%) | 8 (1.0%) |
| 5:30 AM to 5:59 AM | 48 (6.7%) | 55 (6.8%) |
| 6:00 AM to 6:29 AM | 64 (9.0%) | 8 (1.0%) |
| 6:30 AM to 6:59 AM | 72 (10.1%) | 10 (1.2%) |
| 7:00 AM to 7:29 AM | 115 (16.1%) | 142 (17.5%) |
| 7:30 AM to 7:59 AM | 88 (12.3%) | 157 (19.3%) |
| 8:00 AM to 8:29 AM | 36 (5.1%) | 92 (11.3%) |
| 8:30 AM to 8:59 AM | 10 (1.4%) | 68 (8.4%) |
| 9:00 AM to 9:59 AM | 60 (8.4%) | 63 (7.7%) |
| 10:00 AM to 10:59 AM | 40 (5.6%) | 32 (3.9%) |
| 11:00 AM to 11:59 AM | 45 (6.3%) | 43 (5.3%) |
| 12:00 PM to 3:59 PM | 30 (4.2%) | 0 (0.0%) |
| 4:00 PM to 11:59 PM | 19 (2.7%) | 22 (2.7%) |
| Total | 713 (100.0%) | 813 (100.0%) |
Housing Occupancy in Crockett
Occupancy by Ownership in Crockett
Of the total 1,674 dwellings in Crockett, owner-occupied units account for 937 (56.0%), while renter-occupied units make up 737 (44.0%).
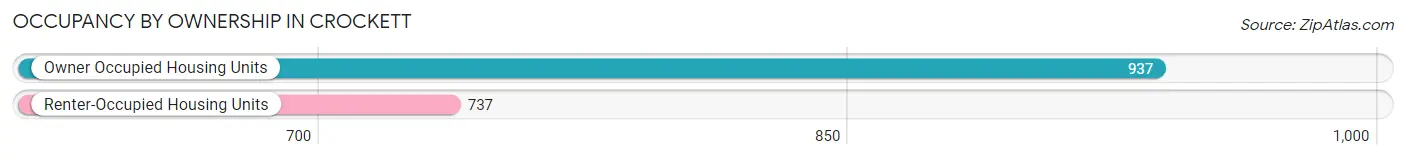
| Occupancy | # Housing Units | % Housing Units |
| Owner Occupied Housing Units | 937 | 56.0% |
| Renter-Occupied Housing Units | 737 | 44.0% |
| Total Occupied Housing Units | 1,674 | 100.0% |
Occupancy by Household Size in Crockett
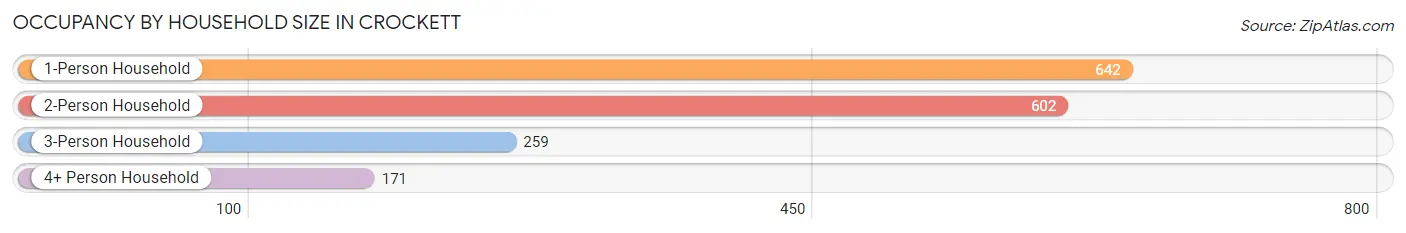
| Household Size | # Housing Units | % Housing Units |
| 1-Person Household | 642 | 38.4% |
| 2-Person Household | 602 | 36.0% |
| 3-Person Household | 259 | 15.5% |
| 4+ Person Household | 171 | 10.2% |
| Total Housing Units | 1,674 | 100.0% |
Occupancy by Ownership by Household Size in Crockett
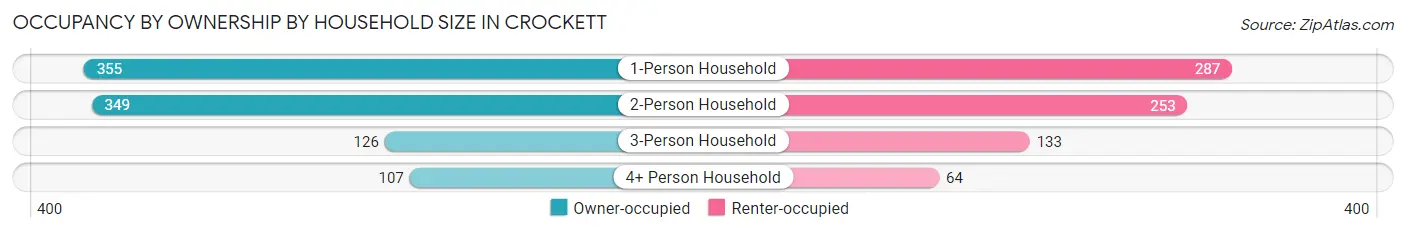
| Household Size | Owner-occupied | Renter-occupied |
| 1-Person Household | 355 (55.3%) | 287 (44.7%) |
| 2-Person Household | 349 (58.0%) | 253 (42.0%) |
| 3-Person Household | 126 (48.6%) | 133 (51.3%) |
| 4+ Person Household | 107 (62.6%) | 64 (37.4%) |
| Total Housing Units | 937 (56.0%) | 737 (44.0%) |
Occupancy by Educational Attainment in Crockett
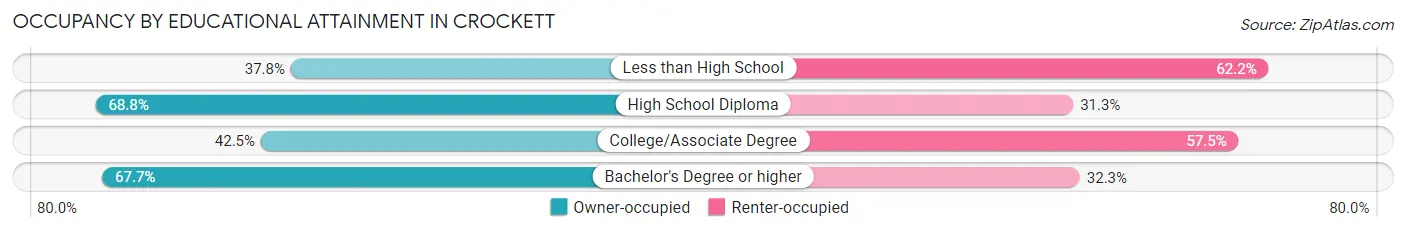
| Household Size | Owner-occupied | Renter-occupied |
| Less than High School | 17 (37.8%) | 28 (62.2%) |
| High School Diploma | 165 (68.8%) | 75 (31.2%) |
| College/Associate Degree | 313 (42.5%) | 423 (57.5%) |
| Bachelor's Degree or higher | 442 (67.7%) | 211 (32.3%) |
Occupancy by Age of Householder in Crockett
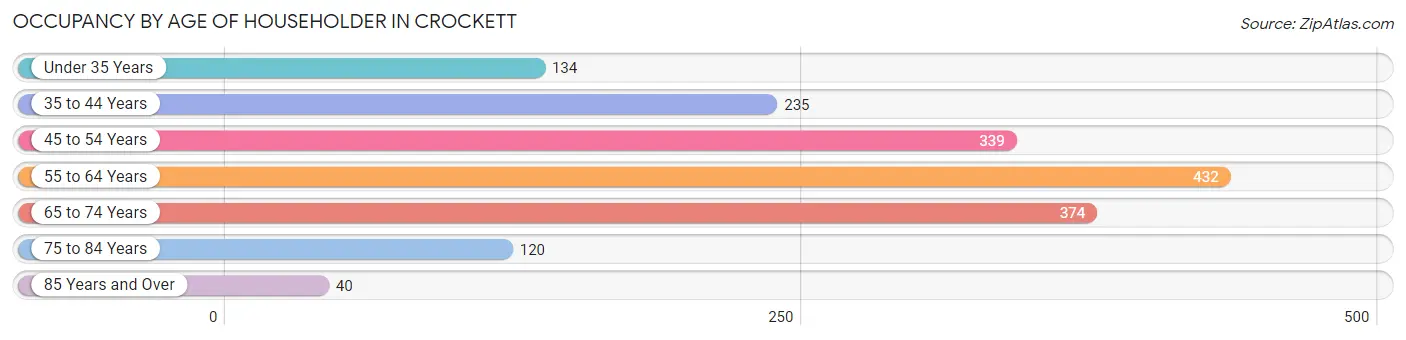
| Age Bracket | # Households | % Households |
| Under 35 Years | 134 | 8.0% |
| 35 to 44 Years | 235 | 14.0% |
| 45 to 54 Years | 339 | 20.3% |
| 55 to 64 Years | 432 | 25.8% |
| 65 to 74 Years | 374 | 22.3% |
| 75 to 84 Years | 120 | 7.2% |
| 85 Years and Over | 40 | 2.4% |
| Total | 1,674 | 100.0% |
Housing Finances in Crockett
Median Income by Occupancy in Crockett
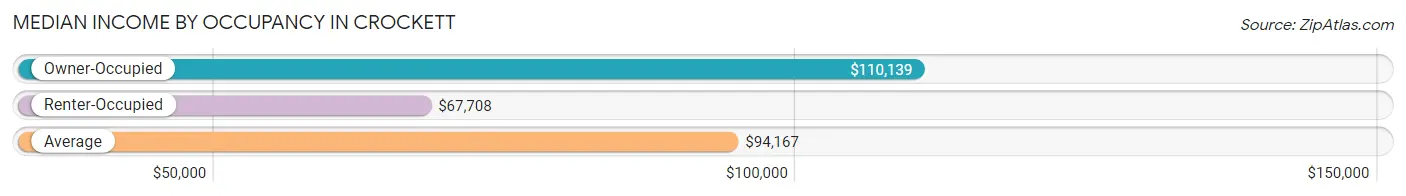
| Occupancy Type | # Households | Median Income |
| Owner-Occupied | 937 (56.0%) | $110,139 |
| Renter-Occupied | 737 (44.0%) | $67,708 |
| Average | 1,674 (100.0%) | $94,167 |
Occupancy by Householder Income Bracket in Crockett
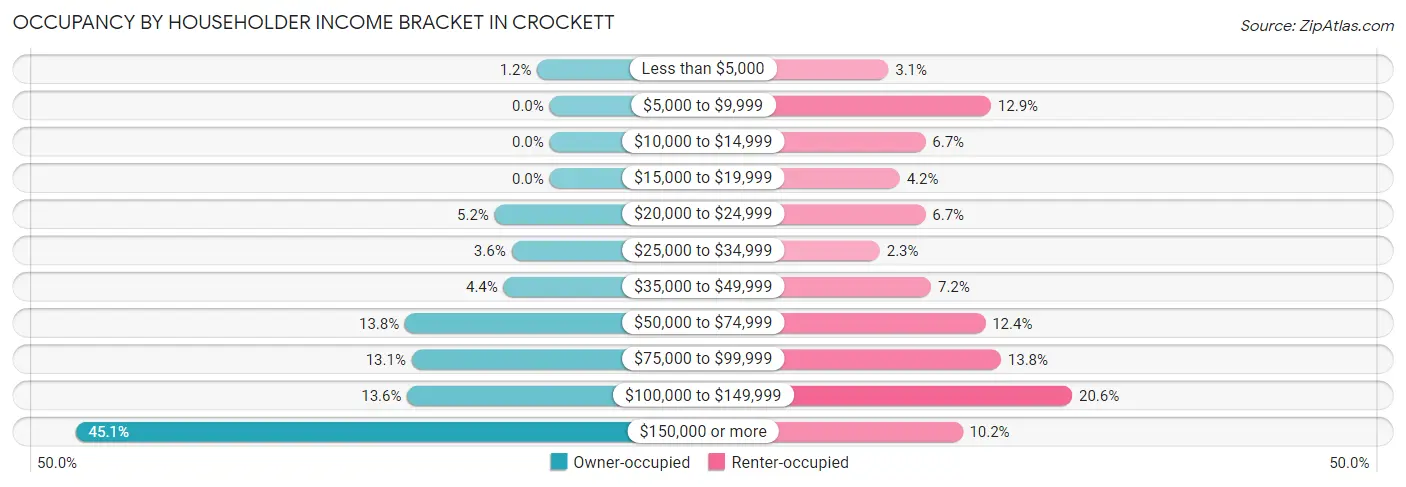
| Income Bracket | Owner-occupied | Renter-occupied |
| Less than $5,000 | 11 (1.2%) | 23 (3.1%) |
| $5,000 to $9,999 | 0 (0.0%) | 95 (12.9%) |
| $10,000 to $14,999 | 0 (0.0%) | 49 (6.7%) |
| $15,000 to $19,999 | 0 (0.0%) | 31 (4.2%) |
| $20,000 to $24,999 | 49 (5.2%) | 49 (6.7%) |
| $25,000 to $34,999 | 34 (3.6%) | 17 (2.3%) |
| $35,000 to $49,999 | 41 (4.4%) | 53 (7.2%) |
| $50,000 to $74,999 | 129 (13.8%) | 91 (12.3%) |
| $75,000 to $99,999 | 123 (13.1%) | 102 (13.8%) |
| $100,000 to $149,999 | 127 (13.6%) | 152 (20.6%) |
| $150,000 or more | 423 (45.1%) | 75 (10.2%) |
| Total | 937 (100.0%) | 737 (100.0%) |
Monthly Housing Cost Tiers in Crockett
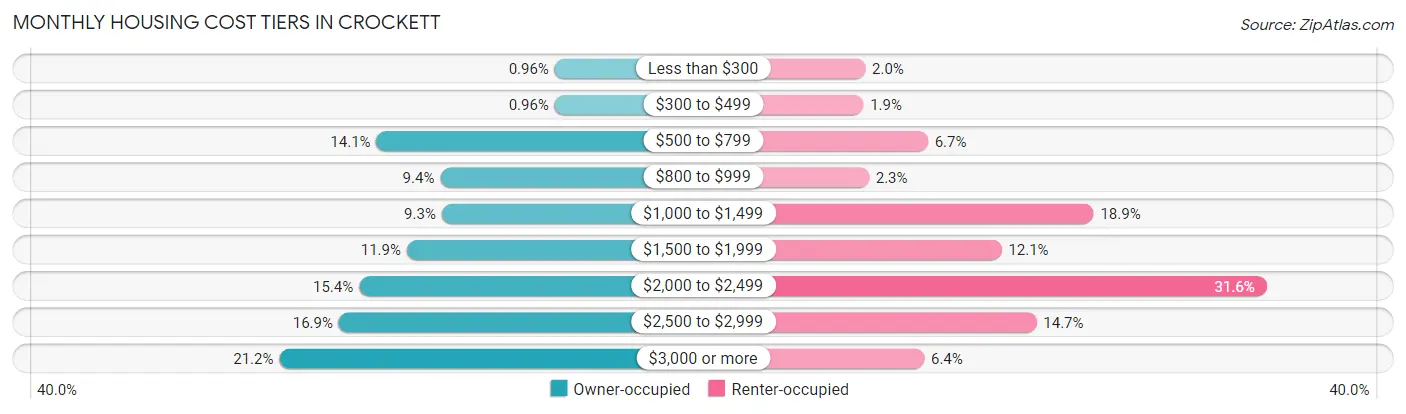
| Monthly Cost | Owner-occupied | Renter-occupied |
| Less than $300 | 9 (1.0%) | 15 (2.0%) |
| $300 to $499 | 9 (1.0%) | 14 (1.9%) |
| $500 to $799 | 132 (14.1%) | 49 (6.7%) |
| $800 to $999 | 88 (9.4%) | 17 (2.3%) |
| $1,000 to $1,499 | 87 (9.3%) | 139 (18.9%) |
| $1,500 to $1,999 | 111 (11.8%) | 89 (12.1%) |
| $2,000 to $2,499 | 144 (15.4%) | 233 (31.6%) |
| $2,500 to $2,999 | 158 (16.9%) | 108 (14.6%) |
| $3,000 or more | 199 (21.2%) | 47 (6.4%) |
| Total | 937 (100.0%) | 737 (100.0%) |
Physical Housing Characteristics in Crockett
Housing Structures in Crockett
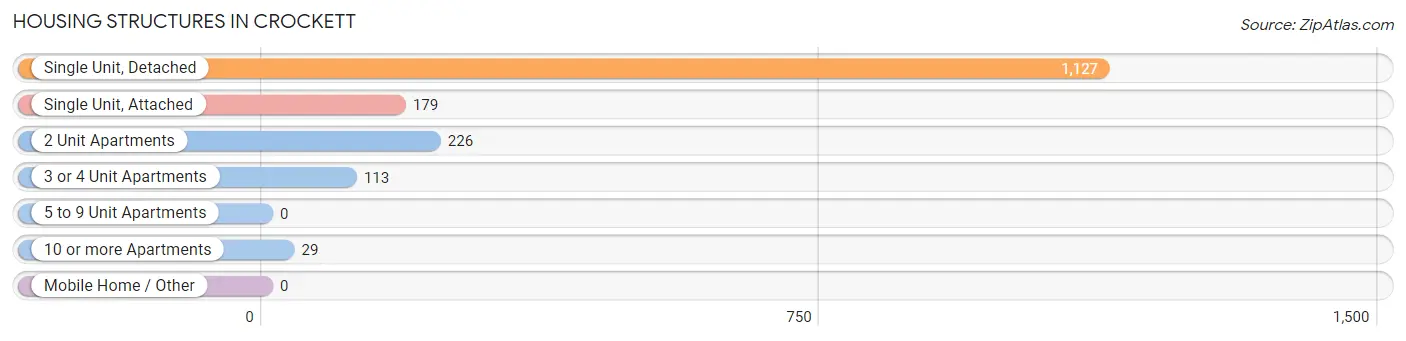
| Structure Type | # Housing Units | % Housing Units |
| Single Unit, Detached | 1,127 | 67.3% |
| Single Unit, Attached | 179 | 10.7% |
| 2 Unit Apartments | 226 | 13.5% |
| 3 or 4 Unit Apartments | 113 | 6.8% |
| 5 to 9 Unit Apartments | 0 | 0.0% |
| 10 or more Apartments | 29 | 1.7% |
| Mobile Home / Other | 0 | 0.0% |
| Total | 1,674 | 100.0% |
Housing Structures by Occupancy in Crockett
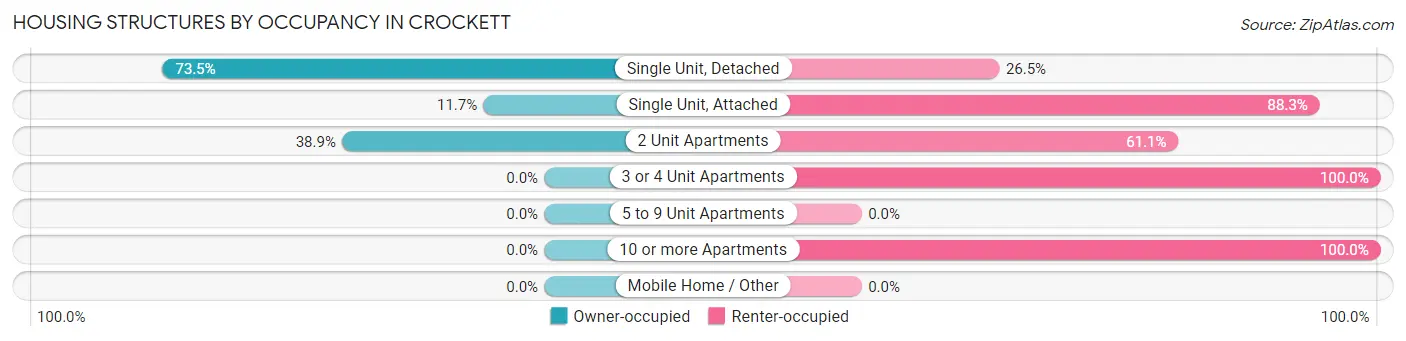
| Structure Type | Owner-occupied | Renter-occupied |
| Single Unit, Detached | 828 (73.5%) | 299 (26.5%) |
| Single Unit, Attached | 21 (11.7%) | 158 (88.3%) |
| 2 Unit Apartments | 88 (38.9%) | 138 (61.1%) |
| 3 or 4 Unit Apartments | 0 (0.0%) | 113 (100.0%) |
| 5 to 9 Unit Apartments | 0 (0.0%) | 0 (0.0%) |
| 10 or more Apartments | 0 (0.0%) | 29 (100.0%) |
| Mobile Home / Other | 0 (0.0%) | 0 (0.0%) |
| Total | 937 (56.0%) | 737 (44.0%) |
Housing Structures by Number of Rooms in Crockett
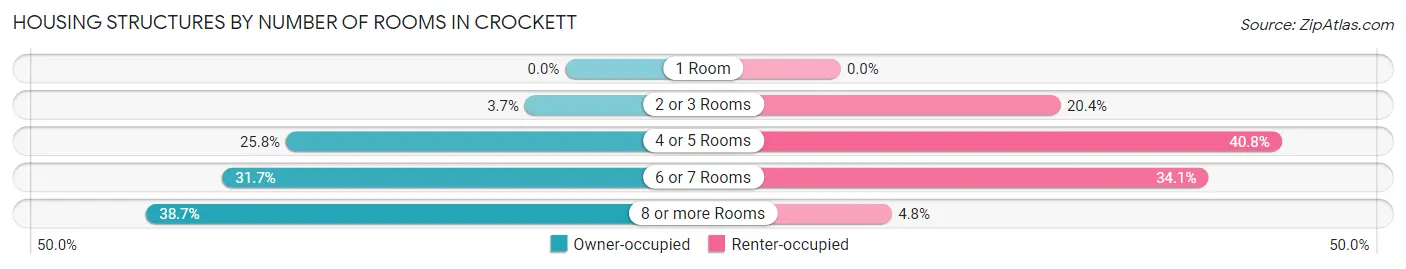
| Number of Rooms | Owner-occupied | Renter-occupied |
| 1 Room | 0 (0.0%) | 0 (0.0%) |
| 2 or 3 Rooms | 35 (3.7%) | 150 (20.3%) |
| 4 or 5 Rooms | 242 (25.8%) | 301 (40.8%) |
| 6 or 7 Rooms | 297 (31.7%) | 251 (34.1%) |
| 8 or more Rooms | 363 (38.7%) | 35 (4.8%) |
| Total | 937 (100.0%) | 737 (100.0%) |
Housing Structure by Heating Type in Crockett
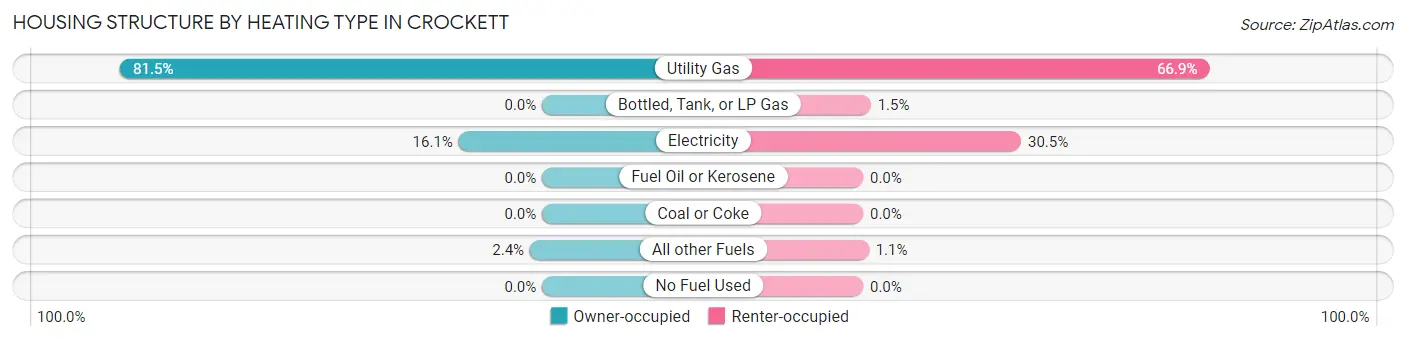
| Heating Type | Owner-occupied | Renter-occupied |
| Utility Gas | 764 (81.5%) | 493 (66.9%) |
| Bottled, Tank, or LP Gas | 0 (0.0%) | 11 (1.5%) |
| Electricity | 151 (16.1%) | 225 (30.5%) |
| Fuel Oil or Kerosene | 0 (0.0%) | 0 (0.0%) |
| Coal or Coke | 0 (0.0%) | 0 (0.0%) |
| All other Fuels | 22 (2.4%) | 8 (1.1%) |
| No Fuel Used | 0 (0.0%) | 0 (0.0%) |
| Total | 937 (100.0%) | 737 (100.0%) |
Household Vehicle Usage in Crockett
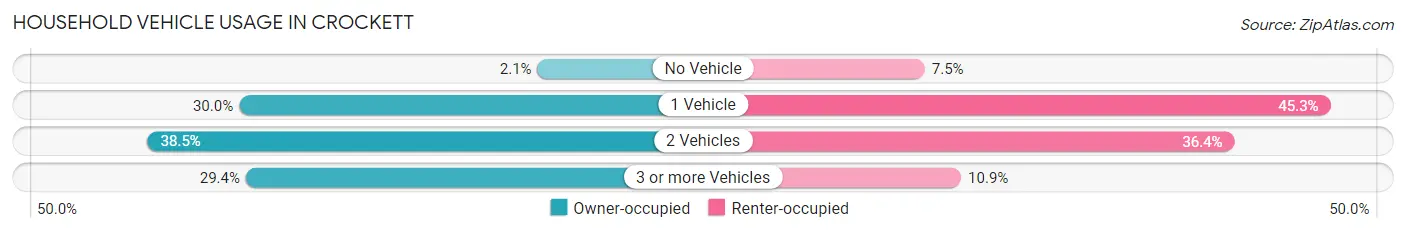
| Vehicles per Household | Owner-occupied | Renter-occupied |
| No Vehicle | 20 (2.1%) | 55 (7.5%) |
| 1 Vehicle | 281 (30.0%) | 334 (45.3%) |
| 2 Vehicles | 361 (38.5%) | 268 (36.4%) |
| 3 or more Vehicles | 275 (29.3%) | 80 (10.8%) |
| Total | 937 (100.0%) | 737 (100.0%) |
Real Estate & Mortgages in Crockett
Real Estate and Mortgage Overview in Crockett
| Characteristic | Without Mortgage | With Mortgage |
| Housing Units | 316 | 621 |
| Median Property Value | $789,300 | $681,500 |
| Median Household Income | $102,857 | $341 |
| Monthly Housing Costs | $817 | $199 |
| Real Estate Taxes | $5,814 | $14 |
Property Value by Mortgage Status in Crockett
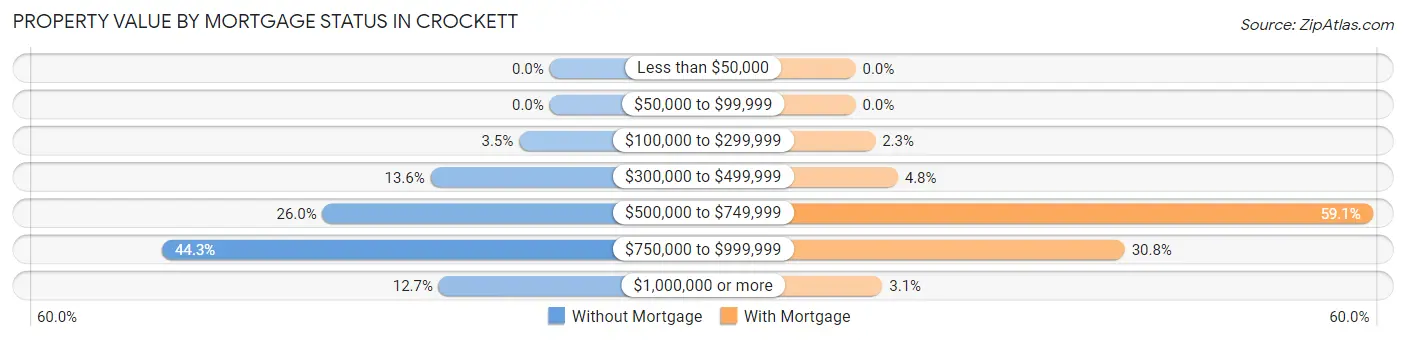
| Property Value | Without Mortgage | With Mortgage |
| Less than $50,000 | 0 (0.0%) | 0 (0.0%) |
| $50,000 to $99,999 | 0 (0.0%) | 0 (0.0%) |
| $100,000 to $299,999 | 11 (3.5%) | 14 (2.2%) |
| $300,000 to $499,999 | 43 (13.6%) | 30 (4.8%) |
| $500,000 to $749,999 | 82 (26.0%) | 367 (59.1%) |
| $750,000 to $999,999 | 140 (44.3%) | 191 (30.8%) |
| $1,000,000 or more | 40 (12.7%) | 19 (3.1%) |
| Total | 316 (100.0%) | 621 (100.0%) |
Household Income by Mortgage Status in Crockett
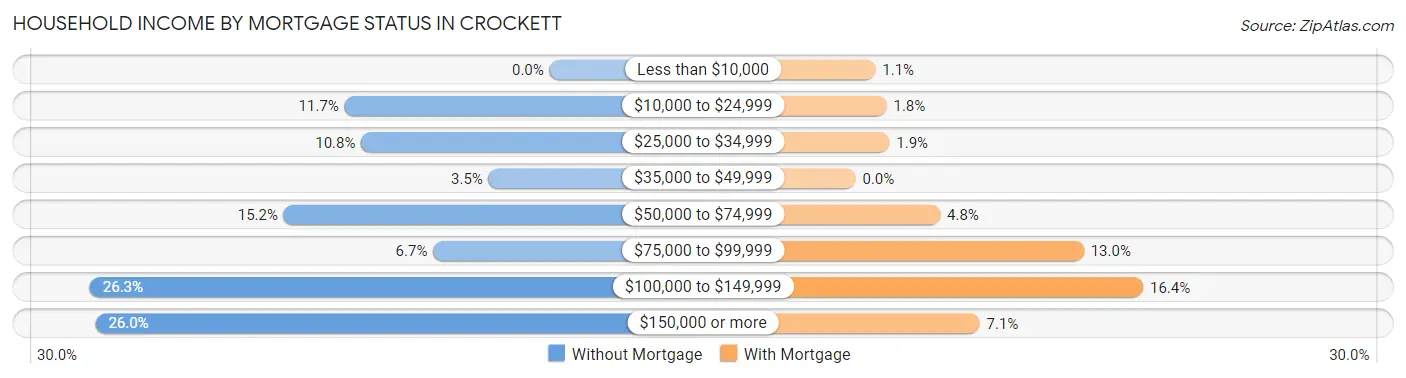
| Household Income | Without Mortgage | With Mortgage |
| Less than $10,000 | 0 (0.0%) | 7 (1.1%) |
| $10,000 to $24,999 | 37 (11.7%) | 11 (1.8%) |
| $25,000 to $34,999 | 34 (10.8%) | 12 (1.9%) |
| $35,000 to $49,999 | 11 (3.5%) | 0 (0.0%) |
| $50,000 to $74,999 | 48 (15.2%) | 30 (4.8%) |
| $75,000 to $99,999 | 21 (6.7%) | 81 (13.0%) |
| $100,000 to $149,999 | 83 (26.3%) | 102 (16.4%) |
| $150,000 or more | 82 (26.0%) | 44 (7.1%) |
| Total | 316 (100.0%) | 621 (100.0%) |
Property Value to Household Income Ratio in Crockett
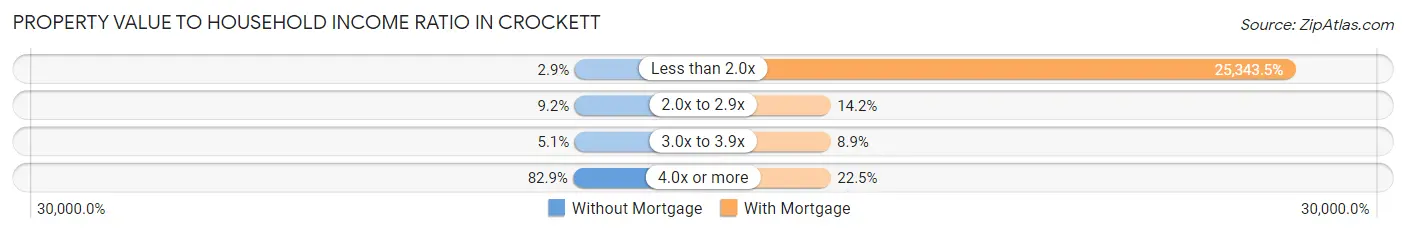
| Value-to-Income Ratio | Without Mortgage | With Mortgage |
| Less than 2.0x | 9 (2.9%) | 157,383 (25,343.5%) |
| 2.0x to 2.9x | 29 (9.2%) | 88 (14.2%) |
| 3.0x to 3.9x | 16 (5.1%) | 55 (8.9%) |
| 4.0x or more | 262 (82.9%) | 140 (22.5%) |
| Total | 316 (100.0%) | 621 (100.0%) |
Real Estate Taxes by Mortgage Status in Crockett
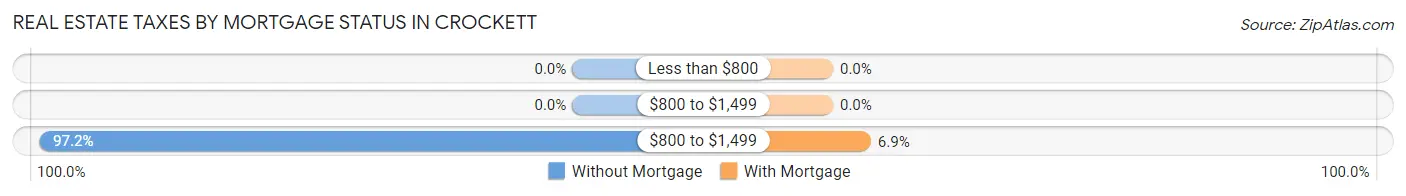
| Property Taxes | Without Mortgage | With Mortgage |
| Less than $800 | 0 (0.0%) | 0 (0.0%) |
| $800 to $1,499 | 0 (0.0%) | 0 (0.0%) |
| $800 to $1,499 | 307 (97.2%) | 43 (6.9%) |
| Total | 316 (100.0%) | 621 (100.0%) |
Health & Disability in Crockett
Health Insurance Coverage by Age in Crockett
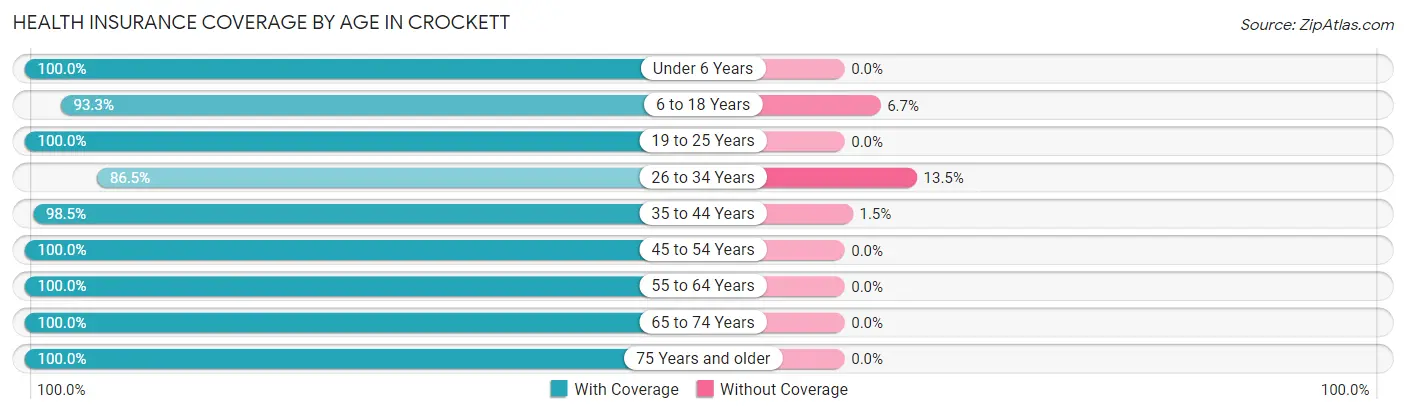
| Age Bracket | With Coverage | Without Coverage |
| Under 6 Years | 104 (100.0%) | 0 (0.0%) |
| 6 to 18 Years | 376 (93.3%) | 27 (6.7%) |
| 19 to 25 Years | 181 (100.0%) | 0 (0.0%) |
| 26 to 34 Years | 308 (86.5%) | 48 (13.5%) |
| 35 to 44 Years | 515 (98.5%) | 8 (1.5%) |
| 45 to 54 Years | 558 (100.0%) | 0 (0.0%) |
| 55 to 64 Years | 752 (100.0%) | 0 (0.0%) |
| 65 to 74 Years | 461 (100.0%) | 0 (0.0%) |
| 75 Years and older | 236 (100.0%) | 0 (0.0%) |
| Total | 3,491 (97.7%) | 83 (2.3%) |
Health Insurance Coverage by Citizenship Status in Crockett
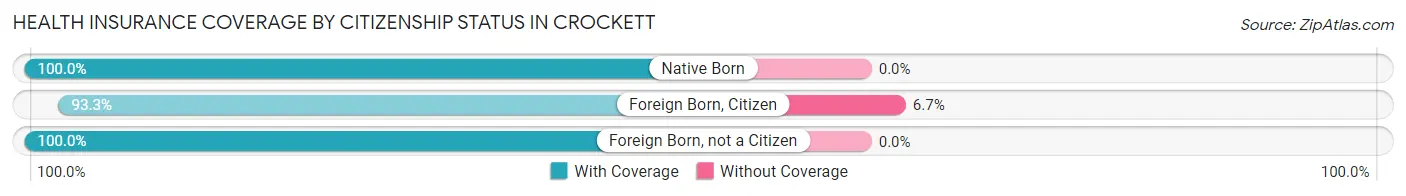
| Citizenship Status | With Coverage | Without Coverage |
| Native Born | 104 (100.0%) | 0 (0.0%) |
| Foreign Born, Citizen | 376 (93.3%) | 27 (6.7%) |
| Foreign Born, not a Citizen | 181 (100.0%) | 0 (0.0%) |
Health Insurance Coverage by Household Income in Crockett
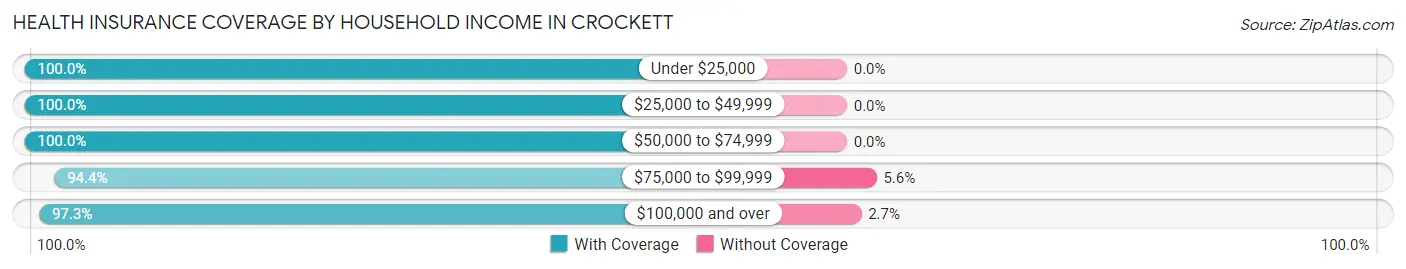
| Household Income | With Coverage | Without Coverage |
| Under $25,000 | 527 (100.0%) | 0 (0.0%) |
| $25,000 to $49,999 | 200 (100.0%) | 0 (0.0%) |
| $50,000 to $74,999 | 347 (100.0%) | 0 (0.0%) |
| $75,000 to $99,999 | 510 (94.4%) | 30 (5.6%) |
| $100,000 and over | 1,907 (97.3%) | 53 (2.7%) |
Public vs Private Health Insurance Coverage by Age in Crockett
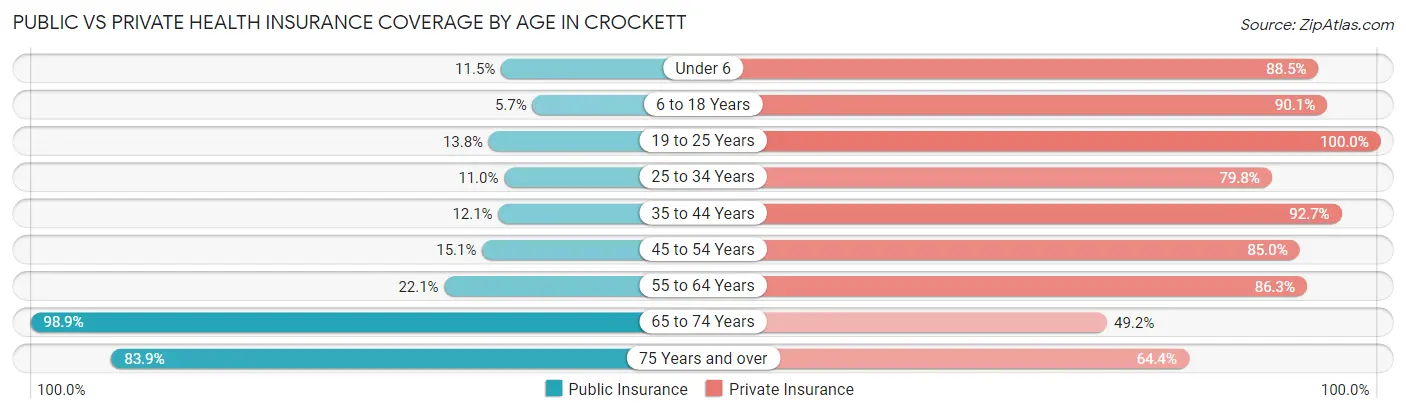
| Age Bracket | Public Insurance | Private Insurance |
| Under 6 | 12 (11.5%) | 92 (88.5%) |
| 6 to 18 Years | 23 (5.7%) | 363 (90.1%) |
| 19 to 25 Years | 25 (13.8%) | 181 (100.0%) |
| 25 to 34 Years | 39 (11.0%) | 284 (79.8%) |
| 35 to 44 Years | 63 (12.0%) | 485 (92.7%) |
| 45 to 54 Years | 84 (15.0%) | 474 (85.0%) |
| 55 to 64 Years | 166 (22.1%) | 649 (86.3%) |
| 65 to 74 Years | 456 (98.9%) | 227 (49.2%) |
| 75 Years and over | 198 (83.9%) | 152 (64.4%) |
| Total | 1,066 (29.8%) | 2,907 (81.3%) |
Disability Status by Sex by Age in Crockett
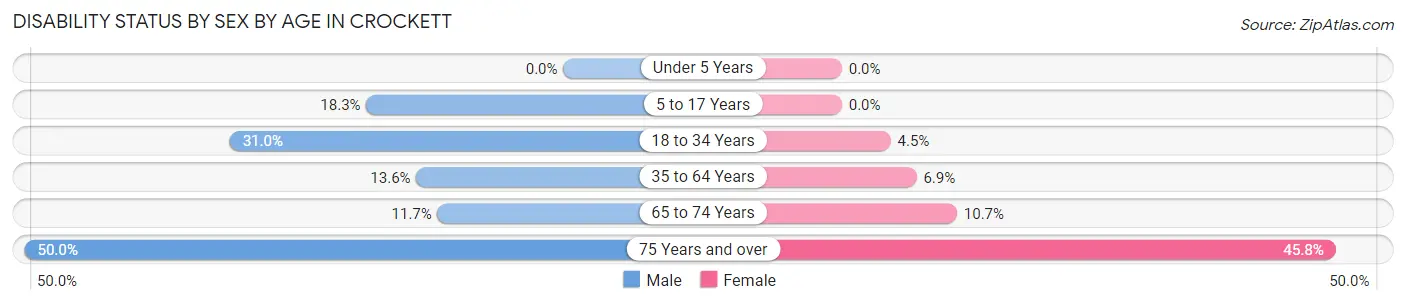
| Age Bracket | Male | Female |
| Under 5 Years | 0 (0.0%) | 0 (0.0%) |
| 5 to 17 Years | 34 (18.3%) | 0 (0.0%) |
| 18 to 34 Years | 87 (31.0%) | 12 (4.5%) |
| 35 to 64 Years | 120 (13.6%) | 66 (6.9%) |
| 65 to 74 Years | 21 (11.7%) | 30 (10.7%) |
| 75 Years and over | 46 (50.0%) | 66 (45.8%) |
Disability Class by Sex by Age in Crockett
Disability Class: Hearing Difficulty
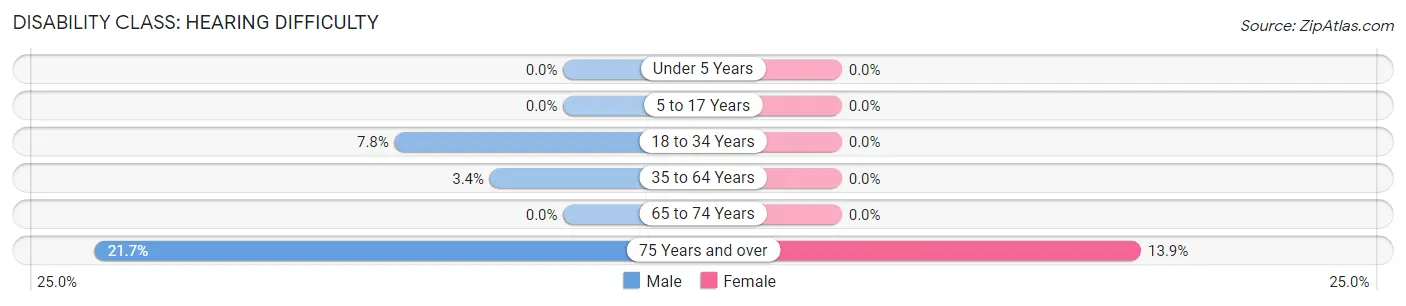
| Age Bracket | Male | Female |
| Under 5 Years | 0 (0.0%) | 0 (0.0%) |
| 5 to 17 Years | 0 (0.0%) | 0 (0.0%) |
| 18 to 34 Years | 22 (7.8%) | 0 (0.0%) |
| 35 to 64 Years | 30 (3.4%) | 0 (0.0%) |
| 65 to 74 Years | 0 (0.0%) | 0 (0.0%) |
| 75 Years and over | 20 (21.7%) | 20 (13.9%) |
Disability Class: Vision Difficulty
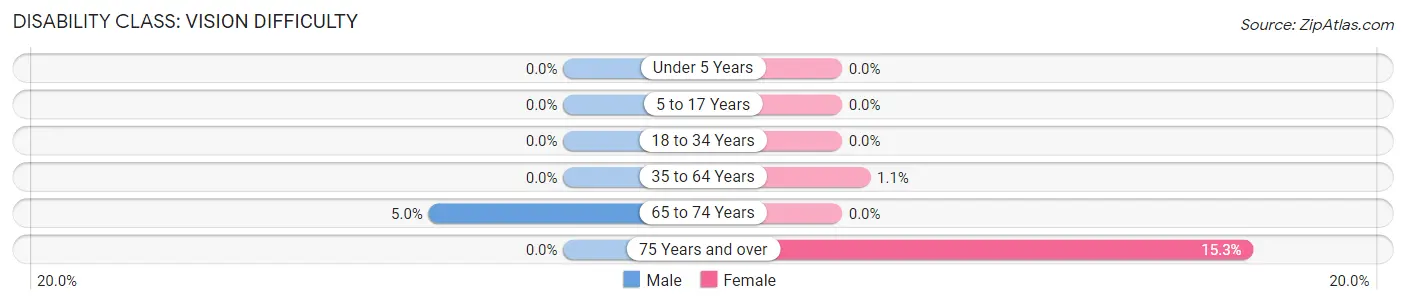
| Age Bracket | Male | Female |
| Under 5 Years | 0 (0.0%) | 0 (0.0%) |
| 5 to 17 Years | 0 (0.0%) | 0 (0.0%) |
| 18 to 34 Years | 0 (0.0%) | 0 (0.0%) |
| 35 to 64 Years | 0 (0.0%) | 10 (1.1%) |
| 65 to 74 Years | 9 (5.0%) | 0 (0.0%) |
| 75 Years and over | 0 (0.0%) | 22 (15.3%) |
Disability Class: Cognitive Difficulty
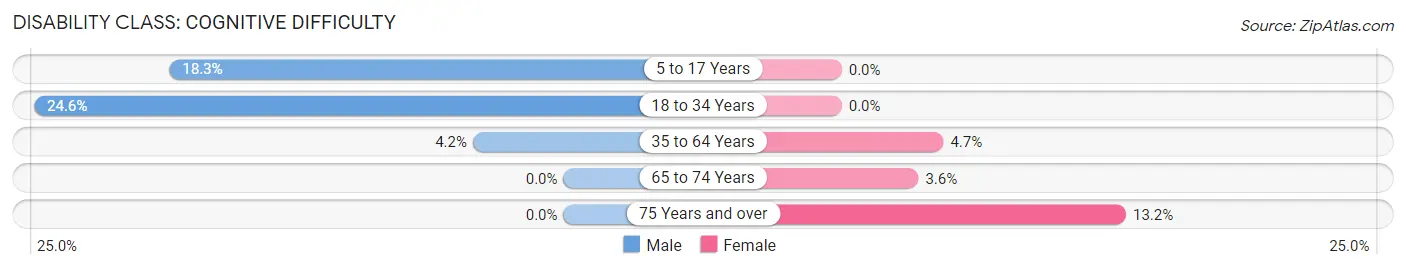
| Age Bracket | Male | Female |
| 5 to 17 Years | 34 (18.3%) | 0 (0.0%) |
| 18 to 34 Years | 69 (24.6%) | 0 (0.0%) |
| 35 to 64 Years | 37 (4.2%) | 45 (4.7%) |
| 65 to 74 Years | 0 (0.0%) | 10 (3.6%) |
| 75 Years and over | 0 (0.0%) | 19 (13.2%) |
Disability Class: Ambulatory Difficulty
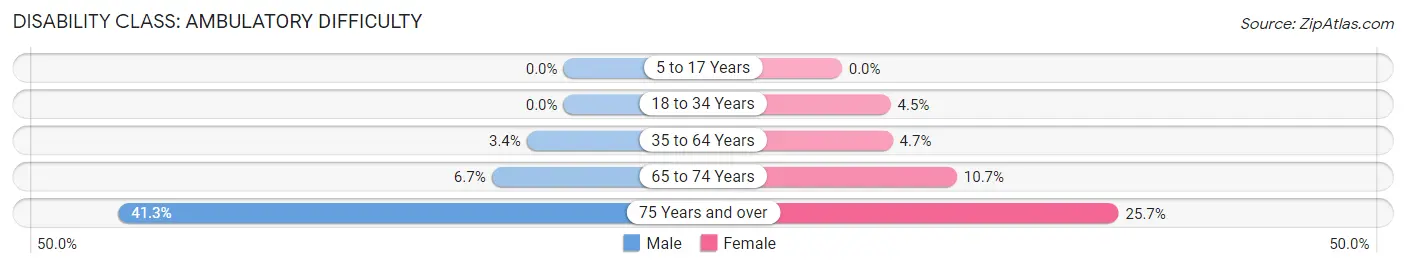
| Age Bracket | Male | Female |
| 5 to 17 Years | 0 (0.0%) | 0 (0.0%) |
| 18 to 34 Years | 0 (0.0%) | 12 (4.5%) |
| 35 to 64 Years | 30 (3.4%) | 45 (4.7%) |
| 65 to 74 Years | 12 (6.7%) | 30 (10.7%) |
| 75 Years and over | 38 (41.3%) | 37 (25.7%) |
Disability Class: Self-Care Difficulty
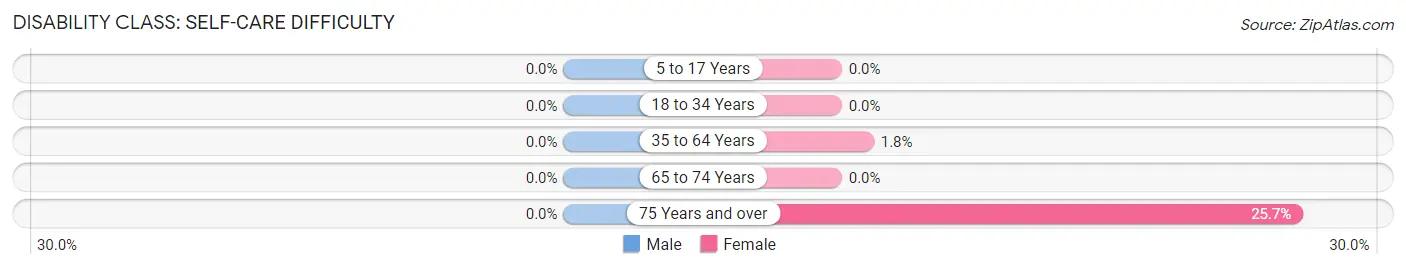
| Age Bracket | Male | Female |
| 5 to 17 Years | 0 (0.0%) | 0 (0.0%) |
| 18 to 34 Years | 0 (0.0%) | 0 (0.0%) |
| 35 to 64 Years | 0 (0.0%) | 17 (1.8%) |
| 65 to 74 Years | 0 (0.0%) | 0 (0.0%) |
| 75 Years and over | 0 (0.0%) | 37 (25.7%) |
Technology Access in Crockett
Computing Device Access in Crockett
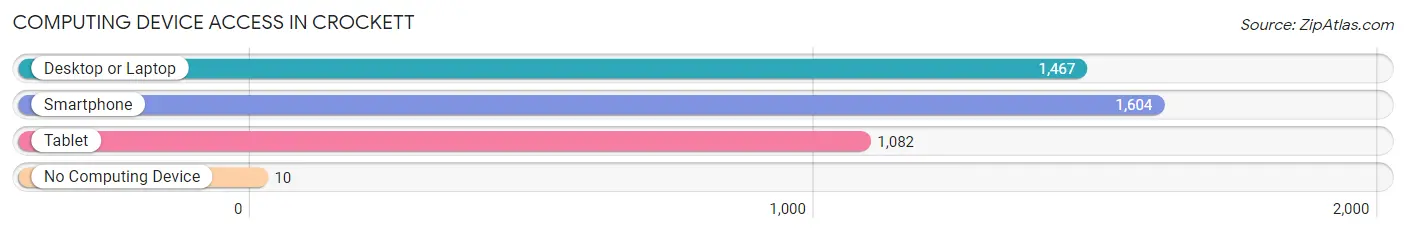
| Device Type | # Households | % Households |
| Desktop or Laptop | 1,467 | 87.6% |
| Smartphone | 1,604 | 95.8% |
| Tablet | 1,082 | 64.6% |
| No Computing Device | 10 | 0.6% |
| Total | 1,674 | 100.0% |
Internet Access in Crockett
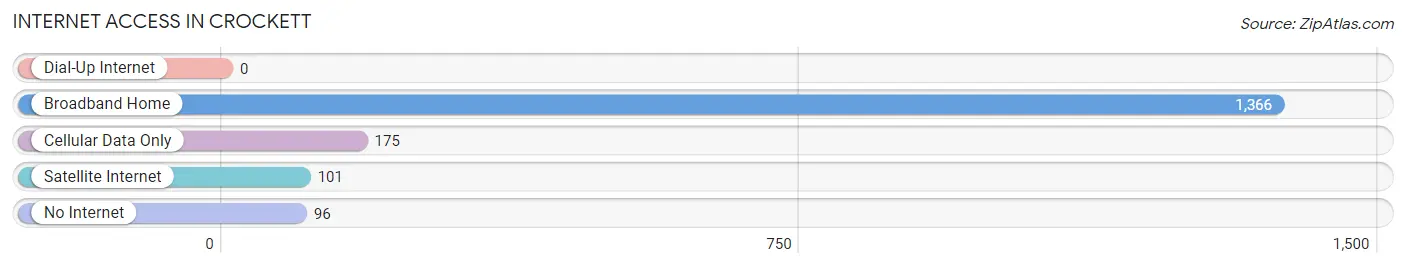
| Internet Type | # Households | % Households |
| Dial-Up Internet | 0 | 0.0% |
| Broadband Home | 1,366 | 81.6% |
| Cellular Data Only | 175 | 10.4% |
| Satellite Internet | 101 | 6.0% |
| No Internet | 96 | 5.7% |
| Total | 1,674 | 100.0% |
Crockett Summary
Crockett is a small city located in Contra Costa County, California, United States. It is situated on the Carquinez Strait, which is part of the San Francisco Bay. The city has a population of about 3,000 people and is part of the larger East Bay region.
History
Crockett was founded in 1892 by Joseph B. Crockett, a former Civil War veteran. He purchased the land from the local Native American tribes and named the area after himself. The city was incorporated in 1911 and has since grown to become a small but vibrant community.
The city was originally a farming and ranching community, but in the early 20th century, it began to develop into an industrial center. The city was home to several large factories, including a sugar refinery, a cannery, and a paper mill. These industries provided jobs for many of the city’s residents.
In the 1950s, the city began to experience a decline in its industrial base. This led to a decrease in population and a shift in the city’s economy. In the late 1970s, the city began to experience a resurgence in its economy, as new businesses began to move into the area.
Geography
Crockett is located in Contra Costa County, California, United States. It is situated on the Carquinez Strait, which is part of the San Francisco Bay. The city has a total area of 1.3 square miles, all of which is land.
The city is located in a valley, surrounded by hills and mountains. The Carquinez Strait is to the east of the city, while the San Pablo Bay is to the west. The city is located near the cities of Vallejo and Martinez.
Economy
Crockett’s economy is largely based on the service industry. The city is home to several restaurants, retail stores, and other businesses. The city is also home to a number of industrial businesses, including a paper mill and a sugar refinery.
The city is also home to a number of small businesses, including a winery, a brewery, and a distillery. The city is also home to a number of art galleries and museums.
Demographics
As of the 2010 census, the population of Crockett was 3,094. The racial makeup of the city was 73.3% White, 11.2% African American, 0.7% Native American, 5.2% Asian, 0.2% Pacific Islander, 5.2% from other races, and 4.2% from two or more races. Hispanic or Latino of any race were 15.2% of the population.
The median income for a household in the city was $50,945, and the median income for a family was $60,945. The per capita income for the city was $25,945. About 11.2% of families and 14.2% of the population were below the poverty line, including 18.2% of those under age 18 and 8.2% of those age 65 or over.
Conclusion
Crockett is a small city located in Contra Costa County, California, United States. It is situated on the Carquinez Strait, which is part of the San Francisco Bay. The city has a population of about 3,000 people and is part of the larger East Bay region. The city’s economy is largely based on the service industry, with a number of restaurants, retail stores, and other businesses. The city is also home to a number of industrial businesses, including a paper mill and a sugar refinery. The racial makeup of the city is 73.3% White, 11.2% African American, 0.7% Native American, 5.2% Asian, 0.2% Pacific Islander, 5.2% from other races, and 4.2% from two or more races. The median income for a household in the city was $50,945, and the median income for a family was $60,945.
Common Questions
What is Per Capita Income in Crockett?
Per Capita income in Crockett is $57,577.
What is the Median Family Income in Crockett?
Median Family Income in Crockett is $116,146.
What is the Median Household income in Crockett?
Median Household Income in Crockett is $94,167.
What is Income or Wage Gap in Crockett?
Income or Wage Gap in Crockett is 25.8%.
Women in Crockett earn 74.2 cents for every dollar earned by a man.
What is Inequality or Gini Index in Crockett?
Inequality or Gini Index in Crockett is 0.47.
What is the Total Population of Crockett?
Total Population of Crockett is 3,574.
What is the Total Male Population of Crockett?
Total Male Population of Crockett is 1,643.
What is the Total Female Population of Crockett?
Total Female Population of Crockett is 1,931.
What is the Ratio of Males per 100 Females in Crockett?
There are 85.09 Males per 100 Females in Crockett.
What is the Ratio of Females per 100 Males in Crockett?
There are 117.53 Females per 100 Males in Crockett.
What is the Median Population Age in Crockett?
Median Population Age in Crockett is 49.3 Years.
What is the Average Family Size in Crockett
Average Family Size in Crockett is 2.8 People.
What is the Average Household Size in Crockett
Average Household Size in Crockett is 2.1 People.
How Large is the Labor Force in Crockett?
There are 2,063 People in the Labor Forcein in Crockett.
What is the Percentage of People in the Labor Force in Crockett?
62.9% of People are in the Labor Force in Crockett.
What is the Unemployment Rate in Crockett?
Unemployment Rate in Crockett is 7.7%.