Crestline, CA Map & Demographics
Crestline Map
Crestline Overview
$38,069
PER CAPITA INCOME
$83,472
AVG FAMILY INCOME
$76,022
AVG HOUSEHOLD INCOME
32.2%
WAGE / INCOME GAP [ % ]
67.8¢/ $1
WAGE / INCOME GAP [ $ ]
0.37
INEQUALITY / GINI INDEX
9,335
TOTAL POPULATION
4,486
MALE POPULATION
4,849
FEMALE POPULATION
92.51
MALES / 100 FEMALES
108.09
FEMALES / 100 MALES
44.6
MEDIAN AGE
3.0
AVG FAMILY SIZE
2.5
AVG HOUSEHOLD SIZE
4,581
LABOR FORCE [ PEOPLE ]
59.6%
PERCENT IN LABOR FORCE
5.5%
UNEMPLOYMENT RATE
Crestline Zip Codes
Income in Crestline
Income Overview in Crestline
Per Capita Income in Crestline is $38,069, while median incomes of families and households are $83,472 and $76,022 respectively.
| Characteristic | Number | Measure |
| Per Capita Income | 9,335 | $38,069 |
| Median Family Income | 2,460 | $83,472 |
| Mean Family Income | 2,460 | $98,343 |
| Median Household Income | 3,759 | $76,022 |
| Mean Household Income | 3,759 | $91,391 |
| Income Deficit | 2,460 | $0 |
| Wage / Income Gap (%) | 9,335 | 32.17% |
| Wage / Income Gap ($) | 9,335 | 67.83¢ per $1 |
| Gini / Inequality Index | 9,335 | 0.37 |
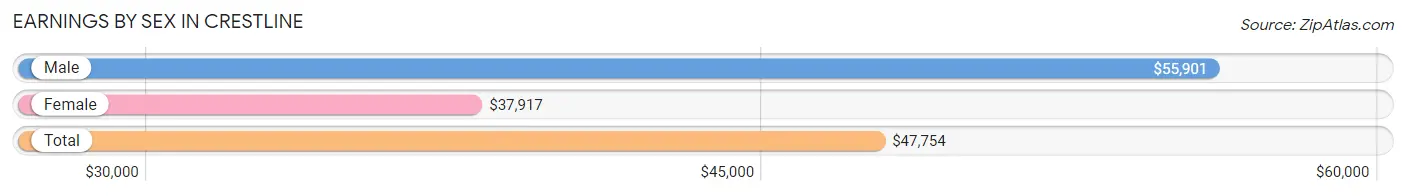
Earnings by Sex in Crestline
Average Earnings in Crestline are $47,754, $55,901 for men and $37,917 for women, a difference of 32.2%.
| Sex | Number | Average Earnings |
| Male | 2,710 (57.6%) | $55,901 |
| Female | 1,999 (42.4%) | $37,917 |
| Total | 4,709 (100.0%) | $47,754 |
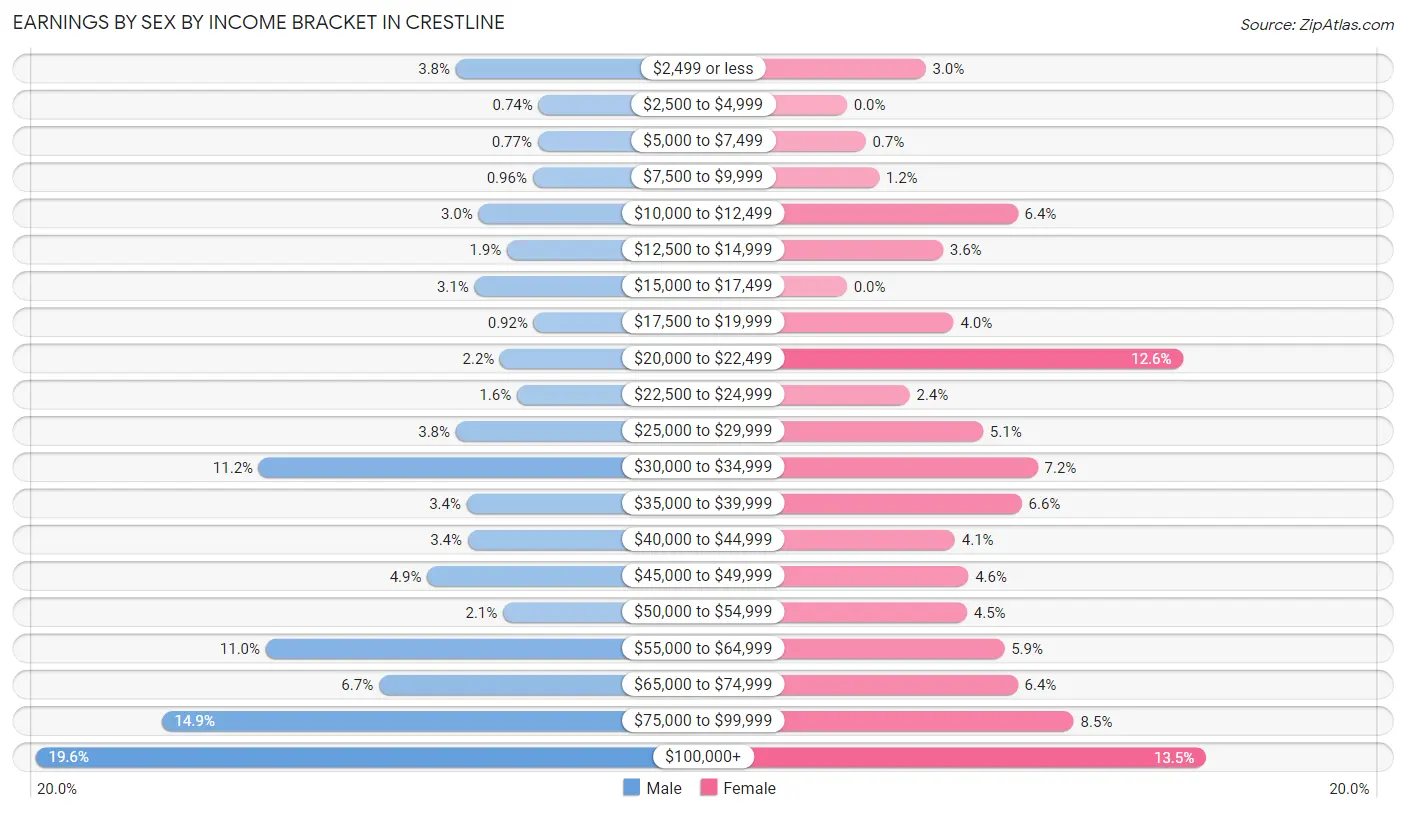
Earnings by Sex by Income Bracket in Crestline
The most common earnings brackets in Crestline are $100,000+ for men (531 | 19.6%) and $100,000+ for women (269 | 13.5%).
| Income | Male | Female |
| $2,499 or less | 104 (3.8%) | 59 (2.9%) |
| $2,500 to $4,999 | 20 (0.7%) | 0 (0.0%) |
| $5,000 to $7,499 | 21 (0.8%) | 14 (0.7%) |
| $7,500 to $9,999 | 26 (1.0%) | 24 (1.2%) |
| $10,000 to $12,499 | 81 (3.0%) | 128 (6.4%) |
| $12,500 to $14,999 | 52 (1.9%) | 72 (3.6%) |
| $15,000 to $17,499 | 85 (3.1%) | 0 (0.0%) |
| $17,500 to $19,999 | 25 (0.9%) | 80 (4.0%) |
| $20,000 to $22,499 | 59 (2.2%) | 252 (12.6%) |
| $22,500 to $24,999 | 42 (1.5%) | 47 (2.4%) |
| $25,000 to $29,999 | 104 (3.8%) | 102 (5.1%) |
| $30,000 to $34,999 | 304 (11.2%) | 143 (7.1%) |
| $35,000 to $39,999 | 93 (3.4%) | 131 (6.6%) |
| $40,000 to $44,999 | 92 (3.4%) | 81 (4.1%) |
| $45,000 to $49,999 | 133 (4.9%) | 91 (4.5%) |
| $50,000 to $54,999 | 56 (2.1%) | 90 (4.5%) |
| $55,000 to $64,999 | 297 (11.0%) | 118 (5.9%) |
| $65,000 to $74,999 | 182 (6.7%) | 128 (6.4%) |
| $75,000 to $99,999 | 403 (14.9%) | 170 (8.5%) |
| $100,000+ | 531 (19.6%) | 269 (13.5%) |
| Total | 2,710 (100.0%) | 1,999 (100.0%) |
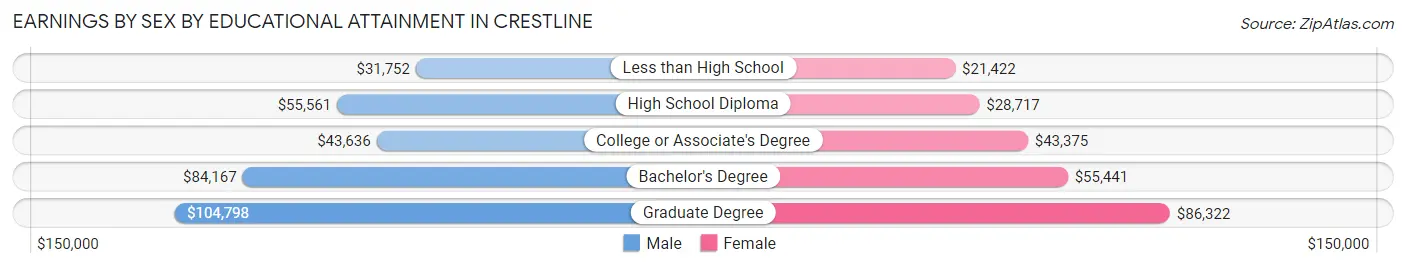
Earnings by Sex by Educational Attainment in Crestline
Average earnings in Crestline are $56,821 for men and $40,098 for women, a difference of 29.4%. Men with an educational attainment of graduate degree enjoy the highest average annual earnings of $104,798, while those with less than high school education earn the least with $31,752. Women with an educational attainment of graduate degree earn the most with the average annual earnings of $86,322, while those with less than high school education have the smallest earnings of $21,422.
| Educational Attainment | Male Income | Female Income |
| Less than High School | $31,752 | $21,422 |
| High School Diploma | $55,561 | $28,717 |
| College or Associate's Degree | $43,636 | $43,375 |
| Bachelor's Degree | $84,167 | $55,441 |
| Graduate Degree | $104,798 | $86,322 |
| Total | $56,821 | $40,098 |
Family Income in Crestline
Family Income Brackets in Crestline
According to the Crestline family income data, there are 531 families falling into the $50,000 to $74,999 income range, which is the most common income bracket and makes up 21.6% of all families. Conversely, the $10,000 to $14,999 income bracket is the least frequent group with only 27 families (1.1%) belonging to this category.
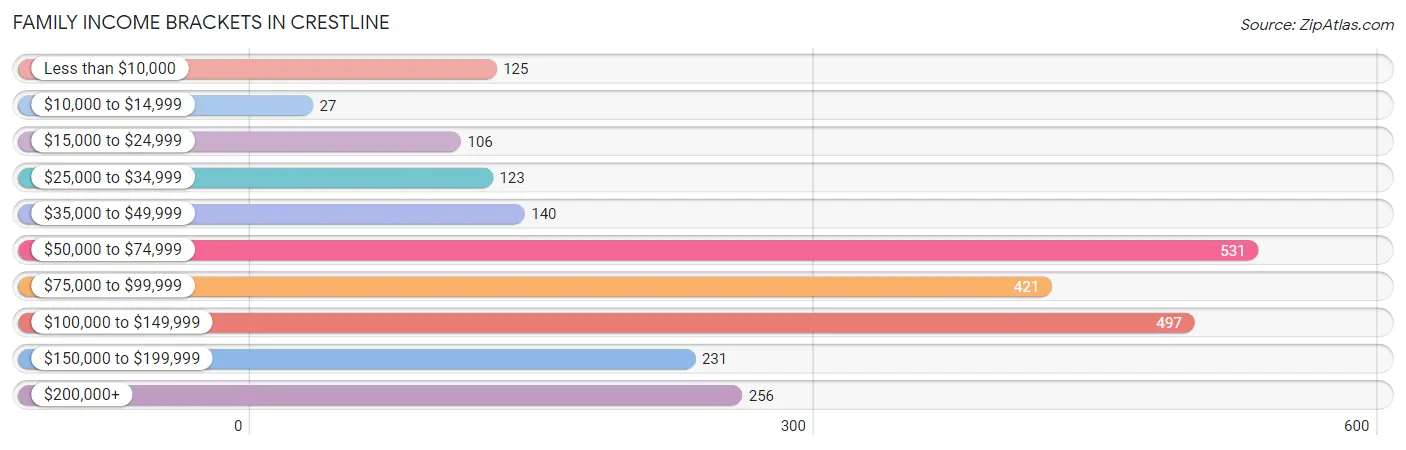
| Income Bracket | # Families | % Families |
| Less than $10,000 | 125 | 5.1% |
| $10,000 to $14,999 | 27 | 1.1% |
| $15,000 to $24,999 | 106 | 4.3% |
| $25,000 to $34,999 | 123 | 5.0% |
| $35,000 to $49,999 | 140 | 5.7% |
| $50,000 to $74,999 | 531 | 21.6% |
| $75,000 to $99,999 | 421 | 17.1% |
| $100,000 to $149,999 | 497 | 20.2% |
| $150,000 to $199,999 | 231 | 9.4% |
| $200,000+ | 256 | 10.4% |
Family Income by Famaliy Size in Crestline
4-person families (227 | 9.2%) account for the highest median family income in Crestline with $122,375 per family, while 2-person families (1,437 | 58.4%) have the highest median income of $41,886 per family member.
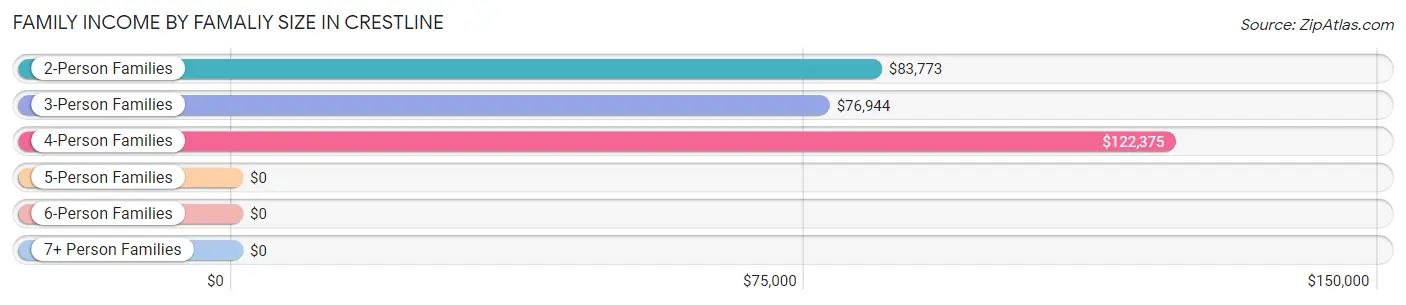
| Income Bracket | # Families | Median Income |
| 2-Person Families | 1,437 (58.4%) | $83,773 |
| 3-Person Families | 452 (18.4%) | $76,944 |
| 4-Person Families | 227 (9.2%) | $122,375 |
| 5-Person Families | 317 (12.9%) | $0 |
| 6-Person Families | 0 (0.0%) | $0 |
| 7+ Person Families | 27 (1.1%) | $0 |
| Total | 2,460 (100.0%) | $83,472 |
Family Income by Number of Earners in Crestline
The median family income in Crestline is $83,472, with families comprising 3+ earners (147) having the highest median family income of $215,134, while families with no earners (477) have the lowest median family income of $37,904, accounting for 6.0% and 19.4% of families, respectively.
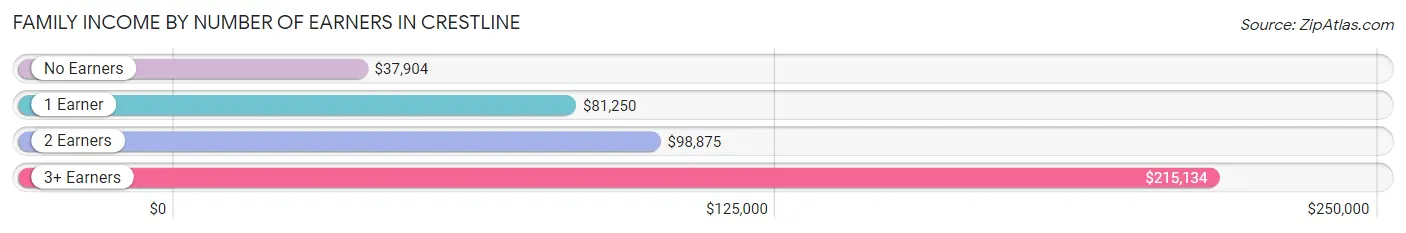
| Number of Earners | # Families | Median Income |
| No Earners | 477 (19.4%) | $37,904 |
| 1 Earner | 986 (40.1%) | $81,250 |
| 2 Earners | 850 (34.5%) | $98,875 |
| 3+ Earners | 147 (6.0%) | $215,134 |
| Total | 2,460 (100.0%) | $83,472 |
Household Income in Crestline
Household Income Brackets in Crestline
With 778 households falling in the category, the $50,000 to $74,999 income range is the most frequent in Crestline, accounting for 20.7% of all households. In contrast, only 109 households (2.9%) fall into the $10,000 to $14,999 income bracket, making it the least populous group.
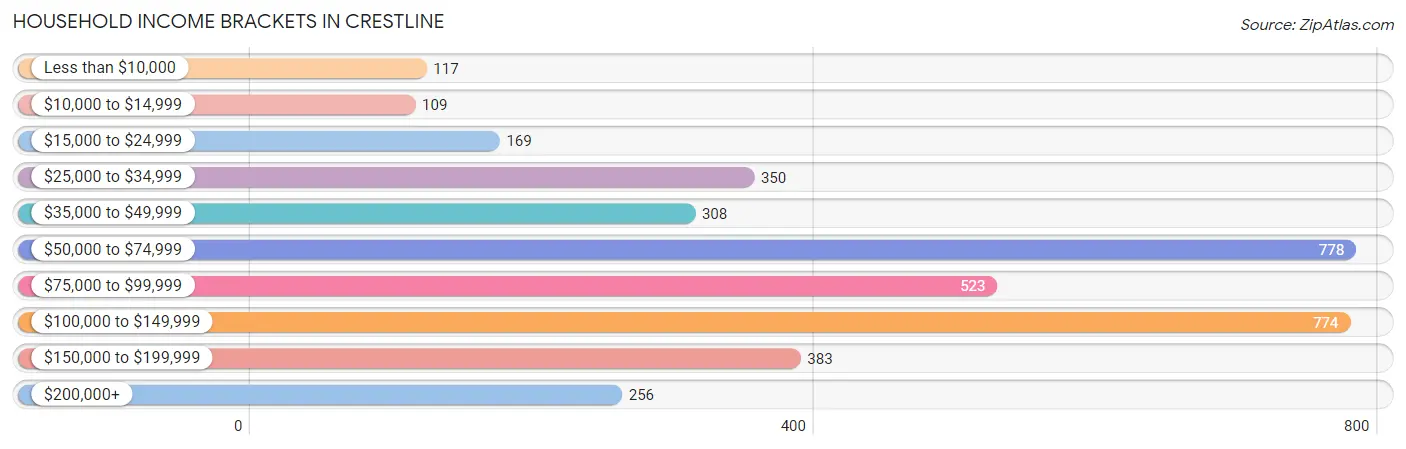
| Income Bracket | # Households | % Households |
| Less than $10,000 | 117 | 3.1% |
| $10,000 to $14,999 | 109 | 2.9% |
| $15,000 to $24,999 | 169 | 4.5% |
| $25,000 to $34,999 | 350 | 9.3% |
| $35,000 to $49,999 | 308 | 8.2% |
| $50,000 to $74,999 | 778 | 20.7% |
| $75,000 to $99,999 | 523 | 13.9% |
| $100,000 to $149,999 | 774 | 20.6% |
| $150,000 to $199,999 | 383 | 10.2% |
| $200,000+ | 256 | 6.8% |
Household Income by Householder Age in Crestline
The median household income in Crestline is $76,022, with the highest median household income of $150,476 found in the 15 to 24 years age bracket for the primary householder. A total of 84 households (2.2%) fall into this category. Meanwhile, the 65+ years age bracket for the primary householder has the lowest median household income of $46,646, with 1,074 households (28.6%) in this group.
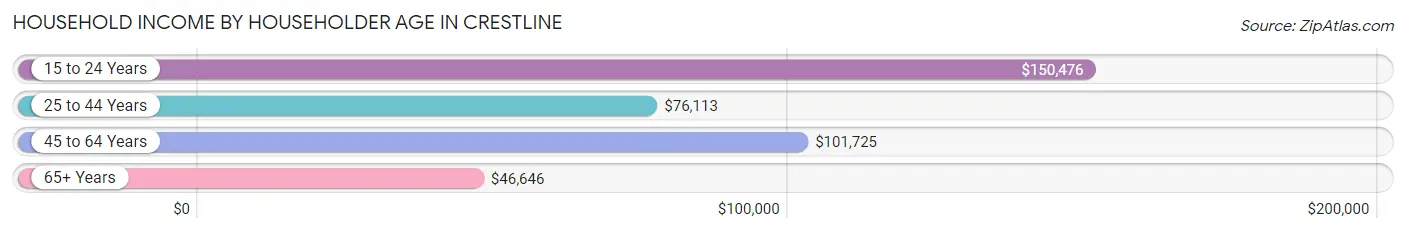
| Income Bracket | # Households | Median Income |
| 15 to 24 Years | 84 (2.2%) | $150,476 |
| 25 to 44 Years | 1,041 (27.7%) | $76,113 |
| 45 to 64 Years | 1,560 (41.5%) | $101,725 |
| 65+ Years | 1,074 (28.6%) | $46,646 |
| Total | 3,759 (100.0%) | $76,022 |
Poverty in Crestline
Income Below Poverty by Sex and Age in Crestline
With 11.7% poverty level for males and 11.4% for females among the residents of Crestline, 5 year old males and under 5 year old females are the most vulnerable to poverty, with 29 males (82.9%) and 76 females (22.4%) in their respective age groups living below the poverty level.
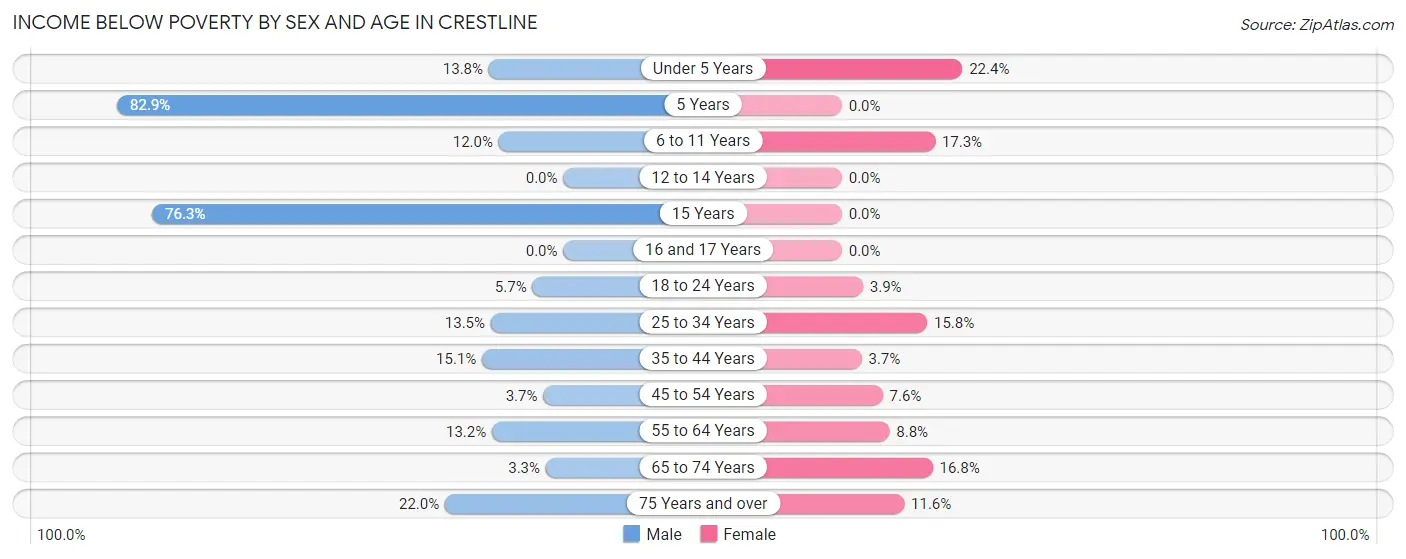
| Age Bracket | Male | Female |
| Under 5 Years | 26 (13.8%) | 76 (22.4%) |
| 5 Years | 29 (82.9%) | 0 (0.0%) |
| 6 to 11 Years | 43 (12.0%) | 51 (17.3%) |
| 12 to 14 Years | 0 (0.0%) | 0 (0.0%) |
| 15 Years | 29 (76.3%) | 0 (0.0%) |
| 16 and 17 Years | 0 (0.0%) | 0 (0.0%) |
| 18 to 24 Years | 18 (5.7%) | 12 (3.9%) |
| 25 to 34 Years | 80 (13.5%) | 111 (15.8%) |
| 35 to 44 Years | 102 (15.1%) | 15 (3.7%) |
| 45 to 54 Years | 18 (3.7%) | 56 (7.6%) |
| 55 to 64 Years | 117 (13.2%) | 59 (8.8%) |
| 65 to 74 Years | 14 (3.3%) | 129 (16.8%) |
| 75 Years and over | 47 (22.0%) | 45 (11.6%) |
| Total | 523 (11.7%) | 554 (11.4%) |
Income Above Poverty by Sex and Age in Crestline
According to the poverty statistics in Crestline, males aged 12 to 14 years and females aged 5 years are the age groups that are most secure financially, with 100.0% of males and 100.0% of females in these age groups living above the poverty line.
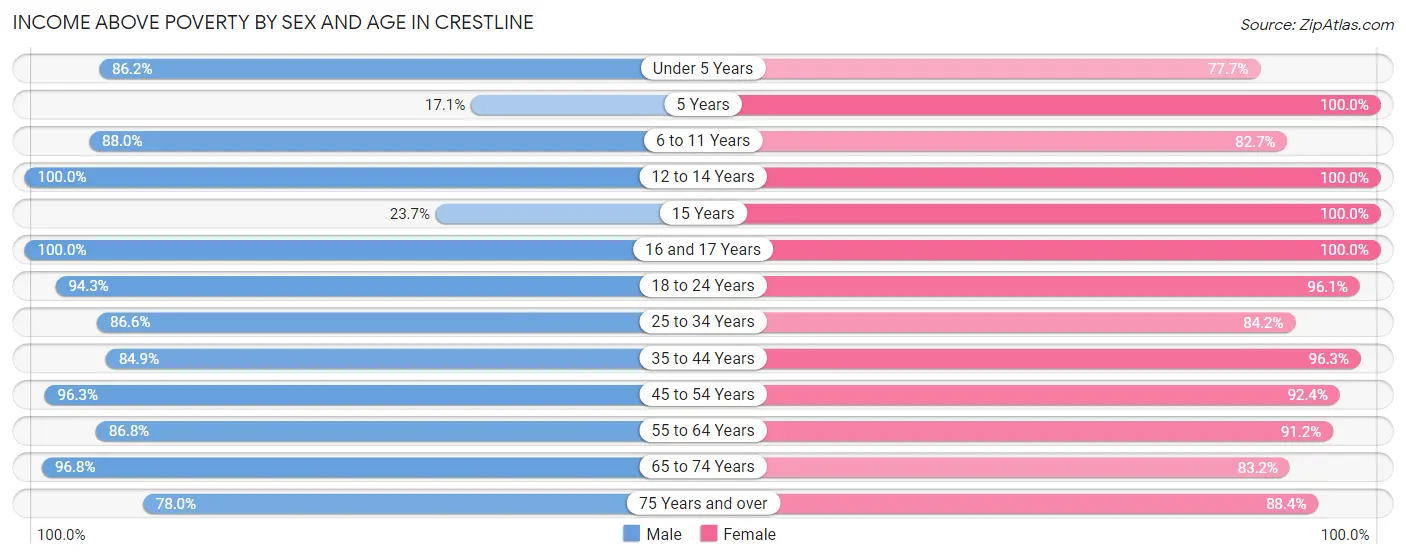
| Age Bracket | Male | Female |
| Under 5 Years | 162 (86.2%) | 264 (77.6%) |
| 5 Years | 6 (17.1%) | 79 (100.0%) |
| 6 to 11 Years | 316 (88.0%) | 244 (82.7%) |
| 12 to 14 Years | 199 (100.0%) | 74 (100.0%) |
| 15 Years | 9 (23.7%) | 39 (100.0%) |
| 16 and 17 Years | 35 (100.0%) | 34 (100.0%) |
| 18 to 24 Years | 296 (94.3%) | 295 (96.1%) |
| 25 to 34 Years | 515 (86.6%) | 590 (84.2%) |
| 35 to 44 Years | 575 (84.9%) | 395 (96.3%) |
| 45 to 54 Years | 466 (96.3%) | 683 (92.4%) |
| 55 to 64 Years | 767 (86.8%) | 609 (91.2%) |
| 65 to 74 Years | 417 (96.8%) | 637 (83.2%) |
| 75 Years and over | 167 (78.0%) | 344 (88.4%) |
| Total | 3,930 (88.3%) | 4,287 (88.6%) |
Income Below Poverty Among Married-Couple Families in Crestline
The poverty statistics for married-couple families in Crestline show that 7.4% or 135 of the total 1,827 families live below the poverty line. Families with 1 or 2 children have the highest poverty rate of 15.0%, comprising of 58 families. On the other hand, families with 3 or 4 children have the lowest poverty rate of 0.0%, which includes 0 families.
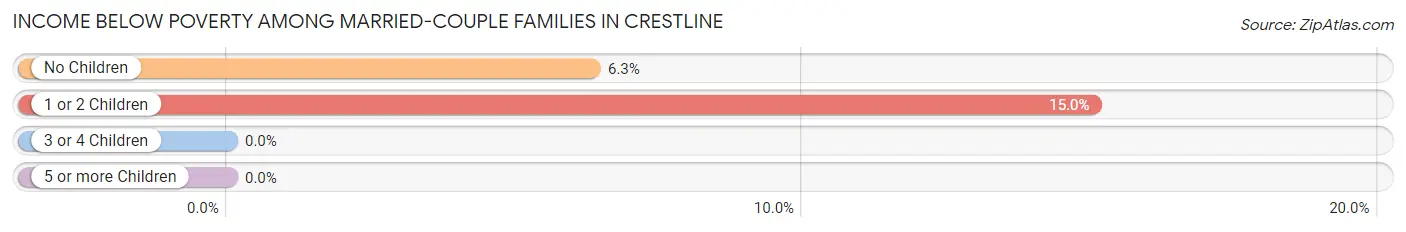
| Children | Above Poverty | Below Poverty |
| No Children | 1,142 (93.7%) | 77 (6.3%) |
| 1 or 2 Children | 328 (85.0%) | 58 (15.0%) |
| 3 or 4 Children | 195 (100.0%) | 0 (0.0%) |
| 5 or more Children | 27 (100.0%) | 0 (0.0%) |
| Total | 1,692 (92.6%) | 135 (7.4%) |
Income Below Poverty Among Single-Parent Households in Crestline
According to the poverty data in Crestline, 15.0% or 27 single-father households and 17.4% or 79 single-mother households are living below the poverty line. Among single-father households, those with 3 or 4 children have the highest poverty rate, with 27 households (100.0%) experiencing poverty. Likewise, among single-mother households, those with 1 or 2 children have the highest poverty rate, with 44 households (38.9%) falling below the poverty line.
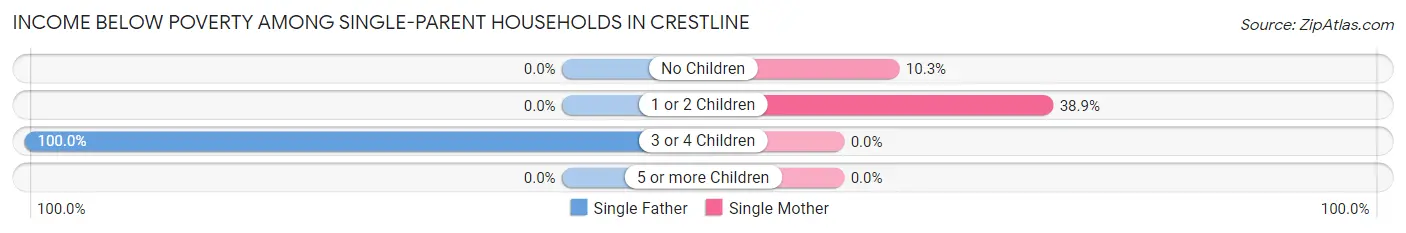
| Children | Single Father | Single Mother |
| No Children | 0 (0.0%) | 35 (10.3%) |
| 1 or 2 Children | 0 (0.0%) | 44 (38.9%) |
| 3 or 4 Children | 27 (100.0%) | 0 (0.0%) |
| 5 or more Children | 0 (0.0%) | 0 (0.0%) |
| Total | 27 (15.0%) | 79 (17.4%) |
Income Below Poverty Among Married-Couple vs Single-Parent Households in Crestline
The poverty data for Crestline shows that 135 of the married-couple family households (7.4%) and 106 of the single-parent households (16.8%) are living below the poverty level. Within the married-couple family households, those with 1 or 2 children have the highest poverty rate, with 58 households (15.0%) falling below the poverty line. Among the single-parent households, those with 3 or 4 children have the highest poverty rate, with 27 household (100.0%) living below poverty.
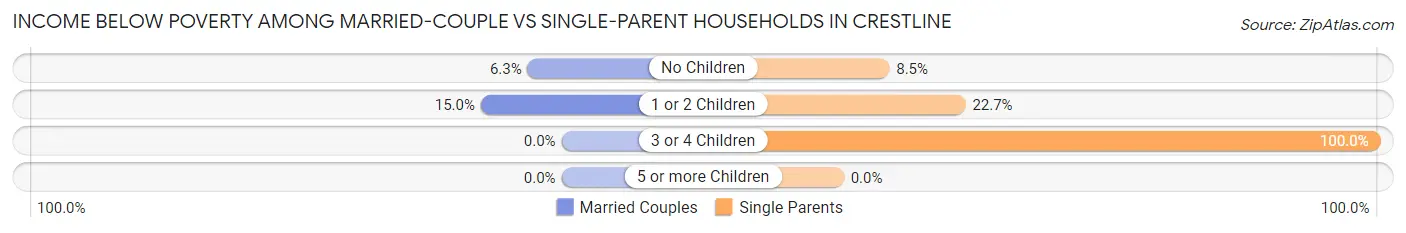
| Children | Married-Couple Families | Single-Parent Households |
| No Children | 77 (6.3%) | 35 (8.5%) |
| 1 or 2 Children | 58 (15.0%) | 44 (22.7%) |
| 3 or 4 Children | 0 (0.0%) | 27 (100.0%) |
| 5 or more Children | 0 (0.0%) | 0 (0.0%) |
| Total | 135 (7.4%) | 106 (16.8%) |
Race in Crestline
The most populous races in Crestline are White / Caucasian (7,227 | 77.4%), Hispanic or Latino (2,034 | 21.8%), and Two or more Races (1,315 | 14.1%).
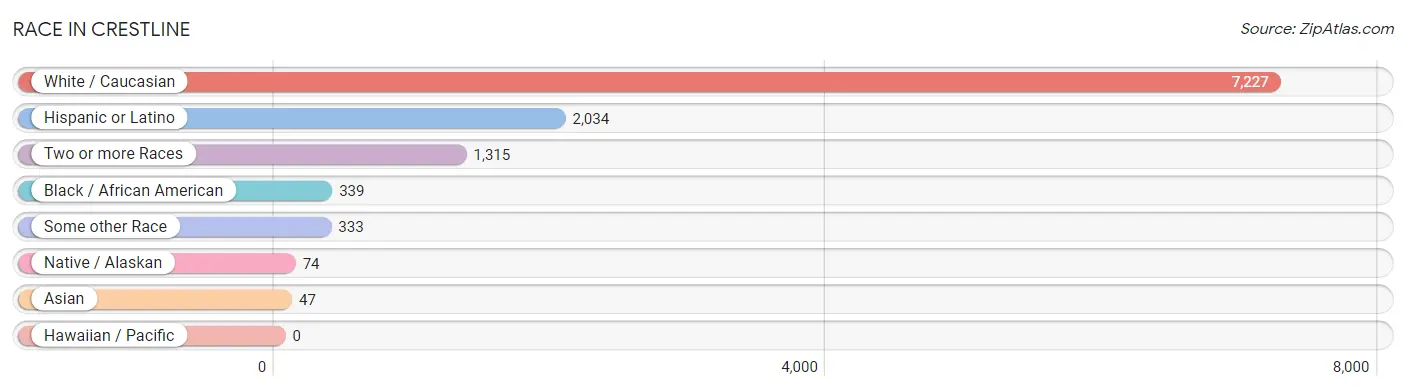
| Race | # Population | % Population |
| Asian | 47 | 0.5% |
| Black / African American | 339 | 3.6% |
| Hawaiian / Pacific | 0 | 0.0% |
| Hispanic or Latino | 2,034 | 21.8% |
| Native / Alaskan | 74 | 0.8% |
| White / Caucasian | 7,227 | 77.4% |
| Two or more Races | 1,315 | 14.1% |
| Some other Race | 333 | 3.6% |
| Total | 9,335 | 100.0% |
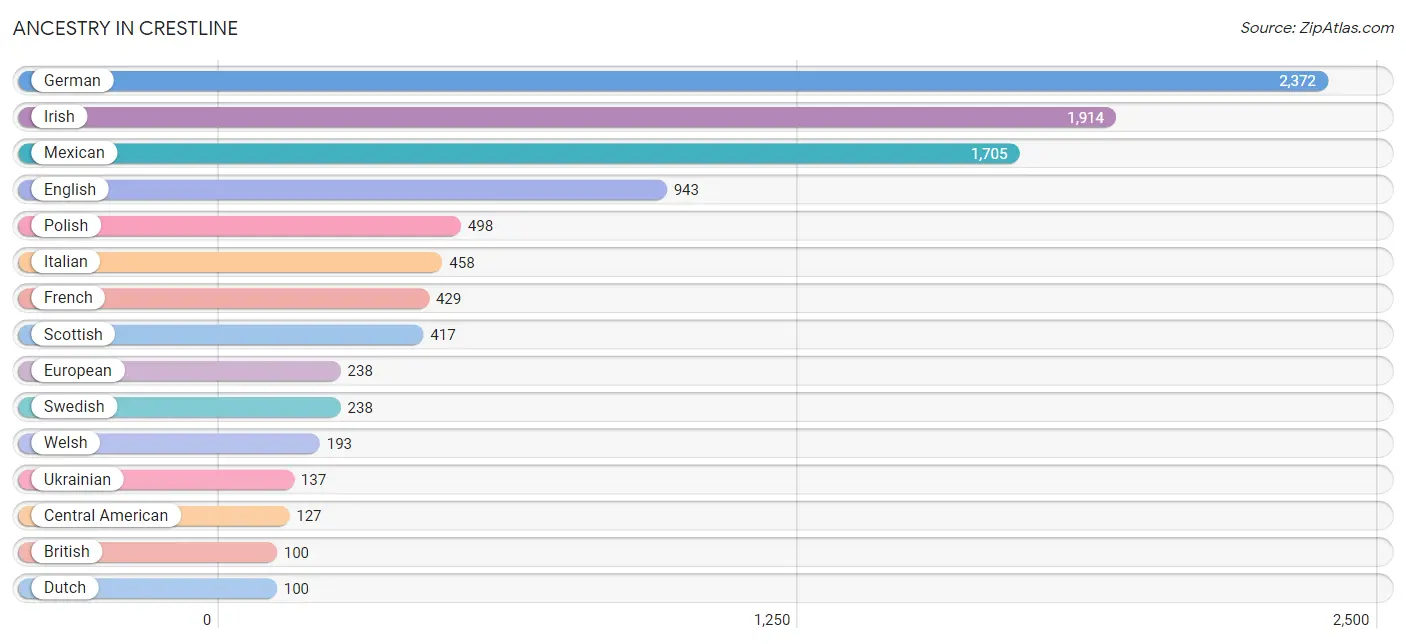
Ancestry in Crestline
The most populous ancestries reported in Crestline are German (2,372 | 25.4%), Irish (1,914 | 20.5%), Mexican (1,705 | 18.3%), English (943 | 10.1%), and Polish (498 | 5.3%), together accounting for 79.6% of all Crestline residents.
| Ancestry | # Population | % Population |
| African | 39 | 0.4% |
| American | 69 | 0.7% |
| Arab | 57 | 0.6% |
| Belgian | 61 | 0.6% |
| Bhutanese | 35 | 0.4% |
| British | 100 | 1.1% |
| Central American | 127 | 1.4% |
| Chippewa | 41 | 0.4% |
| Croatian | 20 | 0.2% |
| Cuban | 65 | 0.7% |
| Czech | 52 | 0.6% |
| Danish | 13 | 0.1% |
| Dutch | 100 | 1.1% |
| English | 943 | 10.1% |
| European | 238 | 2.5% |
| French | 429 | 4.6% |
| French Canadian | 29 | 0.3% |
| German | 2,372 | 25.4% |
| Guatemalan | 95 | 1.0% |
| Hungarian | 33 | 0.4% |
| Irish | 1,914 | 20.5% |
| Italian | 458 | 4.9% |
| Jordanian | 12 | 0.1% |
| Korean | 37 | 0.4% |
| Lebanese | 45 | 0.5% |
| Lithuanian | 55 | 0.6% |
| Malaysian | 13 | 0.1% |
| Mexican | 1,705 | 18.3% |
| Navajo | 23 | 0.3% |
| Nicaraguan | 32 | 0.3% |
| Northern European | 13 | 0.1% |
| Norwegian | 64 | 0.7% |
| Polish | 498 | 5.3% |
| Portuguese | 12 | 0.1% |
| Puerto Rican | 19 | 0.2% |
| Russian | 20 | 0.2% |
| Scandinavian | 87 | 0.9% |
| Scotch-Irish | 17 | 0.2% |
| Scottish | 417 | 4.5% |
| Spaniard | 45 | 0.5% |
| Spanish | 50 | 0.5% |
| Subsaharan African | 39 | 0.4% |
| Swedish | 238 | 2.5% |
| Swiss | 59 | 0.6% |
| Thai | 24 | 0.3% |
| Ukrainian | 137 | 1.5% |
| Welsh | 193 | 2.1% | View All 47 Rows |
Immigrants in Crestline
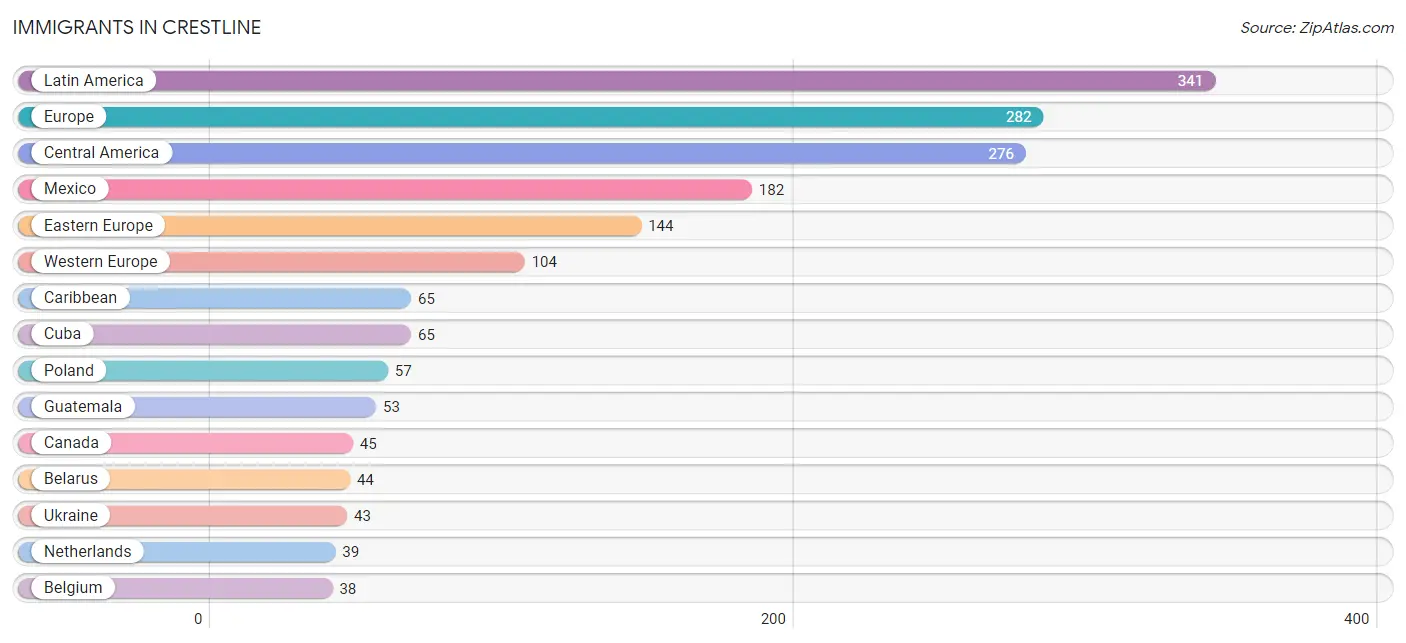
The most numerous immigrant groups reported in Crestline came from Latin America (341 | 3.6%), Europe (282 | 3.0%), Central America (276 | 3.0%), Mexico (182 | 1.9%), and Eastern Europe (144 | 1.5%), together accounting for 13.1% of all Crestline residents.
| Immigration Origin | # Population | % Population |
| Africa | 26 | 0.3% |
| Asia | 11 | 0.1% |
| Belarus | 44 | 0.5% |
| Belgium | 38 | 0.4% |
| Canada | 45 | 0.5% |
| Caribbean | 65 | 0.7% |
| Central America | 276 | 3.0% |
| Cuba | 65 | 0.7% |
| Eastern Europe | 144 | 1.5% |
| El Salvador | 9 | 0.1% |
| Europe | 282 | 3.0% |
| Germany | 27 | 0.3% |
| Guatemala | 53 | 0.6% |
| Italy | 18 | 0.2% |
| Latin America | 341 | 3.6% |
| Mexico | 182 | 1.9% |
| Netherlands | 39 | 0.4% |
| Nicaragua | 32 | 0.3% |
| Northern Europe | 16 | 0.2% |
| Philippines | 11 | 0.1% |
| Poland | 57 | 0.6% |
| South Africa | 26 | 0.3% |
| South Eastern Asia | 11 | 0.1% |
| Southern Europe | 18 | 0.2% |
| Ukraine | 43 | 0.5% |
| Western Europe | 104 | 1.1% | View All 26 Rows |
Sex and Age in Crestline
Sex and Age in Crestline
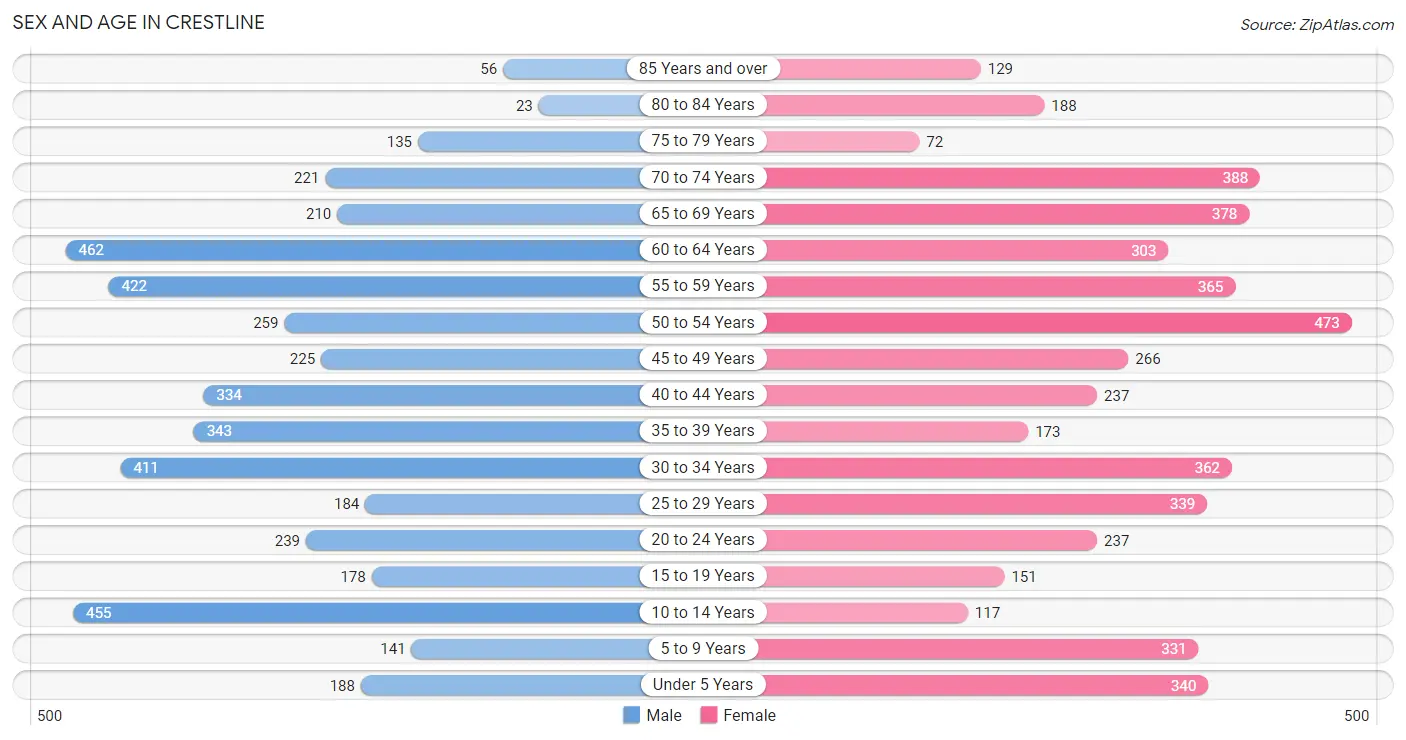
The most populous age groups in Crestline are 60 to 64 Years (462 | 10.3%) for men and 50 to 54 Years (473 | 9.8%) for women.
| Age Bracket | Male | Female |
| Under 5 Years | 188 (4.2%) | 340 (7.0%) |
| 5 to 9 Years | 141 (3.1%) | 331 (6.8%) |
| 10 to 14 Years | 455 (10.1%) | 117 (2.4%) |
| 15 to 19 Years | 178 (4.0%) | 151 (3.1%) |
| 20 to 24 Years | 239 (5.3%) | 237 (4.9%) |
| 25 to 29 Years | 184 (4.1%) | 339 (7.0%) |
| 30 to 34 Years | 411 (9.2%) | 362 (7.5%) |
| 35 to 39 Years | 343 (7.6%) | 173 (3.6%) |
| 40 to 44 Years | 334 (7.4%) | 237 (4.9%) |
| 45 to 49 Years | 225 (5.0%) | 266 (5.5%) |
| 50 to 54 Years | 259 (5.8%) | 473 (9.8%) |
| 55 to 59 Years | 422 (9.4%) | 365 (7.5%) |
| 60 to 64 Years | 462 (10.3%) | 303 (6.2%) |
| 65 to 69 Years | 210 (4.7%) | 378 (7.8%) |
| 70 to 74 Years | 221 (4.9%) | 388 (8.0%) |
| 75 to 79 Years | 135 (3.0%) | 72 (1.5%) |
| 80 to 84 Years | 23 (0.5%) | 188 (3.9%) |
| 85 Years and over | 56 (1.3%) | 129 (2.7%) |
| Total | 4,486 (100.0%) | 4,849 (100.0%) |
Families and Households in Crestline
Median Family Size in Crestline
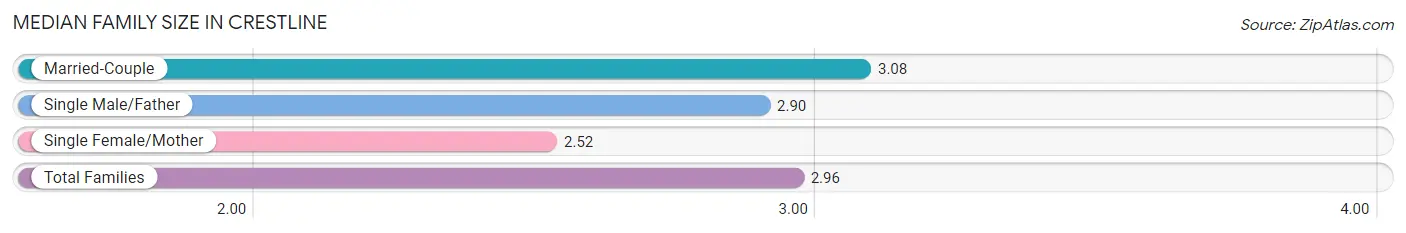
The median family size in Crestline is 2.96 persons per family, with married-couple families (1,827 | 74.3%) accounting for the largest median family size of 3.08 persons per family. On the other hand, single female/mother families (453 | 18.4%) represent the smallest median family size with 2.52 persons per family.
| Family Type | # Families | Family Size |
| Married-Couple | 1,827 (74.3%) | 3.08 |
| Single Male/Father | 180 (7.3%) | 2.90 |
| Single Female/Mother | 453 (18.4%) | 2.52 |
| Total Families | 2,460 (100.0%) | 2.96 |
Median Household Size in Crestline
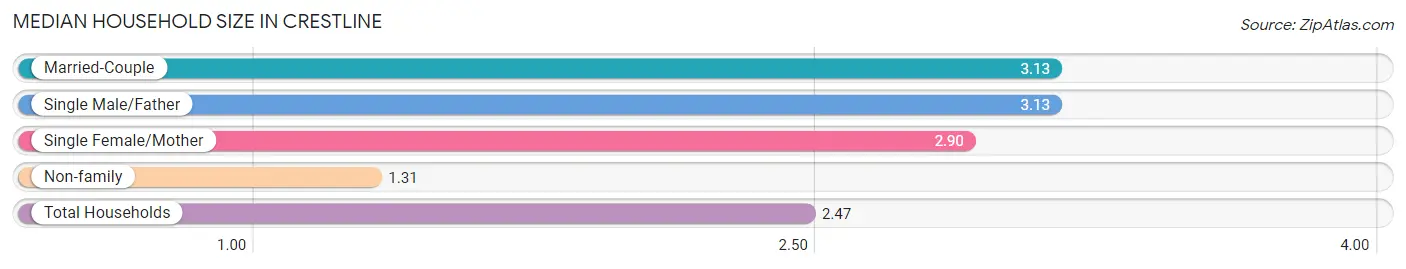
The median household size in Crestline is 2.47 persons per household, with married-couple households (1,827 | 48.6%) accounting for the largest median household size of 3.13 persons per household. non-family households (1,299 | 34.6%) represent the smallest median household size with 1.31 persons per household.
| Household Type | # Households | Household Size |
| Married-Couple | 1,827 (48.6%) | 3.13 |
| Single Male/Father | 180 (4.8%) | 3.13 |
| Single Female/Mother | 453 (12.0%) | 2.90 |
| Non-family | 1,299 (34.6%) | 1.31 |
| Total Households | 3,759 (100.0%) | 2.47 |
Household Size by Marriage Status in Crestline
Out of a total of 3,759 households in Crestline, 2,460 (65.4%) are family households, while 1,299 (34.6%) are nonfamily households. The most numerous type of family households are 2-person households, comprising 1,291, and the most common type of nonfamily households are 1-person households, comprising 949.
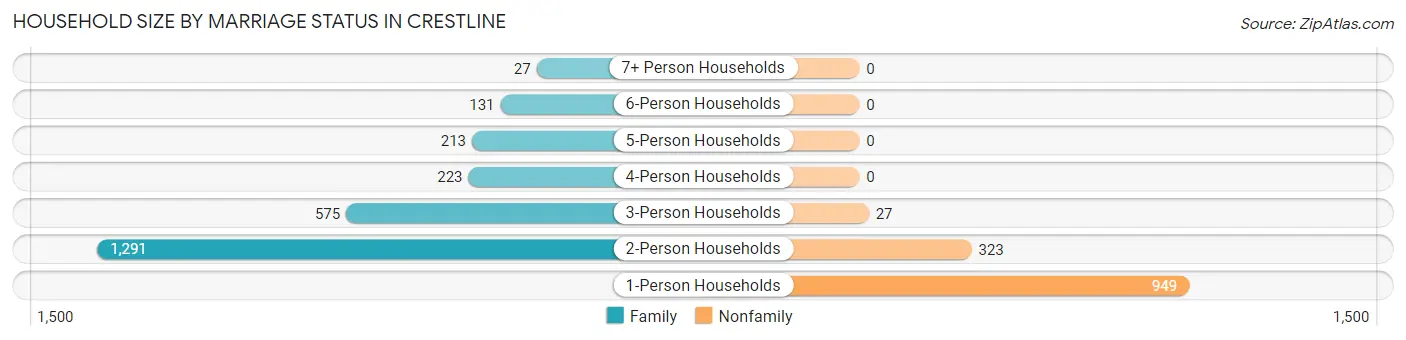
| Household Size | Family Households | Nonfamily Households |
| 1-Person Households | - | 949 (25.3%) |
| 2-Person Households | 1,291 (34.3%) | 323 (8.6%) |
| 3-Person Households | 575 (15.3%) | 27 (0.7%) |
| 4-Person Households | 223 (5.9%) | 0 (0.0%) |
| 5-Person Households | 213 (5.7%) | 0 (0.0%) |
| 6-Person Households | 131 (3.5%) | 0 (0.0%) |
| 7+ Person Households | 27 (0.7%) | 0 (0.0%) |
| Total | 2,460 (65.4%) | 1,299 (34.6%) |
Female Fertility in Crestline
Fertility by Age in Crestline
Average fertility rate in Crestline is 51.0 births per 1,000 women. Women in the age bracket of 20 to 34 years have the highest fertility rate with 59.0 births per 1,000 women. Women in the age bracket of 20 to 34 years acount for 56.1% of all women with births.
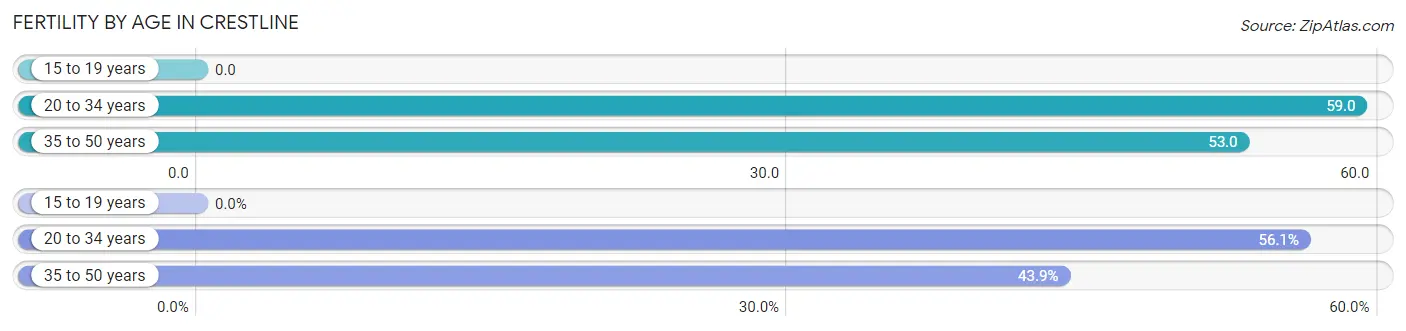
| Age Bracket | Women with Births | Births / 1,000 Women |
| 15 to 19 years | 0 (0.0%) | 0.0 |
| 20 to 34 years | 55 (56.1%) | 59.0 |
| 35 to 50 years | 43 (43.9%) | 53.0 |
| Total | 98 (100.0%) | 51.0 |
Fertility by Age by Marriage Status in Crestline
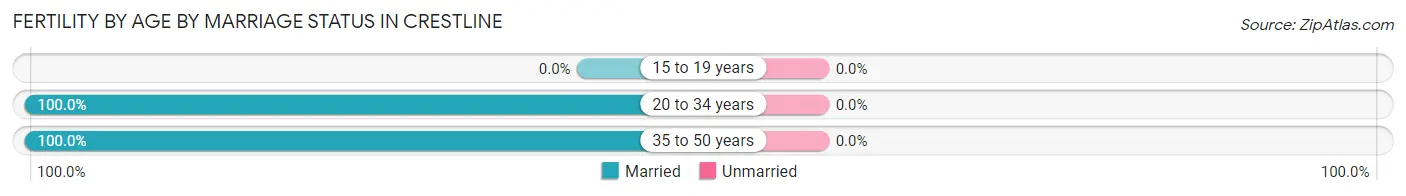
| Age Bracket | Married | Unmarried |
| 15 to 19 years | 0 (0.0%) | 0 (0.0%) |
| 20 to 34 years | 55 (100.0%) | 0 (0.0%) |
| 35 to 50 years | 43 (100.0%) | 0 (0.0%) |
| Total | 98 (100.0%) | 0 (0.0%) |
Fertility by Education in Crestline
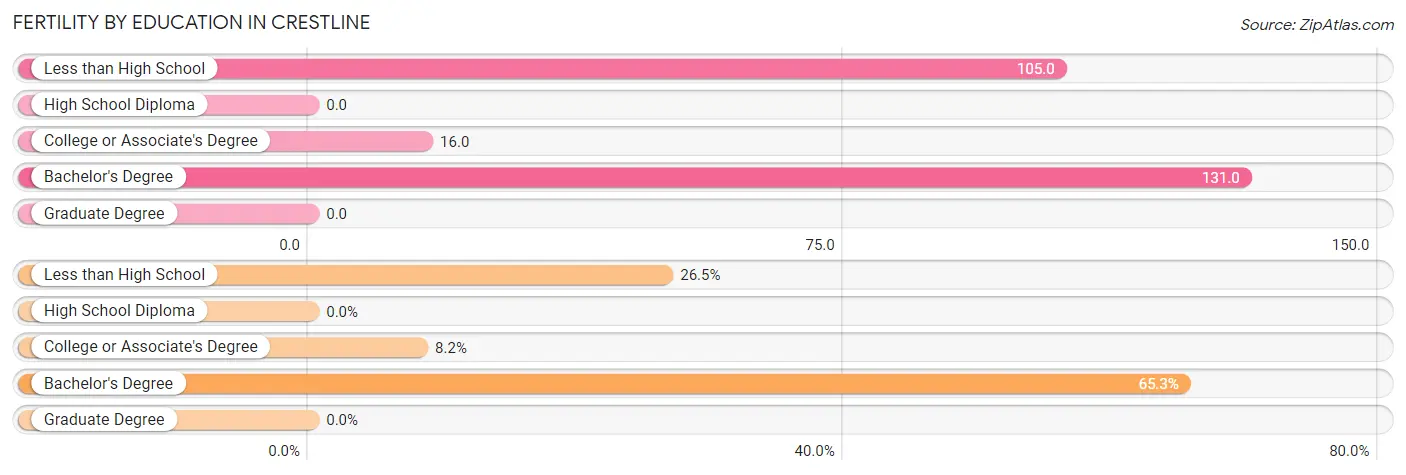
| Educational Attainment | Women with Births | Births / 1,000 Women |
| Less than High School | 26 (26.5%) | 105.0 |
| High School Diploma | 0 (0.0%) | 0.0 |
| College or Associate's Degree | 8 (8.2%) | 16.0 |
| Bachelor's Degree | 64 (65.3%) | 131.0 |
| Graduate Degree | 0 (0.0%) | 0.0 |
| Total | 98 (100.0%) | 51.0 |
Fertility by Education by Marriage Status in Crestline
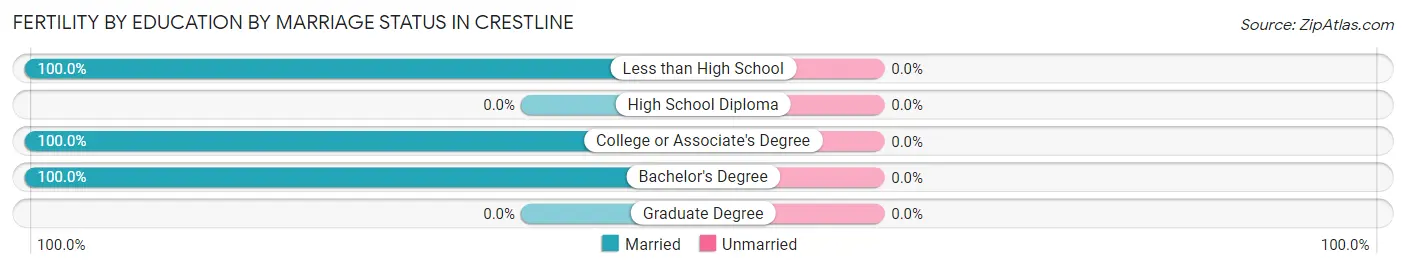
| Educational Attainment | Married | Unmarried |
| Less than High School | 26 (100.0%) | 0 (0.0%) |
| High School Diploma | 0 (0.0%) | 0 (0.0%) |
| College or Associate's Degree | 8 (100.0%) | 0 (0.0%) |
| Bachelor's Degree | 64 (100.0%) | 0 (0.0%) |
| Graduate Degree | 0 (0.0%) | 0 (0.0%) |
| Total | 98 (100.0%) | 0 (0.0%) |
Employment Characteristics in Crestline
Employment by Class of Employer in Crestline
Among the 4,117 employed individuals in Crestline, private company employees (2,617 | 63.6%), self-employed (not incorporated) (555 | 13.5%), and local government employees (341 | 8.3%) make up the most common classes of employment.

| Employer Class | # Employees | % Employees |
| Private Company Employees | 2,617 | 63.6% |
| Self-Employed (Incorporated) | 88 | 2.1% |
| Self-Employed (Not Incorporated) | 555 | 13.5% |
| Not-for-profit Organizations | 262 | 6.4% |
| Local Government Employees | 341 | 8.3% |
| State Government Employees | 146 | 3.5% |
| Federal Government Employees | 108 | 2.6% |
| Unpaid Family Workers | 0 | 0.0% |
| Total | 4,117 | 100.0% |
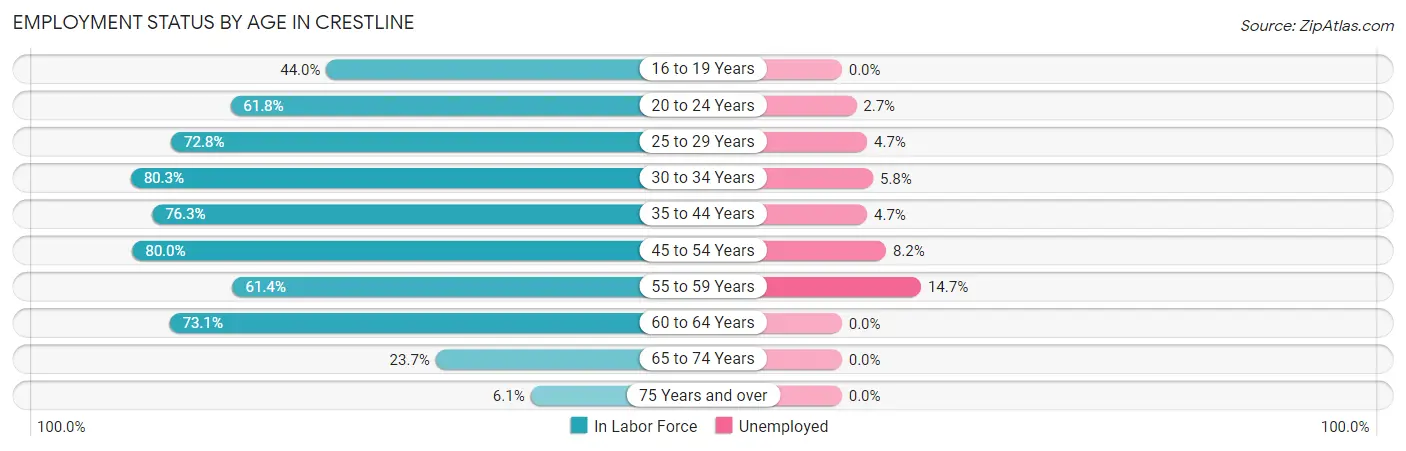
Employment Status by Age in Crestline
According to the labor force statistics for Crestline, out of the total population over 16 years of age (7,686), 59.6% or 4,581 individuals are in the labor force, with 5.5% or 252 of them unemployed. The age group with the highest labor force participation rate is 30 to 34 years, with 80.3% or 621 individuals in the labor force. Within the labor force, the 55 to 59 years age range has the highest percentage of unemployed individuals, with 14.7% or 71 of them being unemployed.
| Age Bracket | In Labor Force | Unemployed |
| 16 to 19 Years | 111 (44.0%) | 0 (0.0%) |
| 20 to 24 Years | 294 (61.8%) | 8 (2.7%) |
| 25 to 29 Years | 381 (72.8%) | 18 (4.7%) |
| 30 to 34 Years | 621 (80.3%) | 36 (5.8%) |
| 35 to 44 Years | 829 (76.3%) | 39 (4.7%) |
| 45 to 54 Years | 978 (80.0%) | 80 (8.2%) |
| 55 to 59 Years | 483 (61.4%) | 71 (14.7%) |
| 60 to 64 Years | 559 (73.1%) | 0 (0.0%) |
| 65 to 74 Years | 284 (23.7%) | 0 (0.0%) |
| 75 Years and over | 37 (6.1%) | 0 (0.0%) |
| Total | 4,581 (59.6%) | 252 (5.5%) |
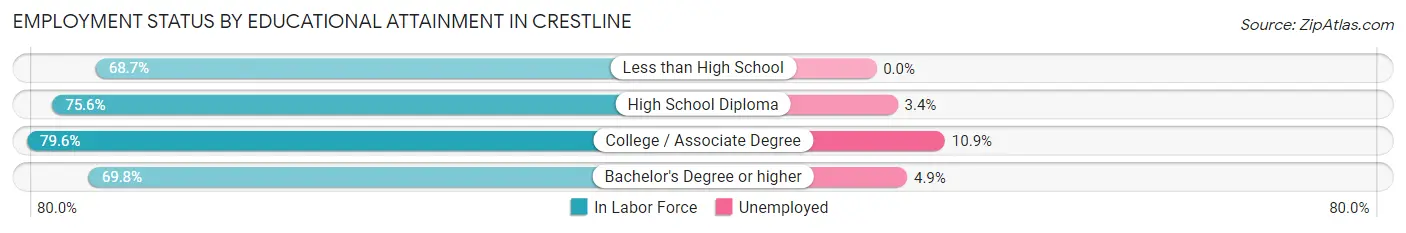
Employment Status by Educational Attainment in Crestline
According to labor force statistics for Crestline, 74.7% of individuals (3,853) out of the total population between 25 and 64 years of age (5,158) are in the labor force, with 6.3% or 243 of them being unemployed. The group with the highest labor force participation rate are those with the educational attainment of college / associate degree, with 79.6% or 1,481 individuals in the labor force. Within the labor force, individuals with college / associate degree education have the highest percentage of unemployment, with 10.9% or 161 of them being unemployed.
| Educational Attainment | In Labor Force | Unemployed |
| Less than High School | 375 (68.7%) | 0 (0.0%) |
| High School Diploma | 990 (75.6%) | 45 (3.4%) |
| College / Associate Degree | 1,481 (79.6%) | 203 (10.9%) |
| Bachelor's Degree or higher | 1,007 (69.8%) | 71 (4.9%) |
| Total | 3,853 (74.7%) | 325 (6.3%) |
Employment Occupations by Sex in Crestline
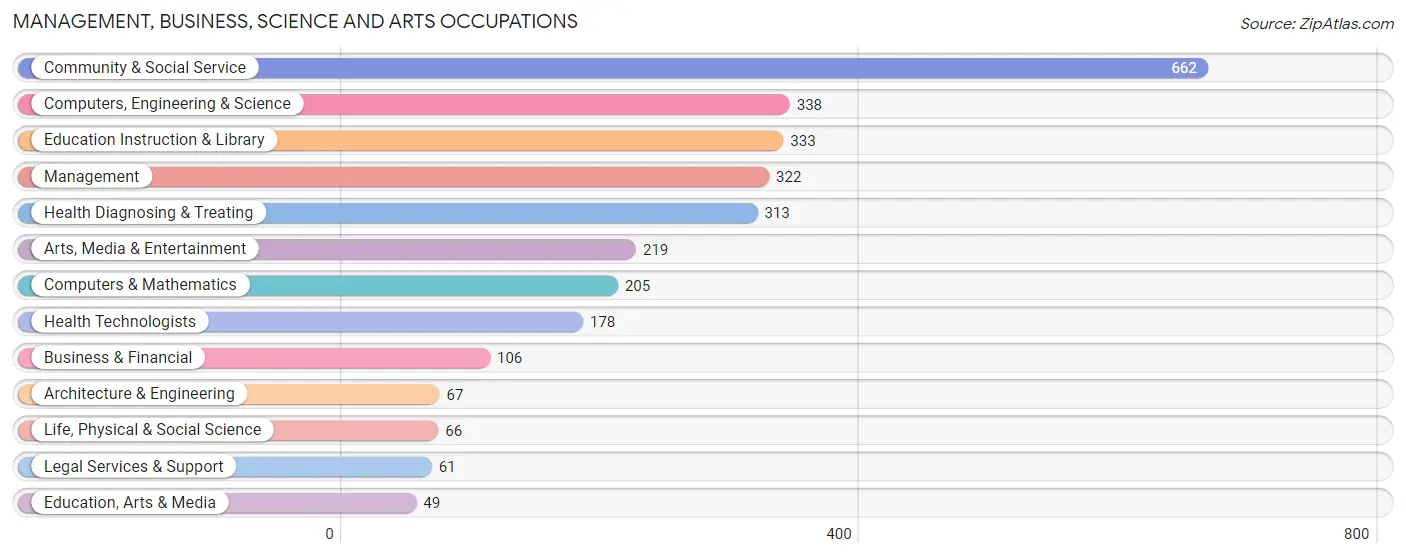
Management, Business, Science and Arts Occupations
The most common Management, Business, Science and Arts occupations in Crestline are Community & Social Service (662 | 15.3%), Computers, Engineering & Science (338 | 7.8%), Education Instruction & Library (333 | 7.7%), Management (322 | 7.5%), and Health Diagnosing & Treating (313 | 7.3%).
Management, Business, Science and Arts Occupations by Sex
Within the Management, Business, Science and Arts occupations in Crestline, the most male-oriented occupations are Education, Arts & Media (100.0%), Legal Services & Support (100.0%), and Arts, Media & Entertainment (79.9%), while the most female-oriented occupations are Health Diagnosing & Treating (79.9%), Health Technologists (70.8%), and Education Instruction & Library (69.4%).
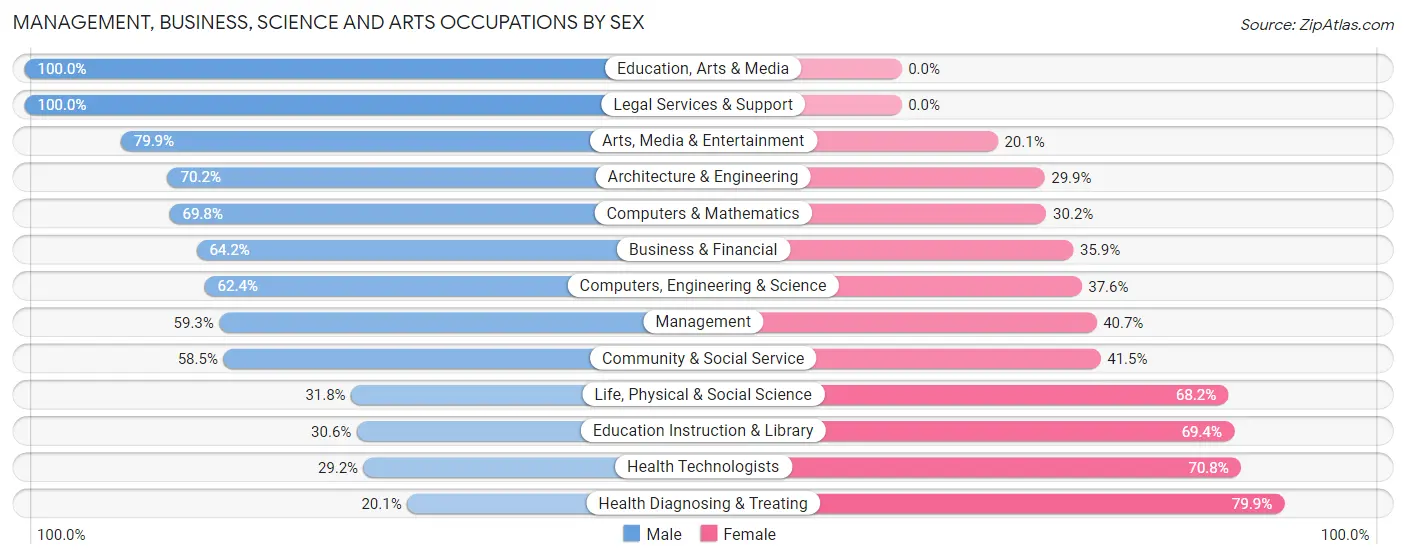
| Occupation | Male | Female |
| Management | 191 (59.3%) | 131 (40.7%) |
| Business & Financial | 68 (64.1%) | 38 (35.8%) |
| Computers, Engineering & Science | 211 (62.4%) | 127 (37.6%) |
| Computers & Mathematics | 143 (69.8%) | 62 (30.2%) |
| Architecture & Engineering | 47 (70.2%) | 20 (29.8%) |
| Life, Physical & Social Science | 21 (31.8%) | 45 (68.2%) |
| Community & Social Service | 387 (58.5%) | 275 (41.5%) |
| Education, Arts & Media | 49 (100.0%) | 0 (0.0%) |
| Legal Services & Support | 61 (100.0%) | 0 (0.0%) |
| Education Instruction & Library | 102 (30.6%) | 231 (69.4%) |
| Arts, Media & Entertainment | 175 (79.9%) | 44 (20.1%) |
| Health Diagnosing & Treating | 63 (20.1%) | 250 (79.9%) |
| Health Technologists | 52 (29.2%) | 126 (70.8%) |
| Total (Category) | 920 (52.8%) | 821 (47.2%) |
| Total (Overall) | 2,502 (58.0%) | 1,811 (42.0%) |
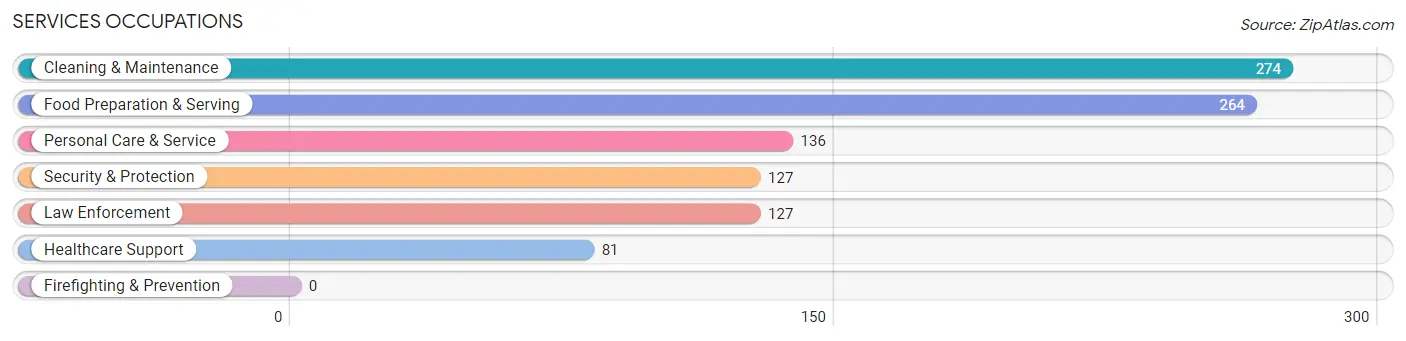
Services Occupations
The most common Services occupations in Crestline are Cleaning & Maintenance (274 | 6.4%), Food Preparation & Serving (264 | 6.1%), Personal Care & Service (136 | 3.2%), Security & Protection (127 | 2.9%), and Law Enforcement (127 | 2.9%).
Services Occupations by Sex
Within the Services occupations in Crestline, the most male-oriented occupations are Security & Protection (100.0%), Law Enforcement (100.0%), and Personal Care & Service (85.3%), while the most female-oriented occupations are Healthcare Support (75.3%), Food Preparation & Serving (70.5%), and Cleaning & Maintenance (33.2%).
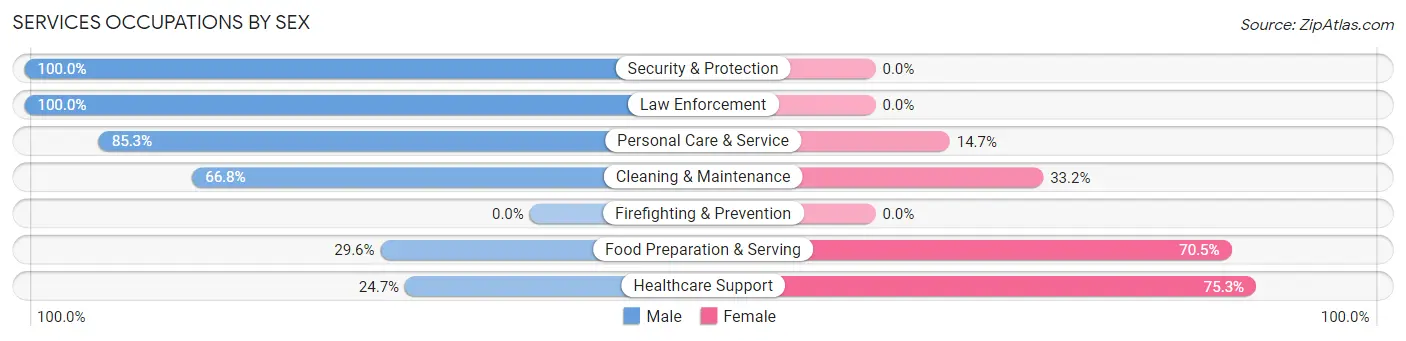
| Occupation | Male | Female |
| Healthcare Support | 20 (24.7%) | 61 (75.3%) |
| Security & Protection | 127 (100.0%) | 0 (0.0%) |
| Firefighting & Prevention | 0 (0.0%) | 0 (0.0%) |
| Law Enforcement | 127 (100.0%) | 0 (0.0%) |
| Food Preparation & Serving | 78 (29.5%) | 186 (70.5%) |
| Cleaning & Maintenance | 183 (66.8%) | 91 (33.2%) |
| Personal Care & Service | 116 (85.3%) | 20 (14.7%) |
| Total (Category) | 524 (59.4%) | 358 (40.6%) |
| Total (Overall) | 2,502 (58.0%) | 1,811 (42.0%) |
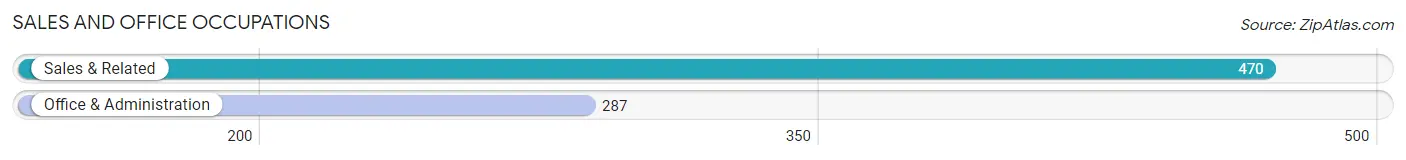
Sales and Office Occupations
The most common Sales and Office occupations in Crestline are Sales & Related (470 | 10.9%), and Office & Administration (287 | 6.7%).
Sales and Office Occupations by Sex
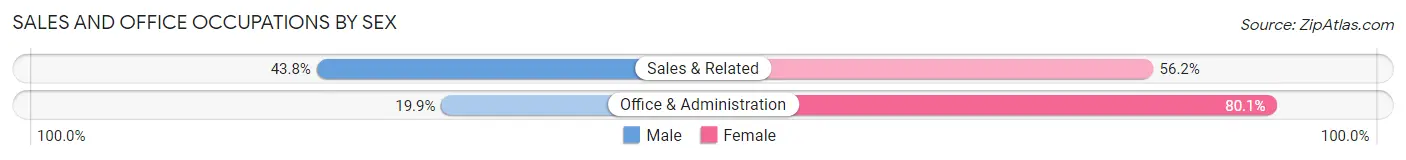
| Occupation | Male | Female |
| Sales & Related | 206 (43.8%) | 264 (56.2%) |
| Office & Administration | 57 (19.9%) | 230 (80.1%) |
| Total (Category) | 263 (34.7%) | 494 (65.3%) |
| Total (Overall) | 2,502 (58.0%) | 1,811 (42.0%) |
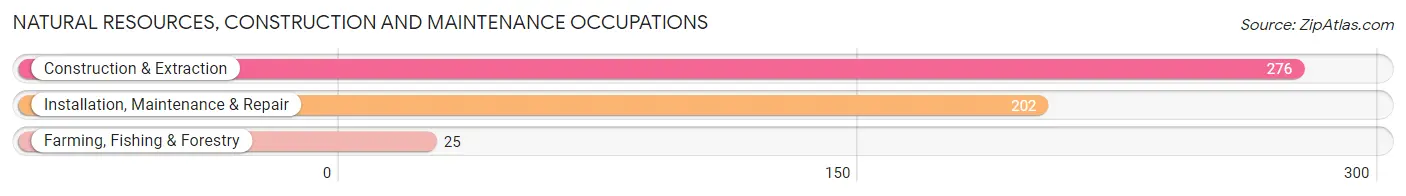
Natural Resources, Construction and Maintenance Occupations
The most common Natural Resources, Construction and Maintenance occupations in Crestline are Construction & Extraction (276 | 6.4%), Installation, Maintenance & Repair (202 | 4.7%), and Farming, Fishing & Forestry (25 | 0.6%).
Natural Resources, Construction and Maintenance Occupations by Sex
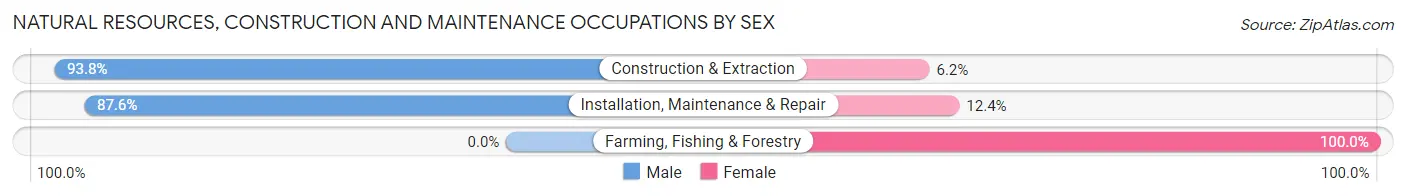
| Occupation | Male | Female |
| Farming, Fishing & Forestry | 0 (0.0%) | 25 (100.0%) |
| Construction & Extraction | 259 (93.8%) | 17 (6.2%) |
| Installation, Maintenance & Repair | 177 (87.6%) | 25 (12.4%) |
| Total (Category) | 436 (86.7%) | 67 (13.3%) |
| Total (Overall) | 2,502 (58.0%) | 1,811 (42.0%) |
Production, Transportation and Moving Occupations
The most common Production, Transportation and Moving occupations in Crestline are Material Moving (157 | 3.6%), Transportation (146 | 3.4%), and Production (127 | 2.9%).
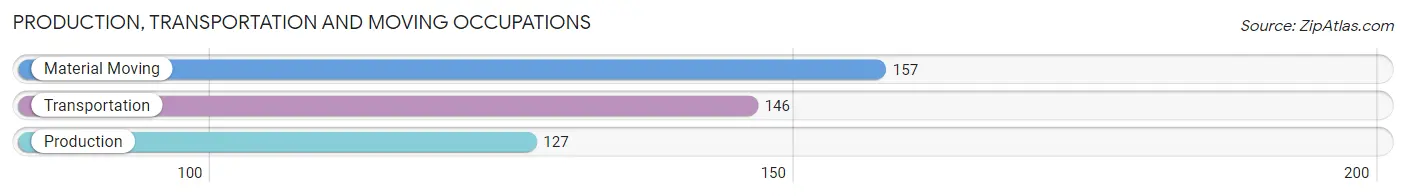
Production, Transportation and Moving Occupations by Sex
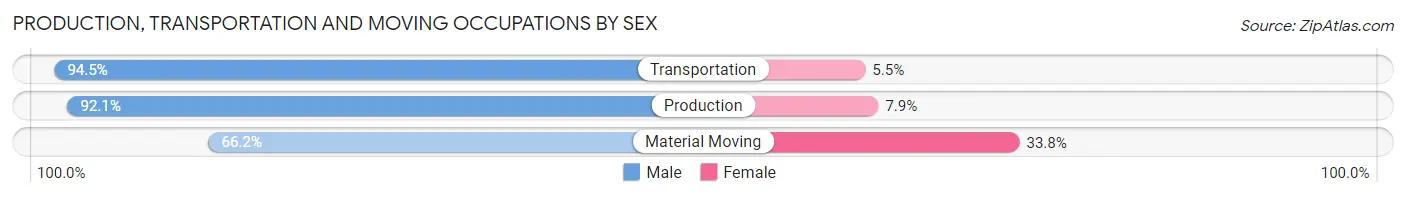
| Occupation | Male | Female |
| Production | 117 (92.1%) | 10 (7.9%) |
| Transportation | 138 (94.5%) | 8 (5.5%) |
| Material Moving | 104 (66.2%) | 53 (33.8%) |
| Total (Category) | 359 (83.5%) | 71 (16.5%) |
| Total (Overall) | 2,502 (58.0%) | 1,811 (42.0%) |
Employment Industries by Sex in Crestline
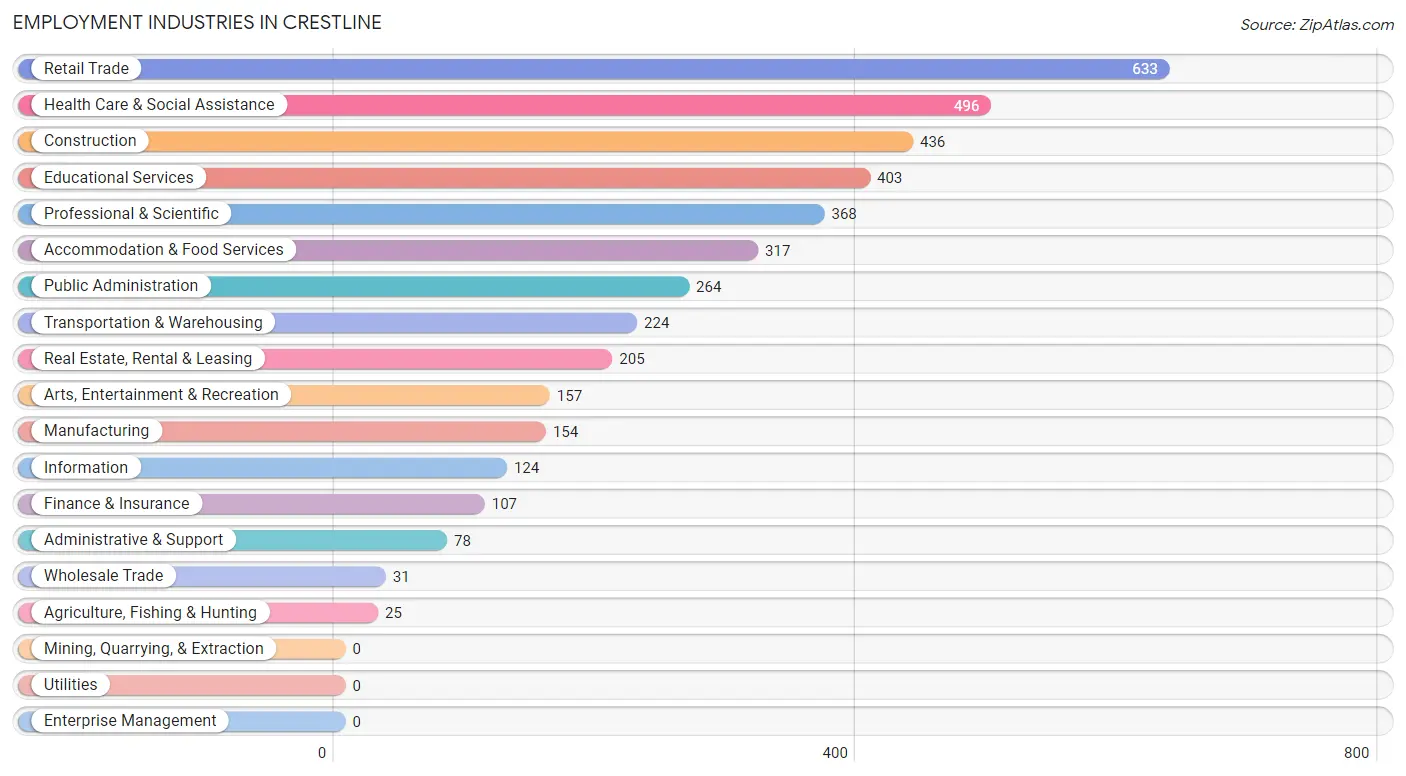
Employment Industries in Crestline
The major employment industries in Crestline include Retail Trade (633 | 14.7%), Health Care & Social Assistance (496 | 11.5%), Construction (436 | 10.1%), Educational Services (403 | 9.3%), and Professional & Scientific (368 | 8.5%).
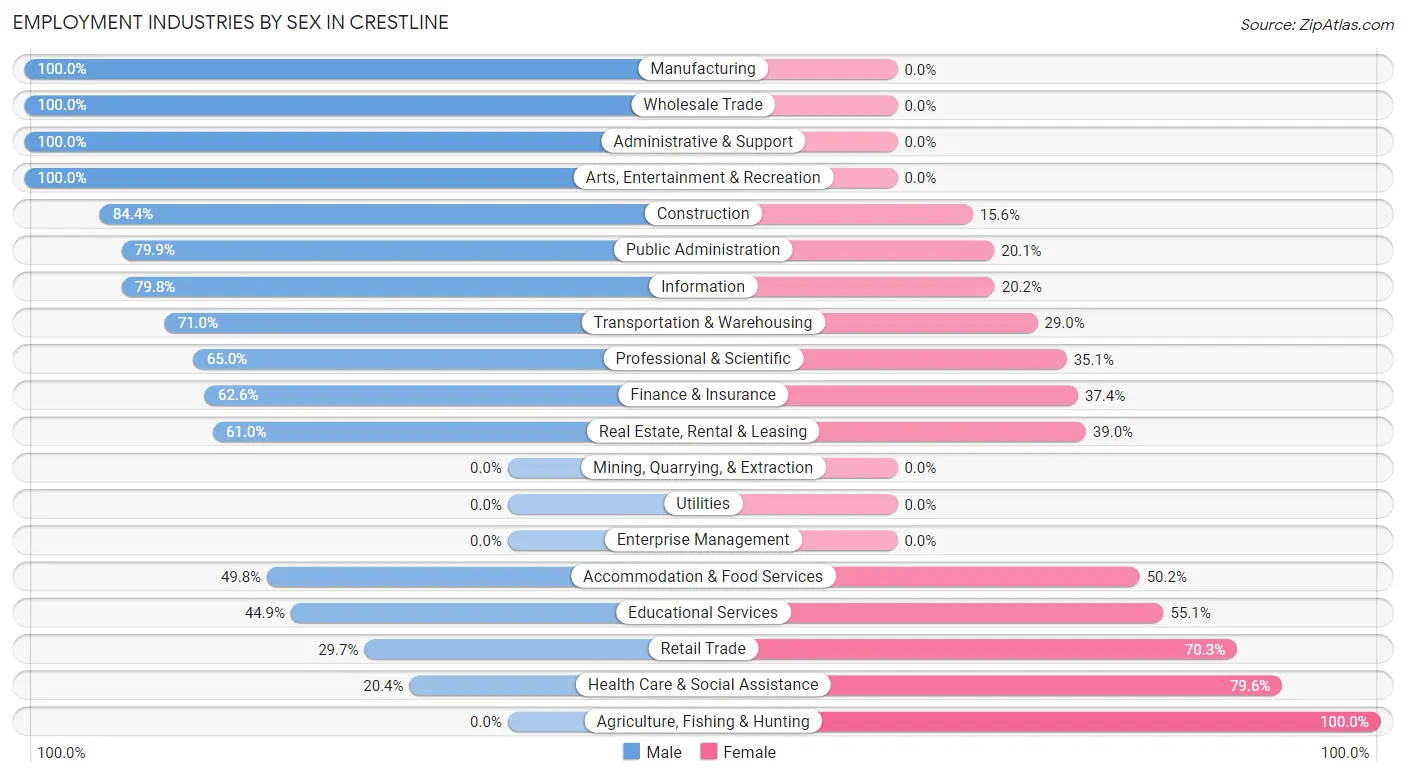
Employment Industries by Sex in Crestline
The Crestline industries that see more men than women are Manufacturing (100.0%), Wholesale Trade (100.0%), and Administrative & Support (100.0%), whereas the industries that tend to have a higher number of women are Agriculture, Fishing & Hunting (100.0%), Health Care & Social Assistance (79.6%), and Retail Trade (70.3%).
| Industry | Male | Female |
| Agriculture, Fishing & Hunting | 0 (0.0%) | 25 (100.0%) |
| Mining, Quarrying, & Extraction | 0 (0.0%) | 0 (0.0%) |
| Construction | 368 (84.4%) | 68 (15.6%) |
| Manufacturing | 154 (100.0%) | 0 (0.0%) |
| Wholesale Trade | 31 (100.0%) | 0 (0.0%) |
| Retail Trade | 188 (29.7%) | 445 (70.3%) |
| Transportation & Warehousing | 159 (71.0%) | 65 (29.0%) |
| Utilities | 0 (0.0%) | 0 (0.0%) |
| Information | 99 (79.8%) | 25 (20.2%) |
| Finance & Insurance | 67 (62.6%) | 40 (37.4%) |
| Real Estate, Rental & Leasing | 125 (61.0%) | 80 (39.0%) |
| Professional & Scientific | 239 (64.9%) | 129 (35.0%) |
| Enterprise Management | 0 (0.0%) | 0 (0.0%) |
| Administrative & Support | 78 (100.0%) | 0 (0.0%) |
| Educational Services | 181 (44.9%) | 222 (55.1%) |
| Health Care & Social Assistance | 101 (20.4%) | 395 (79.6%) |
| Arts, Entertainment & Recreation | 157 (100.0%) | 0 (0.0%) |
| Accommodation & Food Services | 158 (49.8%) | 159 (50.2%) |
| Public Administration | 211 (79.9%) | 53 (20.1%) |
| Total | 2,502 (58.0%) | 1,811 (42.0%) |
Education in Crestline
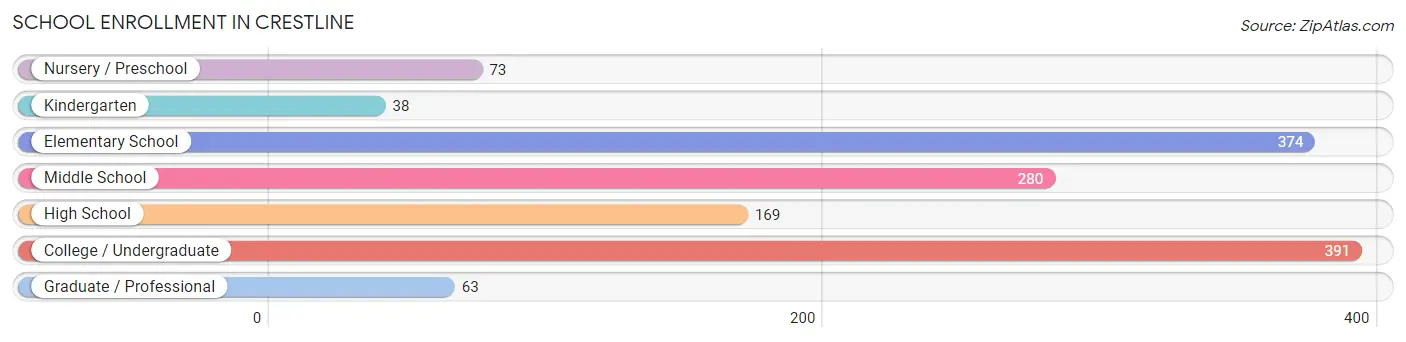
School Enrollment in Crestline
The most common levels of schooling among the 1,388 students in Crestline are college / undergraduate (391 | 28.2%), elementary school (374 | 27.0%), and middle school (280 | 20.2%).
| School Level | # Students | % Students |
| Nursery / Preschool | 73 | 5.3% |
| Kindergarten | 38 | 2.7% |
| Elementary School | 374 | 27.0% |
| Middle School | 280 | 20.2% |
| High School | 169 | 12.2% |
| College / Undergraduate | 391 | 28.2% |
| Graduate / Professional | 63 | 4.5% |
| Total | 1,388 | 100.0% |
School Enrollment by Age by Funding Source in Crestline
Out of a total of 1,388 students who are enrolled in schools in Crestline, 346 (24.9%) attend a private institution, while the remaining 1,042 (75.1%) are enrolled in public schools. The age group of 35 years and over has the highest likelihood of being enrolled in private schools, with 25 (37.3% in the age bracket) enrolled. Conversely, the age group of 3 to 4 year olds has the lowest likelihood of being enrolled in a private school, with 12 (100.0% in the age bracket) attending a public institution.
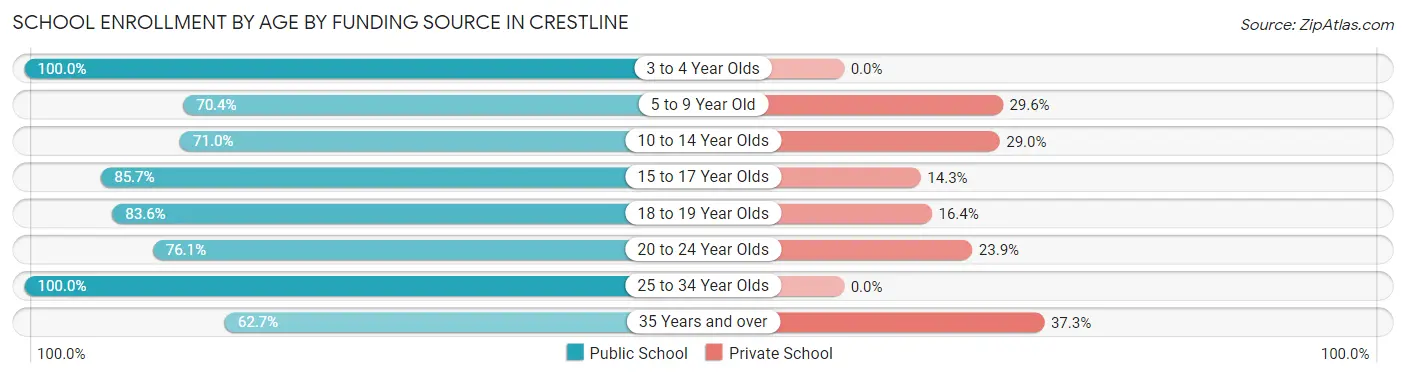
| Age Bracket | Public School | Private School |
| 3 to 4 Year Olds | 12 (100.0%) | 0 (0.0%) |
| 5 to 9 Year Old | 312 (70.4%) | 131 (29.6%) |
| 10 to 14 Year Olds | 223 (71.0%) | 91 (29.0%) |
| 15 to 17 Year Olds | 126 (85.7%) | 21 (14.3%) |
| 18 to 19 Year Olds | 92 (83.6%) | 18 (16.4%) |
| 20 to 24 Year Olds | 188 (76.1%) | 59 (23.9%) |
| 25 to 34 Year Olds | 48 (100.0%) | 0 (0.0%) |
| 35 Years and over | 42 (62.7%) | 25 (37.3%) |
| Total | 1,042 (75.1%) | 346 (24.9%) |
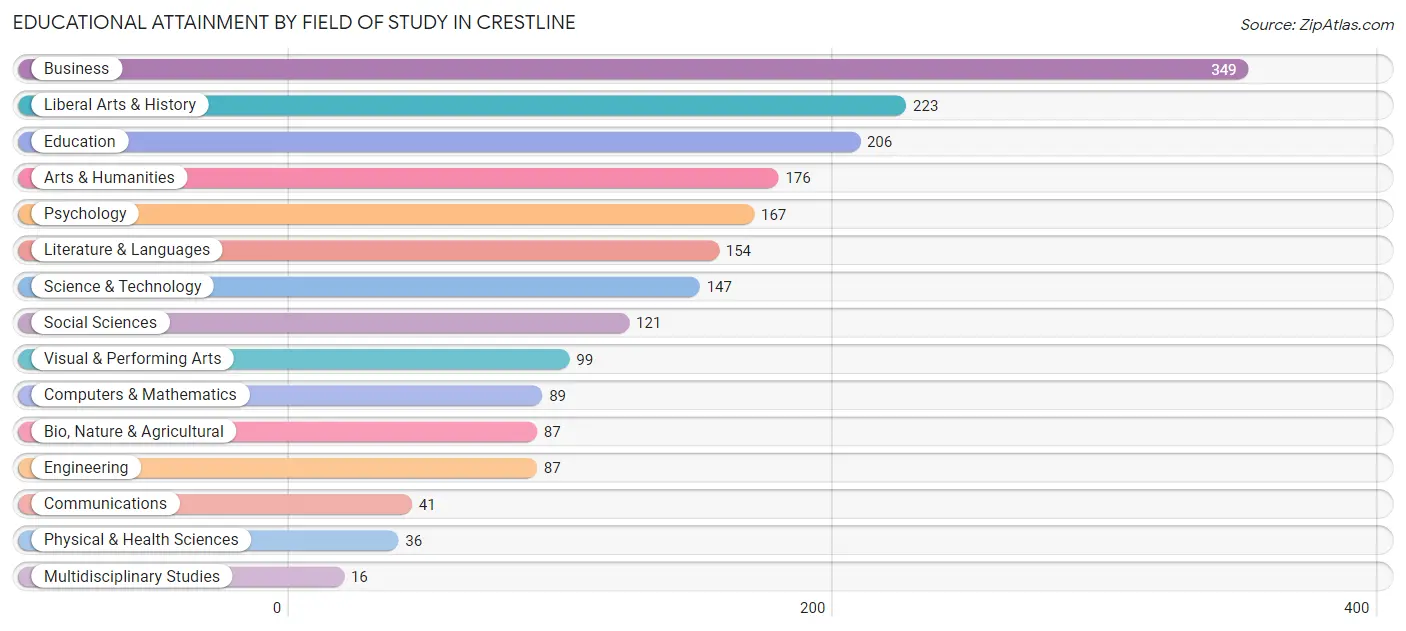
Educational Attainment by Field of Study in Crestline
Business (349 | 17.5%), liberal arts & history (223 | 11.2%), education (206 | 10.3%), arts & humanities (176 | 8.8%), and psychology (167 | 8.4%) are the most common fields of study among 1,998 individuals in Crestline who have obtained a bachelor's degree or higher.
| Field of Study | # Graduates | % Graduates |
| Computers & Mathematics | 89 | 4.4% |
| Bio, Nature & Agricultural | 87 | 4.3% |
| Physical & Health Sciences | 36 | 1.8% |
| Psychology | 167 | 8.4% |
| Social Sciences | 121 | 6.1% |
| Engineering | 87 | 4.3% |
| Multidisciplinary Studies | 16 | 0.8% |
| Science & Technology | 147 | 7.4% |
| Business | 349 | 17.5% |
| Education | 206 | 10.3% |
| Literature & Languages | 154 | 7.7% |
| Liberal Arts & History | 223 | 11.2% |
| Visual & Performing Arts | 99 | 5.0% |
| Communications | 41 | 2.1% |
| Arts & Humanities | 176 | 8.8% |
| Total | 1,998 | 100.0% |
Transportation & Commute in Crestline
Vehicle Availability by Sex in Crestline
The most prevalent vehicle ownership categories in Crestline are males with 2 vehicles (932, accounting for 39.5%) and females with 2 vehicles (822, making up 53.9%).
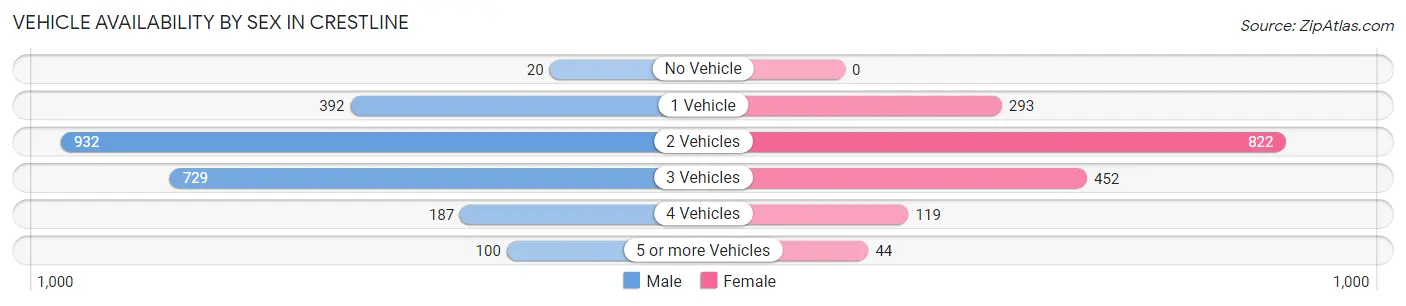
| Vehicles Available | Male | Female |
| No Vehicle | 20 (0.9%) | 0 (0.0%) |
| 1 Vehicle | 392 (16.6%) | 293 (16.9%) |
| 2 Vehicles | 932 (39.5%) | 822 (47.5%) |
| 3 Vehicles | 729 (30.9%) | 452 (26.1%) |
| 4 Vehicles | 187 (7.9%) | 119 (6.9%) |
| 5 or more Vehicles | 100 (4.2%) | 44 (2.5%) |
| Total | 2,360 (100.0%) | 1,730 (100.0%) |
Commute Time in Crestline
The most frequently occuring commute durations in Crestline are 60 to 89 minutes (487 commuters, 14.6%), 30 to 34 minutes (461 commuters, 13.8%), and 90 or more minutes (425 commuters, 12.7%).
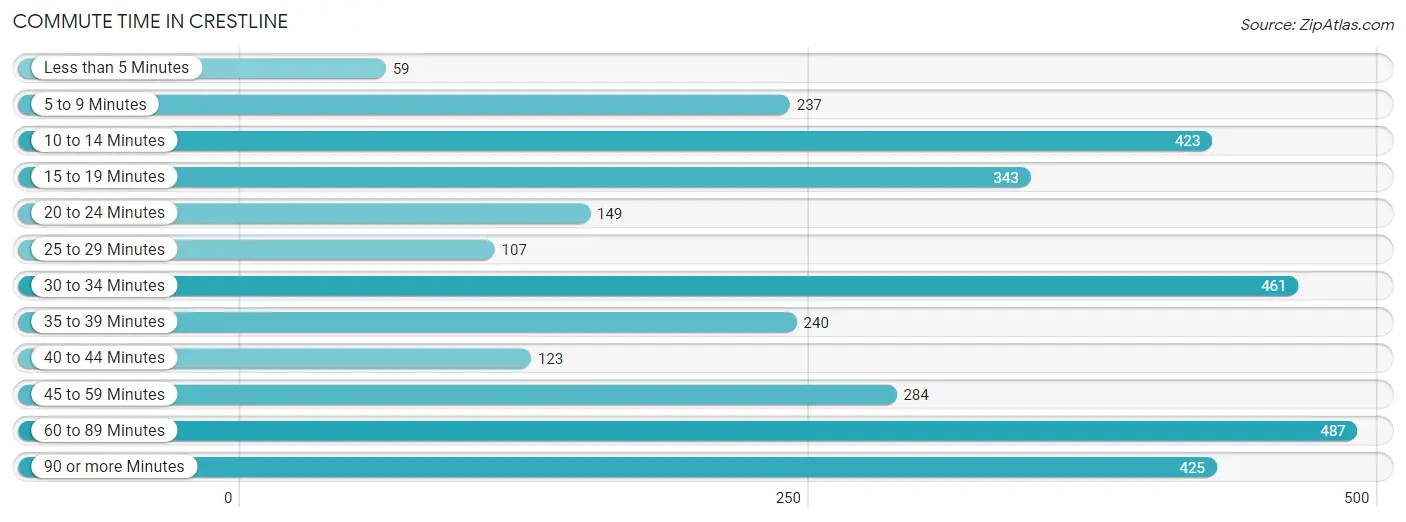
| Commute Time | # Commuters | % Commuters |
| Less than 5 Minutes | 59 | 1.8% |
| 5 to 9 Minutes | 237 | 7.1% |
| 10 to 14 Minutes | 423 | 12.7% |
| 15 to 19 Minutes | 343 | 10.3% |
| 20 to 24 Minutes | 149 | 4.5% |
| 25 to 29 Minutes | 107 | 3.2% |
| 30 to 34 Minutes | 461 | 13.8% |
| 35 to 39 Minutes | 240 | 7.2% |
| 40 to 44 Minutes | 123 | 3.7% |
| 45 to 59 Minutes | 284 | 8.5% |
| 60 to 89 Minutes | 487 | 14.6% |
| 90 or more Minutes | 425 | 12.7% |
Commute Time by Sex in Crestline
The most common commute times in Crestline are 30 to 34 minutes (302 commuters, 16.5%) for males and 10 to 14 minutes (362 commuters, 24.1%) for females.
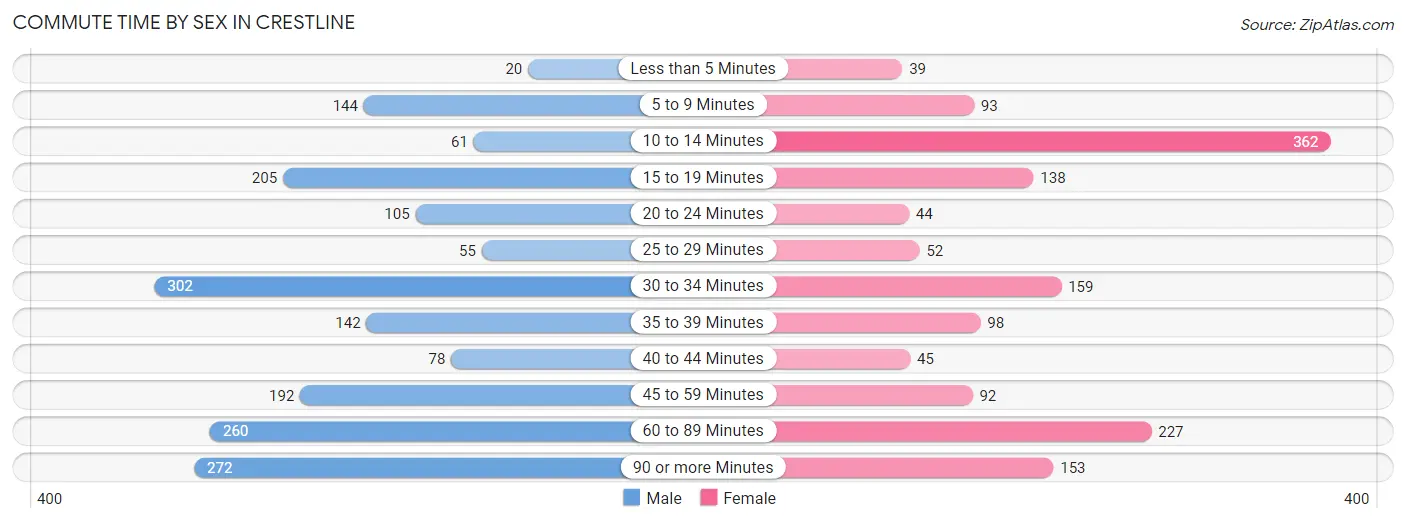
| Commute Time | Male | Female |
| Less than 5 Minutes | 20 (1.1%) | 39 (2.6%) |
| 5 to 9 Minutes | 144 (7.8%) | 93 (6.2%) |
| 10 to 14 Minutes | 61 (3.3%) | 362 (24.1%) |
| 15 to 19 Minutes | 205 (11.2%) | 138 (9.2%) |
| 20 to 24 Minutes | 105 (5.7%) | 44 (2.9%) |
| 25 to 29 Minutes | 55 (3.0%) | 52 (3.5%) |
| 30 to 34 Minutes | 302 (16.5%) | 159 (10.6%) |
| 35 to 39 Minutes | 142 (7.7%) | 98 (6.5%) |
| 40 to 44 Minutes | 78 (4.3%) | 45 (3.0%) |
| 45 to 59 Minutes | 192 (10.5%) | 92 (6.1%) |
| 60 to 89 Minutes | 260 (14.2%) | 227 (15.1%) |
| 90 or more Minutes | 272 (14.8%) | 153 (10.2%) |
Time of Departure to Work by Sex in Crestline
The most frequent times of departure to work in Crestline are 12:00 AM to 4:59 AM (428, 23.3%) for males and 8:00 AM to 8:29 AM (288, 19.2%) for females.
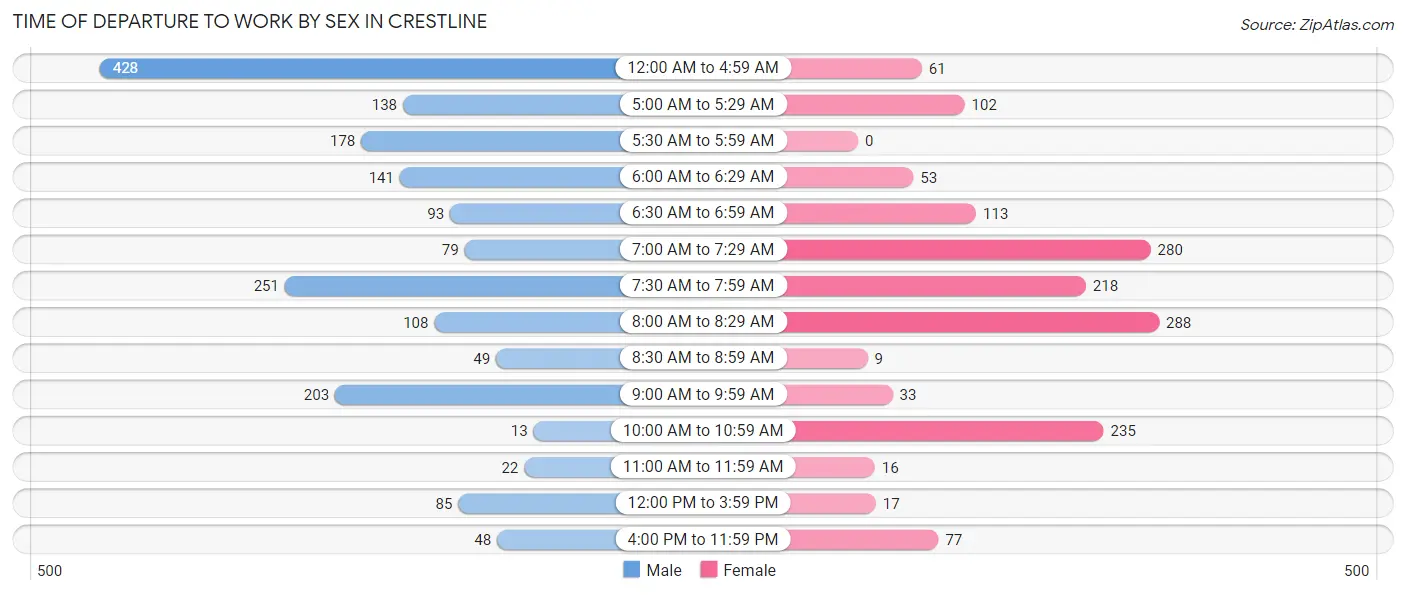
| Time of Departure | Male | Female |
| 12:00 AM to 4:59 AM | 428 (23.3%) | 61 (4.1%) |
| 5:00 AM to 5:29 AM | 138 (7.5%) | 102 (6.8%) |
| 5:30 AM to 5:59 AM | 178 (9.7%) | 0 (0.0%) |
| 6:00 AM to 6:29 AM | 141 (7.7%) | 53 (3.5%) |
| 6:30 AM to 6:59 AM | 93 (5.1%) | 113 (7.5%) |
| 7:00 AM to 7:29 AM | 79 (4.3%) | 280 (18.6%) |
| 7:30 AM to 7:59 AM | 251 (13.7%) | 218 (14.5%) |
| 8:00 AM to 8:29 AM | 108 (5.9%) | 288 (19.2%) |
| 8:30 AM to 8:59 AM | 49 (2.7%) | 9 (0.6%) |
| 9:00 AM to 9:59 AM | 203 (11.1%) | 33 (2.2%) |
| 10:00 AM to 10:59 AM | 13 (0.7%) | 235 (15.7%) |
| 11:00 AM to 11:59 AM | 22 (1.2%) | 16 (1.1%) |
| 12:00 PM to 3:59 PM | 85 (4.6%) | 17 (1.1%) |
| 4:00 PM to 11:59 PM | 48 (2.6%) | 77 (5.1%) |
| Total | 1,836 (100.0%) | 1,502 (100.0%) |
Housing Occupancy in Crestline
Occupancy by Ownership in Crestline
Of the total 3,759 dwellings in Crestline, owner-occupied units account for 2,855 (75.9%), while renter-occupied units make up 904 (24.0%).
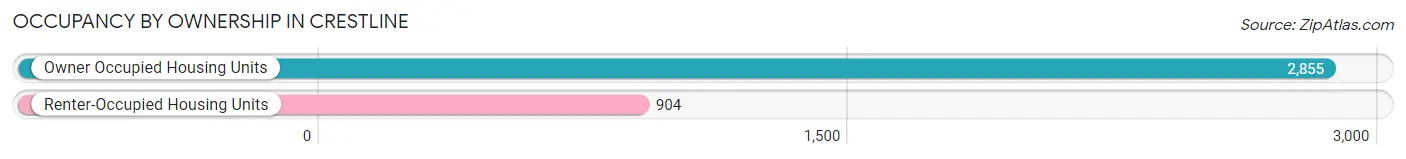
| Occupancy | # Housing Units | % Housing Units |
| Owner Occupied Housing Units | 2,855 | 75.9% |
| Renter-Occupied Housing Units | 904 | 24.0% |
| Total Occupied Housing Units | 3,759 | 100.0% |
Occupancy by Household Size in Crestline
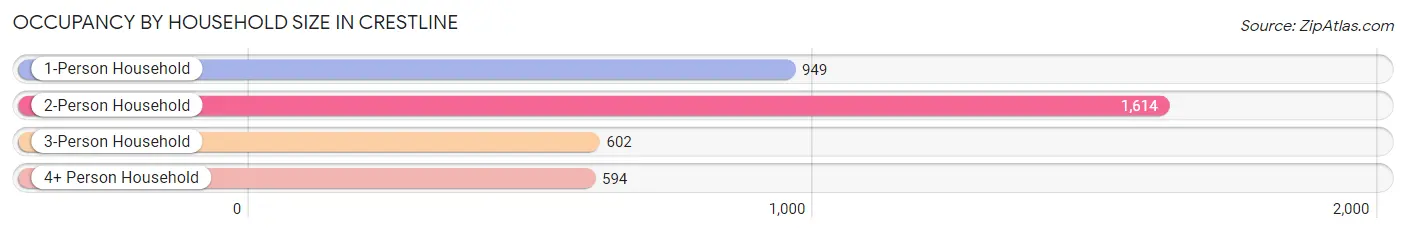
| Household Size | # Housing Units | % Housing Units |
| 1-Person Household | 949 | 25.3% |
| 2-Person Household | 1,614 | 42.9% |
| 3-Person Household | 602 | 16.0% |
| 4+ Person Household | 594 | 15.8% |
| Total Housing Units | 3,759 | 100.0% |
Occupancy by Ownership by Household Size in Crestline
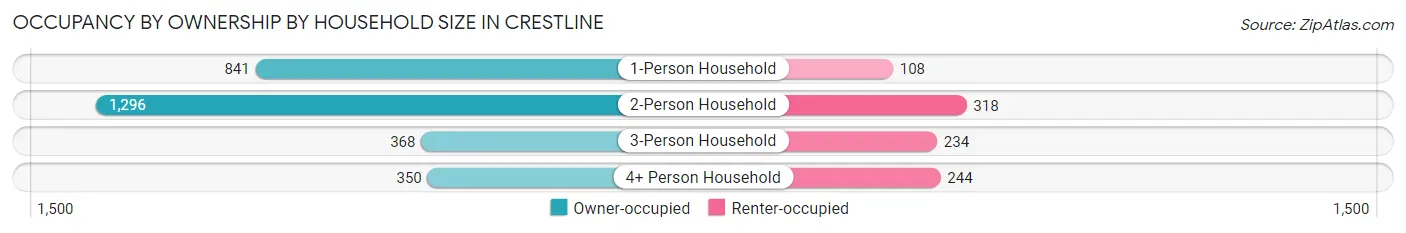
| Household Size | Owner-occupied | Renter-occupied |
| 1-Person Household | 841 (88.6%) | 108 (11.4%) |
| 2-Person Household | 1,296 (80.3%) | 318 (19.7%) |
| 3-Person Household | 368 (61.1%) | 234 (38.9%) |
| 4+ Person Household | 350 (58.9%) | 244 (41.1%) |
| Total Housing Units | 2,855 (75.9%) | 904 (24.0%) |
Occupancy by Educational Attainment in Crestline
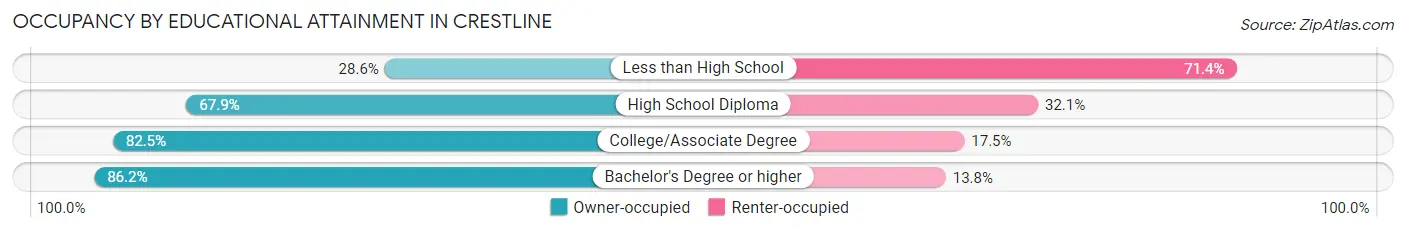
| Household Size | Owner-occupied | Renter-occupied |
| Less than High School | 107 (28.6%) | 267 (71.4%) |
| High School Diploma | 419 (67.9%) | 198 (32.1%) |
| College/Associate Degree | 1,274 (82.5%) | 270 (17.5%) |
| Bachelor's Degree or higher | 1,055 (86.2%) | 169 (13.8%) |
Occupancy by Age of Householder in Crestline
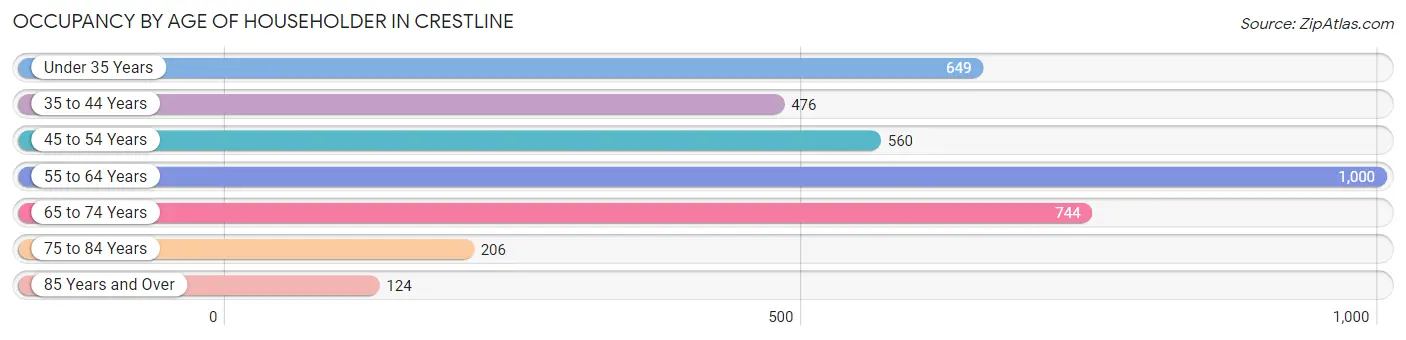
| Age Bracket | # Households | % Households |
| Under 35 Years | 649 | 17.3% |
| 35 to 44 Years | 476 | 12.7% |
| 45 to 54 Years | 560 | 14.9% |
| 55 to 64 Years | 1,000 | 26.6% |
| 65 to 74 Years | 744 | 19.8% |
| 75 to 84 Years | 206 | 5.5% |
| 85 Years and Over | 124 | 3.3% |
| Total | 3,759 | 100.0% |
Housing Finances in Crestline
Median Income by Occupancy in Crestline
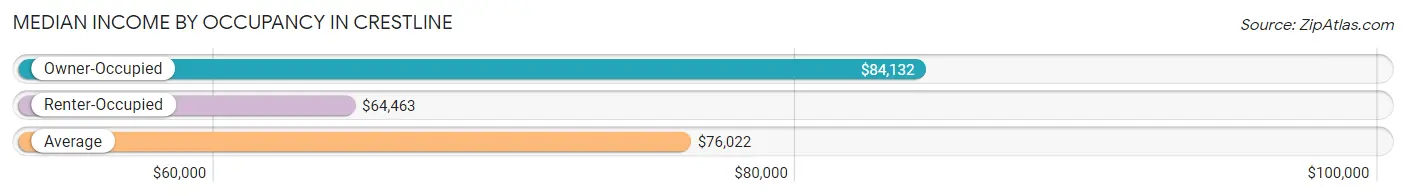
| Occupancy Type | # Households | Median Income |
| Owner-Occupied | 2,855 (75.9%) | $84,132 |
| Renter-Occupied | 904 (24.0%) | $64,463 |
| Average | 3,759 (100.0%) | $76,022 |
Occupancy by Householder Income Bracket in Crestline
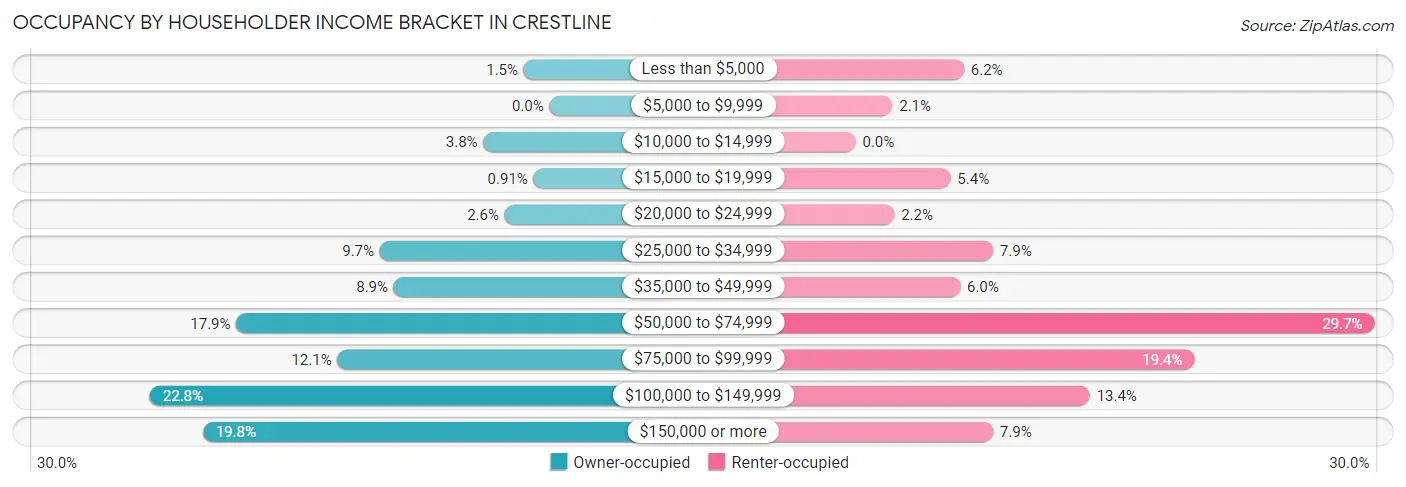
| Income Bracket | Owner-occupied | Renter-occupied |
| Less than $5,000 | 42 (1.5%) | 56 (6.2%) |
| $5,000 to $9,999 | 0 (0.0%) | 19 (2.1%) |
| $10,000 to $14,999 | 108 (3.8%) | 0 (0.0%) |
| $15,000 to $19,999 | 26 (0.9%) | 49 (5.4%) |
| $20,000 to $24,999 | 73 (2.6%) | 20 (2.2%) |
| $25,000 to $34,999 | 277 (9.7%) | 71 (7.9%) |
| $35,000 to $49,999 | 254 (8.9%) | 54 (6.0%) |
| $50,000 to $74,999 | 511 (17.9%) | 268 (29.6%) |
| $75,000 to $99,999 | 346 (12.1%) | 175 (19.4%) |
| $100,000 to $149,999 | 652 (22.8%) | 121 (13.4%) |
| $150,000 or more | 566 (19.8%) | 71 (7.9%) |
| Total | 2,855 (100.0%) | 904 (100.0%) |
Monthly Housing Cost Tiers in Crestline
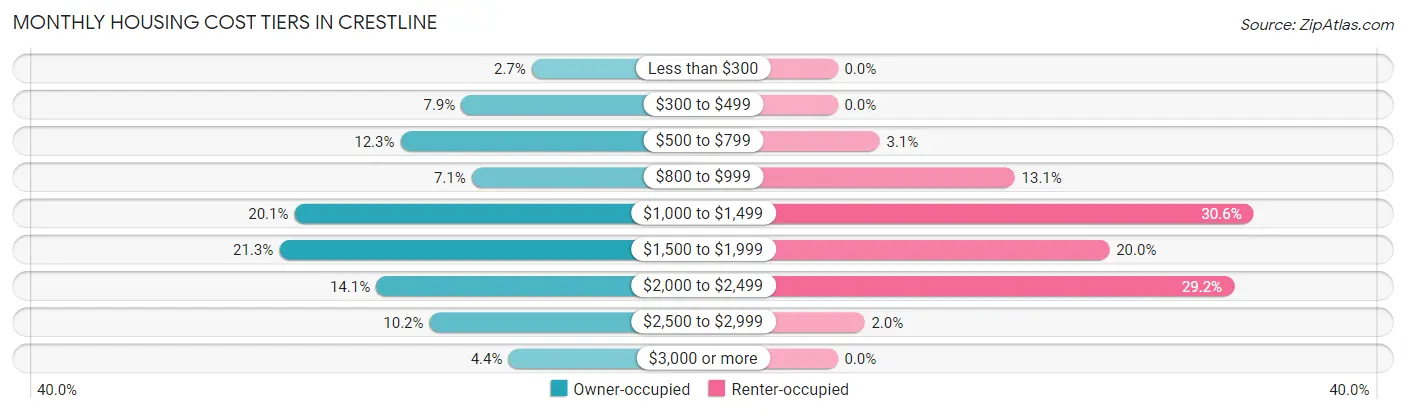
| Monthly Cost | Owner-occupied | Renter-occupied |
| Less than $300 | 76 (2.7%) | 0 (0.0%) |
| $300 to $499 | 224 (7.9%) | 0 (0.0%) |
| $500 to $799 | 352 (12.3%) | 28 (3.1%) |
| $800 to $999 | 202 (7.1%) | 118 (13.1%) |
| $1,000 to $1,499 | 575 (20.1%) | 277 (30.6%) |
| $1,500 to $1,999 | 607 (21.3%) | 181 (20.0%) |
| $2,000 to $2,499 | 403 (14.1%) | 264 (29.2%) |
| $2,500 to $2,999 | 291 (10.2%) | 18 (2.0%) |
| $3,000 or more | 125 (4.4%) | 0 (0.0%) |
| Total | 2,855 (100.0%) | 904 (100.0%) |
Physical Housing Characteristics in Crestline
Housing Structures in Crestline
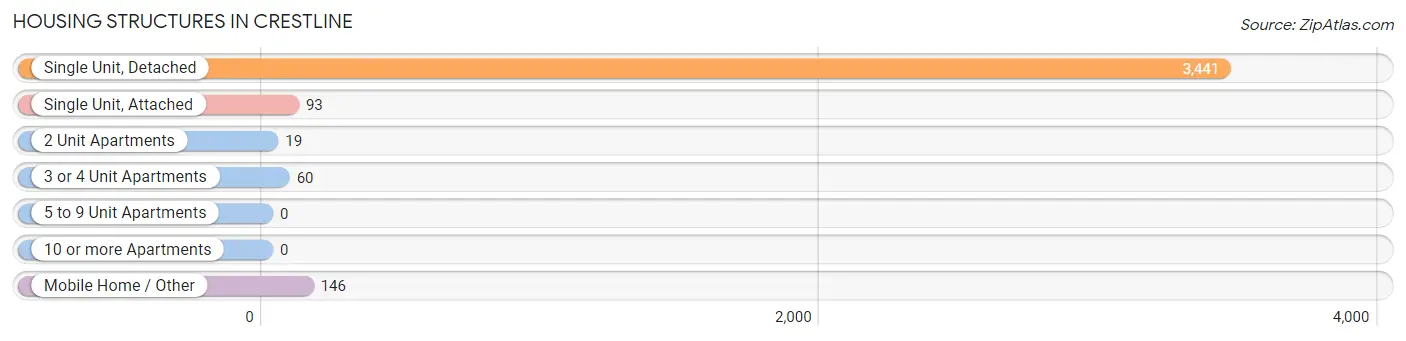
| Structure Type | # Housing Units | % Housing Units |
| Single Unit, Detached | 3,441 | 91.5% |
| Single Unit, Attached | 93 | 2.5% |
| 2 Unit Apartments | 19 | 0.5% |
| 3 or 4 Unit Apartments | 60 | 1.6% |
| 5 to 9 Unit Apartments | 0 | 0.0% |
| 10 or more Apartments | 0 | 0.0% |
| Mobile Home / Other | 146 | 3.9% |
| Total | 3,759 | 100.0% |
Housing Structures by Occupancy in Crestline
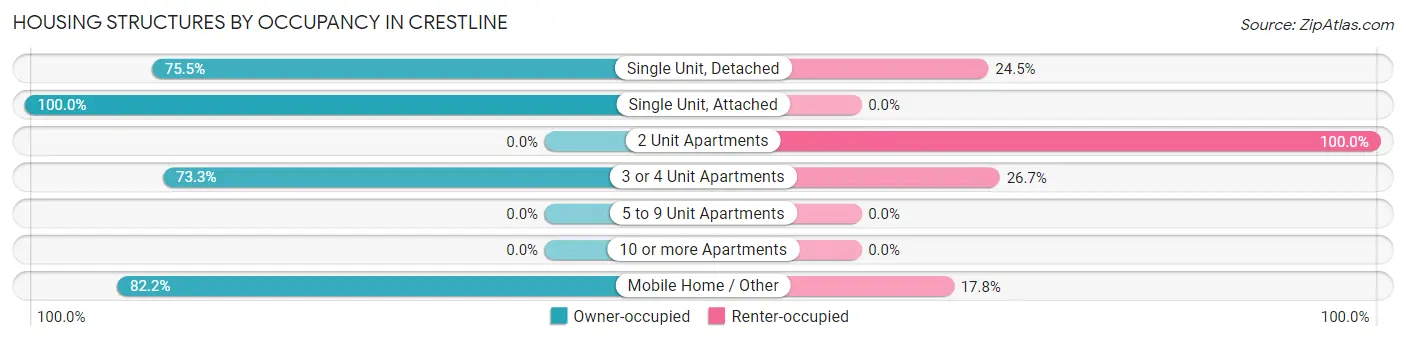
| Structure Type | Owner-occupied | Renter-occupied |
| Single Unit, Detached | 2,598 (75.5%) | 843 (24.5%) |
| Single Unit, Attached | 93 (100.0%) | 0 (0.0%) |
| 2 Unit Apartments | 0 (0.0%) | 19 (100.0%) |
| 3 or 4 Unit Apartments | 44 (73.3%) | 16 (26.7%) |
| 5 to 9 Unit Apartments | 0 (0.0%) | 0 (0.0%) |
| 10 or more Apartments | 0 (0.0%) | 0 (0.0%) |
| Mobile Home / Other | 120 (82.2%) | 26 (17.8%) |
| Total | 2,855 (75.9%) | 904 (24.0%) |
Housing Structures by Number of Rooms in Crestline
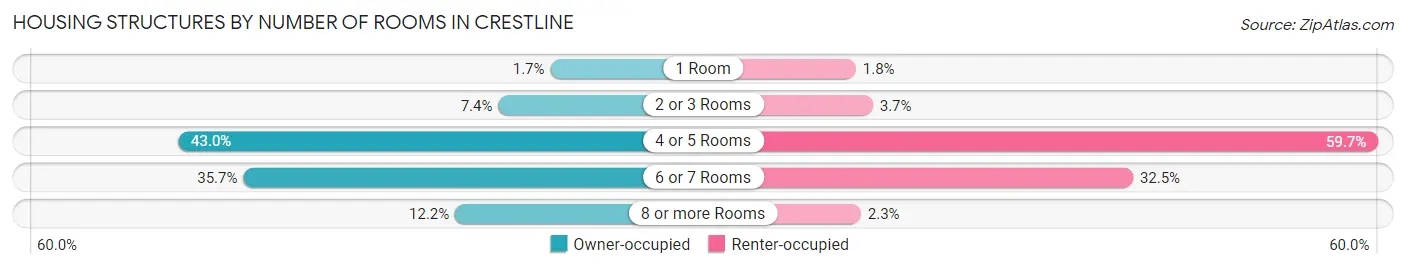
| Number of Rooms | Owner-occupied | Renter-occupied |
| 1 Room | 47 (1.7%) | 16 (1.8%) |
| 2 or 3 Rooms | 212 (7.4%) | 33 (3.6%) |
| 4 or 5 Rooms | 1,227 (43.0%) | 540 (59.7%) |
| 6 or 7 Rooms | 1,020 (35.7%) | 294 (32.5%) |
| 8 or more Rooms | 349 (12.2%) | 21 (2.3%) |
| Total | 2,855 (100.0%) | 904 (100.0%) |
Housing Structure by Heating Type in Crestline
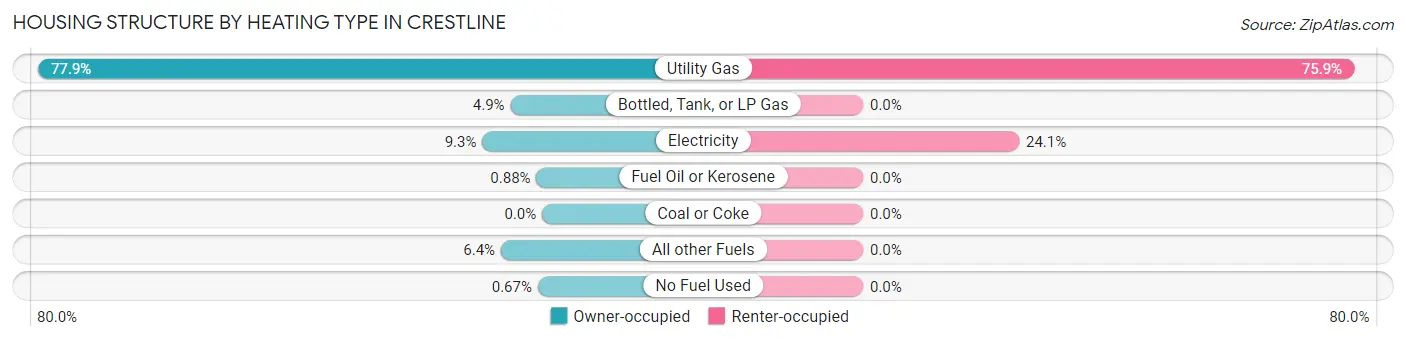
| Heating Type | Owner-occupied | Renter-occupied |
| Utility Gas | 2,225 (77.9%) | 686 (75.9%) |
| Bottled, Tank, or LP Gas | 140 (4.9%) | 0 (0.0%) |
| Electricity | 264 (9.2%) | 218 (24.1%) |
| Fuel Oil or Kerosene | 25 (0.9%) | 0 (0.0%) |
| Coal or Coke | 0 (0.0%) | 0 (0.0%) |
| All other Fuels | 182 (6.4%) | 0 (0.0%) |
| No Fuel Used | 19 (0.7%) | 0 (0.0%) |
| Total | 2,855 (100.0%) | 904 (100.0%) |
Household Vehicle Usage in Crestline
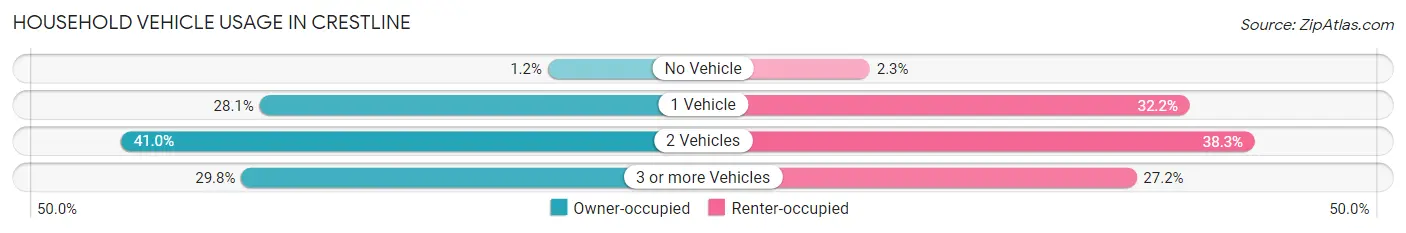
| Vehicles per Household | Owner-occupied | Renter-occupied |
| No Vehicle | 33 (1.2%) | 21 (2.3%) |
| 1 Vehicle | 801 (28.1%) | 291 (32.2%) |
| 2 Vehicles | 1,171 (41.0%) | 346 (38.3%) |
| 3 or more Vehicles | 850 (29.8%) | 246 (27.2%) |
| Total | 2,855 (100.0%) | 904 (100.0%) |
Real Estate & Mortgages in Crestline
Real Estate and Mortgage Overview in Crestline
| Characteristic | Without Mortgage | With Mortgage |
| Housing Units | 905 | 1,950 |
| Median Property Value | $318,300 | $335,700 |
| Median Household Income | $68,520 | $366 |
| Monthly Housing Costs | $612 | $114 |
| Real Estate Taxes | $2,411 | $15 |
Property Value by Mortgage Status in Crestline
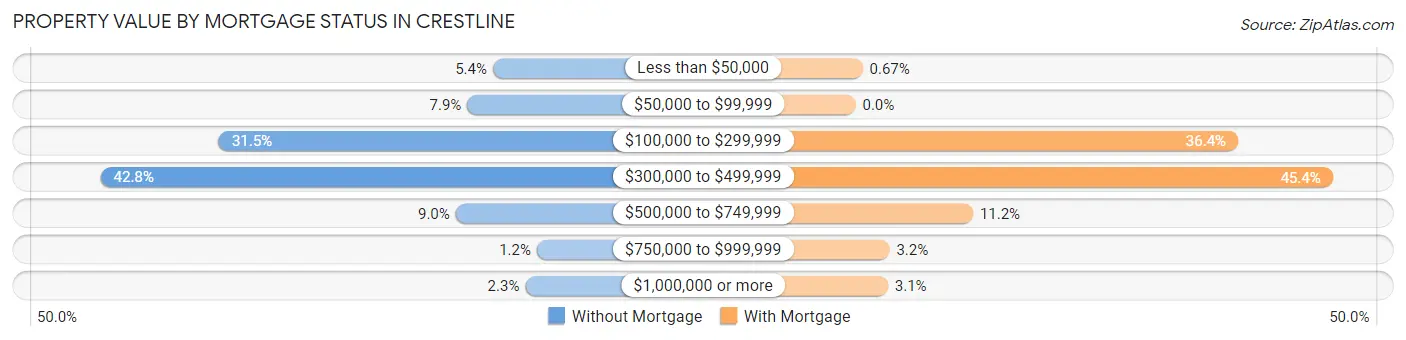
| Property Value | Without Mortgage | With Mortgage |
| Less than $50,000 | 49 (5.4%) | 13 (0.7%) |
| $50,000 to $99,999 | 71 (7.9%) | 0 (0.0%) |
| $100,000 to $299,999 | 285 (31.5%) | 710 (36.4%) |
| $300,000 to $499,999 | 387 (42.8%) | 886 (45.4%) |
| $500,000 to $749,999 | 81 (8.9%) | 218 (11.2%) |
| $750,000 to $999,999 | 11 (1.2%) | 63 (3.2%) |
| $1,000,000 or more | 21 (2.3%) | 60 (3.1%) |
| Total | 905 (100.0%) | 1,950 (100.0%) |
Household Income by Mortgage Status in Crestline
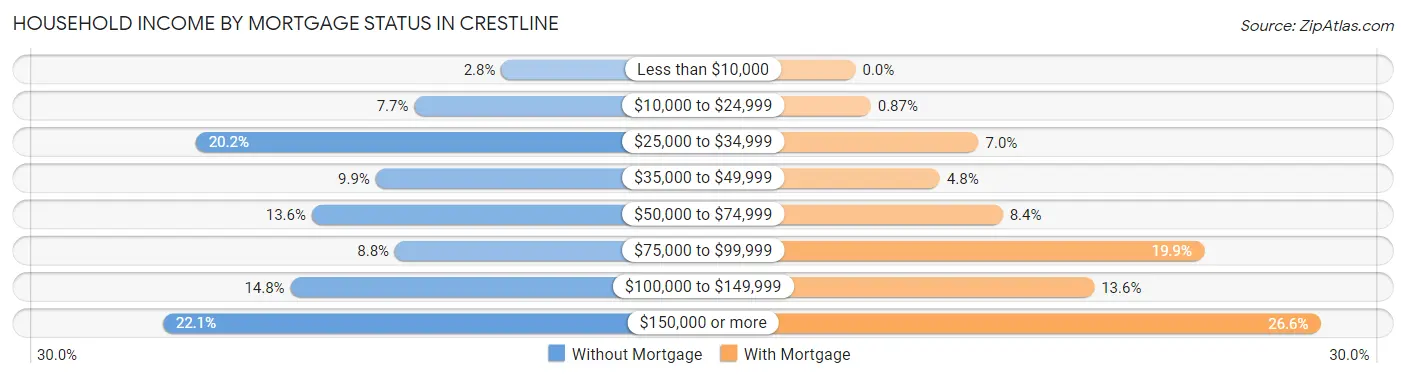
| Household Income | Without Mortgage | With Mortgage |
| Less than $10,000 | 25 (2.8%) | 0 (0.0%) |
| $10,000 to $24,999 | 70 (7.7%) | 17 (0.9%) |
| $25,000 to $34,999 | 183 (20.2%) | 137 (7.0%) |
| $35,000 to $49,999 | 90 (9.9%) | 94 (4.8%) |
| $50,000 to $74,999 | 123 (13.6%) | 164 (8.4%) |
| $75,000 to $99,999 | 80 (8.8%) | 388 (19.9%) |
| $100,000 to $149,999 | 134 (14.8%) | 266 (13.6%) |
| $150,000 or more | 200 (22.1%) | 518 (26.6%) |
| Total | 905 (100.0%) | 1,950 (100.0%) |
Property Value to Household Income Ratio in Crestline
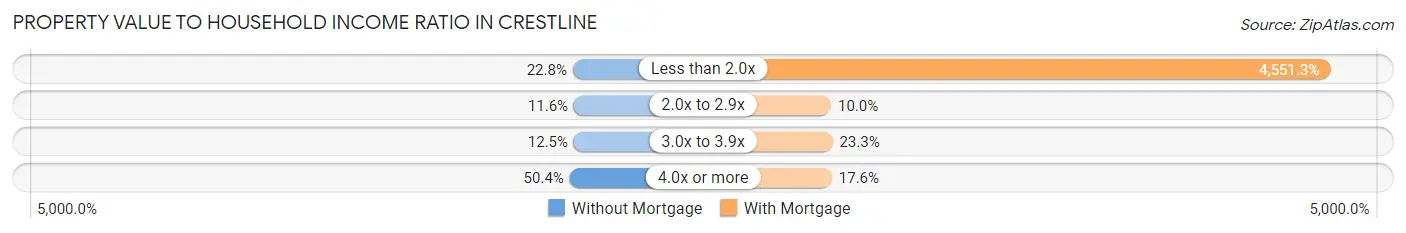
| Value-to-Income Ratio | Without Mortgage | With Mortgage |
| Less than 2.0x | 206 (22.8%) | 88,750 (4,551.3%) |
| 2.0x to 2.9x | 105 (11.6%) | 195 (10.0%) |
| 3.0x to 3.9x | 113 (12.5%) | 455 (23.3%) |
| 4.0x or more | 456 (50.4%) | 343 (17.6%) |
| Total | 905 (100.0%) | 1,950 (100.0%) |
Real Estate Taxes by Mortgage Status in Crestline
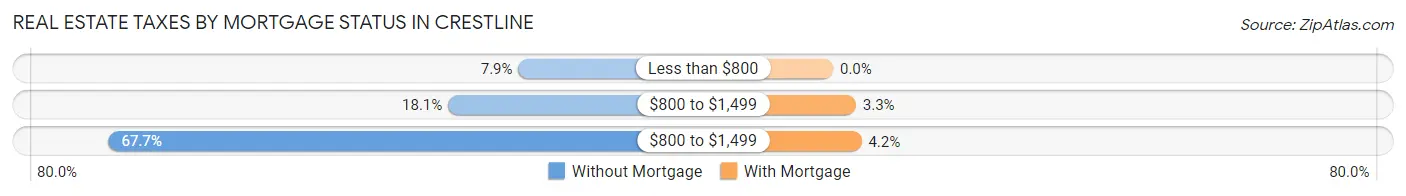
| Property Taxes | Without Mortgage | With Mortgage |
| Less than $800 | 71 (7.9%) | 0 (0.0%) |
| $800 to $1,499 | 164 (18.1%) | 65 (3.3%) |
| $800 to $1,499 | 613 (67.7%) | 81 (4.2%) |
| Total | 905 (100.0%) | 1,950 (100.0%) |
Health & Disability in Crestline
Health Insurance Coverage by Age in Crestline
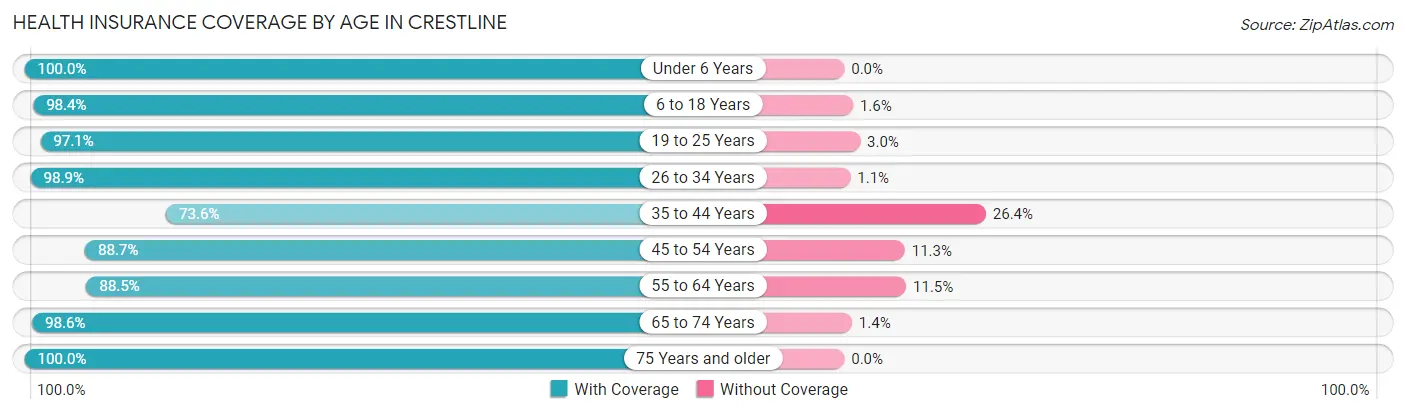
| Age Bracket | With Coverage | Without Coverage |
| Under 6 Years | 642 (100.0%) | 0 (0.0%) |
| 6 to 18 Years | 1,162 (98.4%) | 19 (1.6%) |
| 19 to 25 Years | 659 (97.1%) | 20 (2.9%) |
| 26 to 34 Years | 1,141 (98.9%) | 13 (1.1%) |
| 35 to 44 Years | 800 (73.6%) | 287 (26.4%) |
| 45 to 54 Years | 1,085 (88.7%) | 138 (11.3%) |
| 55 to 64 Years | 1,373 (88.5%) | 179 (11.5%) |
| 65 to 74 Years | 1,180 (98.6%) | 17 (1.4%) |
| 75 Years and older | 603 (100.0%) | 0 (0.0%) |
| Total | 8,645 (92.8%) | 673 (7.2%) |
Health Insurance Coverage by Citizenship Status in Crestline
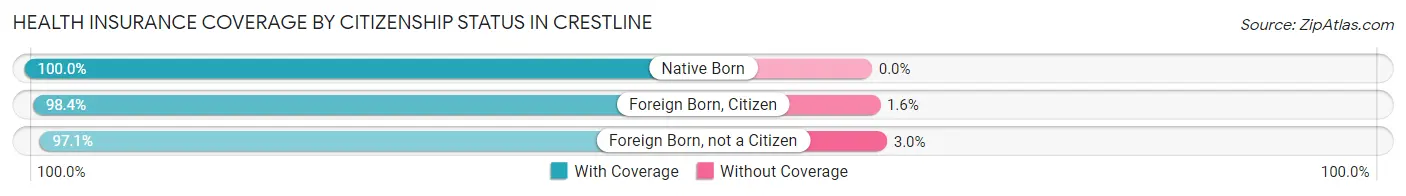
| Citizenship Status | With Coverage | Without Coverage |
| Native Born | 642 (100.0%) | 0 (0.0%) |
| Foreign Born, Citizen | 1,162 (98.4%) | 19 (1.6%) |
| Foreign Born, not a Citizen | 659 (97.1%) | 20 (2.9%) |
Health Insurance Coverage by Household Income in Crestline
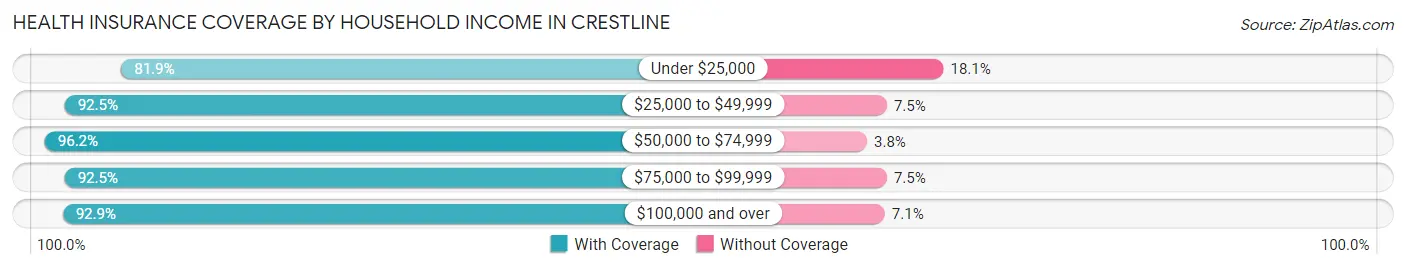
| Household Income | With Coverage | Without Coverage |
| Under $25,000 | 533 (81.9%) | 118 (18.1%) |
| $25,000 to $49,999 | 1,031 (92.5%) | 84 (7.5%) |
| $50,000 to $74,999 | 2,052 (96.2%) | 81 (3.8%) |
| $75,000 to $99,999 | 1,415 (92.5%) | 115 (7.5%) |
| $100,000 and over | 3,574 (92.9%) | 275 (7.1%) |
Public vs Private Health Insurance Coverage by Age in Crestline
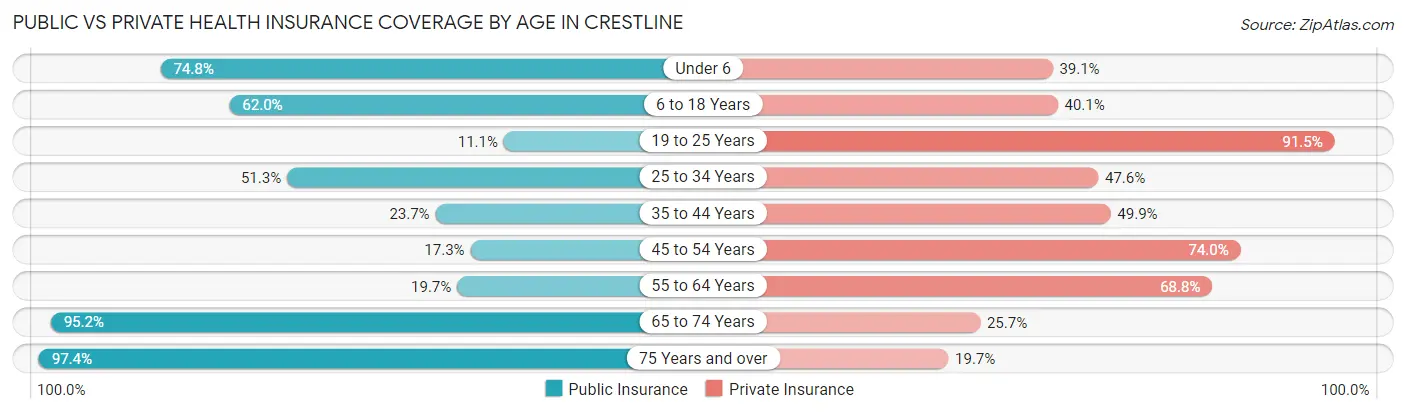
| Age Bracket | Public Insurance | Private Insurance |
| Under 6 | 480 (74.8%) | 251 (39.1%) |
| 6 to 18 Years | 732 (62.0%) | 473 (40.1%) |
| 19 to 25 Years | 75 (11.1%) | 621 (91.5%) |
| 25 to 34 Years | 592 (51.3%) | 549 (47.6%) |
| 35 to 44 Years | 258 (23.7%) | 542 (49.9%) |
| 45 to 54 Years | 211 (17.2%) | 905 (74.0%) |
| 55 to 64 Years | 306 (19.7%) | 1,067 (68.8%) |
| 65 to 74 Years | 1,139 (95.2%) | 307 (25.7%) |
| 75 Years and over | 587 (97.4%) | 119 (19.7%) |
| Total | 4,380 (47.0%) | 4,834 (51.9%) |
Disability Status by Sex by Age in Crestline
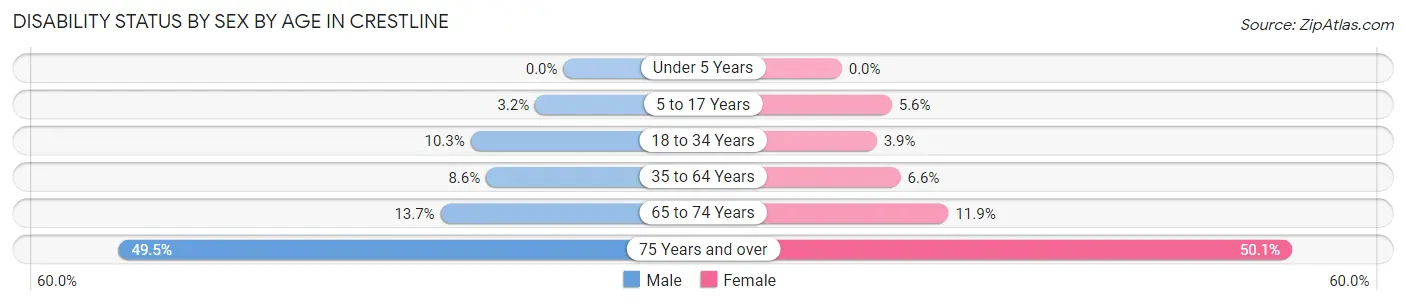
| Age Bracket | Male | Female |
| Under 5 Years | 0 (0.0%) | 0 (0.0%) |
| 5 to 17 Years | 21 (3.2%) | 29 (5.6%) |
| 18 to 34 Years | 97 (10.3%) | 39 (3.9%) |
| 35 to 64 Years | 176 (8.6%) | 119 (6.6%) |
| 65 to 74 Years | 59 (13.7%) | 91 (11.9%) |
| 75 Years and over | 106 (49.5%) | 195 (50.1%) |
Disability Class by Sex by Age in Crestline
Disability Class: Hearing Difficulty
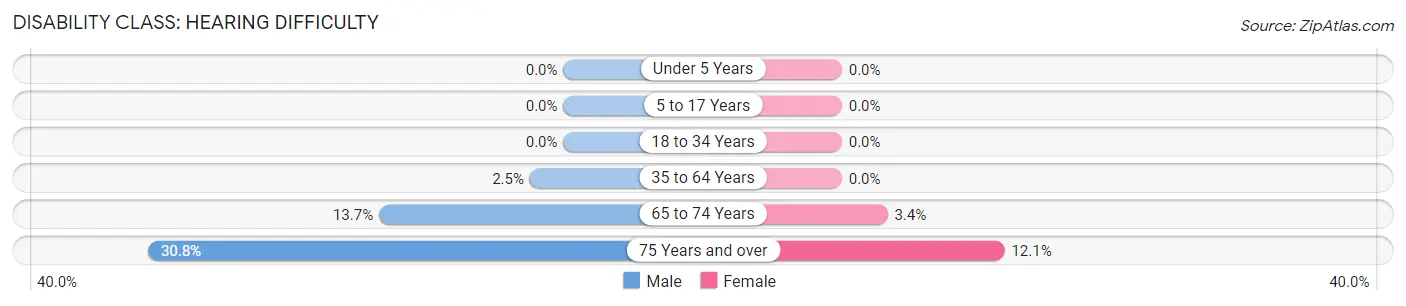
| Age Bracket | Male | Female |
| Under 5 Years | 0 (0.0%) | 0 (0.0%) |
| 5 to 17 Years | 0 (0.0%) | 0 (0.0%) |
| 18 to 34 Years | 0 (0.0%) | 0 (0.0%) |
| 35 to 64 Years | 51 (2.5%) | 0 (0.0%) |
| 65 to 74 Years | 59 (13.7%) | 26 (3.4%) |
| 75 Years and over | 66 (30.8%) | 47 (12.1%) |
Disability Class: Vision Difficulty
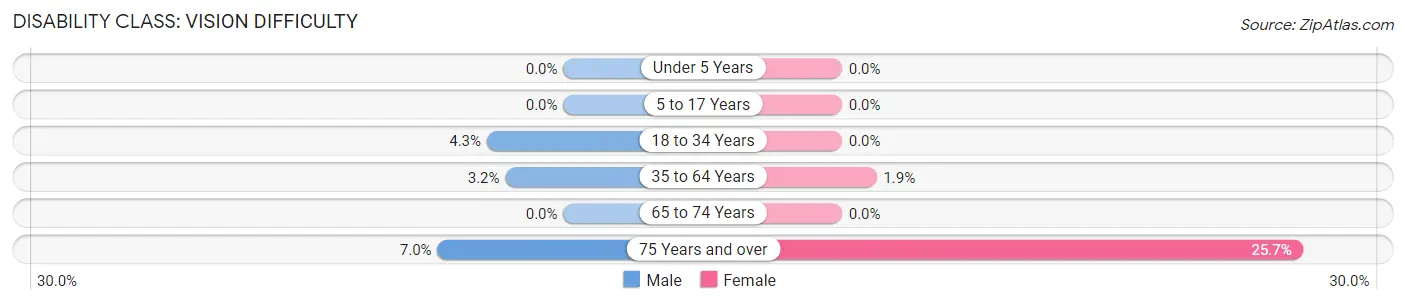
| Age Bracket | Male | Female |
| Under 5 Years | 0 (0.0%) | 0 (0.0%) |
| 5 to 17 Years | 0 (0.0%) | 0 (0.0%) |
| 18 to 34 Years | 40 (4.3%) | 0 (0.0%) |
| 35 to 64 Years | 66 (3.2%) | 35 (1.9%) |
| 65 to 74 Years | 0 (0.0%) | 0 (0.0%) |
| 75 Years and over | 15 (7.0%) | 100 (25.7%) |
Disability Class: Cognitive Difficulty
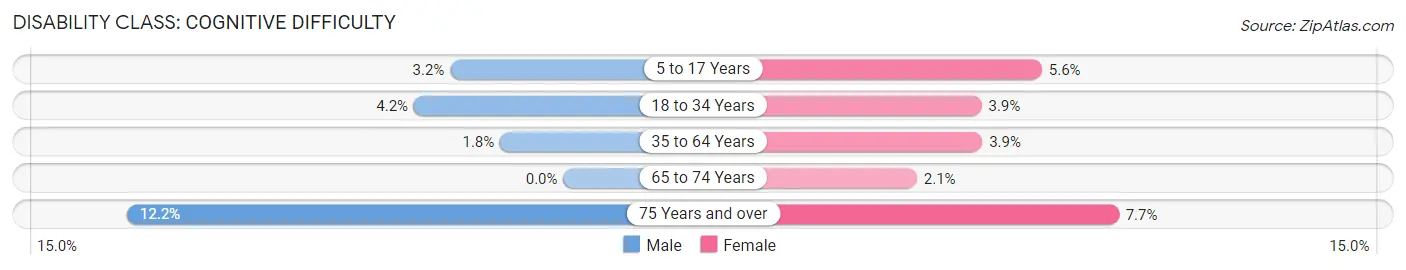
| Age Bracket | Male | Female |
| 5 to 17 Years | 21 (3.2%) | 29 (5.6%) |
| 18 to 34 Years | 39 (4.2%) | 39 (3.9%) |
| 35 to 64 Years | 36 (1.8%) | 71 (3.9%) |
| 65 to 74 Years | 0 (0.0%) | 16 (2.1%) |
| 75 Years and over | 26 (12.1%) | 30 (7.7%) |
Disability Class: Ambulatory Difficulty
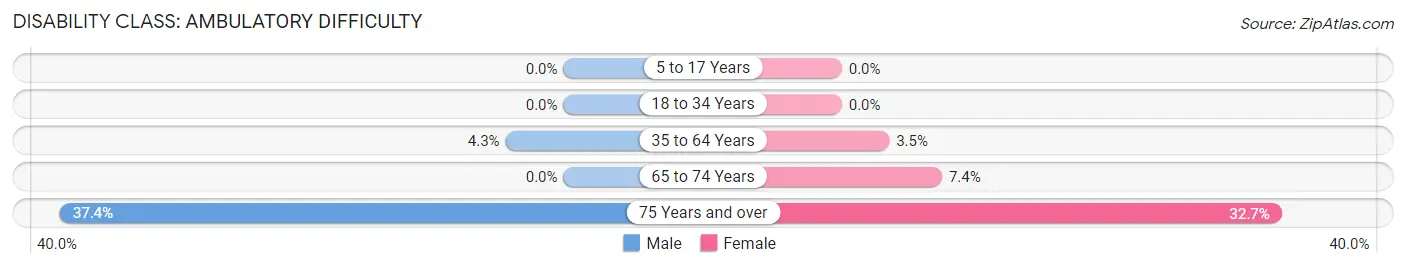
| Age Bracket | Male | Female |
| 5 to 17 Years | 0 (0.0%) | 0 (0.0%) |
| 18 to 34 Years | 0 (0.0%) | 0 (0.0%) |
| 35 to 64 Years | 88 (4.3%) | 64 (3.5%) |
| 65 to 74 Years | 0 (0.0%) | 57 (7.4%) |
| 75 Years and over | 80 (37.4%) | 127 (32.7%) |
Disability Class: Self-Care Difficulty
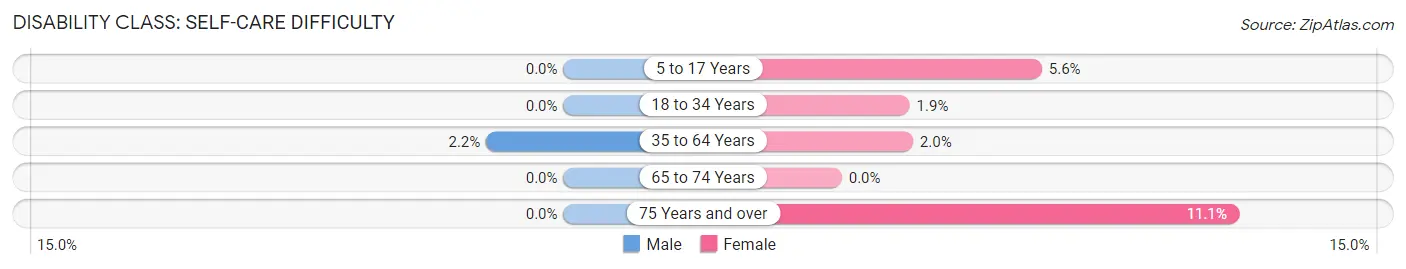
| Age Bracket | Male | Female |
| 5 to 17 Years | 0 (0.0%) | 29 (5.6%) |
| 18 to 34 Years | 0 (0.0%) | 19 (1.9%) |
| 35 to 64 Years | 44 (2.1%) | 36 (2.0%) |
| 65 to 74 Years | 0 (0.0%) | 0 (0.0%) |
| 75 Years and over | 0 (0.0%) | 43 (11.1%) |
Technology Access in Crestline
Computing Device Access in Crestline
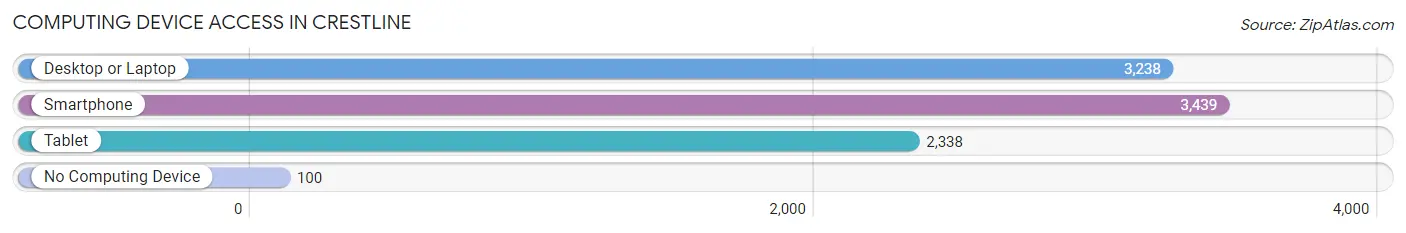
| Device Type | # Households | % Households |
| Desktop or Laptop | 3,238 | 86.1% |
| Smartphone | 3,439 | 91.5% |
| Tablet | 2,338 | 62.2% |
| No Computing Device | 100 | 2.7% |
| Total | 3,759 | 100.0% |
Internet Access in Crestline
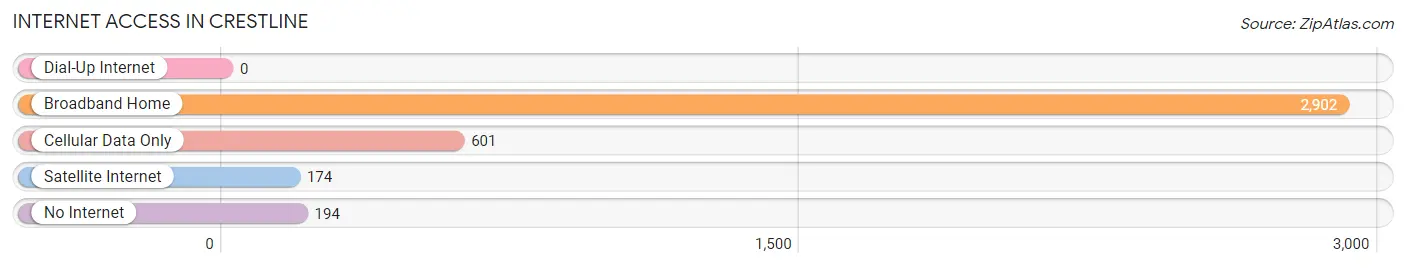
| Internet Type | # Households | % Households |
| Dial-Up Internet | 0 | 0.0% |
| Broadband Home | 2,902 | 77.2% |
| Cellular Data Only | 601 | 16.0% |
| Satellite Internet | 174 | 4.6% |
| No Internet | 194 | 5.2% |
| Total | 3,759 | 100.0% |
Crestline Summary
Crestline is a small mountain community located in the San Bernardino Mountains of Southern California. It is situated at an elevation of 5,096 feet and is part of the San Bernardino National Forest. The town is located in San Bernardino County and is approximately 60 miles east of Los Angeles.
Geography
Crestline is located in the San Bernardino Mountains of Southern California. It is situated at an elevation of 5,096 feet and is part of the San Bernardino National Forest. The town is located in San Bernardino County and is approximately 60 miles east of Los Angeles. The town is surrounded by the San Bernardino National Forest and is home to several lakes, including Lake Gregory, Lake Arrowhead, and Lake Silverwood. The area is known for its beautiful scenery and is a popular destination for outdoor activities such as hiking, camping, fishing, and skiing.
History
Crestline was originally inhabited by the Serrano Indians, who were the first people to settle in the area. The town was founded in 1891 by a group of settlers from the Midwest who were looking for a place to homestead. The town was named after the nearby mountain peak, which was known as “Crestline”. The town grew quickly and by the early 1900s, it had become a popular tourist destination. The town was also home to several resorts, including the Crestline Hotel, which was built in 1906.
In the 1920s, the town began to experience a decline in tourism due to the Great Depression. However, the town was able to survive and eventually began to experience a resurgence in the 1950s. The town was also home to several ski resorts, which helped to attract more visitors to the area.
Economy
Crestline’s economy is largely based on tourism. The town is home to several resorts, including the Crestline Hotel, which was built in 1906. The town is also home to several ski resorts, which attract visitors from all over the world. The town is also home to several restaurants, shops, and other businesses that cater to tourists.
The town is also home to several logging companies, which provide jobs for many of the town’s residents. The town is also home to several small businesses, such as auto repair shops, hardware stores, and other retail stores.
Demographics
As of the 2010 census, the population of Crestline was 8,719. The racial makeup of the town was 87.3% White, 0.7% African American, 0.7% Native American, 0.7% Asian, 0.1% Pacific Islander, 8.2% from other races, and 2.3% from two or more races. The median household income was $41,944 and the median family income was $50,944. The per capita income was $20,944.
Conclusion
Crestline is a small mountain community located in the San Bernardino Mountains of Southern California. It is situated at an elevation of 5,096 feet and is part of the San Bernardino National Forest. The town is located in San Bernardino County and is approximately 60 miles east of Los Angeles. The town is surrounded by the San Bernardino National Forest and is home to several lakes, including Lake Gregory, Lake Arrowhead, and Lake Silverwood. The area is known for its beautiful scenery and is a popular destination for outdoor activities such as hiking, camping, fishing, and skiing. The town’s economy is largely based on tourism and it is home to several resorts, restaurants, shops, and other businesses that cater to tourists. The population of Crestline was 8,719 as of the 2010 census. The racial makeup of the town was 87.3% White, 0.7% African American, 0.7% Native American, 0.7% Asian, 0.1% Pacific Islander, 8.2% from other races, and 2.3% from two or more races. The median household income was $41,944 and the median family income was $50,944. The per capita income was $20,944.
Common Questions
What is Per Capita Income in Crestline?
Per Capita income in Crestline is $38,069.
What is the Median Family Income in Crestline?
Median Family Income in Crestline is $83,472.
What is the Median Household income in Crestline?
Median Household Income in Crestline is $76,022.
What is Income or Wage Gap in Crestline?
Income or Wage Gap in Crestline is 32.2%.
Women in Crestline earn 67.8 cents for every dollar earned by a man.
What is Inequality or Gini Index in Crestline?
Inequality or Gini Index in Crestline is 0.37.
What is the Total Population of Crestline?
Total Population of Crestline is 9,335.
What is the Total Male Population of Crestline?
Total Male Population of Crestline is 4,486.
What is the Total Female Population of Crestline?
Total Female Population of Crestline is 4,849.
What is the Ratio of Males per 100 Females in Crestline?
There are 92.51 Males per 100 Females in Crestline.
What is the Ratio of Females per 100 Males in Crestline?
There are 108.09 Females per 100 Males in Crestline.
What is the Median Population Age in Crestline?
Median Population Age in Crestline is 44.6 Years.
What is the Average Family Size in Crestline
Average Family Size in Crestline is 3.0 People.
What is the Average Household Size in Crestline
Average Household Size in Crestline is 2.5 People.
How Large is the Labor Force in Crestline?
There are 4,581 People in the Labor Forcein in Crestline.
What is the Percentage of People in the Labor Force in Crestline?
59.6% of People are in the Labor Force in Crestline.
What is the Unemployment Rate in Crestline?
Unemployment Rate in Crestline is 5.5%.