Cressey, CA Map & Demographics
Cressey Map
Cressey Overview
$25,719
PER CAPITA INCOME
$88,438
AVG FAMILY INCOME
$74,875
AVG HOUSEHOLD INCOME
0.41
INEQUALITY / GINI INDEX
360
TOTAL POPULATION
188
MALE POPULATION
172
FEMALE POPULATION
109.30
MALES / 100 FEMALES
91.49
FEMALES / 100 MALES
32.8
MEDIAN AGE
3.8
AVG FAMILY SIZE
3.5
AVG HOUSEHOLD SIZE
135
LABOR FORCE [ PEOPLE ]
49.8%
PERCENT IN LABOR FORCE
5.3%
UNEMPLOYMENT RATE
Cressey Zip Codes
Cressey Area Codes
Income in Cressey
Income Overview in Cressey
Per Capita Income in Cressey is $25,719, while median incomes of families and households are $88,438 and $74,875 respectively.
| Characteristic | Number | Measure |
| Per Capita Income | 360 | $25,719 |
| Median Family Income | 76 | $88,438 |
| Mean Family Income | 76 | $111,888 |
| Median Household Income | 103 | $74,875 |
| Mean Household Income | 103 | $92,486 |
| Income Deficit | 76 | $0 |
| Wage / Income Gap (%) | 360 | 0.00% |
| Wage / Income Gap ($) | 360 | 100.00¢ per $1 |
| Gini / Inequality Index | 360 | 0.41 |
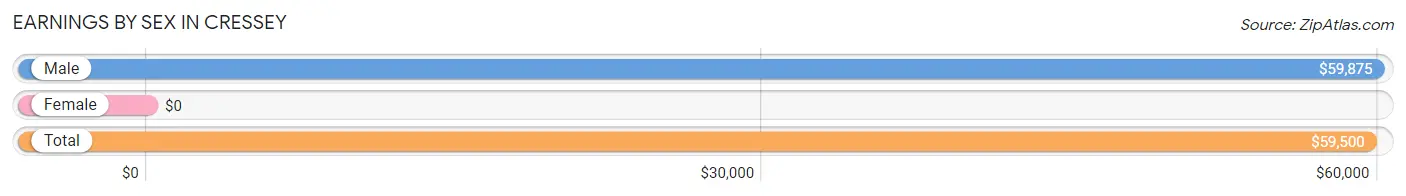
Earnings by Sex in Cressey
| Sex | Number | Average Earnings |
| Male | 83 (62.9%) | $59,875 |
| Female | 49 (37.1%) | $0 |
| Total | 132 (100.0%) | $59,500 |
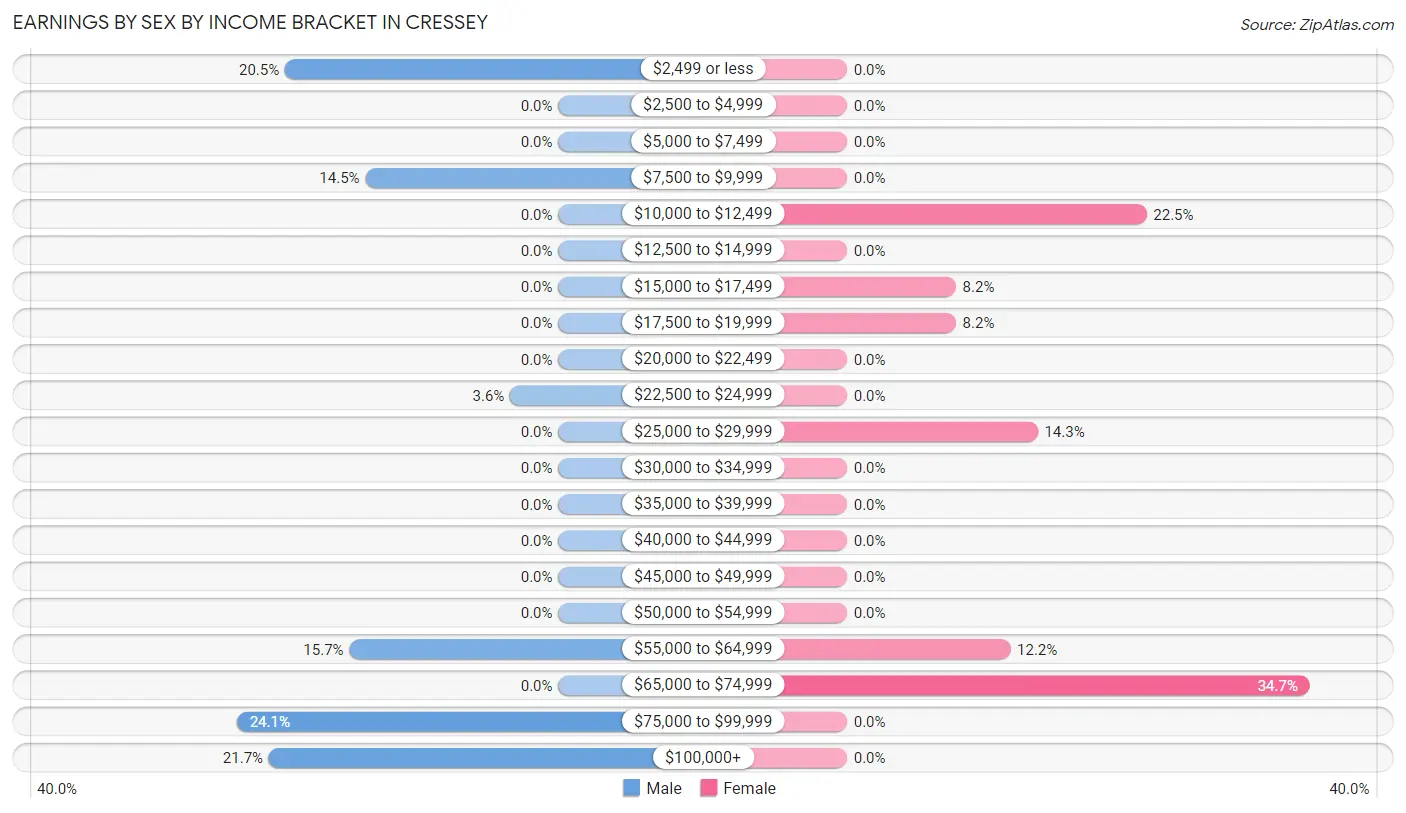
Earnings by Sex by Income Bracket in Cressey
The most common earnings brackets in Cressey are $75,000 to $99,999 for men (20 | 24.1%) and $65,000 to $74,999 for women (17 | 34.7%).
| Income | Male | Female |
| $2,499 or less | 17 (20.5%) | 0 (0.0%) |
| $2,500 to $4,999 | 0 (0.0%) | 0 (0.0%) |
| $5,000 to $7,499 | 0 (0.0%) | 0 (0.0%) |
| $7,500 to $9,999 | 12 (14.5%) | 0 (0.0%) |
| $10,000 to $12,499 | 0 (0.0%) | 11 (22.5%) |
| $12,500 to $14,999 | 0 (0.0%) | 0 (0.0%) |
| $15,000 to $17,499 | 0 (0.0%) | 4 (8.2%) |
| $17,500 to $19,999 | 0 (0.0%) | 4 (8.2%) |
| $20,000 to $22,499 | 0 (0.0%) | 0 (0.0%) |
| $22,500 to $24,999 | 3 (3.6%) | 0 (0.0%) |
| $25,000 to $29,999 | 0 (0.0%) | 7 (14.3%) |
| $30,000 to $34,999 | 0 (0.0%) | 0 (0.0%) |
| $35,000 to $39,999 | 0 (0.0%) | 0 (0.0%) |
| $40,000 to $44,999 | 0 (0.0%) | 0 (0.0%) |
| $45,000 to $49,999 | 0 (0.0%) | 0 (0.0%) |
| $50,000 to $54,999 | 0 (0.0%) | 0 (0.0%) |
| $55,000 to $64,999 | 13 (15.7%) | 6 (12.2%) |
| $65,000 to $74,999 | 0 (0.0%) | 17 (34.7%) |
| $75,000 to $99,999 | 20 (24.1%) | 0 (0.0%) |
| $100,000+ | 18 (21.7%) | 0 (0.0%) |
| Total | 83 (100.0%) | 49 (100.0%) |
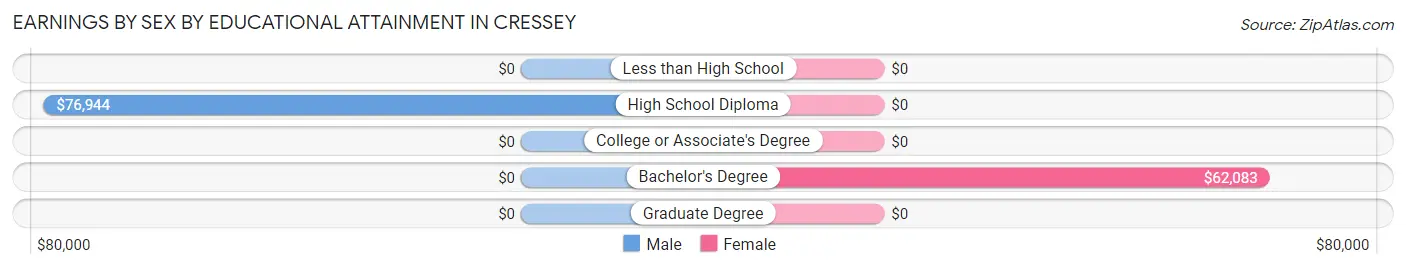
Earnings by Sex by Educational Attainment in Cressey
| Educational Attainment | Male Income | Female Income |
| Less than High School | - | - |
| High School Diploma | $76,944 | $0 |
| College or Associate's Degree | - | - |
| Bachelor's Degree | - | - |
| Graduate Degree | - | - |
| Total | $75,833 | $0 |
Family Income in Cressey
Family Income Brackets in Cressey
According to the Cressey family income data, there are 23 families falling into the $75,000 to $99,999 income range, which is the most common income bracket and makes up 30.3% of all families.
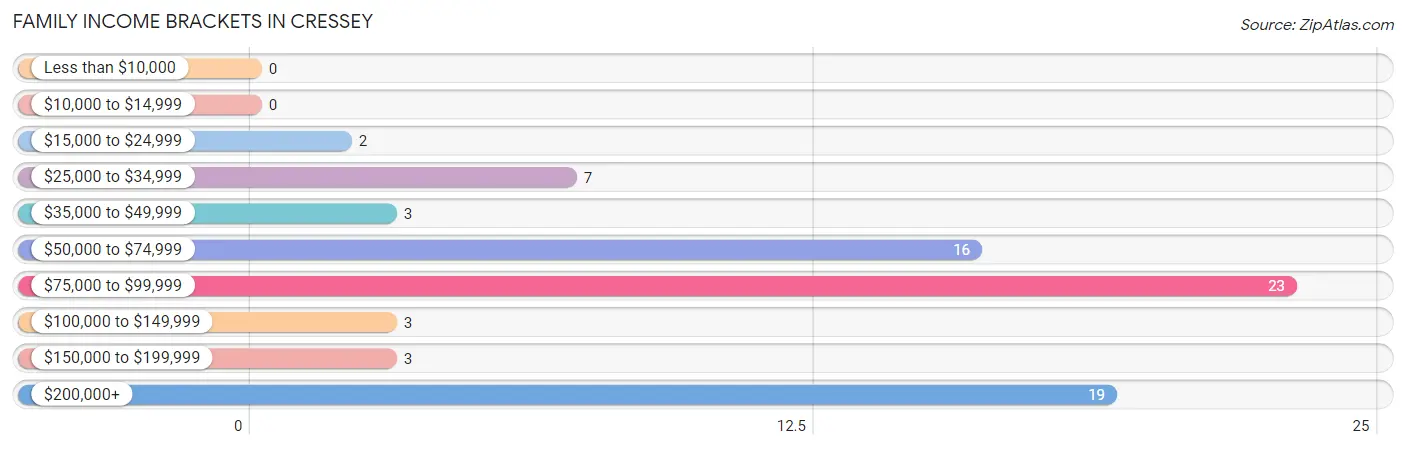
| Income Bracket | # Families | % Families |
| Less than $10,000 | 0 | 0.0% |
| $10,000 to $14,999 | 0 | 0.0% |
| $15,000 to $24,999 | 2 | 2.6% |
| $25,000 to $34,999 | 7 | 9.2% |
| $35,000 to $49,999 | 3 | 3.9% |
| $50,000 to $74,999 | 16 | 21.1% |
| $75,000 to $99,999 | 23 | 30.3% |
| $100,000 to $149,999 | 3 | 3.9% |
| $150,000 to $199,999 | 3 | 3.9% |
| $200,000+ | 19 | 25.0% |
Family Income by Famaliy Size in Cressey
4-person families (22 | 28.9%) account for the highest median family income in Cressey with $89,219 per family, while 4-person families (22 | 28.9%) have the highest median income of $22,305 per family member.
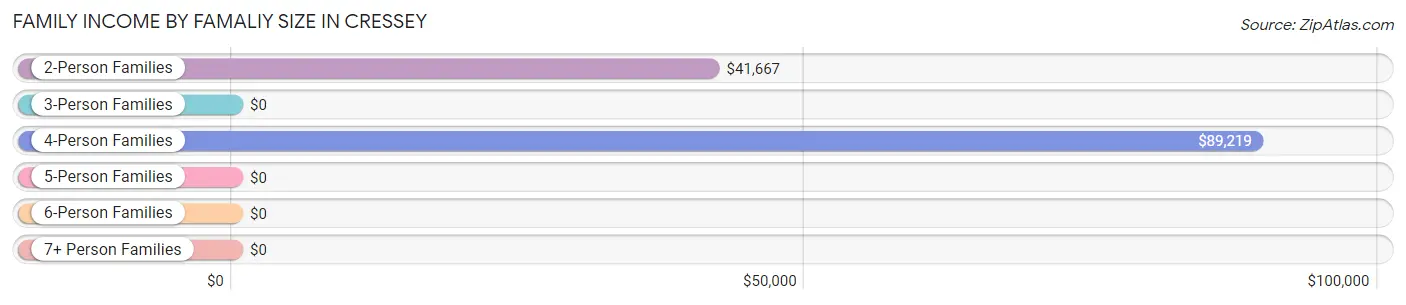
| Income Bracket | # Families | Median Income |
| 2-Person Families | 22 (28.9%) | $41,667 |
| 3-Person Families | 7 (9.2%) | $0 |
| 4-Person Families | 22 (28.9%) | $89,219 |
| 5-Person Families | 10 (13.2%) | $0 |
| 6-Person Families | 15 (19.7%) | $0 |
| 7+ Person Families | 0 (0.0%) | $0 |
| Total | 76 (100.0%) | $88,438 |
Family Income by Number of Earners in Cressey
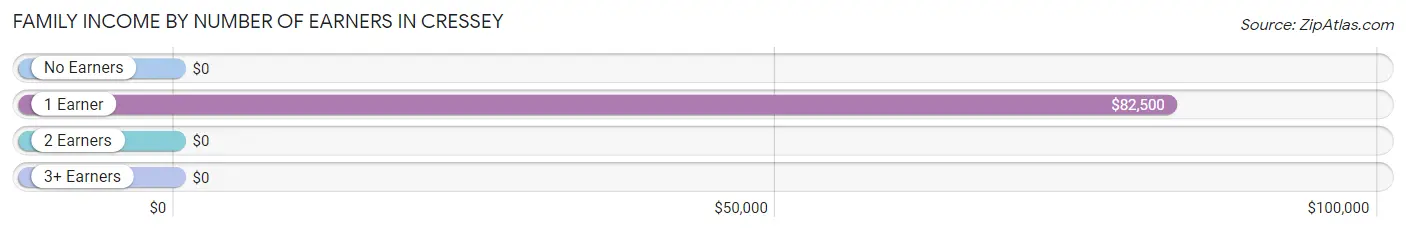
| Number of Earners | # Families | Median Income |
| No Earners | 9 (11.8%) | $0 |
| 1 Earner | 38 (50.0%) | $82,500 |
| 2 Earners | 14 (18.4%) | $0 |
| 3+ Earners | 15 (19.7%) | $0 |
| Total | 76 (100.0%) | $88,438 |
Household Income in Cressey
Household Income Brackets in Cressey
With 26 households falling in the category, the $75,000 to $99,999 income range is the most frequent in Cressey, accounting for 25.2% of all households.
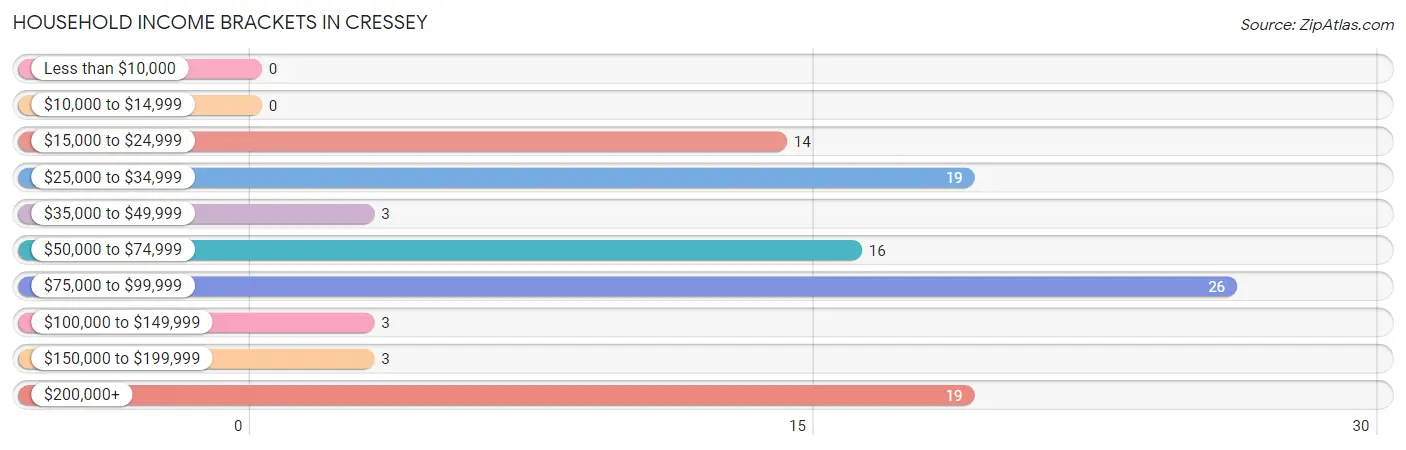
| Income Bracket | # Households | % Households |
| Less than $10,000 | 0 | 0.0% |
| $10,000 to $14,999 | 0 | 0.0% |
| $15,000 to $24,999 | 14 | 13.6% |
| $25,000 to $34,999 | 19 | 18.4% |
| $35,000 to $49,999 | 3 | 2.9% |
| $50,000 to $74,999 | 16 | 15.5% |
| $75,000 to $99,999 | 26 | 25.2% |
| $100,000 to $149,999 | 3 | 2.9% |
| $150,000 to $199,999 | 3 | 2.9% |
| $200,000+ | 19 | 18.4% |
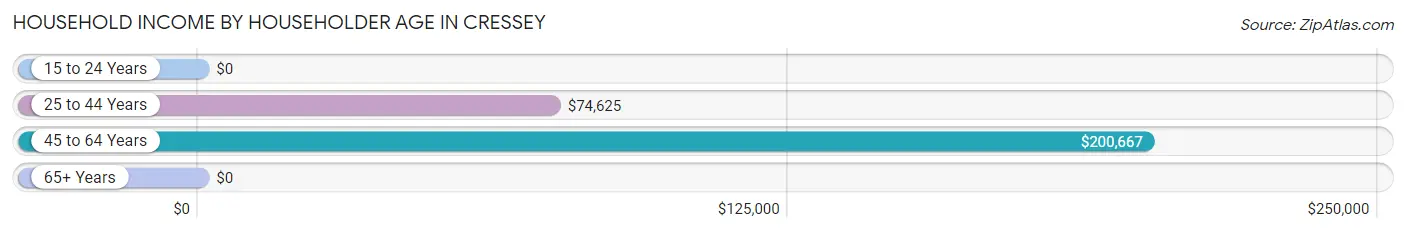
Household Income by Householder Age in Cressey
The median household income in Cressey is $74,875, with the highest median household income of $200,667 found in the 45 to 64 years age bracket for the primary householder. A total of 30 households (29.1%) fall into this category.
| Income Bracket | # Households | Median Income |
| 15 to 24 Years | 0 (0.0%) | $0 |
| 25 to 44 Years | 41 (39.8%) | $74,625 |
| 45 to 64 Years | 30 (29.1%) | $200,667 |
| 65+ Years | 32 (31.1%) | $0 |
| Total | 103 (100.0%) | $74,875 |
Poverty in Cressey
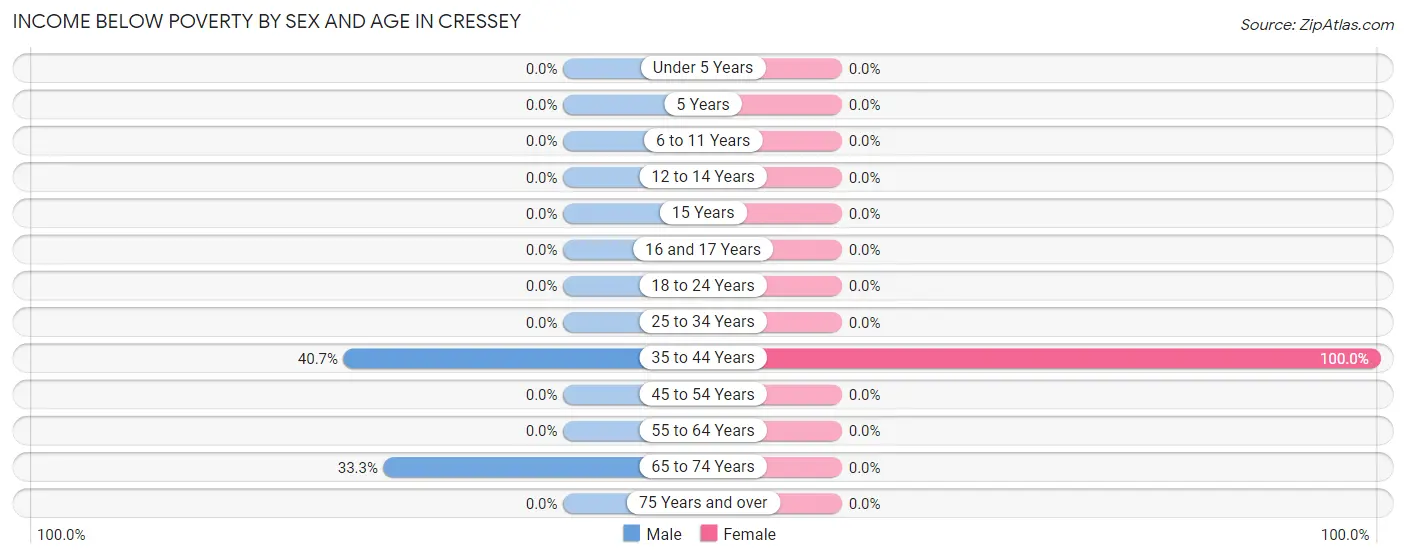
Income Below Poverty by Sex and Age in Cressey
With 10.6% poverty level for males and 6.4% for females among the residents of Cressey, 35 to 44 year old males and 35 to 44 year old females are the most vulnerable to poverty, with 11 males (40.7%) and 11 females (100.0%) in their respective age groups living below the poverty level.
| Age Bracket | Male | Female |
| Under 5 Years | 0 (0.0%) | 0 (0.0%) |
| 5 Years | 0 (0.0%) | 0 (0.0%) |
| 6 to 11 Years | 0 (0.0%) | 0 (0.0%) |
| 12 to 14 Years | 0 (0.0%) | 0 (0.0%) |
| 15 Years | 0 (0.0%) | 0 (0.0%) |
| 16 and 17 Years | 0 (0.0%) | 0 (0.0%) |
| 18 to 24 Years | 0 (0.0%) | 0 (0.0%) |
| 25 to 34 Years | 0 (0.0%) | 0 (0.0%) |
| 35 to 44 Years | 11 (40.7%) | 11 (100.0%) |
| 45 to 54 Years | 0 (0.0%) | 0 (0.0%) |
| 55 to 64 Years | 0 (0.0%) | 0 (0.0%) |
| 65 to 74 Years | 9 (33.3%) | 0 (0.0%) |
| 75 Years and over | 0 (0.0%) | 0 (0.0%) |
| Total | 20 (10.6%) | 11 (6.4%) |
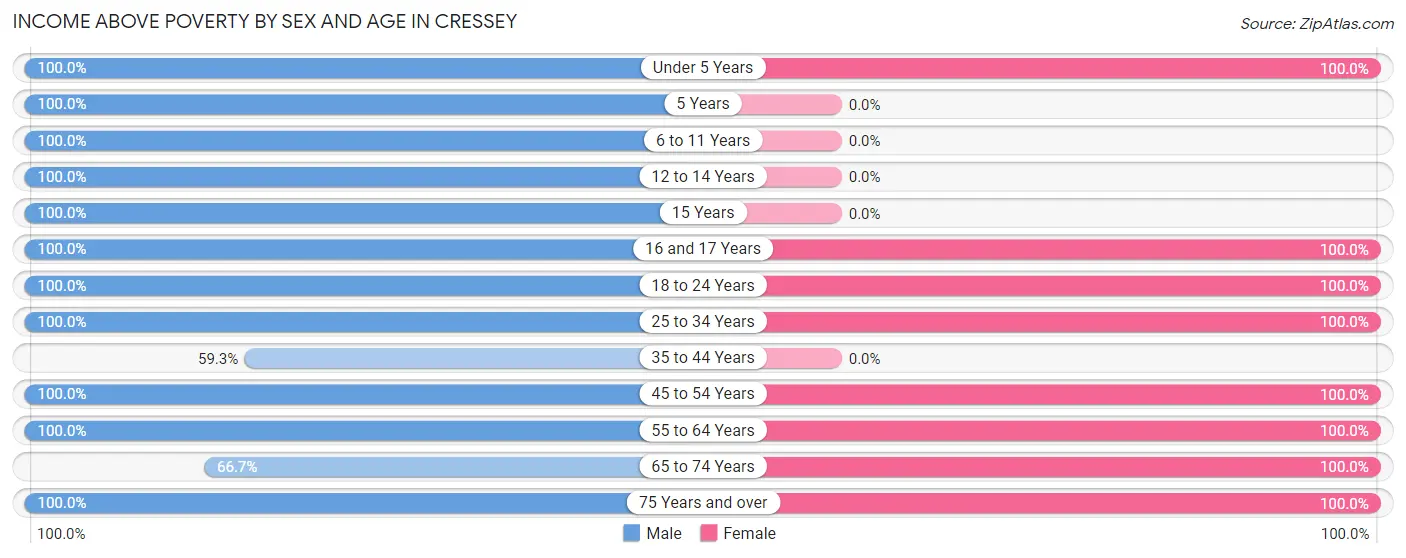
Income Above Poverty by Sex and Age in Cressey
According to the poverty statistics in Cressey, males aged under 5 years and females aged under 5 years are the age groups that are most secure financially, with 100.0% of males and 100.0% of females in these age groups living above the poverty line.
| Age Bracket | Male | Female |
| Under 5 Years | 4 (100.0%) | 49 (100.0%) |
| 5 Years | 10 (100.0%) | 0 (0.0%) |
| 6 to 11 Years | 13 (100.0%) | 0 (0.0%) |
| 12 to 14 Years | 10 (100.0%) | 0 (0.0%) |
| 15 Years | 3 (100.0%) | 0 (0.0%) |
| 16 and 17 Years | 11 (100.0%) | 8 (100.0%) |
| 18 to 24 Years | 13 (100.0%) | 17 (100.0%) |
| 25 to 34 Years | 29 (100.0%) | 15 (100.0%) |
| 35 to 44 Years | 16 (59.3%) | 0 (0.0%) |
| 45 to 54 Years | 19 (100.0%) | 17 (100.0%) |
| 55 to 64 Years | 8 (100.0%) | 20 (100.0%) |
| 65 to 74 Years | 18 (66.7%) | 10 (100.0%) |
| 75 Years and over | 14 (100.0%) | 25 (100.0%) |
| Total | 168 (89.4%) | 161 (93.6%) |
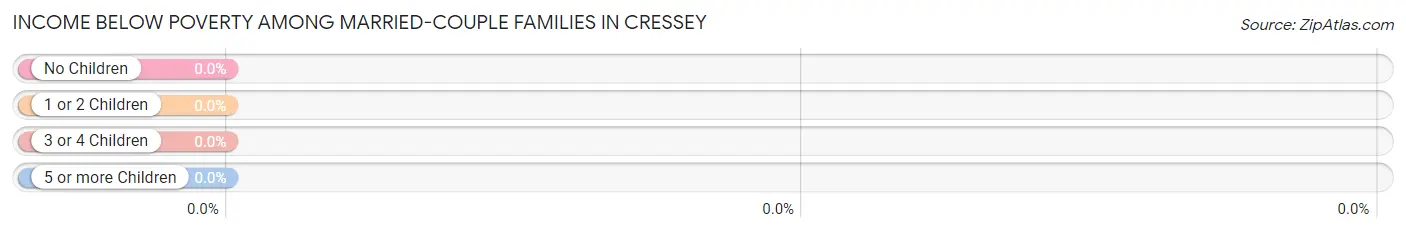
Income Below Poverty Among Married-Couple Families in Cressey
| Children | Above Poverty | Below Poverty |
| No Children | 20 (100.0%) | 0 (0.0%) |
| 1 or 2 Children | 18 (100.0%) | 0 (0.0%) |
| 3 or 4 Children | 0 (0.0%) | 0 (0.0%) |
| 5 or more Children | 0 (0.0%) | 0 (0.0%) |
| Total | 38 (100.0%) | 0 (0.0%) |
Income Below Poverty Among Single-Parent Households in Cressey
| Children | Single Father | Single Mother |
| No Children | 0 (0.0%) | 0 (0.0%) |
| 1 or 2 Children | 0 (0.0%) | 0 (0.0%) |
| 3 or 4 Children | 0 (0.0%) | 0 (0.0%) |
| 5 or more Children | 0 (0.0%) | 0 (0.0%) |
| Total | 0 (0.0%) | 0 (0.0%) |
Income Below Poverty Among Married-Couple vs Single-Parent Households in Cressey
| Children | Married-Couple Families | Single-Parent Households |
| No Children | 0 (0.0%) | 0 (0.0%) |
| 1 or 2 Children | 0 (0.0%) | 0 (0.0%) |
| 3 or 4 Children | 0 (0.0%) | 0 (0.0%) |
| 5 or more Children | 0 (0.0%) | 0 (0.0%) |
| Total | 0 (0.0%) | 0 (0.0%) |
Race in Cressey
The most populous races in Cressey are White / Caucasian (217 | 60.3%), Hispanic or Latino (171 | 47.5%), and Some other Race (92 | 25.6%).
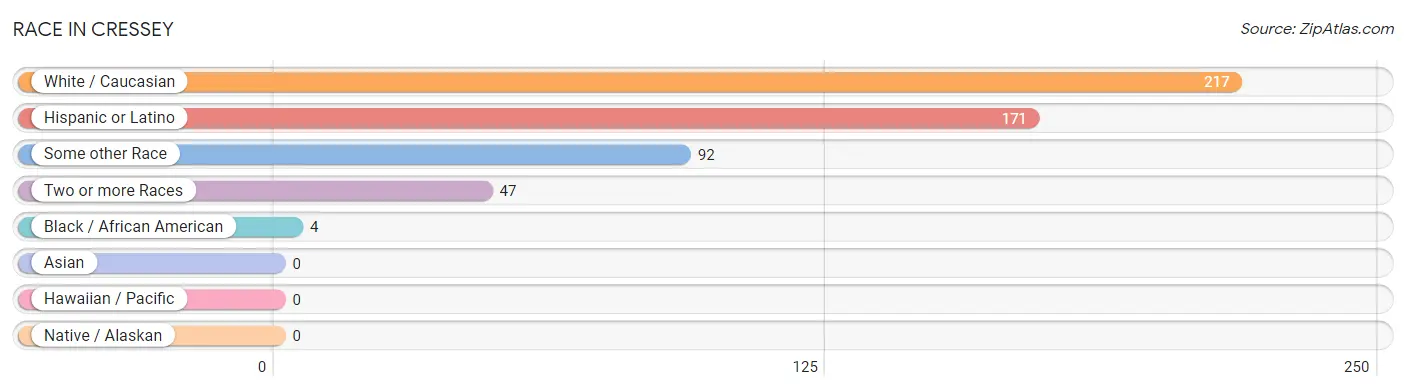
| Race | # Population | % Population |
| Asian | 0 | 0.0% |
| Black / African American | 4 | 1.1% |
| Hawaiian / Pacific | 0 | 0.0% |
| Hispanic or Latino | 171 | 47.5% |
| Native / Alaskan | 0 | 0.0% |
| White / Caucasian | 217 | 60.3% |
| Two or more Races | 47 | 13.1% |
| Some other Race | 92 | 25.6% |
| Total | 360 | 100.0% |
Ancestry in Cressey
The most populous ancestries reported in Cressey are Mexican (168 | 46.7%), German (67 | 18.6%), British (22 | 6.1%), Norwegian (12 | 3.3%), and Potawatomi (12 | 3.3%), together accounting for 78.1% of all Cressey residents.
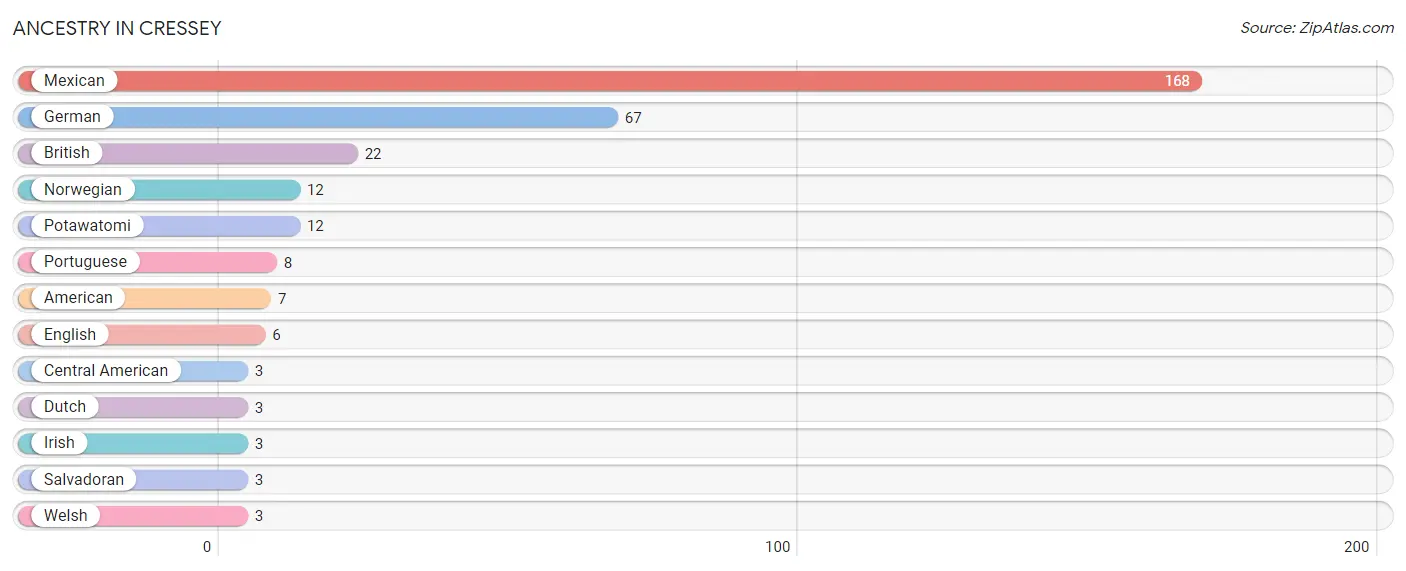
| Ancestry | # Population | % Population |
| American | 7 | 1.9% |
| British | 22 | 6.1% |
| Central American | 3 | 0.8% |
| Dutch | 3 | 0.8% |
| English | 6 | 1.7% |
| German | 67 | 18.6% |
| Irish | 3 | 0.8% |
| Mexican | 168 | 46.7% |
| Norwegian | 12 | 3.3% |
| Portuguese | 8 | 2.2% |
| Potawatomi | 12 | 3.3% |
| Salvadoran | 3 | 0.8% |
| Welsh | 3 | 0.8% | View All 13 Rows |
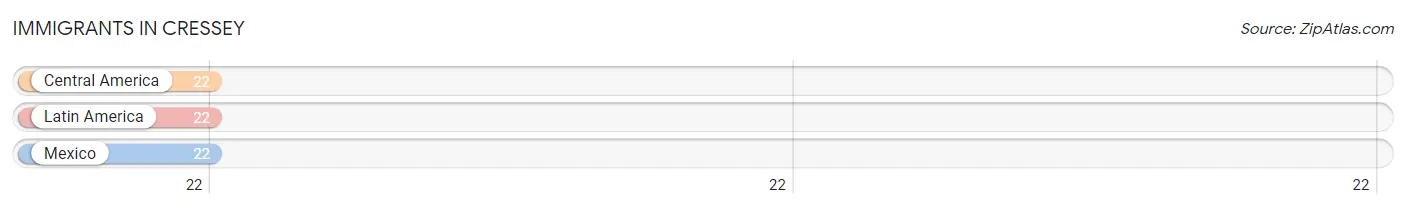
Immigrants in Cressey
The most numerous immigrant groups reported in Cressey came from Central America (22 | 6.1%), Latin America (22 | 6.1%), and Mexico (22 | 6.1%), together accounting for 18.3% of all Cressey residents.
| Immigration Origin | # Population | % Population |
| Central America | 22 | 6.1% |
| Latin America | 22 | 6.1% |
| Mexico | 22 | 6.1% | View All 3 Rows |
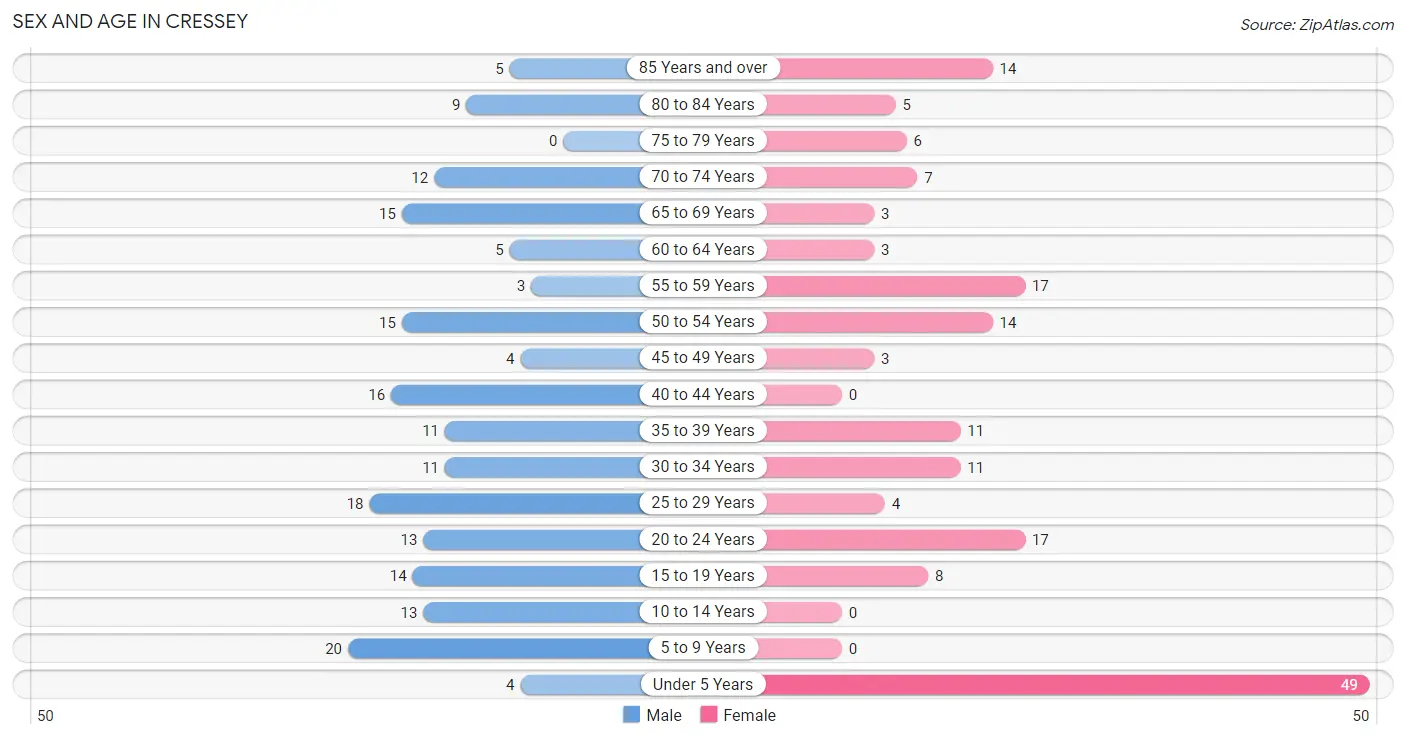
Sex and Age in Cressey
Sex and Age in Cressey
The most populous age groups in Cressey are 5 to 9 Years (20 | 10.6%) for men and Under 5 Years (49 | 28.5%) for women.
| Age Bracket | Male | Female |
| Under 5 Years | 4 (2.1%) | 49 (28.5%) |
| 5 to 9 Years | 20 (10.6%) | 0 (0.0%) |
| 10 to 14 Years | 13 (6.9%) | 0 (0.0%) |
| 15 to 19 Years | 14 (7.4%) | 8 (4.6%) |
| 20 to 24 Years | 13 (6.9%) | 17 (9.9%) |
| 25 to 29 Years | 18 (9.6%) | 4 (2.3%) |
| 30 to 34 Years | 11 (5.9%) | 11 (6.4%) |
| 35 to 39 Years | 11 (5.9%) | 11 (6.4%) |
| 40 to 44 Years | 16 (8.5%) | 0 (0.0%) |
| 45 to 49 Years | 4 (2.1%) | 3 (1.7%) |
| 50 to 54 Years | 15 (8.0%) | 14 (8.1%) |
| 55 to 59 Years | 3 (1.6%) | 17 (9.9%) |
| 60 to 64 Years | 5 (2.7%) | 3 (1.7%) |
| 65 to 69 Years | 15 (8.0%) | 3 (1.7%) |
| 70 to 74 Years | 12 (6.4%) | 7 (4.1%) |
| 75 to 79 Years | 0 (0.0%) | 6 (3.5%) |
| 80 to 84 Years | 9 (4.8%) | 5 (2.9%) |
| 85 Years and over | 5 (2.7%) | 14 (8.1%) |
| Total | 188 (100.0%) | 172 (100.0%) |
Families and Households in Cressey
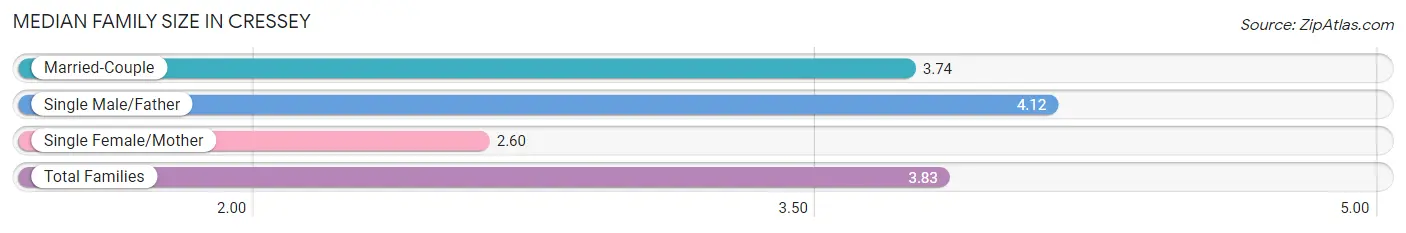
Median Family Size in Cressey
The median family size in Cressey is 3.83 persons per family, with single male/father families (33 | 43.4%) accounting for the largest median family size of 4.12 persons per family. On the other hand, single female/mother families (5 | 6.6%) represent the smallest median family size with 2.60 persons per family.
| Family Type | # Families | Family Size |
| Married-Couple | 38 (50.0%) | 3.74 |
| Single Male/Father | 33 (43.4%) | 4.12 |
| Single Female/Mother | 5 (6.6%) | 2.60 |
| Total Families | 76 (100.0%) | 3.83 |
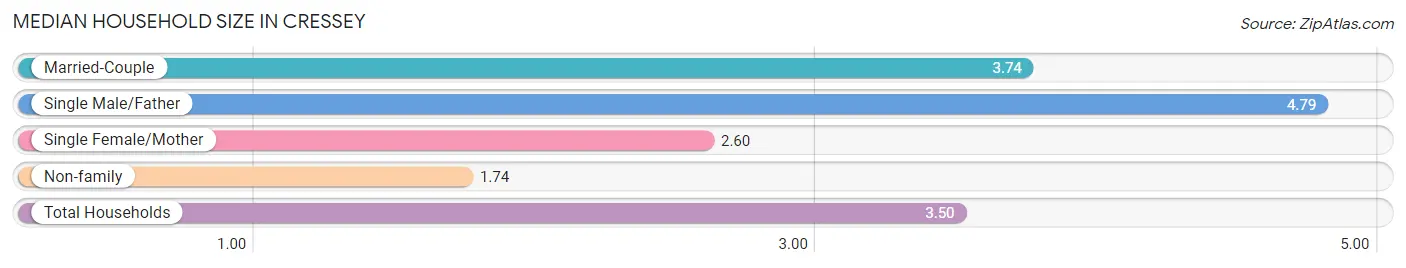
Median Household Size in Cressey
The median household size in Cressey is 3.50 persons per household, with single male/father households (33 | 32.0%) accounting for the largest median household size of 4.79 persons per household. non-family households (27 | 26.2%) represent the smallest median household size with 1.74 persons per household.
| Household Type | # Households | Household Size |
| Married-Couple | 38 (36.9%) | 3.74 |
| Single Male/Father | 33 (32.0%) | 4.79 |
| Single Female/Mother | 5 (4.9%) | 2.60 |
| Non-family | 27 (26.2%) | 1.74 |
| Total Households | 103 (100.0%) | 3.50 |
Household Size by Marriage Status in Cressey
Out of a total of 103 households in Cressey, 76 (73.8%) are family households, while 27 (26.2%) are nonfamily households. The most numerous type of family households are 6-person households, comprising 25, and the most common type of nonfamily households are 1-person households, comprising 19.
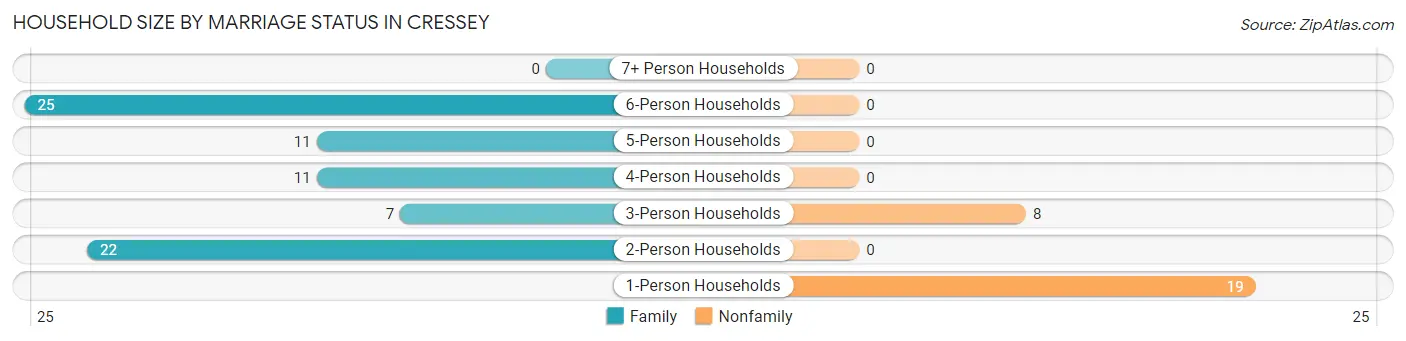
| Household Size | Family Households | Nonfamily Households |
| 1-Person Households | - | 19 (18.4%) |
| 2-Person Households | 22 (21.4%) | 0 (0.0%) |
| 3-Person Households | 7 (6.8%) | 8 (7.8%) |
| 4-Person Households | 11 (10.7%) | 0 (0.0%) |
| 5-Person Households | 11 (10.7%) | 0 (0.0%) |
| 6-Person Households | 25 (24.3%) | 0 (0.0%) |
| 7+ Person Households | 0 (0.0%) | 0 (0.0%) |
| Total | 76 (73.8%) | 27 (26.2%) |
Female Fertility in Cressey
Fertility by Age in Cressey
| Age Bracket | Women with Births | Births / 1,000 Women |
| 15 to 19 years | 0 (0.0%) | 0.0 |
| 20 to 34 years | 0 (0.0%) | 0.0 |
| 35 to 50 years | 0 (0.0%) | 0.0 |
| Total | 0 (0.0%) | 0.0 |
Fertility by Age by Marriage Status in Cressey
| Age Bracket | Married | Unmarried |
| 15 to 19 years | 0 (0.0%) | 0 (0.0%) |
| 20 to 34 years | 0 (0.0%) | 0 (0.0%) |
| 35 to 50 years | 0 (0.0%) | 0 (0.0%) |
| Total | 0 (0.0%) | 0 (0.0%) |
Fertility by Education in Cressey
| Educational Attainment | Women with Births | Births / 1,000 Women |
| Less than High School | 0 (0.0%) | 0.0 |
| High School Diploma | 0 (0.0%) | 0.0 |
| College or Associate's Degree | 0 (0.0%) | 0.0 |
| Bachelor's Degree | 0 (0.0%) | 0.0 |
| Graduate Degree | 0 (0.0%) | 0.0 |
| Total | 0 (0.0%) | 0.0 |
Fertility by Education by Marriage Status in Cressey
| Educational Attainment | Married | Unmarried |
| Less than High School | 0 (0.0%) | 0 (0.0%) |
| High School Diploma | 0 (0.0%) | 0 (0.0%) |
| College or Associate's Degree | 0 (0.0%) | 0 (0.0%) |
| Bachelor's Degree | 0 (0.0%) | 0 (0.0%) |
| Graduate Degree | 0 (0.0%) | 0 (0.0%) |
| Total | 0 (0.0%) | 0 (0.0%) |
Employment Characteristics in Cressey
Employment by Class of Employer in Cressey
Among the 128 employed individuals in Cressey, private company employees (97 | 75.8%), self-employed (incorporated) (17 | 13.3%), and federal government employees (7 | 5.5%) make up the most common classes of employment.
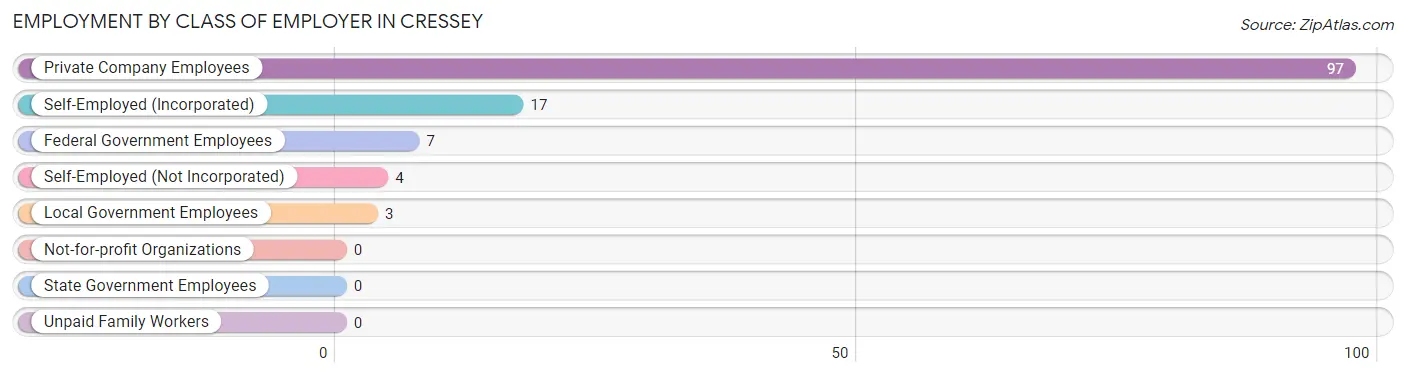
| Employer Class | # Employees | % Employees |
| Private Company Employees | 97 | 75.8% |
| Self-Employed (Incorporated) | 17 | 13.3% |
| Self-Employed (Not Incorporated) | 4 | 3.1% |
| Not-for-profit Organizations | 0 | 0.0% |
| Local Government Employees | 3 | 2.3% |
| State Government Employees | 0 | 0.0% |
| Federal Government Employees | 7 | 5.5% |
| Unpaid Family Workers | 0 | 0.0% |
| Total | 128 | 100.0% |
Employment Status by Age in Cressey
According to the labor force statistics for Cressey, out of the total population over 16 years of age (271), 49.8% or 135 individuals are in the labor force, with 5.3% or 7 of them unemployed. The age group with the highest labor force participation rate is 25 to 29 years, with 100.0% or 22 individuals in the labor force. Within the labor force, the 65 to 74 years age range has the highest percentage of unemployed individuals, with 100.0% or 7 of them being unemployed.
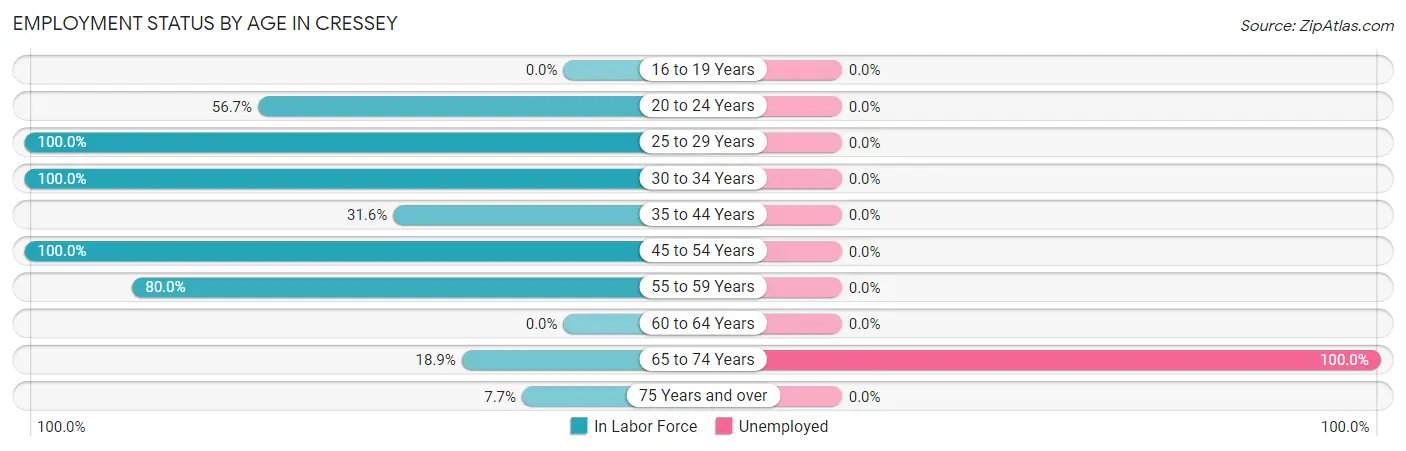
| Age Bracket | In Labor Force | Unemployed |
| 16 to 19 Years | 0 (0.0%) | 0 (0.0%) |
| 20 to 24 Years | 17 (56.7%) | 0 (0.0%) |
| 25 to 29 Years | 22 (100.0%) | 0 (0.0%) |
| 30 to 34 Years | 22 (100.0%) | 0 (0.0%) |
| 35 to 44 Years | 12 (31.6%) | 0 (0.0%) |
| 45 to 54 Years | 36 (100.0%) | 0 (0.0%) |
| 55 to 59 Years | 16 (80.0%) | 0 (0.0%) |
| 60 to 64 Years | 0 (0.0%) | 0 (0.0%) |
| 65 to 74 Years | 7 (18.9%) | 7 (100.0%) |
| 75 Years and over | 3 (7.7%) | 0 (0.0%) |
| Total | 135 (49.8%) | 7 (5.3%) |
Employment Status by Educational Attainment in Cressey
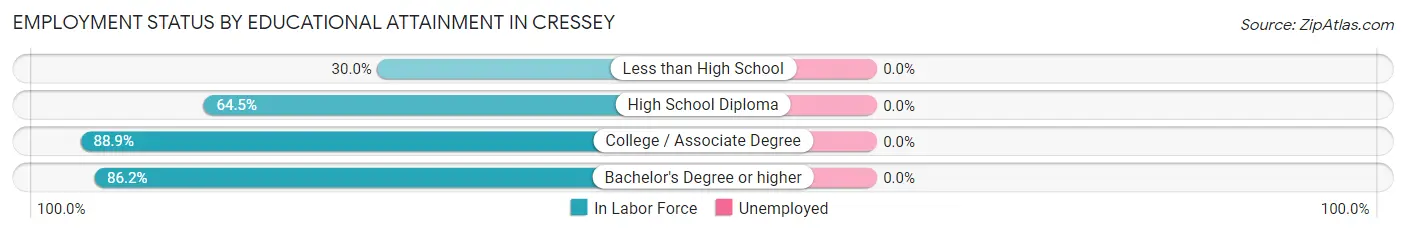
| Educational Attainment | In Labor Force | Unemployed |
| Less than High School | 3 (30.0%) | 0 (0.0%) |
| High School Diploma | 40 (64.5%) | 0 (0.0%) |
| College / Associate Degree | 40 (88.9%) | 0 (0.0%) |
| Bachelor's Degree or higher | 25 (86.2%) | 0 (0.0%) |
| Total | 108 (74.0%) | 0 (0.0%) |
Employment Occupations by Sex in Cressey
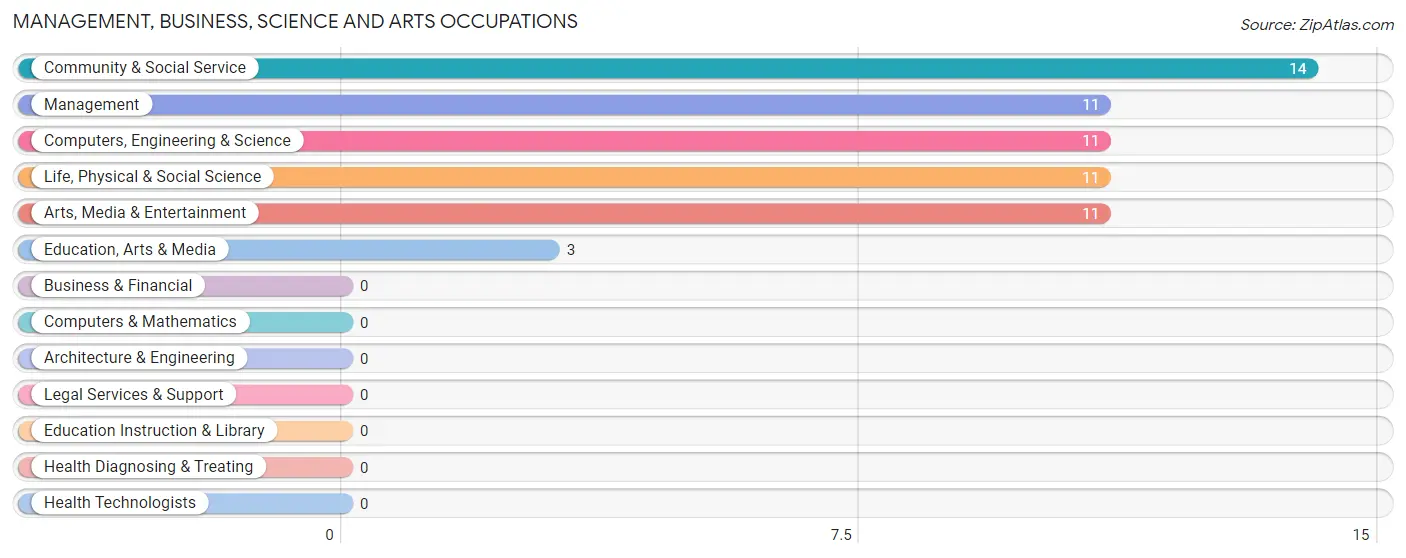
Management, Business, Science and Arts Occupations
The most common Management, Business, Science and Arts occupations in Cressey are Community & Social Service (14 | 11.3%), Management (11 | 8.9%), Computers, Engineering & Science (11 | 8.9%), Life, Physical & Social Science (11 | 8.9%), and Arts, Media & Entertainment (11 | 8.9%).
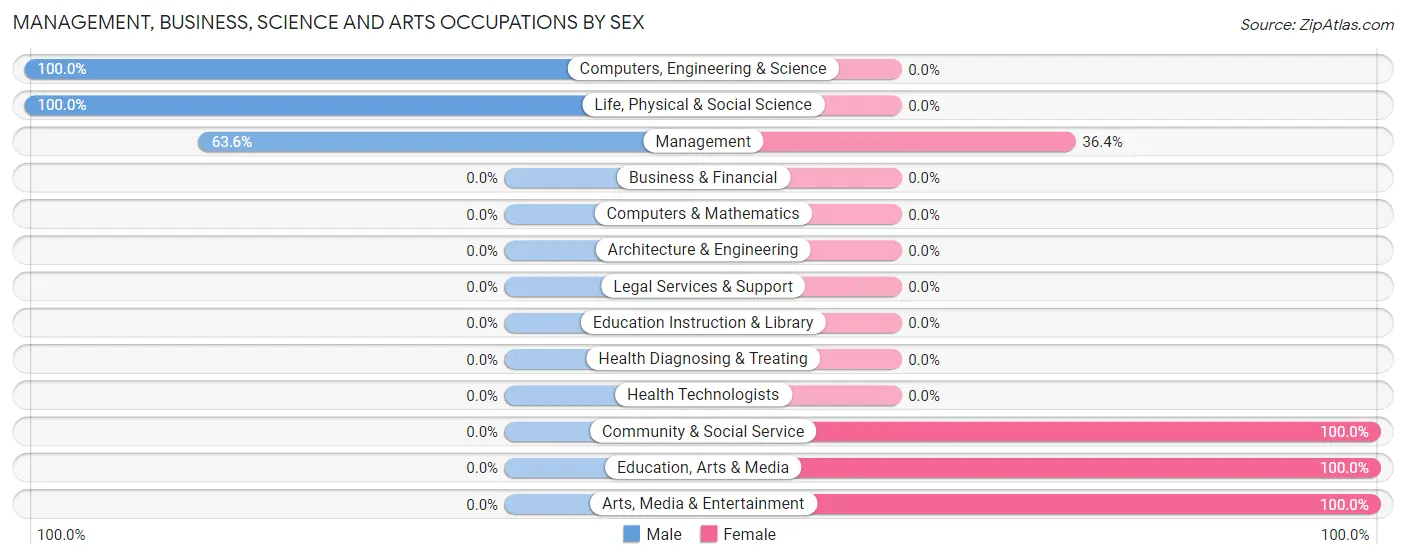
Management, Business, Science and Arts Occupations by Sex
Within the Management, Business, Science and Arts occupations in Cressey, the most male-oriented occupations are Computers, Engineering & Science (100.0%), Life, Physical & Social Science (100.0%), and Management (63.6%), while the most female-oriented occupations are Community & Social Service (100.0%), Education, Arts & Media (100.0%), and Arts, Media & Entertainment (100.0%).
| Occupation | Male | Female |
| Management | 7 (63.6%) | 4 (36.4%) |
| Business & Financial | 0 (0.0%) | 0 (0.0%) |
| Computers, Engineering & Science | 11 (100.0%) | 0 (0.0%) |
| Computers & Mathematics | 0 (0.0%) | 0 (0.0%) |
| Architecture & Engineering | 0 (0.0%) | 0 (0.0%) |
| Life, Physical & Social Science | 11 (100.0%) | 0 (0.0%) |
| Community & Social Service | 0 (0.0%) | 14 (100.0%) |
| Education, Arts & Media | 0 (0.0%) | 3 (100.0%) |
| Legal Services & Support | 0 (0.0%) | 0 (0.0%) |
| Education Instruction & Library | 0 (0.0%) | 0 (0.0%) |
| Arts, Media & Entertainment | 0 (0.0%) | 11 (100.0%) |
| Health Diagnosing & Treating | 0 (0.0%) | 0 (0.0%) |
| Health Technologists | 0 (0.0%) | 0 (0.0%) |
| Total (Category) | 18 (50.0%) | 18 (50.0%) |
| Total (Overall) | 79 (63.7%) | 45 (36.3%) |
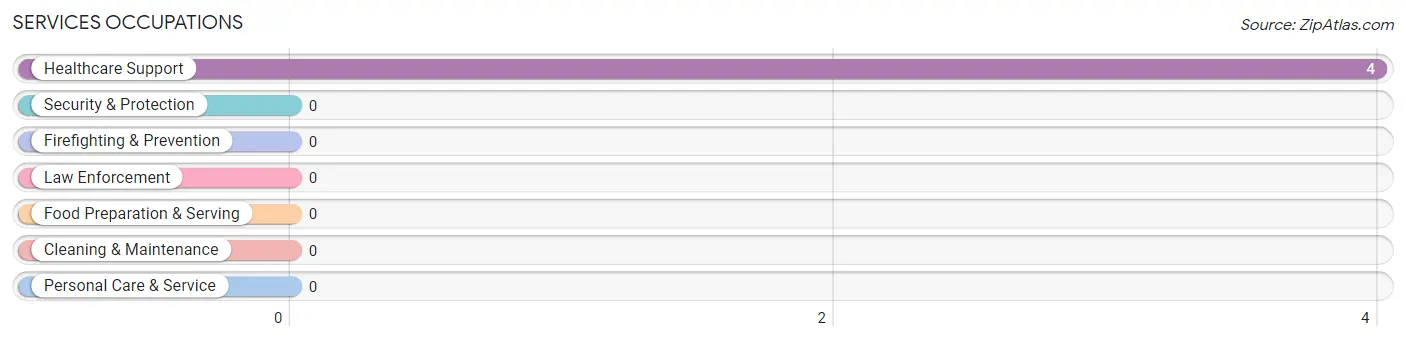
Services Occupations
The most common Services occupations in Cressey are , and Healthcare Support (4 | 3.2%).
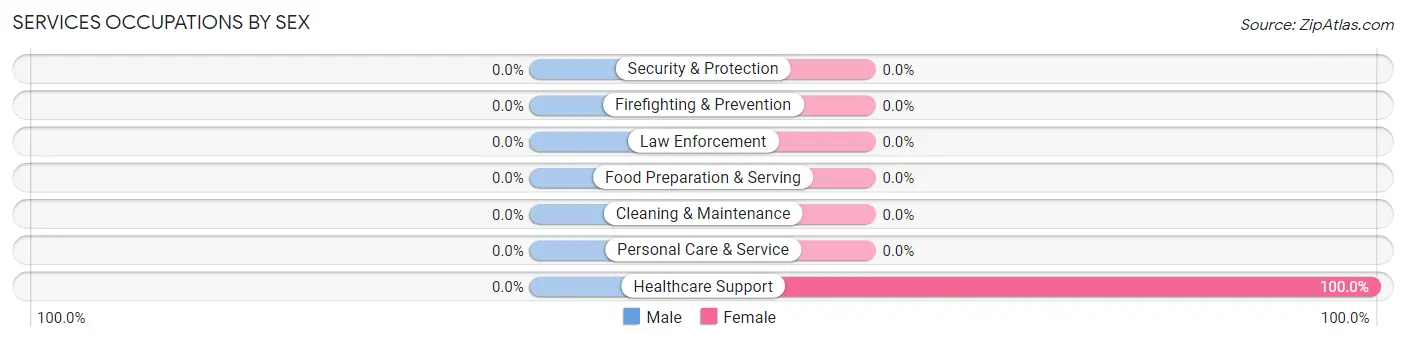
Services Occupations by Sex
| Occupation | Male | Female |
| Healthcare Support | 0 (0.0%) | 4 (100.0%) |
| Security & Protection | 0 (0.0%) | 0 (0.0%) |
| Firefighting & Prevention | 0 (0.0%) | 0 (0.0%) |
| Law Enforcement | 0 (0.0%) | 0 (0.0%) |
| Food Preparation & Serving | 0 (0.0%) | 0 (0.0%) |
| Cleaning & Maintenance | 0 (0.0%) | 0 (0.0%) |
| Personal Care & Service | 0 (0.0%) | 0 (0.0%) |
| Total (Category) | 0 (0.0%) | 4 (100.0%) |
| Total (Overall) | 79 (63.7%) | 45 (36.3%) |
Sales and Office Occupations
The most common Sales and Office occupations in Cressey are , and Sales & Related (31 | 25.0%).
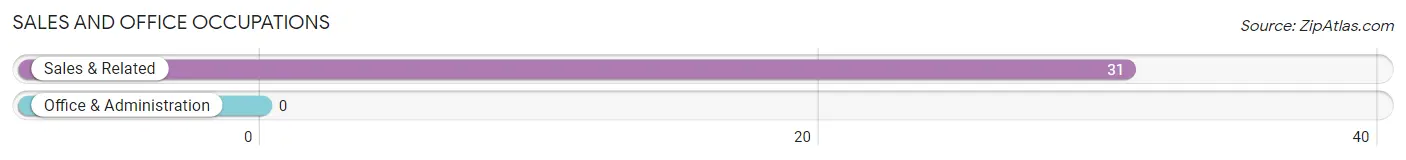
Sales and Office Occupations by Sex
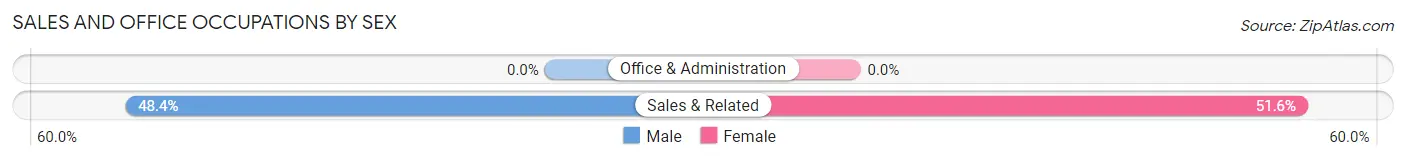
| Occupation | Male | Female |
| Sales & Related | 15 (48.4%) | 16 (51.6%) |
| Office & Administration | 0 (0.0%) | 0 (0.0%) |
| Total (Category) | 15 (48.4%) | 16 (51.6%) |
| Total (Overall) | 79 (63.7%) | 45 (36.3%) |
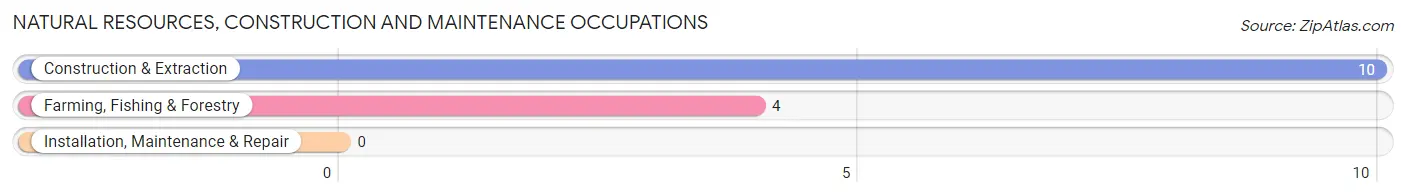
Natural Resources, Construction and Maintenance Occupations
The most common Natural Resources, Construction and Maintenance occupations in Cressey are Construction & Extraction (10 | 8.1%), and Farming, Fishing & Forestry (4 | 3.2%).
Natural Resources, Construction and Maintenance Occupations by Sex
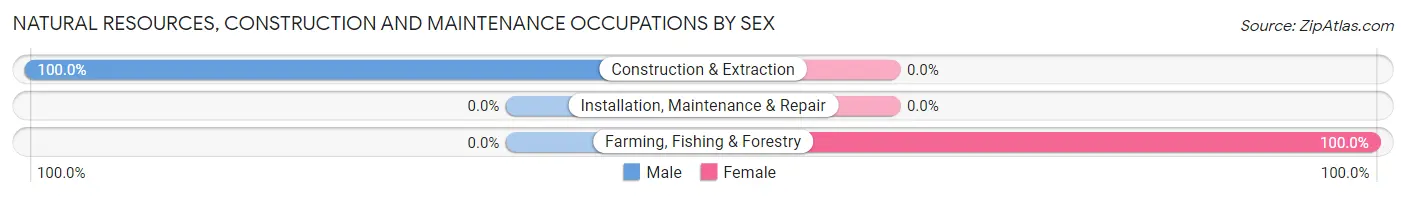
| Occupation | Male | Female |
| Farming, Fishing & Forestry | 0 (0.0%) | 4 (100.0%) |
| Construction & Extraction | 10 (100.0%) | 0 (0.0%) |
| Installation, Maintenance & Repair | 0 (0.0%) | 0 (0.0%) |
| Total (Category) | 10 (71.4%) | 4 (28.6%) |
| Total (Overall) | 79 (63.7%) | 45 (36.3%) |
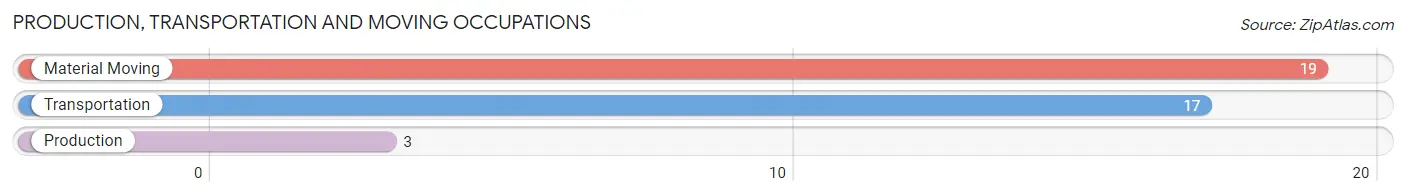
Production, Transportation and Moving Occupations
The most common Production, Transportation and Moving occupations in Cressey are Material Moving (19 | 15.3%), Transportation (17 | 13.7%), and Production (3 | 2.4%).
Production, Transportation and Moving Occupations by Sex
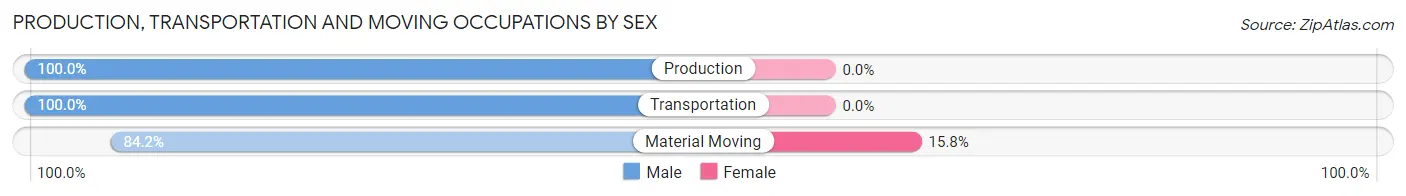
| Occupation | Male | Female |
| Production | 3 (100.0%) | 0 (0.0%) |
| Transportation | 17 (100.0%) | 0 (0.0%) |
| Material Moving | 16 (84.2%) | 3 (15.8%) |
| Total (Category) | 36 (92.3%) | 3 (7.7%) |
| Total (Overall) | 79 (63.7%) | 45 (36.3%) |
Employment Industries by Sex in Cressey
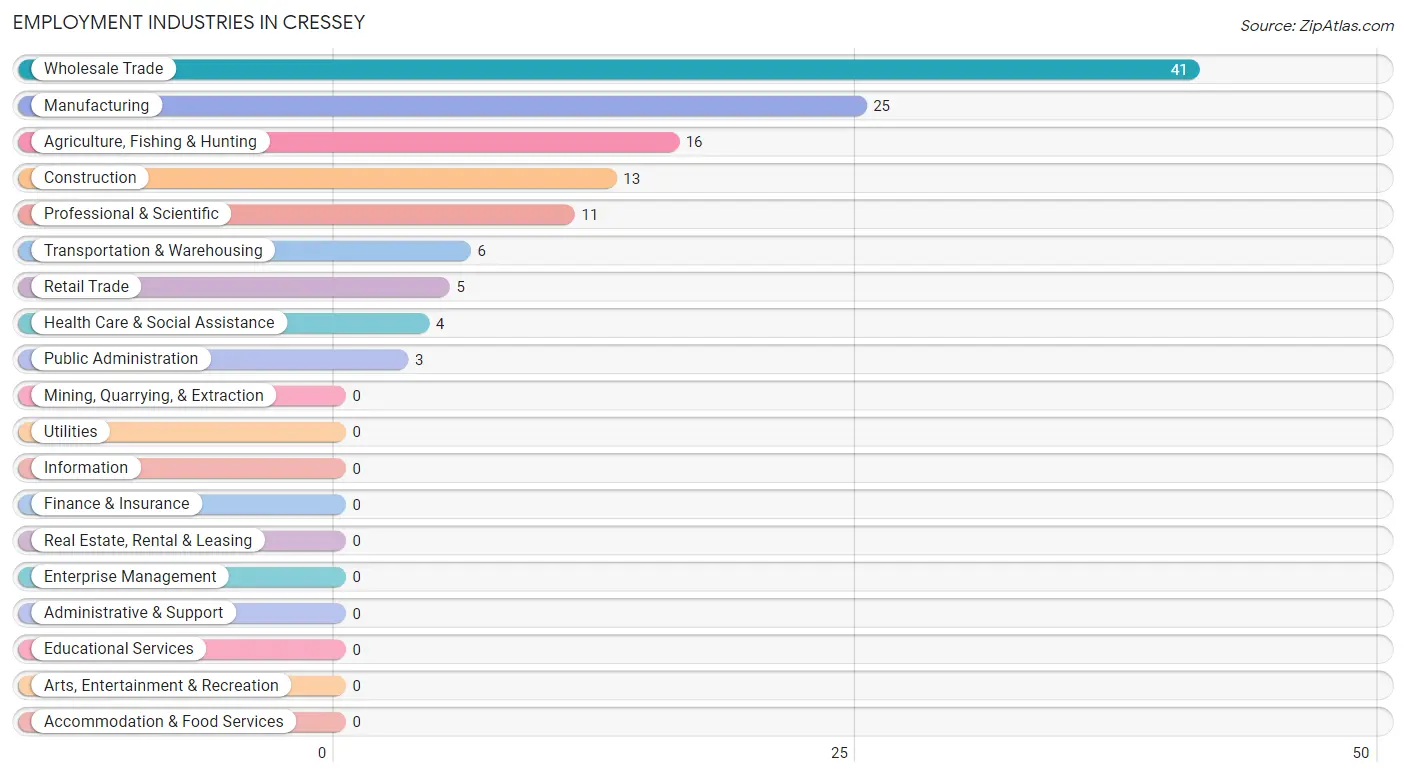
Employment Industries in Cressey
The major employment industries in Cressey include Wholesale Trade (41 | 33.1%), Manufacturing (25 | 20.2%), Agriculture, Fishing & Hunting (16 | 12.9%), Construction (13 | 10.5%), and Professional & Scientific (11 | 8.9%).
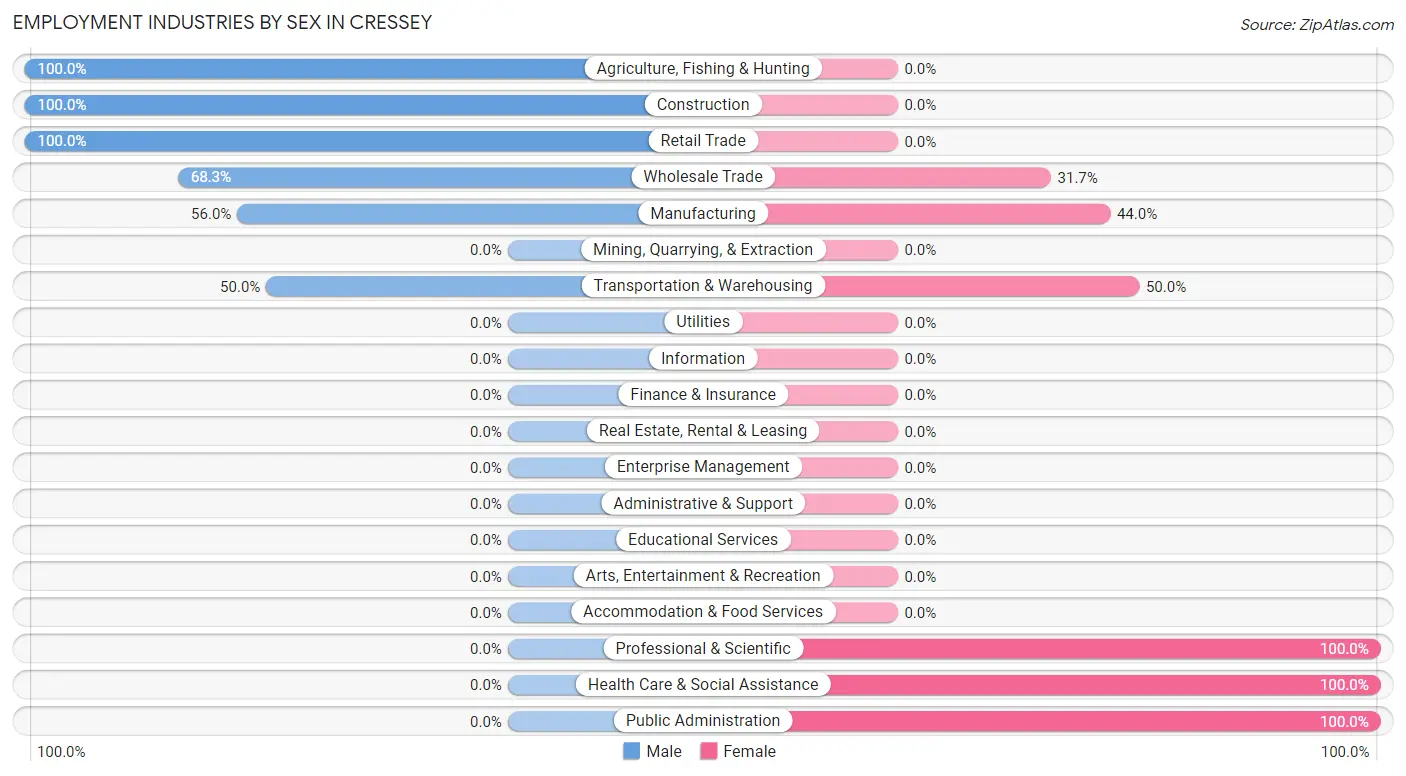
Employment Industries by Sex in Cressey
The Cressey industries that see more men than women are Agriculture, Fishing & Hunting (100.0%), Construction (100.0%), and Retail Trade (100.0%), whereas the industries that tend to have a higher number of women are Professional & Scientific (100.0%), Health Care & Social Assistance (100.0%), and Public Administration (100.0%).
| Industry | Male | Female |
| Agriculture, Fishing & Hunting | 16 (100.0%) | 0 (0.0%) |
| Mining, Quarrying, & Extraction | 0 (0.0%) | 0 (0.0%) |
| Construction | 13 (100.0%) | 0 (0.0%) |
| Manufacturing | 14 (56.0%) | 11 (44.0%) |
| Wholesale Trade | 28 (68.3%) | 13 (31.7%) |
| Retail Trade | 5 (100.0%) | 0 (0.0%) |
| Transportation & Warehousing | 3 (50.0%) | 3 (50.0%) |
| Utilities | 0 (0.0%) | 0 (0.0%) |
| Information | 0 (0.0%) | 0 (0.0%) |
| Finance & Insurance | 0 (0.0%) | 0 (0.0%) |
| Real Estate, Rental & Leasing | 0 (0.0%) | 0 (0.0%) |
| Professional & Scientific | 0 (0.0%) | 11 (100.0%) |
| Enterprise Management | 0 (0.0%) | 0 (0.0%) |
| Administrative & Support | 0 (0.0%) | 0 (0.0%) |
| Educational Services | 0 (0.0%) | 0 (0.0%) |
| Health Care & Social Assistance | 0 (0.0%) | 4 (100.0%) |
| Arts, Entertainment & Recreation | 0 (0.0%) | 0 (0.0%) |
| Accommodation & Food Services | 0 (0.0%) | 0 (0.0%) |
| Public Administration | 0 (0.0%) | 3 (100.0%) |
| Total | 79 (63.7%) | 45 (36.3%) |
Education in Cressey
School Enrollment in Cressey
The most common levels of schooling among the 59 students in Cressey are high school (32 | 54.2%), kindergarten (10 | 17.0%), and elementary school (10 | 17.0%).
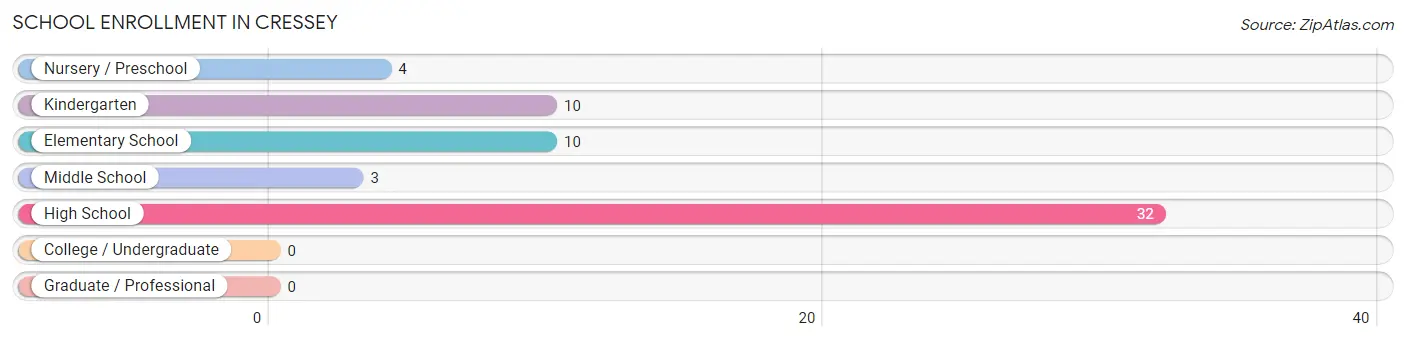
| School Level | # Students | % Students |
| Nursery / Preschool | 4 | 6.8% |
| Kindergarten | 10 | 17.0% |
| Elementary School | 10 | 17.0% |
| Middle School | 3 | 5.1% |
| High School | 32 | 54.2% |
| College / Undergraduate | 0 | 0.0% |
| Graduate / Professional | 0 | 0.0% |
| Total | 59 | 100.0% |
School Enrollment by Age by Funding Source in Cressey
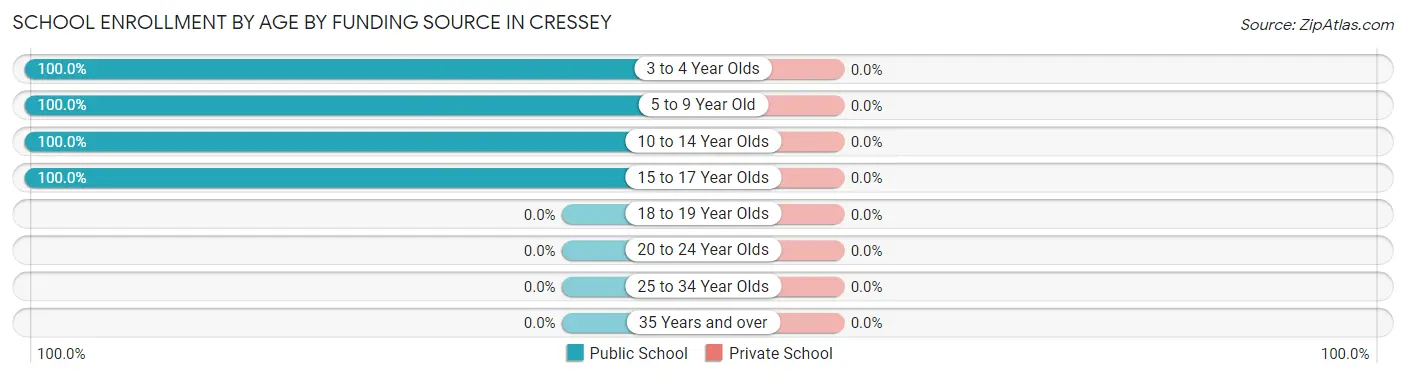
| Age Bracket | Public School | Private School |
| 3 to 4 Year Olds | 4 (100.0%) | 0 (0.0%) |
| 5 to 9 Year Old | 20 (100.0%) | 0 (0.0%) |
| 10 to 14 Year Olds | 13 (100.0%) | 0 (0.0%) |
| 15 to 17 Year Olds | 22 (100.0%) | 0 (0.0%) |
| 18 to 19 Year Olds | 0 (0.0%) | 0 (0.0%) |
| 20 to 24 Year Olds | 0 (0.0%) | 0 (0.0%) |
| 25 to 34 Year Olds | 0 (0.0%) | 0 (0.0%) |
| 35 Years and over | 0 (0.0%) | 0 (0.0%) |
| Total | 59 (100.0%) | 0 (0.0%) |
Educational Attainment by Field of Study in Cressey
Bio, nature & agricultural (12 | 37.5%), social sciences (4 | 12.5%), science & technology (4 | 12.5%), business (3 | 9.4%), and education (3 | 9.4%) are the most common fields of study among 32 individuals in Cressey who have obtained a bachelor's degree or higher.
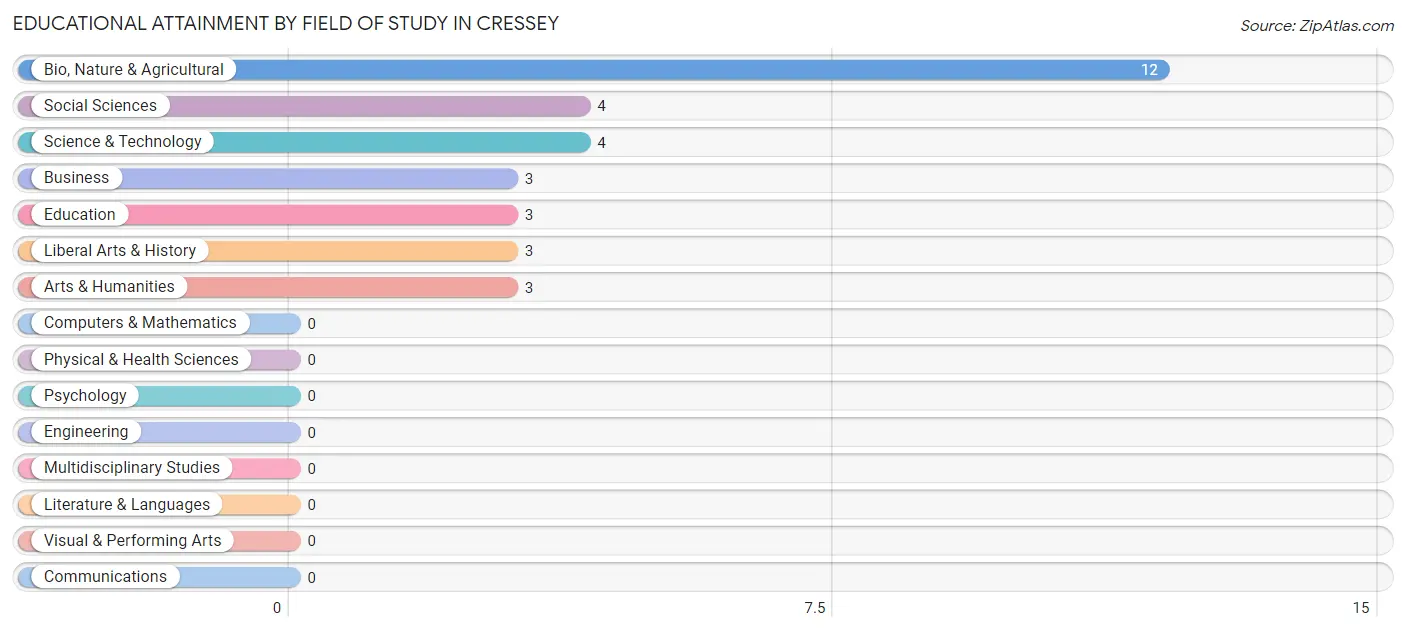
| Field of Study | # Graduates | % Graduates |
| Computers & Mathematics | 0 | 0.0% |
| Bio, Nature & Agricultural | 12 | 37.5% |
| Physical & Health Sciences | 0 | 0.0% |
| Psychology | 0 | 0.0% |
| Social Sciences | 4 | 12.5% |
| Engineering | 0 | 0.0% |
| Multidisciplinary Studies | 0 | 0.0% |
| Science & Technology | 4 | 12.5% |
| Business | 3 | 9.4% |
| Education | 3 | 9.4% |
| Literature & Languages | 0 | 0.0% |
| Liberal Arts & History | 3 | 9.4% |
| Visual & Performing Arts | 0 | 0.0% |
| Communications | 0 | 0.0% |
| Arts & Humanities | 3 | 9.4% |
| Total | 32 | 100.0% |
Transportation & Commute in Cressey
Vehicle Availability by Sex in Cressey
The most prevalent vehicle ownership categories in Cressey are males with 3 vehicles (49, accounting for 62.0%) and females with 3 vehicles (31, making up 100.0%).
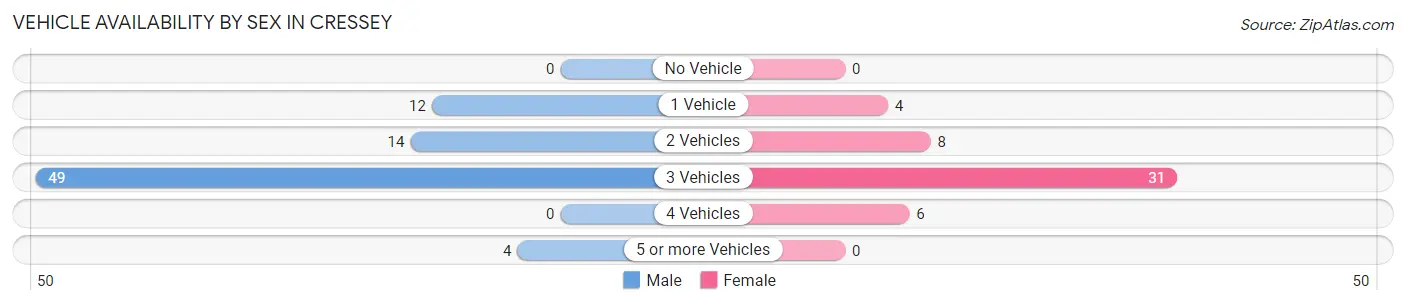
| Vehicles Available | Male | Female |
| No Vehicle | 0 (0.0%) | 0 (0.0%) |
| 1 Vehicle | 12 (15.2%) | 4 (8.2%) |
| 2 Vehicles | 14 (17.7%) | 8 (16.3%) |
| 3 Vehicles | 49 (62.0%) | 31 (63.3%) |
| 4 Vehicles | 0 (0.0%) | 6 (12.2%) |
| 5 or more Vehicles | 4 (5.1%) | 0 (0.0%) |
| Total | 79 (100.0%) | 49 (100.0%) |
Commute Time in Cressey
The most frequently occuring commute durations in Cressey are 15 to 19 minutes (39 commuters, 33.3%), 25 to 29 minutes (17 commuters, 14.5%), and 20 to 24 minutes (15 commuters, 12.8%).
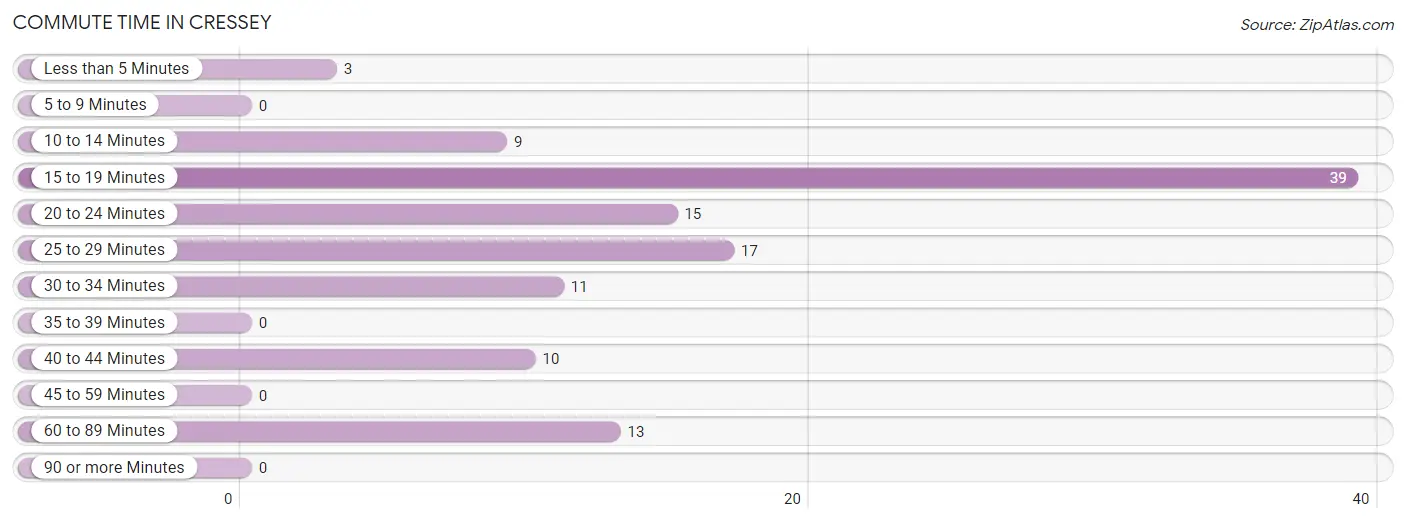
| Commute Time | # Commuters | % Commuters |
| Less than 5 Minutes | 3 | 2.6% |
| 5 to 9 Minutes | 0 | 0.0% |
| 10 to 14 Minutes | 9 | 7.7% |
| 15 to 19 Minutes | 39 | 33.3% |
| 20 to 24 Minutes | 15 | 12.8% |
| 25 to 29 Minutes | 17 | 14.5% |
| 30 to 34 Minutes | 11 | 9.4% |
| 35 to 39 Minutes | 0 | 0.0% |
| 40 to 44 Minutes | 10 | 8.6% |
| 45 to 59 Minutes | 0 | 0.0% |
| 60 to 89 Minutes | 13 | 11.1% |
| 90 or more Minutes | 0 | 0.0% |
Commute Time by Sex in Cressey
The most common commute times in Cressey are 15 to 19 minutes (26 commuters, 36.1%) for males and 25 to 29 minutes (17 commuters, 37.8%) for females.
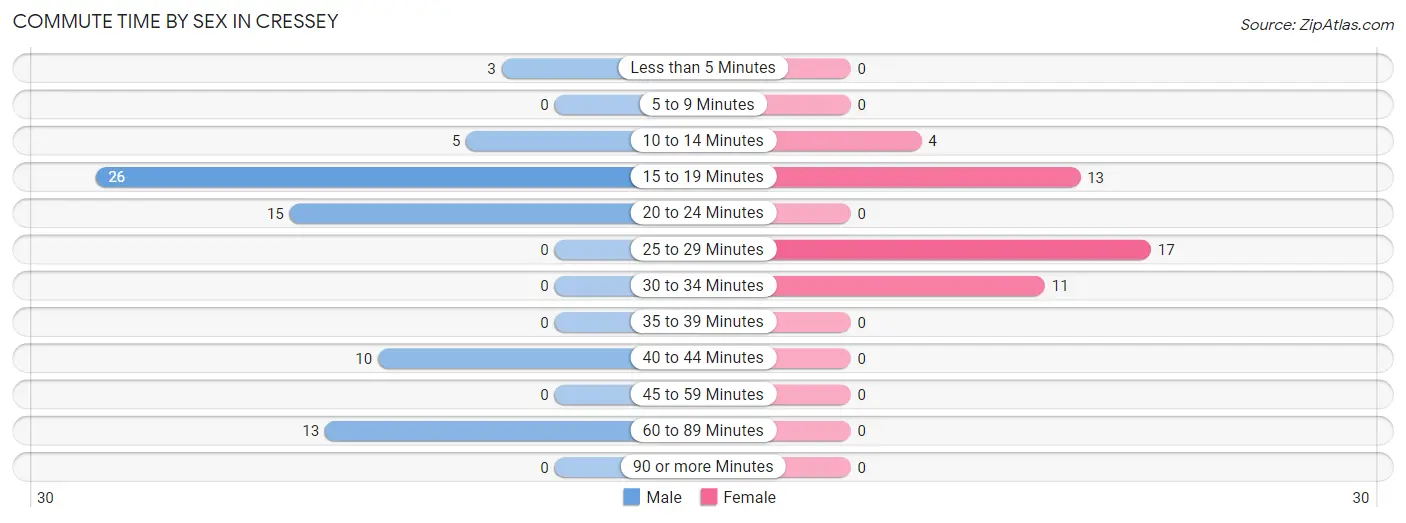
| Commute Time | Male | Female |
| Less than 5 Minutes | 3 (4.2%) | 0 (0.0%) |
| 5 to 9 Minutes | 0 (0.0%) | 0 (0.0%) |
| 10 to 14 Minutes | 5 (6.9%) | 4 (8.9%) |
| 15 to 19 Minutes | 26 (36.1%) | 13 (28.9%) |
| 20 to 24 Minutes | 15 (20.8%) | 0 (0.0%) |
| 25 to 29 Minutes | 0 (0.0%) | 17 (37.8%) |
| 30 to 34 Minutes | 0 (0.0%) | 11 (24.4%) |
| 35 to 39 Minutes | 0 (0.0%) | 0 (0.0%) |
| 40 to 44 Minutes | 10 (13.9%) | 0 (0.0%) |
| 45 to 59 Minutes | 0 (0.0%) | 0 (0.0%) |
| 60 to 89 Minutes | 13 (18.1%) | 0 (0.0%) |
| 90 or more Minutes | 0 (0.0%) | 0 (0.0%) |
Time of Departure to Work by Sex in Cressey
The most frequent times of departure to work in Cressey are 7:00 AM to 7:29 AM (24, 33.3%) for males and 6:00 AM to 6:29 AM (15, 33.3%) for females.
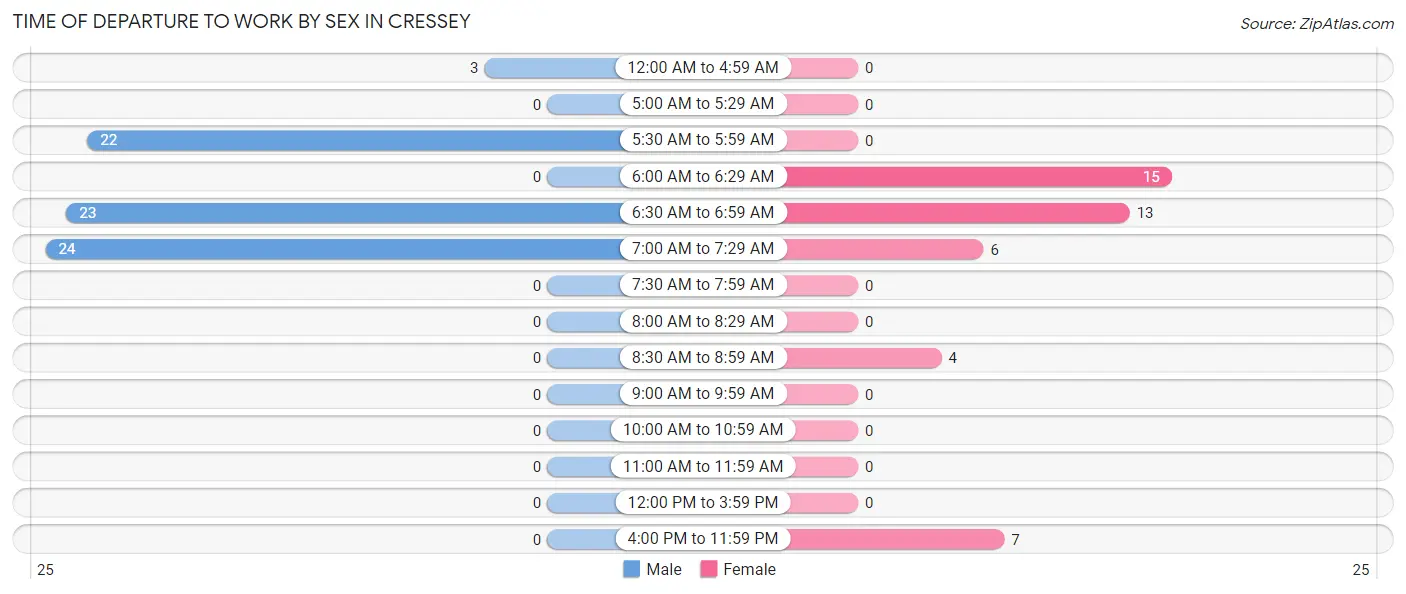
| Time of Departure | Male | Female |
| 12:00 AM to 4:59 AM | 3 (4.2%) | 0 (0.0%) |
| 5:00 AM to 5:29 AM | 0 (0.0%) | 0 (0.0%) |
| 5:30 AM to 5:59 AM | 22 (30.6%) | 0 (0.0%) |
| 6:00 AM to 6:29 AM | 0 (0.0%) | 15 (33.3%) |
| 6:30 AM to 6:59 AM | 23 (31.9%) | 13 (28.9%) |
| 7:00 AM to 7:29 AM | 24 (33.3%) | 6 (13.3%) |
| 7:30 AM to 7:59 AM | 0 (0.0%) | 0 (0.0%) |
| 8:00 AM to 8:29 AM | 0 (0.0%) | 0 (0.0%) |
| 8:30 AM to 8:59 AM | 0 (0.0%) | 4 (8.9%) |
| 9:00 AM to 9:59 AM | 0 (0.0%) | 0 (0.0%) |
| 10:00 AM to 10:59 AM | 0 (0.0%) | 0 (0.0%) |
| 11:00 AM to 11:59 AM | 0 (0.0%) | 0 (0.0%) |
| 12:00 PM to 3:59 PM | 0 (0.0%) | 0 (0.0%) |
| 4:00 PM to 11:59 PM | 0 (0.0%) | 7 (15.6%) |
| Total | 72 (100.0%) | 45 (100.0%) |
Housing Occupancy in Cressey
Occupancy by Ownership in Cressey
Of the total 103 dwellings in Cressey, owner-occupied units account for 64 (62.1%), while renter-occupied units make up 39 (37.9%).
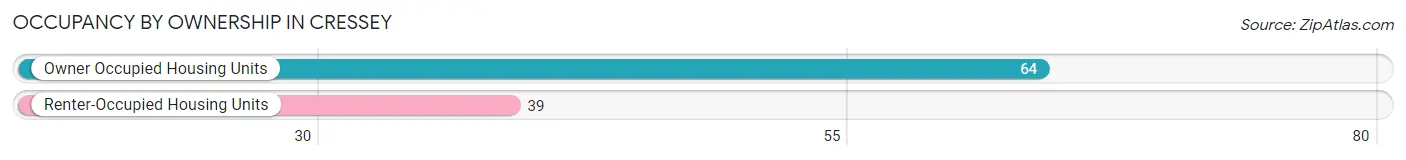
| Occupancy | # Housing Units | % Housing Units |
| Owner Occupied Housing Units | 64 | 62.1% |
| Renter-Occupied Housing Units | 39 | 37.9% |
| Total Occupied Housing Units | 103 | 100.0% |
Occupancy by Household Size in Cressey
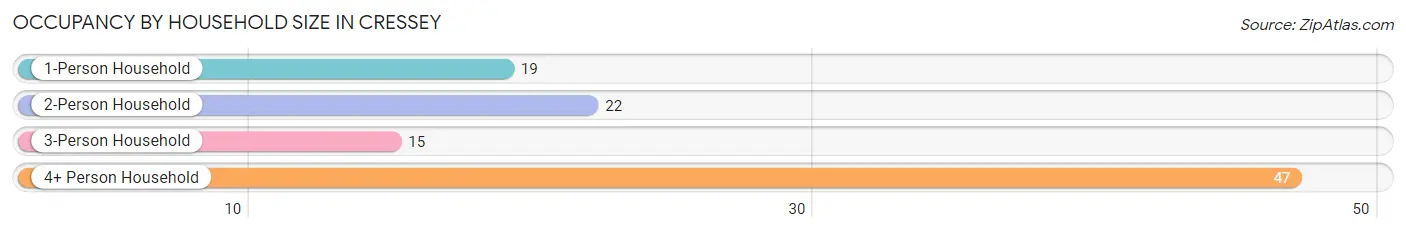
| Household Size | # Housing Units | % Housing Units |
| 1-Person Household | 19 | 18.4% |
| 2-Person Household | 22 | 21.4% |
| 3-Person Household | 15 | 14.6% |
| 4+ Person Household | 47 | 45.6% |
| Total Housing Units | 103 | 100.0% |
Occupancy by Ownership by Household Size in Cressey
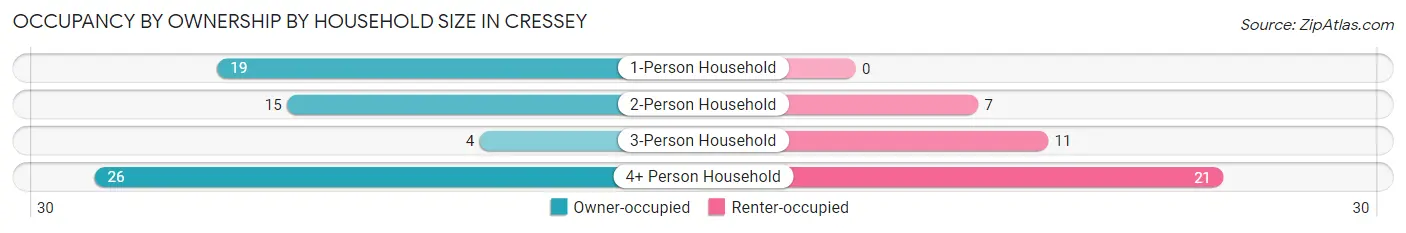
| Household Size | Owner-occupied | Renter-occupied |
| 1-Person Household | 19 (100.0%) | 0 (0.0%) |
| 2-Person Household | 15 (68.2%) | 7 (31.8%) |
| 3-Person Household | 4 (26.7%) | 11 (73.3%) |
| 4+ Person Household | 26 (55.3%) | 21 (44.7%) |
| Total Housing Units | 64 (62.1%) | 39 (37.9%) |
Occupancy by Educational Attainment in Cressey
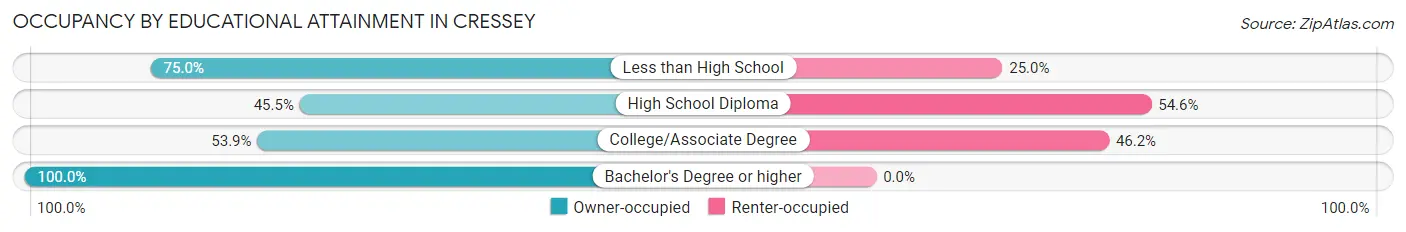
| Household Size | Owner-occupied | Renter-occupied |
| Less than High School | 9 (75.0%) | 3 (25.0%) |
| High School Diploma | 15 (45.5%) | 18 (54.5%) |
| College/Associate Degree | 21 (53.8%) | 18 (46.2%) |
| Bachelor's Degree or higher | 19 (100.0%) | 0 (0.0%) |
Occupancy by Age of Householder in Cressey
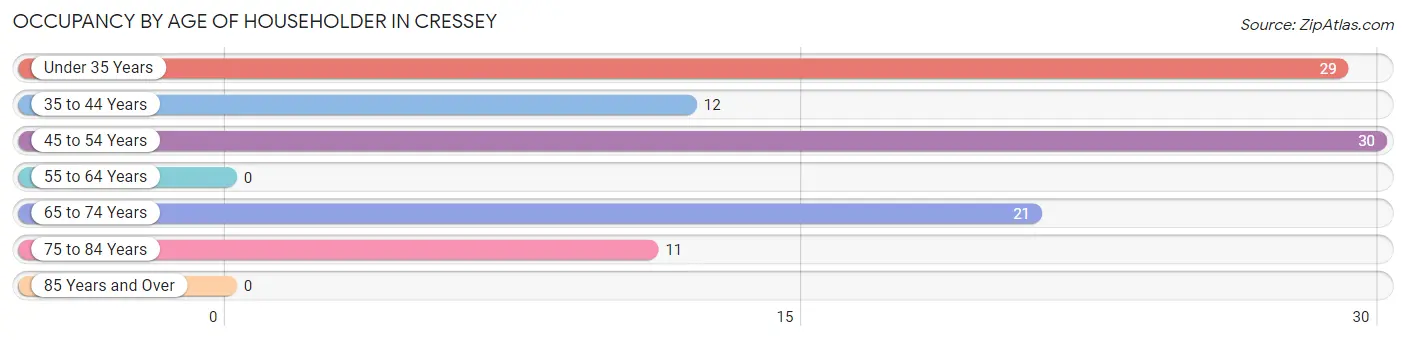
| Age Bracket | # Households | % Households |
| Under 35 Years | 29 | 28.2% |
| 35 to 44 Years | 12 | 11.7% |
| 45 to 54 Years | 30 | 29.1% |
| 55 to 64 Years | 0 | 0.0% |
| 65 to 74 Years | 21 | 20.4% |
| 75 to 84 Years | 11 | 10.7% |
| 85 Years and Over | 0 | 0.0% |
| Total | 103 | 100.0% |
Housing Finances in Cressey
Median Income by Occupancy in Cressey
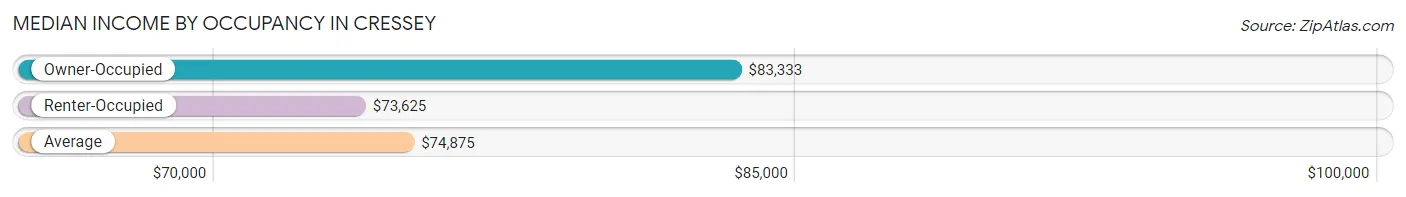
| Occupancy Type | # Households | Median Income |
| Owner-Occupied | 64 (62.1%) | $83,333 |
| Renter-Occupied | 39 (37.9%) | $73,625 |
| Average | 103 (100.0%) | $74,875 |
Occupancy by Householder Income Bracket in Cressey
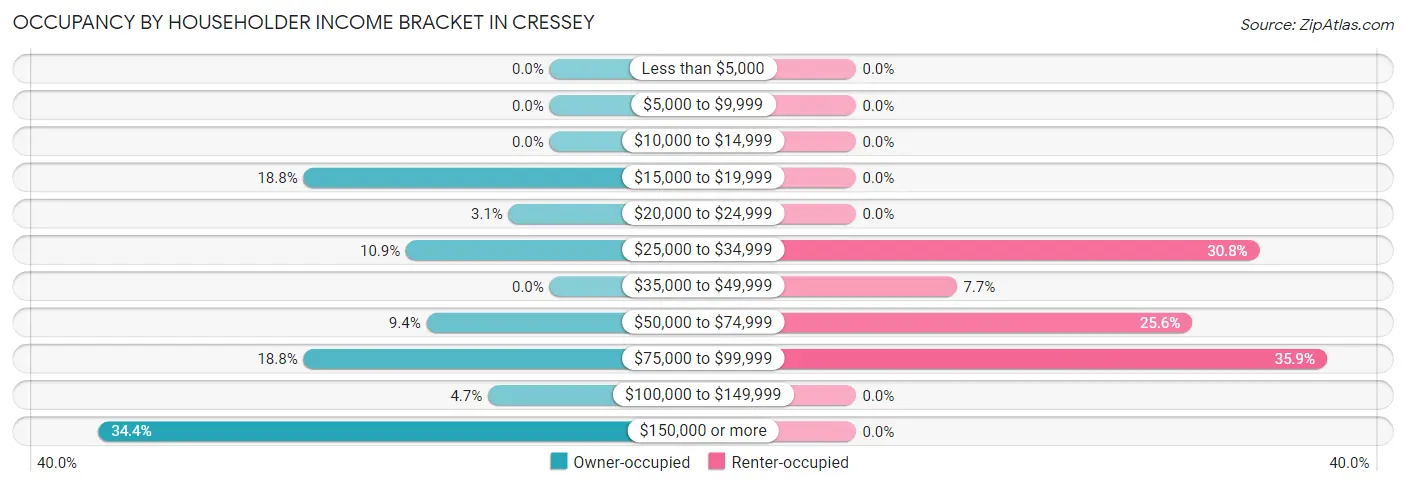
| Income Bracket | Owner-occupied | Renter-occupied |
| Less than $5,000 | 0 (0.0%) | 0 (0.0%) |
| $5,000 to $9,999 | 0 (0.0%) | 0 (0.0%) |
| $10,000 to $14,999 | 0 (0.0%) | 0 (0.0%) |
| $15,000 to $19,999 | 12 (18.8%) | 0 (0.0%) |
| $20,000 to $24,999 | 2 (3.1%) | 0 (0.0%) |
| $25,000 to $34,999 | 7 (10.9%) | 12 (30.8%) |
| $35,000 to $49,999 | 0 (0.0%) | 3 (7.7%) |
| $50,000 to $74,999 | 6 (9.4%) | 10 (25.6%) |
| $75,000 to $99,999 | 12 (18.8%) | 14 (35.9%) |
| $100,000 to $149,999 | 3 (4.7%) | 0 (0.0%) |
| $150,000 or more | 22 (34.4%) | 0 (0.0%) |
| Total | 64 (100.0%) | 39 (100.0%) |
Monthly Housing Cost Tiers in Cressey
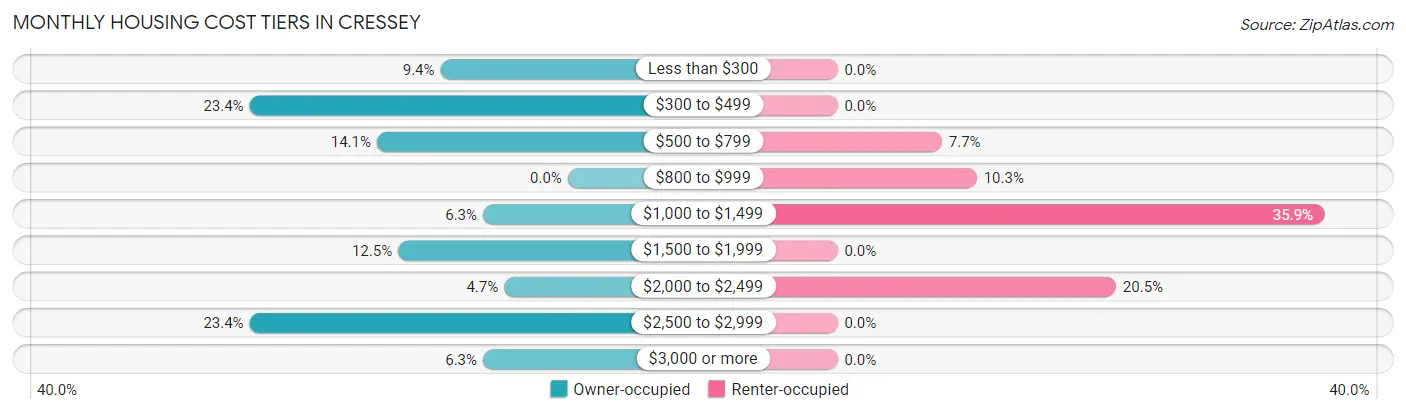
| Monthly Cost | Owner-occupied | Renter-occupied |
| Less than $300 | 6 (9.4%) | 0 (0.0%) |
| $300 to $499 | 15 (23.4%) | 0 (0.0%) |
| $500 to $799 | 9 (14.1%) | 3 (7.7%) |
| $800 to $999 | 0 (0.0%) | 4 (10.3%) |
| $1,000 to $1,499 | 4 (6.2%) | 14 (35.9%) |
| $1,500 to $1,999 | 8 (12.5%) | 0 (0.0%) |
| $2,000 to $2,499 | 3 (4.7%) | 8 (20.5%) |
| $2,500 to $2,999 | 15 (23.4%) | 0 (0.0%) |
| $3,000 or more | 4 (6.2%) | 0 (0.0%) |
| Total | 64 (100.0%) | 39 (100.0%) |
Physical Housing Characteristics in Cressey
Housing Structures in Cressey
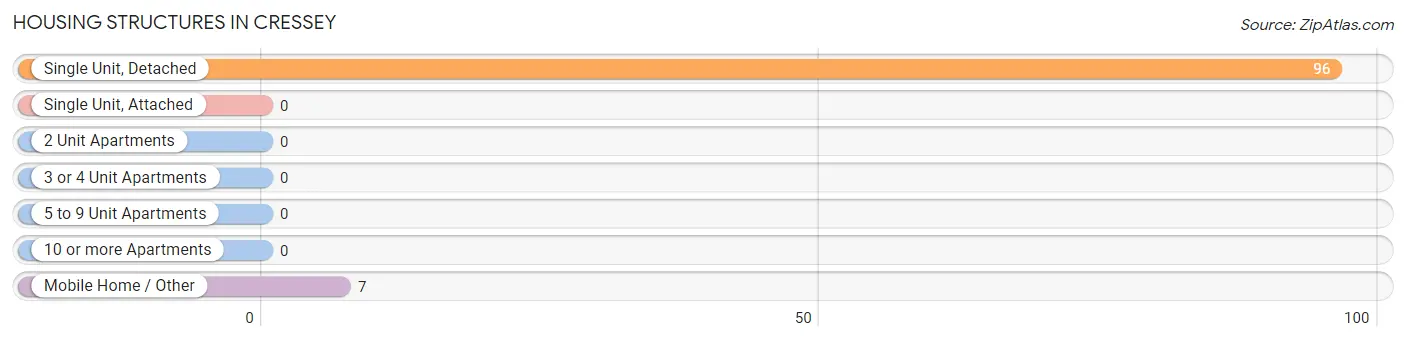
| Structure Type | # Housing Units | % Housing Units |
| Single Unit, Detached | 96 | 93.2% |
| Single Unit, Attached | 0 | 0.0% |
| 2 Unit Apartments | 0 | 0.0% |
| 3 or 4 Unit Apartments | 0 | 0.0% |
| 5 to 9 Unit Apartments | 0 | 0.0% |
| 10 or more Apartments | 0 | 0.0% |
| Mobile Home / Other | 7 | 6.8% |
| Total | 103 | 100.0% |
Housing Structures by Occupancy in Cressey
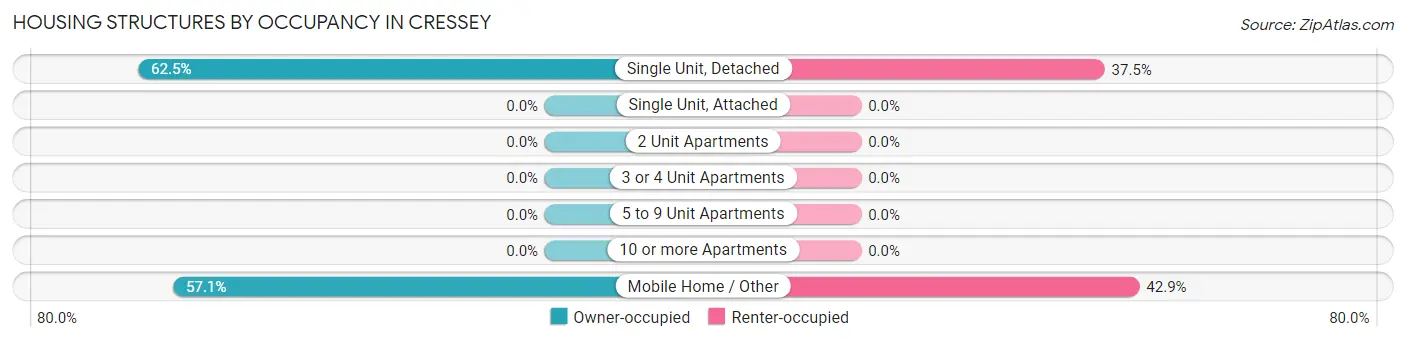
| Structure Type | Owner-occupied | Renter-occupied |
| Single Unit, Detached | 60 (62.5%) | 36 (37.5%) |
| Single Unit, Attached | 0 (0.0%) | 0 (0.0%) |
| 2 Unit Apartments | 0 (0.0%) | 0 (0.0%) |
| 3 or 4 Unit Apartments | 0 (0.0%) | 0 (0.0%) |
| 5 to 9 Unit Apartments | 0 (0.0%) | 0 (0.0%) |
| 10 or more Apartments | 0 (0.0%) | 0 (0.0%) |
| Mobile Home / Other | 4 (57.1%) | 3 (42.9%) |
| Total | 64 (62.1%) | 39 (37.9%) |
Housing Structures by Number of Rooms in Cressey
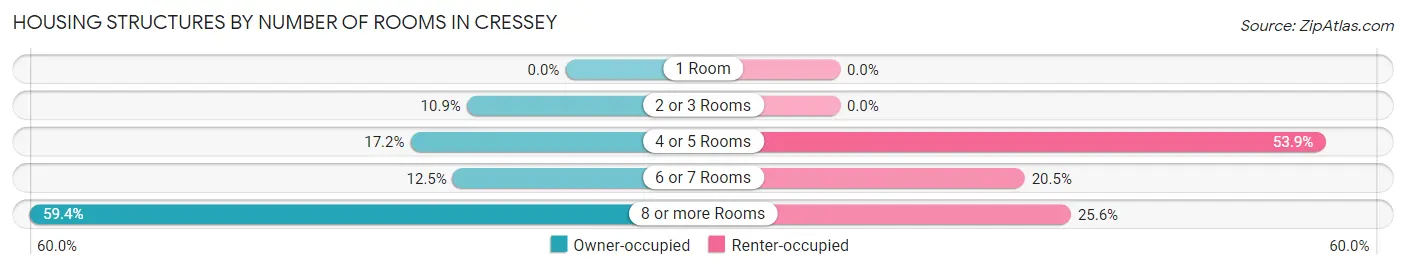
| Number of Rooms | Owner-occupied | Renter-occupied |
| 1 Room | 0 (0.0%) | 0 (0.0%) |
| 2 or 3 Rooms | 7 (10.9%) | 0 (0.0%) |
| 4 or 5 Rooms | 11 (17.2%) | 21 (53.8%) |
| 6 or 7 Rooms | 8 (12.5%) | 8 (20.5%) |
| 8 or more Rooms | 38 (59.4%) | 10 (25.6%) |
| Total | 64 (100.0%) | 39 (100.0%) |
Housing Structure by Heating Type in Cressey
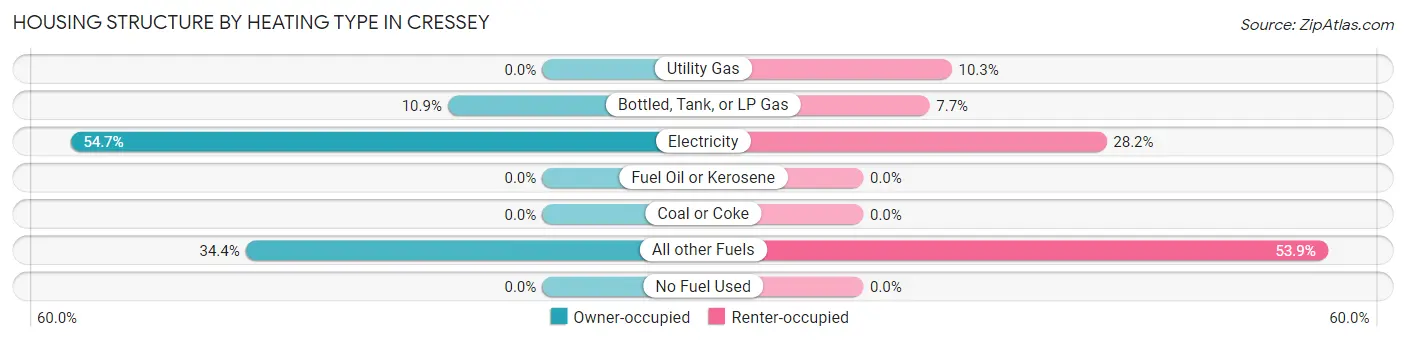
| Heating Type | Owner-occupied | Renter-occupied |
| Utility Gas | 0 (0.0%) | 4 (10.3%) |
| Bottled, Tank, or LP Gas | 7 (10.9%) | 3 (7.7%) |
| Electricity | 35 (54.7%) | 11 (28.2%) |
| Fuel Oil or Kerosene | 0 (0.0%) | 0 (0.0%) |
| Coal or Coke | 0 (0.0%) | 0 (0.0%) |
| All other Fuels | 22 (34.4%) | 21 (53.8%) |
| No Fuel Used | 0 (0.0%) | 0 (0.0%) |
| Total | 64 (100.0%) | 39 (100.0%) |
Household Vehicle Usage in Cressey
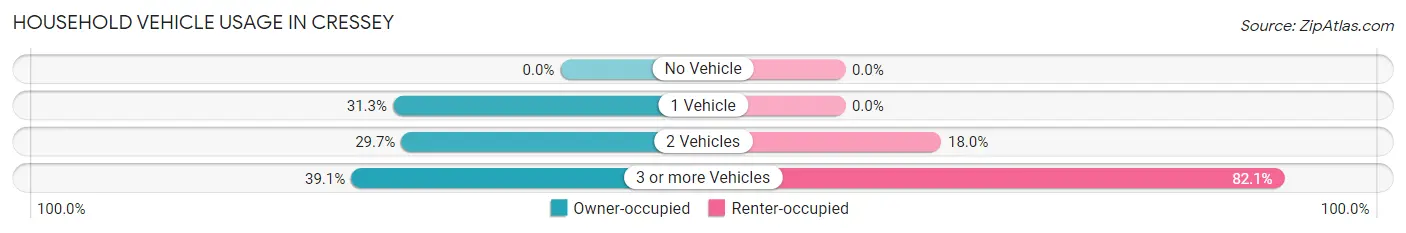
| Vehicles per Household | Owner-occupied | Renter-occupied |
| No Vehicle | 0 (0.0%) | 0 (0.0%) |
| 1 Vehicle | 20 (31.2%) | 0 (0.0%) |
| 2 Vehicles | 19 (29.7%) | 7 (17.9%) |
| 3 or more Vehicles | 25 (39.1%) | 32 (82.1%) |
| Total | 64 (100.0%) | 39 (100.0%) |
Real Estate & Mortgages in Cressey
Real Estate and Mortgage Overview in Cressey
| Characteristic | Without Mortgage | With Mortgage |
| Housing Units | 34 | 30 |
| Median Property Value | $175,000 | $0 |
| Median Household Income | - | - |
| Monthly Housing Costs | $467 | $4 |
| Real Estate Taxes | $2,833 | $0 |
Property Value by Mortgage Status in Cressey
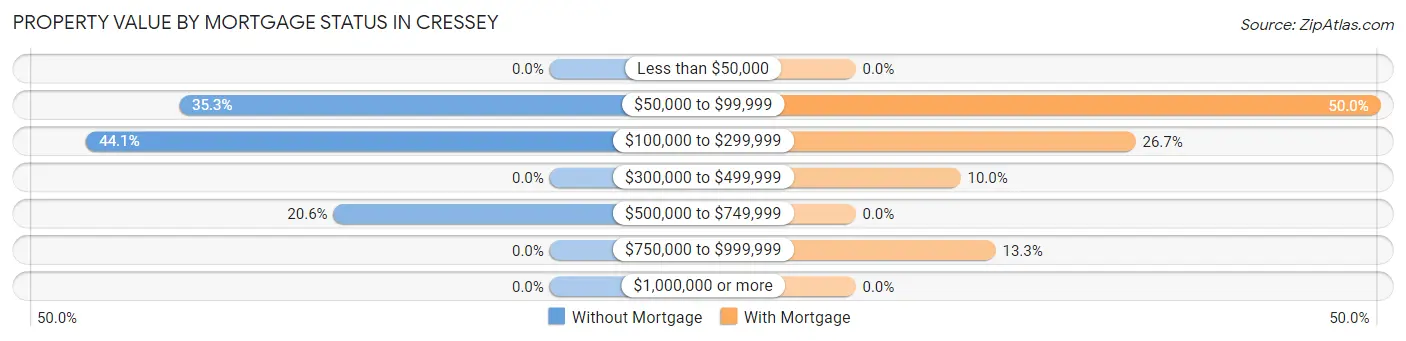
| Property Value | Without Mortgage | With Mortgage |
| Less than $50,000 | 0 (0.0%) | 0 (0.0%) |
| $50,000 to $99,999 | 12 (35.3%) | 15 (50.0%) |
| $100,000 to $299,999 | 15 (44.1%) | 8 (26.7%) |
| $300,000 to $499,999 | 0 (0.0%) | 3 (10.0%) |
| $500,000 to $749,999 | 7 (20.6%) | 0 (0.0%) |
| $750,000 to $999,999 | 0 (0.0%) | 4 (13.3%) |
| $1,000,000 or more | 0 (0.0%) | 0 (0.0%) |
| Total | 34 (100.0%) | 30 (100.0%) |
Household Income by Mortgage Status in Cressey
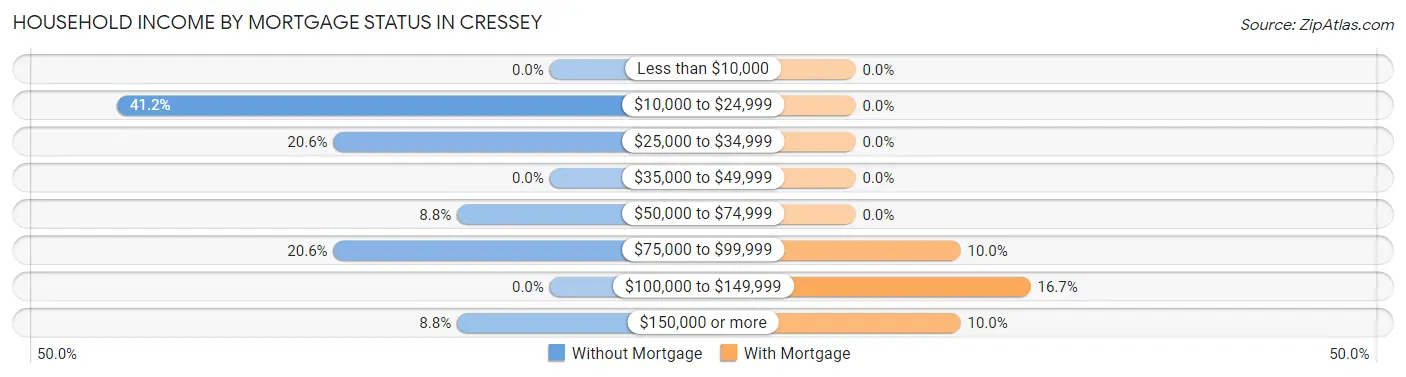
| Household Income | Without Mortgage | With Mortgage |
| Less than $10,000 | 0 (0.0%) | 0 (0.0%) |
| $10,000 to $24,999 | 14 (41.2%) | 0 (0.0%) |
| $25,000 to $34,999 | 7 (20.6%) | 0 (0.0%) |
| $35,000 to $49,999 | 0 (0.0%) | 0 (0.0%) |
| $50,000 to $74,999 | 3 (8.8%) | 0 (0.0%) |
| $75,000 to $99,999 | 7 (20.6%) | 3 (10.0%) |
| $100,000 to $149,999 | 0 (0.0%) | 5 (16.7%) |
| $150,000 or more | 3 (8.8%) | 3 (10.0%) |
| Total | 34 (100.0%) | 30 (100.0%) |
Property Value to Household Income Ratio in Cressey
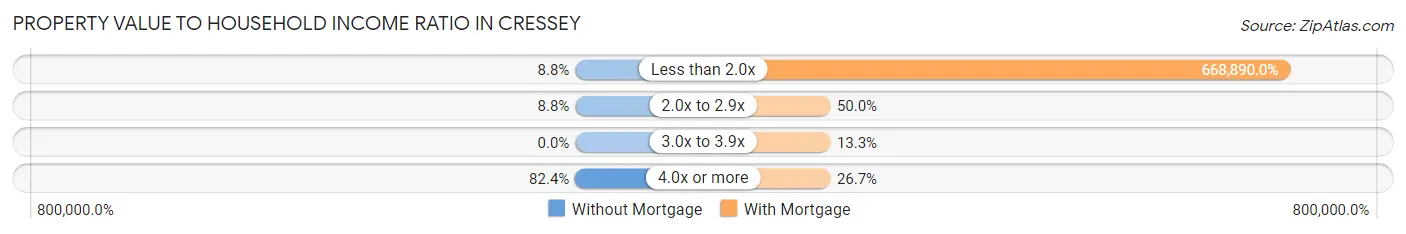
| Value-to-Income Ratio | Without Mortgage | With Mortgage |
| Less than 2.0x | 3 (8.8%) | 200,667 (668,890.0%) |
| 2.0x to 2.9x | 3 (8.8%) | 15 (50.0%) |
| 3.0x to 3.9x | 0 (0.0%) | 4 (13.3%) |
| 4.0x or more | 28 (82.4%) | 8 (26.7%) |
| Total | 34 (100.0%) | 30 (100.0%) |
Real Estate Taxes by Mortgage Status in Cressey
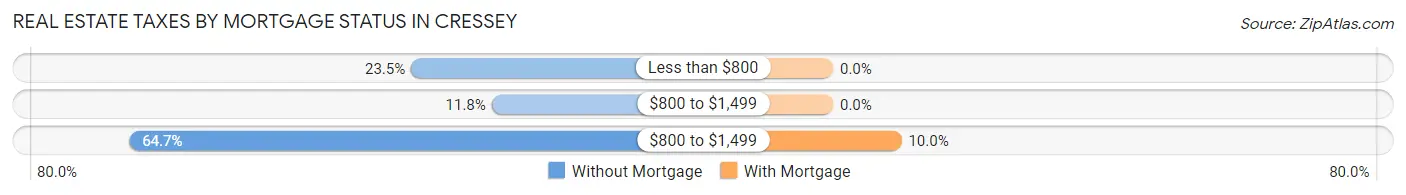
| Property Taxes | Without Mortgage | With Mortgage |
| Less than $800 | 8 (23.5%) | 0 (0.0%) |
| $800 to $1,499 | 4 (11.8%) | 0 (0.0%) |
| $800 to $1,499 | 22 (64.7%) | 3 (10.0%) |
| Total | 34 (100.0%) | 30 (100.0%) |
Health & Disability in Cressey
Health Insurance Coverage by Age in Cressey
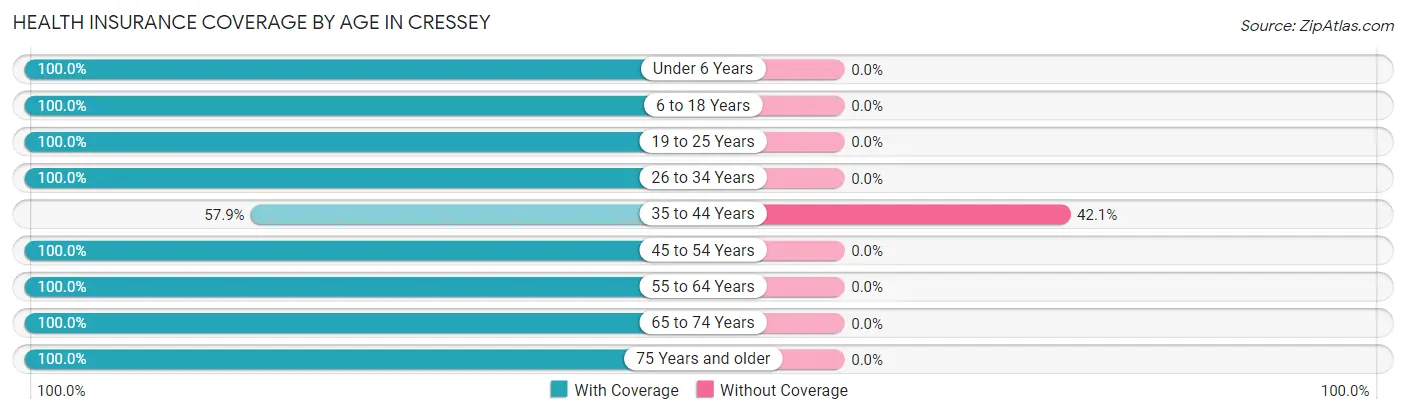
| Age Bracket | With Coverage | Without Coverage |
| Under 6 Years | 63 (100.0%) | 0 (0.0%) |
| 6 to 18 Years | 45 (100.0%) | 0 (0.0%) |
| 19 to 25 Years | 31 (100.0%) | 0 (0.0%) |
| 26 to 34 Years | 39 (100.0%) | 0 (0.0%) |
| 35 to 44 Years | 22 (57.9%) | 16 (42.1%) |
| 45 to 54 Years | 36 (100.0%) | 0 (0.0%) |
| 55 to 64 Years | 28 (100.0%) | 0 (0.0%) |
| 65 to 74 Years | 37 (100.0%) | 0 (0.0%) |
| 75 Years and older | 39 (100.0%) | 0 (0.0%) |
| Total | 340 (95.5%) | 16 (4.5%) |
Health Insurance Coverage by Citizenship Status in Cressey
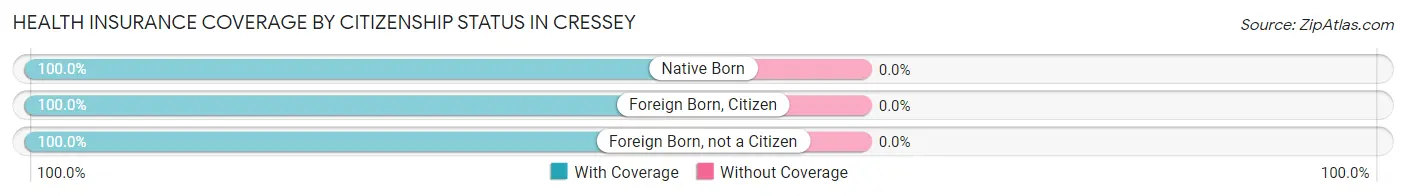
| Citizenship Status | With Coverage | Without Coverage |
| Native Born | 63 (100.0%) | 0 (0.0%) |
| Foreign Born, Citizen | 45 (100.0%) | 0 (0.0%) |
| Foreign Born, not a Citizen | 31 (100.0%) | 0 (0.0%) |
Health Insurance Coverage by Household Income in Cressey
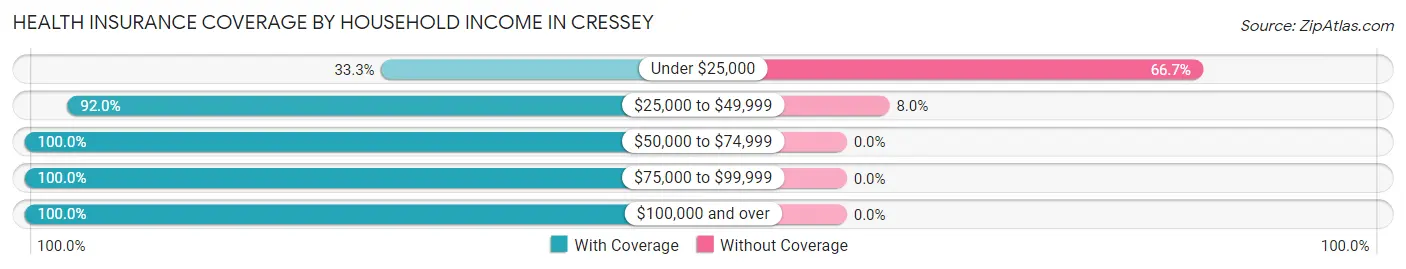
| Household Income | With Coverage | Without Coverage |
| Under $25,000 | 6 (33.3%) | 12 (66.7%) |
| $25,000 to $49,999 | 46 (92.0%) | 4 (8.0%) |
| $50,000 to $74,999 | 75 (100.0%) | 0 (0.0%) |
| $75,000 to $99,999 | 98 (100.0%) | 0 (0.0%) |
| $100,000 and over | 115 (100.0%) | 0 (0.0%) |
Public vs Private Health Insurance Coverage by Age in Cressey
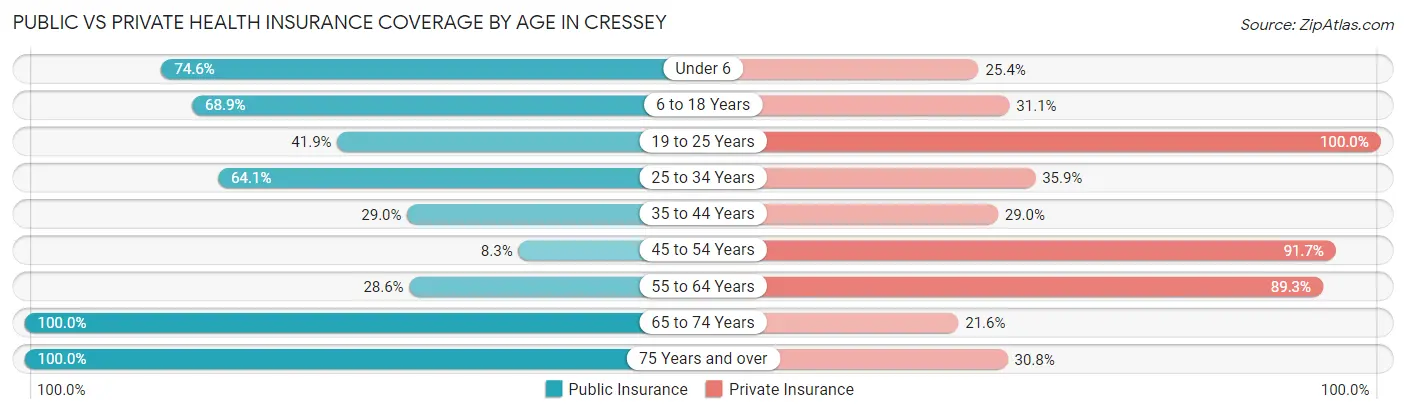
| Age Bracket | Public Insurance | Private Insurance |
| Under 6 | 47 (74.6%) | 16 (25.4%) |
| 6 to 18 Years | 31 (68.9%) | 14 (31.1%) |
| 19 to 25 Years | 13 (41.9%) | 31 (100.0%) |
| 25 to 34 Years | 25 (64.1%) | 14 (35.9%) |
| 35 to 44 Years | 11 (28.9%) | 11 (28.9%) |
| 45 to 54 Years | 3 (8.3%) | 33 (91.7%) |
| 55 to 64 Years | 8 (28.6%) | 25 (89.3%) |
| 65 to 74 Years | 37 (100.0%) | 8 (21.6%) |
| 75 Years and over | 39 (100.0%) | 12 (30.8%) |
| Total | 214 (60.1%) | 164 (46.1%) |
Disability Status by Sex by Age in Cressey
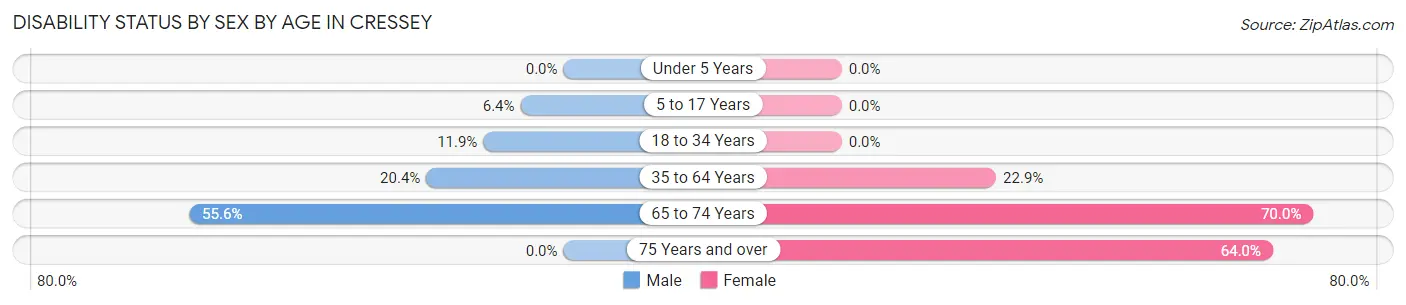
| Age Bracket | Male | Female |
| Under 5 Years | 0 (0.0%) | 0 (0.0%) |
| 5 to 17 Years | 3 (6.4%) | 0 (0.0%) |
| 18 to 34 Years | 5 (11.9%) | 0 (0.0%) |
| 35 to 64 Years | 11 (20.4%) | 11 (22.9%) |
| 65 to 74 Years | 15 (55.6%) | 7 (70.0%) |
| 75 Years and over | 0 (0.0%) | 16 (64.0%) |
Disability Class by Sex by Age in Cressey
Disability Class: Hearing Difficulty
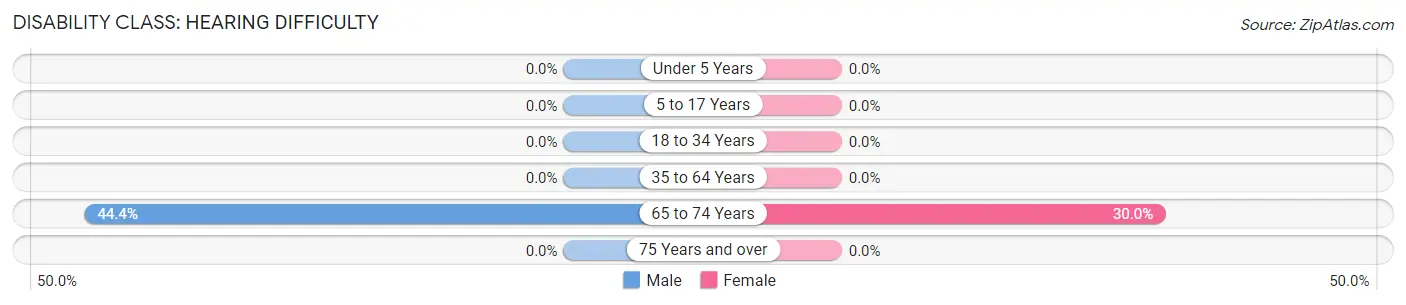
| Age Bracket | Male | Female |
| Under 5 Years | 0 (0.0%) | 0 (0.0%) |
| 5 to 17 Years | 0 (0.0%) | 0 (0.0%) |
| 18 to 34 Years | 0 (0.0%) | 0 (0.0%) |
| 35 to 64 Years | 0 (0.0%) | 0 (0.0%) |
| 65 to 74 Years | 12 (44.4%) | 3 (30.0%) |
| 75 Years and over | 0 (0.0%) | 0 (0.0%) |
Disability Class: Vision Difficulty
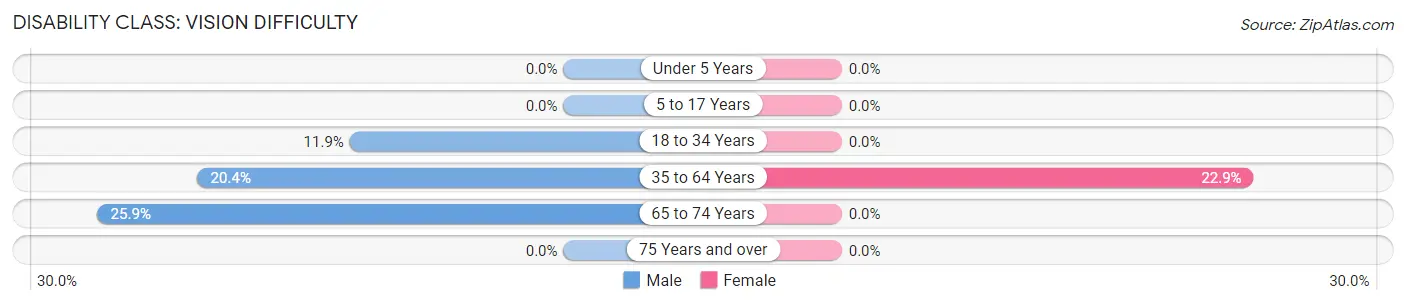
| Age Bracket | Male | Female |
| Under 5 Years | 0 (0.0%) | 0 (0.0%) |
| 5 to 17 Years | 0 (0.0%) | 0 (0.0%) |
| 18 to 34 Years | 5 (11.9%) | 0 (0.0%) |
| 35 to 64 Years | 11 (20.4%) | 11 (22.9%) |
| 65 to 74 Years | 7 (25.9%) | 0 (0.0%) |
| 75 Years and over | 0 (0.0%) | 0 (0.0%) |
Disability Class: Cognitive Difficulty
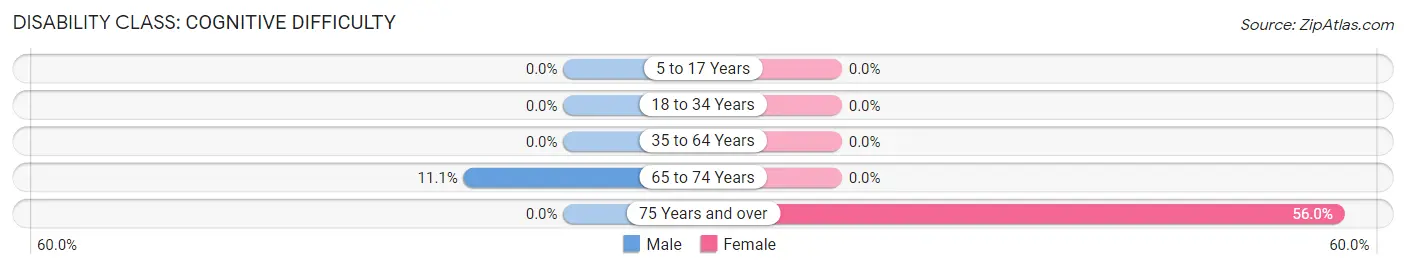
| Age Bracket | Male | Female |
| 5 to 17 Years | 0 (0.0%) | 0 (0.0%) |
| 18 to 34 Years | 0 (0.0%) | 0 (0.0%) |
| 35 to 64 Years | 0 (0.0%) | 0 (0.0%) |
| 65 to 74 Years | 3 (11.1%) | 0 (0.0%) |
| 75 Years and over | 0 (0.0%) | 14 (56.0%) |
Disability Class: Ambulatory Difficulty
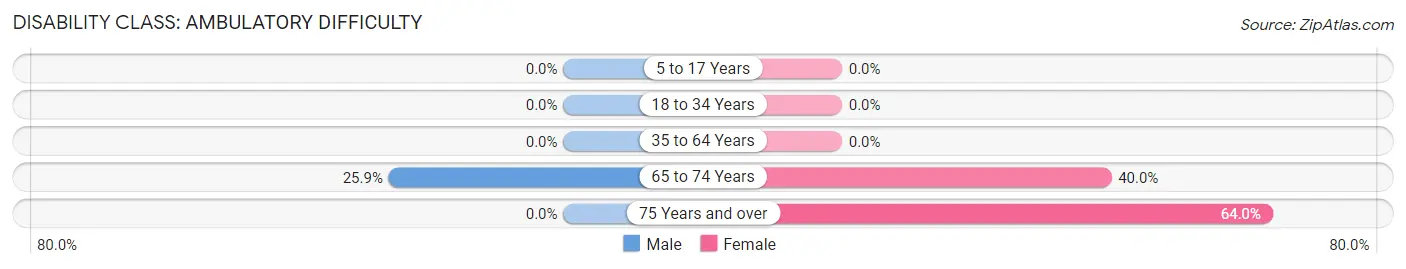
| Age Bracket | Male | Female |
| 5 to 17 Years | 0 (0.0%) | 0 (0.0%) |
| 18 to 34 Years | 0 (0.0%) | 0 (0.0%) |
| 35 to 64 Years | 0 (0.0%) | 0 (0.0%) |
| 65 to 74 Years | 7 (25.9%) | 4 (40.0%) |
| 75 Years and over | 0 (0.0%) | 16 (64.0%) |
Disability Class: Self-Care Difficulty
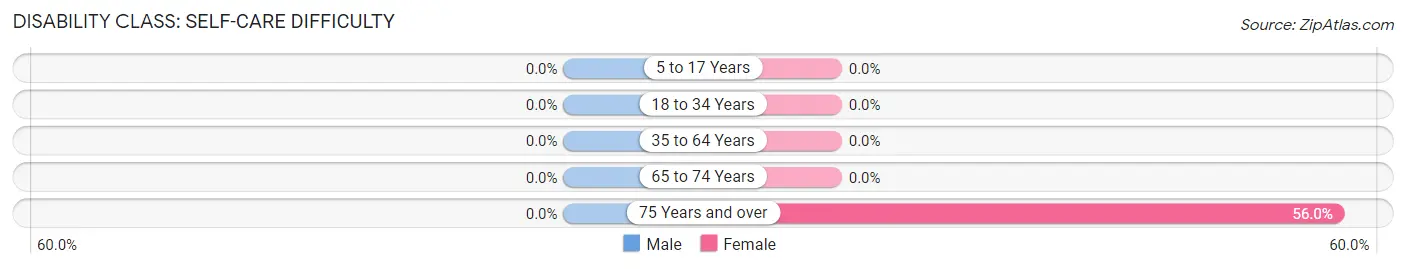
| Age Bracket | Male | Female |
| 5 to 17 Years | 0 (0.0%) | 0 (0.0%) |
| 18 to 34 Years | 0 (0.0%) | 0 (0.0%) |
| 35 to 64 Years | 0 (0.0%) | 0 (0.0%) |
| 65 to 74 Years | 0 (0.0%) | 0 (0.0%) |
| 75 Years and over | 0 (0.0%) | 14 (56.0%) |
Technology Access in Cressey
Computing Device Access in Cressey
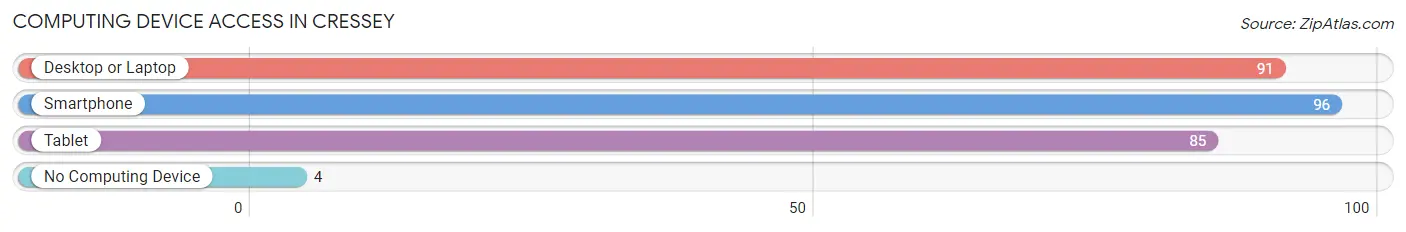
| Device Type | # Households | % Households |
| Desktop or Laptop | 91 | 88.3% |
| Smartphone | 96 | 93.2% |
| Tablet | 85 | 82.5% |
| No Computing Device | 4 | 3.9% |
| Total | 103 | 100.0% |
Internet Access in Cressey
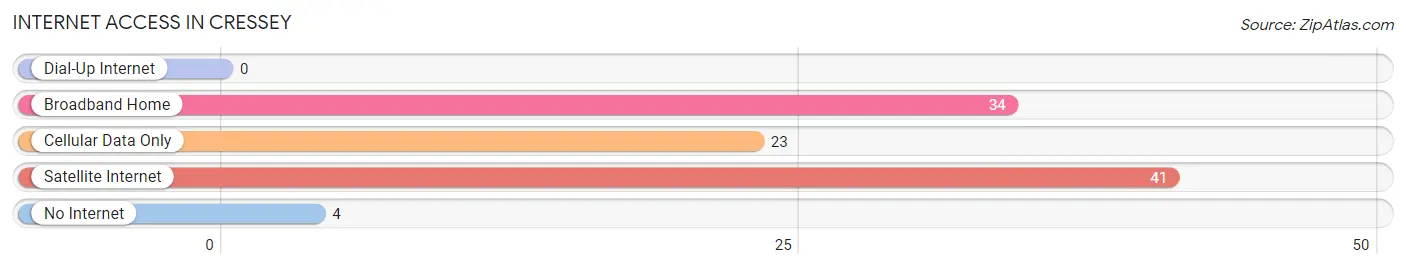
| Internet Type | # Households | % Households |
| Dial-Up Internet | 0 | 0.0% |
| Broadband Home | 34 | 33.0% |
| Cellular Data Only | 23 | 22.3% |
| Satellite Internet | 41 | 39.8% |
| No Internet | 4 | 3.9% |
| Total | 103 | 100.0% |
Cressey Summary
Cressey is a small unincorporated community located in Merced County, California. It is situated in the San Joaquin Valley, approximately 8 miles east of Atwater and 8 miles west of Livingston. The population of Cressey was estimated to be 1,845 in 2019.
History
Cressey was founded in 1891 by William Cressey, a rancher from the Midwest. He purchased a large tract of land in the area and began to develop it for agricultural purposes. The town was named after him. In the early 1900s, Cressey was a thriving agricultural community, with a population of around 500 people. The town was home to a variety of businesses, including a general store, a blacksmith shop, a hotel, and a post office.
In the 1920s, Cressey began to experience a decline in population as many of its residents moved away in search of better economic opportunities. By the 1940s, the population had dropped to around 200 people. In the 1950s, the town experienced a resurgence in population as many of its former residents returned to the area.
Geography
Cressey is located in the San Joaquin Valley, approximately 8 miles east of Atwater and 8 miles west of Livingston. The town is situated at an elevation of approximately 200 feet above sea level. The climate in Cressey is hot and dry in the summer months, with temperatures reaching up to 100 degrees Fahrenheit. Winters are mild, with temperatures rarely dropping below freezing.
Economy
The economy of Cressey is largely based on agriculture. The town is home to a variety of farms, including almond, walnut, and pistachio farms. In addition, there are several wineries in the area. The town is also home to a variety of small businesses, including restaurants, gas stations, and convenience stores.
Demographics
As of 2019, the population of Cressey was estimated to be 1,845. The racial makeup of the town was 79.3% White, 0.7% African American, 0.3% Native American, 0.2% Asian, 0.1% Pacific Islander, 16.2% from other races, and 3.4% from two or more races. The median household income in Cressey was $45,938, and the median age was 33.5 years. The town had a poverty rate of 16.2%.
Common Questions
What is Per Capita Income in Cressey?
Per Capita income in Cressey is $25,719.
What is the Median Family Income in Cressey?
Median Family Income in Cressey is $88,438.
What is the Median Household income in Cressey?
Median Household Income in Cressey is $74,875.
What is Inequality or Gini Index in Cressey?
Inequality or Gini Index in Cressey is 0.41.
What is the Total Population of Cressey?
Total Population of Cressey is 360.
What is the Total Male Population of Cressey?
Total Male Population of Cressey is 188.
What is the Total Female Population of Cressey?
Total Female Population of Cressey is 172.
What is the Ratio of Males per 100 Females in Cressey?
There are 109.30 Males per 100 Females in Cressey.
What is the Ratio of Females per 100 Males in Cressey?
There are 91.49 Females per 100 Males in Cressey.
What is the Median Population Age in Cressey?
Median Population Age in Cressey is 32.8 Years.
What is the Average Family Size in Cressey
Average Family Size in Cressey is 3.8 People.
What is the Average Household Size in Cressey
Average Household Size in Cressey is 3.5 People.
How Large is the Labor Force in Cressey?
There are 135 People in the Labor Forcein in Cressey.
What is the Percentage of People in the Labor Force in Cressey?
49.8% of People are in the Labor Force in Cressey.
What is the Unemployment Rate in Cressey?
Unemployment Rate in Cressey is 5.3%.