Cottonwood, CA Map & Demographics
Cottonwood Map
Cottonwood Overview
$46,245
PER CAPITA INCOME
$105,208
AVG FAMILY INCOME
$90,231
AVG HOUSEHOLD INCOME
30.7%
WAGE / INCOME GAP [ % ]
69.3¢/ $1
WAGE / INCOME GAP [ $ ]
0.46
INEQUALITY / GINI INDEX
5,893
TOTAL POPULATION
2,870
MALE POPULATION
3,023
FEMALE POPULATION
94.94
MALES / 100 FEMALES
105.33
FEMALES / 100 MALES
40.5
MEDIAN AGE
3.0
AVG FAMILY SIZE
2.7
AVG HOUSEHOLD SIZE
2,970
LABOR FORCE [ PEOPLE ]
63.9%
PERCENT IN LABOR FORCE
3.7%
UNEMPLOYMENT RATE
Cottonwood Zip Codes
Cottonwood Area Codes
Income in Cottonwood
Income Overview in Cottonwood
Per Capita Income in Cottonwood is $46,245, while median incomes of families and households are $105,208 and $90,231 respectively.
| Characteristic | Number | Measure |
| Per Capita Income | 5,893 | $46,245 |
| Median Family Income | 1,680 | $105,208 |
| Mean Family Income | 1,680 | $138,076 |
| Median Household Income | 2,205 | $90,231 |
| Mean Household Income | 2,205 | $122,931 |
| Income Deficit | 1,680 | $0 |
| Wage / Income Gap (%) | 5,893 | 30.70% |
| Wage / Income Gap ($) | 5,893 | 69.30¢ per $1 |
| Gini / Inequality Index | 5,893 | 0.46 |
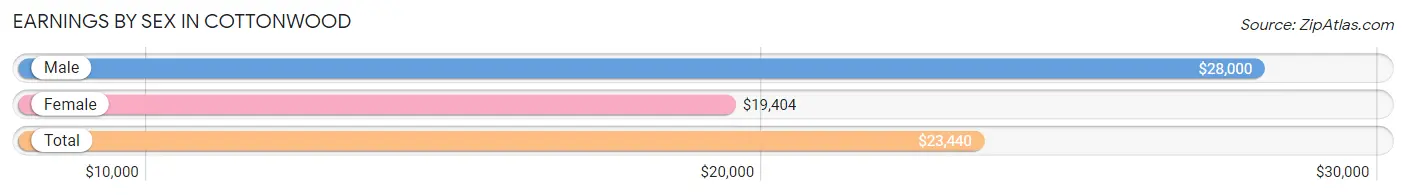
Earnings by Sex in Cottonwood
Average Earnings in Cottonwood are $23,440, $28,000 for men and $19,404 for women, a difference of 30.7%.
| Sex | Number | Average Earnings |
| Male | 1,531 (50.4%) | $28,000 |
| Female | 1,507 (49.6%) | $19,404 |
| Total | 3,038 (100.0%) | $23,440 |
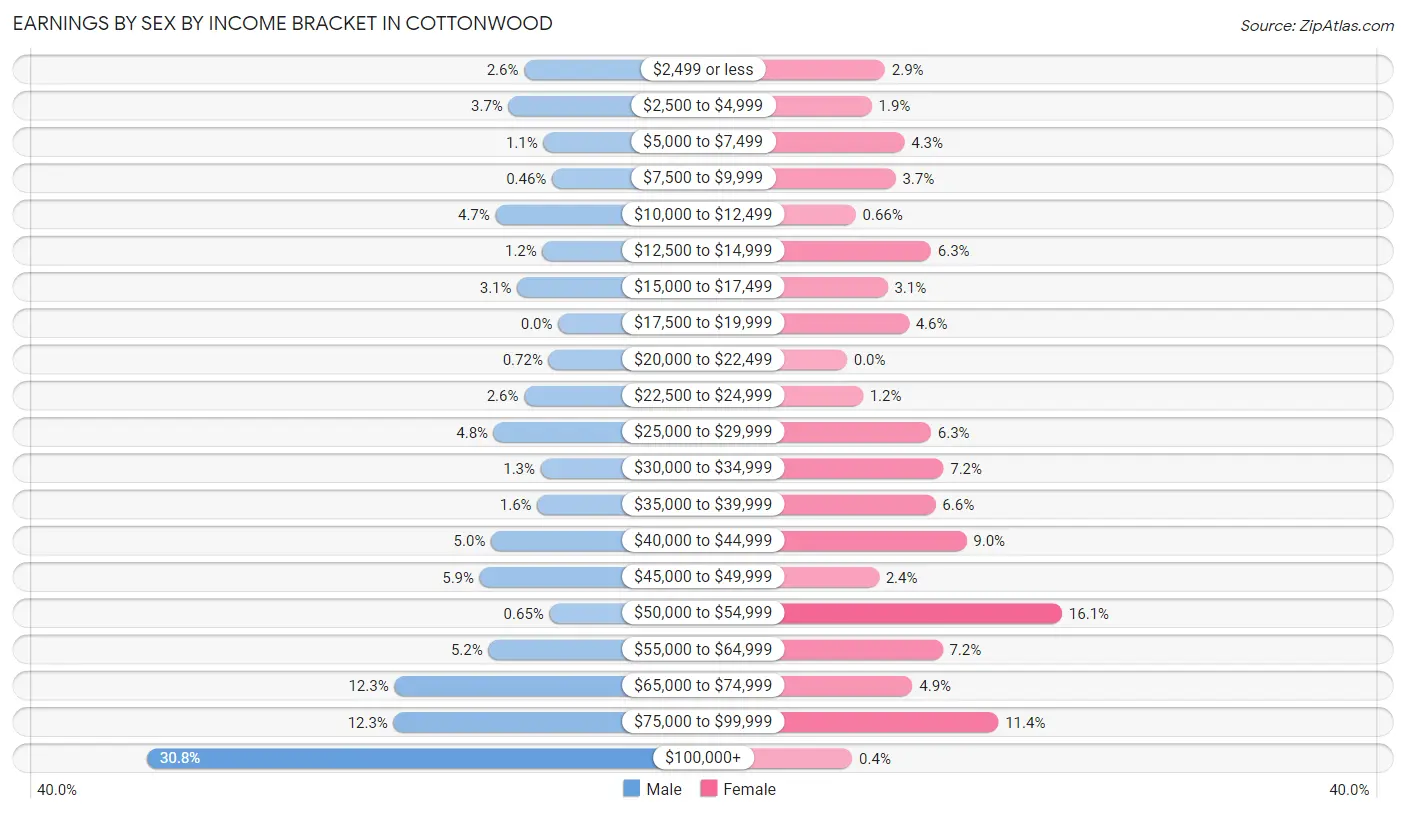
Earnings by Sex by Income Bracket in Cottonwood
The most common earnings brackets in Cottonwood are $100,000+ for men (472 | 30.8%) and $50,000 to $54,999 for women (243 | 16.1%).
| Income | Male | Female |
| $2,499 or less | 39 (2.5%) | 43 (2.9%) |
| $2,500 to $4,999 | 57 (3.7%) | 28 (1.9%) |
| $5,000 to $7,499 | 17 (1.1%) | 65 (4.3%) |
| $7,500 to $9,999 | 7 (0.5%) | 55 (3.6%) |
| $10,000 to $12,499 | 72 (4.7%) | 10 (0.7%) |
| $12,500 to $14,999 | 18 (1.2%) | 95 (6.3%) |
| $15,000 to $17,499 | 47 (3.1%) | 46 (3.0%) |
| $17,500 to $19,999 | 0 (0.0%) | 70 (4.6%) |
| $20,000 to $22,499 | 11 (0.7%) | 0 (0.0%) |
| $22,500 to $24,999 | 39 (2.5%) | 18 (1.2%) |
| $25,000 to $29,999 | 74 (4.8%) | 95 (6.3%) |
| $30,000 to $34,999 | 20 (1.3%) | 109 (7.2%) |
| $35,000 to $39,999 | 24 (1.6%) | 100 (6.6%) |
| $40,000 to $44,999 | 77 (5.0%) | 135 (9.0%) |
| $45,000 to $49,999 | 90 (5.9%) | 36 (2.4%) |
| $50,000 to $54,999 | 10 (0.6%) | 243 (16.1%) |
| $55,000 to $64,999 | 80 (5.2%) | 108 (7.2%) |
| $65,000 to $74,999 | 188 (12.3%) | 74 (4.9%) |
| $75,000 to $99,999 | 189 (12.3%) | 171 (11.4%) |
| $100,000+ | 472 (30.8%) | 6 (0.4%) |
| Total | 1,531 (100.0%) | 1,507 (100.0%) |
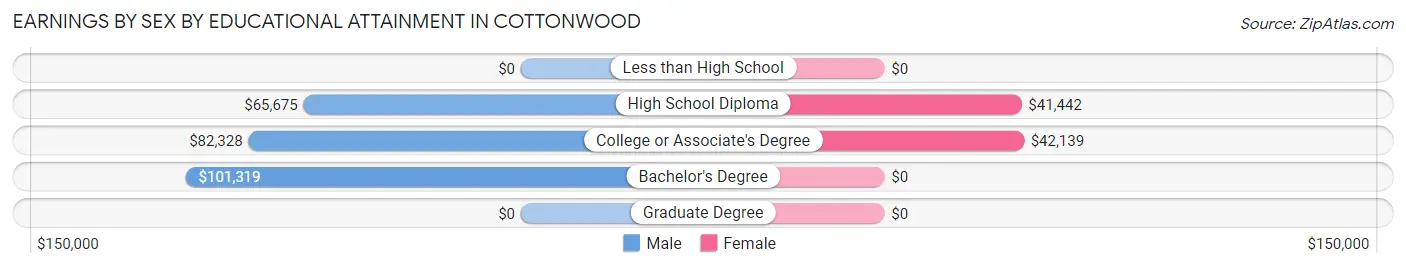
Earnings by Sex by Educational Attainment in Cottonwood
Average earnings in Cottonwood are $69,821 for men and $41,748 for women, a difference of 40.2%. Men with an educational attainment of bachelor's degree enjoy the highest average annual earnings of $101,319, while those with high school diploma education earn the least with $65,675. Women with an educational attainment of college or associate's degree earn the most with the average annual earnings of $42,139, while those with high school diploma education have the smallest earnings of $41,442.
| Educational Attainment | Male Income | Female Income |
| Less than High School | - | - |
| High School Diploma | $65,675 | $41,442 |
| College or Associate's Degree | $82,328 | $42,139 |
| Bachelor's Degree | $101,319 | $0 |
| Graduate Degree | - | - |
| Total | $69,821 | $41,748 |
Family Income in Cottonwood
Family Income Brackets in Cottonwood
According to the Cottonwood family income data, there are 438 families falling into the $100,000 to $149,999 income range, which is the most common income bracket and makes up 26.1% of all families.
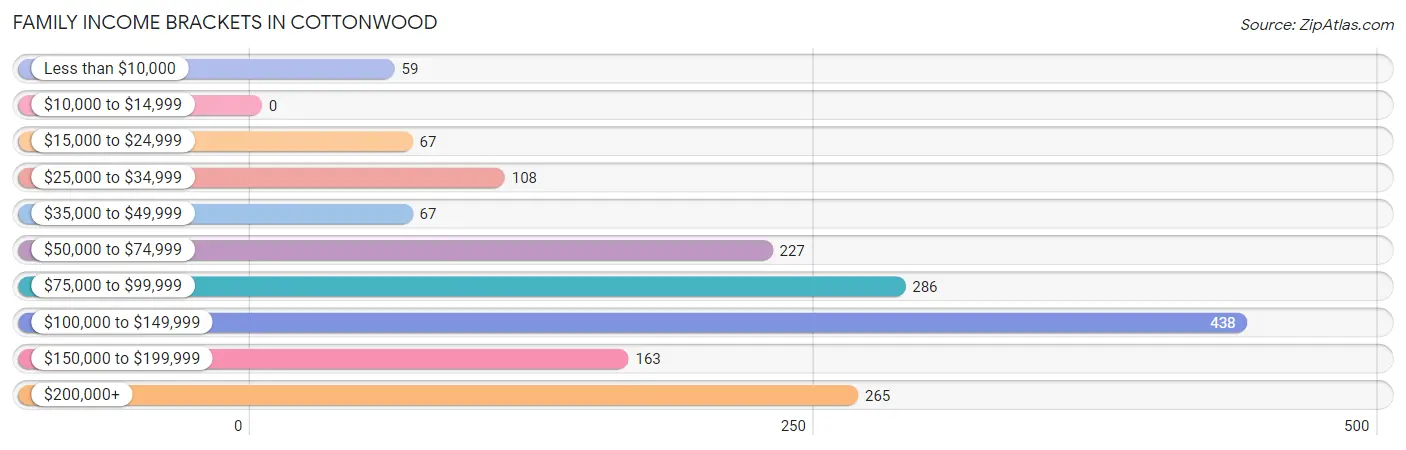
| Income Bracket | # Families | % Families |
| Less than $10,000 | 59 | 3.5% |
| $10,000 to $14,999 | 0 | 0.0% |
| $15,000 to $24,999 | 67 | 4.0% |
| $25,000 to $34,999 | 108 | 6.4% |
| $35,000 to $49,999 | 67 | 4.0% |
| $50,000 to $74,999 | 227 | 13.5% |
| $75,000 to $99,999 | 286 | 17.0% |
| $100,000 to $149,999 | 438 | 26.1% |
| $150,000 to $199,999 | 163 | 9.7% |
| $200,000+ | 265 | 15.8% |
Family Income by Famaliy Size in Cottonwood
4-person families (262 | 15.6%) account for the highest median family income in Cottonwood with $250,001 per family, while 4-person families (262 | 15.6%) have the highest median income of $62,500 per family member.
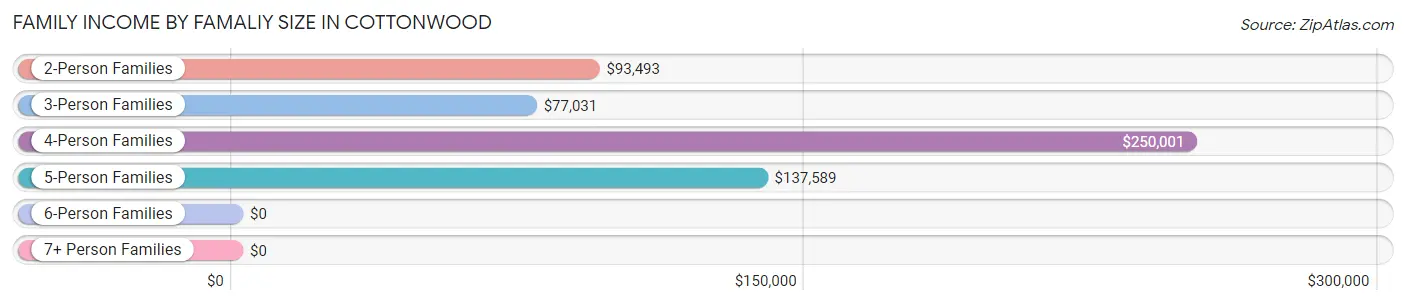
| Income Bracket | # Families | Median Income |
| 2-Person Families | 797 (47.4%) | $93,493 |
| 3-Person Families | 430 (25.6%) | $77,031 |
| 4-Person Families | 262 (15.6%) | $250,001 |
| 5-Person Families | 123 (7.3%) | $137,589 |
| 6-Person Families | 46 (2.7%) | $0 |
| 7+ Person Families | 22 (1.3%) | $0 |
| Total | 1,680 (100.0%) | $105,208 |
Family Income by Number of Earners in Cottonwood
The median family income in Cottonwood is $105,208, with families comprising 3+ earners (93) having the highest median family income of $149,656, while families with no earners (322) have the lowest median family income of $52,143, accounting for 5.5% and 19.2% of families, respectively.
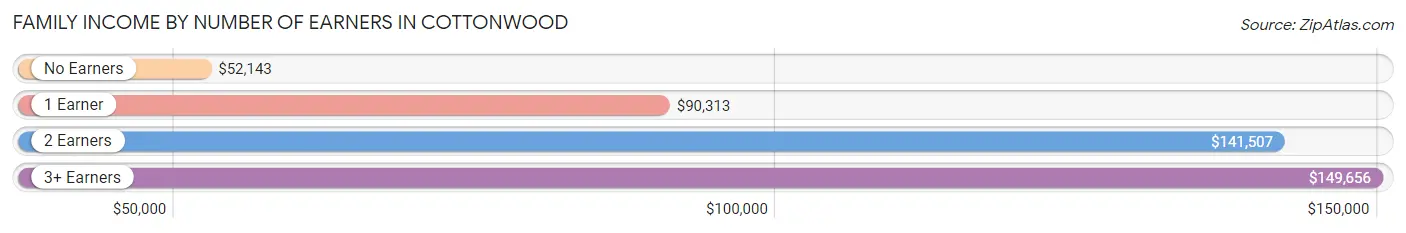
| Number of Earners | # Families | Median Income |
| No Earners | 322 (19.2%) | $52,143 |
| 1 Earner | 497 (29.6%) | $90,313 |
| 2 Earners | 768 (45.7%) | $141,507 |
| 3+ Earners | 93 (5.5%) | $149,656 |
| Total | 1,680 (100.0%) | $105,208 |
Household Income in Cottonwood
Household Income Brackets in Cottonwood
With 467 households falling in the category, the $100,000 to $149,999 income range is the most frequent in Cottonwood, accounting for 21.2% of all households. In contrast, only 71 households (3.2%) fall into the $10,000 to $14,999 income bracket, making it the least populous group.
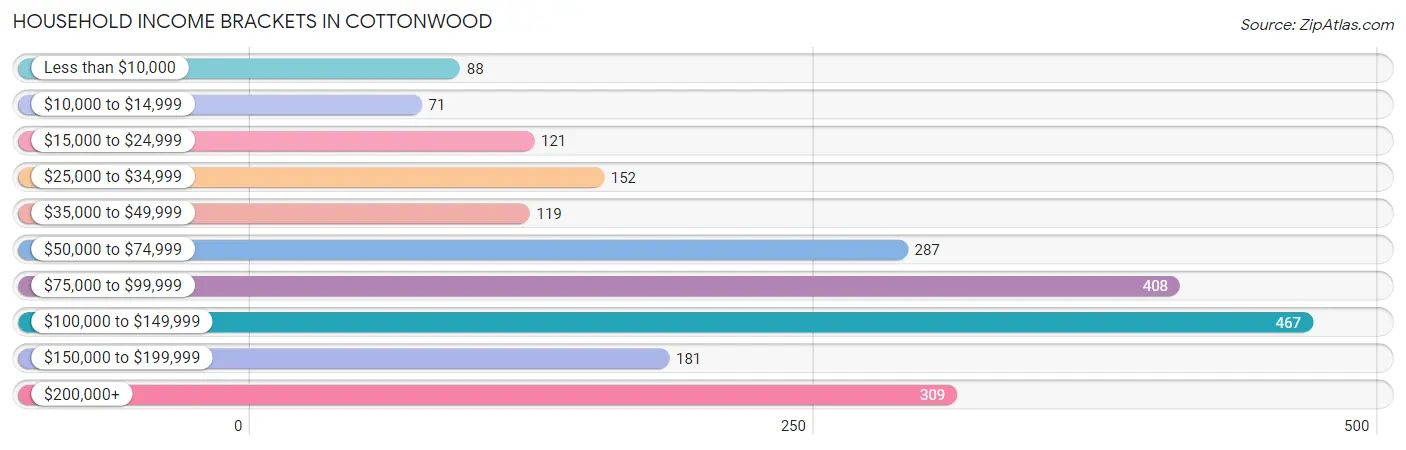
| Income Bracket | # Households | % Households |
| Less than $10,000 | 88 | 4.0% |
| $10,000 to $14,999 | 71 | 3.2% |
| $15,000 to $24,999 | 121 | 5.5% |
| $25,000 to $34,999 | 152 | 6.9% |
| $35,000 to $49,999 | 119 | 5.4% |
| $50,000 to $74,999 | 287 | 13.0% |
| $75,000 to $99,999 | 408 | 18.5% |
| $100,000 to $149,999 | 467 | 21.2% |
| $150,000 to $199,999 | 181 | 8.2% |
| $200,000+ | 309 | 14.0% |
Household Income by Householder Age in Cottonwood
The median household income in Cottonwood is $90,231, with the highest median household income of $134,333 found in the 25 to 44 years age bracket for the primary householder. A total of 656 households (29.7%) fall into this category. Meanwhile, the 15 to 24 years age bracket for the primary householder has the lowest median household income of $0, with 23 households (1.0%) in this group.
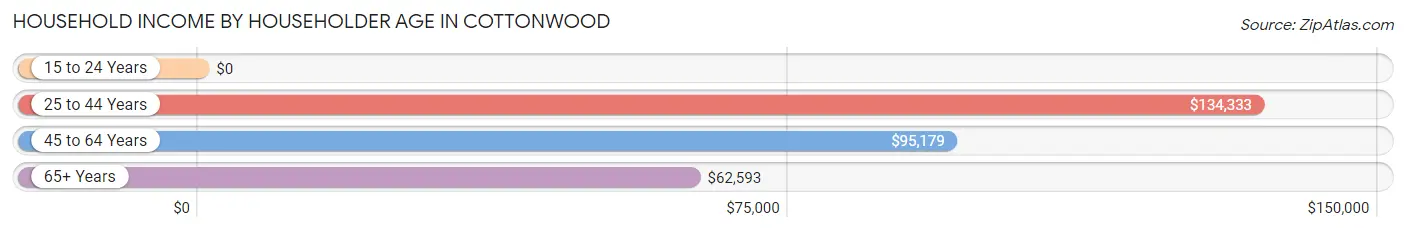
| Income Bracket | # Households | Median Income |
| 15 to 24 Years | 23 (1.0%) | $0 |
| 25 to 44 Years | 656 (29.7%) | $134,333 |
| 45 to 64 Years | 956 (43.4%) | $95,179 |
| 65+ Years | 570 (25.9%) | $62,593 |
| Total | 2,205 (100.0%) | $90,231 |
Poverty in Cottonwood
Income Below Poverty by Sex and Age in Cottonwood
With 7.6% poverty level for males and 9.6% for females among the residents of Cottonwood, 55 to 64 year old males and 5 year old females are the most vulnerable to poverty, with 94 males (25.6%) and 40 females (58.8%) in their respective age groups living below the poverty level.
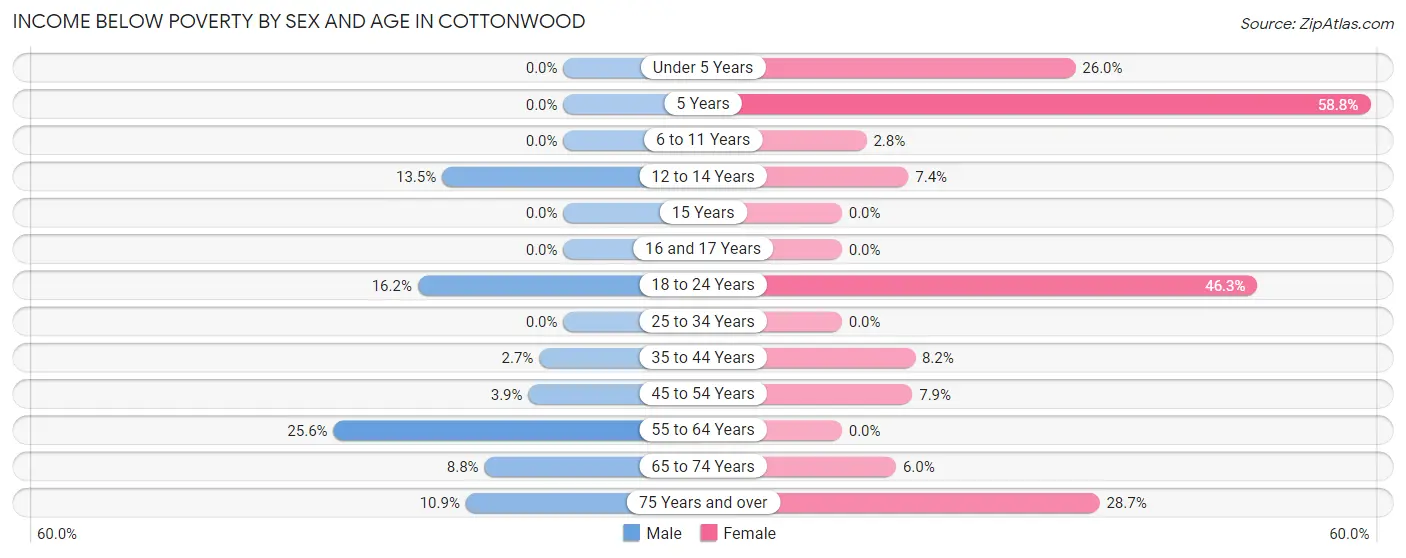
| Age Bracket | Male | Female |
| Under 5 Years | 0 (0.0%) | 45 (26.0%) |
| 5 Years | 0 (0.0%) | 40 (58.8%) |
| 6 to 11 Years | 0 (0.0%) | 9 (2.8%) |
| 12 to 14 Years | 10 (13.5%) | 8 (7.4%) |
| 15 Years | 0 (0.0%) | 0 (0.0%) |
| 16 and 17 Years | 0 (0.0%) | 0 (0.0%) |
| 18 to 24 Years | 36 (16.2%) | 62 (46.3%) |
| 25 to 34 Years | 0 (0.0%) | 0 (0.0%) |
| 35 to 44 Years | 9 (2.7%) | 49 (8.2%) |
| 45 to 54 Years | 21 (3.9%) | 26 (7.9%) |
| 55 to 64 Years | 94 (25.6%) | 0 (0.0%) |
| 65 to 74 Years | 34 (8.8%) | 19 (6.0%) |
| 75 Years and over | 15 (10.9%) | 31 (28.7%) |
| Total | 219 (7.6%) | 289 (9.6%) |
Income Above Poverty by Sex and Age in Cottonwood
According to the poverty statistics in Cottonwood, males aged under 5 years and females aged 15 years are the age groups that are most secure financially, with 100.0% of males and 100.0% of females in these age groups living above the poverty line.
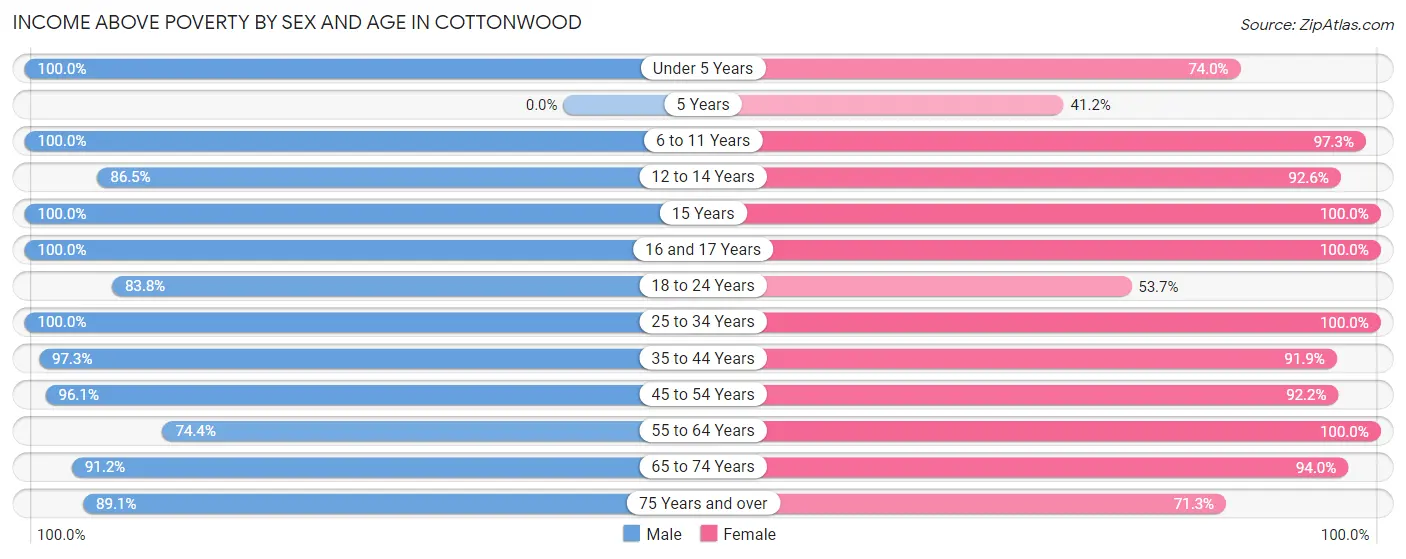
| Age Bracket | Male | Female |
| Under 5 Years | 207 (100.0%) | 128 (74.0%) |
| 5 Years | 0 (0.0%) | 28 (41.2%) |
| 6 to 11 Years | 188 (100.0%) | 318 (97.3%) |
| 12 to 14 Years | 64 (86.5%) | 100 (92.6%) |
| 15 Years | 37 (100.0%) | 63 (100.0%) |
| 16 and 17 Years | 46 (100.0%) | 29 (100.0%) |
| 18 to 24 Years | 186 (83.8%) | 72 (53.7%) |
| 25 to 34 Years | 330 (100.0%) | 371 (100.0%) |
| 35 to 44 Years | 326 (97.3%) | 552 (91.8%) |
| 45 to 54 Years | 518 (96.1%) | 305 (92.1%) |
| 55 to 64 Years | 273 (74.4%) | 395 (100.0%) |
| 65 to 74 Years | 353 (91.2%) | 296 (94.0%) |
| 75 Years and over | 123 (89.1%) | 77 (71.3%) |
| Total | 2,651 (92.4%) | 2,734 (90.4%) |
Income Below Poverty Among Married-Couple Families in Cottonwood
The poverty statistics for married-couple families in Cottonwood show that 6.1% or 85 of the total 1,390 families live below the poverty line. Families with 3 or 4 children have the highest poverty rate of 10.2%, comprising of 10 families. On the other hand, families with 1 or 2 children have the lowest poverty rate of 0.0%, which includes 0 families.
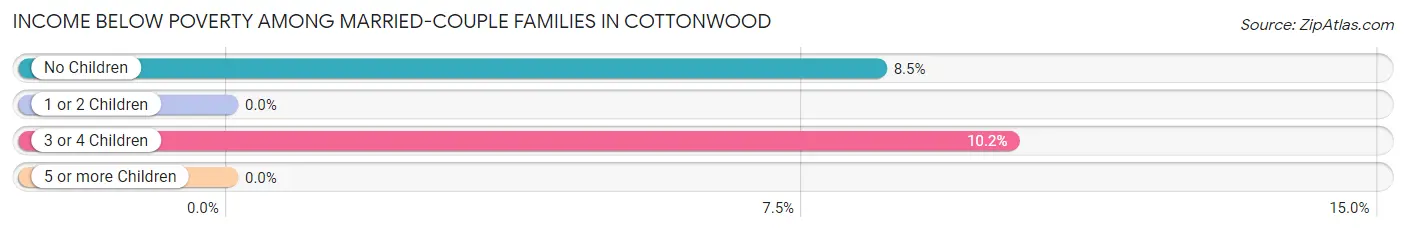
| Children | Above Poverty | Below Poverty |
| No Children | 811 (91.5%) | 75 (8.5%) |
| 1 or 2 Children | 406 (100.0%) | 0 (0.0%) |
| 3 or 4 Children | 88 (89.8%) | 10 (10.2%) |
| 5 or more Children | 0 (0.0%) | 0 (0.0%) |
| Total | 1,305 (93.9%) | 85 (6.1%) |
Income Below Poverty Among Single-Parent Households in Cottonwood
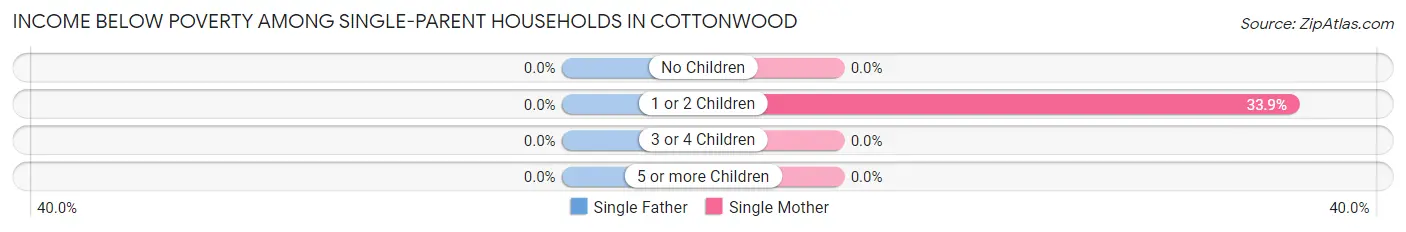
| Children | Single Father | Single Mother |
| No Children | 0 (0.0%) | 0 (0.0%) |
| 1 or 2 Children | 0 (0.0%) | 39 (33.9%) |
| 3 or 4 Children | 0 (0.0%) | 0 (0.0%) |
| 5 or more Children | 0 (0.0%) | 0 (0.0%) |
| Total | 0 (0.0%) | 39 (18.8%) |
Income Below Poverty Among Married-Couple vs Single-Parent Households in Cottonwood
The poverty data for Cottonwood shows that 85 of the married-couple family households (6.1%) and 39 of the single-parent households (13.5%) are living below the poverty level. Within the married-couple family households, those with 3 or 4 children have the highest poverty rate, with 10 households (10.2%) falling below the poverty line. Among the single-parent households, those with 1 or 2 children have the highest poverty rate, with 39 household (24.8%) living below poverty.
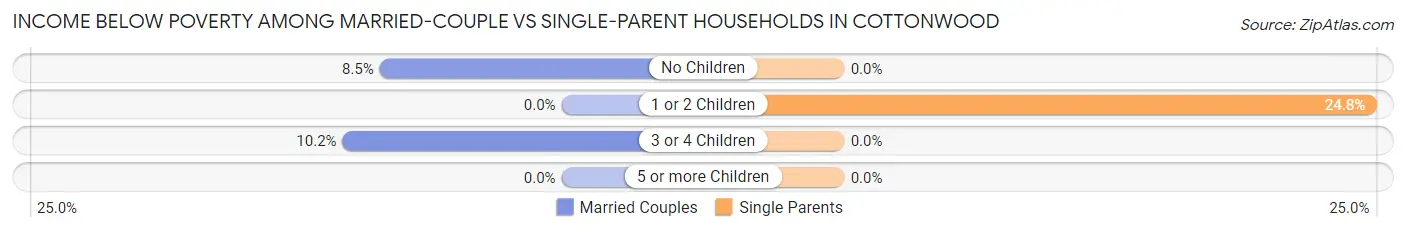
| Children | Married-Couple Families | Single-Parent Households |
| No Children | 75 (8.5%) | 0 (0.0%) |
| 1 or 2 Children | 0 (0.0%) | 39 (24.8%) |
| 3 or 4 Children | 10 (10.2%) | 0 (0.0%) |
| 5 or more Children | 0 (0.0%) | 0 (0.0%) |
| Total | 85 (6.1%) | 39 (13.5%) |
Race in Cottonwood
The most populous races in Cottonwood are White / Caucasian (4,949 | 84.0%), Hispanic or Latino (675 | 11.5%), and Two or more Races (550 | 9.3%).
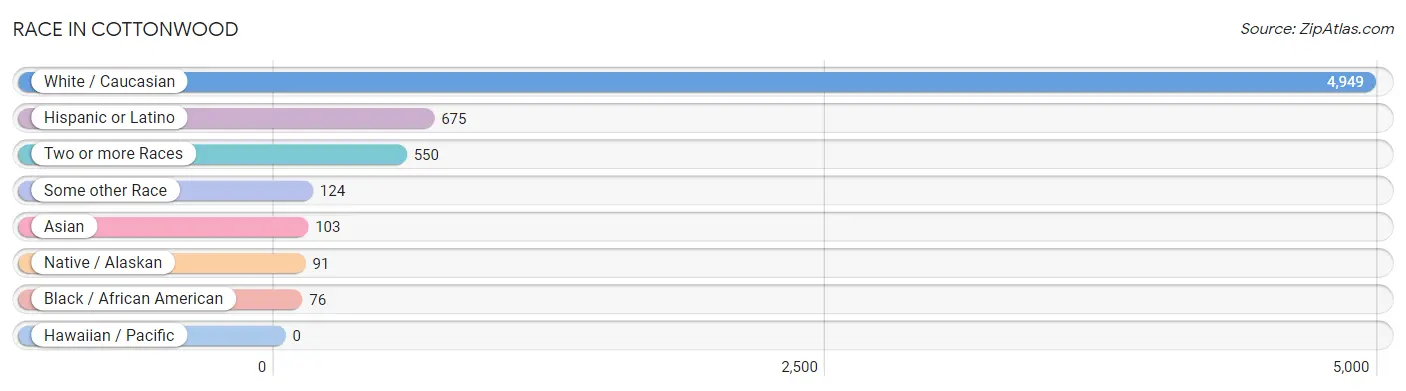
| Race | # Population | % Population |
| Asian | 103 | 1.8% |
| Black / African American | 76 | 1.3% |
| Hawaiian / Pacific | 0 | 0.0% |
| Hispanic or Latino | 675 | 11.5% |
| Native / Alaskan | 91 | 1.5% |
| White / Caucasian | 4,949 | 84.0% |
| Two or more Races | 550 | 9.3% |
| Some other Race | 124 | 2.1% |
| Total | 5,893 | 100.0% |
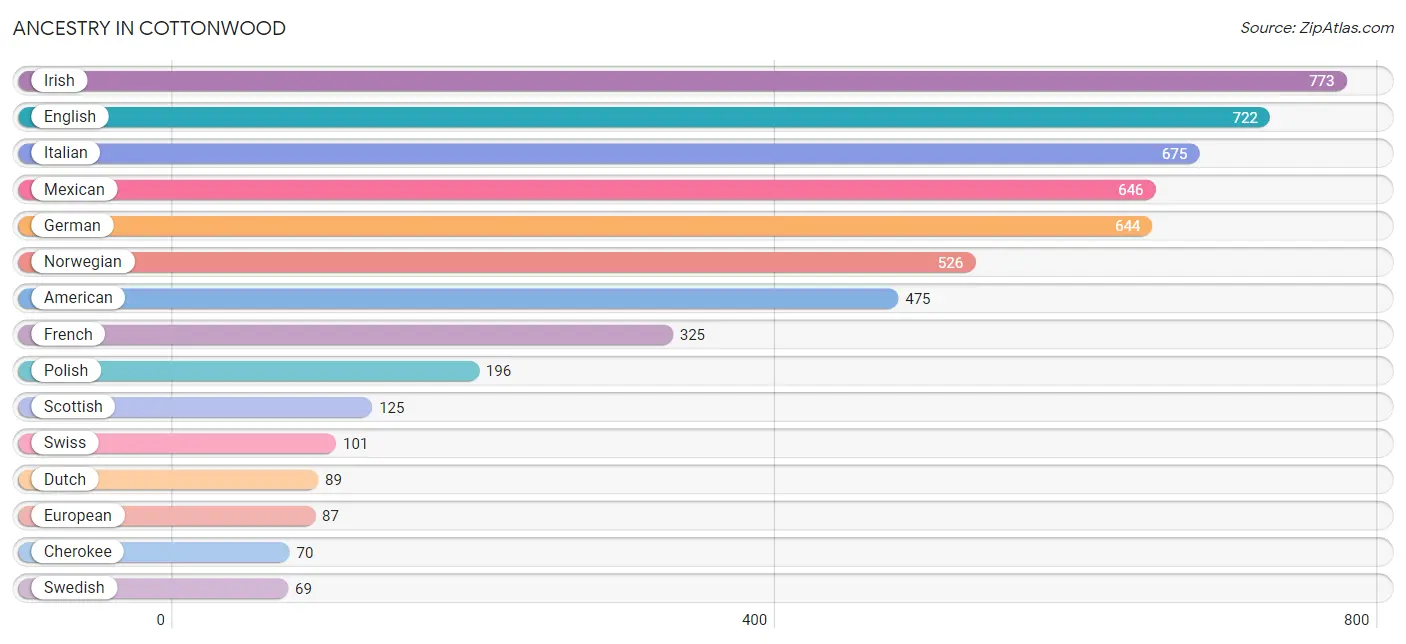
Ancestry in Cottonwood
The most populous ancestries reported in Cottonwood are Irish (773 | 13.1%), English (722 | 12.2%), Italian (675 | 11.5%), Mexican (646 | 11.0%), and German (644 | 10.9%), together accounting for 58.7% of all Cottonwood residents.
| Ancestry | # Population | % Population |
| African | 9 | 0.2% |
| Aleut | 6 | 0.1% |
| American | 475 | 8.1% |
| Bangladeshi | 7 | 0.1% |
| British | 12 | 0.2% |
| Canadian | 12 | 0.2% |
| Central American | 11 | 0.2% |
| Cherokee | 70 | 1.2% |
| Chippewa | 10 | 0.2% |
| Comanche | 11 | 0.2% |
| Danish | 21 | 0.4% |
| Dutch | 89 | 1.5% |
| Eastern European | 14 | 0.2% |
| English | 722 | 12.2% |
| European | 87 | 1.5% |
| French | 325 | 5.5% |
| French Canadian | 10 | 0.2% |
| German | 644 | 10.9% |
| Guatemalan | 11 | 0.2% |
| Hungarian | 20 | 0.3% |
| Indian (Asian) | 14 | 0.2% |
| Irish | 773 | 13.1% |
| Italian | 675 | 11.5% |
| Korean | 17 | 0.3% |
| Lithuanian | 6 | 0.1% |
| Lumbee | 7 | 0.1% |
| Mexican | 646 | 11.0% |
| Norwegian | 526 | 8.9% |
| Pakistani | 35 | 0.6% |
| Polish | 196 | 3.3% |
| Portuguese | 40 | 0.7% |
| Russian | 26 | 0.4% |
| Scandinavian | 14 | 0.2% |
| Scotch-Irish | 14 | 0.2% |
| Scottish | 125 | 2.1% |
| Shoshone | 3 | 0.1% |
| Spanish | 18 | 0.3% |
| Subsaharan African | 9 | 0.2% |
| Swedish | 69 | 1.2% |
| Swiss | 101 | 1.7% |
| Ukrainian | 46 | 0.8% | View All 41 Rows |
Immigrants in Cottonwood
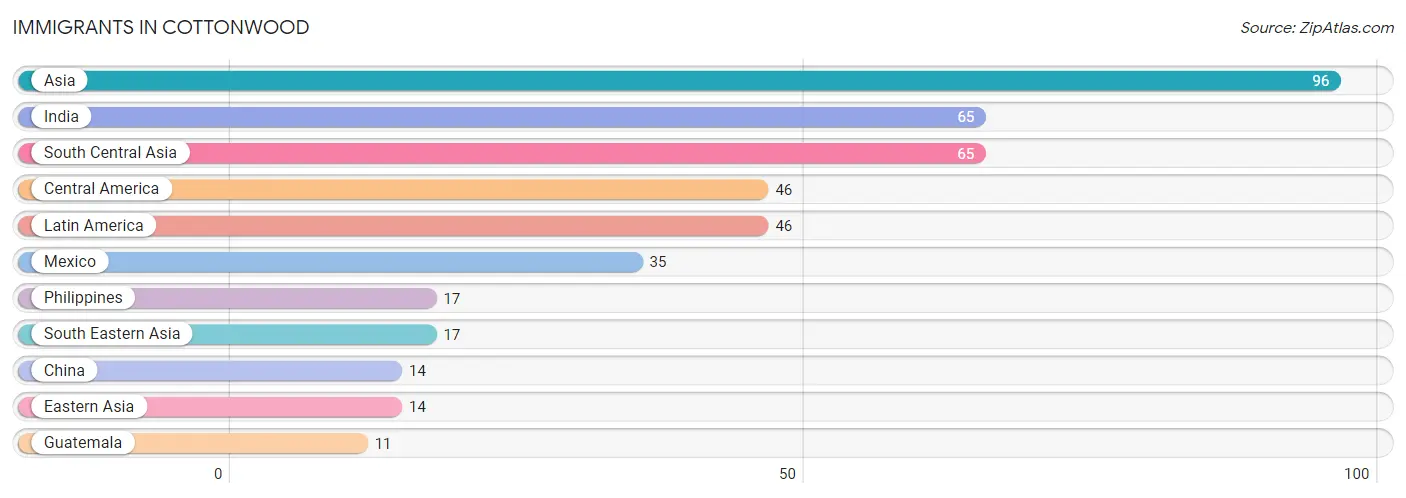
The most numerous immigrant groups reported in Cottonwood came from Asia (96 | 1.6%), India (65 | 1.1%), South Central Asia (65 | 1.1%), Central America (46 | 0.8%), and Latin America (46 | 0.8%), together accounting for 5.4% of all Cottonwood residents.
| Immigration Origin | # Population | % Population |
| Asia | 96 | 1.6% |
| Central America | 46 | 0.8% |
| China | 14 | 0.2% |
| Eastern Asia | 14 | 0.2% |
| Guatemala | 11 | 0.2% |
| India | 65 | 1.1% |
| Latin America | 46 | 0.8% |
| Mexico | 35 | 0.6% |
| Philippines | 17 | 0.3% |
| South Central Asia | 65 | 1.1% |
| South Eastern Asia | 17 | 0.3% | View All 11 Rows |
Sex and Age in Cottonwood
Sex and Age in Cottonwood
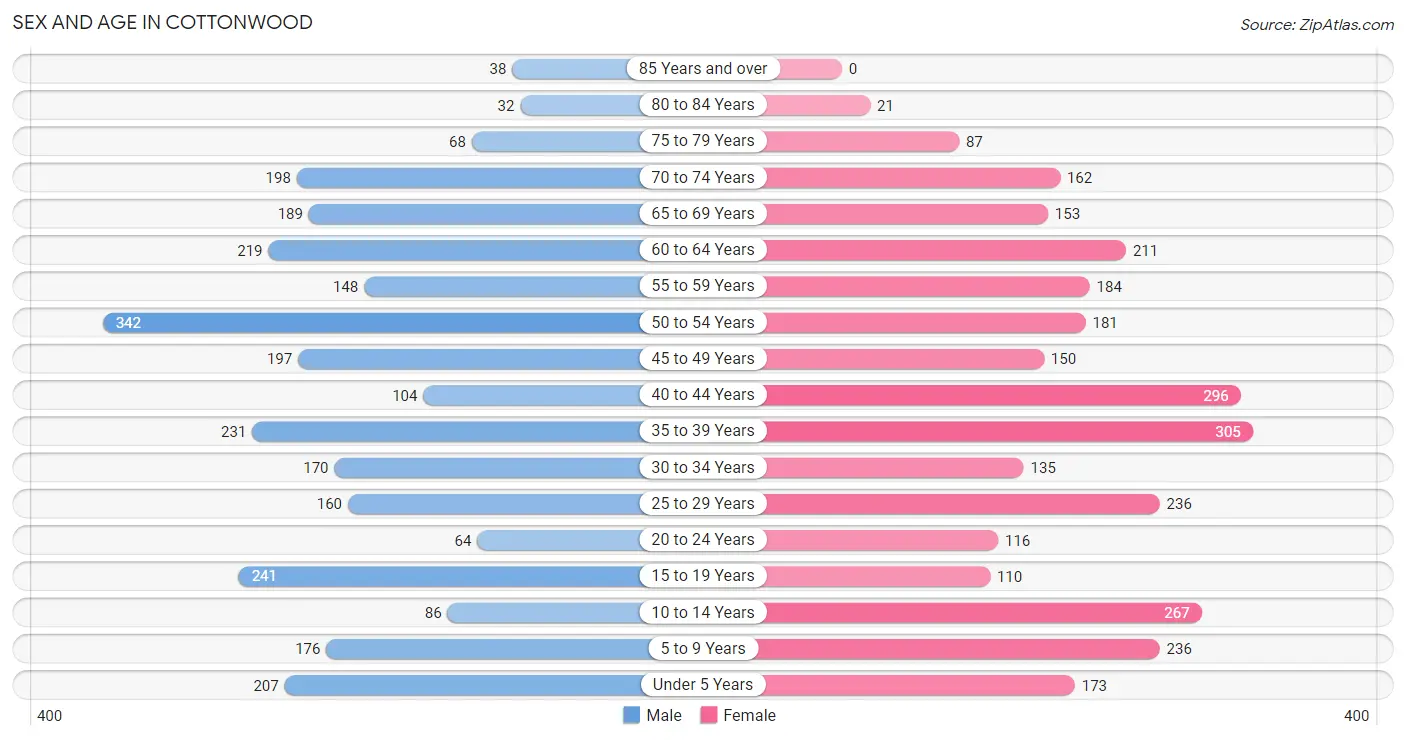
The most populous age groups in Cottonwood are 50 to 54 Years (342 | 11.9%) for men and 35 to 39 Years (305 | 10.1%) for women.
| Age Bracket | Male | Female |
| Under 5 Years | 207 (7.2%) | 173 (5.7%) |
| 5 to 9 Years | 176 (6.1%) | 236 (7.8%) |
| 10 to 14 Years | 86 (3.0%) | 267 (8.8%) |
| 15 to 19 Years | 241 (8.4%) | 110 (3.6%) |
| 20 to 24 Years | 64 (2.2%) | 116 (3.8%) |
| 25 to 29 Years | 160 (5.6%) | 236 (7.8%) |
| 30 to 34 Years | 170 (5.9%) | 135 (4.5%) |
| 35 to 39 Years | 231 (8.1%) | 305 (10.1%) |
| 40 to 44 Years | 104 (3.6%) | 296 (9.8%) |
| 45 to 49 Years | 197 (6.9%) | 150 (5.0%) |
| 50 to 54 Years | 342 (11.9%) | 181 (6.0%) |
| 55 to 59 Years | 148 (5.2%) | 184 (6.1%) |
| 60 to 64 Years | 219 (7.6%) | 211 (7.0%) |
| 65 to 69 Years | 189 (6.6%) | 153 (5.1%) |
| 70 to 74 Years | 198 (6.9%) | 162 (5.4%) |
| 75 to 79 Years | 68 (2.4%) | 87 (2.9%) |
| 80 to 84 Years | 32 (1.1%) | 21 (0.7%) |
| 85 Years and over | 38 (1.3%) | 0 (0.0%) |
| Total | 2,870 (100.0%) | 3,023 (100.0%) |
Families and Households in Cottonwood
Median Family Size in Cottonwood
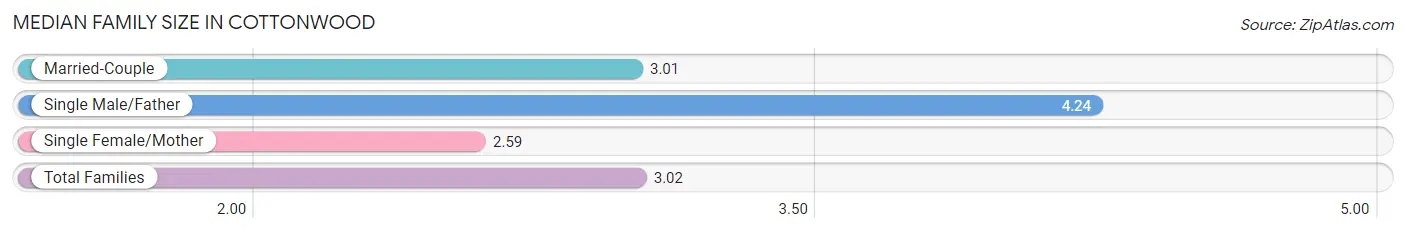
The median family size in Cottonwood is 3.02 persons per family, with single male/father families (82 | 4.9%) accounting for the largest median family size of 4.24 persons per family. On the other hand, single female/mother families (208 | 12.4%) represent the smallest median family size with 2.59 persons per family.
| Family Type | # Families | Family Size |
| Married-Couple | 1,390 (82.7%) | 3.01 |
| Single Male/Father | 82 (4.9%) | 4.24 |
| Single Female/Mother | 208 (12.4%) | 2.59 |
| Total Families | 1,680 (100.0%) | 3.02 |
Median Household Size in Cottonwood
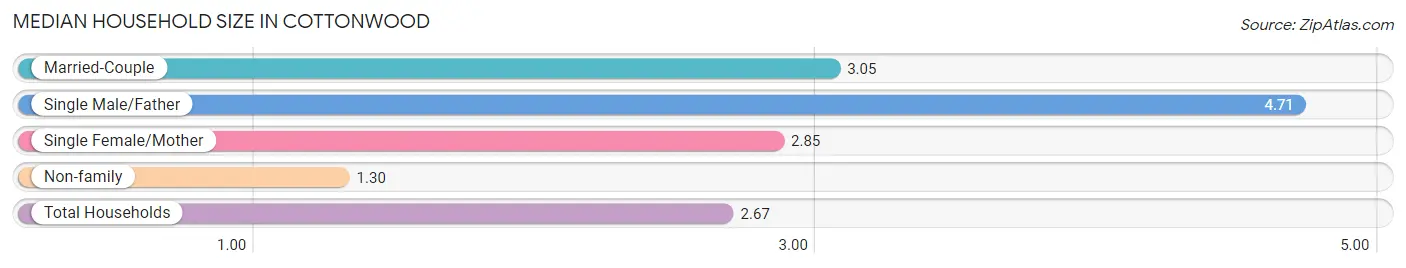
The median household size in Cottonwood is 2.67 persons per household, with single male/father households (82 | 3.7%) accounting for the largest median household size of 4.71 persons per household. non-family households (525 | 23.8%) represent the smallest median household size with 1.30 persons per household.
| Household Type | # Households | Household Size |
| Married-Couple | 1,390 (63.0%) | 3.05 |
| Single Male/Father | 82 (3.7%) | 4.71 |
| Single Female/Mother | 208 (9.4%) | 2.85 |
| Non-family | 525 (23.8%) | 1.30 |
| Total Households | 2,205 (100.0%) | 2.67 |
Household Size by Marriage Status in Cottonwood
Out of a total of 2,205 households in Cottonwood, 1,680 (76.2%) are family households, while 525 (23.8%) are nonfamily households. The most numerous type of family households are 2-person households, comprising 760, and the most common type of nonfamily households are 1-person households, comprising 398.
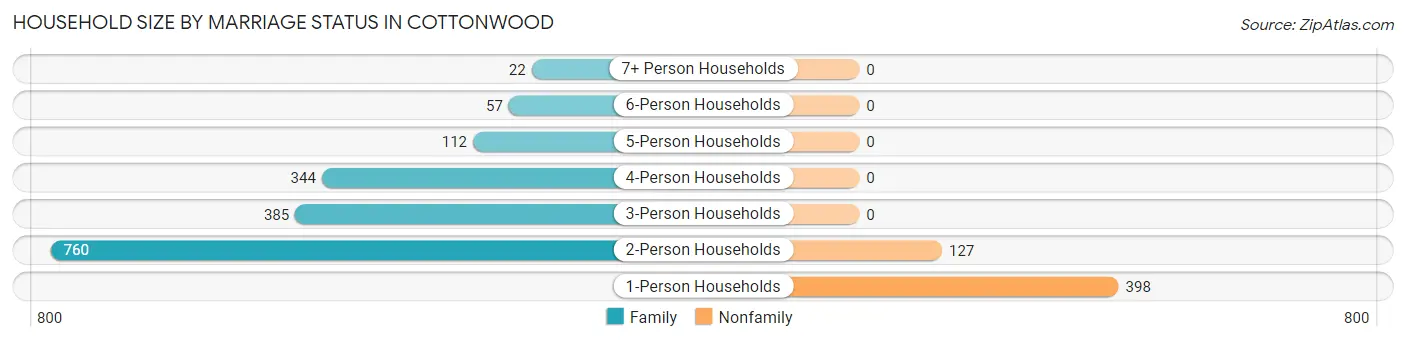
| Household Size | Family Households | Nonfamily Households |
| 1-Person Households | - | 398 (18.0%) |
| 2-Person Households | 760 (34.5%) | 127 (5.8%) |
| 3-Person Households | 385 (17.5%) | 0 (0.0%) |
| 4-Person Households | 344 (15.6%) | 0 (0.0%) |
| 5-Person Households | 112 (5.1%) | 0 (0.0%) |
| 6-Person Households | 57 (2.6%) | 0 (0.0%) |
| 7+ Person Households | 22 (1.0%) | 0 (0.0%) |
| Total | 1,680 (76.2%) | 525 (23.8%) |
Female Fertility in Cottonwood
Fertility by Age in Cottonwood
Average fertility rate in Cottonwood is 79.0 births per 1,000 women. Women in the age bracket of 20 to 34 years have the highest fertility rate with 150.0 births per 1,000 women. Women in the age bracket of 20 to 34 years acount for 65.2% of all women with births.
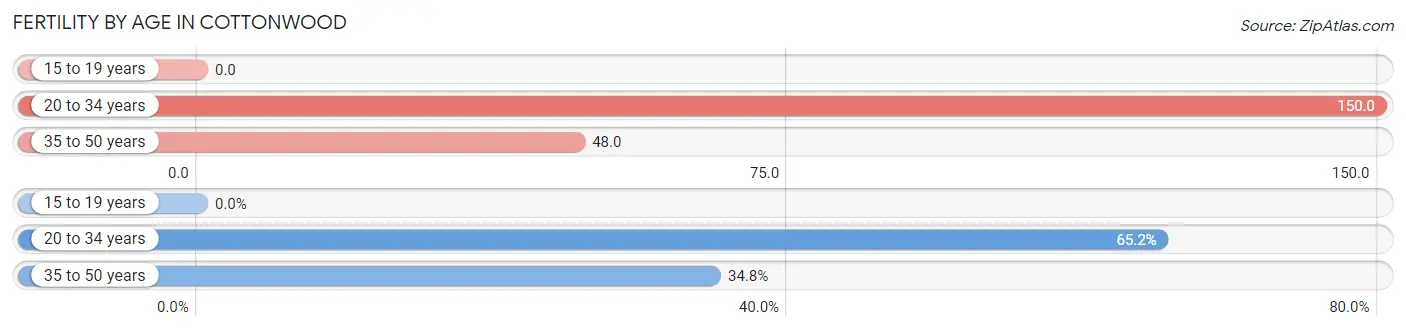
| Age Bracket | Women with Births | Births / 1,000 Women |
| 15 to 19 years | 0 (0.0%) | 0.0 |
| 20 to 34 years | 73 (65.2%) | 150.0 |
| 35 to 50 years | 39 (34.8%) | 48.0 |
| Total | 112 (100.0%) | 79.0 |
Fertility by Age by Marriage Status in Cottonwood
19.6% of women with births (112) in Cottonwood are married. The highest percentage of unmarried women with births falls into 35 to 50 years age bracket with 100.0% of them unmarried at the time of birth, while the lowest percentage of unmarried women with births belong to 20 to 34 years age bracket with 69.9% of them unmarried.
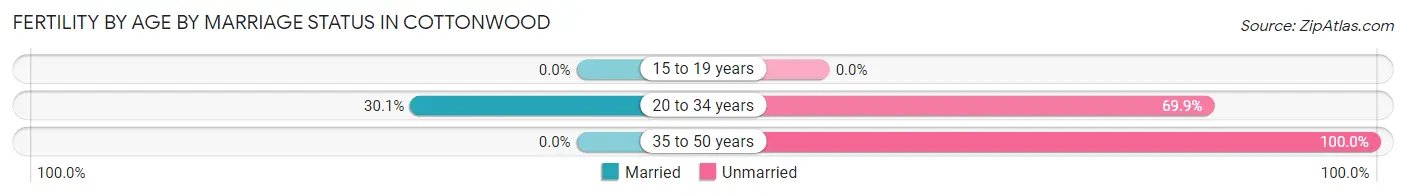
| Age Bracket | Married | Unmarried |
| 15 to 19 years | 0 (0.0%) | 0 (0.0%) |
| 20 to 34 years | 22 (30.1%) | 51 (69.9%) |
| 35 to 50 years | 0 (0.0%) | 39 (100.0%) |
| Total | 22 (19.6%) | 90 (80.4%) |
Fertility by Education in Cottonwood
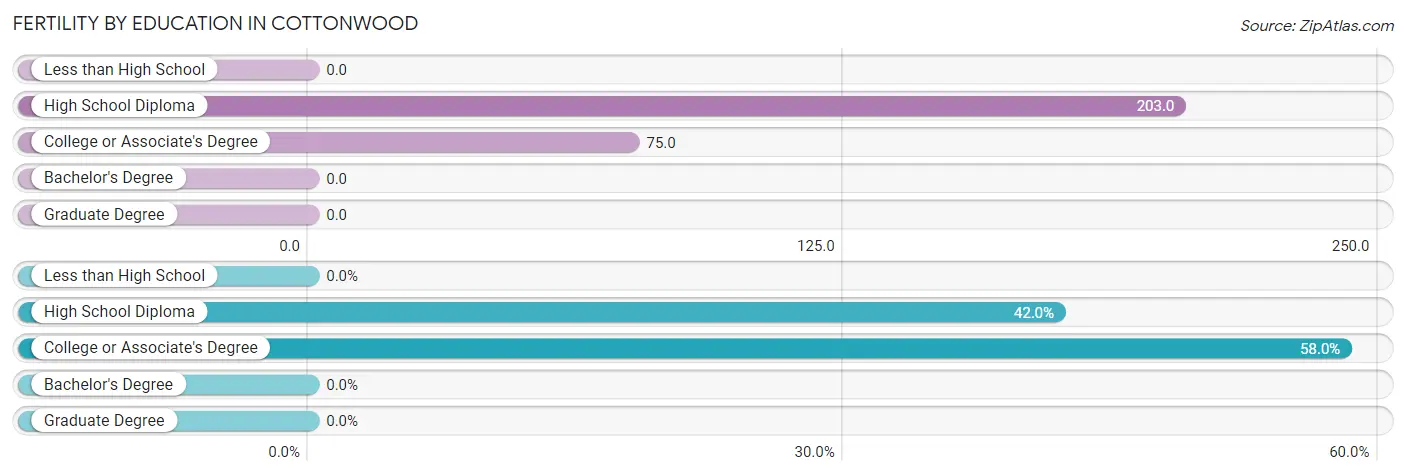
| Educational Attainment | Women with Births | Births / 1,000 Women |
| Less than High School | 0 (0.0%) | 0.0 |
| High School Diploma | 47 (42.0%) | 203.0 |
| College or Associate's Degree | 65 (58.0%) | 75.0 |
| Bachelor's Degree | 0 (0.0%) | 0.0 |
| Graduate Degree | 0 (0.0%) | 0.0 |
| Total | 112 (100.0%) | 79.0 |
Fertility by Education by Marriage Status in Cottonwood
80.4% of women with births in Cottonwood are unmarried. Women with the educational attainment of college or associate's degree are most likely to be married with 33.9% of them married at childbirth, while women with the educational attainment of high school diploma are least likely to be married with 100.0% of them unmarried at childbirth.
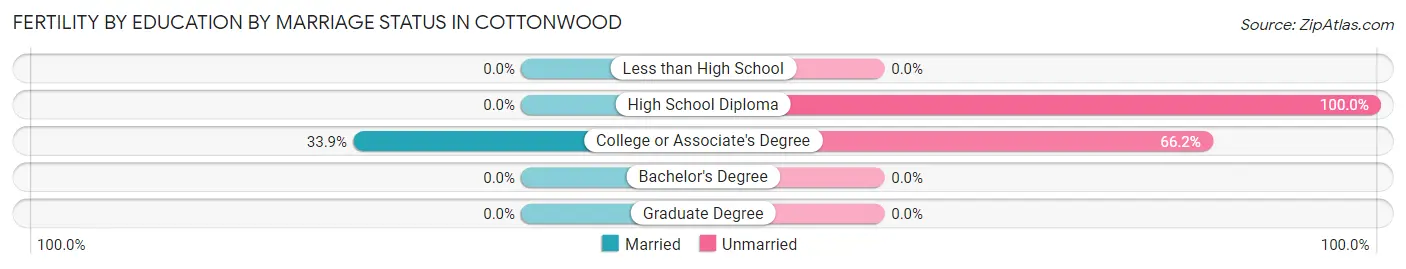
| Educational Attainment | Married | Unmarried |
| Less than High School | 0 (0.0%) | 0 (0.0%) |
| High School Diploma | 0 (0.0%) | 47 (100.0%) |
| College or Associate's Degree | 22 (33.9%) | 43 (66.1%) |
| Bachelor's Degree | 0 (0.0%) | 0 (0.0%) |
| Graduate Degree | 0 (0.0%) | 0 (0.0%) |
| Total | 22 (19.6%) | 90 (80.4%) |
Employment Characteristics in Cottonwood
Employment by Class of Employer in Cottonwood
Among the 2,742 employed individuals in Cottonwood, private company employees (1,627 | 59.3%), local government employees (406 | 14.8%), and state government employees (191 | 7.0%) make up the most common classes of employment.
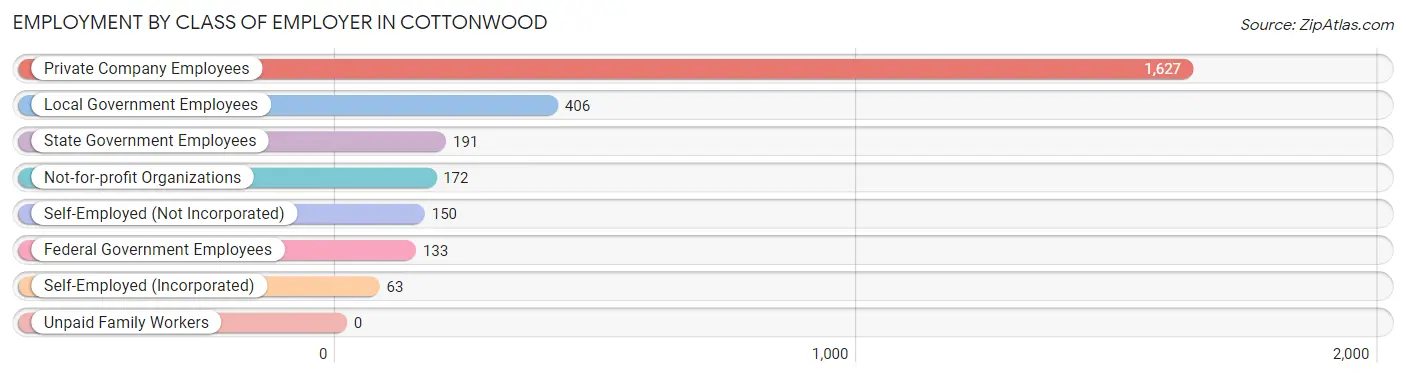
| Employer Class | # Employees | % Employees |
| Private Company Employees | 1,627 | 59.3% |
| Self-Employed (Incorporated) | 63 | 2.3% |
| Self-Employed (Not Incorporated) | 150 | 5.5% |
| Not-for-profit Organizations | 172 | 6.3% |
| Local Government Employees | 406 | 14.8% |
| State Government Employees | 191 | 7.0% |
| Federal Government Employees | 133 | 4.9% |
| Unpaid Family Workers | 0 | 0.0% |
| Total | 2,742 | 100.0% |
Employment Status by Age in Cottonwood
According to the labor force statistics for Cottonwood, out of the total population over 16 years of age (4,648), 63.9% or 2,970 individuals are in the labor force, with 3.7% or 110 of them unemployed. The age group with the highest labor force participation rate is 30 to 34 years, with 98.7% or 301 individuals in the labor force. Within the labor force, the 16 to 19 years age range has the highest percentage of unemployed individuals, with 32.1% or 26 of them being unemployed.
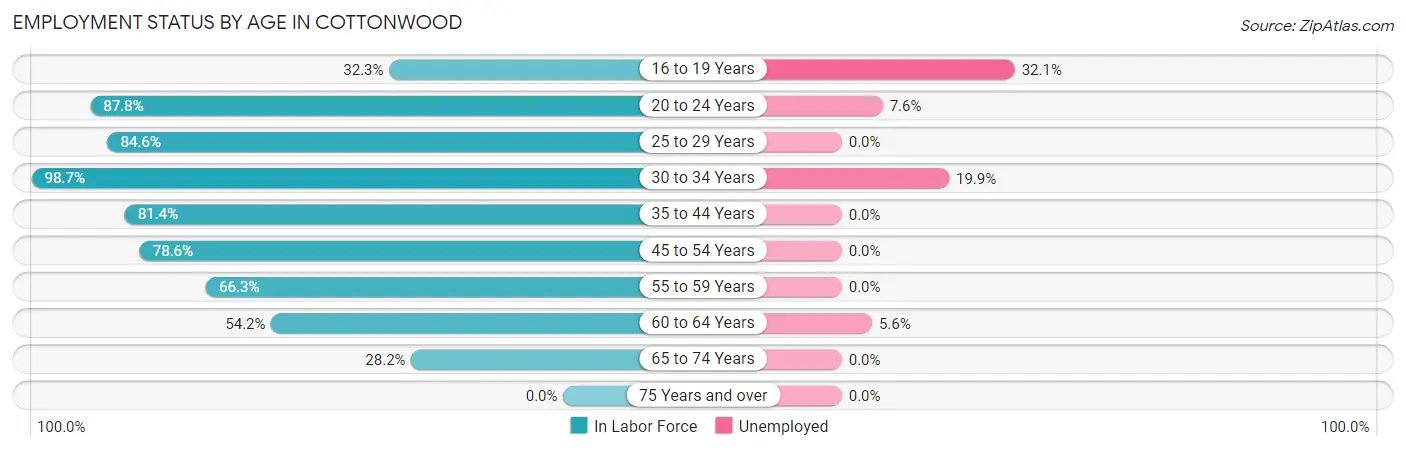
| Age Bracket | In Labor Force | Unemployed |
| 16 to 19 Years | 81 (32.3%) | 26 (32.1%) |
| 20 to 24 Years | 158 (87.8%) | 12 (7.6%) |
| 25 to 29 Years | 335 (84.6%) | 0 (0.0%) |
| 30 to 34 Years | 301 (98.7%) | 60 (19.9%) |
| 35 to 44 Years | 762 (81.4%) | 0 (0.0%) |
| 45 to 54 Years | 684 (78.6%) | 0 (0.0%) |
| 55 to 59 Years | 220 (66.3%) | 0 (0.0%) |
| 60 to 64 Years | 233 (54.2%) | 13 (5.6%) |
| 65 to 74 Years | 198 (28.2%) | 0 (0.0%) |
| 75 Years and over | 0 (0.0%) | 0 (0.0%) |
| Total | 2,970 (63.9%) | 110 (3.7%) |
Employment Status by Educational Attainment in Cottonwood
According to labor force statistics for Cottonwood, 77.5% of individuals (2,533) out of the total population between 25 and 64 years of age (3,269) are in the labor force, with 2.9% or 73 of them being unemployed. The group with the highest labor force participation rate are those with the educational attainment of high school diploma, with 89.3% or 561 individuals in the labor force. Within the labor force, individuals with high school diploma education have the highest percentage of unemployment, with 10.7% or 60 of them being unemployed.
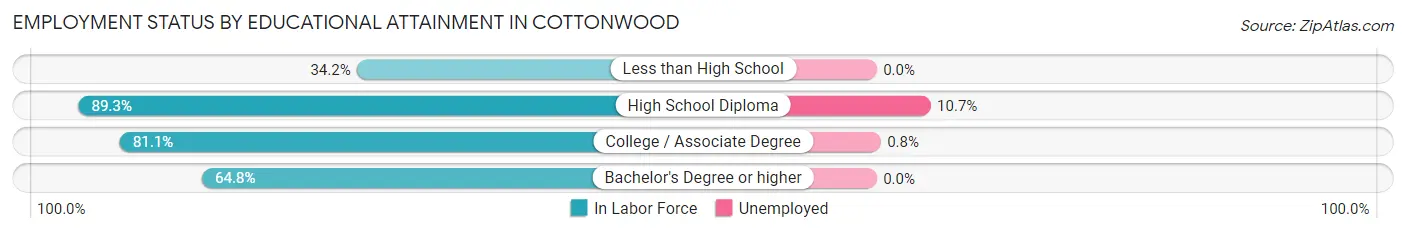
| Educational Attainment | In Labor Force | Unemployed |
| Less than High School | 66 (34.2%) | 0 (0.0%) |
| High School Diploma | 561 (89.3%) | 67 (10.7%) |
| College / Associate Degree | 1,598 (81.1%) | 16 (0.8%) |
| Bachelor's Degree or higher | 309 (64.8%) | 0 (0.0%) |
| Total | 2,533 (77.5%) | 95 (2.9%) |
Employment Occupations by Sex in Cottonwood
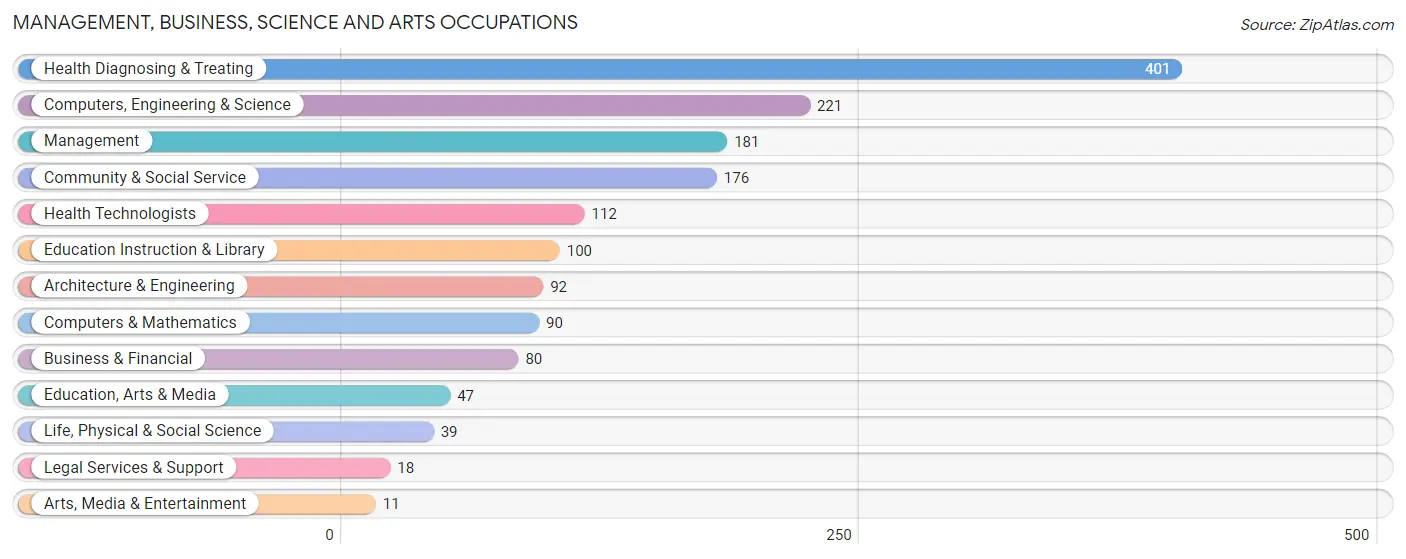
Management, Business, Science and Arts Occupations
The most common Management, Business, Science and Arts occupations in Cottonwood are Health Diagnosing & Treating (401 | 14.0%), Computers, Engineering & Science (221 | 7.7%), Management (181 | 6.3%), Community & Social Service (176 | 6.1%), and Health Technologists (112 | 3.9%).
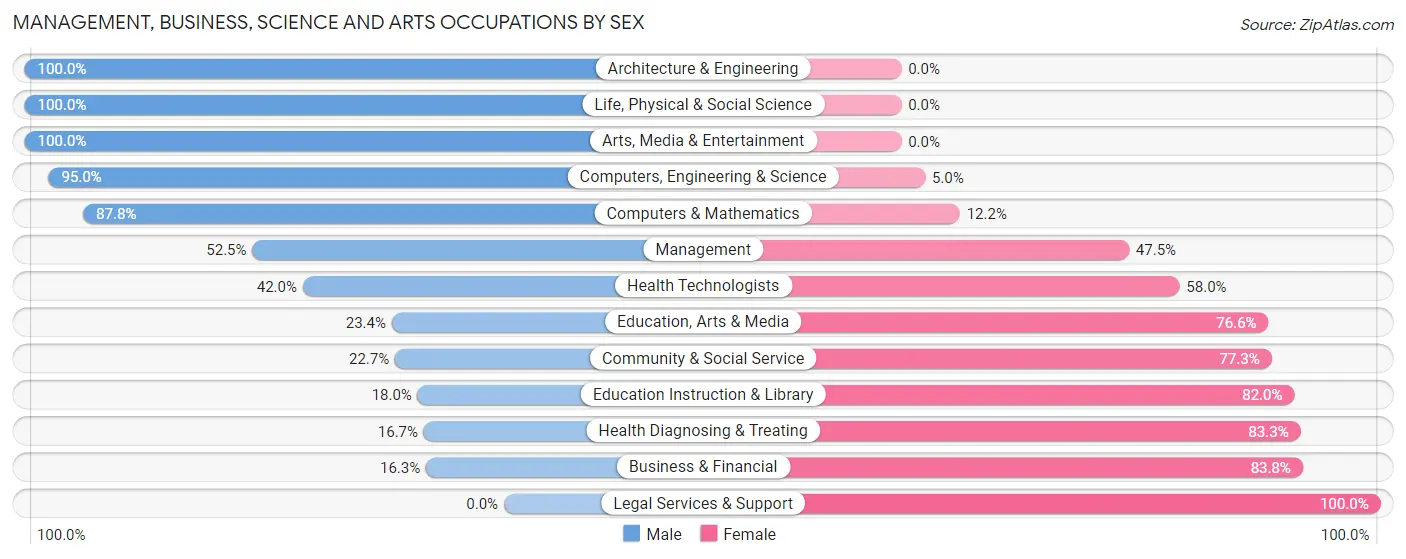
Management, Business, Science and Arts Occupations by Sex
Within the Management, Business, Science and Arts occupations in Cottonwood, the most male-oriented occupations are Architecture & Engineering (100.0%), Life, Physical & Social Science (100.0%), and Arts, Media & Entertainment (100.0%), while the most female-oriented occupations are Legal Services & Support (100.0%), Business & Financial (83.8%), and Health Diagnosing & Treating (83.3%).
| Occupation | Male | Female |
| Management | 95 (52.5%) | 86 (47.5%) |
| Business & Financial | 13 (16.3%) | 67 (83.8%) |
| Computers, Engineering & Science | 210 (95.0%) | 11 (5.0%) |
| Computers & Mathematics | 79 (87.8%) | 11 (12.2%) |
| Architecture & Engineering | 92 (100.0%) | 0 (0.0%) |
| Life, Physical & Social Science | 39 (100.0%) | 0 (0.0%) |
| Community & Social Service | 40 (22.7%) | 136 (77.3%) |
| Education, Arts & Media | 11 (23.4%) | 36 (76.6%) |
| Legal Services & Support | 0 (0.0%) | 18 (100.0%) |
| Education Instruction & Library | 18 (18.0%) | 82 (82.0%) |
| Arts, Media & Entertainment | 11 (100.0%) | 0 (0.0%) |
| Health Diagnosing & Treating | 67 (16.7%) | 334 (83.3%) |
| Health Technologists | 47 (42.0%) | 65 (58.0%) |
| Total (Category) | 425 (40.1%) | 634 (59.9%) |
| Total (Overall) | 1,450 (50.7%) | 1,411 (49.3%) |
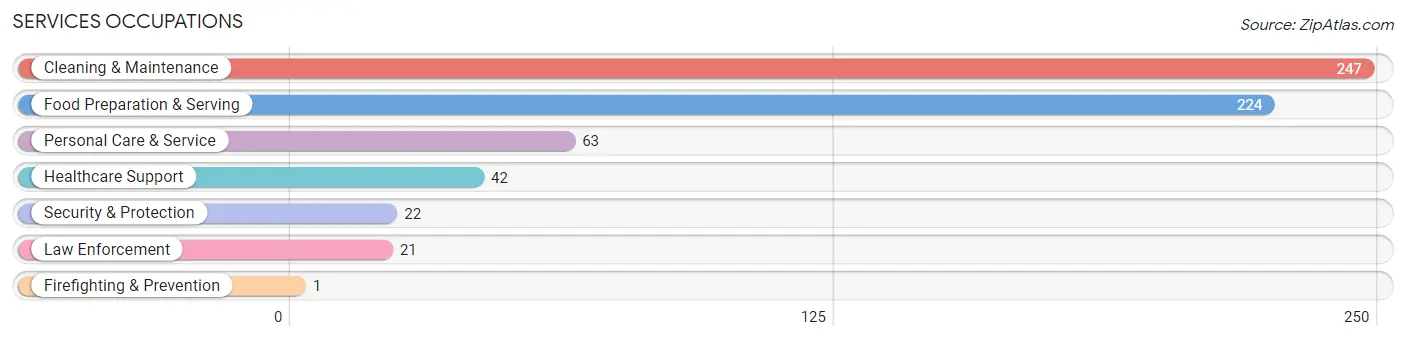
Services Occupations
The most common Services occupations in Cottonwood are Cleaning & Maintenance (247 | 8.6%), Food Preparation & Serving (224 | 7.8%), Personal Care & Service (63 | 2.2%), Healthcare Support (42 | 1.5%), and Security & Protection (22 | 0.8%).
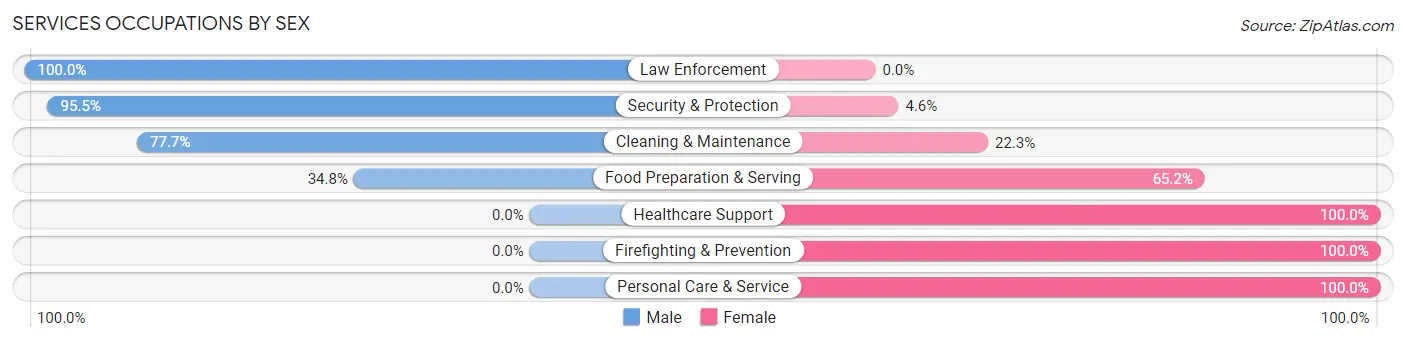
Services Occupations by Sex
Within the Services occupations in Cottonwood, the most male-oriented occupations are Law Enforcement (100.0%), Security & Protection (95.5%), and Cleaning & Maintenance (77.7%), while the most female-oriented occupations are Healthcare Support (100.0%), Firefighting & Prevention (100.0%), and Personal Care & Service (100.0%).
| Occupation | Male | Female |
| Healthcare Support | 0 (0.0%) | 42 (100.0%) |
| Security & Protection | 21 (95.5%) | 1 (4.5%) |
| Firefighting & Prevention | 0 (0.0%) | 1 (100.0%) |
| Law Enforcement | 21 (100.0%) | 0 (0.0%) |
| Food Preparation & Serving | 78 (34.8%) | 146 (65.2%) |
| Cleaning & Maintenance | 192 (77.7%) | 55 (22.3%) |
| Personal Care & Service | 0 (0.0%) | 63 (100.0%) |
| Total (Category) | 291 (48.7%) | 307 (51.3%) |
| Total (Overall) | 1,450 (50.7%) | 1,411 (49.3%) |
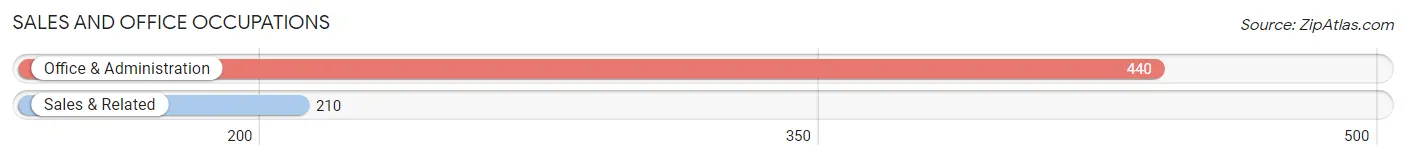
Sales and Office Occupations
The most common Sales and Office occupations in Cottonwood are Office & Administration (440 | 15.4%), and Sales & Related (210 | 7.3%).
Sales and Office Occupations by Sex
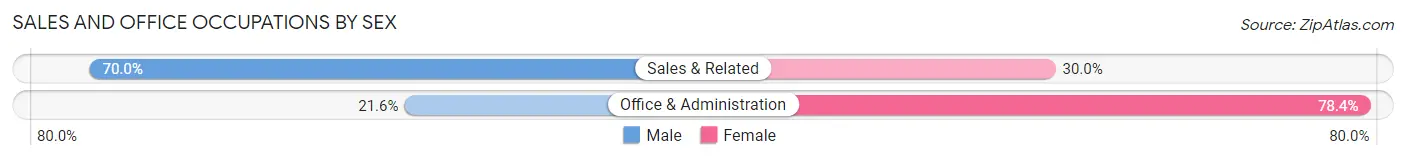
| Occupation | Male | Female |
| Sales & Related | 147 (70.0%) | 63 (30.0%) |
| Office & Administration | 95 (21.6%) | 345 (78.4%) |
| Total (Category) | 242 (37.2%) | 408 (62.8%) |
| Total (Overall) | 1,450 (50.7%) | 1,411 (49.3%) |
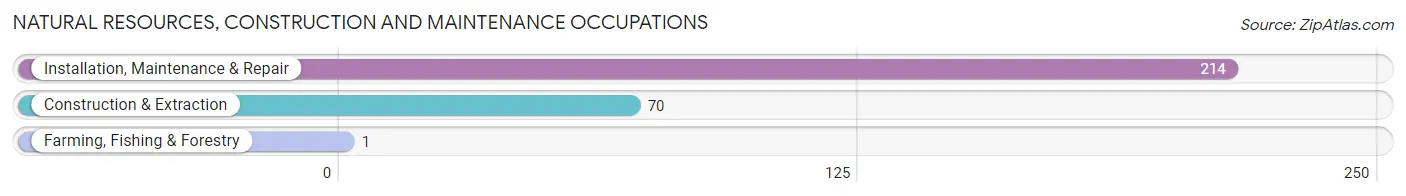
Natural Resources, Construction and Maintenance Occupations
The most common Natural Resources, Construction and Maintenance occupations in Cottonwood are Installation, Maintenance & Repair (214 | 7.5%), Construction & Extraction (70 | 2.5%), and Farming, Fishing & Forestry (1 | 0.0%).
Natural Resources, Construction and Maintenance Occupations by Sex
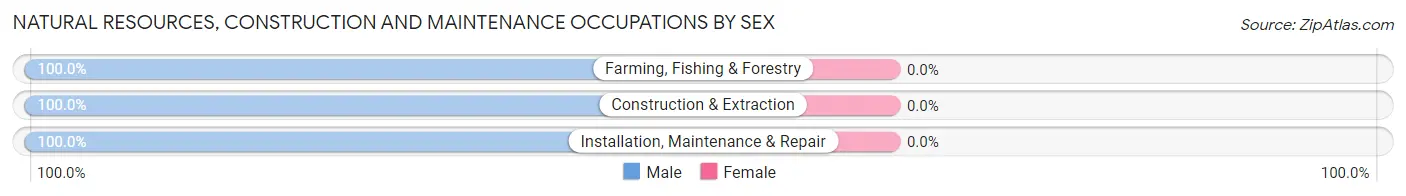
| Occupation | Male | Female |
| Farming, Fishing & Forestry | 1 (100.0%) | 0 (0.0%) |
| Construction & Extraction | 70 (100.0%) | 0 (0.0%) |
| Installation, Maintenance & Repair | 214 (100.0%) | 0 (0.0%) |
| Total (Category) | 285 (100.0%) | 0 (0.0%) |
| Total (Overall) | 1,450 (50.7%) | 1,411 (49.3%) |
Production, Transportation and Moving Occupations
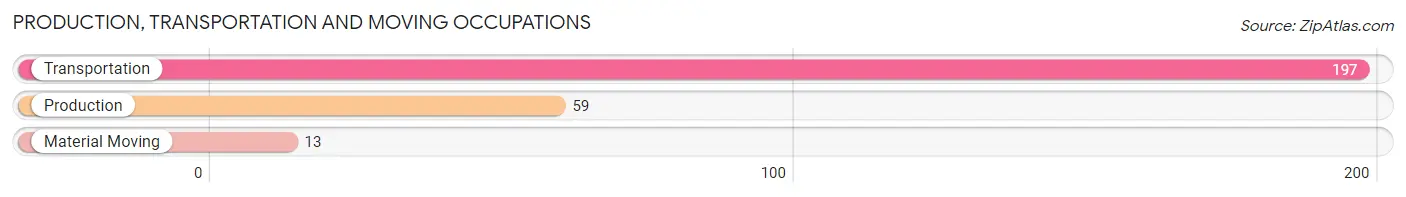
The most common Production, Transportation and Moving occupations in Cottonwood are Transportation (197 | 6.9%), Production (59 | 2.1%), and Material Moving (13 | 0.4%).
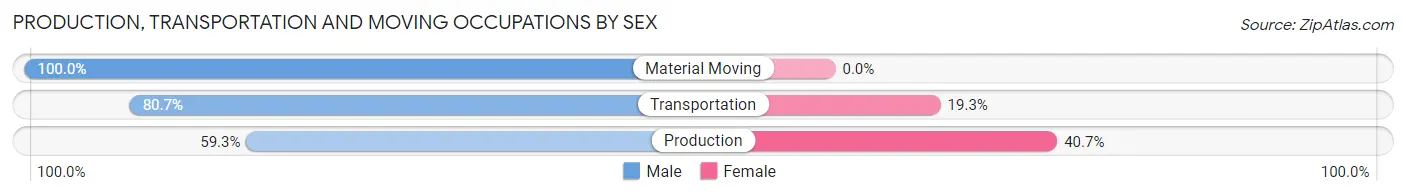
Production, Transportation and Moving Occupations by Sex
| Occupation | Male | Female |
| Production | 35 (59.3%) | 24 (40.7%) |
| Transportation | 159 (80.7%) | 38 (19.3%) |
| Material Moving | 13 (100.0%) | 0 (0.0%) |
| Total (Category) | 207 (76.9%) | 62 (23.1%) |
| Total (Overall) | 1,450 (50.7%) | 1,411 (49.3%) |
Employment Industries by Sex in Cottonwood
Employment Industries in Cottonwood
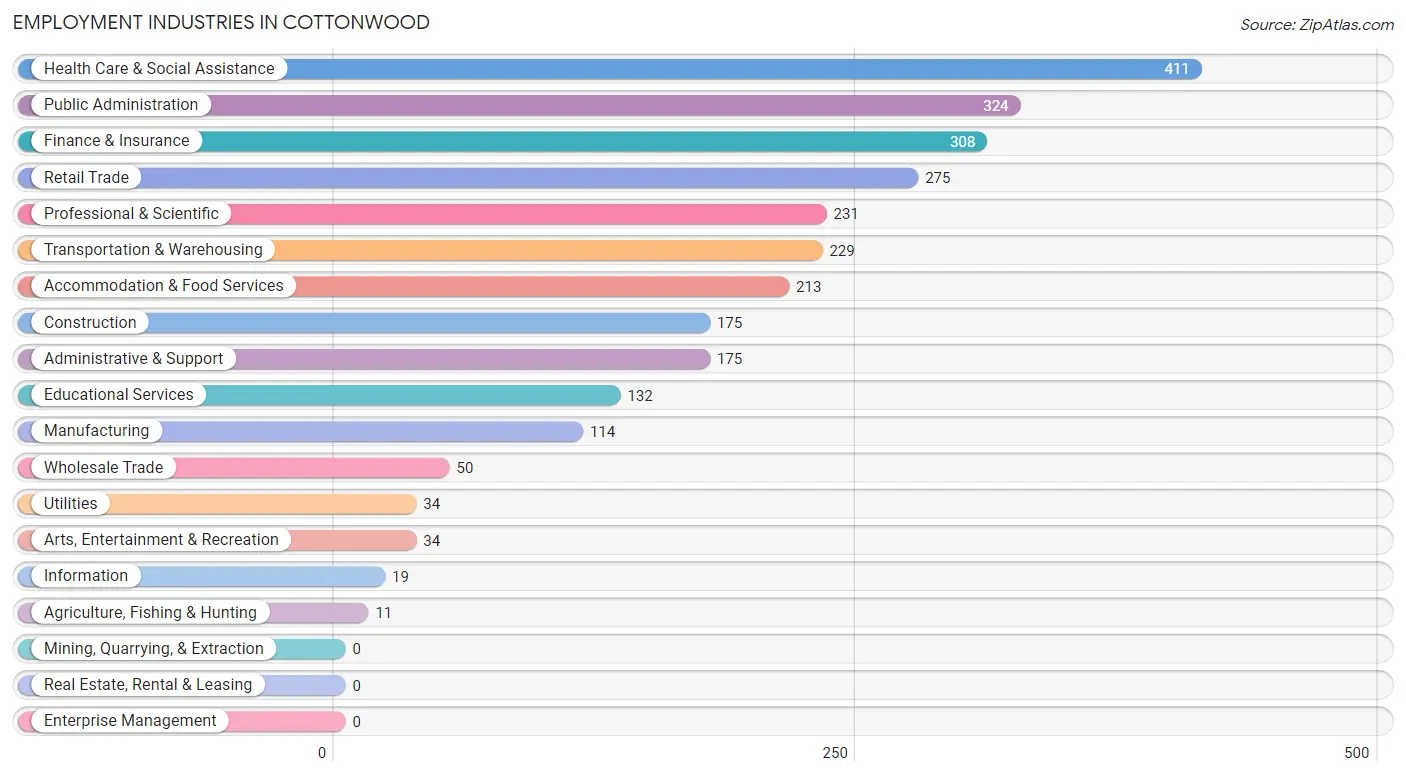
The major employment industries in Cottonwood include Health Care & Social Assistance (411 | 14.4%), Public Administration (324 | 11.3%), Finance & Insurance (308 | 10.8%), Retail Trade (275 | 9.6%), and Professional & Scientific (231 | 8.1%).
Employment Industries by Sex in Cottonwood
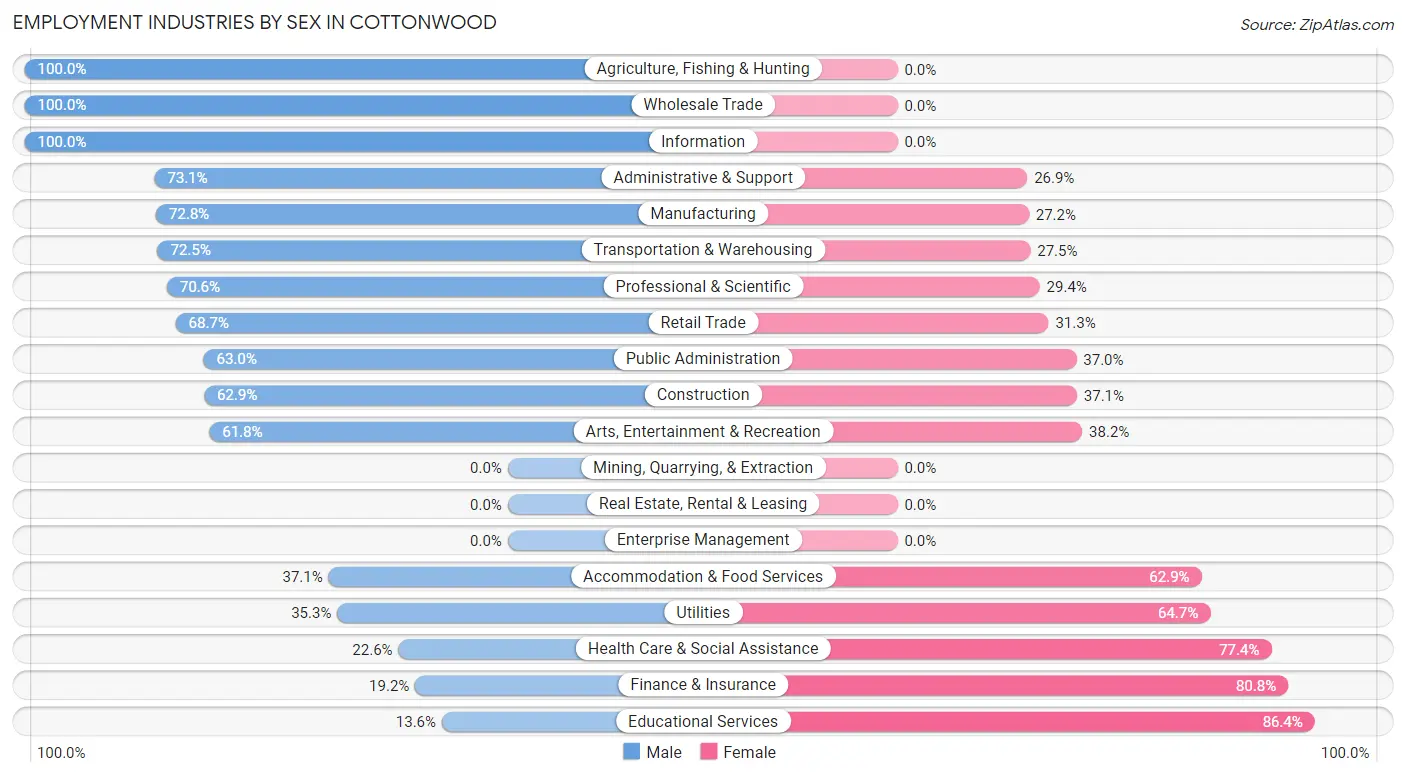
The Cottonwood industries that see more men than women are Agriculture, Fishing & Hunting (100.0%), Wholesale Trade (100.0%), and Information (100.0%), whereas the industries that tend to have a higher number of women are Educational Services (86.4%), Finance & Insurance (80.8%), and Health Care & Social Assistance (77.4%).
| Industry | Male | Female |
| Agriculture, Fishing & Hunting | 11 (100.0%) | 0 (0.0%) |
| Mining, Quarrying, & Extraction | 0 (0.0%) | 0 (0.0%) |
| Construction | 110 (62.9%) | 65 (37.1%) |
| Manufacturing | 83 (72.8%) | 31 (27.2%) |
| Wholesale Trade | 50 (100.0%) | 0 (0.0%) |
| Retail Trade | 189 (68.7%) | 86 (31.3%) |
| Transportation & Warehousing | 166 (72.5%) | 63 (27.5%) |
| Utilities | 12 (35.3%) | 22 (64.7%) |
| Information | 19 (100.0%) | 0 (0.0%) |
| Finance & Insurance | 59 (19.2%) | 249 (80.8%) |
| Real Estate, Rental & Leasing | 0 (0.0%) | 0 (0.0%) |
| Professional & Scientific | 163 (70.6%) | 68 (29.4%) |
| Enterprise Management | 0 (0.0%) | 0 (0.0%) |
| Administrative & Support | 128 (73.1%) | 47 (26.9%) |
| Educational Services | 18 (13.6%) | 114 (86.4%) |
| Health Care & Social Assistance | 93 (22.6%) | 318 (77.4%) |
| Arts, Entertainment & Recreation | 21 (61.8%) | 13 (38.2%) |
| Accommodation & Food Services | 79 (37.1%) | 134 (62.9%) |
| Public Administration | 204 (63.0%) | 120 (37.0%) |
| Total | 1,450 (50.7%) | 1,411 (49.3%) |
Education in Cottonwood
School Enrollment in Cottonwood
The most common levels of schooling among the 1,162 students in Cottonwood are middle school (426 | 36.7%), high school (300 | 25.8%), and elementary school (181 | 15.6%).
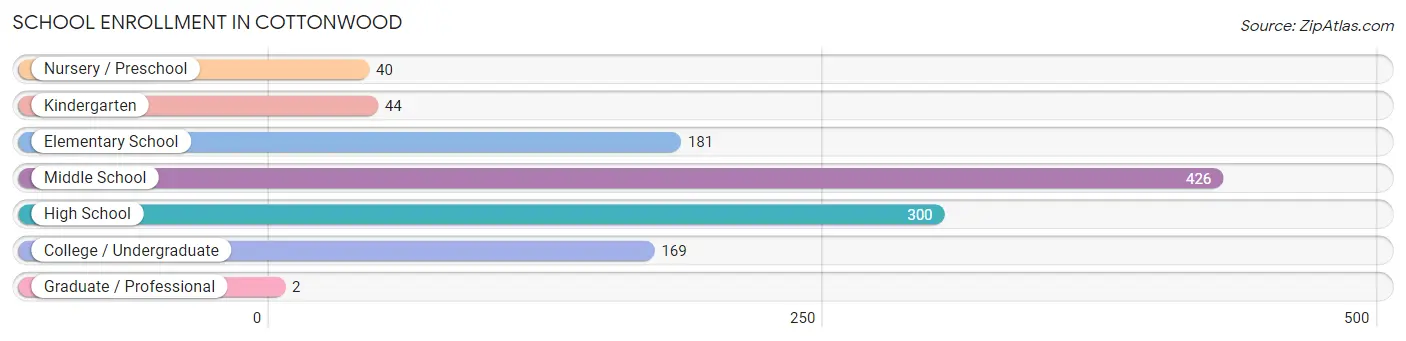
| School Level | # Students | % Students |
| Nursery / Preschool | 40 | 3.4% |
| Kindergarten | 44 | 3.8% |
| Elementary School | 181 | 15.6% |
| Middle School | 426 | 36.7% |
| High School | 300 | 25.8% |
| College / Undergraduate | 169 | 14.5% |
| Graduate / Professional | 2 | 0.2% |
| Total | 1,162 | 100.0% |
School Enrollment by Age by Funding Source in Cottonwood
Out of a total of 1,162 students who are enrolled in schools in Cottonwood, 45 (3.9%) attend a private institution, while the remaining 1,117 (96.1%) are enrolled in public schools. The age group of 35 years and over has the highest likelihood of being enrolled in private schools, with 19 (73.1% in the age bracket) enrolled. Conversely, the age group of 10 to 14 year olds has the lowest likelihood of being enrolled in a private school, with 348 (100.0% in the age bracket) attending a public institution.
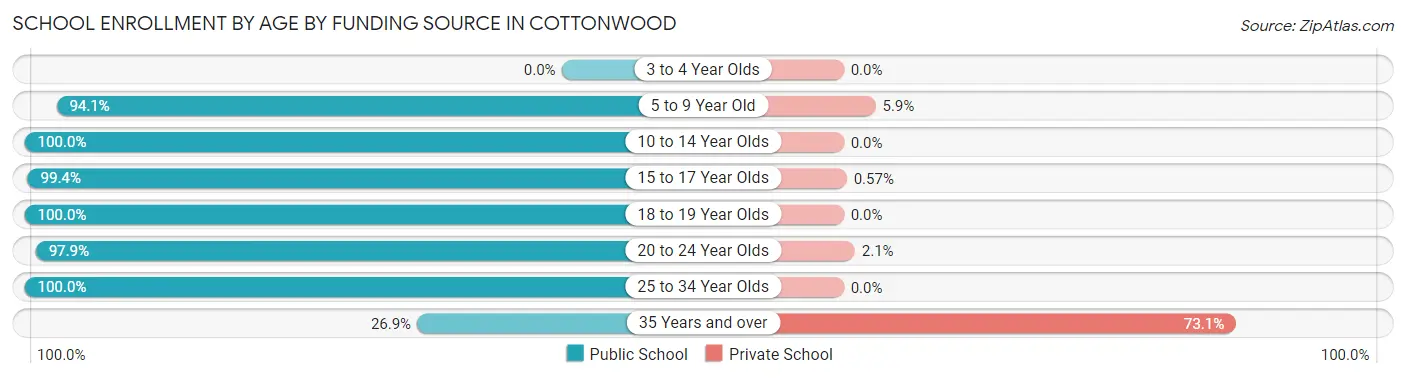
| Age Bracket | Public School | Private School |
| 3 to 4 Year Olds | 0 (0.0%) | 0 (0.0%) |
| 5 to 9 Year Old | 380 (94.1%) | 24 (5.9%) |
| 10 to 14 Year Olds | 348 (100.0%) | 0 (0.0%) |
| 15 to 17 Year Olds | 174 (99.4%) | 1 (0.6%) |
| 18 to 19 Year Olds | 117 (100.0%) | 0 (0.0%) |
| 20 to 24 Year Olds | 47 (97.9%) | 1 (2.1%) |
| 25 to 34 Year Olds | 44 (100.0%) | 0 (0.0%) |
| 35 Years and over | 7 (26.9%) | 19 (73.1%) |
| Total | 1,117 (96.1%) | 45 (3.9%) |
Educational Attainment by Field of Study in Cottonwood
Engineering (150 | 20.6%), education (110 | 15.1%), business (102 | 14.0%), arts & humanities (64 | 8.8%), and science & technology (63 | 8.6%) are the most common fields of study among 728 individuals in Cottonwood who have obtained a bachelor's degree or higher.
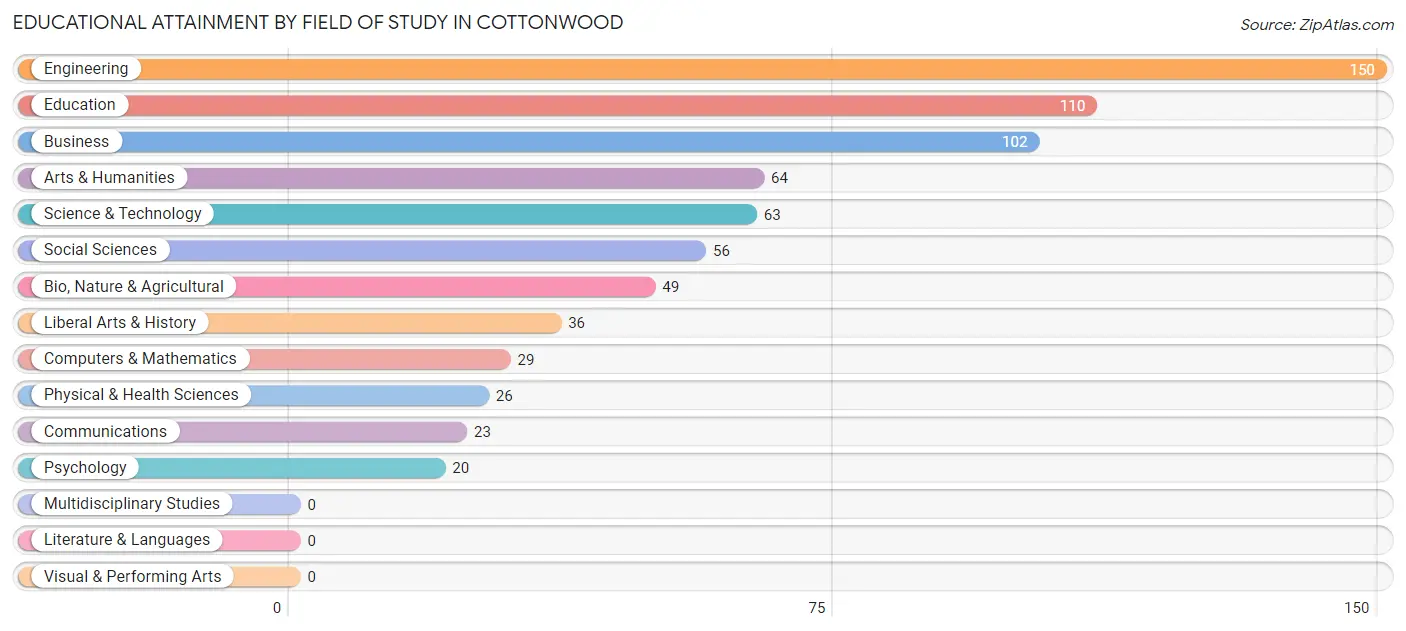
| Field of Study | # Graduates | % Graduates |
| Computers & Mathematics | 29 | 4.0% |
| Bio, Nature & Agricultural | 49 | 6.7% |
| Physical & Health Sciences | 26 | 3.6% |
| Psychology | 20 | 2.8% |
| Social Sciences | 56 | 7.7% |
| Engineering | 150 | 20.6% |
| Multidisciplinary Studies | 0 | 0.0% |
| Science & Technology | 63 | 8.6% |
| Business | 102 | 14.0% |
| Education | 110 | 15.1% |
| Literature & Languages | 0 | 0.0% |
| Liberal Arts & History | 36 | 5.0% |
| Visual & Performing Arts | 0 | 0.0% |
| Communications | 23 | 3.2% |
| Arts & Humanities | 64 | 8.8% |
| Total | 728 | 100.0% |
Transportation & Commute in Cottonwood
Vehicle Availability by Sex in Cottonwood
The most prevalent vehicle ownership categories in Cottonwood are males with 2 vehicles (819, accounting for 57.9%) and females with 2 vehicles (712, making up 61.7%).
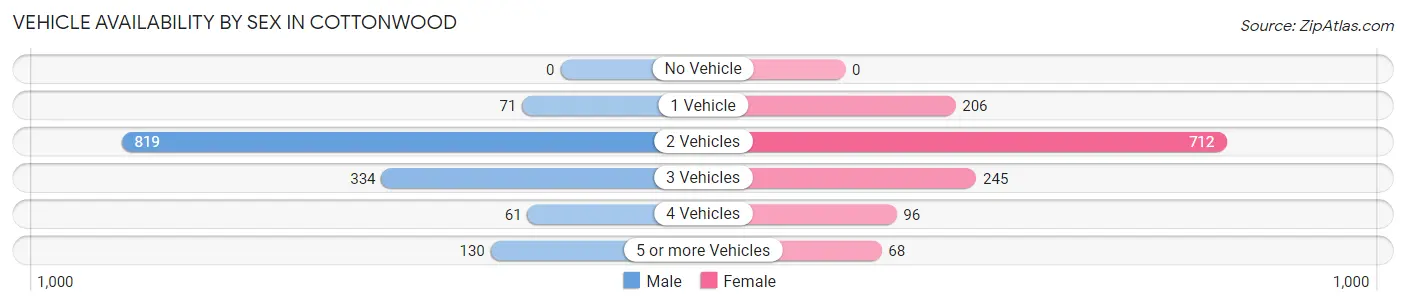
| Vehicles Available | Male | Female |
| No Vehicle | 0 (0.0%) | 0 (0.0%) |
| 1 Vehicle | 71 (5.0%) | 206 (15.5%) |
| 2 Vehicles | 819 (57.9%) | 712 (53.6%) |
| 3 Vehicles | 334 (23.6%) | 245 (18.5%) |
| 4 Vehicles | 61 (4.3%) | 96 (7.2%) |
| 5 or more Vehicles | 130 (9.2%) | 68 (5.1%) |
| Total | 1,415 (100.0%) | 1,327 (100.0%) |
Commute Time in Cottonwood
The most frequently occuring commute durations in Cottonwood are 30 to 34 minutes (623 commuters, 24.6%), 20 to 24 minutes (509 commuters, 20.1%), and 15 to 19 minutes (425 commuters, 16.8%).
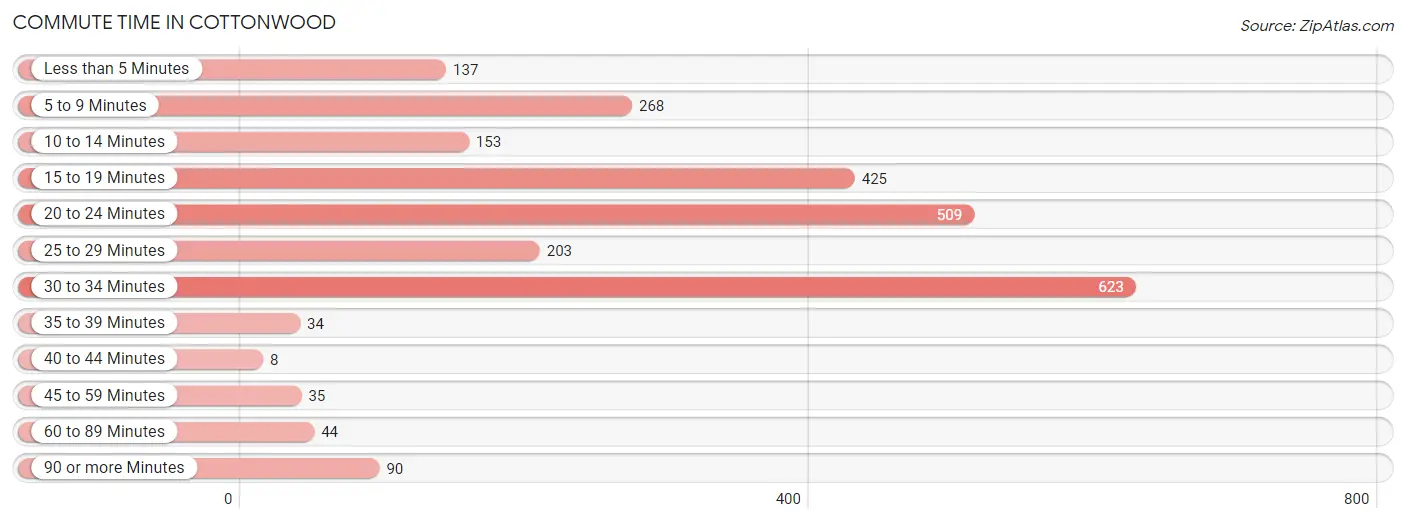
| Commute Time | # Commuters | % Commuters |
| Less than 5 Minutes | 137 | 5.4% |
| 5 to 9 Minutes | 268 | 10.6% |
| 10 to 14 Minutes | 153 | 6.0% |
| 15 to 19 Minutes | 425 | 16.8% |
| 20 to 24 Minutes | 509 | 20.1% |
| 25 to 29 Minutes | 203 | 8.0% |
| 30 to 34 Minutes | 623 | 24.6% |
| 35 to 39 Minutes | 34 | 1.3% |
| 40 to 44 Minutes | 8 | 0.3% |
| 45 to 59 Minutes | 35 | 1.4% |
| 60 to 89 Minutes | 44 | 1.7% |
| 90 or more Minutes | 90 | 3.6% |
Commute Time by Sex in Cottonwood
The most common commute times in Cottonwood are 20 to 24 minutes (371 commuters, 28.7%) for males and 30 to 34 minutes (370 commuters, 29.9%) for females.
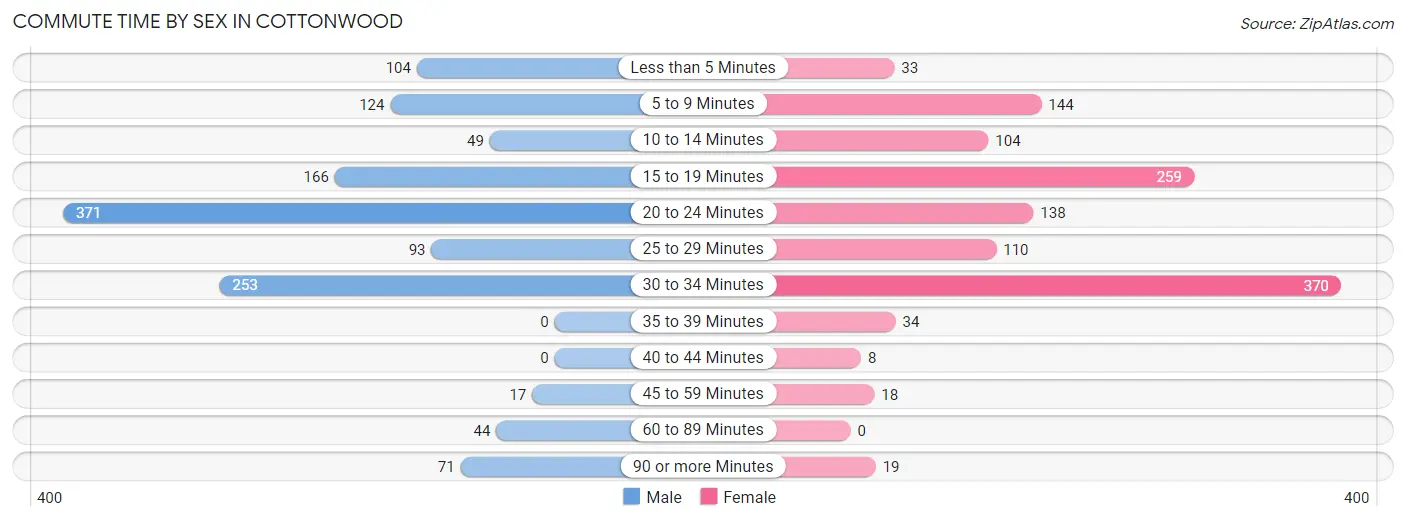
| Commute Time | Male | Female |
| Less than 5 Minutes | 104 (8.1%) | 33 (2.7%) |
| 5 to 9 Minutes | 124 (9.6%) | 144 (11.6%) |
| 10 to 14 Minutes | 49 (3.8%) | 104 (8.4%) |
| 15 to 19 Minutes | 166 (12.9%) | 259 (20.9%) |
| 20 to 24 Minutes | 371 (28.7%) | 138 (11.2%) |
| 25 to 29 Minutes | 93 (7.2%) | 110 (8.9%) |
| 30 to 34 Minutes | 253 (19.6%) | 370 (29.9%) |
| 35 to 39 Minutes | 0 (0.0%) | 34 (2.8%) |
| 40 to 44 Minutes | 0 (0.0%) | 8 (0.6%) |
| 45 to 59 Minutes | 17 (1.3%) | 18 (1.5%) |
| 60 to 89 Minutes | 44 (3.4%) | 0 (0.0%) |
| 90 or more Minutes | 71 (5.5%) | 19 (1.5%) |
Time of Departure to Work by Sex in Cottonwood
The most frequent times of departure to work in Cottonwood are 6:30 AM to 6:59 AM (274, 21.2%) for males and 7:30 AM to 7:59 AM (464, 37.5%) for females.
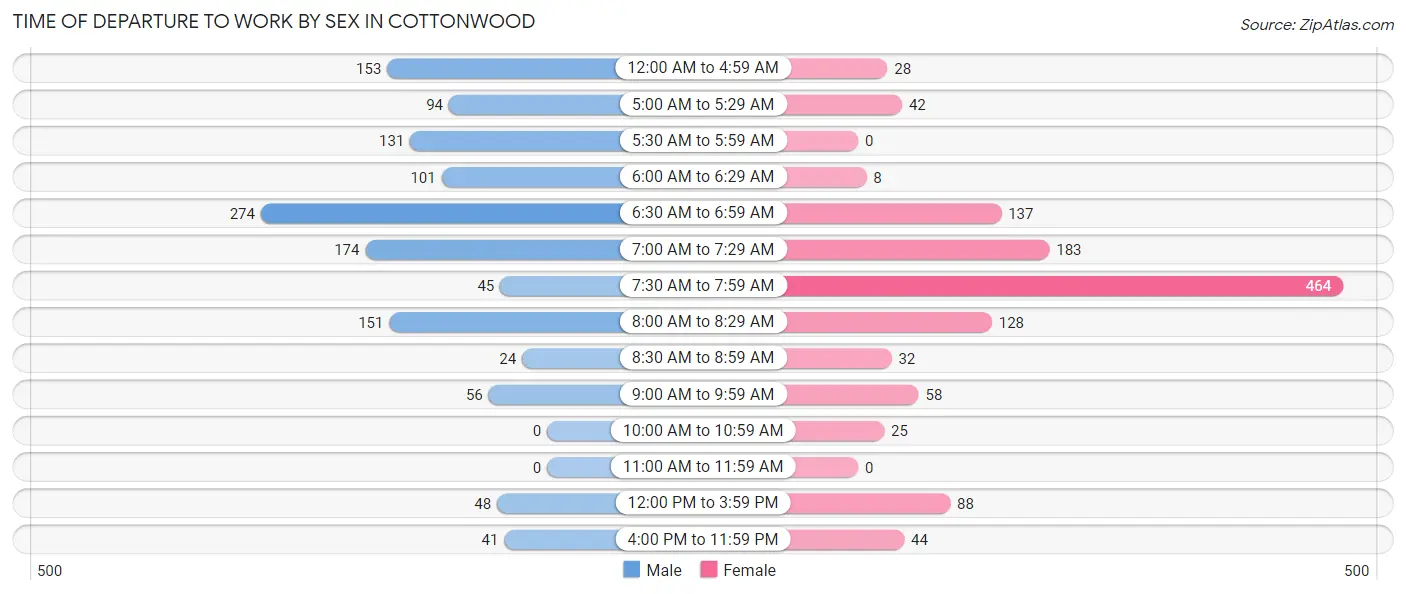
| Time of Departure | Male | Female |
| 12:00 AM to 4:59 AM | 153 (11.8%) | 28 (2.3%) |
| 5:00 AM to 5:29 AM | 94 (7.3%) | 42 (3.4%) |
| 5:30 AM to 5:59 AM | 131 (10.1%) | 0 (0.0%) |
| 6:00 AM to 6:29 AM | 101 (7.8%) | 8 (0.6%) |
| 6:30 AM to 6:59 AM | 274 (21.2%) | 137 (11.1%) |
| 7:00 AM to 7:29 AM | 174 (13.5%) | 183 (14.8%) |
| 7:30 AM to 7:59 AM | 45 (3.5%) | 464 (37.5%) |
| 8:00 AM to 8:29 AM | 151 (11.7%) | 128 (10.3%) |
| 8:30 AM to 8:59 AM | 24 (1.9%) | 32 (2.6%) |
| 9:00 AM to 9:59 AM | 56 (4.3%) | 58 (4.7%) |
| 10:00 AM to 10:59 AM | 0 (0.0%) | 25 (2.0%) |
| 11:00 AM to 11:59 AM | 0 (0.0%) | 0 (0.0%) |
| 12:00 PM to 3:59 PM | 48 (3.7%) | 88 (7.1%) |
| 4:00 PM to 11:59 PM | 41 (3.2%) | 44 (3.6%) |
| Total | 1,292 (100.0%) | 1,237 (100.0%) |
Housing Occupancy in Cottonwood
Occupancy by Ownership in Cottonwood
Of the total 751 dwellings in Cottonwood, owner-occupied units account for 153 (20.4%), while renter-occupied units make up 598 (79.6%).
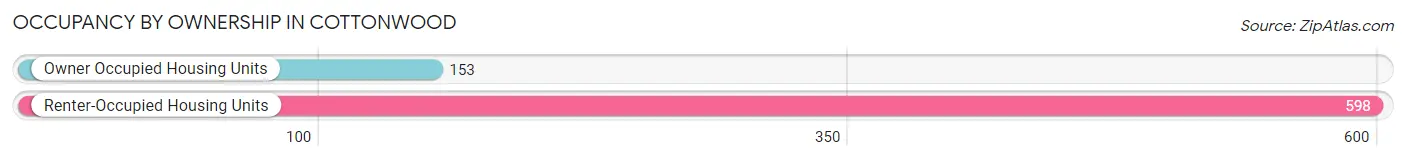
| Occupancy | # Housing Units | % Housing Units |
| Owner Occupied Housing Units | 153 | 20.4% |
| Renter-Occupied Housing Units | 598 | 79.6% |
| Total Occupied Housing Units | 751 | 100.0% |
Occupancy by Household Size in Cottonwood
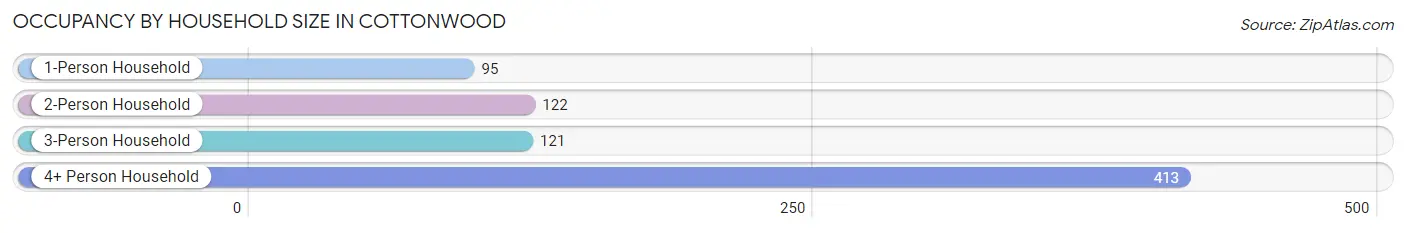
| Household Size | # Housing Units | % Housing Units |
| 1-Person Household | 95 | 12.7% |
| 2-Person Household | 122 | 16.3% |
| 3-Person Household | 121 | 16.1% |
| 4+ Person Household | 413 | 55.0% |
| Total Housing Units | 751 | 100.0% |
Occupancy by Ownership by Household Size in Cottonwood
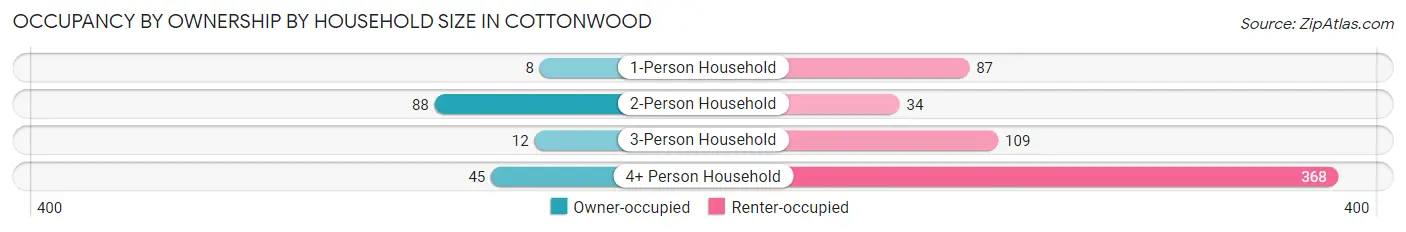
| Household Size | Owner-occupied | Renter-occupied |
| 1-Person Household | 8 (8.4%) | 87 (91.6%) |
| 2-Person Household | 88 (72.1%) | 34 (27.9%) |
| 3-Person Household | 12 (9.9%) | 109 (90.1%) |
| 4+ Person Household | 45 (10.9%) | 368 (89.1%) |
| Total Housing Units | 153 (20.4%) | 598 (79.6%) |
Occupancy by Educational Attainment in Cottonwood
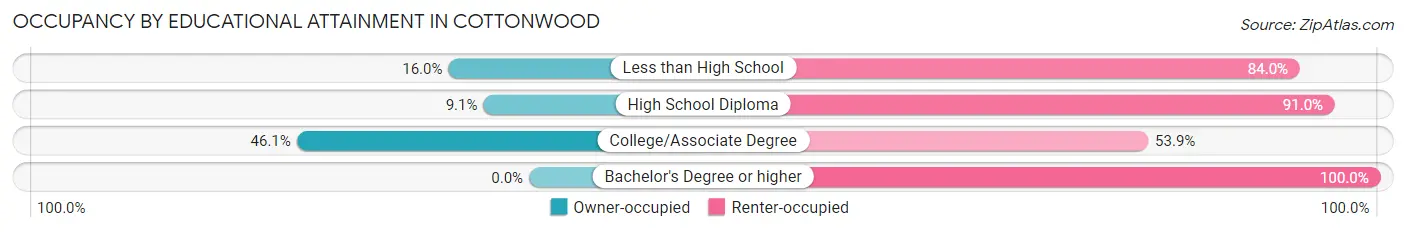
| Household Size | Owner-occupied | Renter-occupied |
| Less than High School | 51 (16.0%) | 268 (84.0%) |
| High School Diploma | 20 (9.0%) | 201 (90.9%) |
| College/Associate Degree | 82 (46.1%) | 96 (53.9%) |
| Bachelor's Degree or higher | 0 (0.0%) | 33 (100.0%) |
Occupancy by Age of Householder in Cottonwood
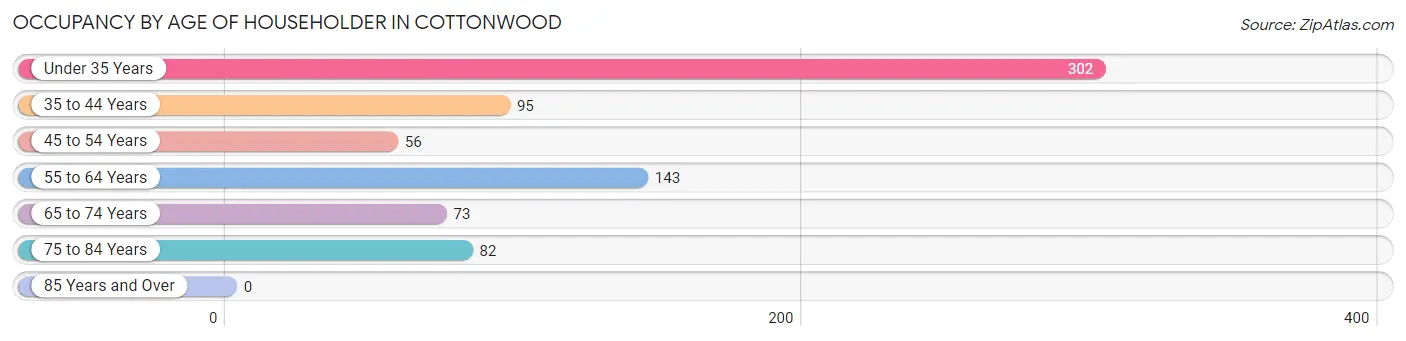
| Age Bracket | # Households | % Households |
| Under 35 Years | 302 | 40.2% |
| 35 to 44 Years | 95 | 12.7% |
| 45 to 54 Years | 56 | 7.5% |
| 55 to 64 Years | 143 | 19.0% |
| 65 to 74 Years | 73 | 9.7% |
| 75 to 84 Years | 82 | 10.9% |
| 85 Years and Over | 0 | 0.0% |
| Total | 751 | 100.0% |
Housing Finances in Cottonwood
Median Income by Occupancy in Cottonwood
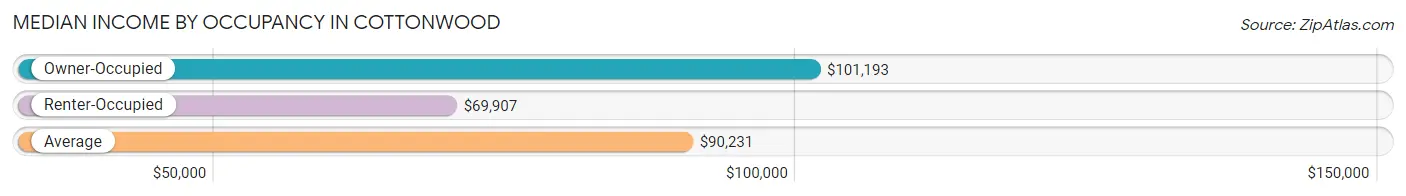
| Occupancy Type | # Households | Median Income |
| Owner-Occupied | 1,583 (71.8%) | $101,193 |
| Renter-Occupied | 622 (28.2%) | $69,907 |
| Average | 2,205 (100.0%) | $90,231 |
Occupancy by Householder Income Bracket in Cottonwood
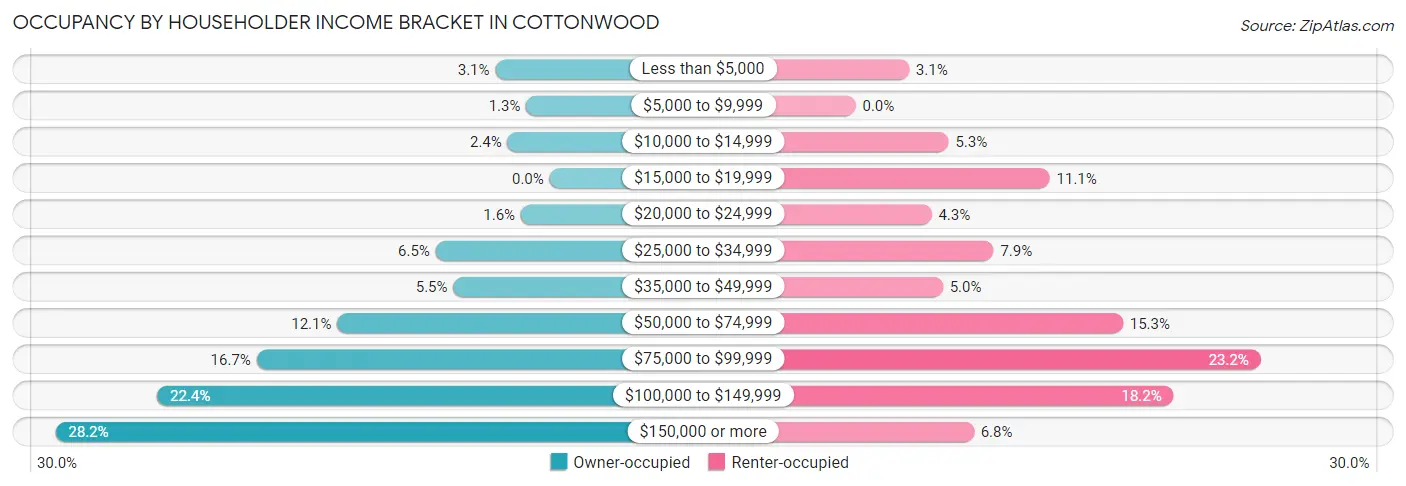
| Income Bracket | Owner-occupied | Renter-occupied |
| Less than $5,000 | 49 (3.1%) | 19 (3.0%) |
| $5,000 to $9,999 | 21 (1.3%) | 0 (0.0%) |
| $10,000 to $14,999 | 38 (2.4%) | 33 (5.3%) |
| $15,000 to $19,999 | 0 (0.0%) | 69 (11.1%) |
| $20,000 to $24,999 | 26 (1.6%) | 27 (4.3%) |
| $25,000 to $34,999 | 103 (6.5%) | 49 (7.9%) |
| $35,000 to $49,999 | 87 (5.5%) | 31 (5.0%) |
| $50,000 to $74,999 | 192 (12.1%) | 95 (15.3%) |
| $75,000 to $99,999 | 265 (16.7%) | 144 (23.2%) |
| $100,000 to $149,999 | 355 (22.4%) | 113 (18.2%) |
| $150,000 or more | 447 (28.2%) | 42 (6.8%) |
| Total | 1,583 (100.0%) | 622 (100.0%) |
Monthly Housing Cost Tiers in Cottonwood
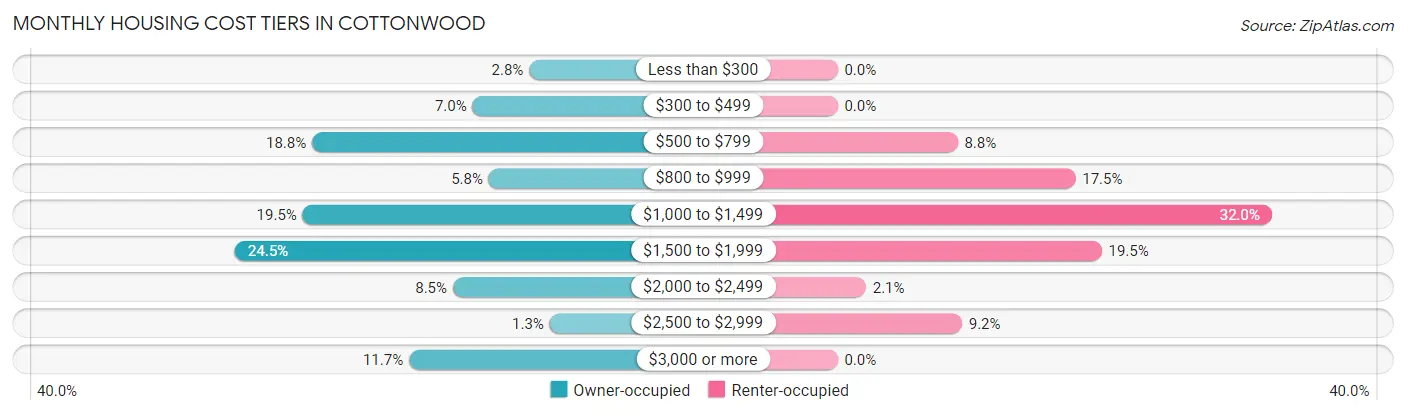
| Monthly Cost | Owner-occupied | Renter-occupied |
| Less than $300 | 45 (2.8%) | 0 (0.0%) |
| $300 to $499 | 111 (7.0%) | 0 (0.0%) |
| $500 to $799 | 298 (18.8%) | 55 (8.8%) |
| $800 to $999 | 92 (5.8%) | 109 (17.5%) |
| $1,000 to $1,499 | 309 (19.5%) | 199 (32.0%) |
| $1,500 to $1,999 | 388 (24.5%) | 121 (19.5%) |
| $2,000 to $2,499 | 134 (8.5%) | 13 (2.1%) |
| $2,500 to $2,999 | 21 (1.3%) | 57 (9.2%) |
| $3,000 or more | 185 (11.7%) | 0 (0.0%) |
| Total | 1,583 (100.0%) | 622 (100.0%) |
Physical Housing Characteristics in Cottonwood
Housing Structures in Cottonwood
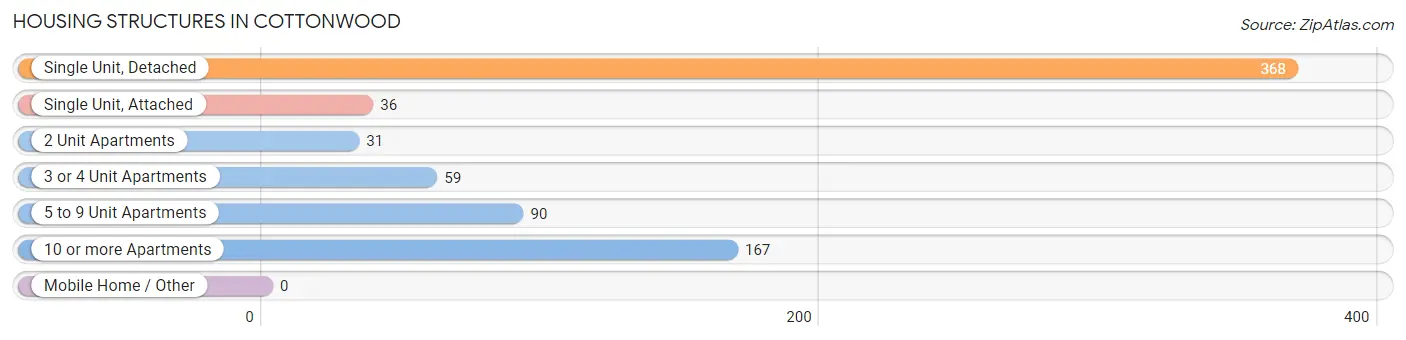
| Structure Type | # Housing Units | % Housing Units |
| Single Unit, Detached | 368 | 49.0% |
| Single Unit, Attached | 36 | 4.8% |
| 2 Unit Apartments | 31 | 4.1% |
| 3 or 4 Unit Apartments | 59 | 7.9% |
| 5 to 9 Unit Apartments | 90 | 12.0% |
| 10 or more Apartments | 167 | 22.2% |
| Mobile Home / Other | 0 | 0.0% |
| Total | 751 | 100.0% |
Housing Structures by Occupancy in Cottonwood
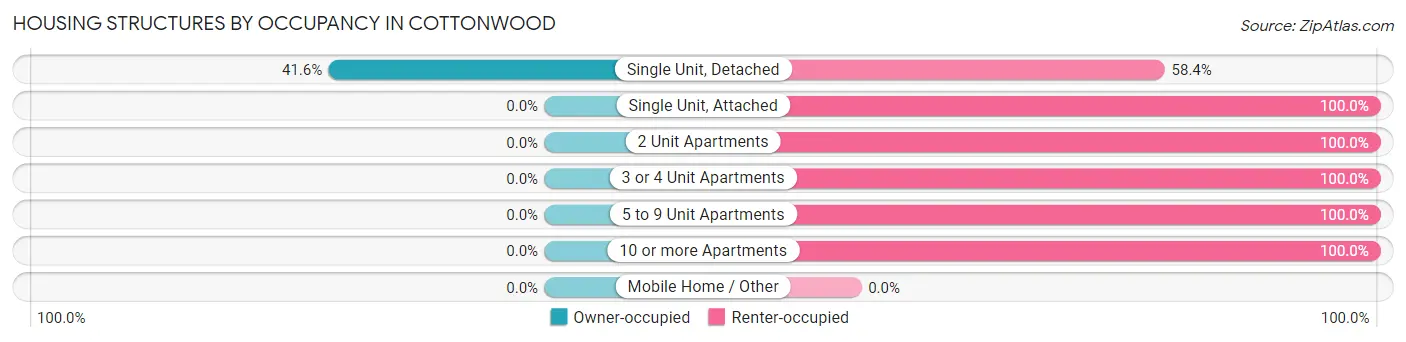
| Structure Type | Owner-occupied | Renter-occupied |
| Single Unit, Detached | 153 (41.6%) | 215 (58.4%) |
| Single Unit, Attached | 0 (0.0%) | 36 (100.0%) |
| 2 Unit Apartments | 0 (0.0%) | 31 (100.0%) |
| 3 or 4 Unit Apartments | 0 (0.0%) | 59 (100.0%) |
| 5 to 9 Unit Apartments | 0 (0.0%) | 90 (100.0%) |
| 10 or more Apartments | 0 (0.0%) | 167 (100.0%) |
| Mobile Home / Other | 0 (0.0%) | 0 (0.0%) |
| Total | 153 (20.4%) | 598 (79.6%) |
Housing Structures by Number of Rooms in Cottonwood
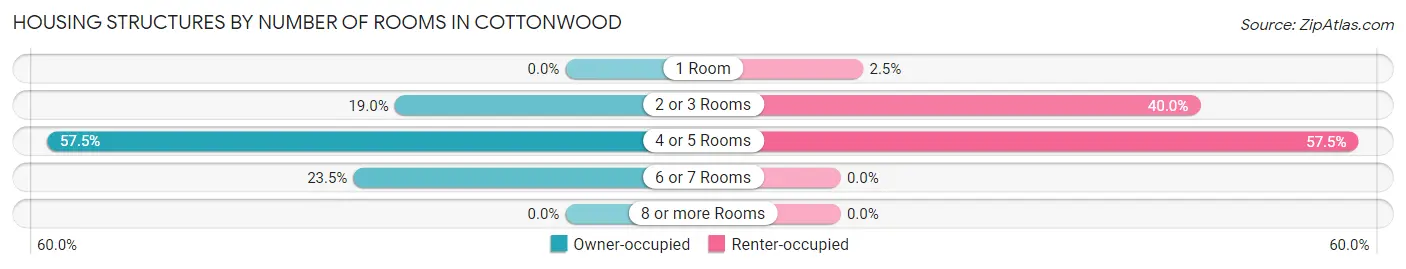
| Number of Rooms | Owner-occupied | Renter-occupied |
| 1 Room | 0 (0.0%) | 15 (2.5%) |
| 2 or 3 Rooms | 29 (19.0%) | 239 (40.0%) |
| 4 or 5 Rooms | 88 (57.5%) | 344 (57.5%) |
| 6 or 7 Rooms | 36 (23.5%) | 0 (0.0%) |
| 8 or more Rooms | 0 (0.0%) | 0 (0.0%) |
| Total | 153 (100.0%) | 598 (100.0%) |
Housing Structure by Heating Type in Cottonwood
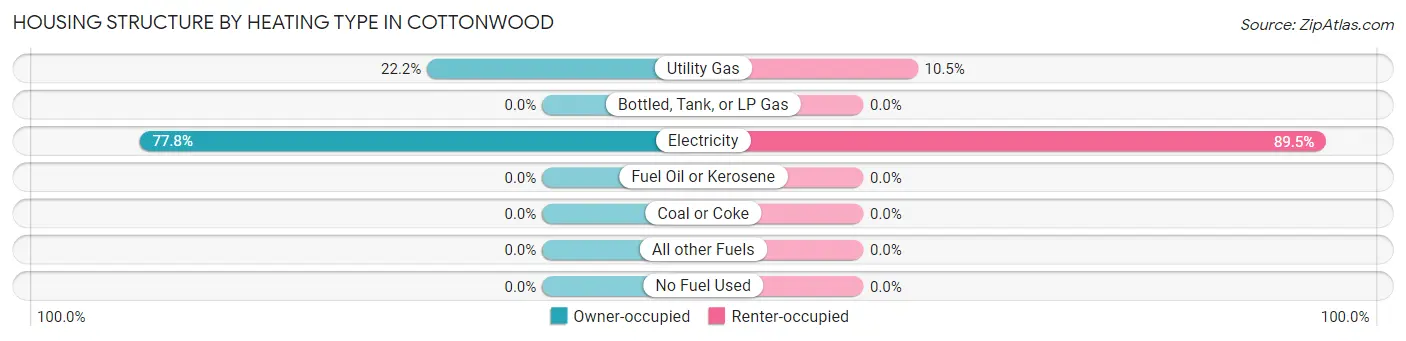
| Heating Type | Owner-occupied | Renter-occupied |
| Utility Gas | 34 (22.2%) | 63 (10.5%) |
| Bottled, Tank, or LP Gas | 0 (0.0%) | 0 (0.0%) |
| Electricity | 119 (77.8%) | 535 (89.5%) |
| Fuel Oil or Kerosene | 0 (0.0%) | 0 (0.0%) |
| Coal or Coke | 0 (0.0%) | 0 (0.0%) |
| All other Fuels | 0 (0.0%) | 0 (0.0%) |
| No Fuel Used | 0 (0.0%) | 0 (0.0%) |
| Total | 153 (100.0%) | 598 (100.0%) |
Household Vehicle Usage in Cottonwood
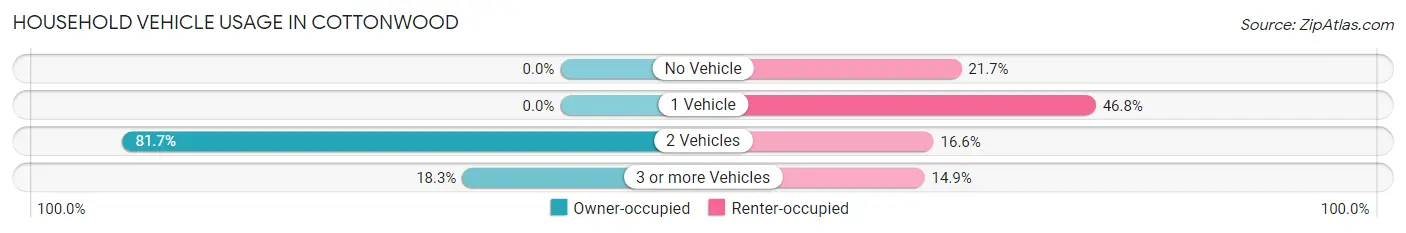
| Vehicles per Household | Owner-occupied | Renter-occupied |
| No Vehicle | 0 (0.0%) | 130 (21.7%) |
| 1 Vehicle | 0 (0.0%) | 280 (46.8%) |
| 2 Vehicles | 125 (81.7%) | 99 (16.6%) |
| 3 or more Vehicles | 28 (18.3%) | 89 (14.9%) |
| Total | 153 (100.0%) | 598 (100.0%) |
Real Estate & Mortgages in Cottonwood
Real Estate and Mortgage Overview in Cottonwood
| Characteristic | Without Mortgage | With Mortgage |
| Housing Units | 65 | 1,089 |
| Median Property Value | $139,300 | $328,700 |
| Median Household Income | $59,271 | $384 |
| Monthly Housing Costs | $422 | $185 |
| Real Estate Taxes | $1,609 | $0 |
Property Value by Mortgage Status in Cottonwood
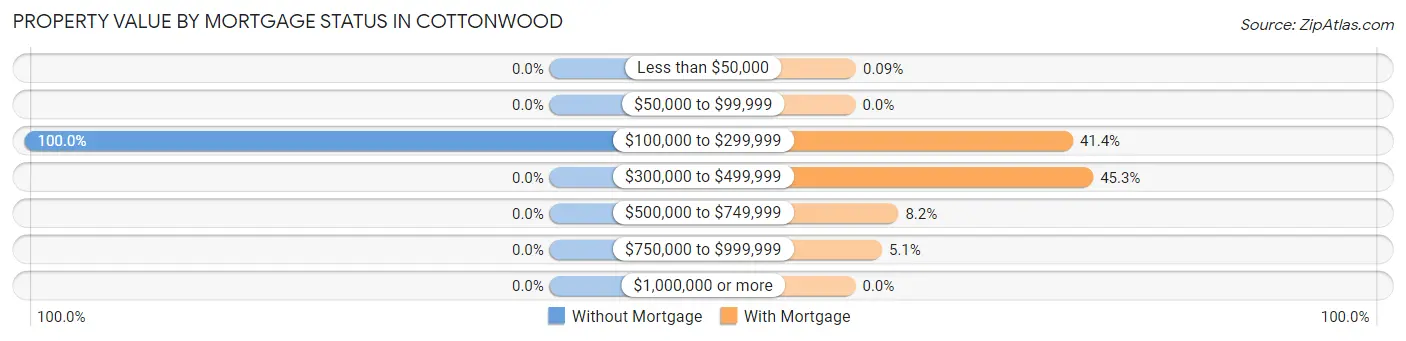
| Property Value | Without Mortgage | With Mortgage |
| Less than $50,000 | 0 (0.0%) | 1 (0.1%) |
| $50,000 to $99,999 | 0 (0.0%) | 0 (0.0%) |
| $100,000 to $299,999 | 65 (100.0%) | 451 (41.4%) |
| $300,000 to $499,999 | 0 (0.0%) | 493 (45.3%) |
| $500,000 to $749,999 | 0 (0.0%) | 89 (8.2%) |
| $750,000 to $999,999 | 0 (0.0%) | 55 (5.1%) |
| $1,000,000 or more | 0 (0.0%) | 0 (0.0%) |
| Total | 65 (100.0%) | 1,089 (100.0%) |
Household Income by Mortgage Status in Cottonwood
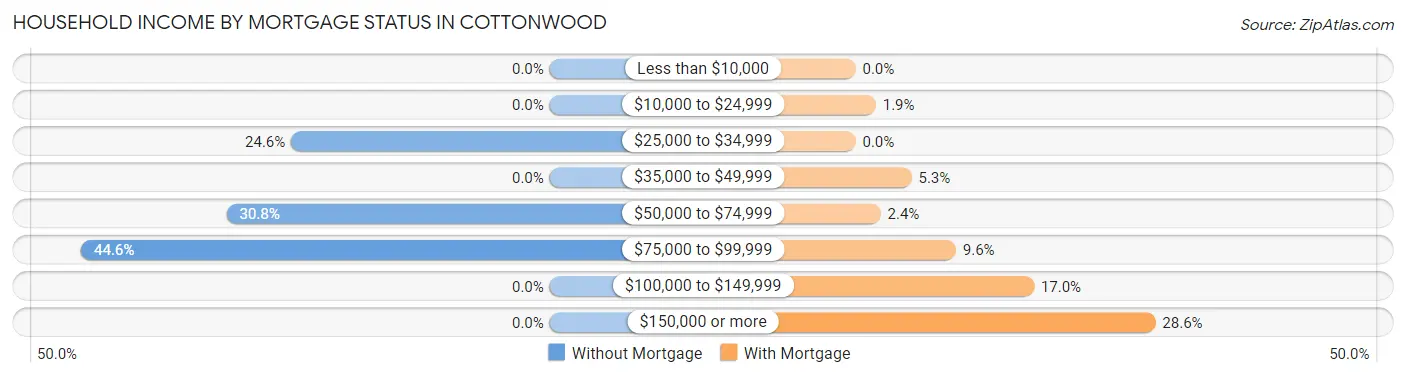
| Household Income | Without Mortgage | With Mortgage |
| Less than $10,000 | 0 (0.0%) | 0 (0.0%) |
| $10,000 to $24,999 | 0 (0.0%) | 21 (1.9%) |
| $25,000 to $34,999 | 16 (24.6%) | 0 (0.0%) |
| $35,000 to $49,999 | 0 (0.0%) | 58 (5.3%) |
| $50,000 to $74,999 | 20 (30.8%) | 26 (2.4%) |
| $75,000 to $99,999 | 29 (44.6%) | 104 (9.6%) |
| $100,000 to $149,999 | 0 (0.0%) | 185 (17.0%) |
| $150,000 or more | 0 (0.0%) | 311 (28.6%) |
| Total | 65 (100.0%) | 1,089 (100.0%) |
Property Value to Household Income Ratio in Cottonwood
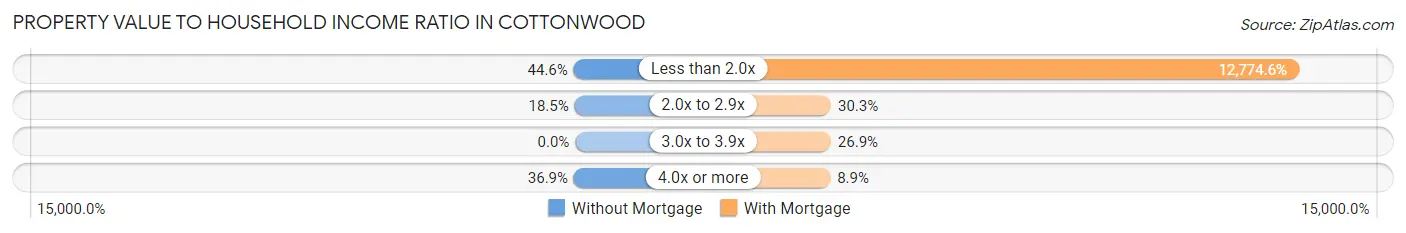
| Value-to-Income Ratio | Without Mortgage | With Mortgage |
| Less than 2.0x | 29 (44.6%) | 139,115 (12,774.6%) |
| 2.0x to 2.9x | 12 (18.5%) | 330 (30.3%) |
| 3.0x to 3.9x | 0 (0.0%) | 293 (26.9%) |
| 4.0x or more | 24 (36.9%) | 97 (8.9%) |
| Total | 65 (100.0%) | 1,089 (100.0%) |
Real Estate Taxes by Mortgage Status in Cottonwood
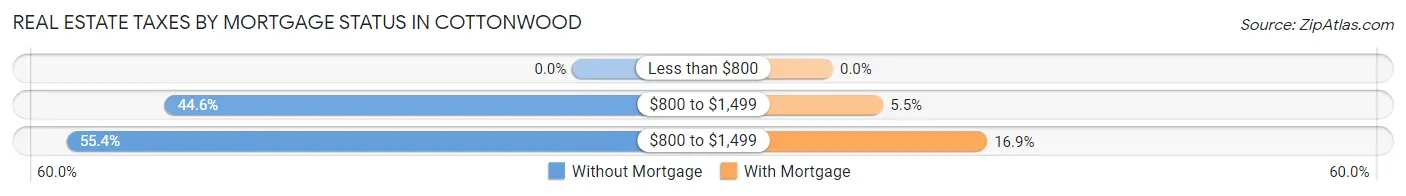
| Property Taxes | Without Mortgage | With Mortgage |
| Less than $800 | 0 (0.0%) | 0 (0.0%) |
| $800 to $1,499 | 29 (44.6%) | 60 (5.5%) |
| $800 to $1,499 | 36 (55.4%) | 184 (16.9%) |
| Total | 65 (100.0%) | 1,089 (100.0%) |
Health & Disability in Cottonwood
Health Insurance Coverage by Age in Cottonwood
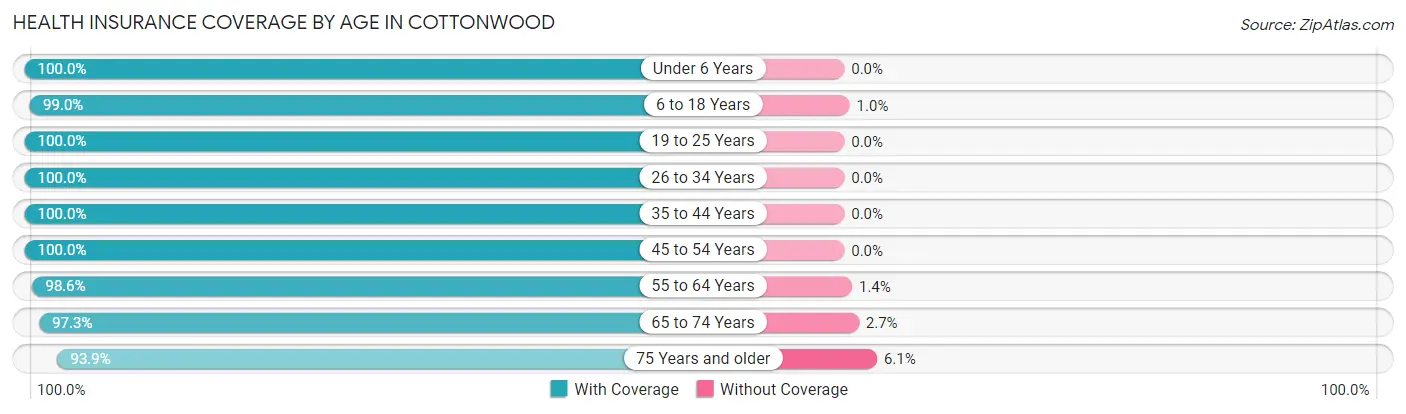
| Age Bracket | With Coverage | Without Coverage |
| Under 6 Years | 448 (100.0%) | 0 (0.0%) |
| 6 to 18 Years | 988 (99.0%) | 10 (1.0%) |
| 19 to 25 Years | 354 (100.0%) | 0 (0.0%) |
| 26 to 34 Years | 577 (100.0%) | 0 (0.0%) |
| 35 to 44 Years | 936 (100.0%) | 0 (0.0%) |
| 45 to 54 Years | 870 (100.0%) | 0 (0.0%) |
| 55 to 64 Years | 751 (98.6%) | 11 (1.4%) |
| 65 to 74 Years | 683 (97.3%) | 19 (2.7%) |
| 75 Years and older | 231 (93.9%) | 15 (6.1%) |
| Total | 5,838 (99.1%) | 55 (0.9%) |
Health Insurance Coverage by Citizenship Status in Cottonwood
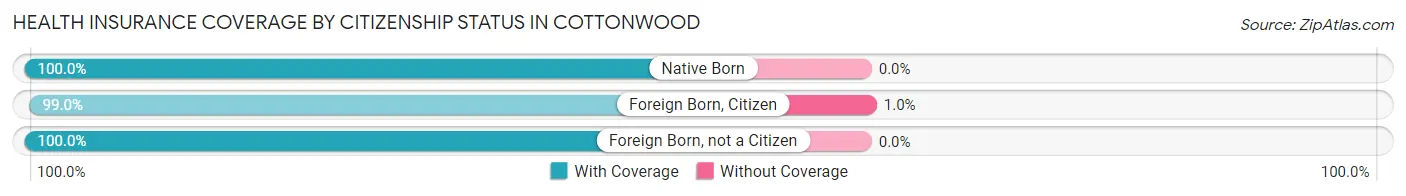
| Citizenship Status | With Coverage | Without Coverage |
| Native Born | 448 (100.0%) | 0 (0.0%) |
| Foreign Born, Citizen | 988 (99.0%) | 10 (1.0%) |
| Foreign Born, not a Citizen | 354 (100.0%) | 0 (0.0%) |
Health Insurance Coverage by Household Income in Cottonwood
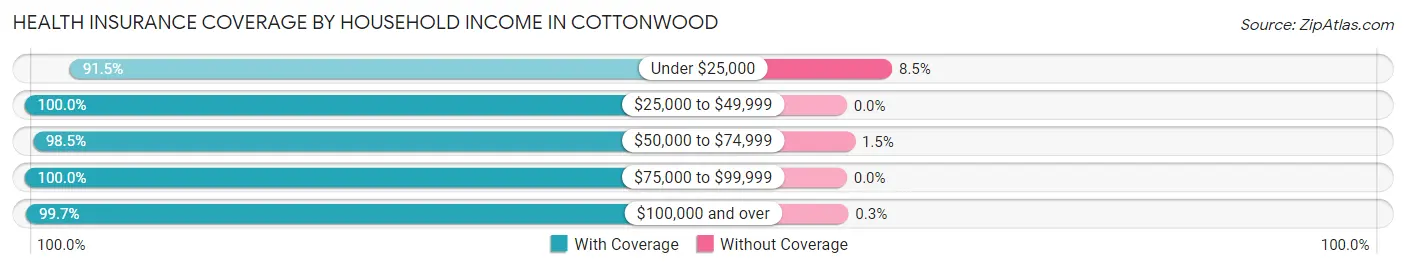
| Household Income | With Coverage | Without Coverage |
| Under $25,000 | 367 (91.5%) | 34 (8.5%) |
| $25,000 to $49,999 | 528 (100.0%) | 0 (0.0%) |
| $50,000 to $74,999 | 706 (98.5%) | 11 (1.5%) |
| $75,000 to $99,999 | 933 (100.0%) | 0 (0.0%) |
| $100,000 and over | 3,304 (99.7%) | 10 (0.3%) |
Public vs Private Health Insurance Coverage by Age in Cottonwood
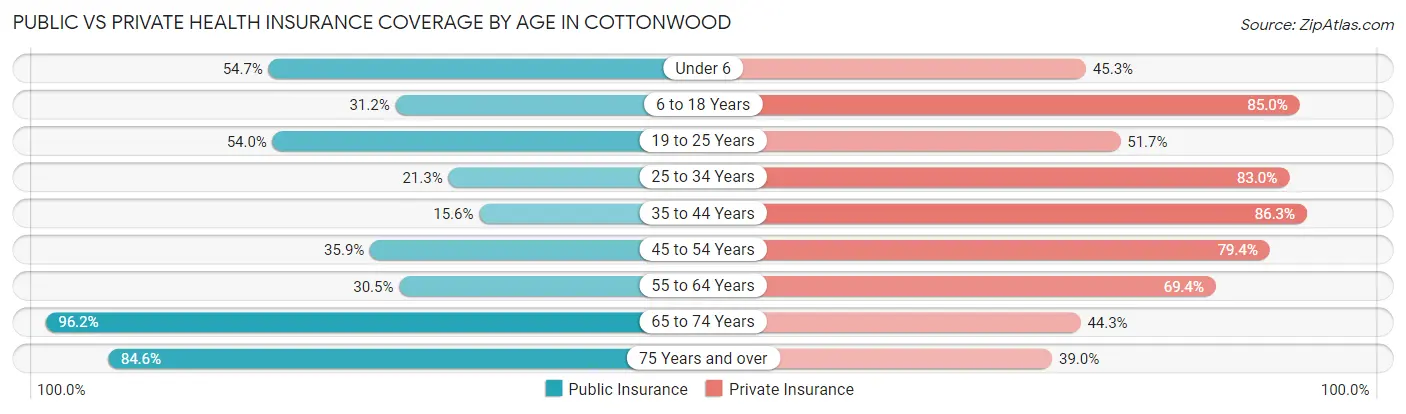
| Age Bracket | Public Insurance | Private Insurance |
| Under 6 | 245 (54.7%) | 203 (45.3%) |
| 6 to 18 Years | 311 (31.2%) | 848 (85.0%) |
| 19 to 25 Years | 191 (53.9%) | 183 (51.7%) |
| 25 to 34 Years | 123 (21.3%) | 479 (83.0%) |
| 35 to 44 Years | 146 (15.6%) | 808 (86.3%) |
| 45 to 54 Years | 312 (35.9%) | 691 (79.4%) |
| 55 to 64 Years | 232 (30.4%) | 529 (69.4%) |
| 65 to 74 Years | 675 (96.2%) | 311 (44.3%) |
| 75 Years and over | 208 (84.6%) | 96 (39.0%) |
| Total | 2,443 (41.5%) | 4,148 (70.4%) |
Disability Status by Sex by Age in Cottonwood
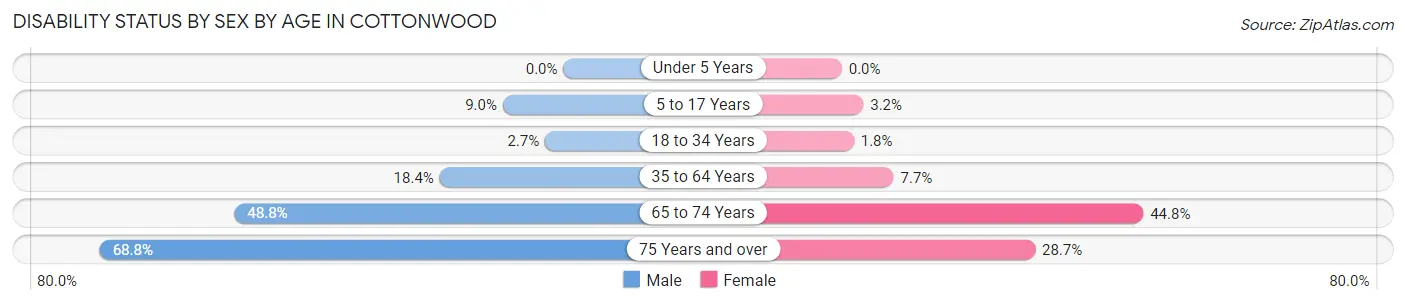
| Age Bracket | Male | Female |
| Under 5 Years | 0 (0.0%) | 0 (0.0%) |
| 5 to 17 Years | 31 (9.0%) | 19 (3.2%) |
| 18 to 34 Years | 15 (2.7%) | 9 (1.8%) |
| 35 to 64 Years | 228 (18.4%) | 102 (7.7%) |
| 65 to 74 Years | 189 (48.8%) | 141 (44.8%) |
| 75 Years and over | 95 (68.8%) | 31 (28.7%) |
Disability Class by Sex by Age in Cottonwood
Disability Class: Hearing Difficulty
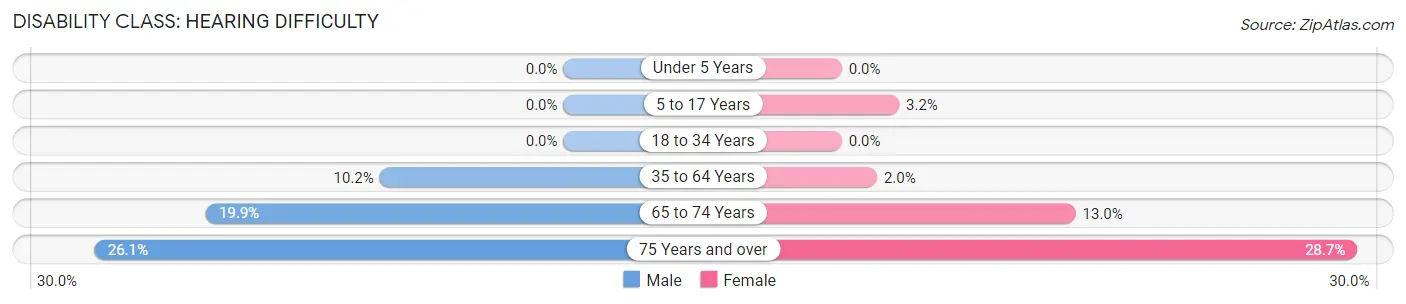
| Age Bracket | Male | Female |
| Under 5 Years | 0 (0.0%) | 0 (0.0%) |
| 5 to 17 Years | 0 (0.0%) | 19 (3.2%) |
| 18 to 34 Years | 0 (0.0%) | 0 (0.0%) |
| 35 to 64 Years | 127 (10.2%) | 26 (2.0%) |
| 65 to 74 Years | 77 (19.9%) | 41 (13.0%) |
| 75 Years and over | 36 (26.1%) | 31 (28.7%) |
Disability Class: Vision Difficulty
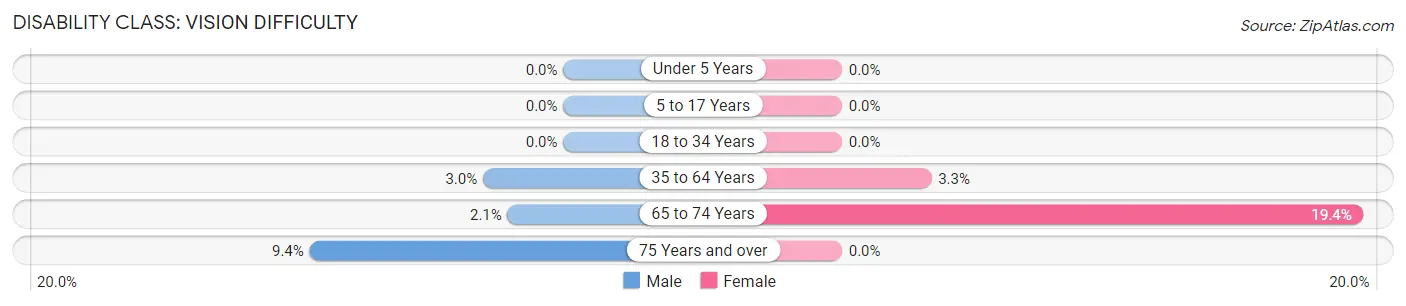
| Age Bracket | Male | Female |
| Under 5 Years | 0 (0.0%) | 0 (0.0%) |
| 5 to 17 Years | 0 (0.0%) | 0 (0.0%) |
| 18 to 34 Years | 0 (0.0%) | 0 (0.0%) |
| 35 to 64 Years | 37 (3.0%) | 44 (3.3%) |
| 65 to 74 Years | 8 (2.1%) | 61 (19.4%) |
| 75 Years and over | 13 (9.4%) | 0 (0.0%) |
Disability Class: Cognitive Difficulty
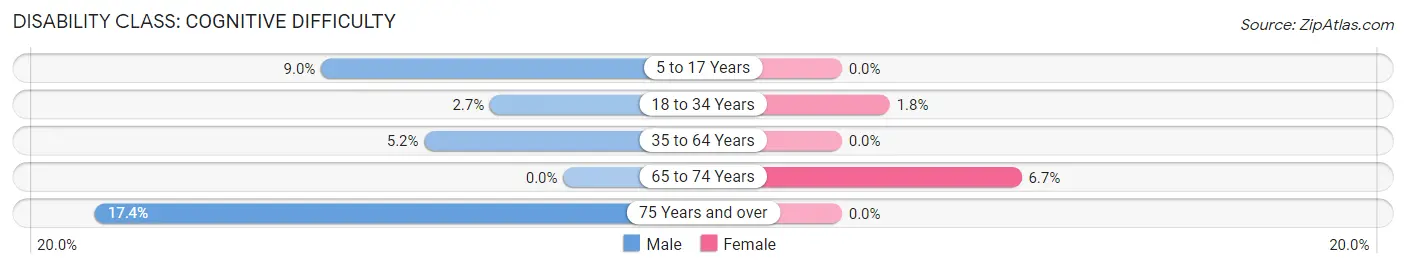
| Age Bracket | Male | Female |
| 5 to 17 Years | 31 (9.0%) | 0 (0.0%) |
| 18 to 34 Years | 15 (2.7%) | 9 (1.8%) |
| 35 to 64 Years | 64 (5.2%) | 0 (0.0%) |
| 65 to 74 Years | 0 (0.0%) | 21 (6.7%) |
| 75 Years and over | 24 (17.4%) | 0 (0.0%) |
Disability Class: Ambulatory Difficulty
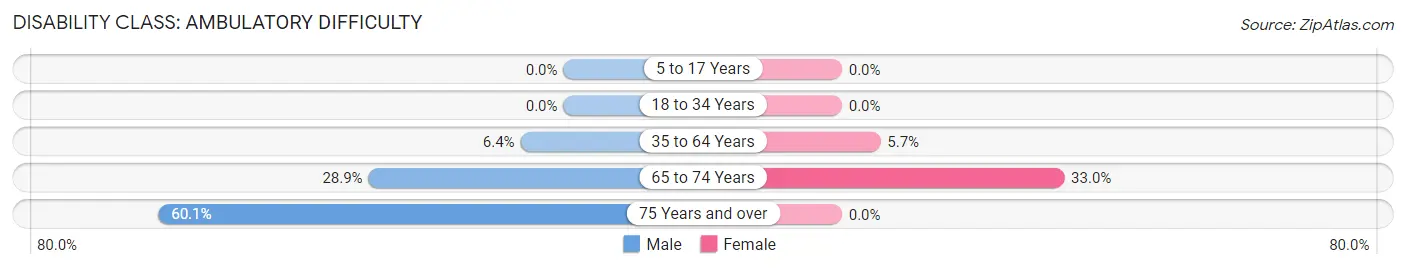
| Age Bracket | Male | Female |
| 5 to 17 Years | 0 (0.0%) | 0 (0.0%) |
| 18 to 34 Years | 0 (0.0%) | 0 (0.0%) |
| 35 to 64 Years | 79 (6.4%) | 76 (5.7%) |
| 65 to 74 Years | 112 (28.9%) | 104 (33.0%) |
| 75 Years and over | 83 (60.1%) | 0 (0.0%) |
Disability Class: Self-Care Difficulty
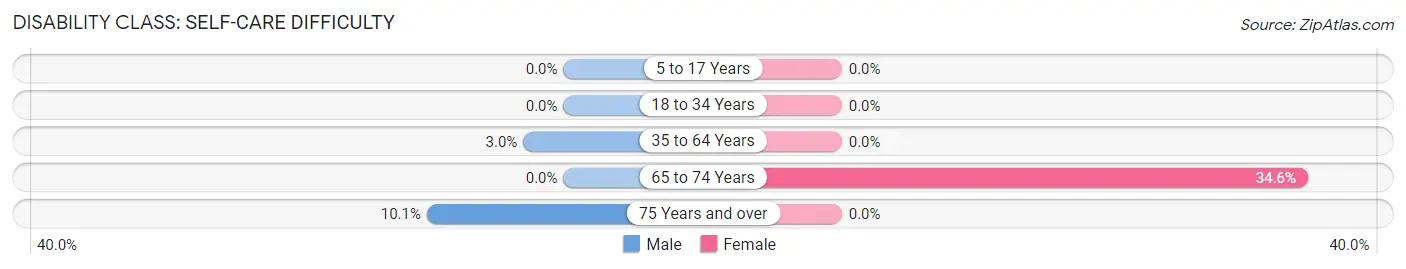
| Age Bracket | Male | Female |
| 5 to 17 Years | 0 (0.0%) | 0 (0.0%) |
| 18 to 34 Years | 0 (0.0%) | 0 (0.0%) |
| 35 to 64 Years | 37 (3.0%) | 0 (0.0%) |
| 65 to 74 Years | 0 (0.0%) | 109 (34.6%) |
| 75 Years and over | 14 (10.1%) | 0 (0.0%) |
Technology Access in Cottonwood
Computing Device Access in Cottonwood
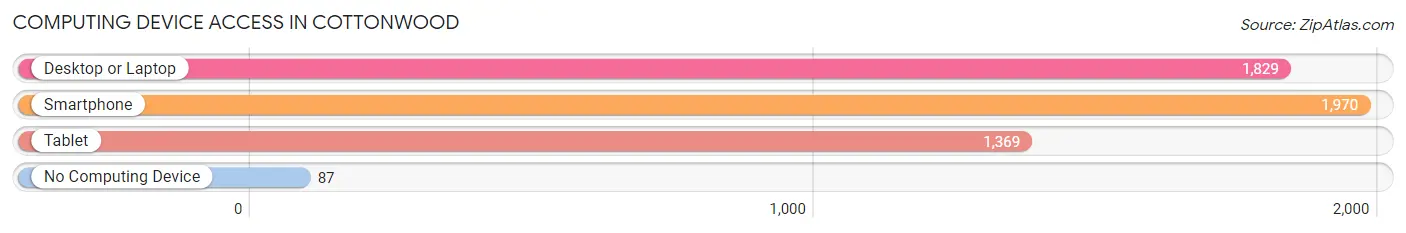
| Device Type | # Households | % Households |
| Desktop or Laptop | 1,829 | 83.0% |
| Smartphone | 1,970 | 89.3% |
| Tablet | 1,369 | 62.1% |
| No Computing Device | 87 | 4.0% |
| Total | 2,205 | 100.0% |
Internet Access in Cottonwood
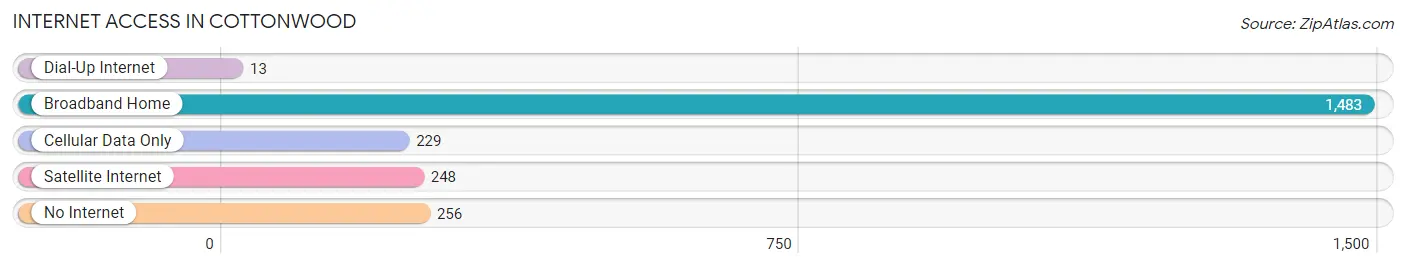
| Internet Type | # Households | % Households |
| Dial-Up Internet | 13 | 0.6% |
| Broadband Home | 1,483 | 67.3% |
| Cellular Data Only | 229 | 10.4% |
| Satellite Internet | 248 | 11.3% |
| No Internet | 256 | 11.6% |
| Total | 2,205 | 100.0% |
Cottonwood Summary
Cottonwood, California is a small unincorporated community located in Shasta County, California. It is situated in the northern part of the state, about 10 miles south of Redding. The population of Cottonwood was estimated to be around 3,000 in 2020.
History
Cottonwood was first settled in the late 1800s by a group of settlers from the Midwest. The town was originally called "Cottonwood Station" due to its proximity to the railroad. The town was officially incorporated in 1891 and was named after the cottonwood trees that grew in the area.
In the early 1900s, Cottonwood was a thriving agricultural community. The town was known for its production of apples, pears, and other fruits. Cottonwood also had a thriving lumber industry, with several sawmills in the area.
In the 1950s, Cottonwood began to experience a decline in population as people moved away to larger cities. The town was eventually annexed by the City of Redding in the 1970s.
Geography
Cottonwood is located in the northern part of Shasta County, California. It is situated in the Sacramento Valley, about 10 miles south of Redding. The town is surrounded by rolling hills and is located near the Sacramento River.
The climate in Cottonwood is generally mild, with hot summers and cool winters. The average temperature in the summer is around 90 degrees Fahrenheit, while the average temperature in the winter is around 40 degrees Fahrenheit.
Economy
Cottonwood's economy is largely based on agriculture and tourism. The town is home to several wineries, as well as a number of apple orchards. Cottonwood is also home to several small businesses, including restaurants, shops, and a movie theater.
The town is also home to a number of manufacturing companies, including a paper mill and a furniture factory. Cottonwood is also home to a number of government offices, including the Shasta County Sheriff's Office and the Shasta County Courthouse.
Demographics
As of 2020, the population of Cottonwood was estimated to be around 3,000. The town is predominantly white, with a small Hispanic population. The median household income in Cottonwood is around $50,000, and the median home value is around $200,000.
Cottonwood is served by the Shasta County School District, which includes two elementary schools, one middle school, and one high school. The town is also home to a number of churches, including the Cottonwood Community Church and the Cottonwood Baptist Church.
Conclusion
Cottonwood, California is a small unincorporated community located in Shasta County, California. It is situated in the northern part of the state, about 10 miles south of Redding. The population of Cottonwood was estimated to be around 3,000 in 2020. The town is predominantly white, with a small Hispanic population. The economy of Cottonwood is largely based on agriculture and tourism, and the town is home to several wineries, apple orchards, small businesses, and manufacturing companies. Cottonwood is served by the Shasta County School District, and the town is also home to a number of churches.
Common Questions
What is Per Capita Income in Cottonwood?
Per Capita income in Cottonwood is $46,245.
What is the Median Family Income in Cottonwood?
Median Family Income in Cottonwood is $105,208.
What is the Median Household income in Cottonwood?
Median Household Income in Cottonwood is $90,231.
What is Income or Wage Gap in Cottonwood?
Income or Wage Gap in Cottonwood is 30.7%.
Women in Cottonwood earn 69.3 cents for every dollar earned by a man.
What is Inequality or Gini Index in Cottonwood?
Inequality or Gini Index in Cottonwood is 0.46.
What is the Total Population of Cottonwood?
Total Population of Cottonwood is 5,893.
What is the Total Male Population of Cottonwood?
Total Male Population of Cottonwood is 2,870.
What is the Total Female Population of Cottonwood?
Total Female Population of Cottonwood is 3,023.
What is the Ratio of Males per 100 Females in Cottonwood?
There are 94.94 Males per 100 Females in Cottonwood.
What is the Ratio of Females per 100 Males in Cottonwood?
There are 105.33 Females per 100 Males in Cottonwood.
What is the Median Population Age in Cottonwood?
Median Population Age in Cottonwood is 40.5 Years.
What is the Average Family Size in Cottonwood
Average Family Size in Cottonwood is 3.0 People.
What is the Average Household Size in Cottonwood
Average Household Size in Cottonwood is 2.7 People.
How Large is the Labor Force in Cottonwood?
There are 2,970 People in the Labor Forcein in Cottonwood.
What is the Percentage of People in the Labor Force in Cottonwood?
63.9% of People are in the Labor Force in Cottonwood.
What is the Unemployment Rate in Cottonwood?
Unemployment Rate in Cottonwood is 3.7%.