Corte Madera, CA Map & Demographics
Corte Madera Map
Corte Madera Overview
$112,991
PER CAPITA INCOME
$250,001
AVG FAMILY INCOME
$210,560
AVG HOUSEHOLD INCOME
9.0%
WAGE / INCOME GAP [ % ]
91.0¢/ $1
WAGE / INCOME GAP [ $ ]
0.44
INEQUALITY / GINI INDEX
10,155
TOTAL POPULATION
5,167
MALE POPULATION
4,988
FEMALE POPULATION
103.59
MALES / 100 FEMALES
96.54
FEMALES / 100 MALES
44.4
MEDIAN AGE
3.0
AVG FAMILY SIZE
2.5
AVG HOUSEHOLD SIZE
5,181
LABOR FORCE [ PEOPLE ]
66.3%
PERCENT IN LABOR FORCE
5.2%
UNEMPLOYMENT RATE
Corte Madera Zip Codes
Corte Madera Area Codes
Income in Corte Madera
Income Overview in Corte Madera
Per Capita Income in Corte Madera is $112,991, while median incomes of families and households are $250,001 and $210,560 respectively.
| Characteristic | Number | Measure |
| Per Capita Income | 10,155 | $112,991 |
| Median Family Income | 2,926 | $250,001 |
| Mean Family Income | 2,926 | $332,569 |
| Median Household Income | 4,023 | $210,560 |
| Mean Household Income | 4,023 | $284,794 |
| Income Deficit | 2,926 | $0 |
| Wage / Income Gap (%) | 10,155 | 9.03% |
| Wage / Income Gap ($) | 10,155 | 90.97¢ per $1 |
| Gini / Inequality Index | 10,155 | 0.44 |
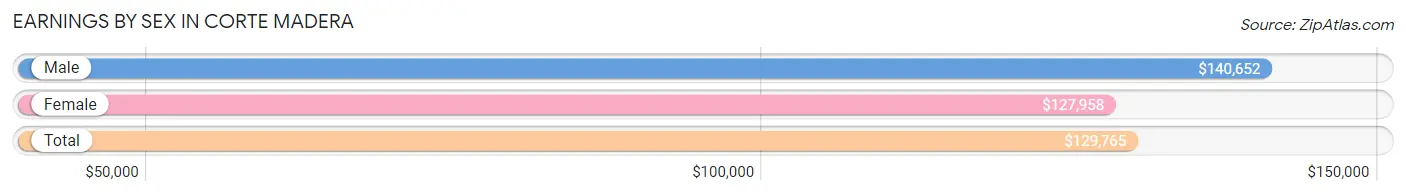
Earnings by Sex in Corte Madera
Average Earnings in Corte Madera are $129,765, $140,652 for men and $127,958 for women, a difference of 9.0%.
| Sex | Number | Average Earnings |
| Male | 3,118 (55.0%) | $140,652 |
| Female | 2,549 (45.0%) | $127,958 |
| Total | 5,667 (100.0%) | $129,765 |
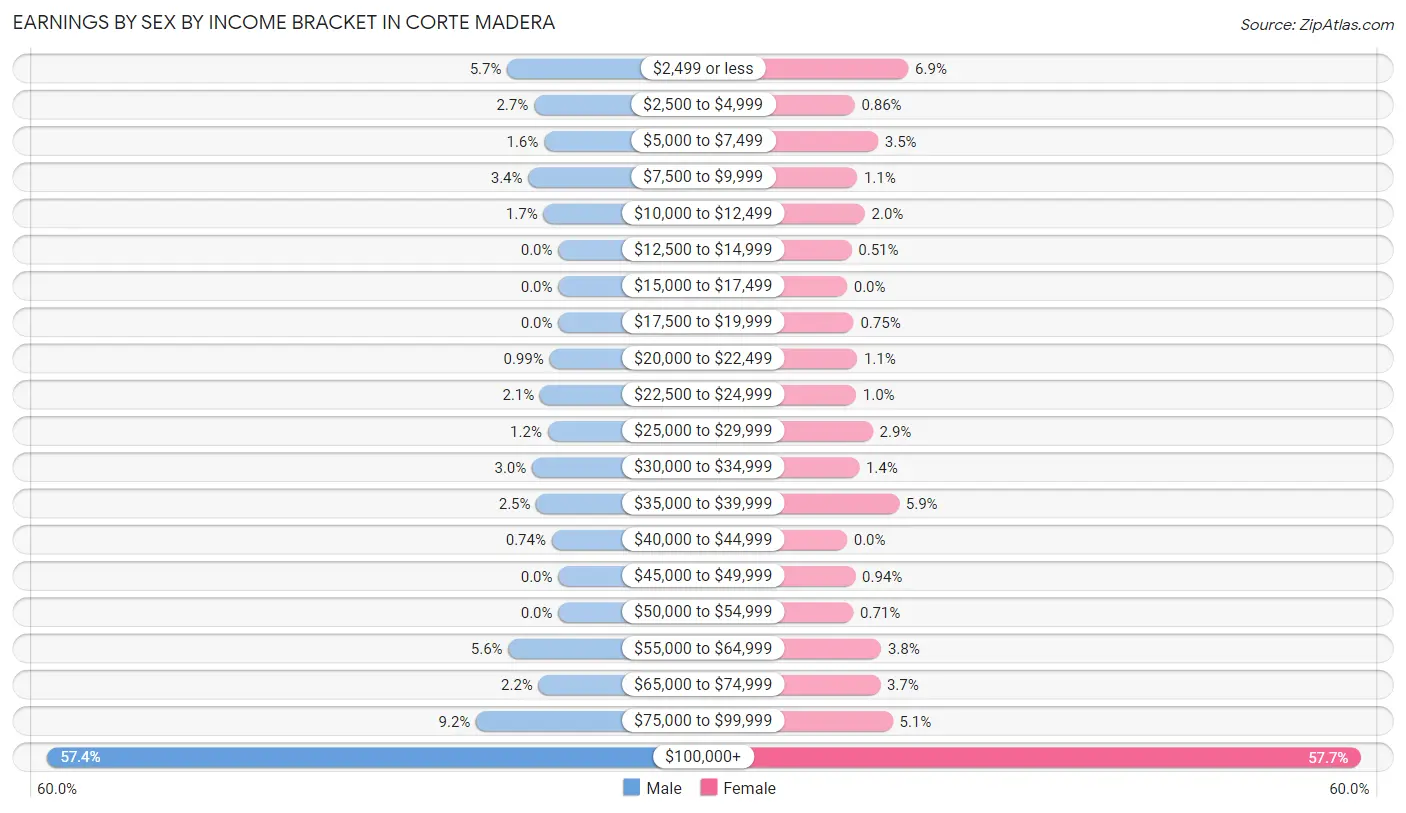
Earnings by Sex by Income Bracket in Corte Madera
The most common earnings brackets in Corte Madera are $100,000+ for men (1,791 | 57.4%) and $100,000+ for women (1,471 | 57.7%).
| Income | Male | Female |
| $2,499 or less | 179 (5.7%) | 176 (6.9%) |
| $2,500 to $4,999 | 85 (2.7%) | 22 (0.9%) |
| $5,000 to $7,499 | 50 (1.6%) | 89 (3.5%) |
| $7,500 to $9,999 | 105 (3.4%) | 29 (1.1%) |
| $10,000 to $12,499 | 52 (1.7%) | 51 (2.0%) |
| $12,500 to $14,999 | 0 (0.0%) | 13 (0.5%) |
| $15,000 to $17,499 | 0 (0.0%) | 0 (0.0%) |
| $17,500 to $19,999 | 0 (0.0%) | 19 (0.7%) |
| $20,000 to $22,499 | 31 (1.0%) | 29 (1.1%) |
| $22,500 to $24,999 | 64 (2.1%) | 26 (1.0%) |
| $25,000 to $29,999 | 37 (1.2%) | 74 (2.9%) |
| $30,000 to $34,999 | 92 (2.9%) | 35 (1.4%) |
| $35,000 to $39,999 | 77 (2.5%) | 149 (5.9%) |
| $40,000 to $44,999 | 23 (0.7%) | 0 (0.0%) |
| $45,000 to $49,999 | 0 (0.0%) | 24 (0.9%) |
| $50,000 to $54,999 | 0 (0.0%) | 18 (0.7%) |
| $55,000 to $64,999 | 175 (5.6%) | 98 (3.8%) |
| $65,000 to $74,999 | 69 (2.2%) | 95 (3.7%) |
| $75,000 to $99,999 | 288 (9.2%) | 131 (5.1%) |
| $100,000+ | 1,791 (57.4%) | 1,471 (57.7%) |
| Total | 3,118 (100.0%) | 2,549 (100.0%) |
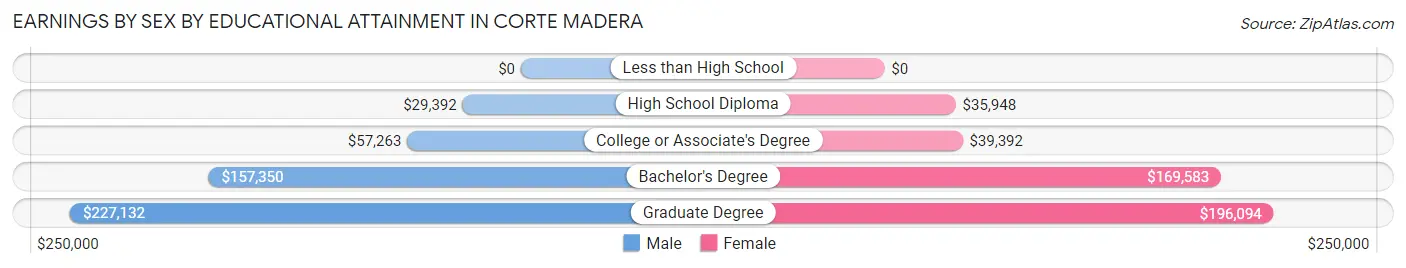
Earnings by Sex by Educational Attainment in Corte Madera
Average earnings in Corte Madera are $168,125 for men and $134,688 for women, a difference of 19.9%. Men with an educational attainment of graduate degree enjoy the highest average annual earnings of $227,132, while those with high school diploma education earn the least with $29,392. Women with an educational attainment of graduate degree earn the most with the average annual earnings of $196,094, while those with high school diploma education have the smallest earnings of $35,948.
| Educational Attainment | Male Income | Female Income |
| Less than High School | - | - |
| High School Diploma | $29,392 | $35,948 |
| College or Associate's Degree | $57,263 | $39,392 |
| Bachelor's Degree | $157,350 | $169,583 |
| Graduate Degree | $227,132 | $196,094 |
| Total | $168,125 | $134,688 |
Family Income in Corte Madera
Family Income Brackets in Corte Madera
According to the Corte Madera family income data, there are 1,931 families falling into the $200,000+ income range, which is the most common income bracket and makes up 66.0% of all families. Conversely, the $10,000 to $14,999 income bracket is the least frequent group with only 15 families (0.5%) belonging to this category.
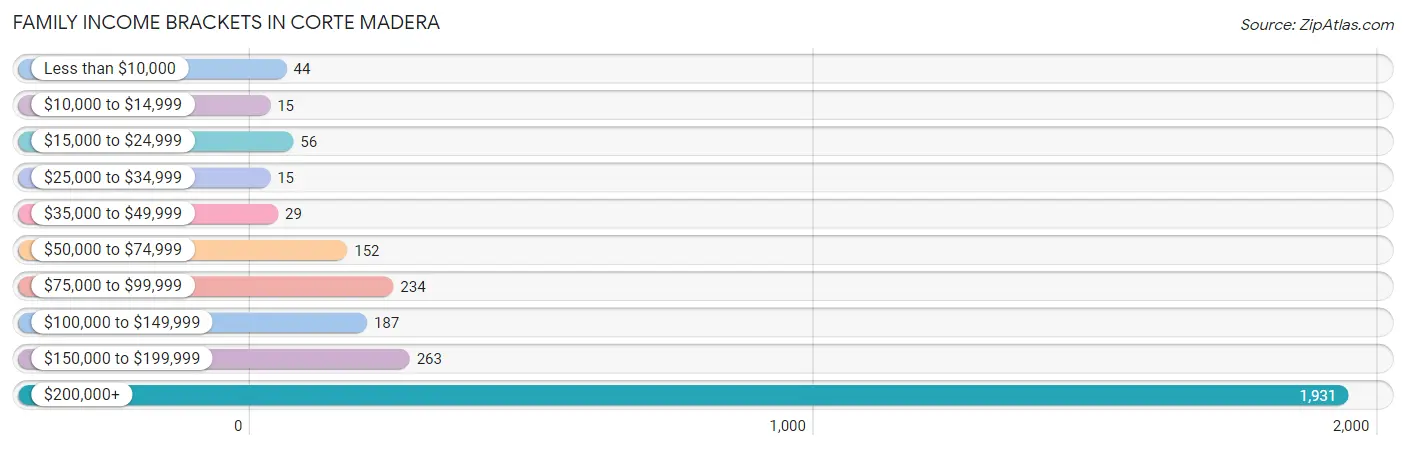
| Income Bracket | # Families | % Families |
| Less than $10,000 | 44 | 1.5% |
| $10,000 to $14,999 | 15 | 0.5% |
| $15,000 to $24,999 | 56 | 1.9% |
| $25,000 to $34,999 | 15 | 0.5% |
| $35,000 to $49,999 | 29 | 1.0% |
| $50,000 to $74,999 | 152 | 5.2% |
| $75,000 to $99,999 | 234 | 8.0% |
| $100,000 to $149,999 | 187 | 6.4% |
| $150,000 to $199,999 | 263 | 9.0% |
| $200,000+ | 1,931 | 66.0% |
Family Income by Famaliy Size in Corte Madera
3-person families (673 | 23.0%) account for the highest median family income in Corte Madera with $250,001 per family, while 2-person families (1,377 | 47.1%) have the highest median income of $100,854 per family member.
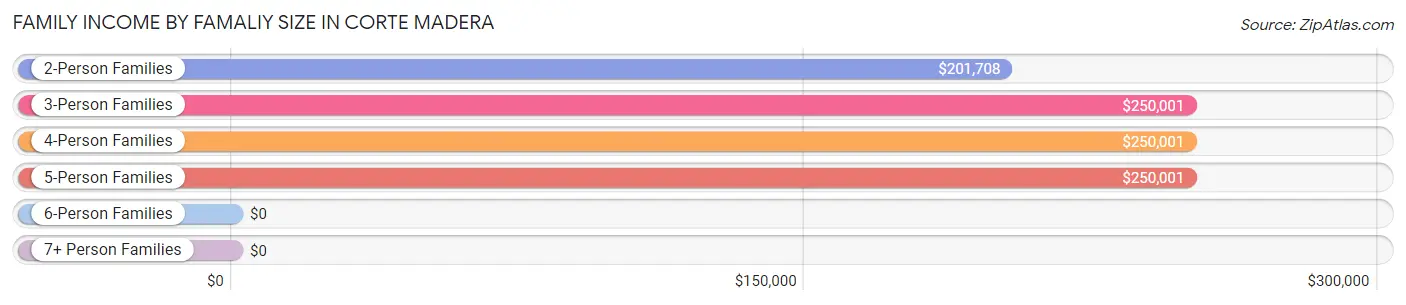
| Income Bracket | # Families | Median Income |
| 2-Person Families | 1,377 (47.1%) | $201,708 |
| 3-Person Families | 673 (23.0%) | $250,001 |
| 4-Person Families | 748 (25.6%) | $250,001 |
| 5-Person Families | 128 (4.4%) | $250,001 |
| 6-Person Families | 0 (0.0%) | $0 |
| 7+ Person Families | 0 (0.0%) | $0 |
| Total | 2,926 (100.0%) | $250,001 |
Family Income by Number of Earners in Corte Madera
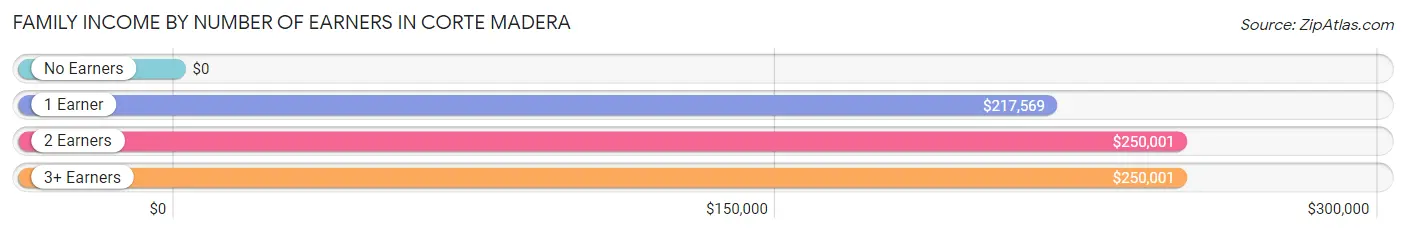
| Number of Earners | # Families | Median Income |
| No Earners | 337 (11.5%) | $0 |
| 1 Earner | 885 (30.2%) | $217,569 |
| 2 Earners | 1,496 (51.1%) | $250,001 |
| 3+ Earners | 208 (7.1%) | $250,001 |
| Total | 2,926 (100.0%) | $250,001 |
Household Income in Corte Madera
Household Income Brackets in Corte Madera
With 2,156 households falling in the category, the $200,000+ income range is the most frequent in Corte Madera, accounting for 53.6% of all households. In contrast, only 16 households (0.4%) fall into the $10,000 to $14,999 income bracket, making it the least populous group.
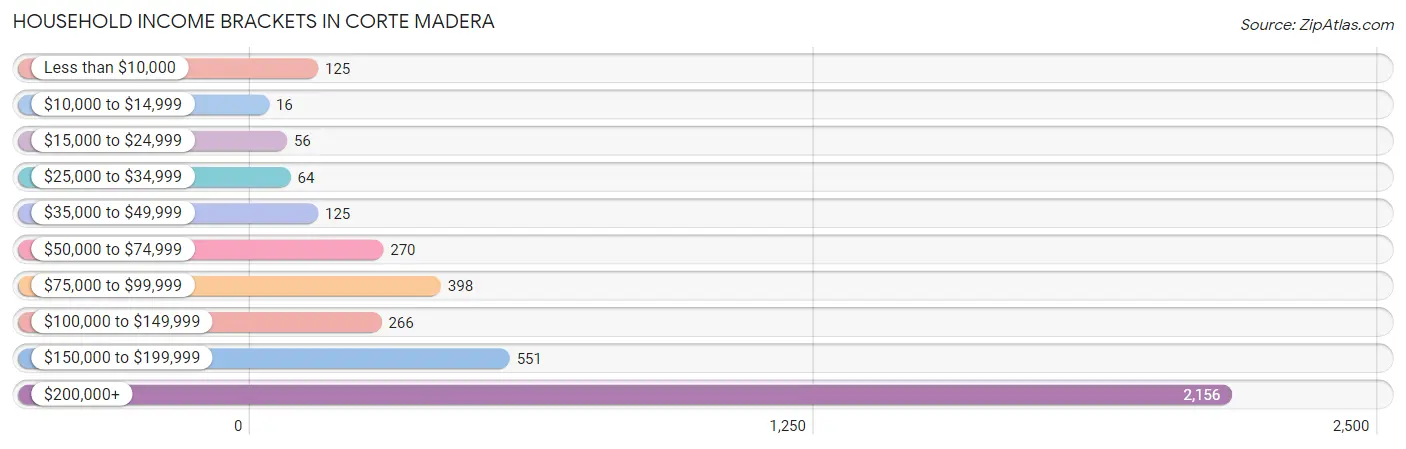
| Income Bracket | # Households | % Households |
| Less than $10,000 | 125 | 3.1% |
| $10,000 to $14,999 | 16 | 0.4% |
| $15,000 to $24,999 | 56 | 1.4% |
| $25,000 to $34,999 | 64 | 1.6% |
| $35,000 to $49,999 | 125 | 3.1% |
| $50,000 to $74,999 | 270 | 6.7% |
| $75,000 to $99,999 | 398 | 9.9% |
| $100,000 to $149,999 | 266 | 6.6% |
| $150,000 to $199,999 | 551 | 13.7% |
| $200,000+ | 2,156 | 53.6% |
Household Income by Householder Age in Corte Madera
The median household income in Corte Madera is $210,560, with the highest median household income of $250,001 found in the 25 to 44 years age bracket for the primary householder. A total of 831 households (20.7%) fall into this category. Meanwhile, the 15 to 24 years age bracket for the primary householder has the lowest median household income of $0, with 51 households (1.3%) in this group.
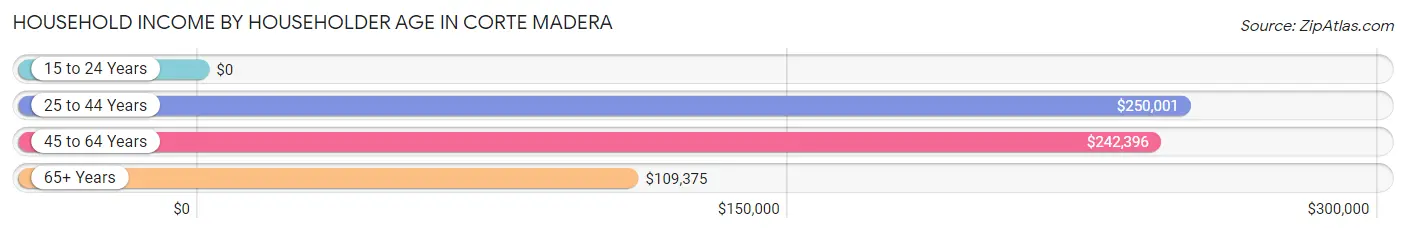
| Income Bracket | # Households | Median Income |
| 15 to 24 Years | 51 (1.3%) | $0 |
| 25 to 44 Years | 831 (20.7%) | $250,001 |
| 45 to 64 Years | 1,939 (48.2%) | $242,396 |
| 65+ Years | 1,202 (29.9%) | $109,375 |
| Total | 4,023 (100.0%) | $210,560 |
Poverty in Corte Madera
Income Below Poverty by Sex and Age in Corte Madera
With 3.4% poverty level for males and 4.0% for females among the residents of Corte Madera, 15 year old males and under 5 year old females are the most vulnerable to poverty, with 48 males (98.0%) and 39 females (11.5%) in their respective age groups living below the poverty level.
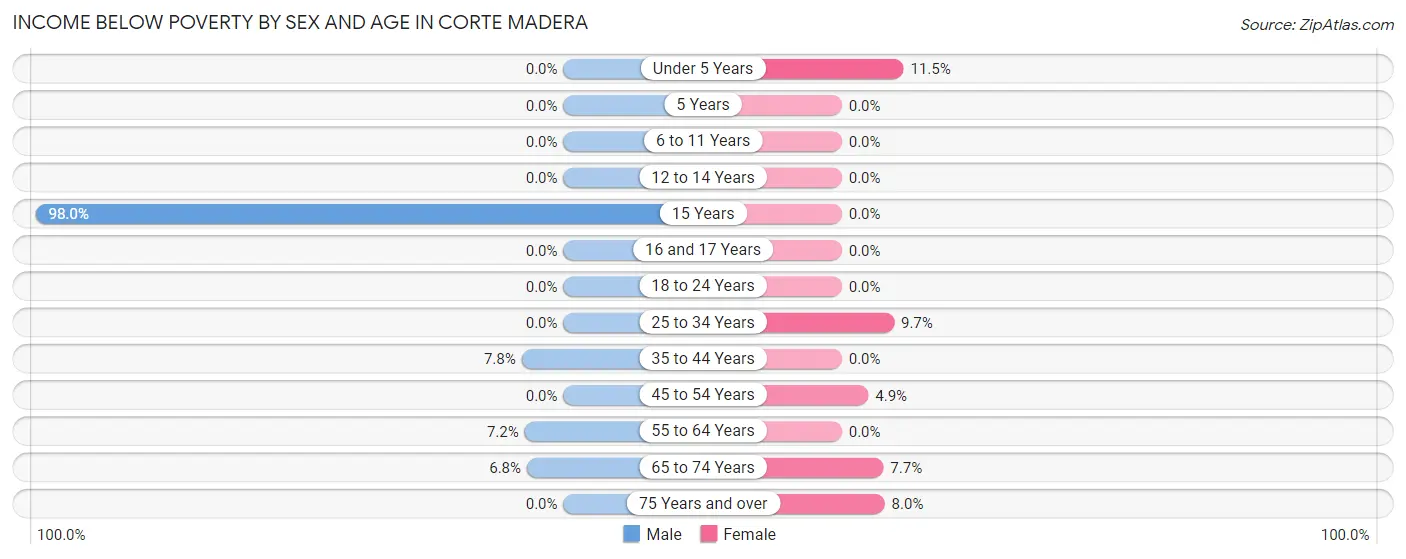
| Age Bracket | Male | Female |
| Under 5 Years | 0 (0.0%) | 39 (11.5%) |
| 5 Years | 0 (0.0%) | 0 (0.0%) |
| 6 to 11 Years | 0 (0.0%) | 0 (0.0%) |
| 12 to 14 Years | 0 (0.0%) | 0 (0.0%) |
| 15 Years | 48 (98.0%) | 0 (0.0%) |
| 16 and 17 Years | 0 (0.0%) | 0 (0.0%) |
| 18 to 24 Years | 0 (0.0%) | 0 (0.0%) |
| 25 to 34 Years | 0 (0.0%) | 39 (9.7%) |
| 35 to 44 Years | 47 (7.8%) | 0 (0.0%) |
| 45 to 54 Years | 0 (0.0%) | 45 (4.9%) |
| 55 to 64 Years | 53 (7.2%) | 0 (0.0%) |
| 65 to 74 Years | 30 (6.8%) | 44 (7.7%) |
| 75 Years and over | 0 (0.0%) | 34 (8.0%) |
| Total | 178 (3.4%) | 201 (4.0%) |
Income Above Poverty by Sex and Age in Corte Madera
According to the poverty statistics in Corte Madera, males aged under 5 years and females aged 5 years are the age groups that are most secure financially, with 100.0% of males and 100.0% of females in these age groups living above the poverty line.
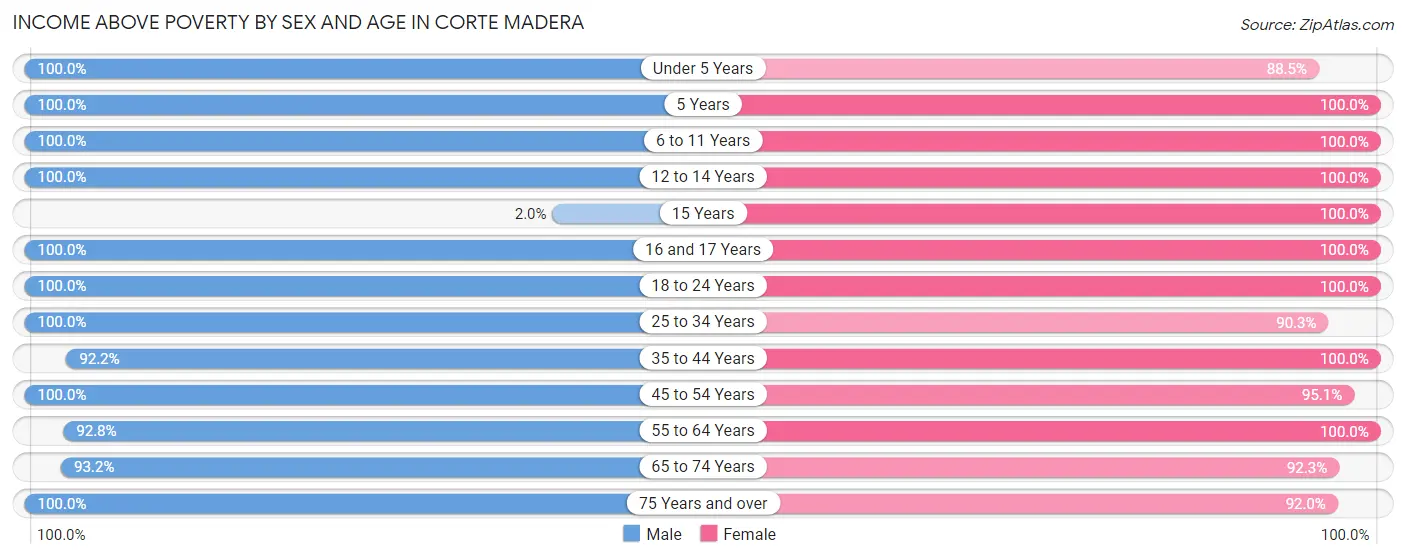
| Age Bracket | Male | Female |
| Under 5 Years | 330 (100.0%) | 301 (88.5%) |
| 5 Years | 140 (100.0%) | 120 (100.0%) |
| 6 to 11 Years | 399 (100.0%) | 440 (100.0%) |
| 12 to 14 Years | 254 (100.0%) | 234 (100.0%) |
| 15 Years | 1 (2.0%) | 34 (100.0%) |
| 16 and 17 Years | 89 (100.0%) | 152 (100.0%) |
| 18 to 24 Years | 538 (100.0%) | 80 (100.0%) |
| 25 to 34 Years | 418 (100.0%) | 363 (90.3%) |
| 35 to 44 Years | 559 (92.2%) | 520 (100.0%) |
| 45 to 54 Years | 790 (100.0%) | 867 (95.1%) |
| 55 to 64 Years | 683 (92.8%) | 757 (100.0%) |
| 65 to 74 Years | 413 (93.2%) | 526 (92.3%) |
| 75 Years and over | 375 (100.0%) | 393 (92.0%) |
| Total | 4,989 (96.6%) | 4,787 (96.0%) |
Income Below Poverty Among Married-Couple Families in Corte Madera
The poverty statistics for married-couple families in Corte Madera show that 1.8% or 43 of the total 2,418 families live below the poverty line. Families with 1 or 2 children have the highest poverty rate of 2.4%, comprising of 27 families. On the other hand, families with 3 or 4 children have the lowest poverty rate of 0.0%, which includes 0 families.
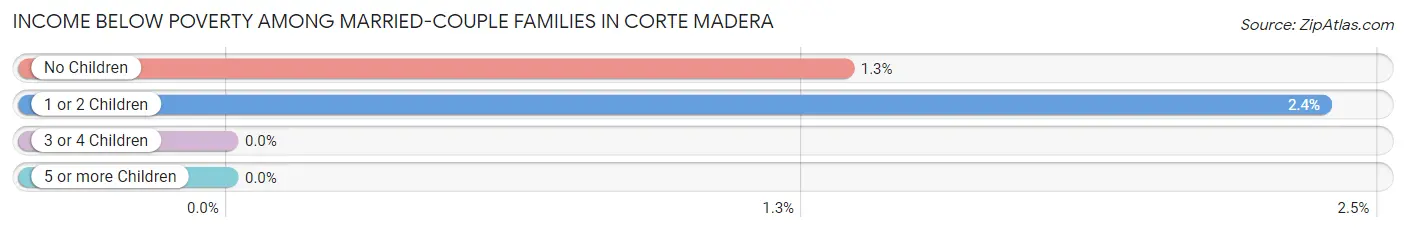
| Children | Above Poverty | Below Poverty |
| No Children | 1,182 (98.7%) | 16 (1.3%) |
| 1 or 2 Children | 1,108 (97.6%) | 27 (2.4%) |
| 3 or 4 Children | 85 (100.0%) | 0 (0.0%) |
| 5 or more Children | 0 (0.0%) | 0 (0.0%) |
| Total | 2,375 (98.2%) | 43 (1.8%) |
Income Below Poverty Among Single-Parent Households in Corte Madera
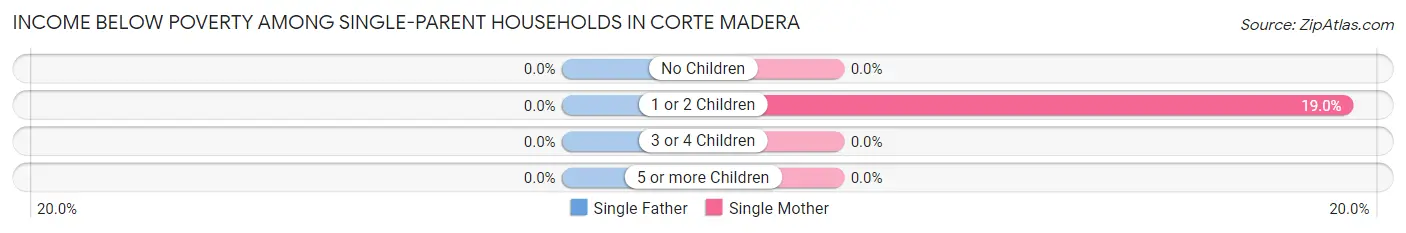
| Children | Single Father | Single Mother |
| No Children | 0 (0.0%) | 0 (0.0%) |
| 1 or 2 Children | 0 (0.0%) | 45 (19.0%) |
| 3 or 4 Children | 0 (0.0%) | 0 (0.0%) |
| 5 or more Children | 0 (0.0%) | 0 (0.0%) |
| Total | 0 (0.0%) | 45 (11.2%) |
Income Below Poverty Among Married-Couple vs Single-Parent Households in Corte Madera
The poverty data for Corte Madera shows that 43 of the married-couple family households (1.8%) and 45 of the single-parent households (8.9%) are living below the poverty level. Within the married-couple family households, those with 1 or 2 children have the highest poverty rate, with 27 households (2.4%) falling below the poverty line. Among the single-parent households, those with 1 or 2 children have the highest poverty rate, with 45 household (13.1%) living below poverty.
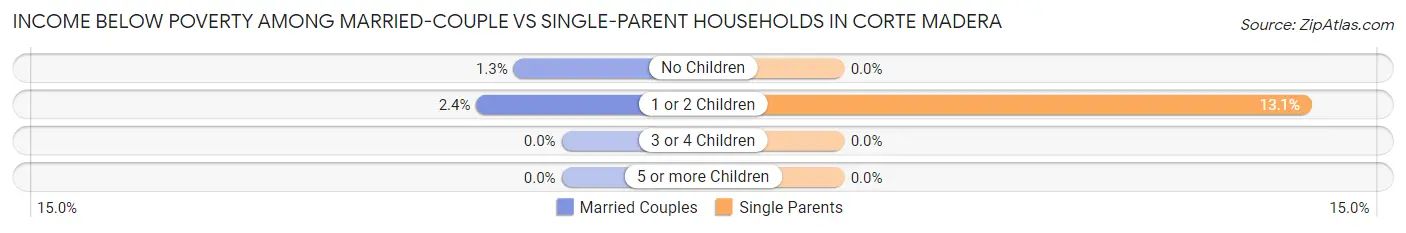
| Children | Married-Couple Families | Single-Parent Households |
| No Children | 16 (1.3%) | 0 (0.0%) |
| 1 or 2 Children | 27 (2.4%) | 45 (13.1%) |
| 3 or 4 Children | 0 (0.0%) | 0 (0.0%) |
| 5 or more Children | 0 (0.0%) | 0 (0.0%) |
| Total | 43 (1.8%) | 45 (8.9%) |
Race in Corte Madera
The most populous races in Corte Madera are White / Caucasian (7,922 | 78.0%), Two or more Races (1,063 | 10.5%), and Hispanic or Latino (913 | 9.0%).
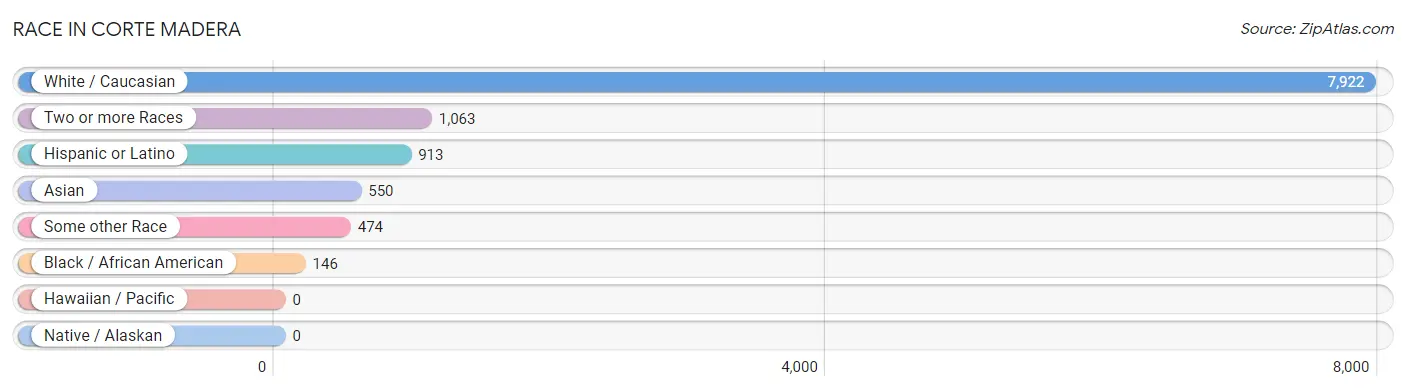
| Race | # Population | % Population |
| Asian | 550 | 5.4% |
| Black / African American | 146 | 1.4% |
| Hawaiian / Pacific | 0 | 0.0% |
| Hispanic or Latino | 913 | 9.0% |
| Native / Alaskan | 0 | 0.0% |
| White / Caucasian | 7,922 | 78.0% |
| Two or more Races | 1,063 | 10.5% |
| Some other Race | 474 | 4.7% |
| Total | 10,155 | 100.0% |
Ancestry in Corte Madera
The most populous ancestries reported in Corte Madera are German (1,610 | 15.9%), English (1,481 | 14.6%), Italian (1,343 | 13.2%), Irish (1,244 | 12.2%), and Mexican (660 | 6.5%), together accounting for 62.4% of all Corte Madera residents.
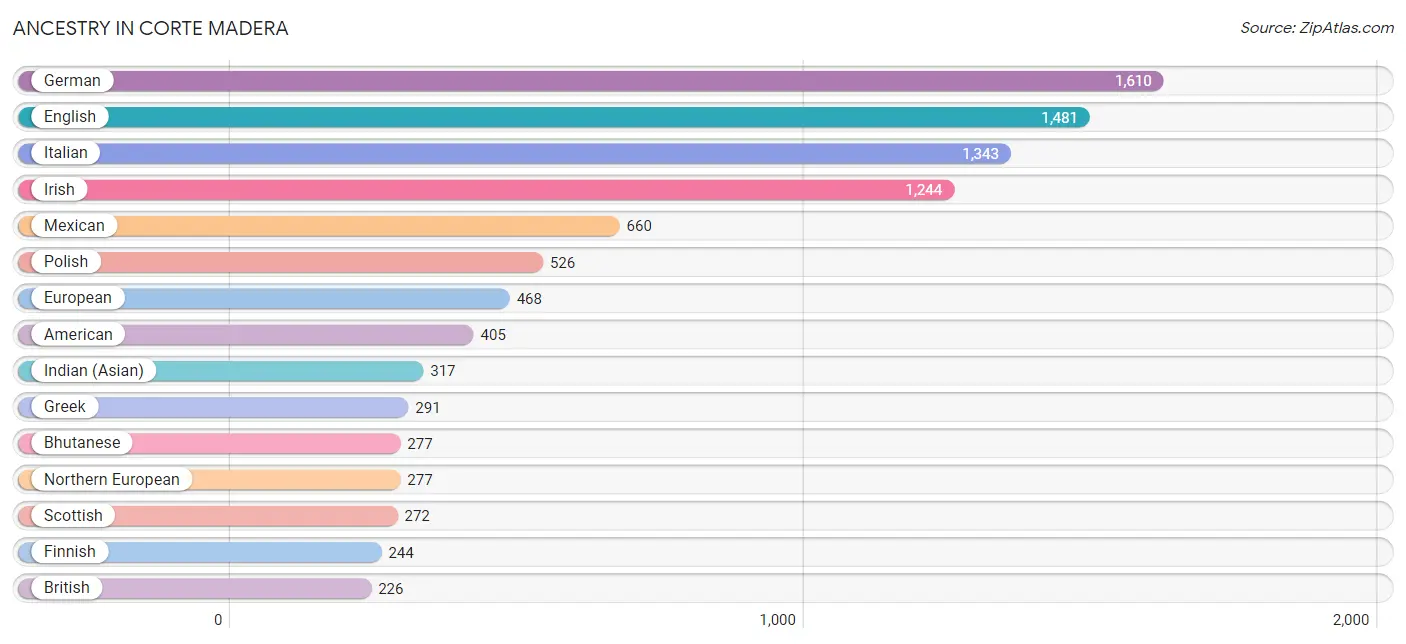
| Ancestry | # Population | % Population |
| American | 405 | 4.0% |
| Arab | 25 | 0.3% |
| Armenian | 40 | 0.4% |
| Australian | 25 | 0.3% |
| Austrian | 83 | 0.8% |
| Bhutanese | 277 | 2.7% |
| Brazilian | 73 | 0.7% |
| British | 226 | 2.2% |
| Burmese | 127 | 1.3% |
| Canadian | 15 | 0.2% |
| Central American | 139 | 1.4% |
| Colombian | 15 | 0.2% |
| Croatian | 83 | 0.8% |
| Czech | 97 | 1.0% |
| Danish | 121 | 1.2% |
| Dutch | 152 | 1.5% |
| Eastern European | 169 | 1.7% |
| English | 1,481 | 14.6% |
| European | 468 | 4.6% |
| Filipino | 29 | 0.3% |
| Finnish | 244 | 2.4% |
| French | 147 | 1.5% |
| German | 1,610 | 15.9% |
| Greek | 291 | 2.9% |
| Guatemalan | 46 | 0.4% |
| Indian (Asian) | 317 | 3.1% |
| Iranian | 61 | 0.6% |
| Irish | 1,244 | 12.2% |
| Italian | 1,343 | 13.2% |
| Japanese | 23 | 0.2% |
| Korean | 54 | 0.5% |
| Laotian | 16 | 0.2% |
| Lebanese | 15 | 0.2% |
| Lithuanian | 64 | 0.6% |
| Mexican | 660 | 6.5% |
| Northern European | 277 | 2.7% |
| Norwegian | 222 | 2.2% |
| Panamanian | 75 | 0.7% |
| Polish | 526 | 5.2% |
| Portuguese | 100 | 1.0% |
| Russian | 87 | 0.9% |
| Salvadoran | 18 | 0.2% |
| Scandinavian | 51 | 0.5% |
| Scotch-Irish | 114 | 1.1% |
| Scottish | 272 | 2.7% |
| Slavic | 16 | 0.2% |
| Slovene | 52 | 0.5% |
| South American | 15 | 0.2% |
| South American Indian | 15 | 0.2% |
| Spanish | 6 | 0.1% |
| Swedish | 148 | 1.5% |
| Swiss | 101 | 1.0% |
| Syrian | 15 | 0.2% |
| Thai | 80 | 0.8% |
| Ukrainian | 11 | 0.1% | View All 55 Rows |
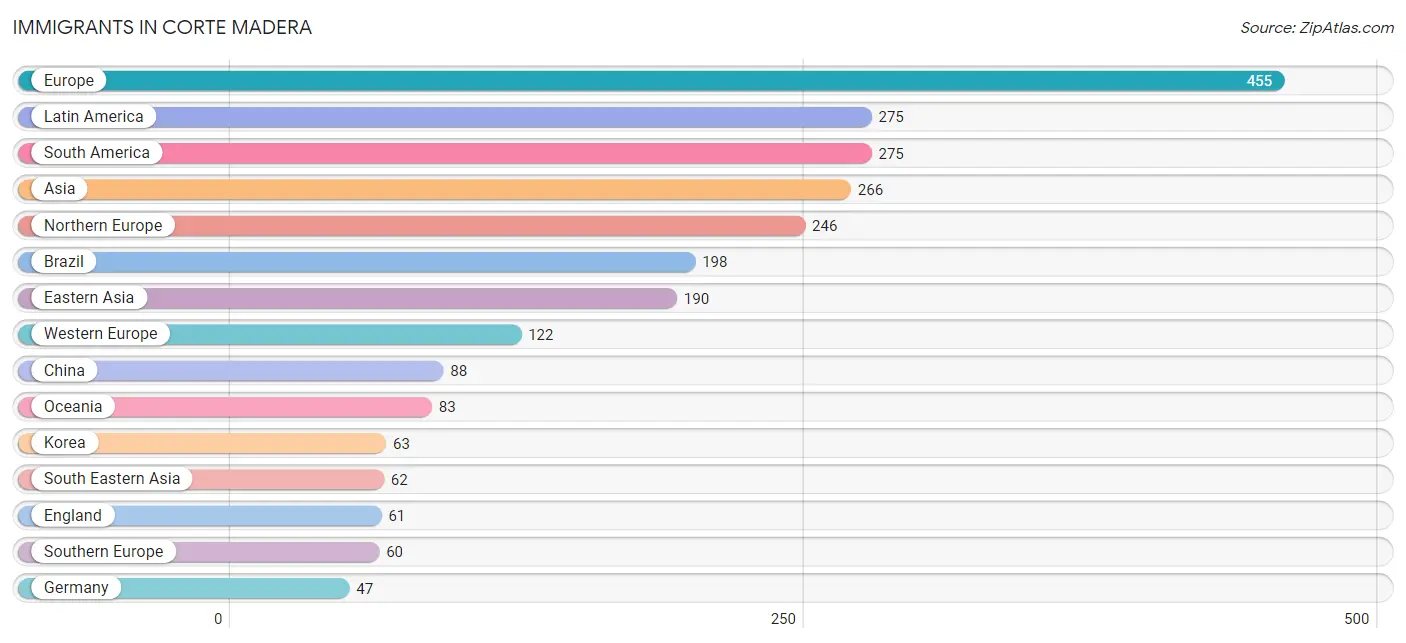
Immigrants in Corte Madera
The most numerous immigrant groups reported in Corte Madera came from Europe (455 | 4.5%), Latin America (275 | 2.7%), South America (275 | 2.7%), Asia (266 | 2.6%), and Northern Europe (246 | 2.4%), together accounting for 14.9% of all Corte Madera residents.
| Immigration Origin | # Population | % Population |
| Argentina | 16 | 0.2% |
| Armenia | 7 | 0.1% |
| Asia | 266 | 2.6% |
| Australia | 14 | 0.1% |
| Austria | 42 | 0.4% |
| Bolivia | 46 | 0.4% |
| Brazil | 198 | 1.9% |
| Canada | 44 | 0.4% |
| China | 88 | 0.9% |
| Colombia | 15 | 0.2% |
| Croatia | 17 | 0.2% |
| Eastern Asia | 190 | 1.9% |
| Eastern Europe | 27 | 0.3% |
| England | 61 | 0.6% |
| Europe | 455 | 4.5% |
| Fiji | 45 | 0.4% |
| Germany | 47 | 0.5% |
| Greece | 42 | 0.4% |
| Indonesia | 17 | 0.2% |
| Ireland | 17 | 0.2% |
| Italy | 18 | 0.2% |
| Japan | 39 | 0.4% |
| Korea | 63 | 0.6% |
| Latin America | 275 | 2.7% |
| Lebanon | 7 | 0.1% |
| Malaysia | 24 | 0.2% |
| Netherlands | 33 | 0.3% |
| Northern Europe | 246 | 2.4% |
| Norway | 17 | 0.2% |
| Oceania | 83 | 0.8% |
| Philippines | 6 | 0.1% |
| Russia | 10 | 0.1% |
| Singapore | 15 | 0.2% |
| South America | 275 | 2.7% |
| South Eastern Asia | 62 | 0.6% |
| Southern Europe | 60 | 0.6% |
| Western Asia | 14 | 0.1% |
| Western Europe | 122 | 1.2% | View All 38 Rows |
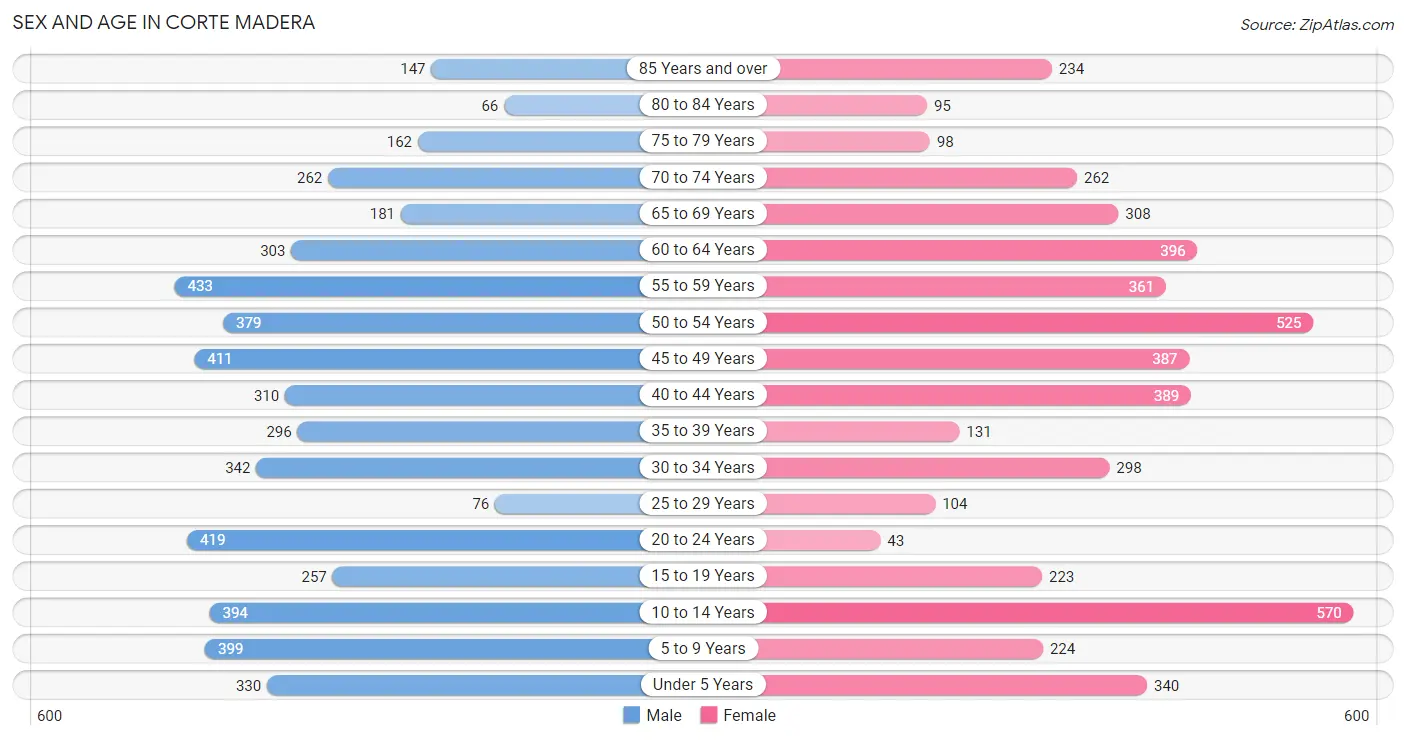
Sex and Age in Corte Madera
Sex and Age in Corte Madera
The most populous age groups in Corte Madera are 55 to 59 Years (433 | 8.4%) for men and 10 to 14 Years (570 | 11.4%) for women.
| Age Bracket | Male | Female |
| Under 5 Years | 330 (6.4%) | 340 (6.8%) |
| 5 to 9 Years | 399 (7.7%) | 224 (4.5%) |
| 10 to 14 Years | 394 (7.6%) | 570 (11.4%) |
| 15 to 19 Years | 257 (5.0%) | 223 (4.5%) |
| 20 to 24 Years | 419 (8.1%) | 43 (0.9%) |
| 25 to 29 Years | 76 (1.5%) | 104 (2.1%) |
| 30 to 34 Years | 342 (6.6%) | 298 (6.0%) |
| 35 to 39 Years | 296 (5.7%) | 131 (2.6%) |
| 40 to 44 Years | 310 (6.0%) | 389 (7.8%) |
| 45 to 49 Years | 411 (8.0%) | 387 (7.8%) |
| 50 to 54 Years | 379 (7.3%) | 525 (10.5%) |
| 55 to 59 Years | 433 (8.4%) | 361 (7.2%) |
| 60 to 64 Years | 303 (5.9%) | 396 (7.9%) |
| 65 to 69 Years | 181 (3.5%) | 308 (6.2%) |
| 70 to 74 Years | 262 (5.1%) | 262 (5.2%) |
| 75 to 79 Years | 162 (3.1%) | 98 (2.0%) |
| 80 to 84 Years | 66 (1.3%) | 95 (1.9%) |
| 85 Years and over | 147 (2.8%) | 234 (4.7%) |
| Total | 5,167 (100.0%) | 4,988 (100.0%) |
Families and Households in Corte Madera
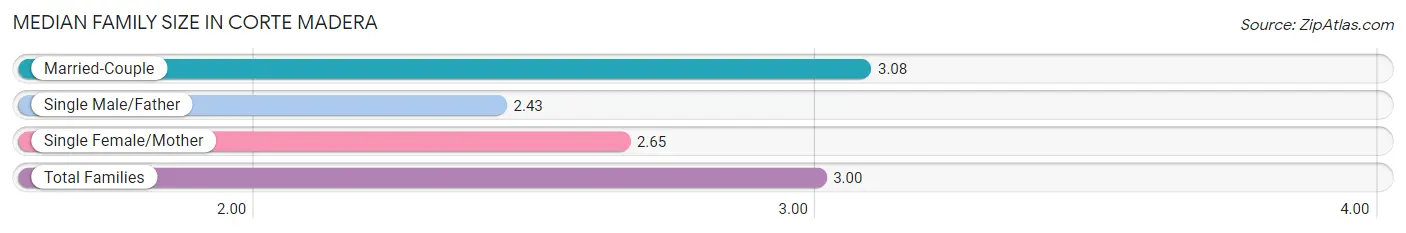
Median Family Size in Corte Madera
The median family size in Corte Madera is 3.00 persons per family, with married-couple families (2,418 | 82.6%) accounting for the largest median family size of 3.08 persons per family. On the other hand, single male/father families (107 | 3.7%) represent the smallest median family size with 2.43 persons per family.
| Family Type | # Families | Family Size |
| Married-Couple | 2,418 (82.6%) | 3.08 |
| Single Male/Father | 107 (3.7%) | 2.43 |
| Single Female/Mother | 401 (13.7%) | 2.65 |
| Total Families | 2,926 (100.0%) | 3.00 |
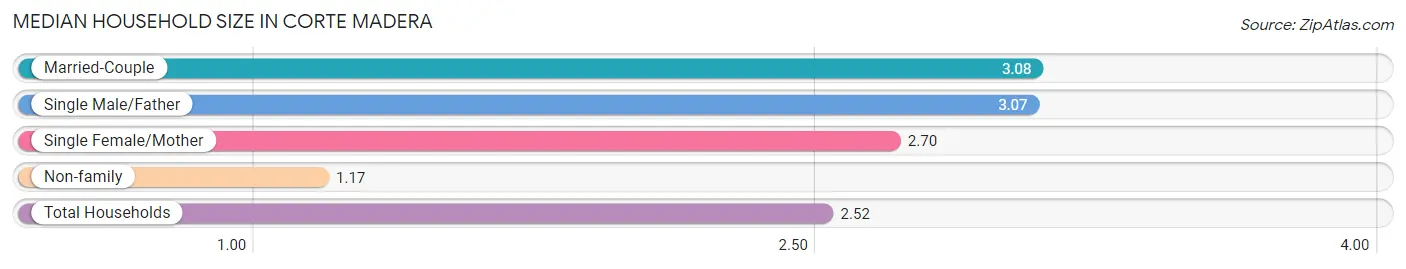
Median Household Size in Corte Madera
The median household size in Corte Madera is 2.52 persons per household, with married-couple households (2,418 | 60.1%) accounting for the largest median household size of 3.08 persons per household. non-family households (1,097 | 27.3%) represent the smallest median household size with 1.17 persons per household.
| Household Type | # Households | Household Size |
| Married-Couple | 2,418 (60.1%) | 3.08 |
| Single Male/Father | 107 (2.7%) | 3.07 |
| Single Female/Mother | 401 (10.0%) | 2.70 |
| Non-family | 1,097 (27.3%) | 1.17 |
| Total Households | 4,023 (100.0%) | 2.52 |
Household Size by Marriage Status in Corte Madera
Out of a total of 4,023 households in Corte Madera, 2,926 (72.7%) are family households, while 1,097 (27.3%) are nonfamily households. The most numerous type of family households are 2-person households, comprising 1,322, and the most common type of nonfamily households are 1-person households, comprising 906.
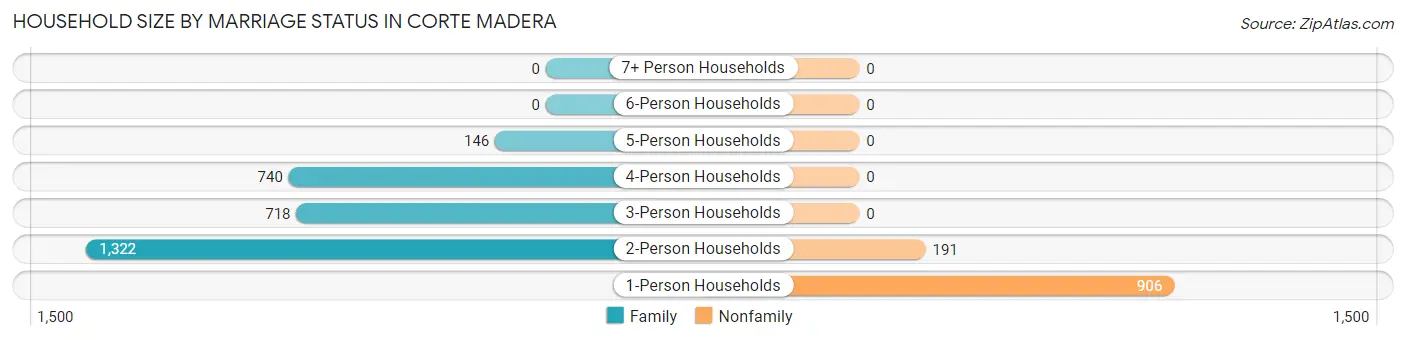
| Household Size | Family Households | Nonfamily Households |
| 1-Person Households | - | 906 (22.5%) |
| 2-Person Households | 1,322 (32.9%) | 191 (4.8%) |
| 3-Person Households | 718 (17.8%) | 0 (0.0%) |
| 4-Person Households | 740 (18.4%) | 0 (0.0%) |
| 5-Person Households | 146 (3.6%) | 0 (0.0%) |
| 6-Person Households | 0 (0.0%) | 0 (0.0%) |
| 7+ Person Households | 0 (0.0%) | 0 (0.0%) |
| Total | 2,926 (72.7%) | 1,097 (27.3%) |
Female Fertility in Corte Madera
Fertility by Age in Corte Madera
Average fertility rate in Corte Madera is 84.0 births per 1,000 women. Women in the age bracket of 20 to 34 years have the highest fertility rate with 279.0 births per 1,000 women. Women in the age bracket of 20 to 34 years acount for 89.2% of all women with births.
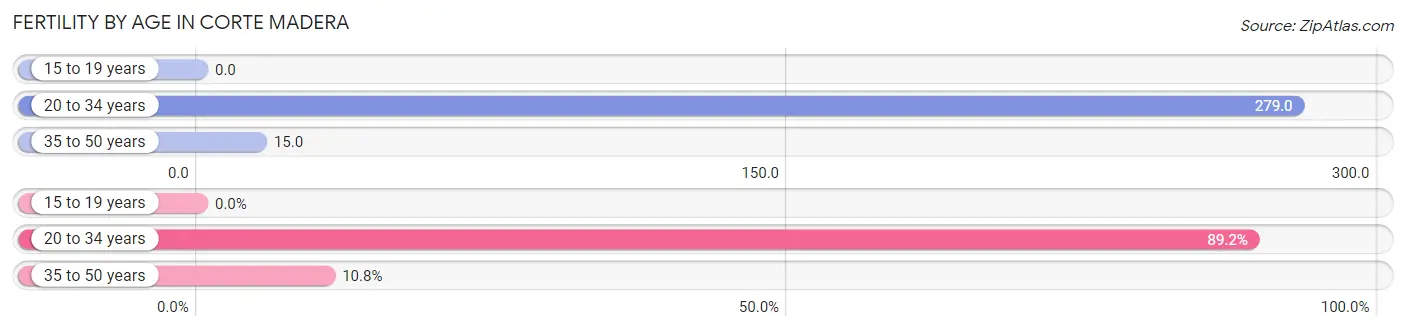
| Age Bracket | Women with Births | Births / 1,000 Women |
| 15 to 19 years | 0 (0.0%) | 0.0 |
| 20 to 34 years | 124 (89.2%) | 279.0 |
| 35 to 50 years | 15 (10.8%) | 15.0 |
| Total | 139 (100.0%) | 84.0 |
Fertility by Age by Marriage Status in Corte Madera
79.9% of women with births (139) in Corte Madera are married. The highest percentage of unmarried women with births falls into 35 to 50 years age bracket with 100.0% of them unmarried at the time of birth, while the lowest percentage of unmarried women with births belong to 20 to 34 years age bracket with 10.5% of them unmarried.
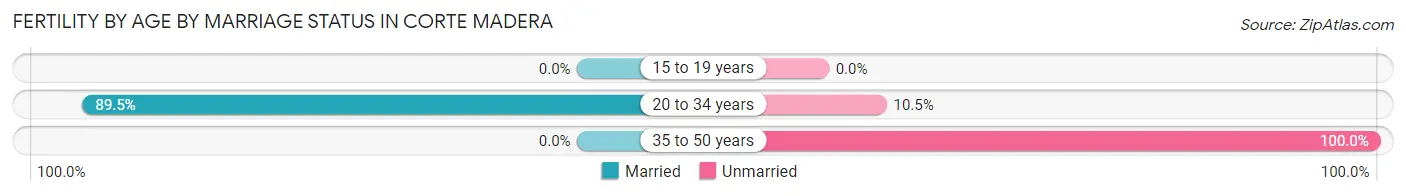
| Age Bracket | Married | Unmarried |
| 15 to 19 years | 0 (0.0%) | 0 (0.0%) |
| 20 to 34 years | 111 (89.5%) | 13 (10.5%) |
| 35 to 50 years | 0 (0.0%) | 15 (100.0%) |
| Total | 111 (79.9%) | 28 (20.1%) |
Fertility by Education in Corte Madera
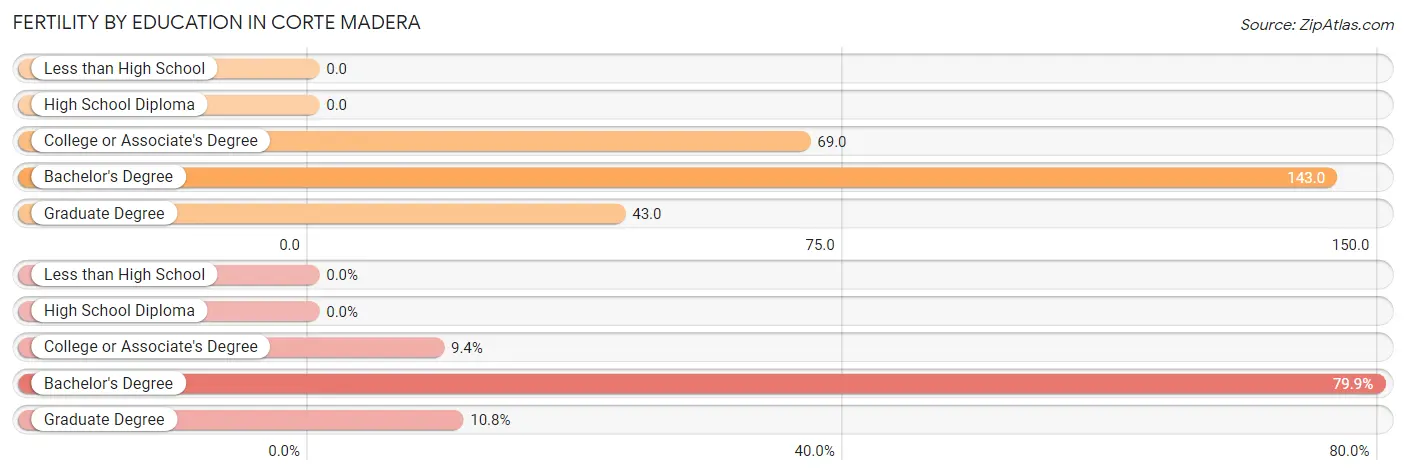
| Educational Attainment | Women with Births | Births / 1,000 Women |
| Less than High School | 0 (0.0%) | 0.0 |
| High School Diploma | 0 (0.0%) | 0.0 |
| College or Associate's Degree | 13 (9.3%) | 69.0 |
| Bachelor's Degree | 111 (79.9%) | 143.0 |
| Graduate Degree | 15 (10.8%) | 43.0 |
| Total | 139 (100.0%) | 84.0 |
Fertility by Education by Marriage Status in Corte Madera
20.1% of women with births in Corte Madera are unmarried. Women with the educational attainment of bachelor's degree are most likely to be married with 100.0% of them married at childbirth, while women with the educational attainment of college or associate's degree are least likely to be married with 100.0% of them unmarried at childbirth.
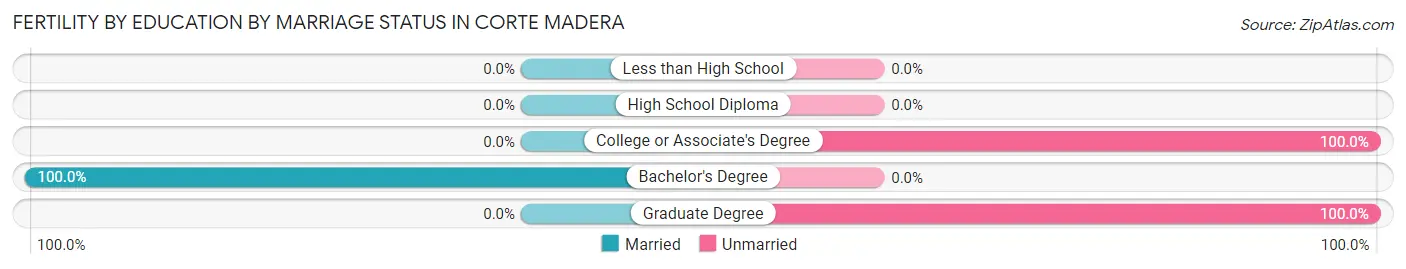
| Educational Attainment | Married | Unmarried |
| Less than High School | 0 (0.0%) | 0 (0.0%) |
| High School Diploma | 0 (0.0%) | 0 (0.0%) |
| College or Associate's Degree | 0 (0.0%) | 13 (100.0%) |
| Bachelor's Degree | 111 (100.0%) | 0 (0.0%) |
| Graduate Degree | 0 (0.0%) | 15 (100.0%) |
| Total | 111 (79.9%) | 28 (20.1%) |
Employment Characteristics in Corte Madera
Employment by Class of Employer in Corte Madera
Among the 4,700 employed individuals in Corte Madera, private company employees (2,856 | 60.8%), self-employed (incorporated) (520 | 11.1%), and self-employed (not incorporated) (471 | 10.0%) make up the most common classes of employment.
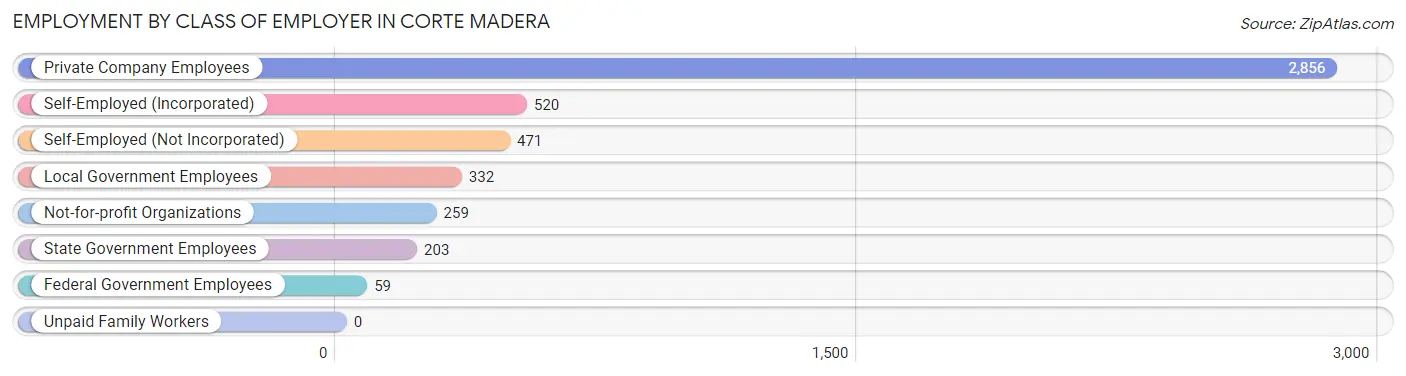
| Employer Class | # Employees | % Employees |
| Private Company Employees | 2,856 | 60.8% |
| Self-Employed (Incorporated) | 520 | 11.1% |
| Self-Employed (Not Incorporated) | 471 | 10.0% |
| Not-for-profit Organizations | 259 | 5.5% |
| Local Government Employees | 332 | 7.1% |
| State Government Employees | 203 | 4.3% |
| Federal Government Employees | 59 | 1.3% |
| Unpaid Family Workers | 0 | 0.0% |
| Total | 4,700 | 100.0% |
Employment Status by Age in Corte Madera
According to the labor force statistics for Corte Madera, out of the total population over 16 years of age (7,815), 66.3% or 5,181 individuals are in the labor force, with 5.2% or 269 of them unemployed. The age group with the highest labor force participation rate is 25 to 29 years, with 100.0% or 180 individuals in the labor force. Within the labor force, the 75 years and over age range has the highest percentage of unemployed individuals, with 31.3% or 26 of them being unemployed.
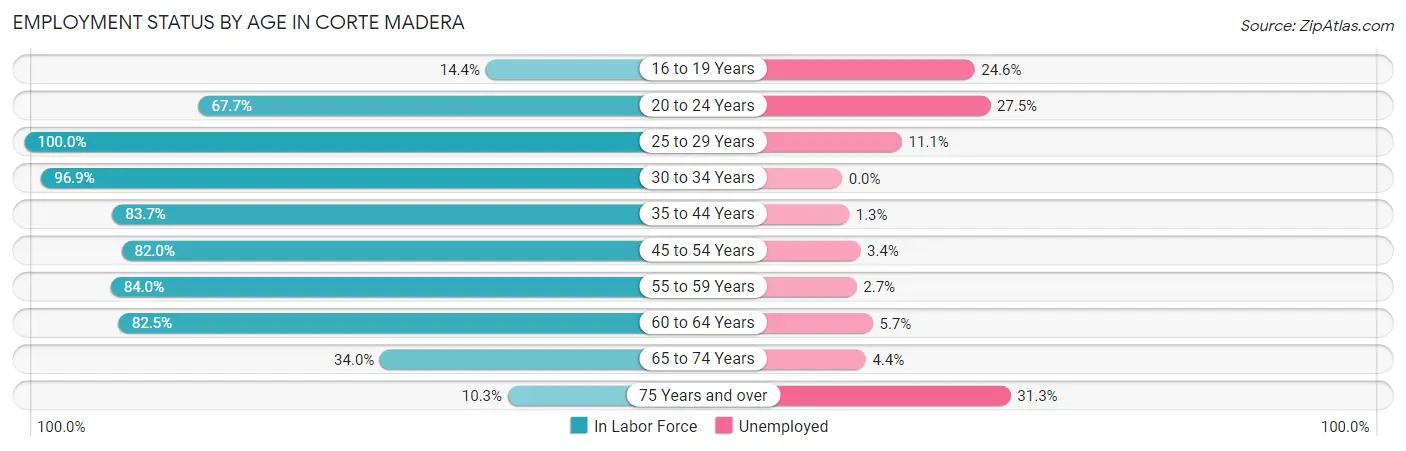
| Age Bracket | In Labor Force | Unemployed |
| 16 to 19 Years | 57 (14.4%) | 14 (24.6%) |
| 20 to 24 Years | 313 (67.7%) | 86 (27.5%) |
| 25 to 29 Years | 180 (100.0%) | 20 (11.1%) |
| 30 to 34 Years | 620 (96.9%) | 0 (0.0%) |
| 35 to 44 Years | 942 (83.7%) | 12 (1.3%) |
| 45 to 54 Years | 1,396 (82.0%) | 47 (3.4%) |
| 55 to 59 Years | 667 (84.0%) | 18 (2.7%) |
| 60 to 64 Years | 577 (82.5%) | 33 (5.7%) |
| 65 to 74 Years | 344 (34.0%) | 15 (4.4%) |
| 75 Years and over | 83 (10.3%) | 26 (31.3%) |
| Total | 5,181 (66.3%) | 269 (5.2%) |
Employment Status by Educational Attainment in Corte Madera
According to labor force statistics for Corte Madera, 85.3% of individuals (4,385) out of the total population between 25 and 64 years of age (5,141) are in the labor force, with 3.0% or 132 of them being unemployed. The group with the highest labor force participation rate are those with the educational attainment of bachelor's degree or higher, with 90.5% or 3,632 individuals in the labor force. Within the labor force, individuals with college / associate degree education have the highest percentage of unemployment, with 5.8% or 32 of them being unemployed.
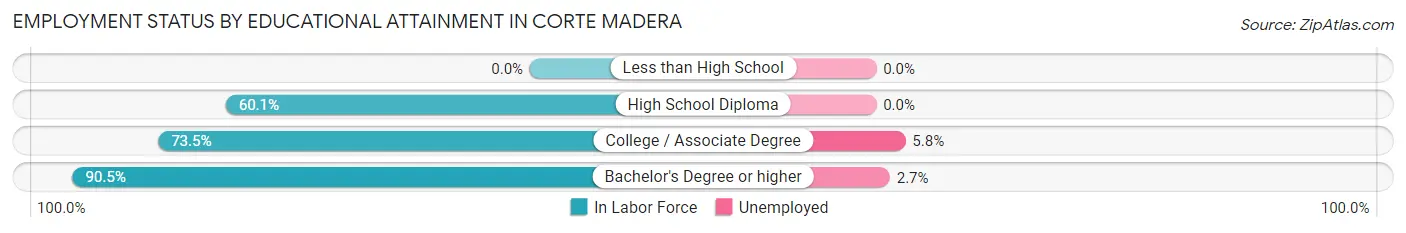
| Educational Attainment | In Labor Force | Unemployed |
| Less than High School | 0 (0.0%) | 0 (0.0%) |
| High School Diploma | 199 (60.1%) | 0 (0.0%) |
| College / Associate Degree | 553 (73.5%) | 44 (5.8%) |
| Bachelor's Degree or higher | 3,632 (90.5%) | 108 (2.7%) |
| Total | 4,385 (85.3%) | 154 (3.0%) |
Employment Occupations by Sex in Corte Madera
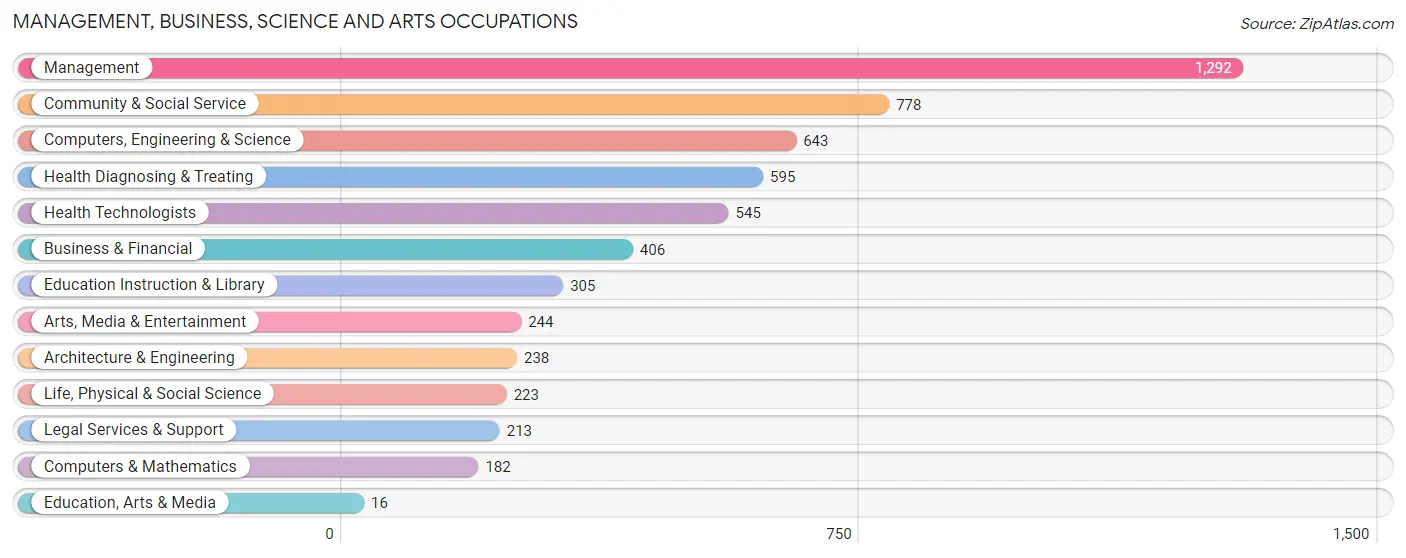
Management, Business, Science and Arts Occupations
The most common Management, Business, Science and Arts occupations in Corte Madera are Management (1,292 | 26.3%), Community & Social Service (778 | 15.9%), Computers, Engineering & Science (643 | 13.1%), Health Diagnosing & Treating (595 | 12.1%), and Health Technologists (545 | 11.1%).
Management, Business, Science and Arts Occupations by Sex
Within the Management, Business, Science and Arts occupations in Corte Madera, the most male-oriented occupations are Architecture & Engineering (100.0%), Computers & Mathematics (90.1%), and Arts, Media & Entertainment (79.9%), while the most female-oriented occupations are Education, Arts & Media (100.0%), Health Technologists (69.4%), and Health Diagnosing & Treating (63.5%).
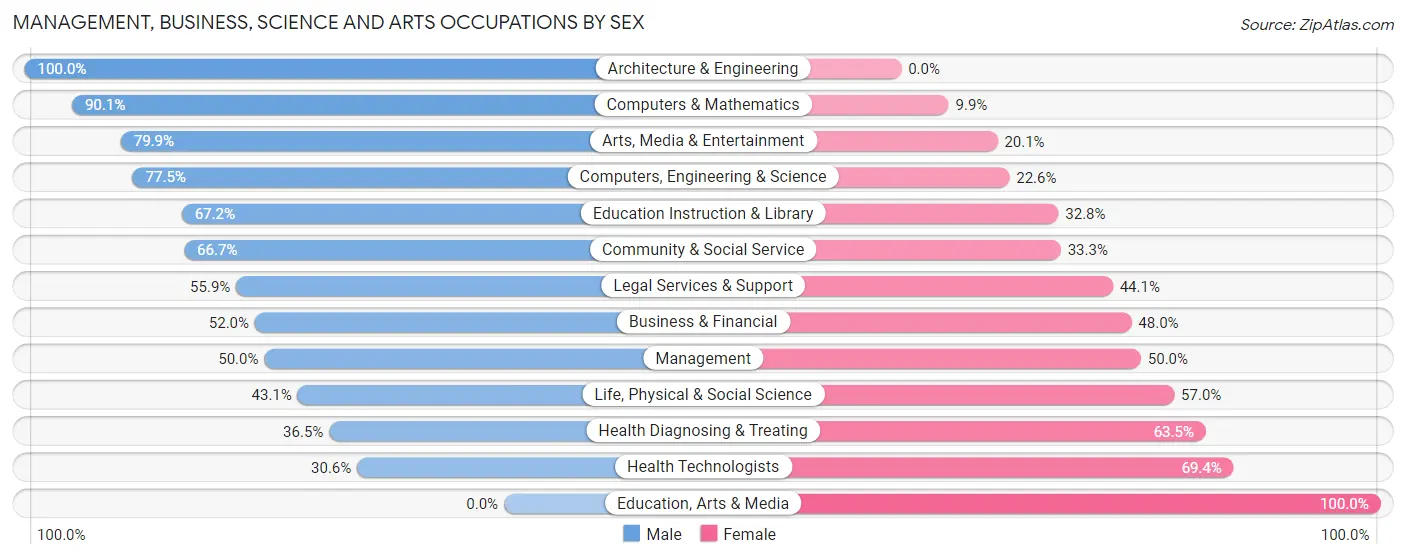
| Occupation | Male | Female |
| Management | 646 (50.0%) | 646 (50.0%) |
| Business & Financial | 211 (52.0%) | 195 (48.0%) |
| Computers, Engineering & Science | 498 (77.4%) | 145 (22.6%) |
| Computers & Mathematics | 164 (90.1%) | 18 (9.9%) |
| Architecture & Engineering | 238 (100.0%) | 0 (0.0%) |
| Life, Physical & Social Science | 96 (43.0%) | 127 (57.0%) |
| Community & Social Service | 519 (66.7%) | 259 (33.3%) |
| Education, Arts & Media | 0 (0.0%) | 16 (100.0%) |
| Legal Services & Support | 119 (55.9%) | 94 (44.1%) |
| Education Instruction & Library | 205 (67.2%) | 100 (32.8%) |
| Arts, Media & Entertainment | 195 (79.9%) | 49 (20.1%) |
| Health Diagnosing & Treating | 217 (36.5%) | 378 (63.5%) |
| Health Technologists | 167 (30.6%) | 378 (69.4%) |
| Total (Category) | 2,091 (56.3%) | 1,623 (43.7%) |
| Total (Overall) | 2,785 (56.7%) | 2,124 (43.3%) |
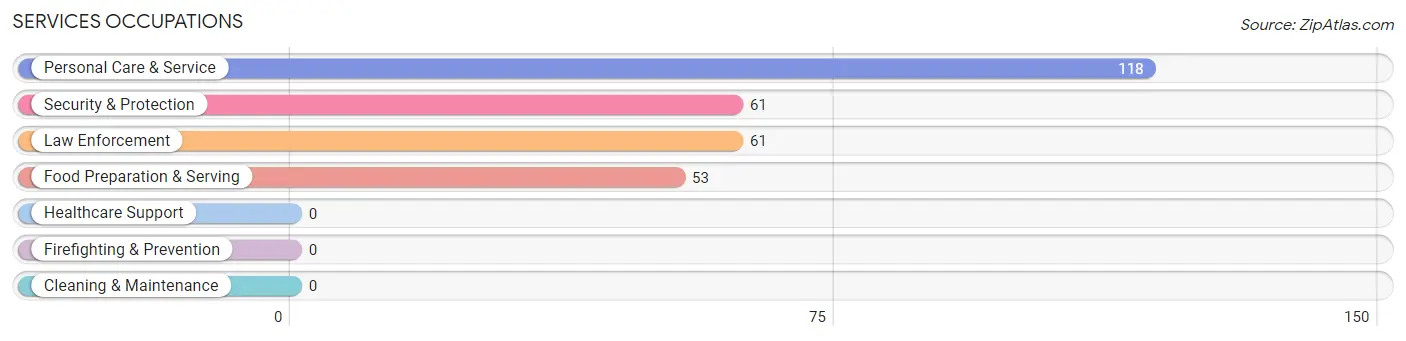
Services Occupations
The most common Services occupations in Corte Madera are Personal Care & Service (118 | 2.4%), Security & Protection (61 | 1.2%), Law Enforcement (61 | 1.2%), and Food Preparation & Serving (53 | 1.1%).
Services Occupations by Sex
Within the Services occupations in Corte Madera, the most male-oriented occupations are Security & Protection (100.0%), Law Enforcement (100.0%), and Personal Care & Service (28.0%), while the most female-oriented occupations are Food Preparation & Serving (83.0%), and Personal Care & Service (72.0%).
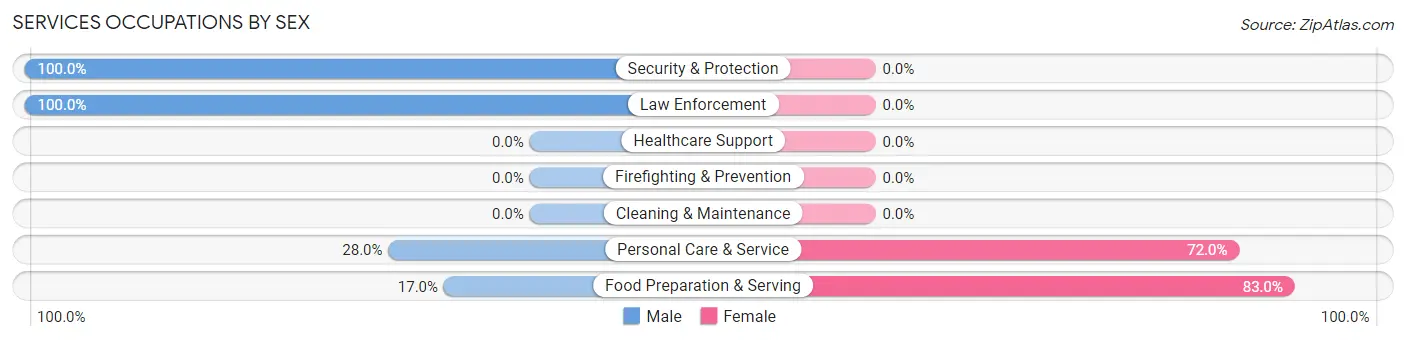
| Occupation | Male | Female |
| Healthcare Support | 0 (0.0%) | 0 (0.0%) |
| Security & Protection | 61 (100.0%) | 0 (0.0%) |
| Firefighting & Prevention | 0 (0.0%) | 0 (0.0%) |
| Law Enforcement | 61 (100.0%) | 0 (0.0%) |
| Food Preparation & Serving | 9 (17.0%) | 44 (83.0%) |
| Cleaning & Maintenance | 0 (0.0%) | 0 (0.0%) |
| Personal Care & Service | 33 (28.0%) | 85 (72.0%) |
| Total (Category) | 103 (44.4%) | 129 (55.6%) |
| Total (Overall) | 2,785 (56.7%) | 2,124 (43.3%) |
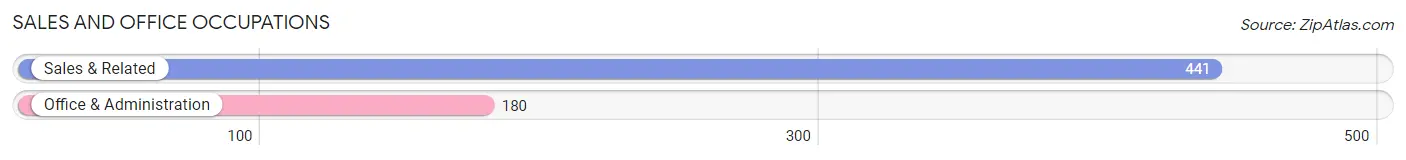
Sales and Office Occupations
The most common Sales and Office occupations in Corte Madera are Sales & Related (441 | 9.0%), and Office & Administration (180 | 3.7%).
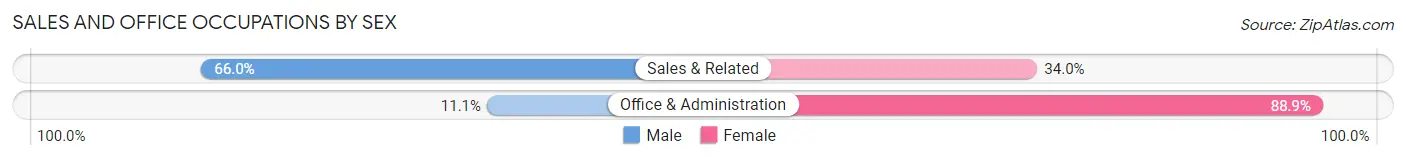
Sales and Office Occupations by Sex
| Occupation | Male | Female |
| Sales & Related | 291 (66.0%) | 150 (34.0%) |
| Office & Administration | 20 (11.1%) | 160 (88.9%) |
| Total (Category) | 311 (50.1%) | 310 (49.9%) |
| Total (Overall) | 2,785 (56.7%) | 2,124 (43.3%) |
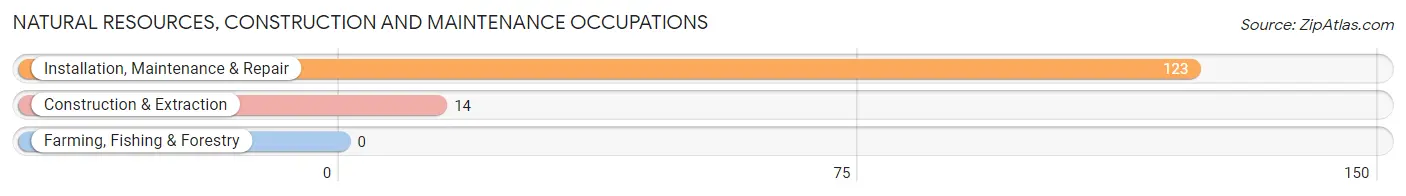
Natural Resources, Construction and Maintenance Occupations
The most common Natural Resources, Construction and Maintenance occupations in Corte Madera are Installation, Maintenance & Repair (123 | 2.5%), and Construction & Extraction (14 | 0.3%).
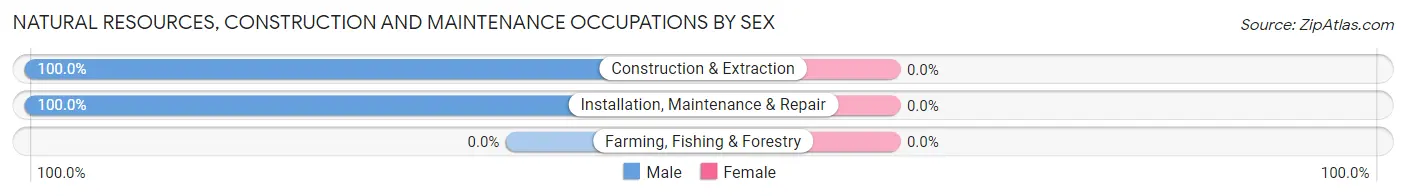
Natural Resources, Construction and Maintenance Occupations by Sex
| Occupation | Male | Female |
| Farming, Fishing & Forestry | 0 (0.0%) | 0 (0.0%) |
| Construction & Extraction | 14 (100.0%) | 0 (0.0%) |
| Installation, Maintenance & Repair | 123 (100.0%) | 0 (0.0%) |
| Total (Category) | 137 (100.0%) | 0 (0.0%) |
| Total (Overall) | 2,785 (56.7%) | 2,124 (43.3%) |
Production, Transportation and Moving Occupations
The most common Production, Transportation and Moving occupations in Corte Madera are Transportation (109 | 2.2%), Production (67 | 1.4%), and Material Moving (29 | 0.6%).
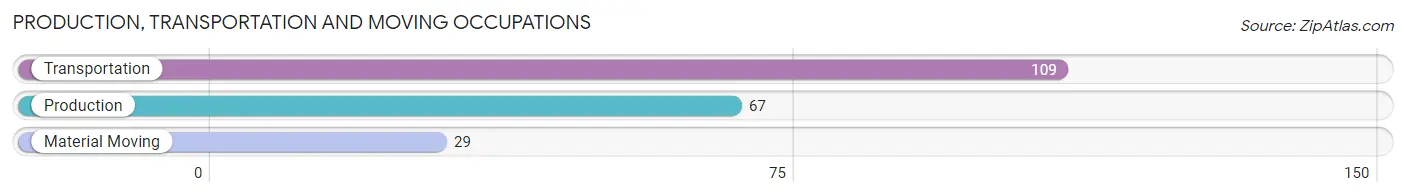
Production, Transportation and Moving Occupations by Sex
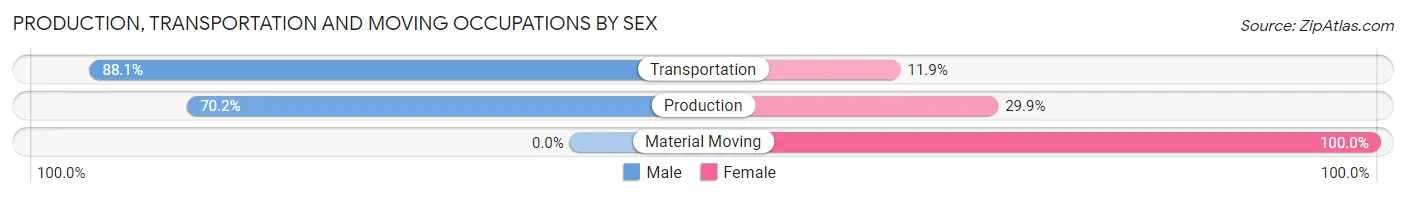
| Occupation | Male | Female |
| Production | 47 (70.2%) | 20 (29.8%) |
| Transportation | 96 (88.1%) | 13 (11.9%) |
| Material Moving | 0 (0.0%) | 29 (100.0%) |
| Total (Category) | 143 (69.8%) | 62 (30.2%) |
| Total (Overall) | 2,785 (56.7%) | 2,124 (43.3%) |
Employment Industries by Sex in Corte Madera
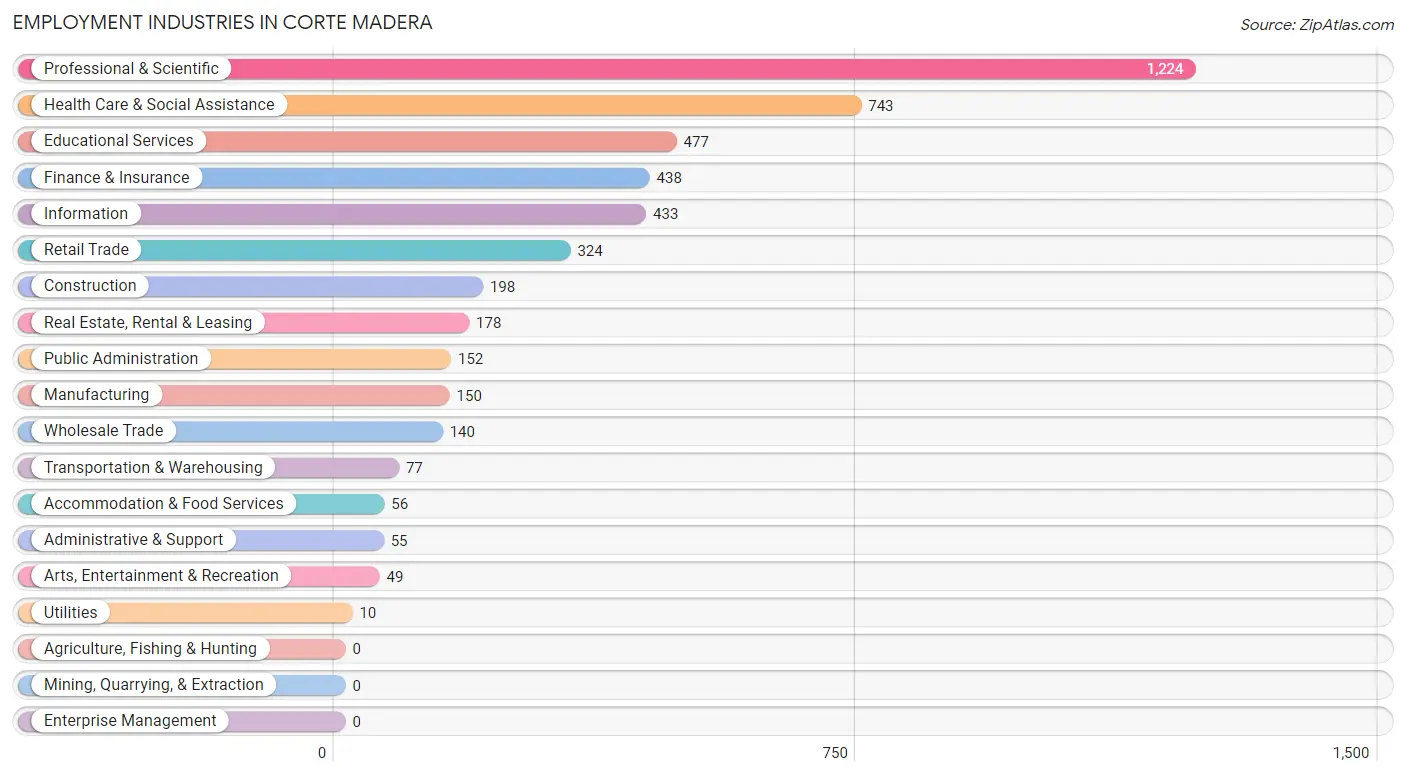
Employment Industries in Corte Madera
The major employment industries in Corte Madera include Professional & Scientific (1,224 | 24.9%), Health Care & Social Assistance (743 | 15.1%), Educational Services (477 | 9.7%), Finance & Insurance (438 | 8.9%), and Information (433 | 8.8%).
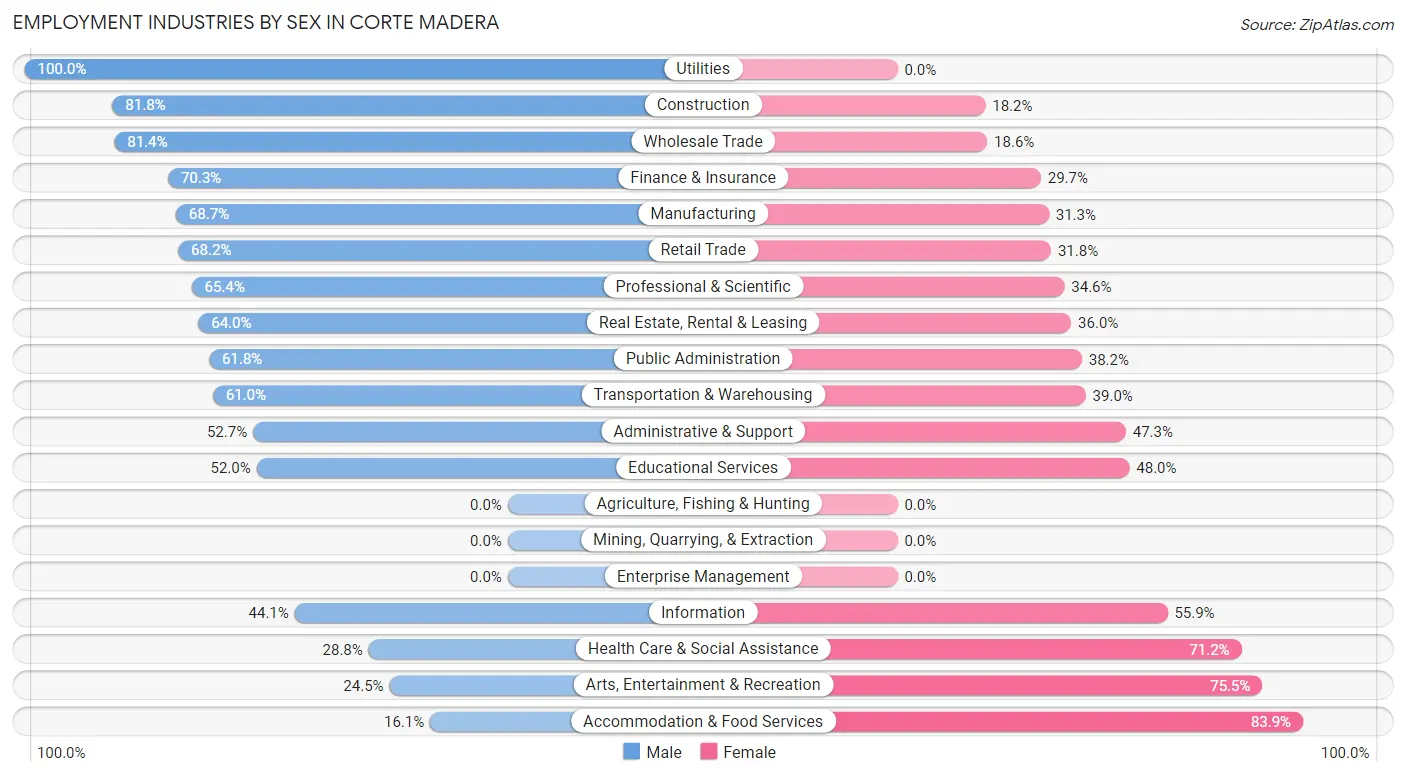
Employment Industries by Sex in Corte Madera
The Corte Madera industries that see more men than women are Utilities (100.0%), Construction (81.8%), and Wholesale Trade (81.4%), whereas the industries that tend to have a higher number of women are Accommodation & Food Services (83.9%), Arts, Entertainment & Recreation (75.5%), and Health Care & Social Assistance (71.2%).
| Industry | Male | Female |
| Agriculture, Fishing & Hunting | 0 (0.0%) | 0 (0.0%) |
| Mining, Quarrying, & Extraction | 0 (0.0%) | 0 (0.0%) |
| Construction | 162 (81.8%) | 36 (18.2%) |
| Manufacturing | 103 (68.7%) | 47 (31.3%) |
| Wholesale Trade | 114 (81.4%) | 26 (18.6%) |
| Retail Trade | 221 (68.2%) | 103 (31.8%) |
| Transportation & Warehousing | 47 (61.0%) | 30 (39.0%) |
| Utilities | 10 (100.0%) | 0 (0.0%) |
| Information | 191 (44.1%) | 242 (55.9%) |
| Finance & Insurance | 308 (70.3%) | 130 (29.7%) |
| Real Estate, Rental & Leasing | 114 (64.0%) | 64 (36.0%) |
| Professional & Scientific | 801 (65.4%) | 423 (34.6%) |
| Enterprise Management | 0 (0.0%) | 0 (0.0%) |
| Administrative & Support | 29 (52.7%) | 26 (47.3%) |
| Educational Services | 248 (52.0%) | 229 (48.0%) |
| Health Care & Social Assistance | 214 (28.8%) | 529 (71.2%) |
| Arts, Entertainment & Recreation | 12 (24.5%) | 37 (75.5%) |
| Accommodation & Food Services | 9 (16.1%) | 47 (83.9%) |
| Public Administration | 94 (61.8%) | 58 (38.2%) |
| Total | 2,785 (56.7%) | 2,124 (43.3%) |
Education in Corte Madera
School Enrollment in Corte Madera
The most common levels of schooling among the 2,784 students in Corte Madera are middle school (731 | 26.3%), high school (531 | 19.1%), and college / undergraduate (438 | 15.7%).
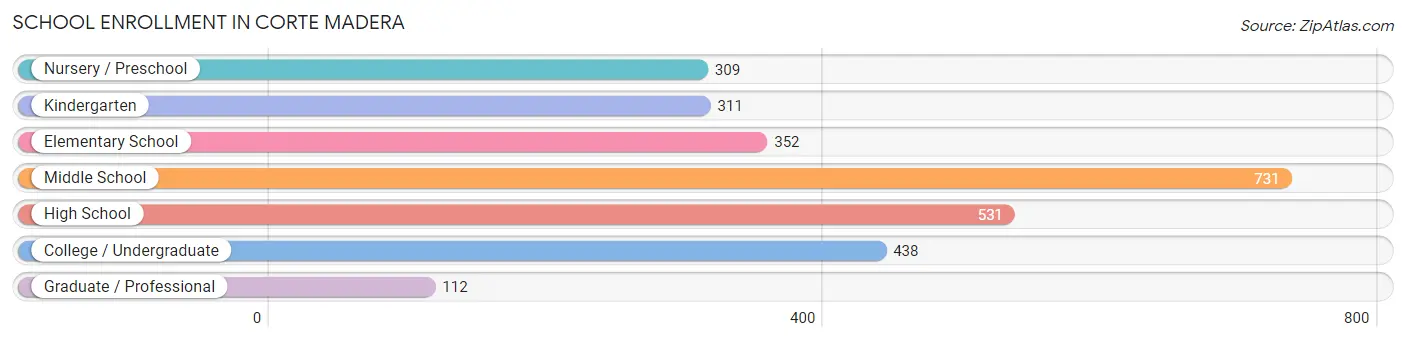
| School Level | # Students | % Students |
| Nursery / Preschool | 309 | 11.1% |
| Kindergarten | 311 | 11.2% |
| Elementary School | 352 | 12.6% |
| Middle School | 731 | 26.3% |
| High School | 531 | 19.1% |
| College / Undergraduate | 438 | 15.7% |
| Graduate / Professional | 112 | 4.0% |
| Total | 2,784 | 100.0% |
School Enrollment by Age by Funding Source in Corte Madera
Out of a total of 2,784 students who are enrolled in schools in Corte Madera, 807 (29.0%) attend a private institution, while the remaining 1,977 (71.0%) are enrolled in public schools. The age group of 3 to 4 year olds has the highest likelihood of being enrolled in private schools, with 189 (71.6% in the age bracket) enrolled. Conversely, the age group of 35 years and over has the lowest likelihood of being enrolled in a private school, with 96 (100.0% in the age bracket) attending a public institution.
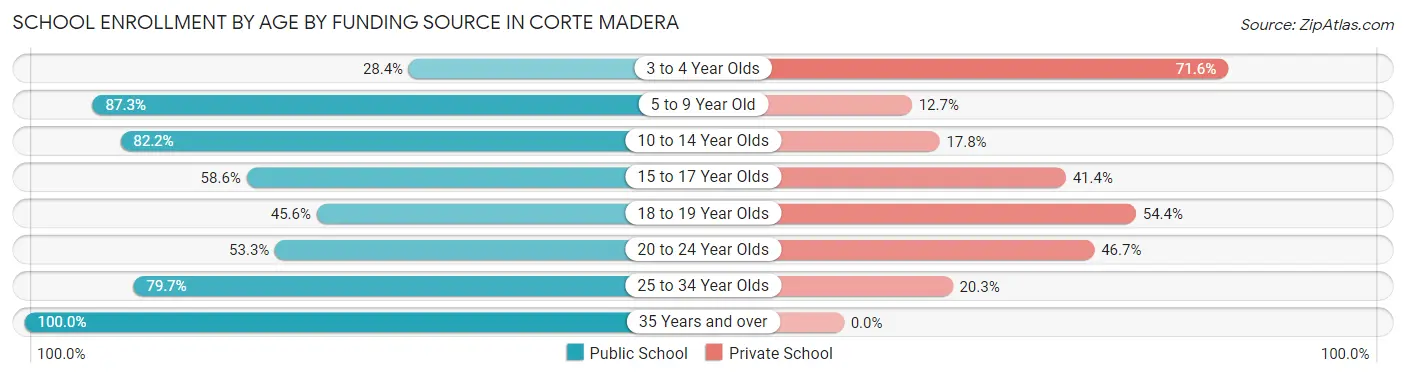
| Age Bracket | Public School | Private School |
| 3 to 4 Year Olds | 75 (28.4%) | 189 (71.6%) |
| 5 to 9 Year Old | 537 (87.3%) | 78 (12.7%) |
| 10 to 14 Year Olds | 792 (82.2%) | 172 (17.8%) |
| 15 to 17 Year Olds | 190 (58.6%) | 134 (41.4%) |
| 18 to 19 Year Olds | 67 (45.6%) | 80 (54.4%) |
| 20 to 24 Year Olds | 160 (53.3%) | 140 (46.7%) |
| 25 to 34 Year Olds | 59 (79.7%) | 15 (20.3%) |
| 35 Years and over | 96 (100.0%) | 0 (0.0%) |
| Total | 1,977 (71.0%) | 807 (29.0%) |
Educational Attainment by Field of Study in Corte Madera
Social sciences (1,064 | 17.4%), business (806 | 13.2%), bio, nature & agricultural (527 | 8.6%), literature & languages (500 | 8.2%), and communications (492 | 8.0%) are the most common fields of study among 6,127 individuals in Corte Madera who have obtained a bachelor's degree or higher.
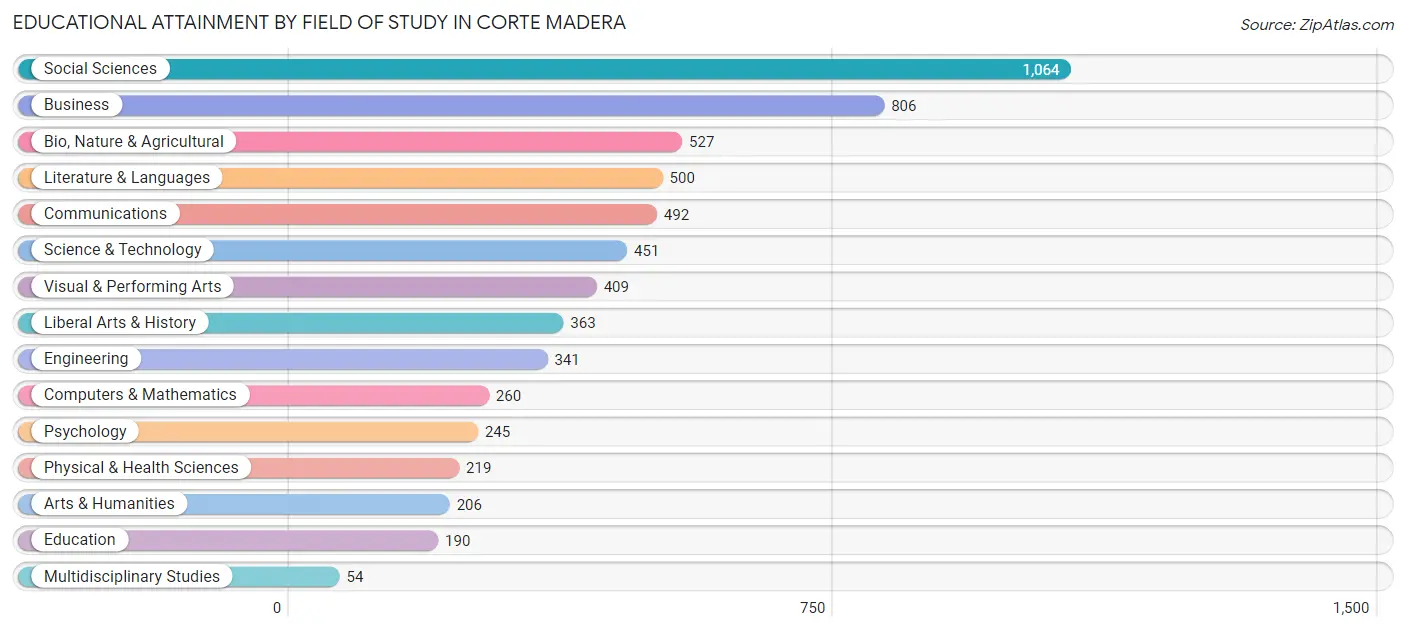
| Field of Study | # Graduates | % Graduates |
| Computers & Mathematics | 260 | 4.2% |
| Bio, Nature & Agricultural | 527 | 8.6% |
| Physical & Health Sciences | 219 | 3.6% |
| Psychology | 245 | 4.0% |
| Social Sciences | 1,064 | 17.4% |
| Engineering | 341 | 5.6% |
| Multidisciplinary Studies | 54 | 0.9% |
| Science & Technology | 451 | 7.4% |
| Business | 806 | 13.2% |
| Education | 190 | 3.1% |
| Literature & Languages | 500 | 8.2% |
| Liberal Arts & History | 363 | 5.9% |
| Visual & Performing Arts | 409 | 6.7% |
| Communications | 492 | 8.0% |
| Arts & Humanities | 206 | 3.4% |
| Total | 6,127 | 100.0% |
Transportation & Commute in Corte Madera
Vehicle Availability by Sex in Corte Madera
The most prevalent vehicle ownership categories in Corte Madera are males with 2 vehicles (1,298, accounting for 47.7%) and females with 2 vehicles (1,011, making up 65.7%).
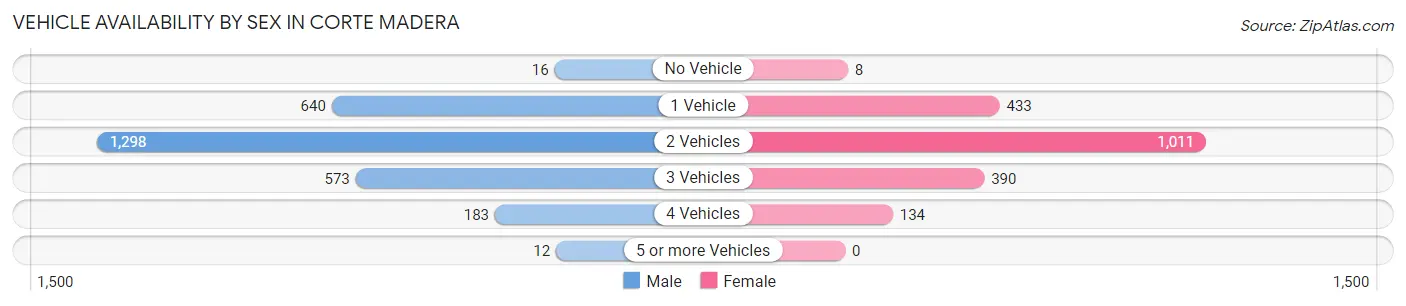
| Vehicles Available | Male | Female |
| No Vehicle | 16 (0.6%) | 8 (0.4%) |
| 1 Vehicle | 640 (23.5%) | 433 (21.9%) |
| 2 Vehicles | 1,298 (47.7%) | 1,011 (51.2%) |
| 3 Vehicles | 573 (21.0%) | 390 (19.7%) |
| 4 Vehicles | 183 (6.7%) | 134 (6.8%) |
| 5 or more Vehicles | 12 (0.4%) | 0 (0.0%) |
| Total | 2,722 (100.0%) | 1,976 (100.0%) |
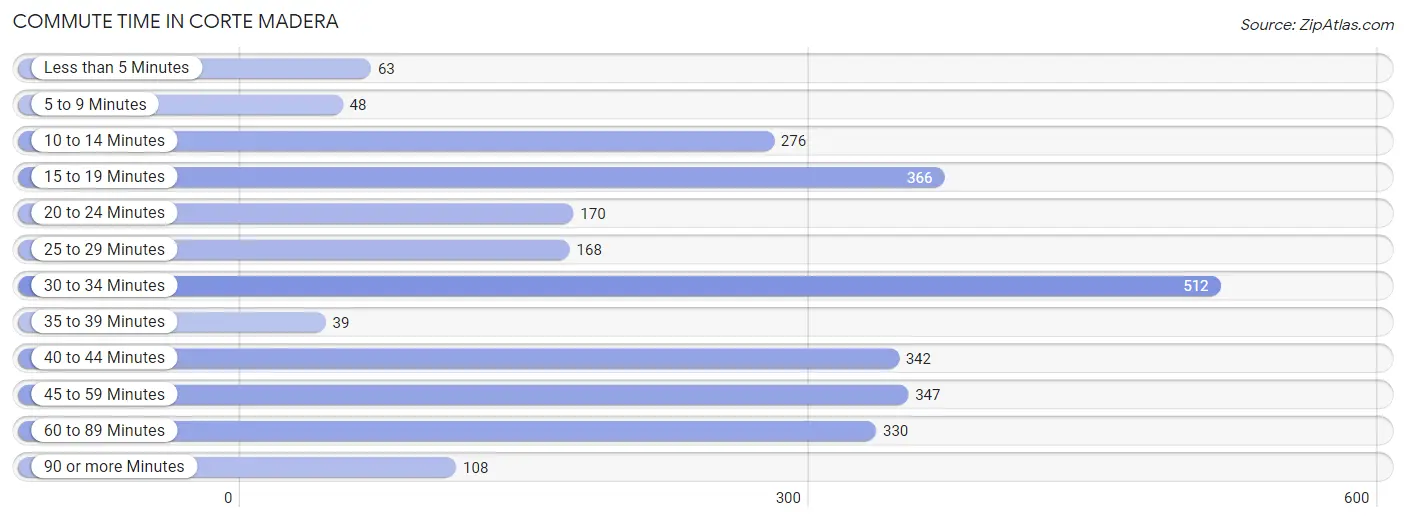
Commute Time in Corte Madera
The most frequently occuring commute durations in Corte Madera are 30 to 34 minutes (512 commuters, 18.5%), 15 to 19 minutes (366 commuters, 13.2%), and 45 to 59 minutes (347 commuters, 12.5%).
| Commute Time | # Commuters | % Commuters |
| Less than 5 Minutes | 63 | 2.3% |
| 5 to 9 Minutes | 48 | 1.7% |
| 10 to 14 Minutes | 276 | 10.0% |
| 15 to 19 Minutes | 366 | 13.2% |
| 20 to 24 Minutes | 170 | 6.1% |
| 25 to 29 Minutes | 168 | 6.1% |
| 30 to 34 Minutes | 512 | 18.5% |
| 35 to 39 Minutes | 39 | 1.4% |
| 40 to 44 Minutes | 342 | 12.3% |
| 45 to 59 Minutes | 347 | 12.5% |
| 60 to 89 Minutes | 330 | 11.9% |
| 90 or more Minutes | 108 | 3.9% |
Commute Time by Sex in Corte Madera
The most common commute times in Corte Madera are 30 to 34 minutes (310 commuters, 19.6%) for males and 15 to 19 minutes (244 commuters, 20.6%) for females.
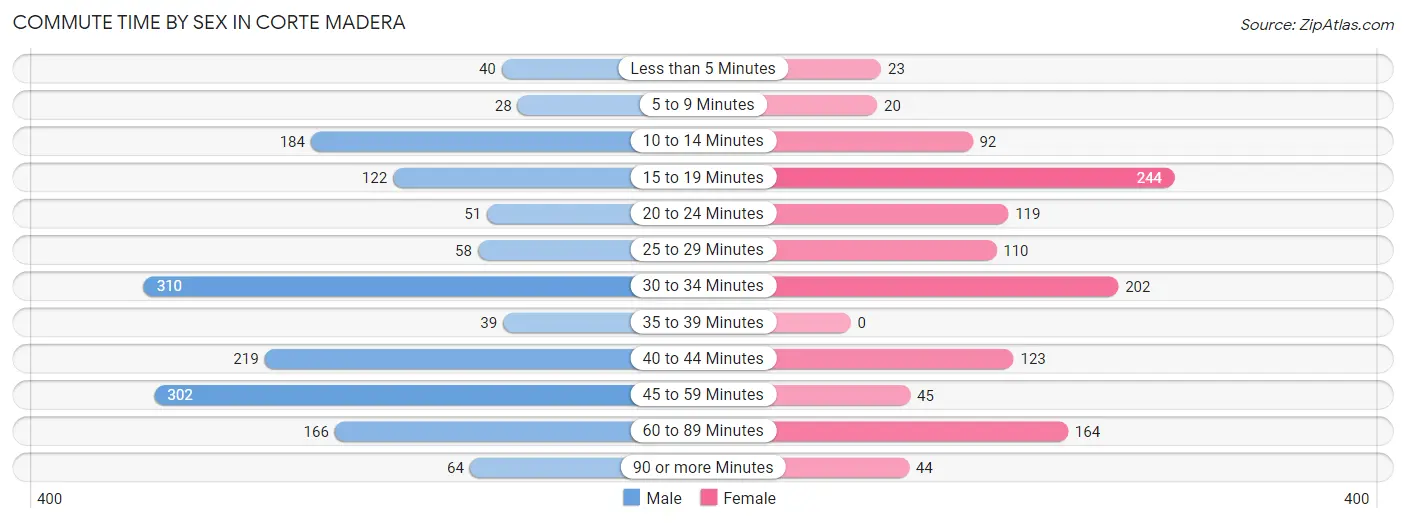
| Commute Time | Male | Female |
| Less than 5 Minutes | 40 (2.5%) | 23 (1.9%) |
| 5 to 9 Minutes | 28 (1.8%) | 20 (1.7%) |
| 10 to 14 Minutes | 184 (11.6%) | 92 (7.8%) |
| 15 to 19 Minutes | 122 (7.7%) | 244 (20.6%) |
| 20 to 24 Minutes | 51 (3.2%) | 119 (10.0%) |
| 25 to 29 Minutes | 58 (3.7%) | 110 (9.3%) |
| 30 to 34 Minutes | 310 (19.6%) | 202 (17.0%) |
| 35 to 39 Minutes | 39 (2.5%) | 0 (0.0%) |
| 40 to 44 Minutes | 219 (13.8%) | 123 (10.4%) |
| 45 to 59 Minutes | 302 (19.1%) | 45 (3.8%) |
| 60 to 89 Minutes | 166 (10.5%) | 164 (13.8%) |
| 90 or more Minutes | 64 (4.0%) | 44 (3.7%) |
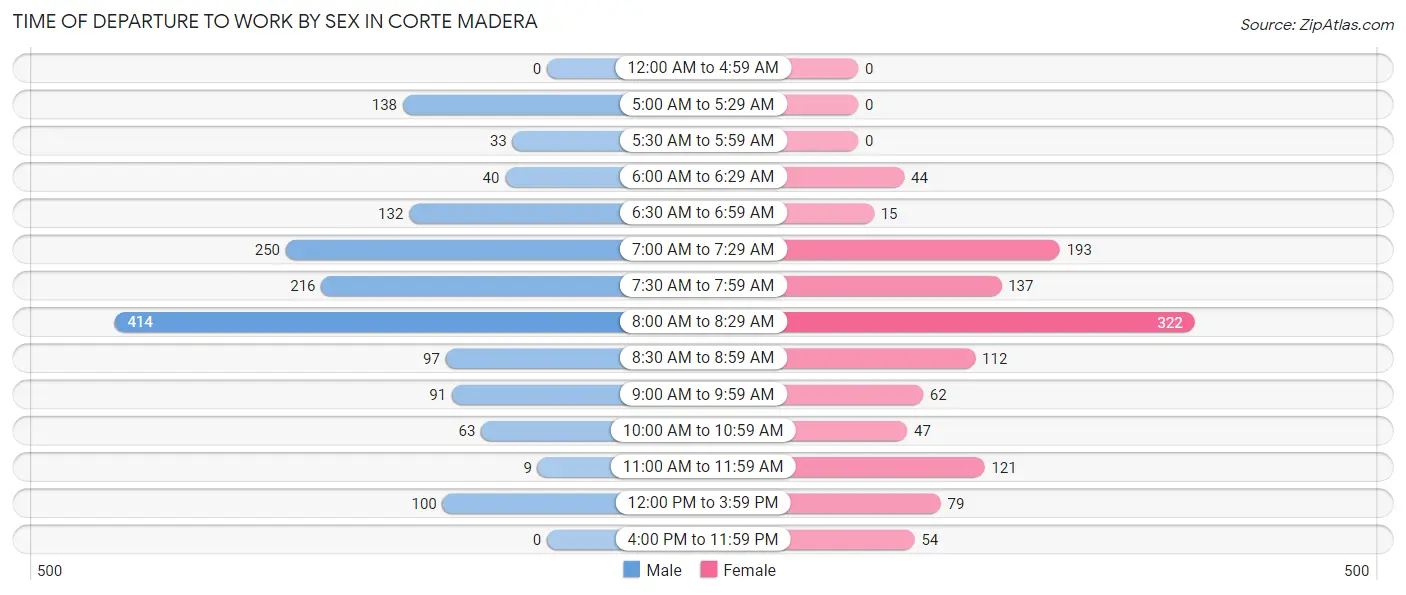
Time of Departure to Work by Sex in Corte Madera
The most frequent times of departure to work in Corte Madera are 8:00 AM to 8:29 AM (414, 26.2%) for males and 8:00 AM to 8:29 AM (322, 27.2%) for females.
| Time of Departure | Male | Female |
| 12:00 AM to 4:59 AM | 0 (0.0%) | 0 (0.0%) |
| 5:00 AM to 5:29 AM | 138 (8.7%) | 0 (0.0%) |
| 5:30 AM to 5:59 AM | 33 (2.1%) | 0 (0.0%) |
| 6:00 AM to 6:29 AM | 40 (2.5%) | 44 (3.7%) |
| 6:30 AM to 6:59 AM | 132 (8.3%) | 15 (1.3%) |
| 7:00 AM to 7:29 AM | 250 (15.8%) | 193 (16.3%) |
| 7:30 AM to 7:59 AM | 216 (13.6%) | 137 (11.6%) |
| 8:00 AM to 8:29 AM | 414 (26.2%) | 322 (27.2%) |
| 8:30 AM to 8:59 AM | 97 (6.1%) | 112 (9.4%) |
| 9:00 AM to 9:59 AM | 91 (5.8%) | 62 (5.2%) |
| 10:00 AM to 10:59 AM | 63 (4.0%) | 47 (4.0%) |
| 11:00 AM to 11:59 AM | 9 (0.6%) | 121 (10.2%) |
| 12:00 PM to 3:59 PM | 100 (6.3%) | 79 (6.7%) |
| 4:00 PM to 11:59 PM | 0 (0.0%) | 54 (4.5%) |
| Total | 1,583 (100.0%) | 1,186 (100.0%) |
Housing Occupancy in Corte Madera
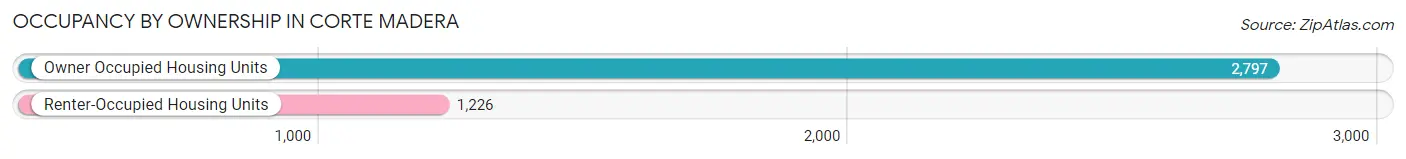
Occupancy by Ownership in Corte Madera
Of the total 4,023 dwellings in Corte Madera, owner-occupied units account for 2,797 (69.5%), while renter-occupied units make up 1,226 (30.5%).
| Occupancy | # Housing Units | % Housing Units |
| Owner Occupied Housing Units | 2,797 | 69.5% |
| Renter-Occupied Housing Units | 1,226 | 30.5% |
| Total Occupied Housing Units | 4,023 | 100.0% |
Occupancy by Household Size in Corte Madera
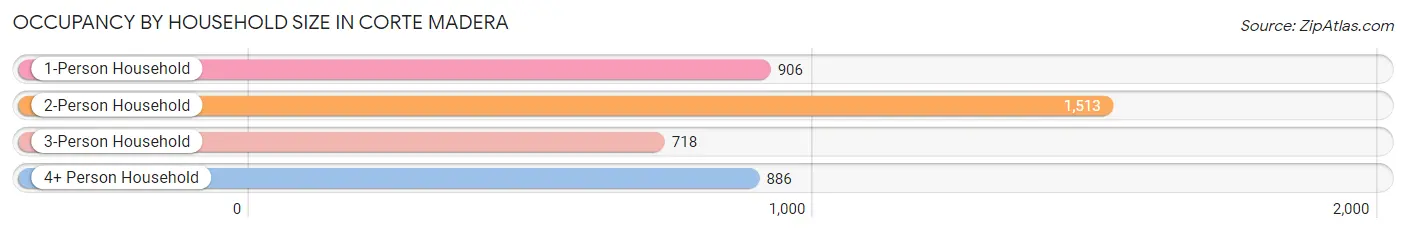
| Household Size | # Housing Units | % Housing Units |
| 1-Person Household | 906 | 22.5% |
| 2-Person Household | 1,513 | 37.6% |
| 3-Person Household | 718 | 17.8% |
| 4+ Person Household | 886 | 22.0% |
| Total Housing Units | 4,023 | 100.0% |
Occupancy by Ownership by Household Size in Corte Madera
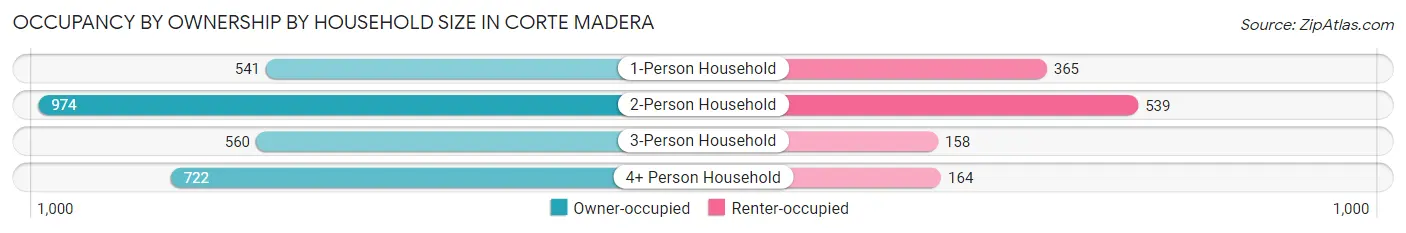
| Household Size | Owner-occupied | Renter-occupied |
| 1-Person Household | 541 (59.7%) | 365 (40.3%) |
| 2-Person Household | 974 (64.4%) | 539 (35.6%) |
| 3-Person Household | 560 (78.0%) | 158 (22.0%) |
| 4+ Person Household | 722 (81.5%) | 164 (18.5%) |
| Total Housing Units | 2,797 (69.5%) | 1,226 (30.5%) |
Occupancy by Educational Attainment in Corte Madera
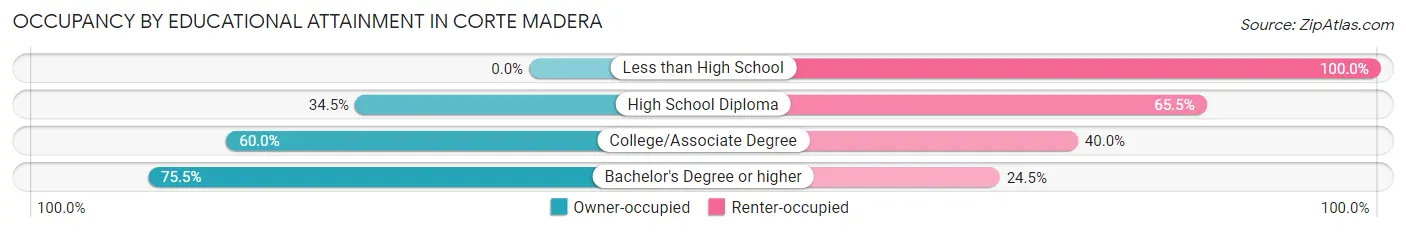
| Household Size | Owner-occupied | Renter-occupied |
| Less than High School | 0 (0.0%) | 45 (100.0%) |
| High School Diploma | 98 (34.5%) | 186 (65.5%) |
| College/Associate Degree | 348 (60.0%) | 232 (40.0%) |
| Bachelor's Degree or higher | 2,351 (75.5%) | 763 (24.5%) |
Occupancy by Age of Householder in Corte Madera
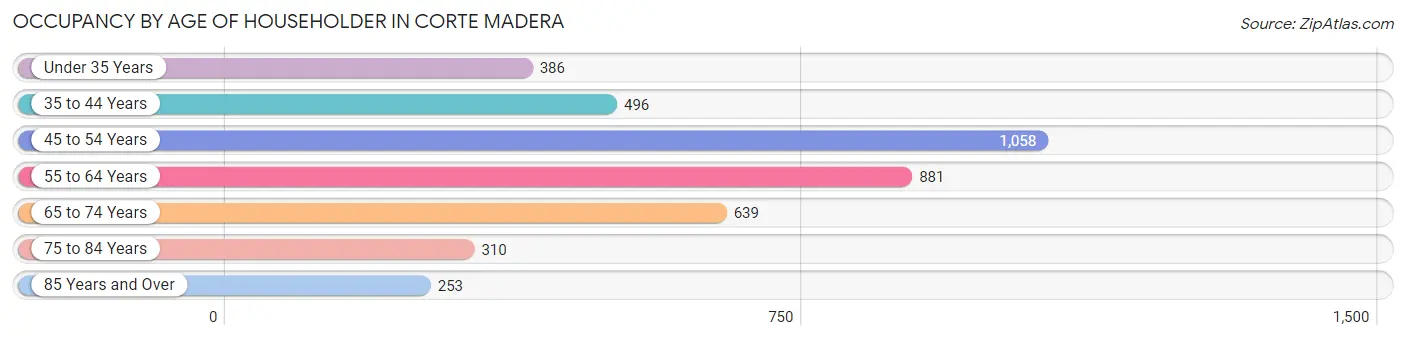
| Age Bracket | # Households | % Households |
| Under 35 Years | 386 | 9.6% |
| 35 to 44 Years | 496 | 12.3% |
| 45 to 54 Years | 1,058 | 26.3% |
| 55 to 64 Years | 881 | 21.9% |
| 65 to 74 Years | 639 | 15.9% |
| 75 to 84 Years | 310 | 7.7% |
| 85 Years and Over | 253 | 6.3% |
| Total | 4,023 | 100.0% |
Housing Finances in Corte Madera
Median Income by Occupancy in Corte Madera
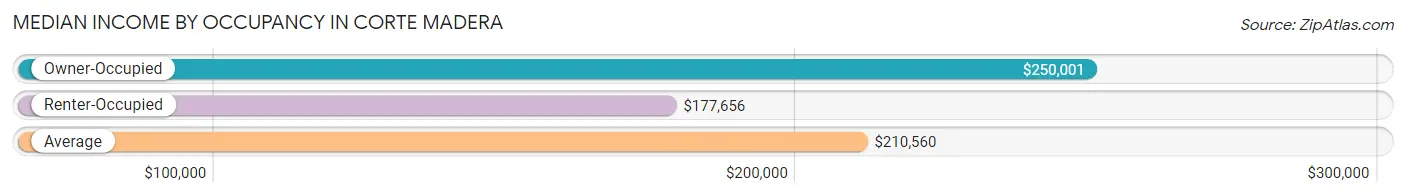
| Occupancy Type | # Households | Median Income |
| Owner-Occupied | 2,797 (69.5%) | $250,001 |
| Renter-Occupied | 1,226 (30.5%) | $177,656 |
| Average | 4,023 (100.0%) | $210,560 |
Occupancy by Householder Income Bracket in Corte Madera
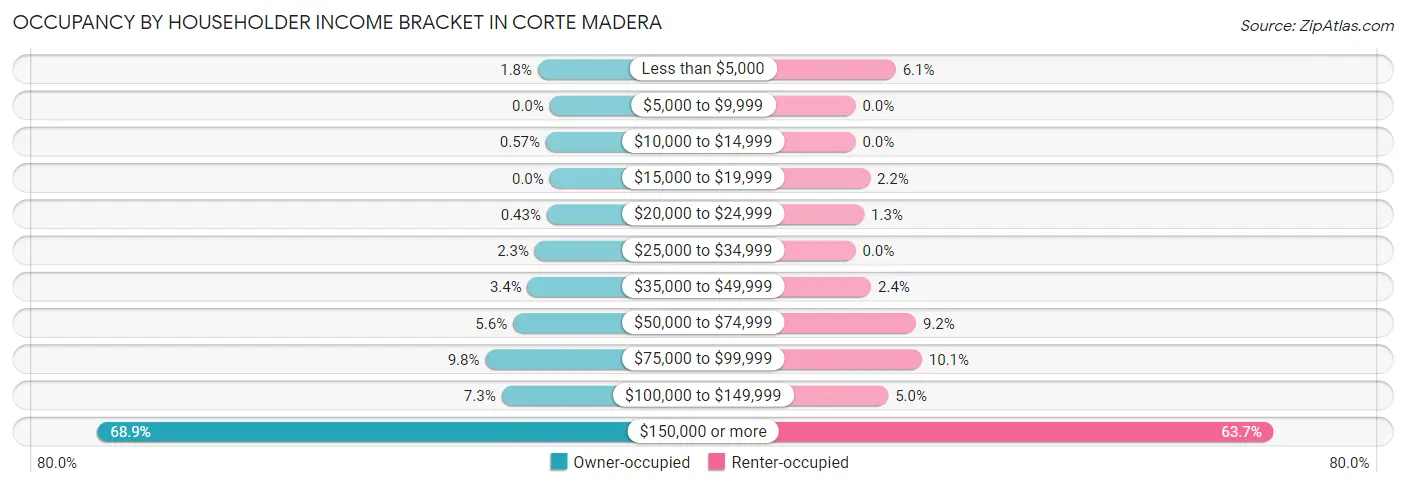
| Income Bracket | Owner-occupied | Renter-occupied |
| Less than $5,000 | 50 (1.8%) | 75 (6.1%) |
| $5,000 to $9,999 | 0 (0.0%) | 0 (0.0%) |
| $10,000 to $14,999 | 16 (0.6%) | 0 (0.0%) |
| $15,000 to $19,999 | 0 (0.0%) | 27 (2.2%) |
| $20,000 to $24,999 | 12 (0.4%) | 16 (1.3%) |
| $25,000 to $34,999 | 63 (2.2%) | 0 (0.0%) |
| $35,000 to $49,999 | 94 (3.4%) | 29 (2.4%) |
| $50,000 to $74,999 | 156 (5.6%) | 113 (9.2%) |
| $75,000 to $99,999 | 274 (9.8%) | 124 (10.1%) |
| $100,000 to $149,999 | 205 (7.3%) | 61 (5.0%) |
| $150,000 or more | 1,927 (68.9%) | 781 (63.7%) |
| Total | 2,797 (100.0%) | 1,226 (100.0%) |
Monthly Housing Cost Tiers in Corte Madera
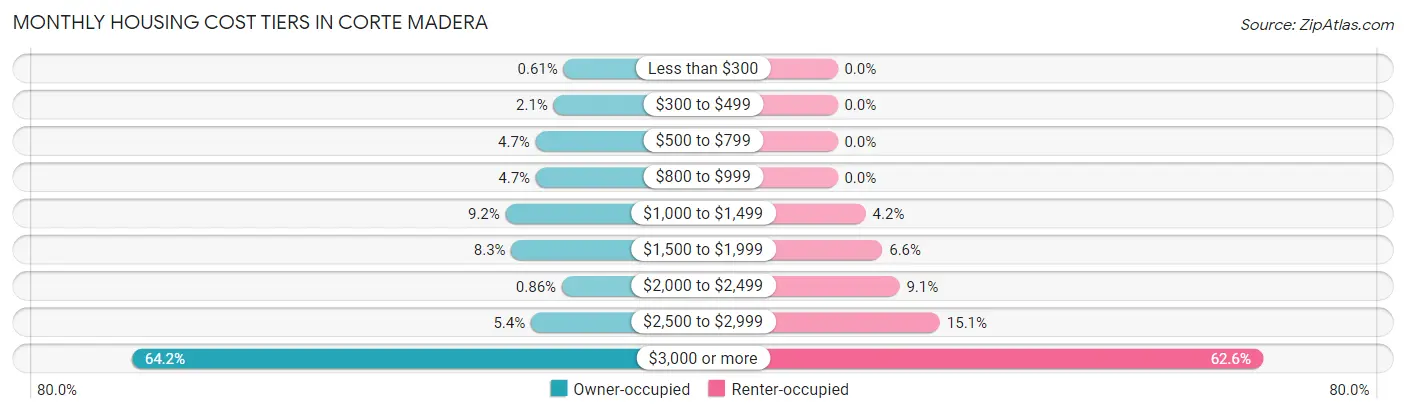
| Monthly Cost | Owner-occupied | Renter-occupied |
| Less than $300 | 17 (0.6%) | 0 (0.0%) |
| $300 to $499 | 58 (2.1%) | 0 (0.0%) |
| $500 to $799 | 132 (4.7%) | 0 (0.0%) |
| $800 to $999 | 131 (4.7%) | 0 (0.0%) |
| $1,000 to $1,499 | 256 (9.1%) | 51 (4.2%) |
| $1,500 to $1,999 | 232 (8.3%) | 81 (6.6%) |
| $2,000 to $2,499 | 24 (0.9%) | 112 (9.1%) |
| $2,500 to $2,999 | 151 (5.4%) | 185 (15.1%) |
| $3,000 or more | 1,796 (64.2%) | 768 (62.6%) |
| Total | 2,797 (100.0%) | 1,226 (100.0%) |
Physical Housing Characteristics in Corte Madera
Housing Structures in Corte Madera
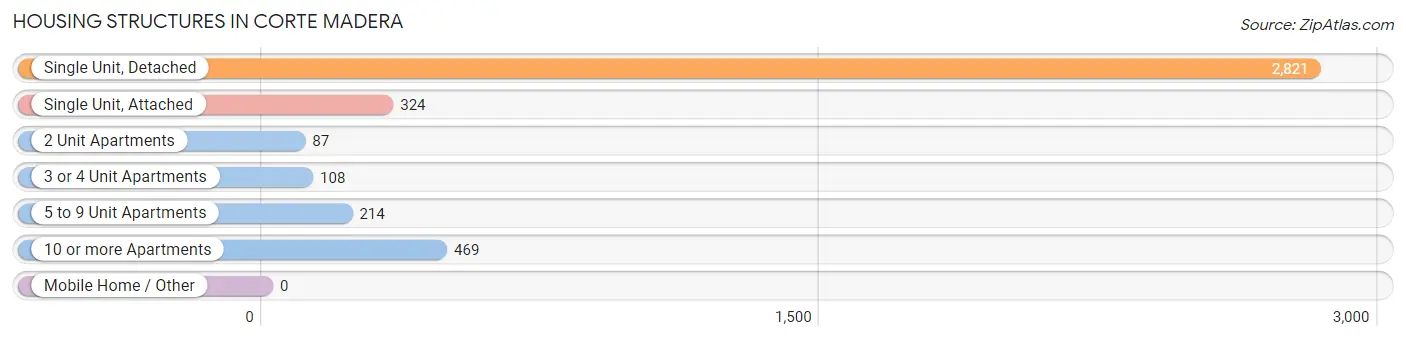
| Structure Type | # Housing Units | % Housing Units |
| Single Unit, Detached | 2,821 | 70.1% |
| Single Unit, Attached | 324 | 8.1% |
| 2 Unit Apartments | 87 | 2.2% |
| 3 or 4 Unit Apartments | 108 | 2.7% |
| 5 to 9 Unit Apartments | 214 | 5.3% |
| 10 or more Apartments | 469 | 11.7% |
| Mobile Home / Other | 0 | 0.0% |
| Total | 4,023 | 100.0% |
Housing Structures by Occupancy in Corte Madera
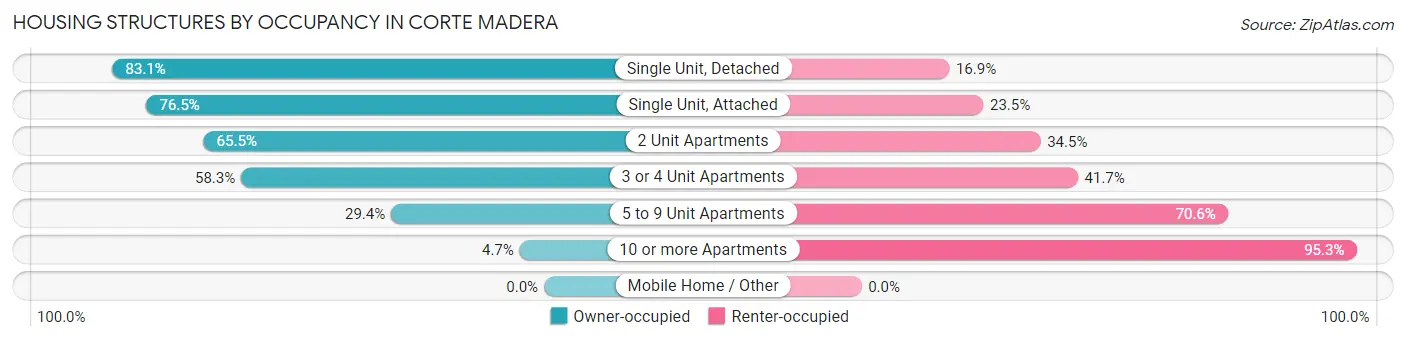
| Structure Type | Owner-occupied | Renter-occupied |
| Single Unit, Detached | 2,344 (83.1%) | 477 (16.9%) |
| Single Unit, Attached | 248 (76.5%) | 76 (23.5%) |
| 2 Unit Apartments | 57 (65.5%) | 30 (34.5%) |
| 3 or 4 Unit Apartments | 63 (58.3%) | 45 (41.7%) |
| 5 to 9 Unit Apartments | 63 (29.4%) | 151 (70.6%) |
| 10 or more Apartments | 22 (4.7%) | 447 (95.3%) |
| Mobile Home / Other | 0 (0.0%) | 0 (0.0%) |
| Total | 2,797 (69.5%) | 1,226 (30.5%) |
Housing Structures by Number of Rooms in Corte Madera
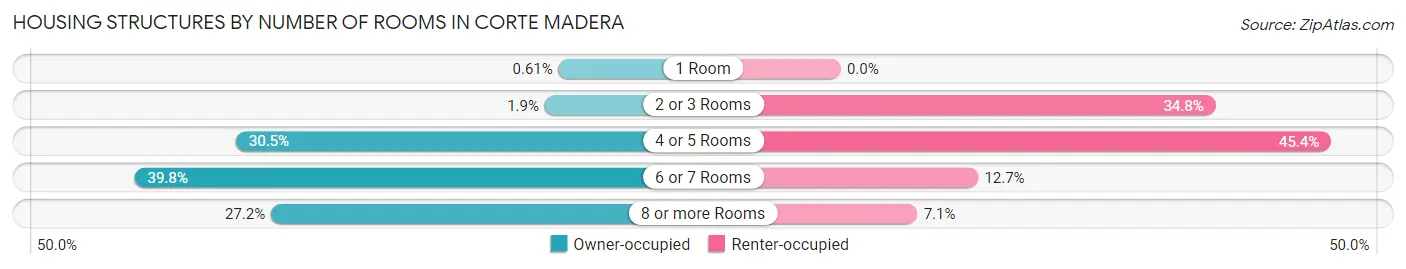
| Number of Rooms | Owner-occupied | Renter-occupied |
| 1 Room | 17 (0.6%) | 0 (0.0%) |
| 2 or 3 Rooms | 53 (1.9%) | 426 (34.7%) |
| 4 or 5 Rooms | 852 (30.5%) | 557 (45.4%) |
| 6 or 7 Rooms | 1,114 (39.8%) | 156 (12.7%) |
| 8 or more Rooms | 761 (27.2%) | 87 (7.1%) |
| Total | 2,797 (100.0%) | 1,226 (100.0%) |
Housing Structure by Heating Type in Corte Madera
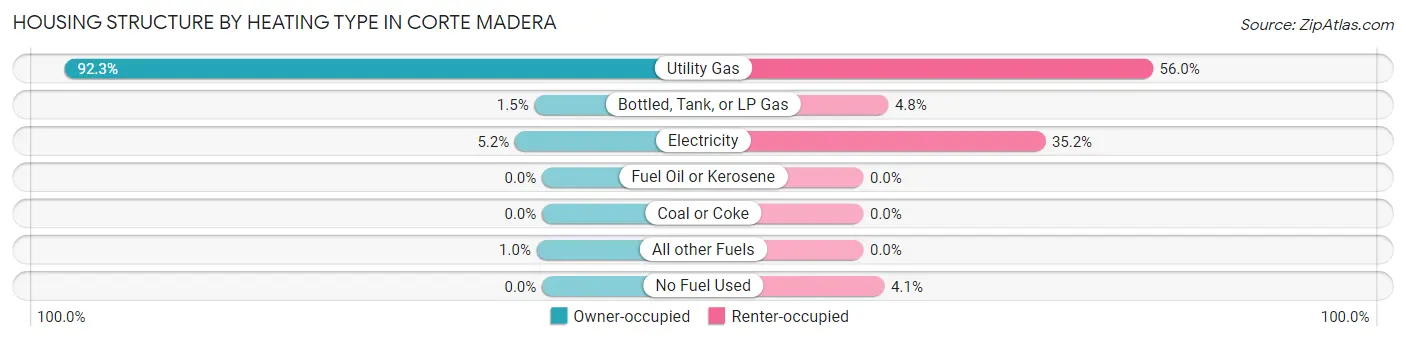
| Heating Type | Owner-occupied | Renter-occupied |
| Utility Gas | 2,581 (92.3%) | 686 (55.9%) |
| Bottled, Tank, or LP Gas | 41 (1.5%) | 59 (4.8%) |
| Electricity | 146 (5.2%) | 431 (35.1%) |
| Fuel Oil or Kerosene | 0 (0.0%) | 0 (0.0%) |
| Coal or Coke | 0 (0.0%) | 0 (0.0%) |
| All other Fuels | 29 (1.0%) | 0 (0.0%) |
| No Fuel Used | 0 (0.0%) | 50 (4.1%) |
| Total | 2,797 (100.0%) | 1,226 (100.0%) |
Household Vehicle Usage in Corte Madera
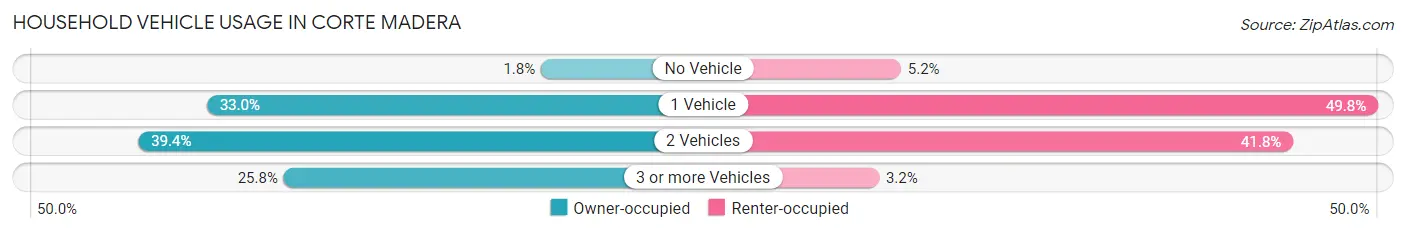
| Vehicles per Household | Owner-occupied | Renter-occupied |
| No Vehicle | 50 (1.8%) | 64 (5.2%) |
| 1 Vehicle | 923 (33.0%) | 610 (49.8%) |
| 2 Vehicles | 1,102 (39.4%) | 513 (41.8%) |
| 3 or more Vehicles | 722 (25.8%) | 39 (3.2%) |
| Total | 2,797 (100.0%) | 1,226 (100.0%) |
Real Estate & Mortgages in Corte Madera
Real Estate and Mortgage Overview in Corte Madera
| Characteristic | Without Mortgage | With Mortgage |
| Housing Units | 781 | 2,016 |
| Median Property Value | $1,276,900 | $1,740,900 |
| Median Household Income | $90,306 | $1,643 |
| Monthly Housing Costs | $1,125 | $1,777 |
| Real Estate Taxes | $6,058 | $0 |
Property Value by Mortgage Status in Corte Madera
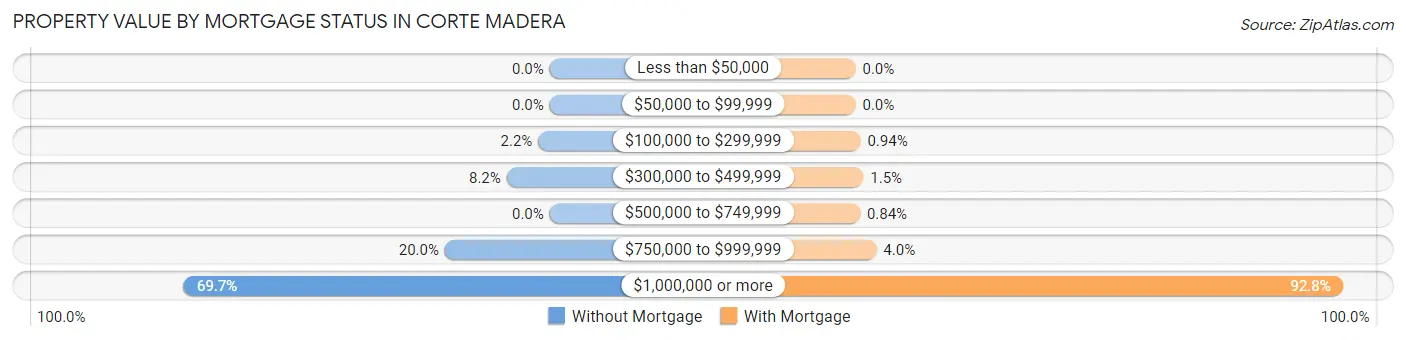
| Property Value | Without Mortgage | With Mortgage |
| Less than $50,000 | 0 (0.0%) | 0 (0.0%) |
| $50,000 to $99,999 | 0 (0.0%) | 0 (0.0%) |
| $100,000 to $299,999 | 17 (2.2%) | 19 (0.9%) |
| $300,000 to $499,999 | 64 (8.2%) | 30 (1.5%) |
| $500,000 to $749,999 | 0 (0.0%) | 17 (0.8%) |
| $750,000 to $999,999 | 156 (20.0%) | 80 (4.0%) |
| $1,000,000 or more | 544 (69.7%) | 1,870 (92.8%) |
| Total | 781 (100.0%) | 2,016 (100.0%) |
Household Income by Mortgage Status in Corte Madera
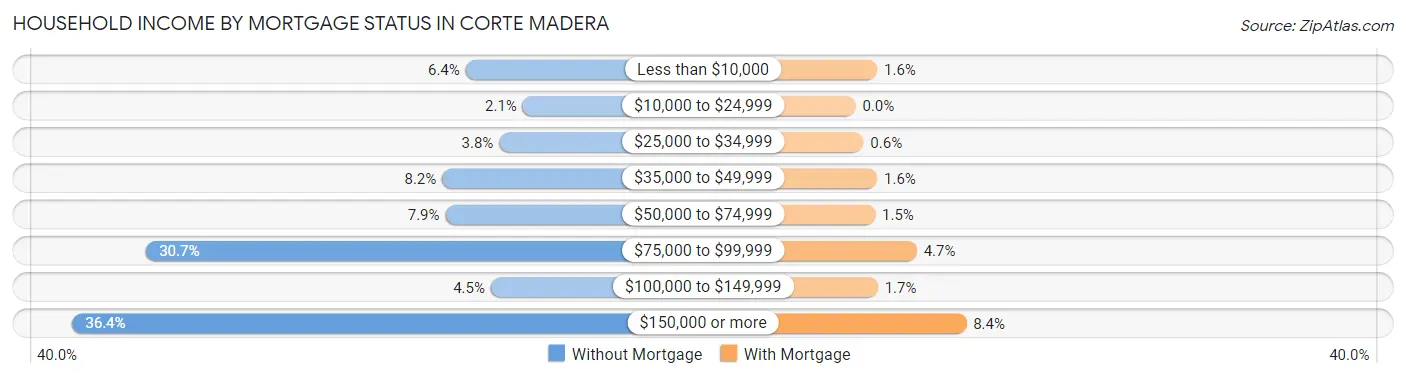
| Household Income | Without Mortgage | With Mortgage |
| Less than $10,000 | 50 (6.4%) | 33 (1.6%) |
| $10,000 to $24,999 | 16 (2.1%) | 0 (0.0%) |
| $25,000 to $34,999 | 30 (3.8%) | 12 (0.6%) |
| $35,000 to $49,999 | 64 (8.2%) | 33 (1.6%) |
| $50,000 to $74,999 | 62 (7.9%) | 30 (1.5%) |
| $75,000 to $99,999 | 240 (30.7%) | 94 (4.7%) |
| $100,000 to $149,999 | 35 (4.5%) | 34 (1.7%) |
| $150,000 or more | 284 (36.4%) | 170 (8.4%) |
| Total | 781 (100.0%) | 2,016 (100.0%) |
Property Value to Household Income Ratio in Corte Madera
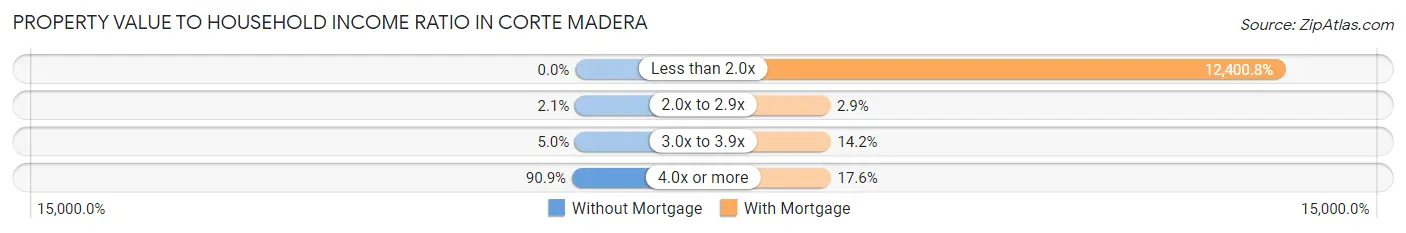
| Value-to-Income Ratio | Without Mortgage | With Mortgage |
| Less than 2.0x | 0 (0.0%) | 250,001 (12,400.8%) |
| 2.0x to 2.9x | 16 (2.1%) | 58 (2.9%) |
| 3.0x to 3.9x | 39 (5.0%) | 287 (14.2%) |
| 4.0x or more | 710 (90.9%) | 355 (17.6%) |
| Total | 781 (100.0%) | 2,016 (100.0%) |
Real Estate Taxes by Mortgage Status in Corte Madera
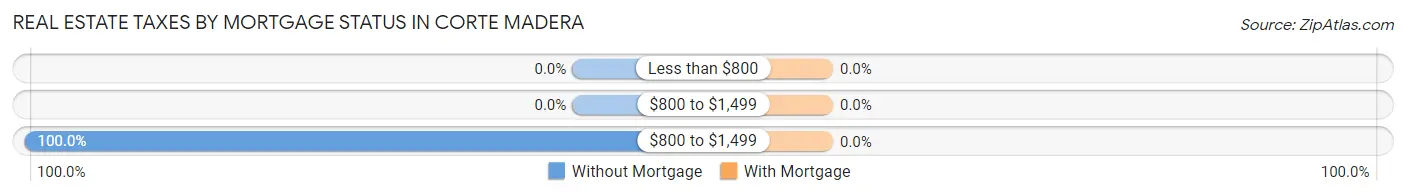
| Property Taxes | Without Mortgage | With Mortgage |
| Less than $800 | 0 (0.0%) | 0 (0.0%) |
| $800 to $1,499 | 0 (0.0%) | 0 (0.0%) |
| $800 to $1,499 | 781 (100.0%) | 0 (0.0%) |
| Total | 781 (100.0%) | 2,016 (100.0%) |
Health & Disability in Corte Madera
Health Insurance Coverage by Age in Corte Madera
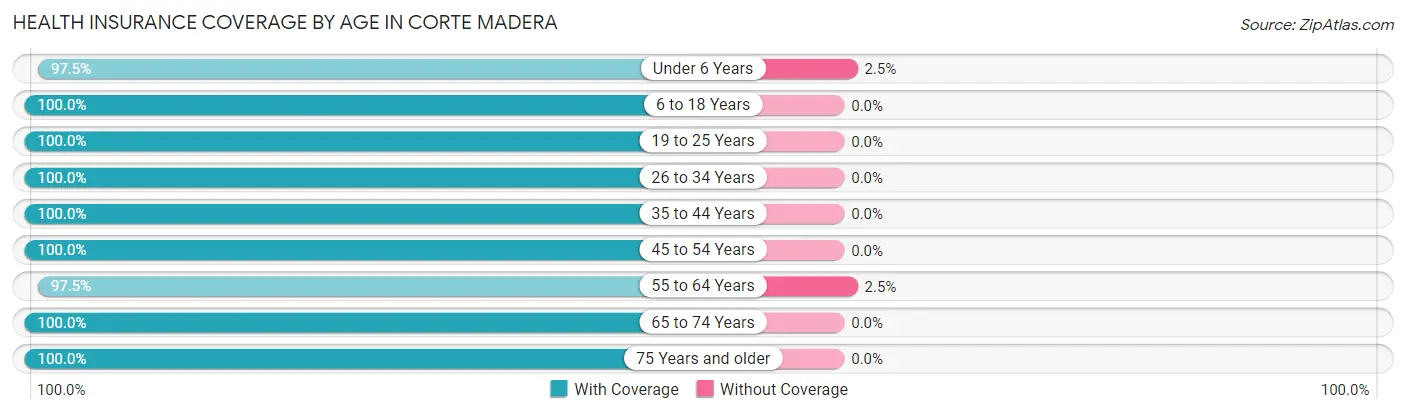
| Age Bracket | With Coverage | Without Coverage |
| Under 6 Years | 907 (97.5%) | 23 (2.5%) |
| 6 to 18 Years | 1,727 (100.0%) | 0 (0.0%) |
| 19 to 25 Years | 562 (100.0%) | 0 (0.0%) |
| 26 to 34 Years | 800 (100.0%) | 0 (0.0%) |
| 35 to 44 Years | 1,126 (100.0%) | 0 (0.0%) |
| 45 to 54 Years | 1,702 (100.0%) | 0 (0.0%) |
| 55 to 64 Years | 1,456 (97.5%) | 37 (2.5%) |
| 65 to 74 Years | 1,013 (100.0%) | 0 (0.0%) |
| 75 Years and older | 802 (100.0%) | 0 (0.0%) |
| Total | 10,095 (99.4%) | 60 (0.6%) |
Health Insurance Coverage by Citizenship Status in Corte Madera
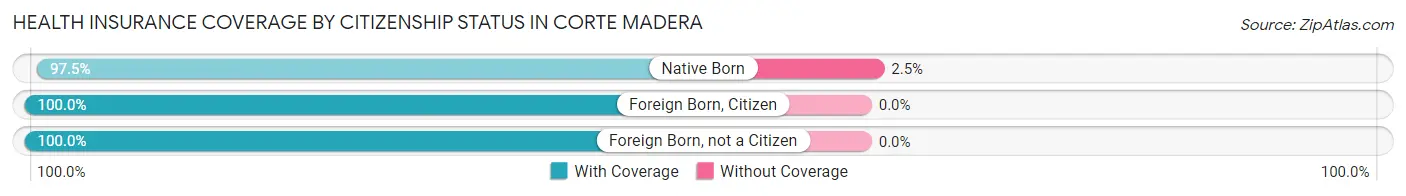
| Citizenship Status | With Coverage | Without Coverage |
| Native Born | 907 (97.5%) | 23 (2.5%) |
| Foreign Born, Citizen | 1,727 (100.0%) | 0 (0.0%) |
| Foreign Born, not a Citizen | 562 (100.0%) | 0 (0.0%) |
Health Insurance Coverage by Household Income in Corte Madera
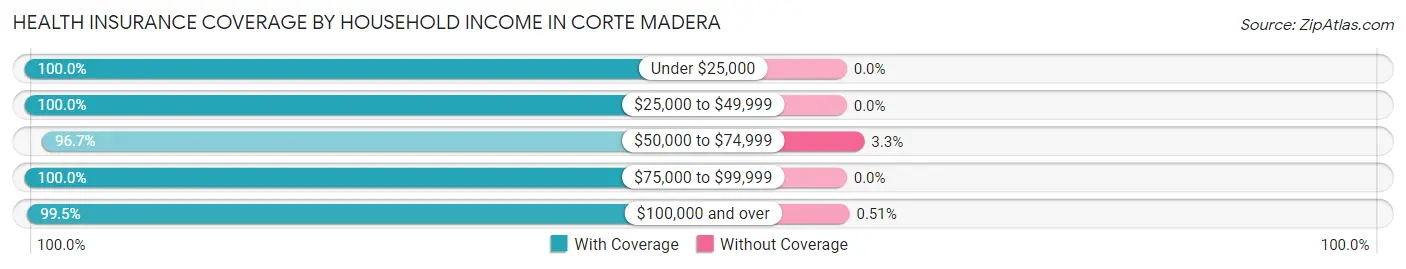
| Household Income | With Coverage | Without Coverage |
| Under $25,000 | 351 (100.0%) | 0 (0.0%) |
| $25,000 to $49,999 | 250 (100.0%) | 0 (0.0%) |
| $50,000 to $74,999 | 528 (96.7%) | 18 (3.3%) |
| $75,000 to $99,999 | 751 (100.0%) | 0 (0.0%) |
| $100,000 and over | 8,213 (99.5%) | 42 (0.5%) |
Public vs Private Health Insurance Coverage by Age in Corte Madera
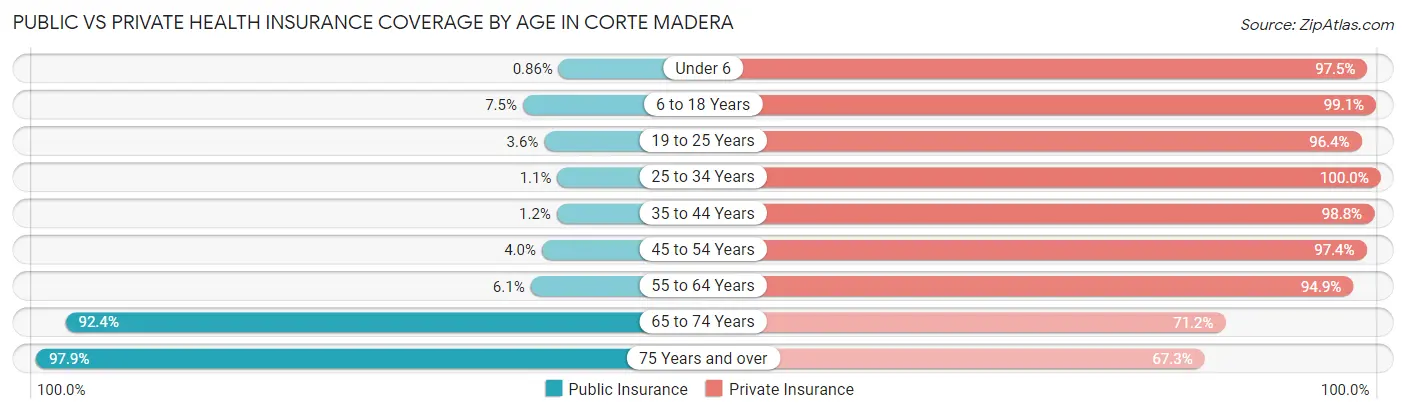
| Age Bracket | Public Insurance | Private Insurance |
| Under 6 | 8 (0.9%) | 907 (97.5%) |
| 6 to 18 Years | 130 (7.5%) | 1,712 (99.1%) |
| 19 to 25 Years | 20 (3.6%) | 542 (96.4%) |
| 25 to 34 Years | 9 (1.1%) | 800 (100.0%) |
| 35 to 44 Years | 14 (1.2%) | 1,112 (98.8%) |
| 45 to 54 Years | 68 (4.0%) | 1,657 (97.4%) |
| 55 to 64 Years | 91 (6.1%) | 1,417 (94.9%) |
| 65 to 74 Years | 936 (92.4%) | 721 (71.2%) |
| 75 Years and over | 785 (97.9%) | 540 (67.3%) |
| Total | 2,061 (20.3%) | 9,408 (92.6%) |
Disability Status by Sex by Age in Corte Madera
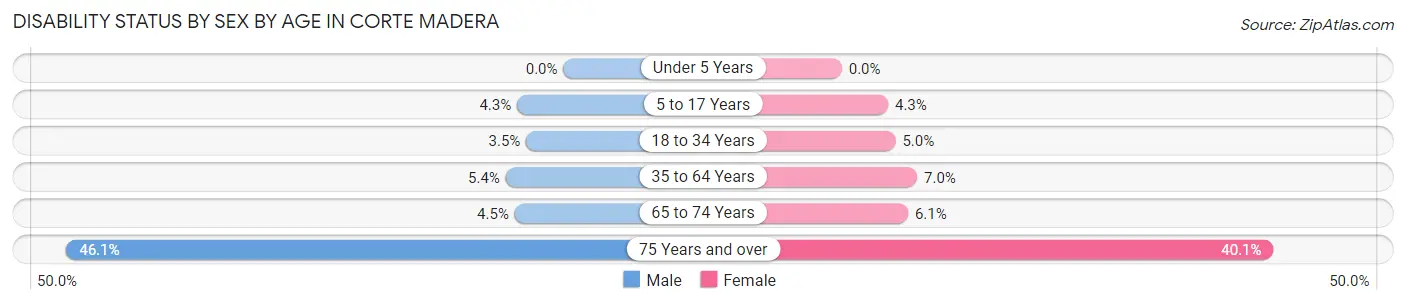
| Age Bracket | Male | Female |
| Under 5 Years | 0 (0.0%) | 0 (0.0%) |
| 5 to 17 Years | 40 (4.3%) | 42 (4.3%) |
| 18 to 34 Years | 33 (3.5%) | 24 (5.0%) |
| 35 to 64 Years | 114 (5.3%) | 153 (7.0%) |
| 65 to 74 Years | 20 (4.5%) | 35 (6.1%) |
| 75 Years and over | 173 (46.1%) | 171 (40.1%) |
Disability Class by Sex by Age in Corte Madera
Disability Class: Hearing Difficulty
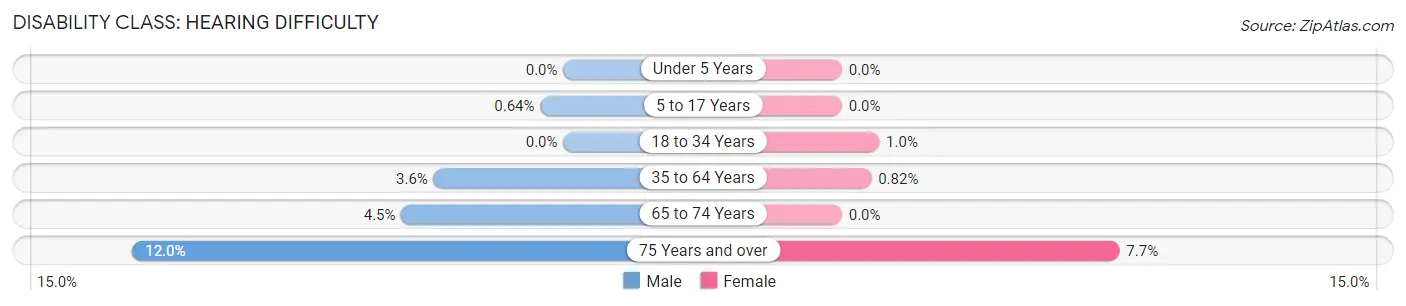
| Age Bracket | Male | Female |
| Under 5 Years | 0 (0.0%) | 0 (0.0%) |
| 5 to 17 Years | 6 (0.6%) | 0 (0.0%) |
| 18 to 34 Years | 0 (0.0%) | 5 (1.0%) |
| 35 to 64 Years | 77 (3.6%) | 18 (0.8%) |
| 65 to 74 Years | 20 (4.5%) | 0 (0.0%) |
| 75 Years and over | 45 (12.0%) | 33 (7.7%) |
Disability Class: Vision Difficulty
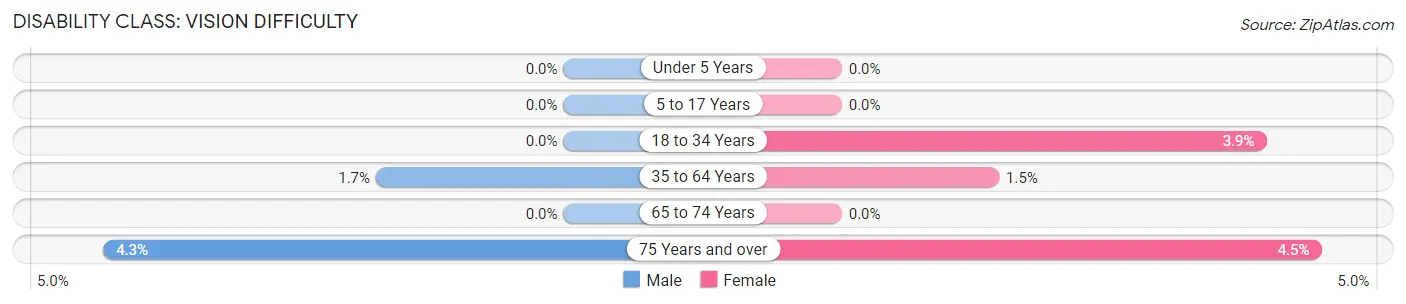
| Age Bracket | Male | Female |
| Under 5 Years | 0 (0.0%) | 0 (0.0%) |
| 5 to 17 Years | 0 (0.0%) | 0 (0.0%) |
| 18 to 34 Years | 0 (0.0%) | 19 (3.9%) |
| 35 to 64 Years | 37 (1.7%) | 32 (1.5%) |
| 65 to 74 Years | 0 (0.0%) | 0 (0.0%) |
| 75 Years and over | 16 (4.3%) | 19 (4.4%) |
Disability Class: Cognitive Difficulty
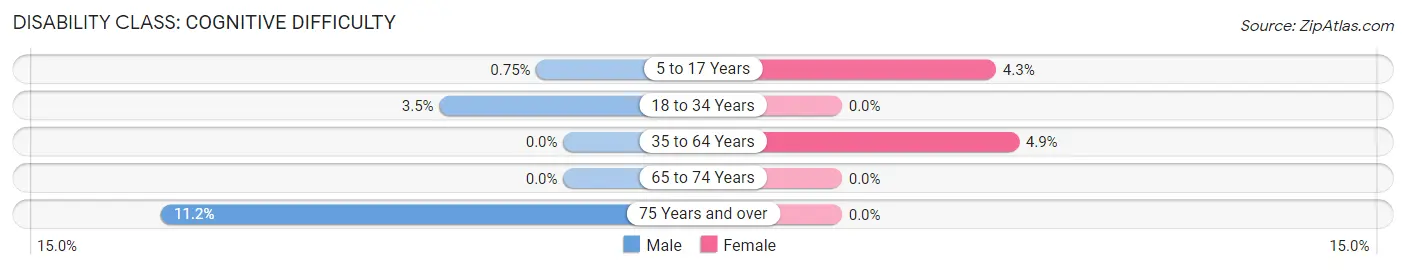
| Age Bracket | Male | Female |
| 5 to 17 Years | 7 (0.7%) | 42 (4.3%) |
| 18 to 34 Years | 33 (3.5%) | 0 (0.0%) |
| 35 to 64 Years | 0 (0.0%) | 108 (4.9%) |
| 65 to 74 Years | 0 (0.0%) | 0 (0.0%) |
| 75 Years and over | 42 (11.2%) | 0 (0.0%) |
Disability Class: Ambulatory Difficulty
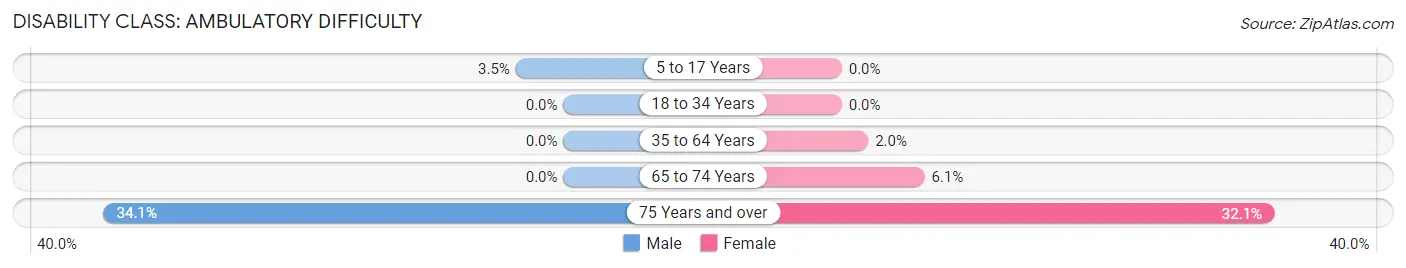
| Age Bracket | Male | Female |
| 5 to 17 Years | 33 (3.5%) | 0 (0.0%) |
| 18 to 34 Years | 0 (0.0%) | 0 (0.0%) |
| 35 to 64 Years | 0 (0.0%) | 43 (2.0%) |
| 65 to 74 Years | 0 (0.0%) | 35 (6.1%) |
| 75 Years and over | 128 (34.1%) | 137 (32.1%) |
Disability Class: Self-Care Difficulty
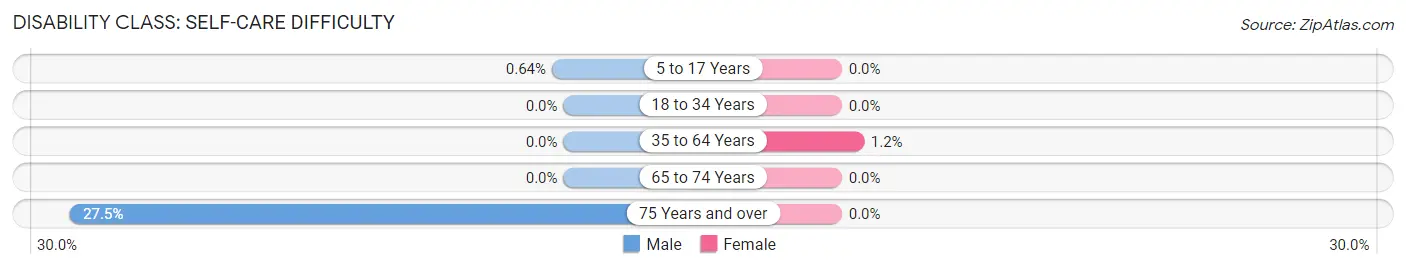
| Age Bracket | Male | Female |
| 5 to 17 Years | 6 (0.6%) | 0 (0.0%) |
| 18 to 34 Years | 0 (0.0%) | 0 (0.0%) |
| 35 to 64 Years | 0 (0.0%) | 27 (1.2%) |
| 65 to 74 Years | 0 (0.0%) | 0 (0.0%) |
| 75 Years and over | 103 (27.5%) | 0 (0.0%) |
Technology Access in Corte Madera
Computing Device Access in Corte Madera
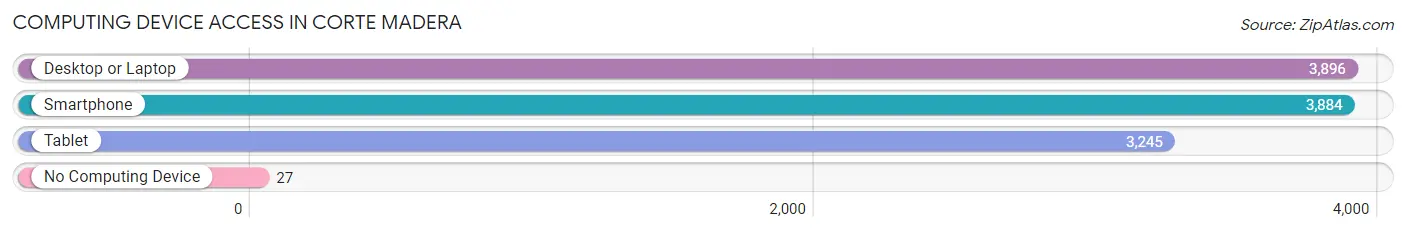
| Device Type | # Households | % Households |
| Desktop or Laptop | 3,896 | 96.8% |
| Smartphone | 3,884 | 96.5% |
| Tablet | 3,245 | 80.7% |
| No Computing Device | 27 | 0.7% |
| Total | 4,023 | 100.0% |
Internet Access in Corte Madera
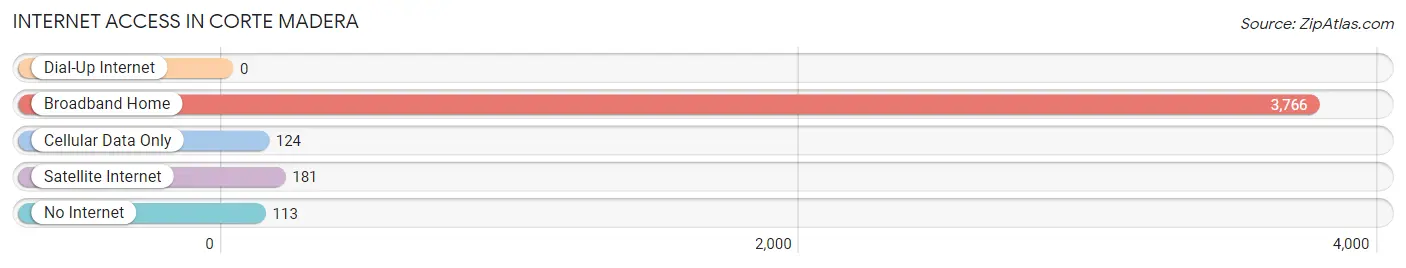
| Internet Type | # Households | % Households |
| Dial-Up Internet | 0 | 0.0% |
| Broadband Home | 3,766 | 93.6% |
| Cellular Data Only | 124 | 3.1% |
| Satellite Internet | 181 | 4.5% |
| No Internet | 113 | 2.8% |
| Total | 4,023 | 100.0% |
Corte Madera Summary
Corte Madera is a small town located in Marin County, California, United States. It is situated on the San Francisco Bay, just north of San Francisco and south of San Rafael. The town has a population of approximately 9,000 people and is known for its small-town charm and beautiful scenery.
History
The area that is now Corte Madera was originally inhabited by the Coast Miwok Native American tribe. The first European settlers arrived in the area in the late 1700s, and the town was officially founded in 1878. The town was named after the Spanish phrase “corte de madera” which means “wooden court”. The town was originally a logging and lumber town, and the lumber industry was the main source of income for the town until the 1950s.
In the 1950s, the town began to transition from a lumber town to a residential community. The town was incorporated in 1961 and has since become a popular bedroom community for people who work in San Francisco and the surrounding areas.
Geography
Corte Madera is located in Marin County, California, United States. It is situated on the San Francisco Bay, just north of San Francisco and south of San Rafael. The town is bordered by the cities of Larkspur, San Anselmo, and Ross. The town has a total area of 4.2 square miles, all of which is land.
The town is located in a temperate climate zone and has mild temperatures year-round. The average high temperature in the summer is around 75 degrees Fahrenheit and the average low temperature in the winter is around 45 degrees Fahrenheit.
Economy
The economy of Corte Madera is largely based on retail and services. The town is home to several shopping centers, including the Town Center Corte Madera, which is the largest shopping center in Marin County. The town is also home to several restaurants, cafes, and bars.
The town is also home to several corporate offices, including Autodesk, Inc., which is a software company, and the headquarters of the outdoor clothing company Patagonia.
Demographics
As of the 2010 census, the population of Corte Madera was 8,917. The racial makeup of the town was 79.3% White, 8.2% Asian, 6.2% Hispanic or Latino, 4.2% African American, and 2.1% from other races.
The median household income in Corte Madera was $107,813 in 2019, which is significantly higher than the national median household income of $61,937. The median home value in Corte Madera was $1,092,400 in 2019, which is significantly higher than the national median home value of $219,700.
Conclusion
Corte Madera is a small town located in Marin County, California, United States. It is situated on the San Francisco Bay, just north of San Francisco and south of San Rafael. The town has a population of approximately 9,000 people and is known for its small-town charm and beautiful scenery. The economy of Corte Madera is largely based on retail and services, and the town is home to several corporate offices. The median household income in Corte Madera was $107,813 in 2019, which is significantly higher than the national median household income of $61,937. The median home value in Corte Madera was $1,092,400 in 2019, which is significantly higher than the national median home value of $219,700.
Common Questions
What is Per Capita Income in Corte Madera?
Per Capita income in Corte Madera is $112,991.
What is the Median Family Income in Corte Madera?
Median Family Income in Corte Madera is $250,001.
What is the Median Household income in Corte Madera?
Median Household Income in Corte Madera is $210,560.
What is Income or Wage Gap in Corte Madera?
Income or Wage Gap in Corte Madera is 9.0%.
Women in Corte Madera earn 91.0 cents for every dollar earned by a man.
What is Inequality or Gini Index in Corte Madera?
Inequality or Gini Index in Corte Madera is 0.44.
What is the Total Population of Corte Madera?
Total Population of Corte Madera is 10,155.
What is the Total Male Population of Corte Madera?
Total Male Population of Corte Madera is 5,167.
What is the Total Female Population of Corte Madera?
Total Female Population of Corte Madera is 4,988.
What is the Ratio of Males per 100 Females in Corte Madera?
There are 103.59 Males per 100 Females in Corte Madera.
What is the Ratio of Females per 100 Males in Corte Madera?
There are 96.54 Females per 100 Males in Corte Madera.
What is the Median Population Age in Corte Madera?
Median Population Age in Corte Madera is 44.4 Years.
What is the Average Family Size in Corte Madera
Average Family Size in Corte Madera is 3.0 People.
What is the Average Household Size in Corte Madera
Average Household Size in Corte Madera is 2.5 People.
How Large is the Labor Force in Corte Madera?
There are 5,181 People in the Labor Forcein in Corte Madera.
What is the Percentage of People in the Labor Force in Corte Madera?
66.3% of People are in the Labor Force in Corte Madera.
What is the Unemployment Rate in Corte Madera?
Unemployment Rate in Corte Madera is 5.2%.