Coronado, CA Map & Demographics
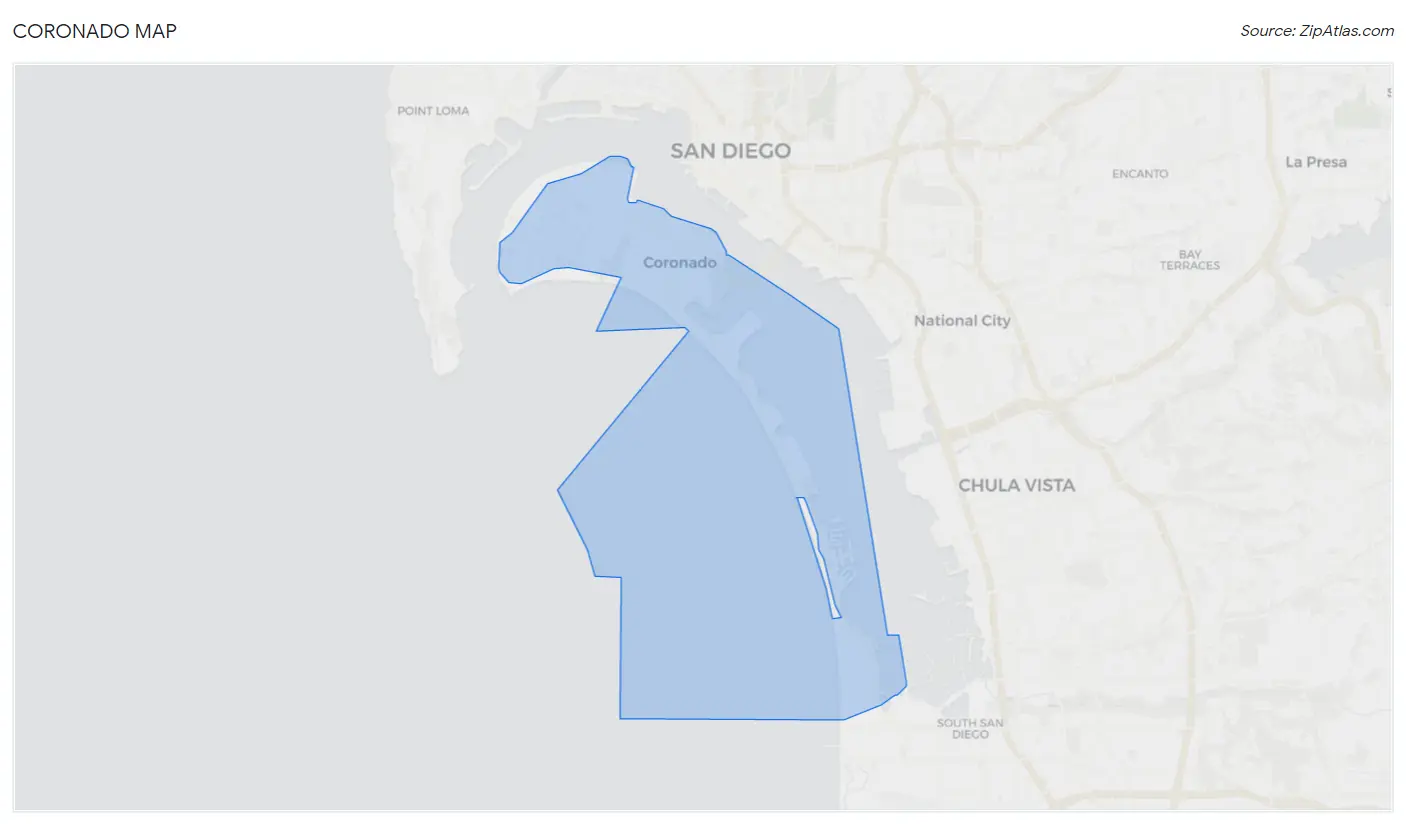
Coronado Map
Coronado Overview
$72,266
PER CAPITA INCOME
$151,357
AVG FAMILY INCOME
$125,558
AVG HOUSEHOLD INCOME
18.9%
WAGE / INCOME GAP [ % ]
81.1¢/ $1
WAGE / INCOME GAP [ $ ]
$14,904
FAMILY INCOME DEFICIT
0.50
INEQUALITY / GINI INDEX
18,871
TOTAL POPULATION
10,766
MALE POPULATION
8,105
FEMALE POPULATION
132.83
MALES / 100 FEMALES
75.28
FEMALES / 100 MALES
40.3
MEDIAN AGE
2.8
AVG FAMILY SIZE
2.4
AVG HOUSEHOLD SIZE
10,458
LABOR FORCE [ PEOPLE ]
65.1%
PERCENT IN LABOR FORCE
5.0%
UNEMPLOYMENT RATE
Coronado Zip Codes
Coronado Area Codes
Income in Coronado
Income Overview in Coronado
Per Capita Income in Coronado is $72,266, while median incomes of families and households are $151,357 and $125,558 respectively.
| Characteristic | Number | Measure |
| Per Capita Income | 18,871 | $72,266 |
| Median Family Income | 4,654 | $151,357 |
| Mean Family Income | 4,654 | $220,684 |
| Median Household Income | 6,549 | $125,558 |
| Mean Household Income | 6,549 | $189,078 |
| Income Deficit | 4,654 | $14,904 |
| Wage / Income Gap (%) | 18,871 | 18.94% |
| Wage / Income Gap ($) | 18,871 | 81.06¢ per $1 |
| Gini / Inequality Index | 18,871 | 0.50 |
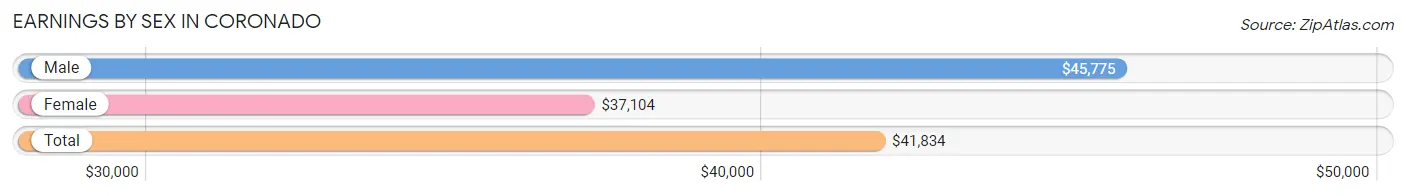
Earnings by Sex in Coronado
Average Earnings in Coronado are $41,834, $45,775 for men and $37,104 for women, a difference of 18.9%.
| Sex | Number | Average Earnings |
| Male | 7,160 (65.4%) | $45,775 |
| Female | 3,793 (34.6%) | $37,104 |
| Total | 10,953 (100.0%) | $41,834 |
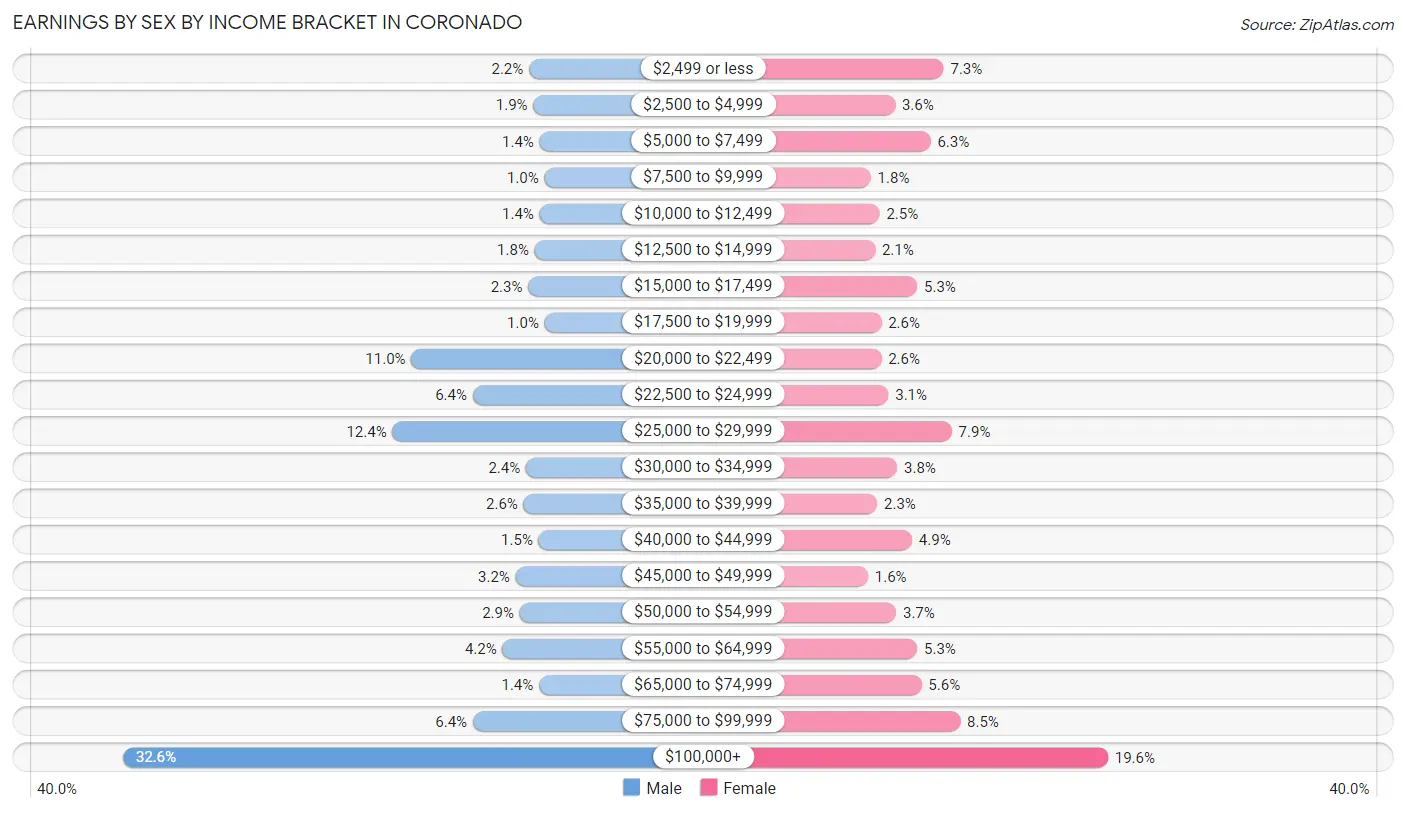
Earnings by Sex by Income Bracket in Coronado
The most common earnings brackets in Coronado are $100,000+ for men (2,337 | 32.6%) and $100,000+ for women (742 | 19.6%).
| Income | Male | Female |
| $2,499 or less | 157 (2.2%) | 275 (7.2%) |
| $2,500 to $4,999 | 134 (1.9%) | 137 (3.6%) |
| $5,000 to $7,499 | 100 (1.4%) | 238 (6.3%) |
| $7,500 to $9,999 | 74 (1.0%) | 68 (1.8%) |
| $10,000 to $12,499 | 100 (1.4%) | 93 (2.5%) |
| $12,500 to $14,999 | 127 (1.8%) | 80 (2.1%) |
| $15,000 to $17,499 | 161 (2.2%) | 200 (5.3%) |
| $17,500 to $19,999 | 73 (1.0%) | 98 (2.6%) |
| $20,000 to $22,499 | 788 (11.0%) | 98 (2.6%) |
| $22,500 to $24,999 | 459 (6.4%) | 118 (3.1%) |
| $25,000 to $29,999 | 890 (12.4%) | 298 (7.9%) |
| $30,000 to $34,999 | 173 (2.4%) | 143 (3.8%) |
| $35,000 to $39,999 | 186 (2.6%) | 86 (2.3%) |
| $40,000 to $44,999 | 105 (1.5%) | 185 (4.9%) |
| $45,000 to $49,999 | 229 (3.2%) | 60 (1.6%) |
| $50,000 to $54,999 | 207 (2.9%) | 140 (3.7%) |
| $55,000 to $64,999 | 299 (4.2%) | 200 (5.3%) |
| $65,000 to $74,999 | 103 (1.4%) | 212 (5.6%) |
| $75,000 to $99,999 | 458 (6.4%) | 322 (8.5%) |
| $100,000+ | 2,337 (32.6%) | 742 (19.6%) |
| Total | 7,160 (100.0%) | 3,793 (100.0%) |
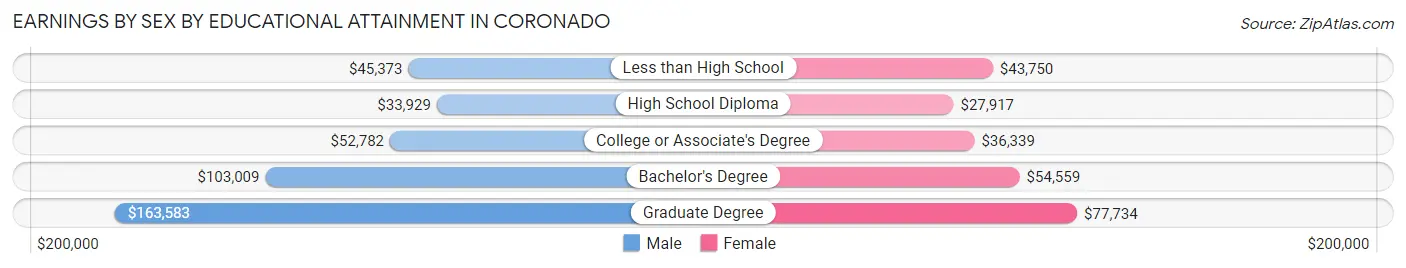
Earnings by Sex by Educational Attainment in Coronado
Average earnings in Coronado are $92,646 for men and $51,003 for women, a difference of 45.0%. Men with an educational attainment of graduate degree enjoy the highest average annual earnings of $163,583, while those with high school diploma education earn the least with $33,929. Women with an educational attainment of graduate degree earn the most with the average annual earnings of $77,734, while those with high school diploma education have the smallest earnings of $27,917.
| Educational Attainment | Male Income | Female Income |
| Less than High School | $45,373 | $43,750 |
| High School Diploma | $33,929 | $27,917 |
| College or Associate's Degree | $52,782 | $36,339 |
| Bachelor's Degree | $103,009 | $54,559 |
| Graduate Degree | $163,583 | $77,734 |
| Total | $92,646 | $51,003 |
Family Income in Coronado
Family Income Brackets in Coronado
According to the Coronado family income data, there are 1,634 families falling into the $200,000+ income range, which is the most common income bracket and makes up 35.1% of all families. Conversely, the $15,000 to $24,999 income bracket is the least frequent group with only 37 families (0.8%) belonging to this category.
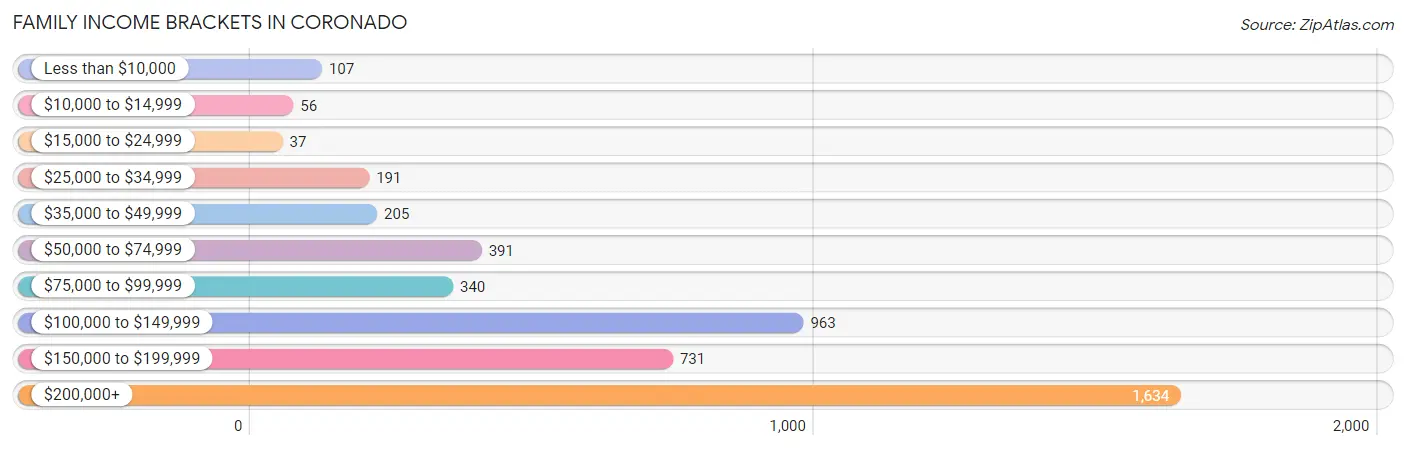
| Income Bracket | # Families | % Families |
| Less than $10,000 | 107 | 2.3% |
| $10,000 to $14,999 | 56 | 1.2% |
| $15,000 to $24,999 | 37 | 0.8% |
| $25,000 to $34,999 | 191 | 4.1% |
| $35,000 to $49,999 | 205 | 4.4% |
| $50,000 to $74,999 | 391 | 8.4% |
| $75,000 to $99,999 | 340 | 7.3% |
| $100,000 to $149,999 | 963 | 20.7% |
| $150,000 to $199,999 | 731 | 15.7% |
| $200,000+ | 1,634 | 35.1% |
Family Income by Famaliy Size in Coronado
5-person families (203 | 4.4%) account for the highest median family income in Coronado with $250,001 per family, while 2-person families (2,671 | 57.4%) have the highest median income of $74,049 per family member.
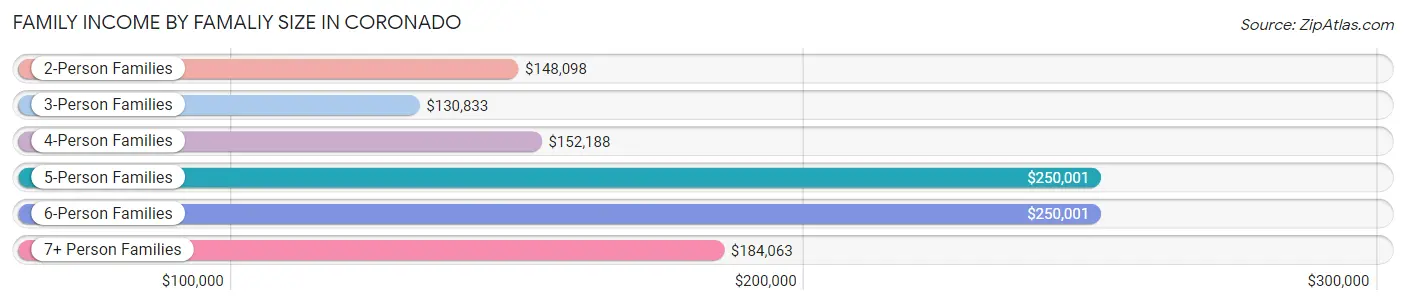
| Income Bracket | # Families | Median Income |
| 2-Person Families | 2,671 (57.4%) | $148,098 |
| 3-Person Families | 1,022 (22.0%) | $130,833 |
| 4-Person Families | 651 (14.0%) | $152,188 |
| 5-Person Families | 203 (4.4%) | $250,001 |
| 6-Person Families | 69 (1.5%) | $250,001 |
| 7+ Person Families | 38 (0.8%) | $184,063 |
| Total | 4,654 (100.0%) | $151,357 |
Family Income by Number of Earners in Coronado
The median family income in Coronado is $151,357, with families comprising 3+ earners (287) having the highest median family income of $250,001, while families with no earners (990) have the lowest median family income of $109,709, accounting for 6.2% and 21.3% of families, respectively.
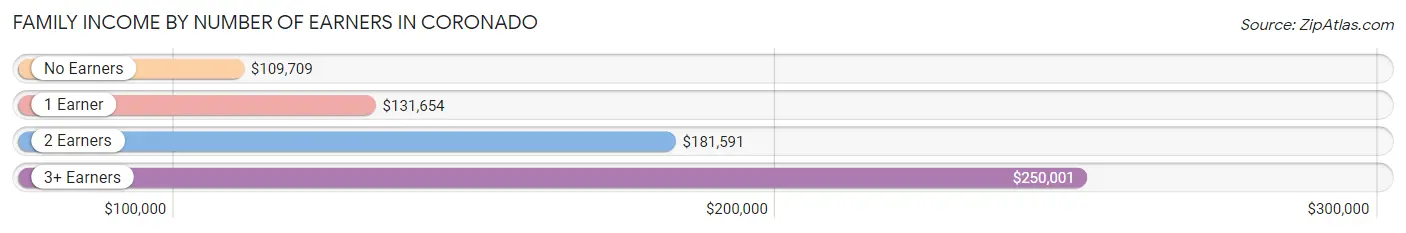
| Number of Earners | # Families | Median Income |
| No Earners | 990 (21.3%) | $109,709 |
| 1 Earner | 1,429 (30.7%) | $131,654 |
| 2 Earners | 1,948 (41.9%) | $181,591 |
| 3+ Earners | 287 (6.2%) | $250,001 |
| Total | 4,654 (100.0%) | $151,357 |
Household Income in Coronado
Household Income Brackets in Coronado
With 1,925 households falling in the category, the $200,000+ income range is the most frequent in Coronado, accounting for 29.4% of all households. In contrast, only 85 households (1.3%) fall into the $10,000 to $14,999 income bracket, making it the least populous group.
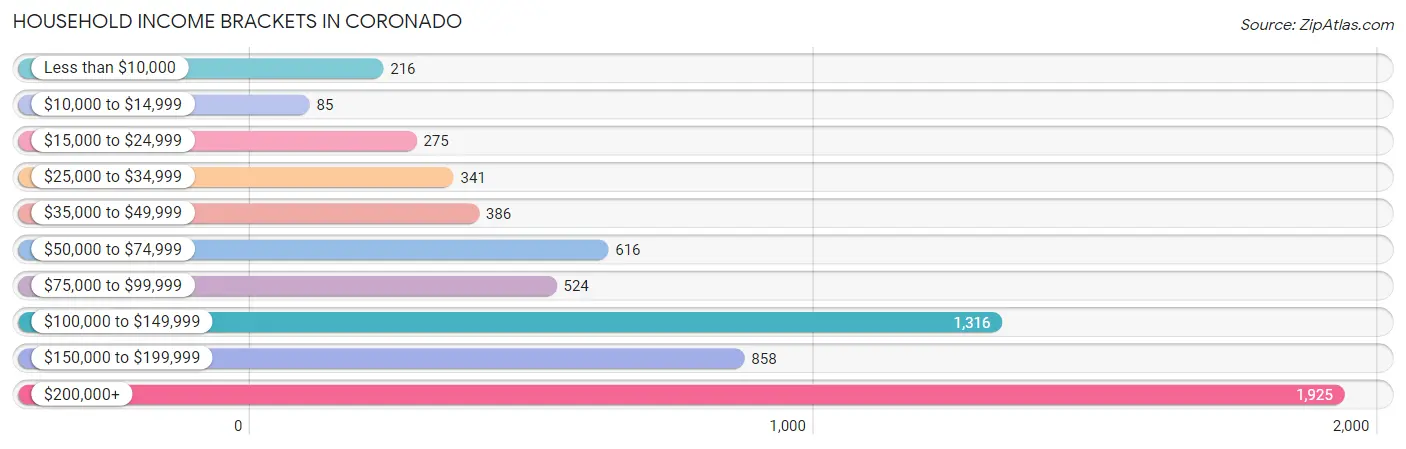
| Income Bracket | # Households | % Households |
| Less than $10,000 | 216 | 3.3% |
| $10,000 to $14,999 | 85 | 1.3% |
| $15,000 to $24,999 | 275 | 4.2% |
| $25,000 to $34,999 | 341 | 5.2% |
| $35,000 to $49,999 | 386 | 5.9% |
| $50,000 to $74,999 | 616 | 9.4% |
| $75,000 to $99,999 | 524 | 8.0% |
| $100,000 to $149,999 | 1,316 | 20.1% |
| $150,000 to $199,999 | 858 | 13.1% |
| $200,000+ | 1,925 | 29.4% |
Household Income by Householder Age in Coronado
The median household income in Coronado is $125,558, with the highest median household income of $160,852 found in the 45 to 64 years age bracket for the primary householder. A total of 2,421 households (37.0%) fall into this category. Meanwhile, the 15 to 24 years age bracket for the primary householder has the lowest median household income of $49,653, with 161 households (2.5%) in this group.
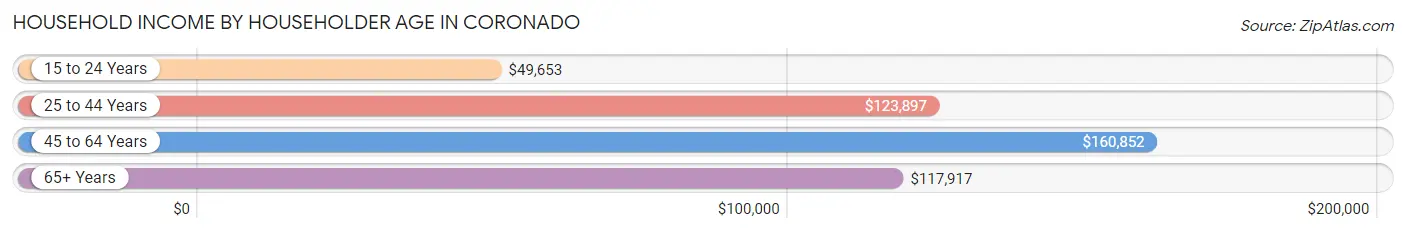
| Income Bracket | # Households | Median Income |
| 15 to 24 Years | 161 (2.5%) | $49,653 |
| 25 to 44 Years | 1,535 (23.4%) | $123,897 |
| 45 to 64 Years | 2,421 (37.0%) | $160,852 |
| 65+ Years | 2,432 (37.1%) | $117,917 |
| Total | 6,549 (100.0%) | $125,558 |
Poverty in Coronado
Income Below Poverty by Sex and Age in Coronado
With 4.9% poverty level for males and 6.8% for females among the residents of Coronado, under 5 year old males and 15 year old females are the most vulnerable to poverty, with 30 males (10.2%) and 35 females (27.6%) in their respective age groups living below the poverty level.
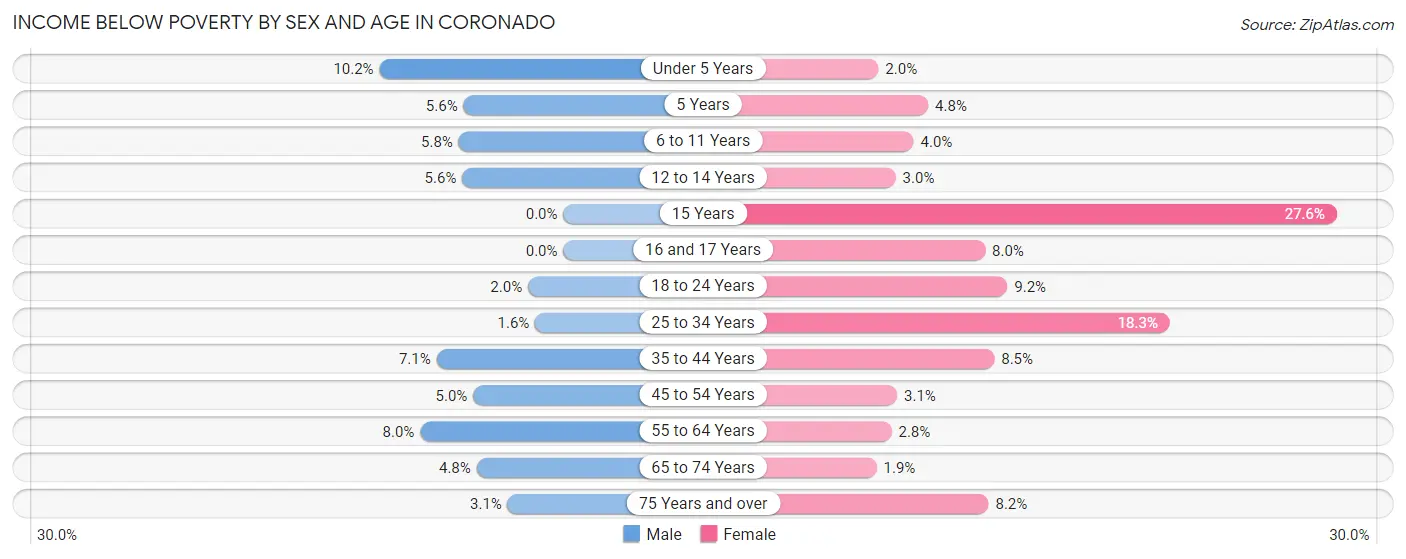
| Age Bracket | Male | Female |
| Under 5 Years | 30 (10.2%) | 7 (2.0%) |
| 5 Years | 7 (5.6%) | 5 (4.8%) |
| 6 to 11 Years | 36 (5.8%) | 13 (4.0%) |
| 12 to 14 Years | 22 (5.6%) | 13 (3.0%) |
| 15 Years | 0 (0.0%) | 35 (27.6%) |
| 16 and 17 Years | 0 (0.0%) | 21 (8.0%) |
| 18 to 24 Years | 11 (2.0%) | 38 (9.2%) |
| 25 to 34 Years | 12 (1.6%) | 149 (18.3%) |
| 35 to 44 Years | 58 (7.1%) | 75 (8.5%) |
| 45 to 54 Years | 55 (5.0%) | 30 (3.1%) |
| 55 to 64 Years | 78 (8.0%) | 30 (2.8%) |
| 65 to 74 Years | 37 (4.8%) | 17 (1.9%) |
| 75 Years and over | 33 (3.1%) | 88 (8.2%) |
| Total | 379 (4.9%) | 521 (6.8%) |
Income Above Poverty by Sex and Age in Coronado
According to the poverty statistics in Coronado, males aged 15 years and females aged 65 to 74 years are the age groups that are most secure financially, with 100.0% of males and 98.1% of females in these age groups living above the poverty line.
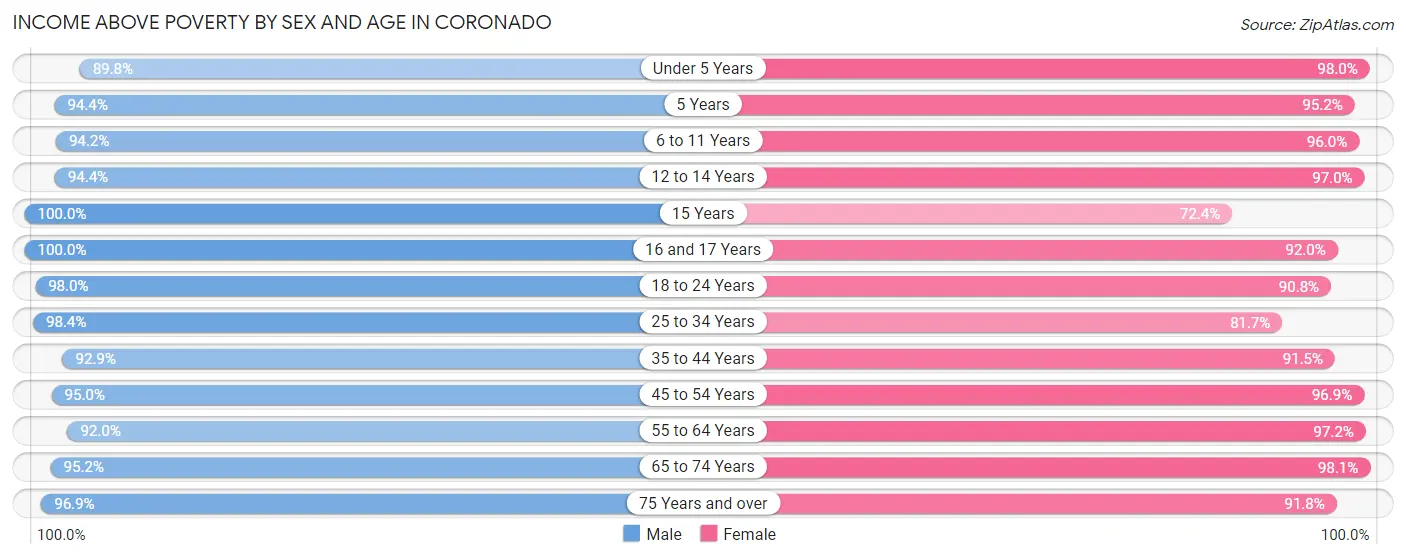
| Age Bracket | Male | Female |
| Under 5 Years | 263 (89.8%) | 336 (98.0%) |
| 5 Years | 119 (94.4%) | 99 (95.2%) |
| 6 to 11 Years | 582 (94.2%) | 312 (96.0%) |
| 12 to 14 Years | 369 (94.4%) | 421 (97.0%) |
| 15 Years | 46 (100.0%) | 92 (72.4%) |
| 16 and 17 Years | 189 (100.0%) | 242 (92.0%) |
| 18 to 24 Years | 546 (98.0%) | 374 (90.8%) |
| 25 to 34 Years | 754 (98.4%) | 667 (81.7%) |
| 35 to 44 Years | 763 (92.9%) | 808 (91.5%) |
| 45 to 54 Years | 1,041 (95.0%) | 944 (96.9%) |
| 55 to 64 Years | 901 (92.0%) | 1,054 (97.2%) |
| 65 to 74 Years | 729 (95.2%) | 860 (98.1%) |
| 75 Years and over | 1,030 (96.9%) | 989 (91.8%) |
| Total | 7,332 (95.1%) | 7,198 (93.2%) |
Income Below Poverty Among Married-Couple Families in Coronado
The poverty statistics for married-couple families in Coronado show that 3.3% or 130 of the total 3,993 families live below the poverty line. Families with 3 or 4 children have the highest poverty rate of 6.7%, comprising of 15 families. On the other hand, families with 5 or more children have the lowest poverty rate of 0.0%, which includes 0 families.
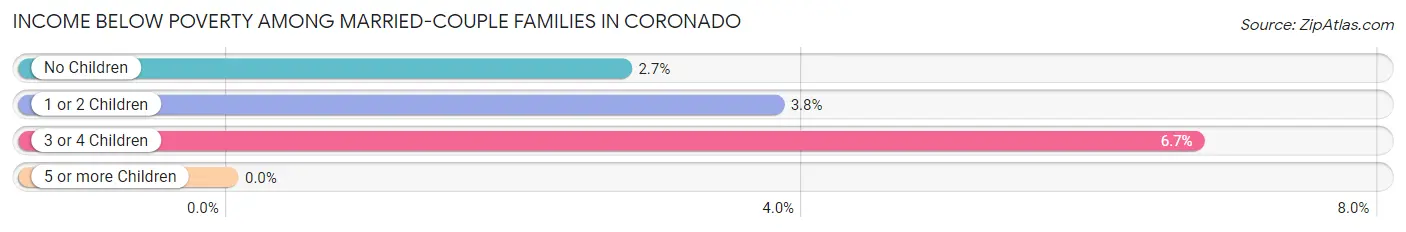
| Children | Above Poverty | Below Poverty |
| No Children | 2,518 (97.3%) | 71 (2.7%) |
| 1 or 2 Children | 1,113 (96.2%) | 44 (3.8%) |
| 3 or 4 Children | 208 (93.3%) | 15 (6.7%) |
| 5 or more Children | 24 (100.0%) | 0 (0.0%) |
| Total | 3,863 (96.7%) | 130 (3.3%) |
Income Below Poverty Among Single-Parent Households in Coronado
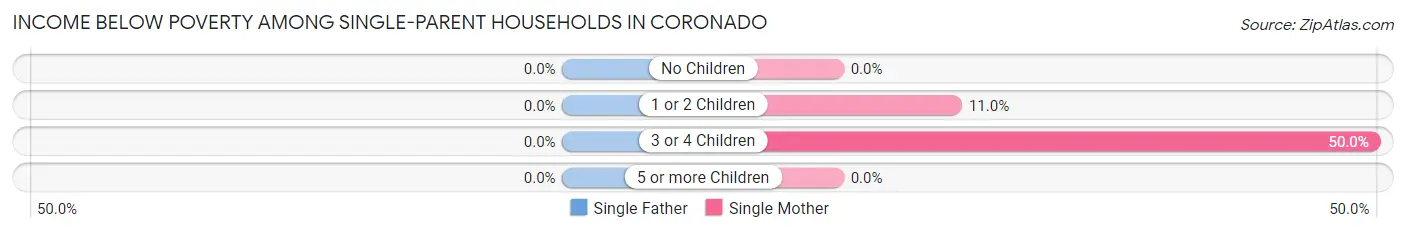
| Children | Single Father | Single Mother |
| No Children | 0 (0.0%) | 0 (0.0%) |
| 1 or 2 Children | 0 (0.0%) | 41 (11.0%) |
| 3 or 4 Children | 0 (0.0%) | 4 (50.0%) |
| 5 or more Children | 0 (0.0%) | 0 (0.0%) |
| Total | 0 (0.0%) | 45 (8.5%) |
Income Below Poverty Among Married-Couple vs Single-Parent Households in Coronado
The poverty data for Coronado shows that 130 of the married-couple family households (3.3%) and 45 of the single-parent households (6.8%) are living below the poverty level. Within the married-couple family households, those with 3 or 4 children have the highest poverty rate, with 15 households (6.7%) falling below the poverty line. Among the single-parent households, those with 3 or 4 children have the highest poverty rate, with 4 household (50.0%) living below poverty.
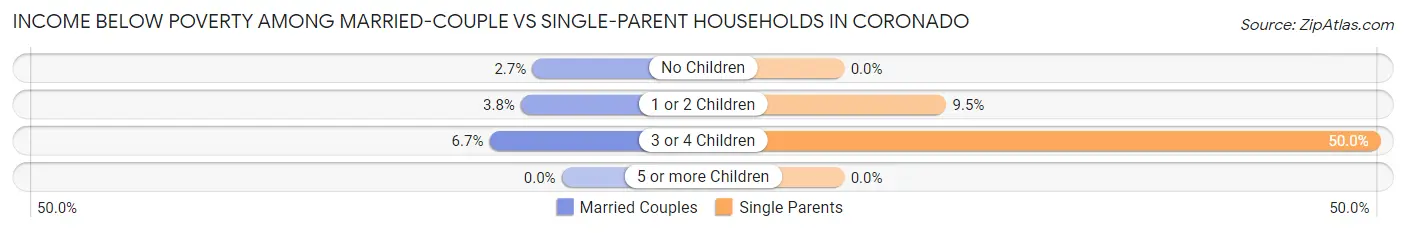
| Children | Married-Couple Families | Single-Parent Households |
| No Children | 71 (2.7%) | 0 (0.0%) |
| 1 or 2 Children | 44 (3.8%) | 41 (9.5%) |
| 3 or 4 Children | 15 (6.7%) | 4 (50.0%) |
| 5 or more Children | 0 (0.0%) | 0 (0.0%) |
| Total | 130 (3.3%) | 45 (6.8%) |
Race in Coronado
The most populous races in Coronado are White / Caucasian (14,622 | 77.5%), Hispanic or Latino (3,808 | 20.2%), and Two or more Races (1,826 | 9.7%).
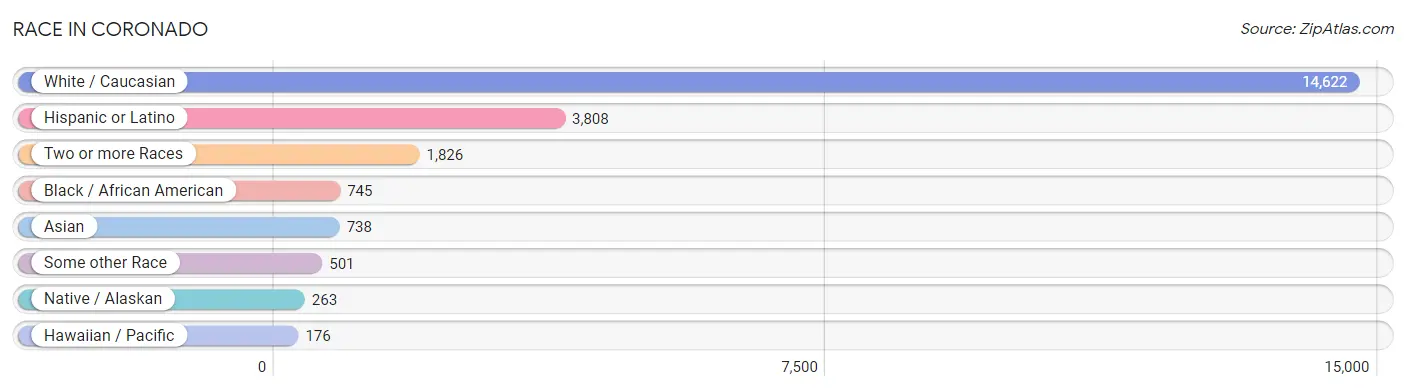
| Race | # Population | % Population |
| Asian | 738 | 3.9% |
| Black / African American | 745 | 4.0% |
| Hawaiian / Pacific | 176 | 0.9% |
| Hispanic or Latino | 3,808 | 20.2% |
| Native / Alaskan | 263 | 1.4% |
| White / Caucasian | 14,622 | 77.5% |
| Two or more Races | 1,826 | 9.7% |
| Some other Race | 501 | 2.6% |
| Total | 18,871 | 100.0% |
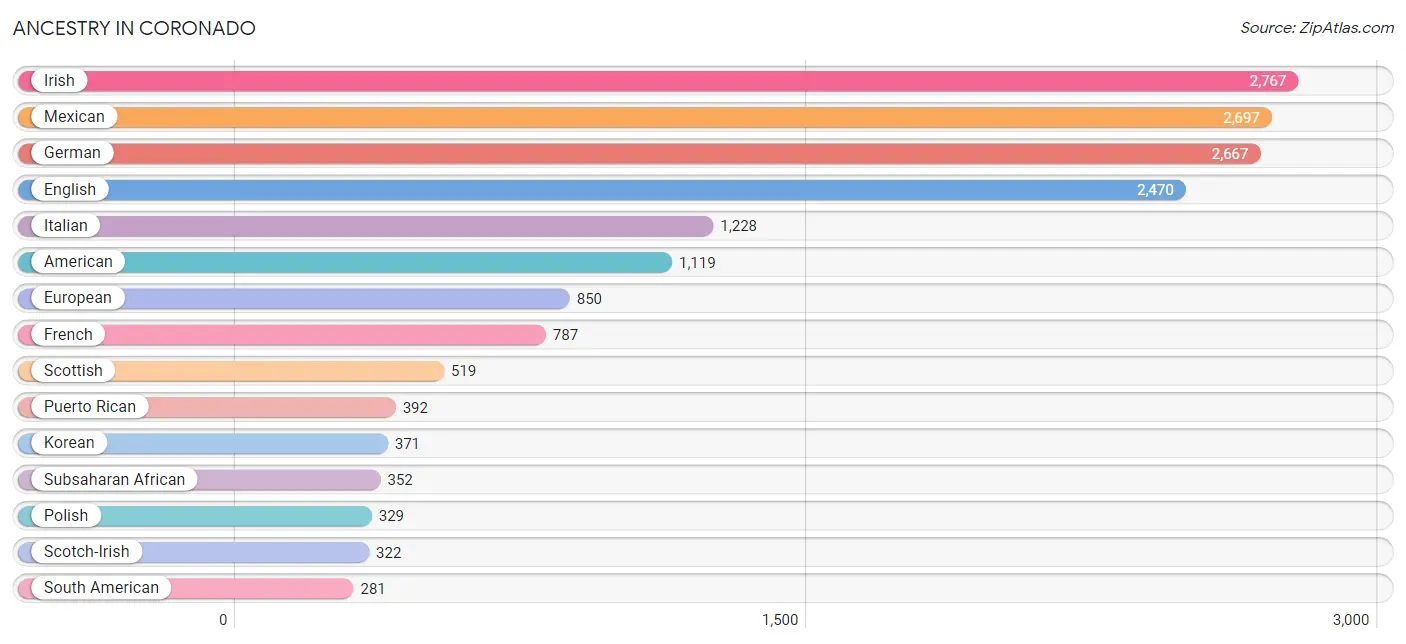
Ancestry in Coronado
The most populous ancestries reported in Coronado are Irish (2,767 | 14.7%), Mexican (2,697 | 14.3%), German (2,667 | 14.1%), English (2,470 | 13.1%), and Italian (1,228 | 6.5%), together accounting for 62.7% of all Coronado residents.
| Ancestry | # Population | % Population |
| African | 269 | 1.4% |
| Albanian | 81 | 0.4% |
| Alsatian | 9 | 0.1% |
| American | 1,119 | 5.9% |
| Apache | 70 | 0.4% |
| Arab | 214 | 1.1% |
| Argentinean | 8 | 0.0% |
| Armenian | 5 | 0.0% |
| Assyrian / Chaldean / Syriac | 22 | 0.1% |
| Austrian | 197 | 1.0% |
| Basque | 55 | 0.3% |
| Belgian | 58 | 0.3% |
| Bhutanese | 250 | 1.3% |
| Blackfeet | 2 | 0.0% |
| Brazilian | 3 | 0.0% |
| British | 167 | 0.9% |
| Burmese | 82 | 0.4% |
| Canadian | 72 | 0.4% |
| Central American | 142 | 0.7% |
| Cherokee | 100 | 0.5% |
| Choctaw | 61 | 0.3% |
| Colombian | 46 | 0.2% |
| Comanche | 7 | 0.0% |
| Croatian | 12 | 0.1% |
| Cuban | 65 | 0.3% |
| Czech | 61 | 0.3% |
| Czechoslovakian | 8 | 0.0% |
| Danish | 109 | 0.6% |
| Dominican | 16 | 0.1% |
| Dutch | 210 | 1.1% |
| Eastern European | 95 | 0.5% |
| Ecuadorian | 30 | 0.2% |
| English | 2,470 | 13.1% |
| Ethiopian | 12 | 0.1% |
| European | 850 | 4.5% |
| Finnish | 15 | 0.1% |
| French | 787 | 4.2% |
| French Canadian | 90 | 0.5% |
| German | 2,667 | 14.1% |
| Greek | 98 | 0.5% |
| Guamanian / Chamorro | 151 | 0.8% |
| Guatemalan | 4 | 0.0% |
| Haitian | 8 | 0.0% |
| Honduran | 1 | 0.0% |
| Hungarian | 67 | 0.4% |
| Icelander | 8 | 0.0% |
| Indian (Asian) | 125 | 0.7% |
| Indonesian | 5 | 0.0% |
| Iranian | 13 | 0.1% |
| Iraqi | 36 | 0.2% |
| Irish | 2,767 | 14.7% |
| Israeli | 1 | 0.0% |
| Italian | 1,228 | 6.5% |
| Jamaican | 10 | 0.1% |
| Korean | 371 | 2.0% |
| Lebanese | 108 | 0.6% |
| Lithuanian | 30 | 0.2% |
| Lumbee | 6 | 0.0% |
| Luxembourger | 14 | 0.1% |
| Macedonian | 8 | 0.0% |
| Maltese | 19 | 0.1% |
| Mexican | 2,697 | 14.3% |
| Mexican American Indian | 21 | 0.1% |
| Mongolian | 6 | 0.0% |
| Native Hawaiian | 82 | 0.4% |
| Navajo | 10 | 0.1% |
| Nigerian | 65 | 0.3% |
| Northern European | 91 | 0.5% |
| Norwegian | 218 | 1.2% |
| Panamanian | 5 | 0.0% |
| Peruvian | 33 | 0.2% |
| Polish | 329 | 1.7% |
| Portuguese | 30 | 0.2% |
| Potawatomi | 9 | 0.1% |
| Pueblo | 7 | 0.0% |
| Puerto Rican | 392 | 2.1% |
| Romanian | 5 | 0.0% |
| Russian | 266 | 1.4% |
| Salvadoran | 132 | 0.7% |
| Samoan | 9 | 0.1% |
| Scandinavian | 26 | 0.1% |
| Scotch-Irish | 322 | 1.7% |
| Scottish | 519 | 2.8% |
| Serbian | 4 | 0.0% |
| Shoshone | 20 | 0.1% |
| Slavic | 6 | 0.0% |
| Slovak | 32 | 0.2% |
| Slovene | 10 | 0.1% |
| South African | 6 | 0.0% |
| South American | 281 | 1.5% |
| South American Indian | 2 | 0.0% |
| Spaniard | 60 | 0.3% |
| Spanish | 53 | 0.3% |
| Sri Lankan | 33 | 0.2% |
| Subsaharan African | 352 | 1.9% |
| Swedish | 262 | 1.4% |
| Swiss | 67 | 0.4% |
| Thai | 111 | 0.6% |
| Turkish | 18 | 0.1% |
| Ukrainian | 134 | 0.7% |
| Uruguayan | 121 | 0.6% |
| Venezuelan | 43 | 0.2% |
| Welsh | 100 | 0.5% |
| Yugoslavian | 26 | 0.1% |
| Yuman | 28 | 0.2% | View All 105 Rows |
Immigrants in Coronado
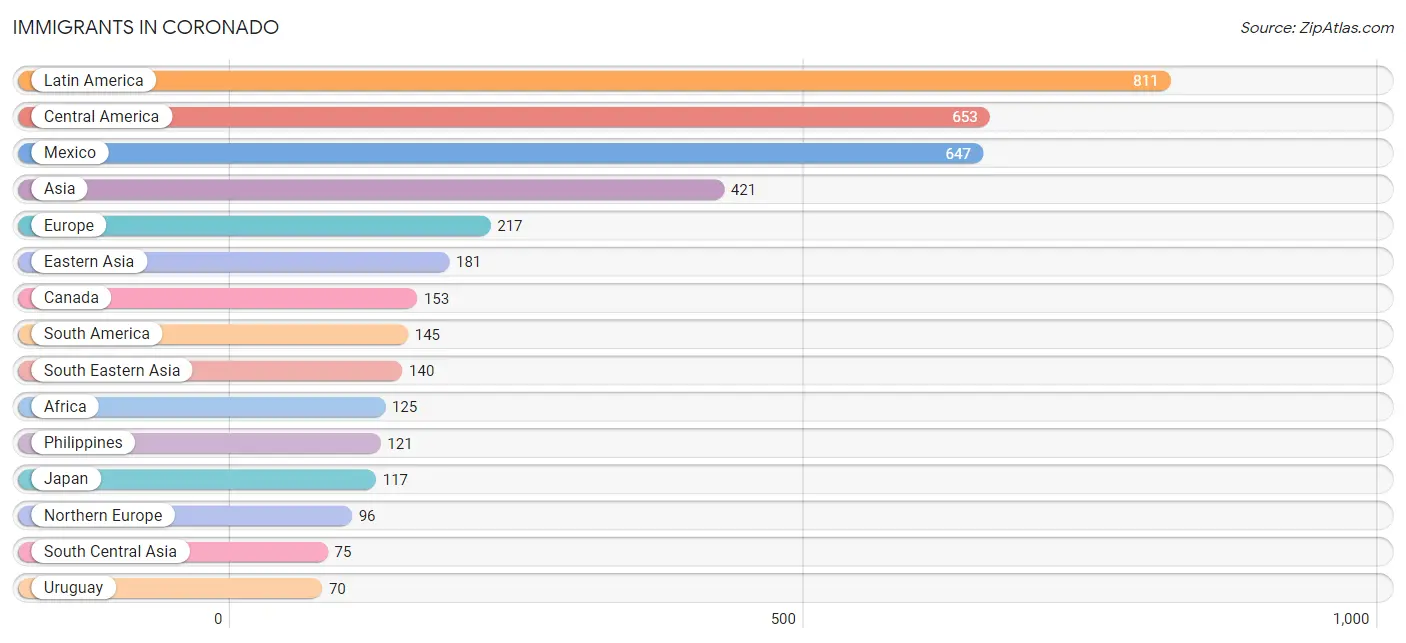
The most numerous immigrant groups reported in Coronado came from Latin America (811 | 4.3%), Central America (653 | 3.5%), Mexico (647 | 3.4%), Asia (421 | 2.2%), and Europe (217 | 1.1%), together accounting for 14.6% of all Coronado residents.
| Immigration Origin | # Population | % Population |
| Afghanistan | 35 | 0.2% |
| Africa | 125 | 0.7% |
| Albania | 5 | 0.0% |
| Armenia | 1 | 0.0% |
| Asia | 421 | 2.2% |
| Australia | 34 | 0.2% |
| Belgium | 6 | 0.0% |
| Brazil | 44 | 0.2% |
| Canada | 153 | 0.8% |
| Caribbean | 13 | 0.1% |
| Central America | 653 | 3.5% |
| China | 59 | 0.3% |
| Colombia | 29 | 0.2% |
| Cuba | 7 | 0.0% |
| Denmark | 8 | 0.0% |
| Eastern Africa | 18 | 0.1% |
| Eastern Asia | 181 | 1.0% |
| Eastern Europe | 41 | 0.2% |
| El Salvador | 6 | 0.0% |
| England | 18 | 0.1% |
| Ethiopia | 12 | 0.1% |
| Europe | 217 | 1.1% |
| France | 5 | 0.0% |
| Germany | 43 | 0.2% |
| Ghana | 5 | 0.0% |
| Haiti | 2 | 0.0% |
| Hong Kong | 13 | 0.1% |
| India | 40 | 0.2% |
| Iraq | 16 | 0.1% |
| Ireland | 21 | 0.1% |
| Israel | 8 | 0.0% |
| Italy | 5 | 0.0% |
| Jamaica | 4 | 0.0% |
| Japan | 117 | 0.6% |
| Korea | 5 | 0.0% |
| Latin America | 811 | 4.3% |
| Malaysia | 6 | 0.0% |
| Mexico | 647 | 3.4% |
| Moldova | 5 | 0.0% |
| Morocco | 4 | 0.0% |
| Netherlands | 15 | 0.1% |
| Nigeria | 65 | 0.3% |
| Northern Africa | 4 | 0.0% |
| Northern Europe | 96 | 0.5% |
| Oceania | 34 | 0.2% |
| Peru | 2 | 0.0% |
| Philippines | 121 | 0.6% |
| Poland | 5 | 0.0% |
| Scotland | 7 | 0.0% |
| South Africa | 33 | 0.2% |
| South America | 145 | 0.8% |
| South Central Asia | 75 | 0.4% |
| South Eastern Asia | 140 | 0.7% |
| Southern Europe | 11 | 0.1% |
| Spain | 6 | 0.0% |
| Uganda | 6 | 0.0% |
| Ukraine | 26 | 0.1% |
| Uruguay | 70 | 0.4% |
| Vietnam | 8 | 0.0% |
| Western Africa | 70 | 0.4% |
| Western Asia | 25 | 0.1% |
| Western Europe | 69 | 0.4% | View All 62 Rows |
Sex and Age in Coronado
Sex and Age in Coronado
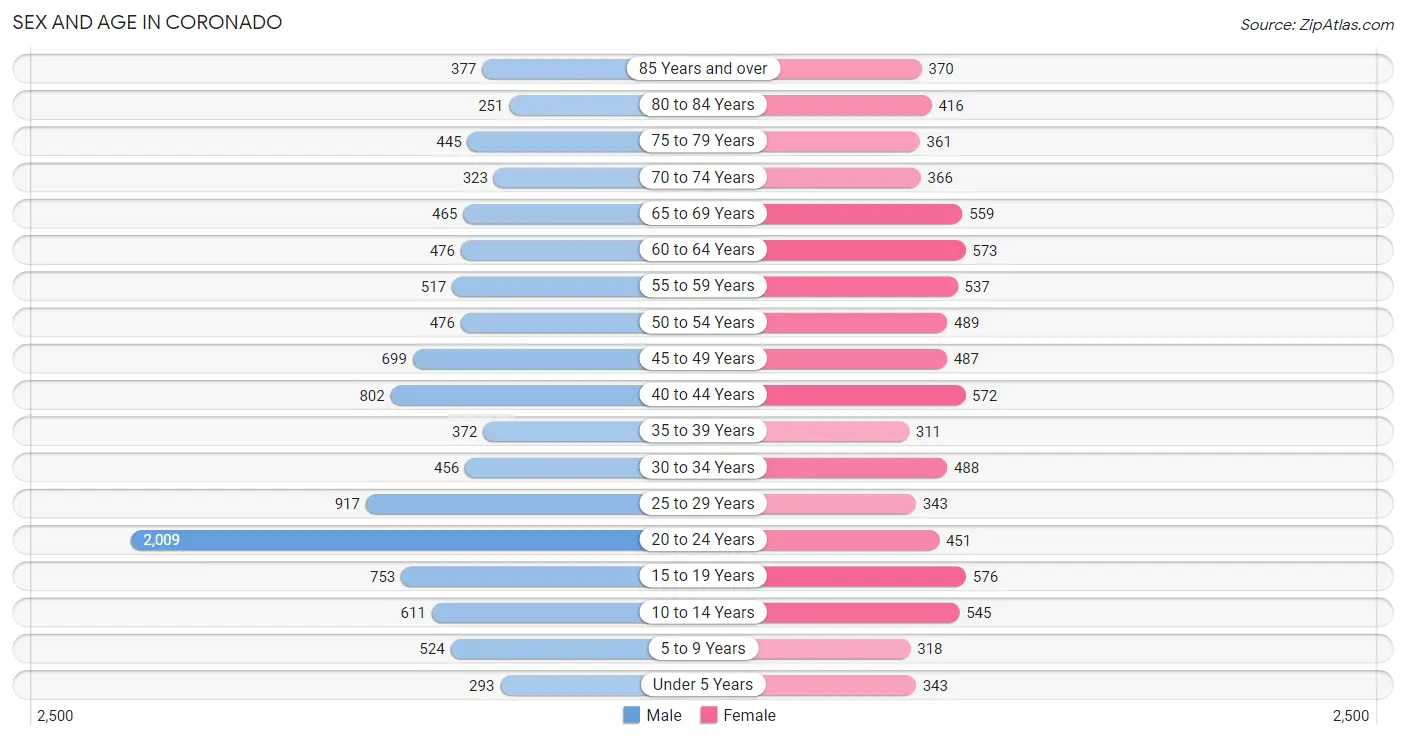
The most populous age groups in Coronado are 20 to 24 Years (2,009 | 18.7%) for men and 15 to 19 Years (576 | 7.1%) for women.
| Age Bracket | Male | Female |
| Under 5 Years | 293 (2.7%) | 343 (4.2%) |
| 5 to 9 Years | 524 (4.9%) | 318 (3.9%) |
| 10 to 14 Years | 611 (5.7%) | 545 (6.7%) |
| 15 to 19 Years | 753 (7.0%) | 576 (7.1%) |
| 20 to 24 Years | 2,009 (18.7%) | 451 (5.6%) |
| 25 to 29 Years | 917 (8.5%) | 343 (4.2%) |
| 30 to 34 Years | 456 (4.2%) | 488 (6.0%) |
| 35 to 39 Years | 372 (3.5%) | 311 (3.8%) |
| 40 to 44 Years | 802 (7.4%) | 572 (7.1%) |
| 45 to 49 Years | 699 (6.5%) | 487 (6.0%) |
| 50 to 54 Years | 476 (4.4%) | 489 (6.0%) |
| 55 to 59 Years | 517 (4.8%) | 537 (6.6%) |
| 60 to 64 Years | 476 (4.4%) | 573 (7.1%) |
| 65 to 69 Years | 465 (4.3%) | 559 (6.9%) |
| 70 to 74 Years | 323 (3.0%) | 366 (4.5%) |
| 75 to 79 Years | 445 (4.1%) | 361 (4.4%) |
| 80 to 84 Years | 251 (2.3%) | 416 (5.1%) |
| 85 Years and over | 377 (3.5%) | 370 (4.6%) |
| Total | 10,766 (100.0%) | 8,105 (100.0%) |
Families and Households in Coronado
Median Family Size in Coronado
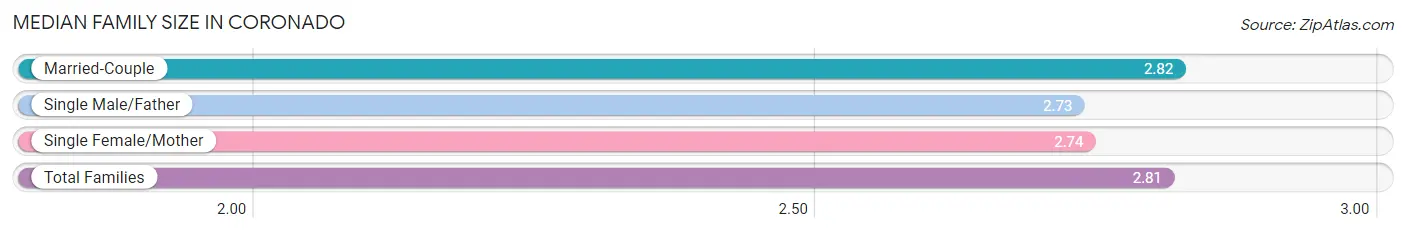
The median family size in Coronado is 2.81 persons per family, with married-couple families (3,993 | 85.8%) accounting for the largest median family size of 2.82 persons per family. On the other hand, single male/father families (131 | 2.8%) represent the smallest median family size with 2.73 persons per family.
| Family Type | # Families | Family Size |
| Married-Couple | 3,993 (85.8%) | 2.82 |
| Single Male/Father | 131 (2.8%) | 2.73 |
| Single Female/Mother | 530 (11.4%) | 2.74 |
| Total Families | 4,654 (100.0%) | 2.81 |
Median Household Size in Coronado
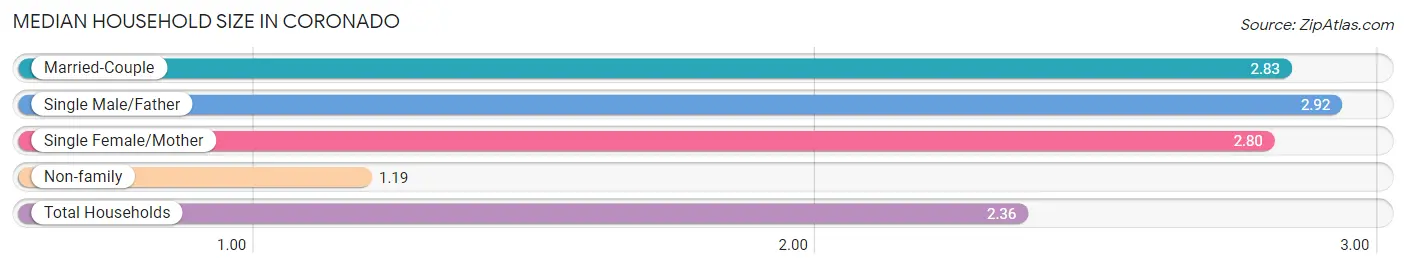
The median household size in Coronado is 2.36 persons per household, with single male/father households (131 | 2.0%) accounting for the largest median household size of 2.92 persons per household. non-family households (1,895 | 28.9%) represent the smallest median household size with 1.19 persons per household.
| Household Type | # Households | Household Size |
| Married-Couple | 3,993 (61.0%) | 2.83 |
| Single Male/Father | 131 (2.0%) | 2.92 |
| Single Female/Mother | 530 (8.1%) | 2.80 |
| Non-family | 1,895 (28.9%) | 1.19 |
| Total Households | 6,549 (100.0%) | 2.36 |
Household Size by Marriage Status in Coronado
Out of a total of 6,549 households in Coronado, 4,654 (71.1%) are family households, while 1,895 (28.9%) are nonfamily households. The most numerous type of family households are 2-person households, comprising 2,627, and the most common type of nonfamily households are 1-person households, comprising 1,612.
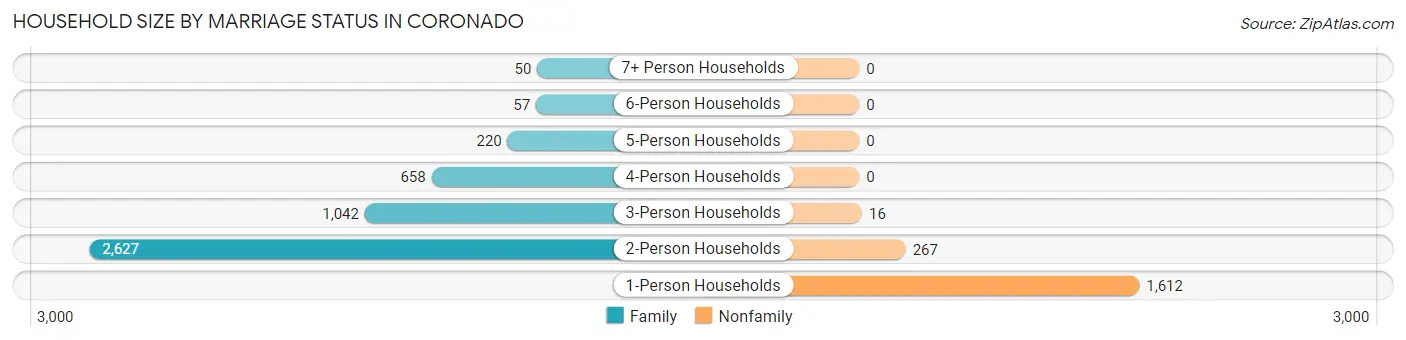
| Household Size | Family Households | Nonfamily Households |
| 1-Person Households | - | 1,612 (24.6%) |
| 2-Person Households | 2,627 (40.1%) | 267 (4.1%) |
| 3-Person Households | 1,042 (15.9%) | 16 (0.2%) |
| 4-Person Households | 658 (10.1%) | 0 (0.0%) |
| 5-Person Households | 220 (3.4%) | 0 (0.0%) |
| 6-Person Households | 57 (0.9%) | 0 (0.0%) |
| 7+ Person Households | 50 (0.8%) | 0 (0.0%) |
| Total | 4,654 (71.1%) | 1,895 (28.9%) |
Female Fertility in Coronado
Fertility by Age in Coronado
Average fertility rate in Coronado is 42.0 births per 1,000 women. Women in the age bracket of 20 to 34 years have the highest fertility rate with 71.0 births per 1,000 women. Women in the age bracket of 20 to 34 years acount for 64.1% of all women with births.
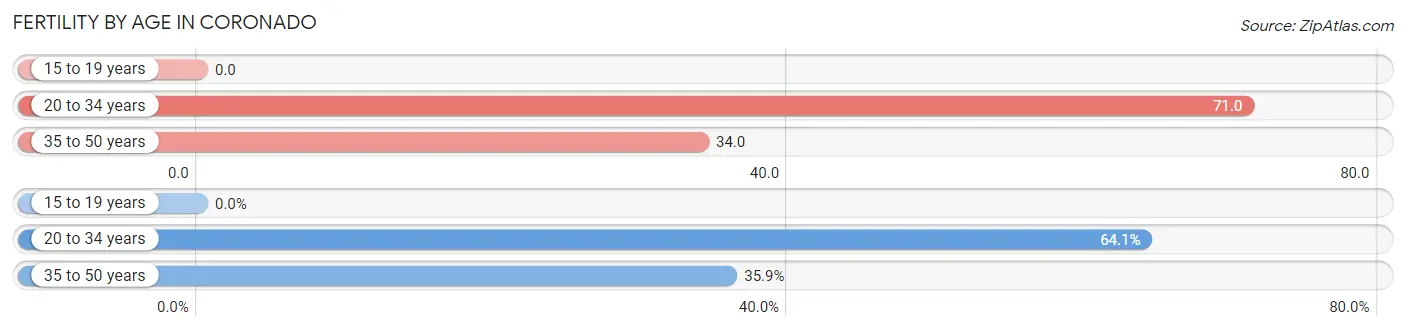
| Age Bracket | Women with Births | Births / 1,000 Women |
| 15 to 19 years | 0 (0.0%) | 0.0 |
| 20 to 34 years | 91 (64.1%) | 71.0 |
| 35 to 50 years | 51 (35.9%) | 34.0 |
| Total | 142 (100.0%) | 42.0 |
Fertility by Age by Marriage Status in Coronado
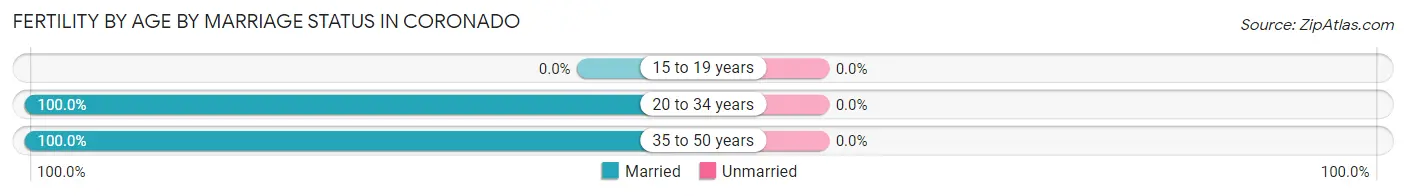
| Age Bracket | Married | Unmarried |
| 15 to 19 years | 0 (0.0%) | 0 (0.0%) |
| 20 to 34 years | 91 (100.0%) | 0 (0.0%) |
| 35 to 50 years | 51 (100.0%) | 0 (0.0%) |
| Total | 142 (100.0%) | 0 (0.0%) |
Fertility by Education in Coronado
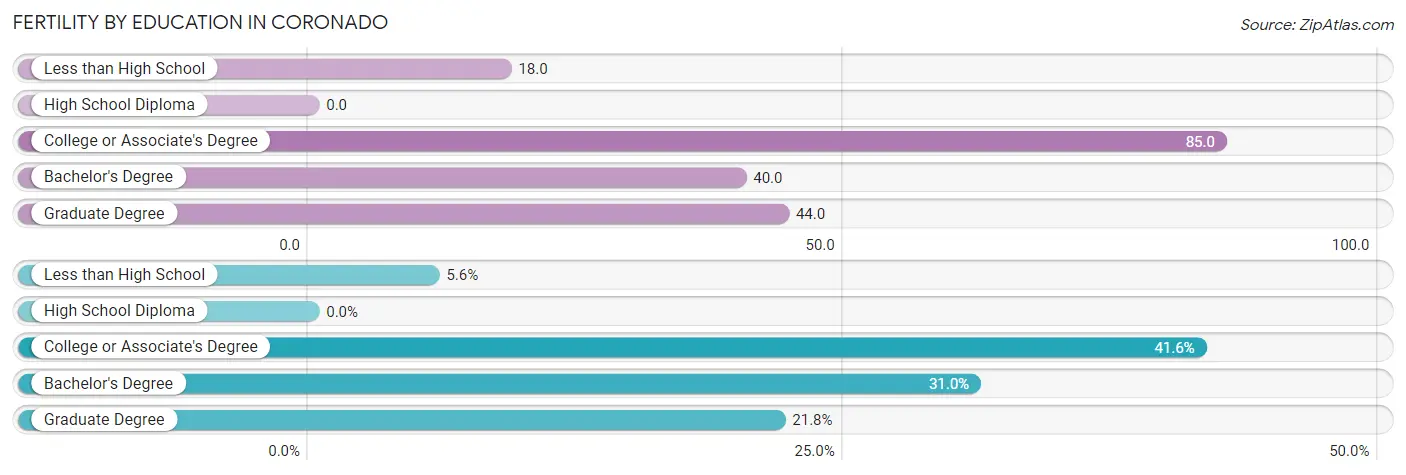
| Educational Attainment | Women with Births | Births / 1,000 Women |
| Less than High School | 8 (5.6%) | 18.0 |
| High School Diploma | 0 (0.0%) | 0.0 |
| College or Associate's Degree | 59 (41.5%) | 85.0 |
| Bachelor's Degree | 44 (31.0%) | 40.0 |
| Graduate Degree | 31 (21.8%) | 44.0 |
| Total | 142 (100.0%) | 42.0 |
Fertility by Education by Marriage Status in Coronado
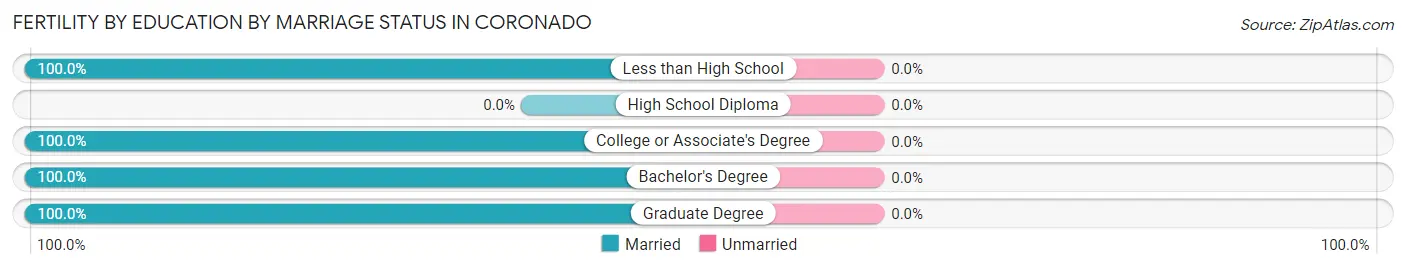
| Educational Attainment | Married | Unmarried |
| Less than High School | 8 (100.0%) | 0 (0.0%) |
| High School Diploma | 0 (0.0%) | 0 (0.0%) |
| College or Associate's Degree | 59 (100.0%) | 0 (0.0%) |
| Bachelor's Degree | 44 (100.0%) | 0 (0.0%) |
| Graduate Degree | 31 (100.0%) | 0 (0.0%) |
| Total | 142 (100.0%) | 0 (0.0%) |
Employment Characteristics in Coronado
Employment by Class of Employer in Coronado
Among the 9,920 employed individuals in Coronado, federal government employees (4,270 | 43.0%), private company employees (3,086 | 31.1%), and self-employed (not incorporated) (737 | 7.4%) make up the most common classes of employment.
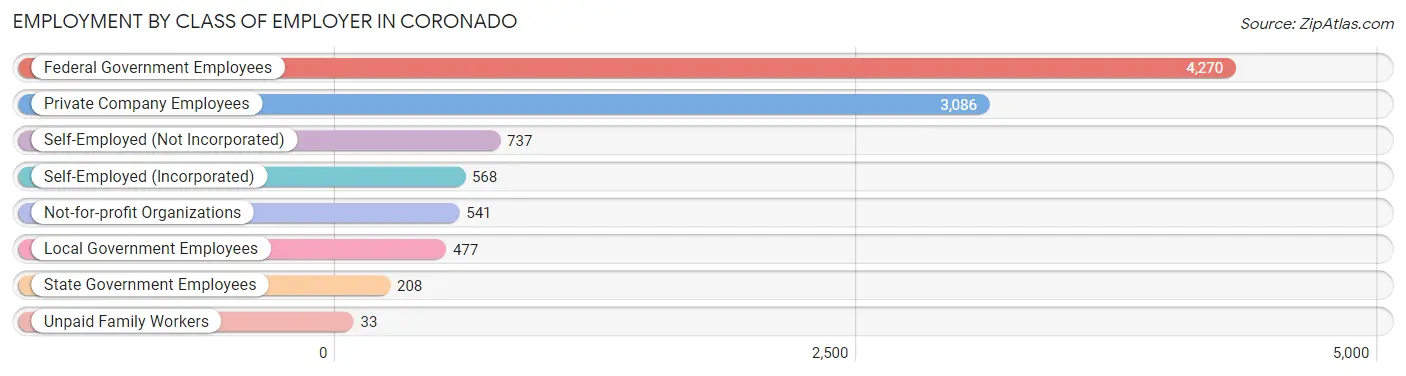
| Employer Class | # Employees | % Employees |
| Private Company Employees | 3,086 | 31.1% |
| Self-Employed (Incorporated) | 568 | 5.7% |
| Self-Employed (Not Incorporated) | 737 | 7.4% |
| Not-for-profit Organizations | 541 | 5.4% |
| Local Government Employees | 477 | 4.8% |
| State Government Employees | 208 | 2.1% |
| Federal Government Employees | 4,270 | 43.0% |
| Unpaid Family Workers | 33 | 0.3% |
| Total | 9,920 | 100.0% |
Employment Status by Age in Coronado
According to the labor force statistics for Coronado, out of the total population over 16 years of age (16,064), 65.1% or 10,458 individuals are in the labor force, with 5.0% or 523 of them unemployed. The age group with the highest labor force participation rate is 25 to 29 years, with 95.3% or 1,201 individuals in the labor force. Within the labor force, the 75 years and over age range has the highest percentage of unemployed individuals, with 17.3% or 24 of them being unemployed.
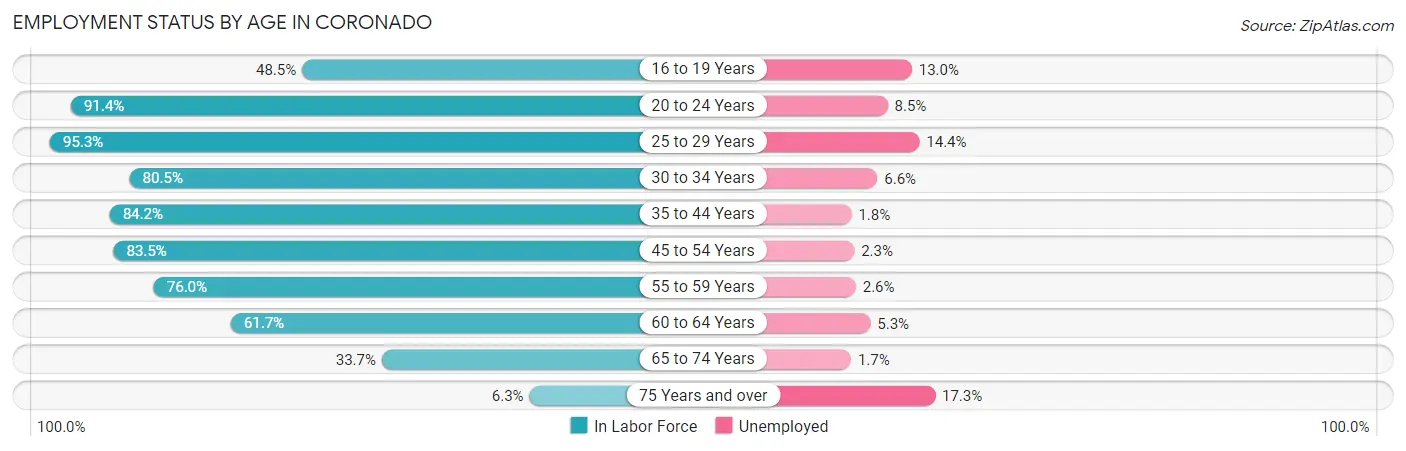
| Age Bracket | In Labor Force | Unemployed |
| 16 to 19 Years | 561 (48.5%) | 73 (13.0%) |
| 20 to 24 Years | 2,248 (91.4%) | 191 (8.5%) |
| 25 to 29 Years | 1,201 (95.3%) | 173 (14.4%) |
| 30 to 34 Years | 760 (80.5%) | 50 (6.6%) |
| 35 to 44 Years | 1,732 (84.2%) | 31 (1.8%) |
| 45 to 54 Years | 1,796 (83.5%) | 41 (2.3%) |
| 55 to 59 Years | 801 (76.0%) | 21 (2.6%) |
| 60 to 64 Years | 647 (61.7%) | 34 (5.3%) |
| 65 to 74 Years | 577 (33.7%) | 10 (1.7%) |
| 75 Years and over | 140 (6.3%) | 24 (17.3%) |
| Total | 10,458 (65.1%) | 523 (5.0%) |
Employment Status by Educational Attainment in Coronado
According to labor force statistics for Coronado, 81.5% of individuals (6,940) out of the total population between 25 and 64 years of age (8,515) are in the labor force, with 4.5% or 312 of them being unemployed. The group with the highest labor force participation rate are those with the educational attainment of bachelor's degree or higher, with 83.2% or 4,429 individuals in the labor force. Within the labor force, individuals with less than high school education have the highest percentage of unemployment, with 20.8% or 32 of them being unemployed.
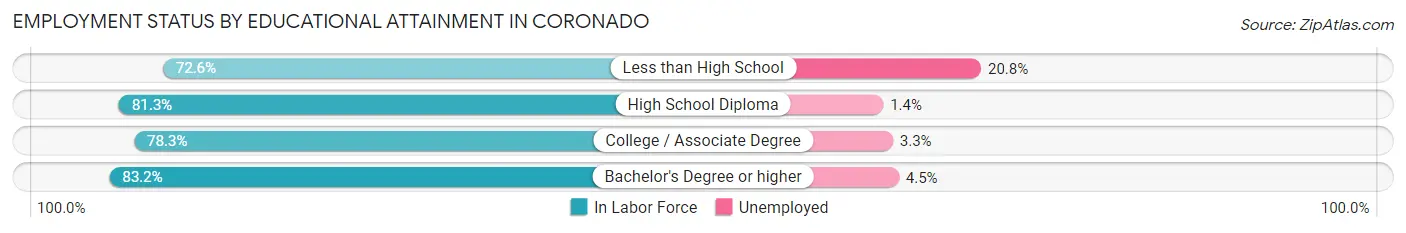
| Educational Attainment | In Labor Force | Unemployed |
| Less than High School | 154 (72.6%) | 44 (20.8%) |
| High School Diploma | 570 (81.3%) | 10 (1.4%) |
| College / Associate Degree | 1,784 (78.3%) | 75 (3.3%) |
| Bachelor's Degree or higher | 4,429 (83.2%) | 240 (4.5%) |
| Total | 6,940 (81.5%) | 383 (4.5%) |
Employment Occupations by Sex in Coronado
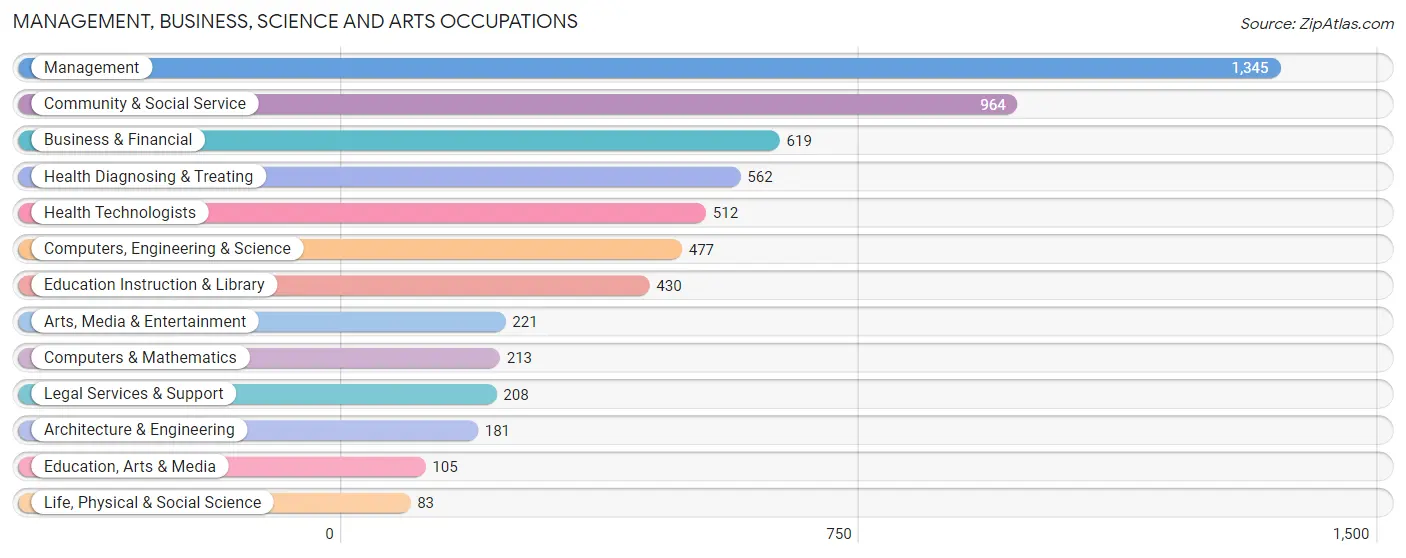
Management, Business, Science and Arts Occupations
The most common Management, Business, Science and Arts occupations in Coronado are Management (1,345 | 21.5%), Community & Social Service (964 | 15.4%), Business & Financial (619 | 9.9%), Health Diagnosing & Treating (562 | 9.0%), and Health Technologists (512 | 8.2%).
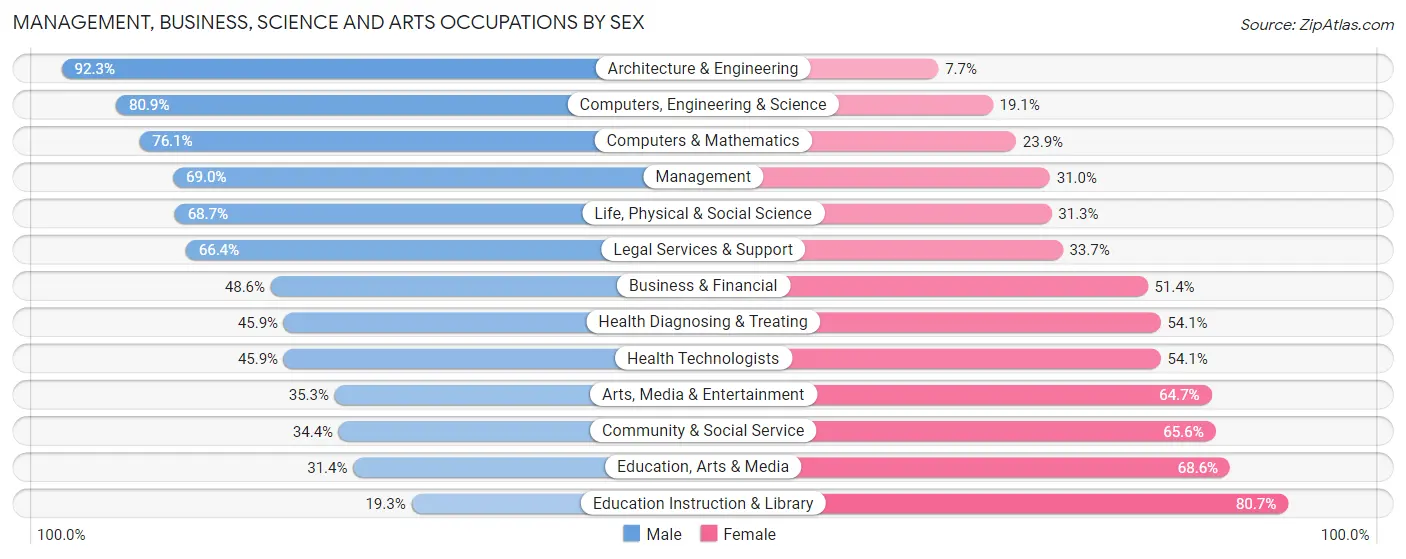
Management, Business, Science and Arts Occupations by Sex
Within the Management, Business, Science and Arts occupations in Coronado, the most male-oriented occupations are Architecture & Engineering (92.3%), Computers, Engineering & Science (80.9%), and Computers & Mathematics (76.1%), while the most female-oriented occupations are Education Instruction & Library (80.7%), Education, Arts & Media (68.6%), and Community & Social Service (65.6%).
| Occupation | Male | Female |
| Management | 928 (69.0%) | 417 (31.0%) |
| Business & Financial | 301 (48.6%) | 318 (51.4%) |
| Computers, Engineering & Science | 386 (80.9%) | 91 (19.1%) |
| Computers & Mathematics | 162 (76.1%) | 51 (23.9%) |
| Architecture & Engineering | 167 (92.3%) | 14 (7.7%) |
| Life, Physical & Social Science | 57 (68.7%) | 26 (31.3%) |
| Community & Social Service | 332 (34.4%) | 632 (65.6%) |
| Education, Arts & Media | 33 (31.4%) | 72 (68.6%) |
| Legal Services & Support | 138 (66.3%) | 70 (33.7%) |
| Education Instruction & Library | 83 (19.3%) | 347 (80.7%) |
| Arts, Media & Entertainment | 78 (35.3%) | 143 (64.7%) |
| Health Diagnosing & Treating | 258 (45.9%) | 304 (54.1%) |
| Health Technologists | 235 (45.9%) | 277 (54.1%) |
| Total (Category) | 2,205 (55.6%) | 1,762 (44.4%) |
| Total (Overall) | 3,302 (52.8%) | 2,951 (47.2%) |
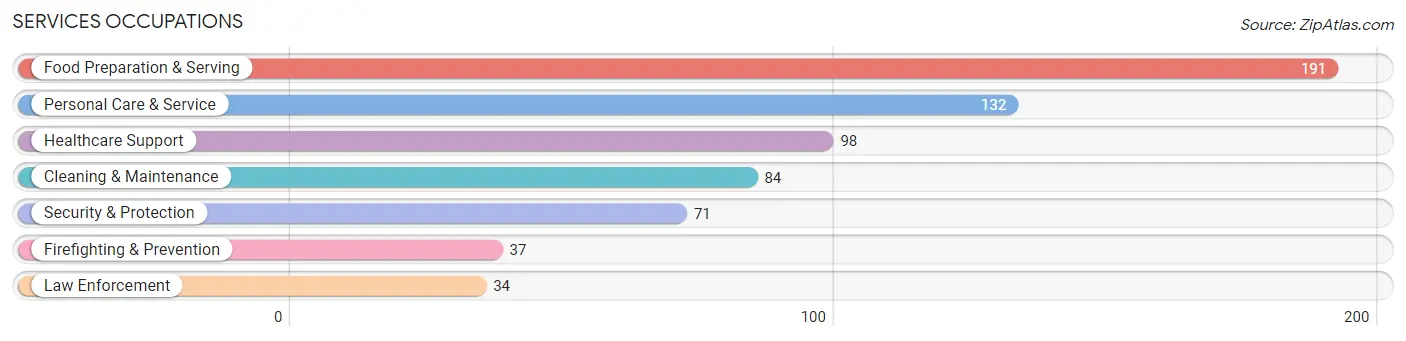
Services Occupations
The most common Services occupations in Coronado are Food Preparation & Serving (191 | 3.0%), Personal Care & Service (132 | 2.1%), Healthcare Support (98 | 1.6%), Cleaning & Maintenance (84 | 1.3%), and Security & Protection (71 | 1.1%).
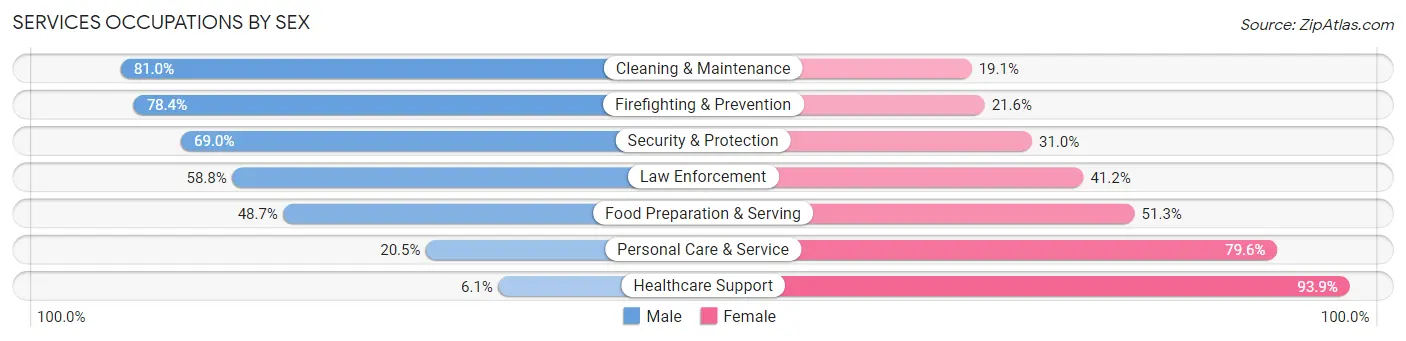
Services Occupations by Sex
Within the Services occupations in Coronado, the most male-oriented occupations are Cleaning & Maintenance (80.9%), Firefighting & Prevention (78.4%), and Security & Protection (69.0%), while the most female-oriented occupations are Healthcare Support (93.9%), Personal Care & Service (79.5%), and Food Preparation & Serving (51.3%).
| Occupation | Male | Female |
| Healthcare Support | 6 (6.1%) | 92 (93.9%) |
| Security & Protection | 49 (69.0%) | 22 (31.0%) |
| Firefighting & Prevention | 29 (78.4%) | 8 (21.6%) |
| Law Enforcement | 20 (58.8%) | 14 (41.2%) |
| Food Preparation & Serving | 93 (48.7%) | 98 (51.3%) |
| Cleaning & Maintenance | 68 (80.9%) | 16 (19.1%) |
| Personal Care & Service | 27 (20.4%) | 105 (79.5%) |
| Total (Category) | 243 (42.2%) | 333 (57.8%) |
| Total (Overall) | 3,302 (52.8%) | 2,951 (47.2%) |
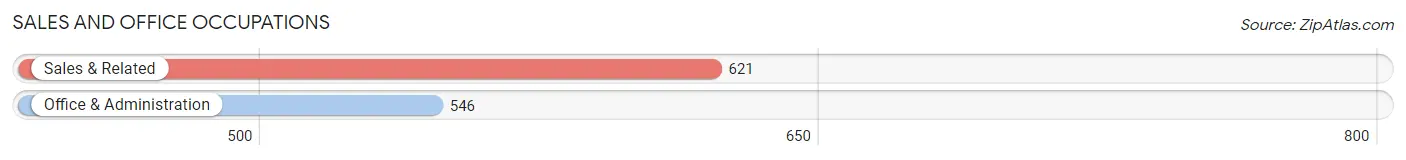
Sales and Office Occupations
The most common Sales and Office occupations in Coronado are Sales & Related (621 | 9.9%), and Office & Administration (546 | 8.7%).
Sales and Office Occupations by Sex
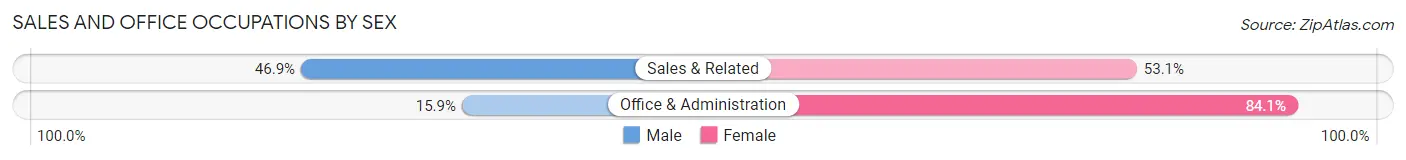
| Occupation | Male | Female |
| Sales & Related | 291 (46.9%) | 330 (53.1%) |
| Office & Administration | 87 (15.9%) | 459 (84.1%) |
| Total (Category) | 378 (32.4%) | 789 (67.6%) |
| Total (Overall) | 3,302 (52.8%) | 2,951 (47.2%) |
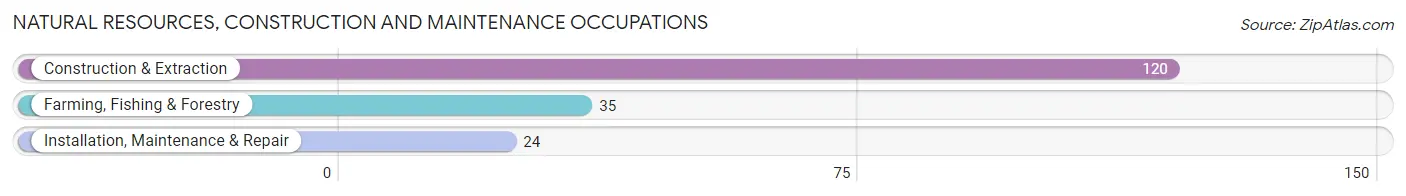
Natural Resources, Construction and Maintenance Occupations
The most common Natural Resources, Construction and Maintenance occupations in Coronado are Construction & Extraction (120 | 1.9%), Farming, Fishing & Forestry (35 | 0.6%), and Installation, Maintenance & Repair (24 | 0.4%).
Natural Resources, Construction and Maintenance Occupations by Sex
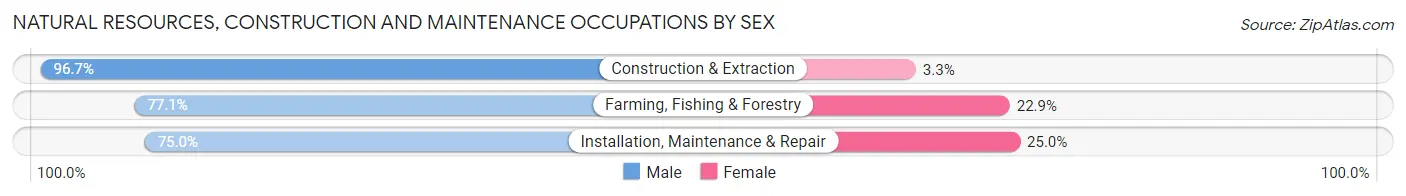
| Occupation | Male | Female |
| Farming, Fishing & Forestry | 27 (77.1%) | 8 (22.9%) |
| Construction & Extraction | 116 (96.7%) | 4 (3.3%) |
| Installation, Maintenance & Repair | 18 (75.0%) | 6 (25.0%) |
| Total (Category) | 161 (89.9%) | 18 (10.1%) |
| Total (Overall) | 3,302 (52.8%) | 2,951 (47.2%) |
Production, Transportation and Moving Occupations
The most common Production, Transportation and Moving occupations in Coronado are Transportation (164 | 2.6%), Material Moving (122 | 1.9%), and Production (78 | 1.3%).
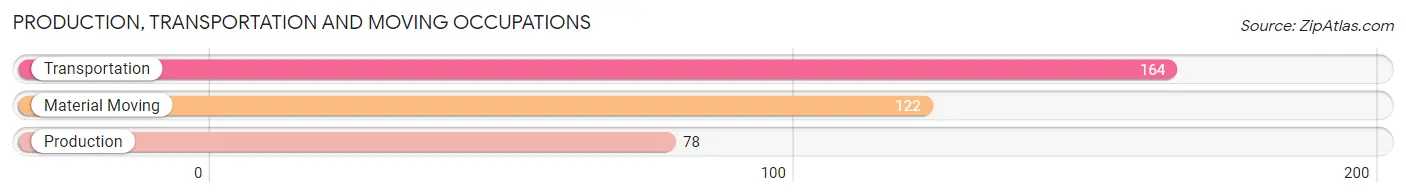
Production, Transportation and Moving Occupations by Sex
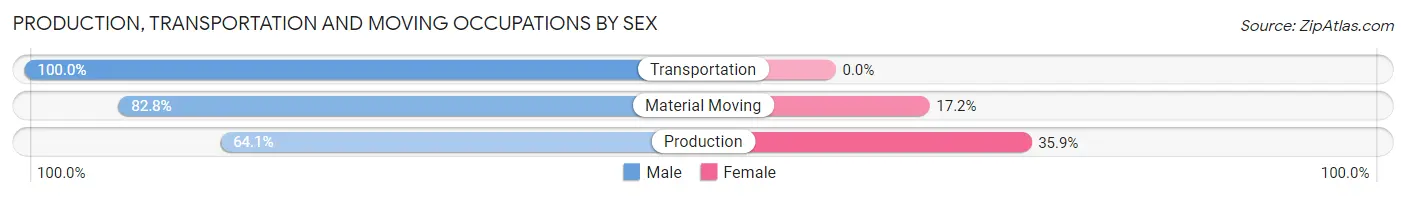
| Occupation | Male | Female |
| Production | 50 (64.1%) | 28 (35.9%) |
| Transportation | 164 (100.0%) | 0 (0.0%) |
| Material Moving | 101 (82.8%) | 21 (17.2%) |
| Total (Category) | 315 (86.5%) | 49 (13.5%) |
| Total (Overall) | 3,302 (52.8%) | 2,951 (47.2%) |
Employment Industries by Sex in Coronado
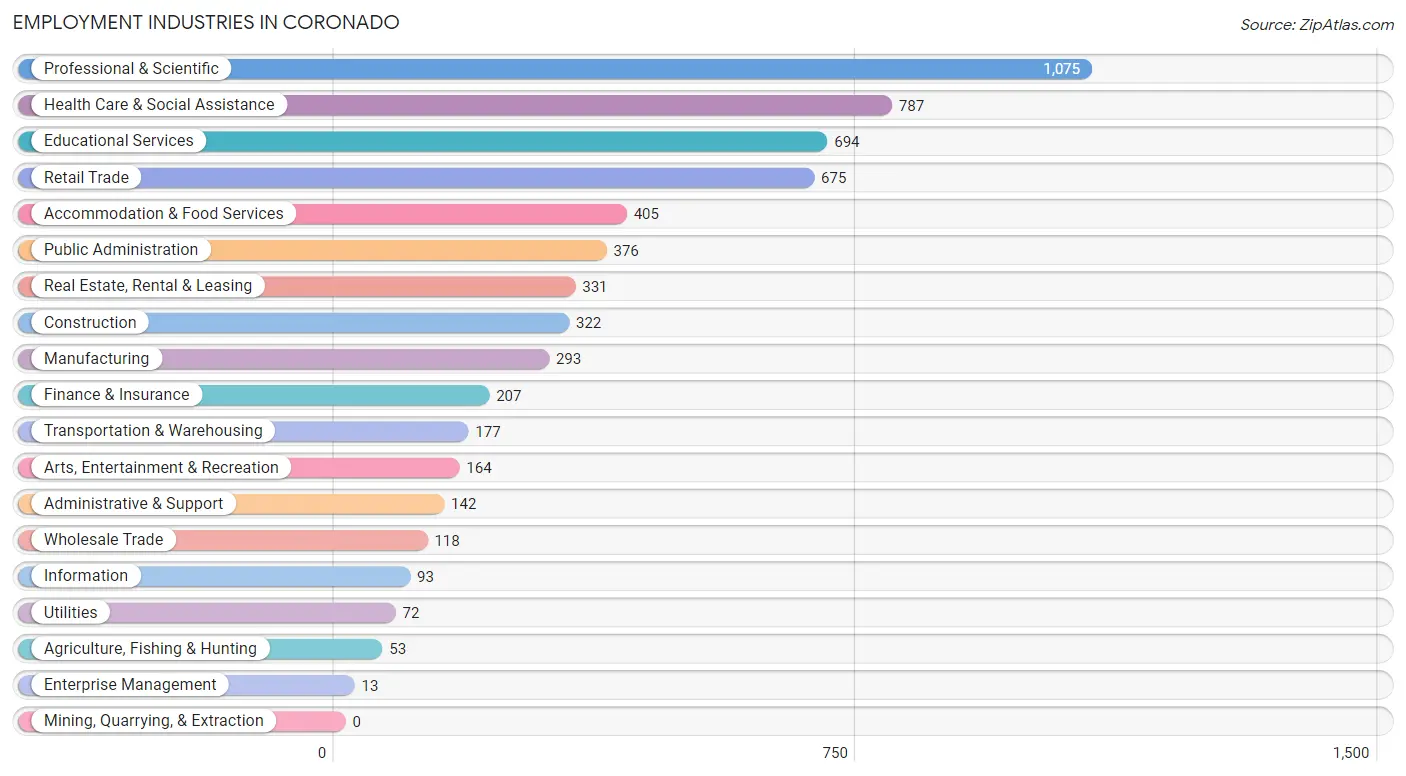
Employment Industries in Coronado
The major employment industries in Coronado include Professional & Scientific (1,075 | 17.2%), Health Care & Social Assistance (787 | 12.6%), Educational Services (694 | 11.1%), Retail Trade (675 | 10.8%), and Accommodation & Food Services (405 | 6.5%).
Employment Industries by Sex in Coronado
The Coronado industries that see more men than women are Enterprise Management (100.0%), Transportation & Warehousing (95.5%), and Construction (94.7%), whereas the industries that tend to have a higher number of women are Educational Services (74.8%), Arts, Entertainment & Recreation (65.2%), and Health Care & Social Assistance (62.8%).
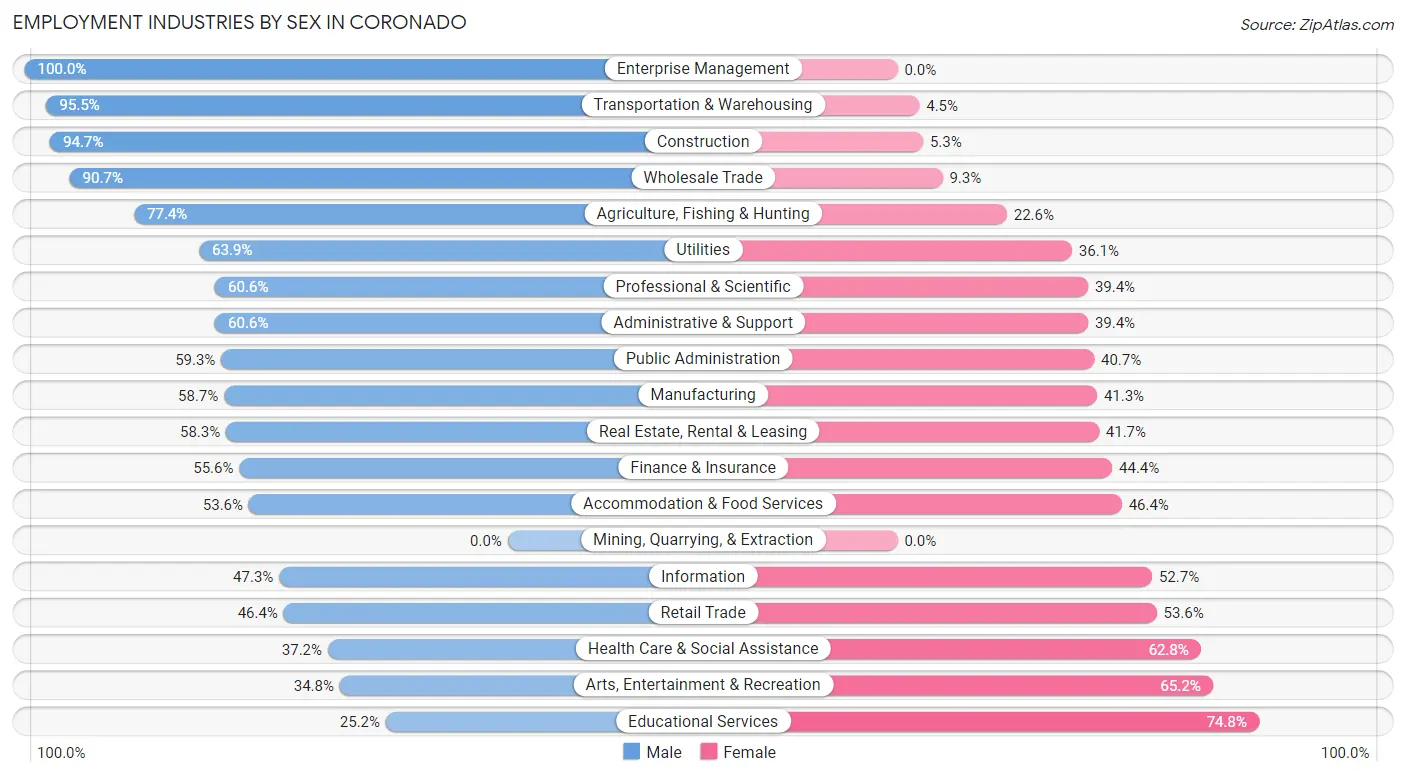
| Industry | Male | Female |
| Agriculture, Fishing & Hunting | 41 (77.4%) | 12 (22.6%) |
| Mining, Quarrying, & Extraction | 0 (0.0%) | 0 (0.0%) |
| Construction | 305 (94.7%) | 17 (5.3%) |
| Manufacturing | 172 (58.7%) | 121 (41.3%) |
| Wholesale Trade | 107 (90.7%) | 11 (9.3%) |
| Retail Trade | 313 (46.4%) | 362 (53.6%) |
| Transportation & Warehousing | 169 (95.5%) | 8 (4.5%) |
| Utilities | 46 (63.9%) | 26 (36.1%) |
| Information | 44 (47.3%) | 49 (52.7%) |
| Finance & Insurance | 115 (55.6%) | 92 (44.4%) |
| Real Estate, Rental & Leasing | 193 (58.3%) | 138 (41.7%) |
| Professional & Scientific | 651 (60.6%) | 424 (39.4%) |
| Enterprise Management | 13 (100.0%) | 0 (0.0%) |
| Administrative & Support | 86 (60.6%) | 56 (39.4%) |
| Educational Services | 175 (25.2%) | 519 (74.8%) |
| Health Care & Social Assistance | 293 (37.2%) | 494 (62.8%) |
| Arts, Entertainment & Recreation | 57 (34.8%) | 107 (65.2%) |
| Accommodation & Food Services | 217 (53.6%) | 188 (46.4%) |
| Public Administration | 223 (59.3%) | 153 (40.7%) |
| Total | 3,302 (52.8%) | 2,951 (47.2%) |
Education in Coronado
School Enrollment in Coronado
The most common levels of schooling among the 4,058 students in Coronado are high school (940 | 23.2%), college / undergraduate (939 | 23.1%), and middle school (816 | 20.1%).
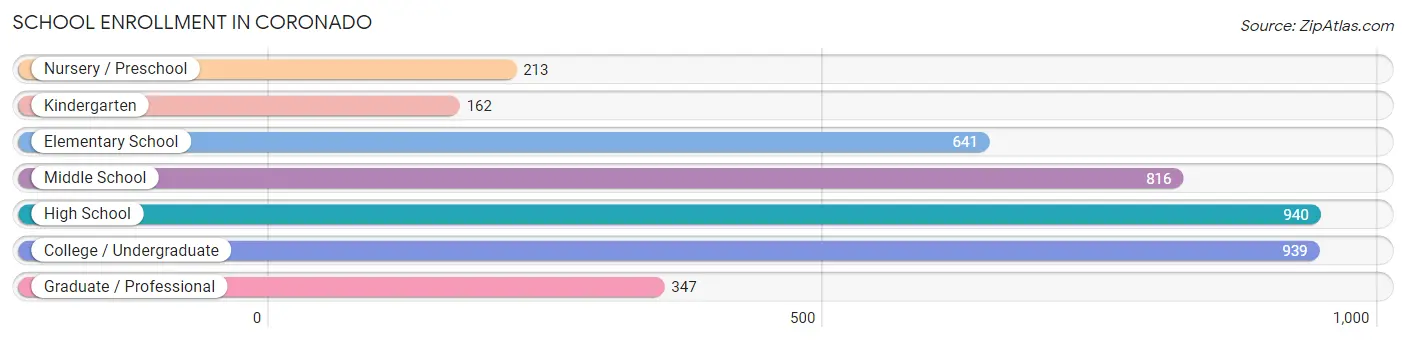
| School Level | # Students | % Students |
| Nursery / Preschool | 213 | 5.2% |
| Kindergarten | 162 | 4.0% |
| Elementary School | 641 | 15.8% |
| Middle School | 816 | 20.1% |
| High School | 940 | 23.2% |
| College / Undergraduate | 939 | 23.1% |
| Graduate / Professional | 347 | 8.6% |
| Total | 4,058 | 100.0% |
School Enrollment by Age by Funding Source in Coronado
Out of a total of 4,058 students who are enrolled in schools in Coronado, 978 (24.1%) attend a private institution, while the remaining 3,080 (75.9%) are enrolled in public schools. The age group of 3 to 4 year olds has the highest likelihood of being enrolled in private schools, with 87 (48.9% in the age bracket) enrolled. Conversely, the age group of 18 to 19 year olds has the lowest likelihood of being enrolled in a private school, with 272 (97.5% in the age bracket) attending a public institution.
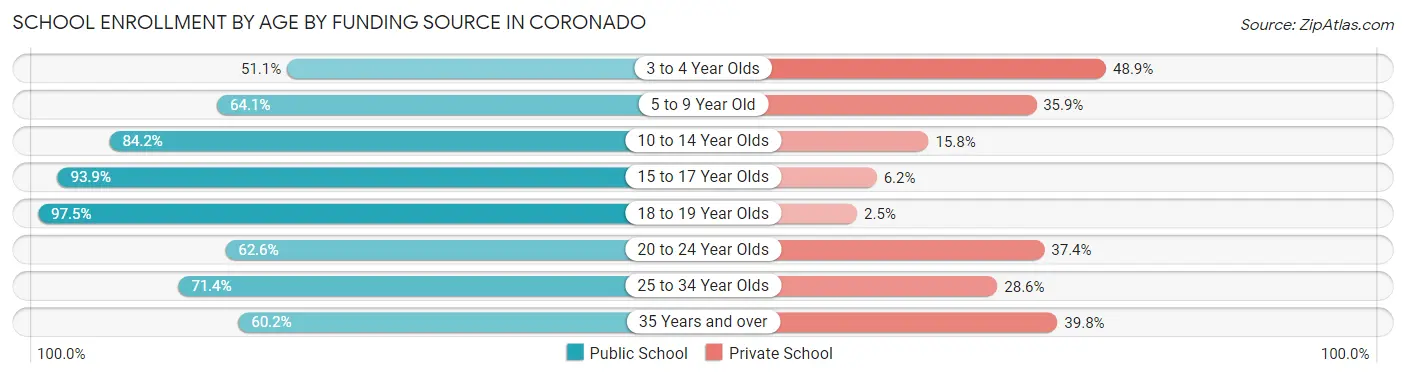
| Age Bracket | Public School | Private School |
| 3 to 4 Year Olds | 91 (51.1%) | 87 (48.9%) |
| 5 to 9 Year Old | 483 (64.1%) | 270 (35.9%) |
| 10 to 14 Year Olds | 948 (84.2%) | 178 (15.8%) |
| 15 to 17 Year Olds | 580 (93.9%) | 38 (6.1%) |
| 18 to 19 Year Olds | 272 (97.5%) | 7 (2.5%) |
| 20 to 24 Year Olds | 263 (62.6%) | 157 (37.4%) |
| 25 to 34 Year Olds | 187 (71.4%) | 75 (28.6%) |
| 35 Years and over | 254 (60.2%) | 168 (39.8%) |
| Total | 3,080 (75.9%) | 978 (24.1%) |
Educational Attainment by Field of Study in Coronado
Business (1,611 | 18.4%), social sciences (1,378 | 15.7%), engineering (791 | 9.0%), science & technology (729 | 8.3%), and bio, nature & agricultural (722 | 8.3%) are the most common fields of study among 8,754 individuals in Coronado who have obtained a bachelor's degree or higher.
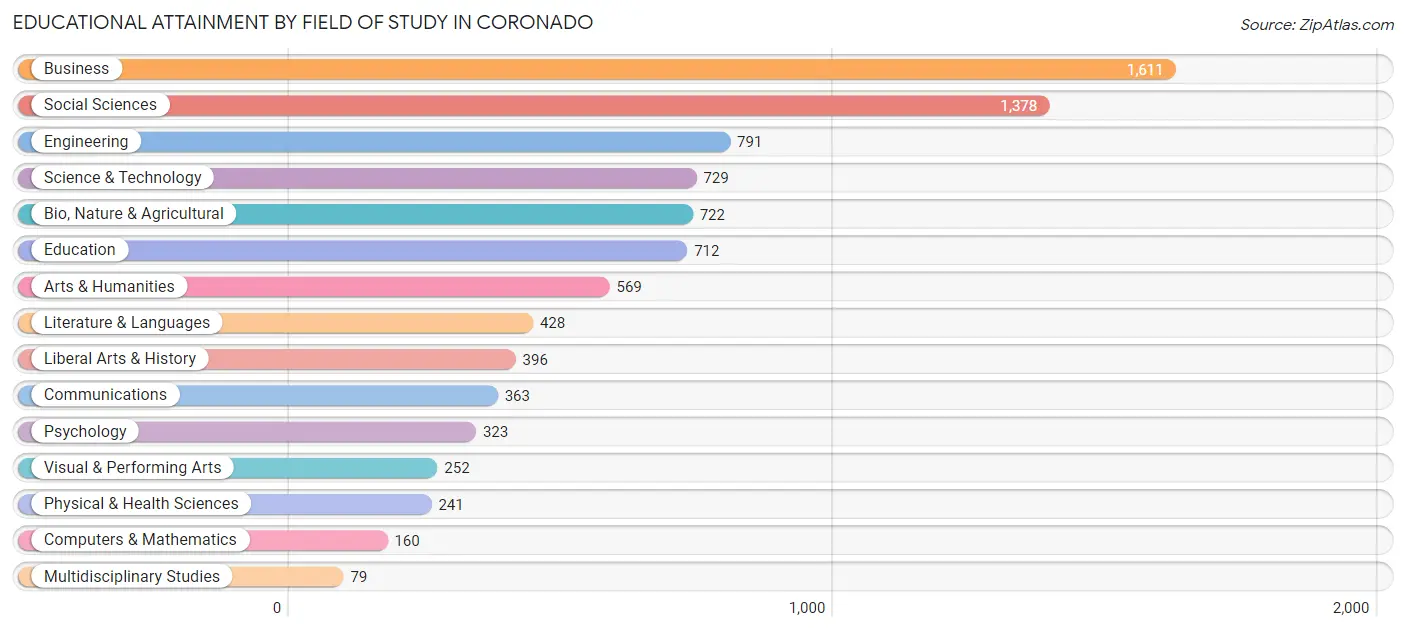
| Field of Study | # Graduates | % Graduates |
| Computers & Mathematics | 160 | 1.8% |
| Bio, Nature & Agricultural | 722 | 8.3% |
| Physical & Health Sciences | 241 | 2.8% |
| Psychology | 323 | 3.7% |
| Social Sciences | 1,378 | 15.7% |
| Engineering | 791 | 9.0% |
| Multidisciplinary Studies | 79 | 0.9% |
| Science & Technology | 729 | 8.3% |
| Business | 1,611 | 18.4% |
| Education | 712 | 8.1% |
| Literature & Languages | 428 | 4.9% |
| Liberal Arts & History | 396 | 4.5% |
| Visual & Performing Arts | 252 | 2.9% |
| Communications | 363 | 4.2% |
| Arts & Humanities | 569 | 6.5% |
| Total | 8,754 | 100.0% |
Transportation & Commute in Coronado
Vehicle Availability by Sex in Coronado
The most prevalent vehicle ownership categories in Coronado are males with 2 vehicles (1,788, accounting for 47.4%) and females with 2 vehicles (1,295, making up 60.2%).
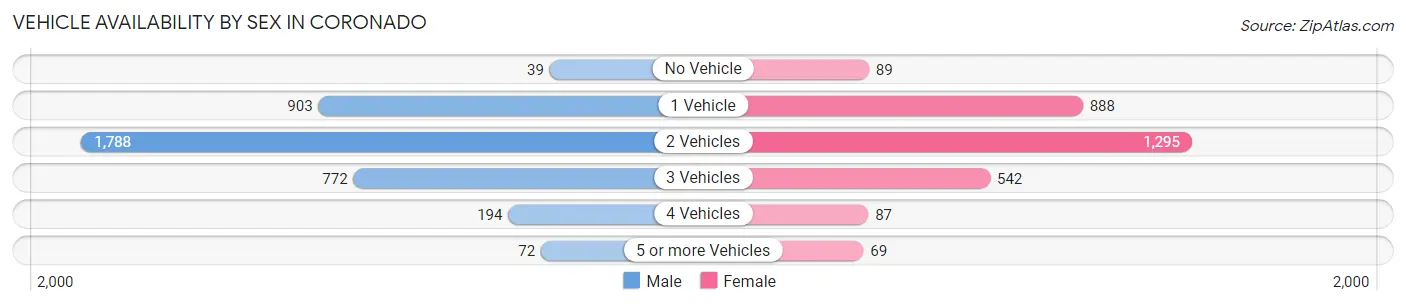
| Vehicles Available | Male | Female |
| No Vehicle | 39 (1.0%) | 89 (3.0%) |
| 1 Vehicle | 903 (24.0%) | 888 (29.9%) |
| 2 Vehicles | 1,788 (47.4%) | 1,295 (43.6%) |
| 3 Vehicles | 772 (20.5%) | 542 (18.2%) |
| 4 Vehicles | 194 (5.1%) | 87 (2.9%) |
| 5 or more Vehicles | 72 (1.9%) | 69 (2.3%) |
| Total | 3,768 (100.0%) | 2,970 (100.0%) |
Commute Time in Coronado
The most frequently occuring commute durations in Coronado are 20 to 24 minutes (1,499 commuters, 18.2%), 5 to 9 minutes (1,446 commuters, 17.6%), and 15 to 19 minutes (1,346 commuters, 16.4%).
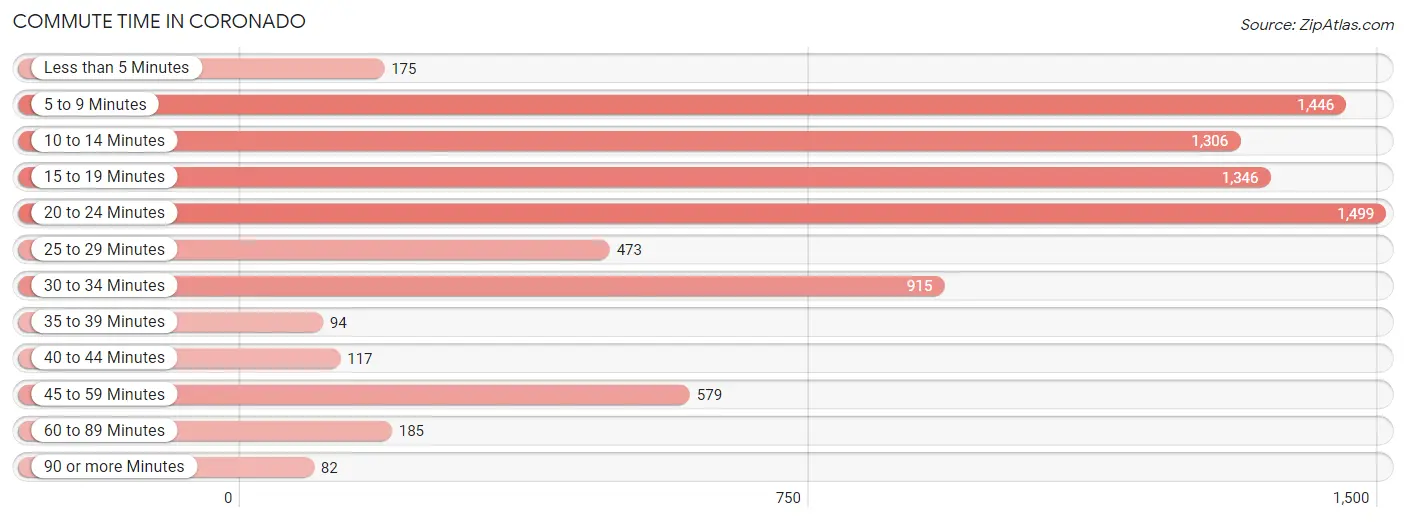
| Commute Time | # Commuters | % Commuters |
| Less than 5 Minutes | 175 | 2.1% |
| 5 to 9 Minutes | 1,446 | 17.6% |
| 10 to 14 Minutes | 1,306 | 15.9% |
| 15 to 19 Minutes | 1,346 | 16.4% |
| 20 to 24 Minutes | 1,499 | 18.2% |
| 25 to 29 Minutes | 473 | 5.8% |
| 30 to 34 Minutes | 915 | 11.1% |
| 35 to 39 Minutes | 94 | 1.1% |
| 40 to 44 Minutes | 117 | 1.4% |
| 45 to 59 Minutes | 579 | 7.0% |
| 60 to 89 Minutes | 185 | 2.2% |
| 90 or more Minutes | 82 | 1.0% |
Commute Time by Sex in Coronado
The most common commute times in Coronado are 5 to 9 minutes (1,100 commuters, 18.6%) for males and 20 to 24 minutes (617 commuters, 26.8%) for females.
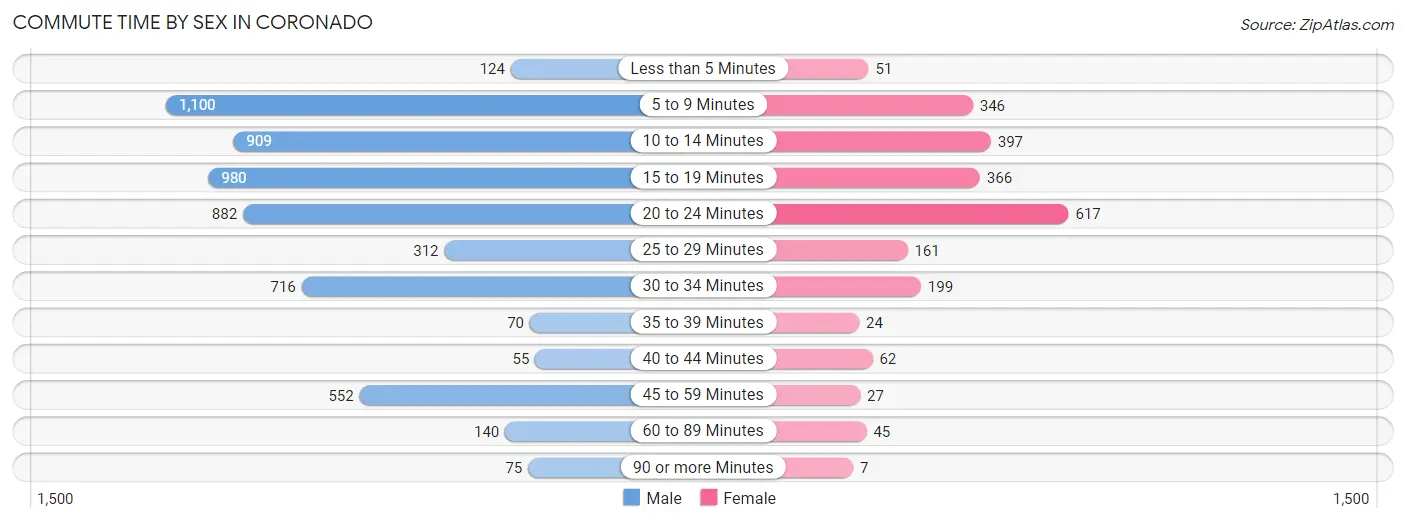
| Commute Time | Male | Female |
| Less than 5 Minutes | 124 (2.1%) | 51 (2.2%) |
| 5 to 9 Minutes | 1,100 (18.6%) | 346 (15.0%) |
| 10 to 14 Minutes | 909 (15.4%) | 397 (17.2%) |
| 15 to 19 Minutes | 980 (16.6%) | 366 (15.9%) |
| 20 to 24 Minutes | 882 (14.9%) | 617 (26.8%) |
| 25 to 29 Minutes | 312 (5.3%) | 161 (7.0%) |
| 30 to 34 Minutes | 716 (12.1%) | 199 (8.6%) |
| 35 to 39 Minutes | 70 (1.2%) | 24 (1.0%) |
| 40 to 44 Minutes | 55 (0.9%) | 62 (2.7%) |
| 45 to 59 Minutes | 552 (9.3%) | 27 (1.2%) |
| 60 to 89 Minutes | 140 (2.4%) | 45 (1.9%) |
| 90 or more Minutes | 75 (1.3%) | 7 (0.3%) |
Time of Departure to Work by Sex in Coronado
The most frequent times of departure to work in Coronado are 6:00 AM to 6:29 AM (802, 13.6%) for males and 8:00 AM to 8:29 AM (377, 16.4%) for females.
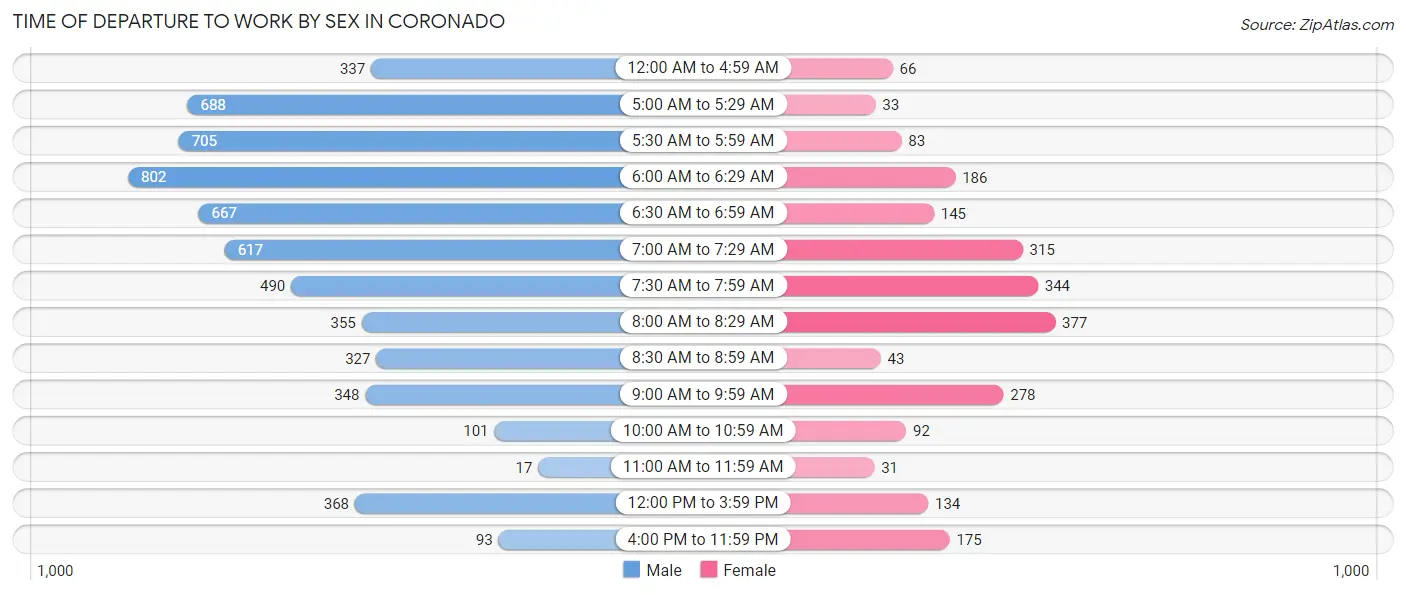
| Time of Departure | Male | Female |
| 12:00 AM to 4:59 AM | 337 (5.7%) | 66 (2.9%) |
| 5:00 AM to 5:29 AM | 688 (11.6%) | 33 (1.4%) |
| 5:30 AM to 5:59 AM | 705 (11.9%) | 83 (3.6%) |
| 6:00 AM to 6:29 AM | 802 (13.6%) | 186 (8.1%) |
| 6:30 AM to 6:59 AM | 667 (11.3%) | 145 (6.3%) |
| 7:00 AM to 7:29 AM | 617 (10.4%) | 315 (13.7%) |
| 7:30 AM to 7:59 AM | 490 (8.3%) | 344 (14.9%) |
| 8:00 AM to 8:29 AM | 355 (6.0%) | 377 (16.4%) |
| 8:30 AM to 8:59 AM | 327 (5.5%) | 43 (1.9%) |
| 9:00 AM to 9:59 AM | 348 (5.9%) | 278 (12.1%) |
| 10:00 AM to 10:59 AM | 101 (1.7%) | 92 (4.0%) |
| 11:00 AM to 11:59 AM | 17 (0.3%) | 31 (1.3%) |
| 12:00 PM to 3:59 PM | 368 (6.2%) | 134 (5.8%) |
| 4:00 PM to 11:59 PM | 93 (1.6%) | 175 (7.6%) |
| Total | 5,915 (100.0%) | 2,302 (100.0%) |
Housing Occupancy in Coronado
Occupancy by Ownership in Coronado
Of the total 6,549 dwellings in Coronado, owner-occupied units account for 3,554 (54.3%), while renter-occupied units make up 2,995 (45.7%).
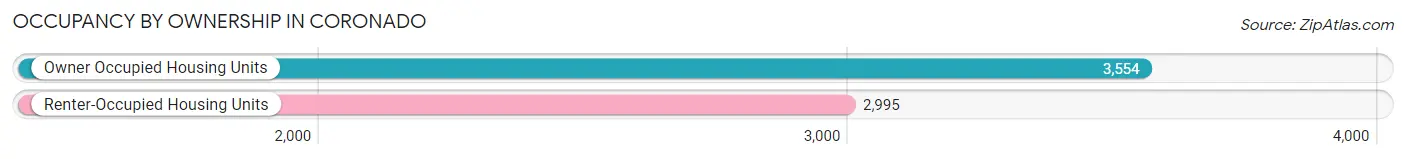
| Occupancy | # Housing Units | % Housing Units |
| Owner Occupied Housing Units | 3,554 | 54.3% |
| Renter-Occupied Housing Units | 2,995 | 45.7% |
| Total Occupied Housing Units | 6,549 | 100.0% |
Occupancy by Household Size in Coronado
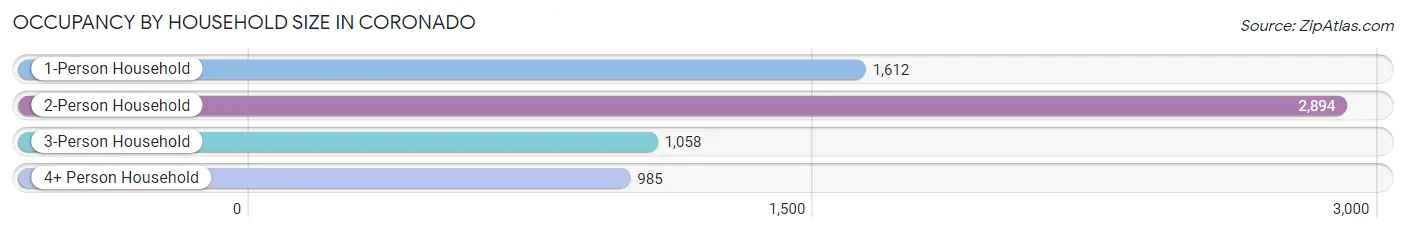
| Household Size | # Housing Units | % Housing Units |
| 1-Person Household | 1,612 | 24.6% |
| 2-Person Household | 2,894 | 44.2% |
| 3-Person Household | 1,058 | 16.2% |
| 4+ Person Household | 985 | 15.0% |
| Total Housing Units | 6,549 | 100.0% |
Occupancy by Ownership by Household Size in Coronado
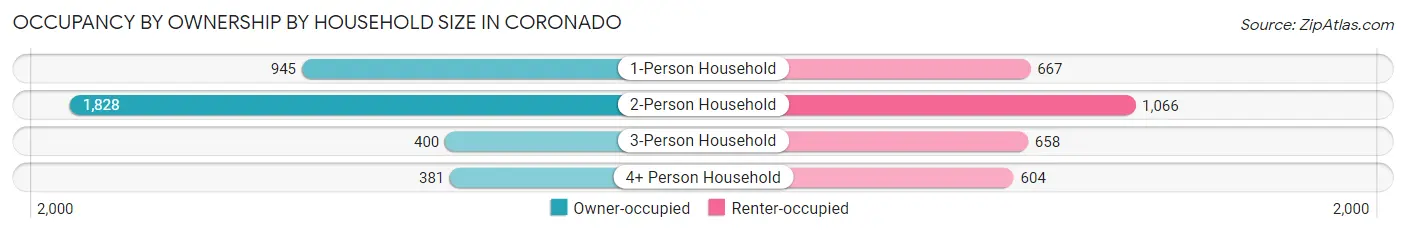
| Household Size | Owner-occupied | Renter-occupied |
| 1-Person Household | 945 (58.6%) | 667 (41.4%) |
| 2-Person Household | 1,828 (63.2%) | 1,066 (36.8%) |
| 3-Person Household | 400 (37.8%) | 658 (62.2%) |
| 4+ Person Household | 381 (38.7%) | 604 (61.3%) |
| Total Housing Units | 3,554 (54.3%) | 2,995 (45.7%) |
Occupancy by Educational Attainment in Coronado
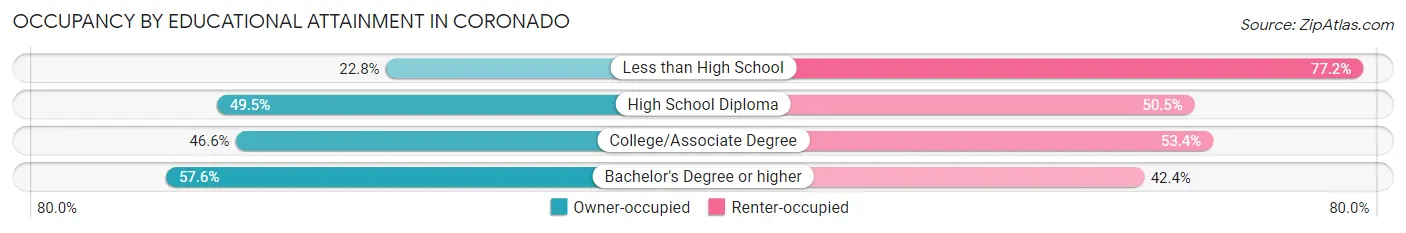
| Household Size | Owner-occupied | Renter-occupied |
| Less than High School | 23 (22.8%) | 78 (77.2%) |
| High School Diploma | 248 (49.5%) | 253 (50.5%) |
| College/Associate Degree | 595 (46.6%) | 683 (53.4%) |
| Bachelor's Degree or higher | 2,688 (57.6%) | 1,981 (42.4%) |
Occupancy by Age of Householder in Coronado
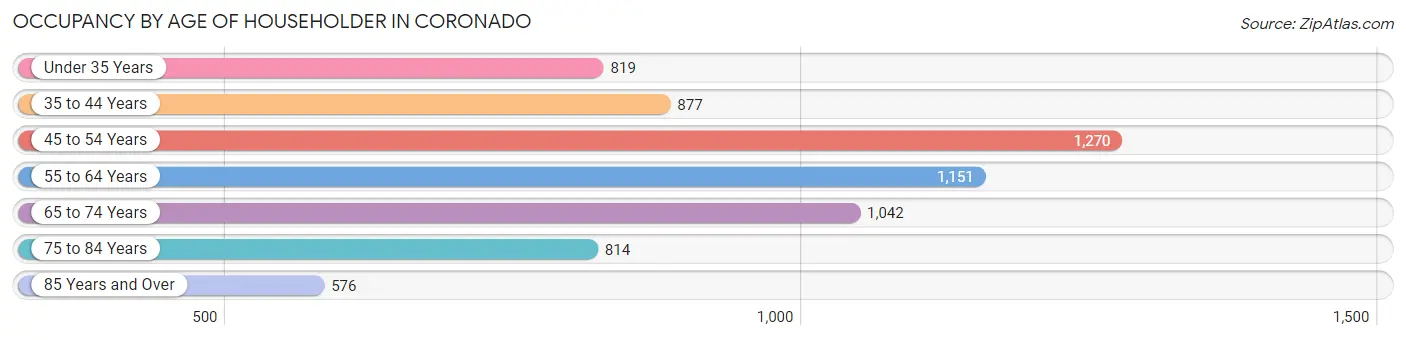
| Age Bracket | # Households | % Households |
| Under 35 Years | 819 | 12.5% |
| 35 to 44 Years | 877 | 13.4% |
| 45 to 54 Years | 1,270 | 19.4% |
| 55 to 64 Years | 1,151 | 17.6% |
| 65 to 74 Years | 1,042 | 15.9% |
| 75 to 84 Years | 814 | 12.4% |
| 85 Years and Over | 576 | 8.8% |
| Total | 6,549 | 100.0% |
Housing Finances in Coronado
Median Income by Occupancy in Coronado
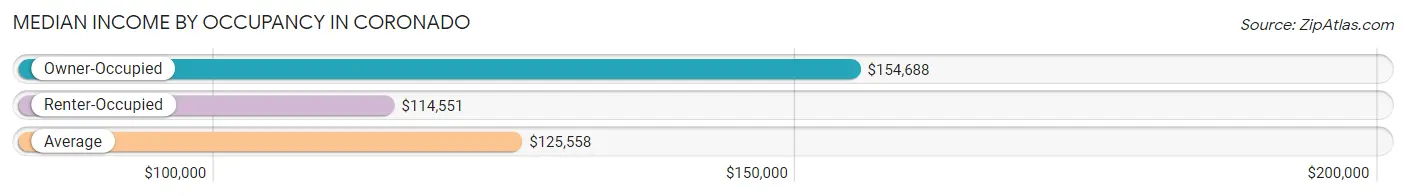
| Occupancy Type | # Households | Median Income |
| Owner-Occupied | 3,554 (54.3%) | $154,688 |
| Renter-Occupied | 2,995 (45.7%) | $114,551 |
| Average | 6,549 (100.0%) | $125,558 |
Occupancy by Householder Income Bracket in Coronado
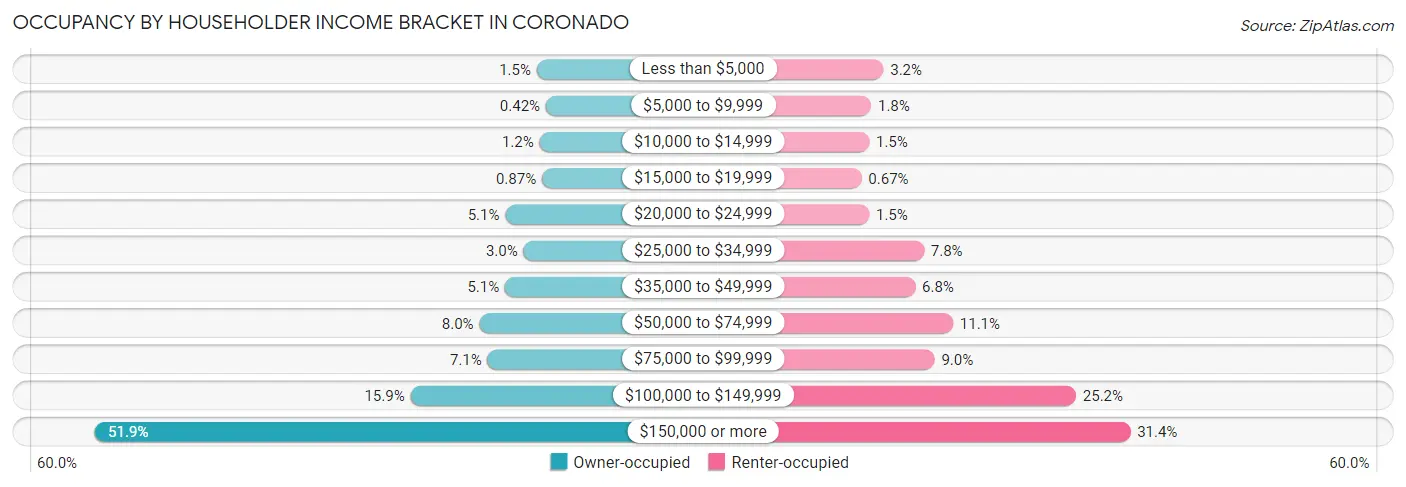
| Income Bracket | Owner-occupied | Renter-occupied |
| Less than $5,000 | 52 (1.5%) | 95 (3.2%) |
| $5,000 to $9,999 | 15 (0.4%) | 53 (1.8%) |
| $10,000 to $14,999 | 41 (1.1%) | 46 (1.5%) |
| $15,000 to $19,999 | 31 (0.9%) | 20 (0.7%) |
| $20,000 to $24,999 | 180 (5.1%) | 46 (1.5%) |
| $25,000 to $34,999 | 106 (3.0%) | 234 (7.8%) |
| $35,000 to $49,999 | 181 (5.1%) | 204 (6.8%) |
| $50,000 to $74,999 | 285 (8.0%) | 333 (11.1%) |
| $75,000 to $99,999 | 252 (7.1%) | 270 (9.0%) |
| $100,000 to $149,999 | 565 (15.9%) | 754 (25.2%) |
| $150,000 or more | 1,846 (51.9%) | 940 (31.4%) |
| Total | 3,554 (100.0%) | 2,995 (100.0%) |
Monthly Housing Cost Tiers in Coronado
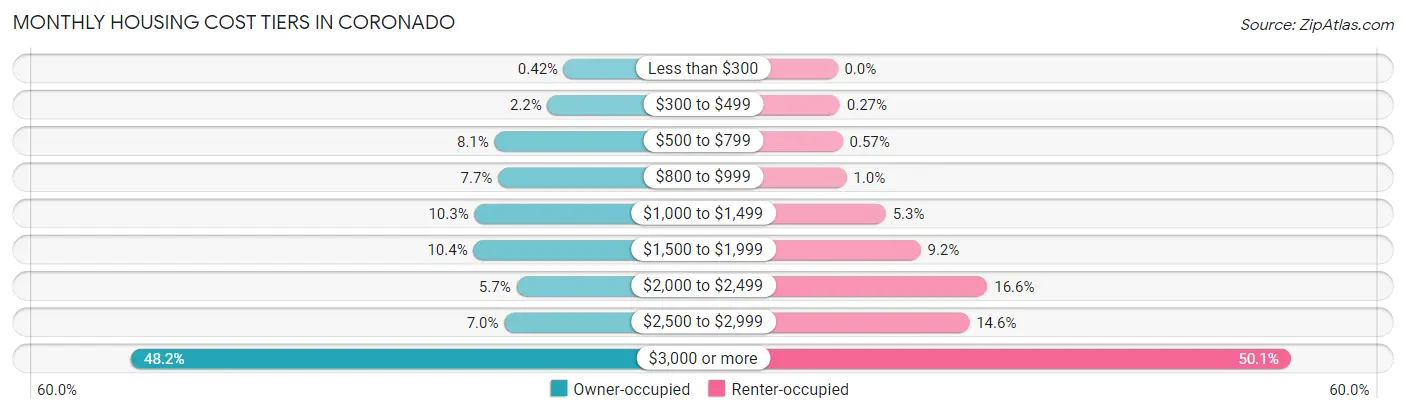
| Monthly Cost | Owner-occupied | Renter-occupied |
| Less than $300 | 15 (0.4%) | 0 (0.0%) |
| $300 to $499 | 79 (2.2%) | 8 (0.3%) |
| $500 to $799 | 287 (8.1%) | 17 (0.6%) |
| $800 to $999 | 273 (7.7%) | 30 (1.0%) |
| $1,000 to $1,499 | 366 (10.3%) | 160 (5.3%) |
| $1,500 to $1,999 | 370 (10.4%) | 275 (9.2%) |
| $2,000 to $2,499 | 201 (5.7%) | 496 (16.6%) |
| $2,500 to $2,999 | 249 (7.0%) | 436 (14.6%) |
| $3,000 or more | 1,714 (48.2%) | 1,499 (50.0%) |
| Total | 3,554 (100.0%) | 2,995 (100.0%) |
Physical Housing Characteristics in Coronado
Housing Structures in Coronado
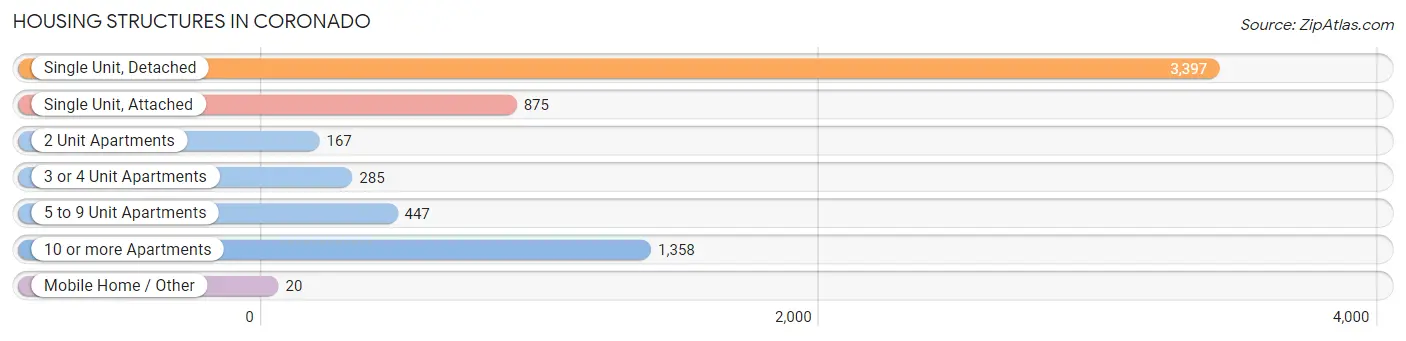
| Structure Type | # Housing Units | % Housing Units |
| Single Unit, Detached | 3,397 | 51.9% |
| Single Unit, Attached | 875 | 13.4% |
| 2 Unit Apartments | 167 | 2.5% |
| 3 or 4 Unit Apartments | 285 | 4.3% |
| 5 to 9 Unit Apartments | 447 | 6.8% |
| 10 or more Apartments | 1,358 | 20.7% |
| Mobile Home / Other | 20 | 0.3% |
| Total | 6,549 | 100.0% |
Housing Structures by Occupancy in Coronado
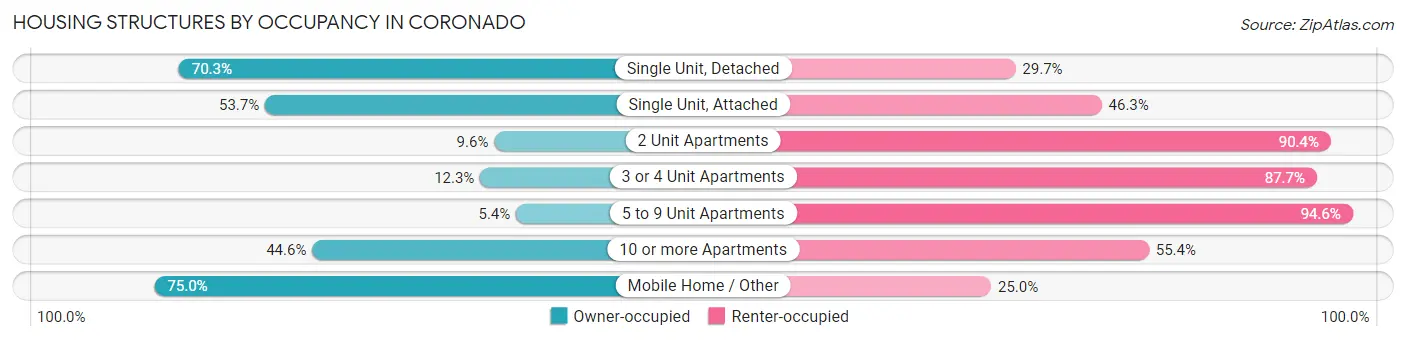
| Structure Type | Owner-occupied | Renter-occupied |
| Single Unit, Detached | 2,388 (70.3%) | 1,009 (29.7%) |
| Single Unit, Attached | 470 (53.7%) | 405 (46.3%) |
| 2 Unit Apartments | 16 (9.6%) | 151 (90.4%) |
| 3 or 4 Unit Apartments | 35 (12.3%) | 250 (87.7%) |
| 5 to 9 Unit Apartments | 24 (5.4%) | 423 (94.6%) |
| 10 or more Apartments | 606 (44.6%) | 752 (55.4%) |
| Mobile Home / Other | 15 (75.0%) | 5 (25.0%) |
| Total | 3,554 (54.3%) | 2,995 (45.7%) |
Housing Structures by Number of Rooms in Coronado
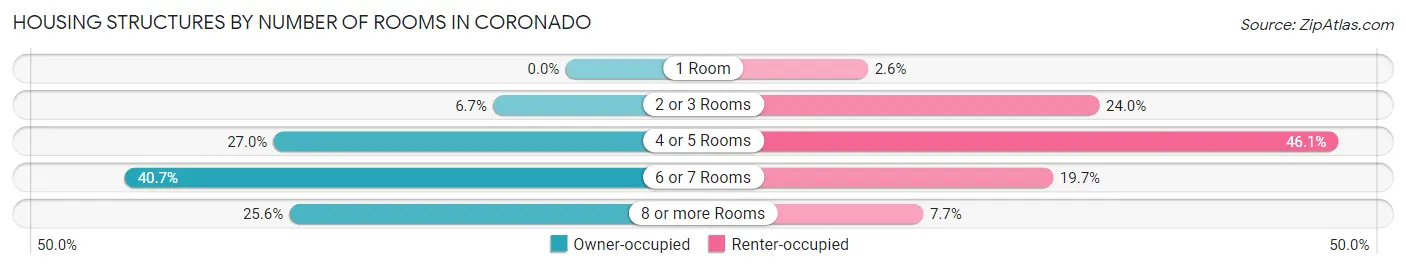
| Number of Rooms | Owner-occupied | Renter-occupied |
| 1 Room | 0 (0.0%) | 77 (2.6%) |
| 2 or 3 Rooms | 238 (6.7%) | 718 (24.0%) |
| 4 or 5 Rooms | 960 (27.0%) | 1,380 (46.1%) |
| 6 or 7 Rooms | 1,448 (40.7%) | 590 (19.7%) |
| 8 or more Rooms | 908 (25.6%) | 230 (7.7%) |
| Total | 3,554 (100.0%) | 2,995 (100.0%) |
Housing Structure by Heating Type in Coronado
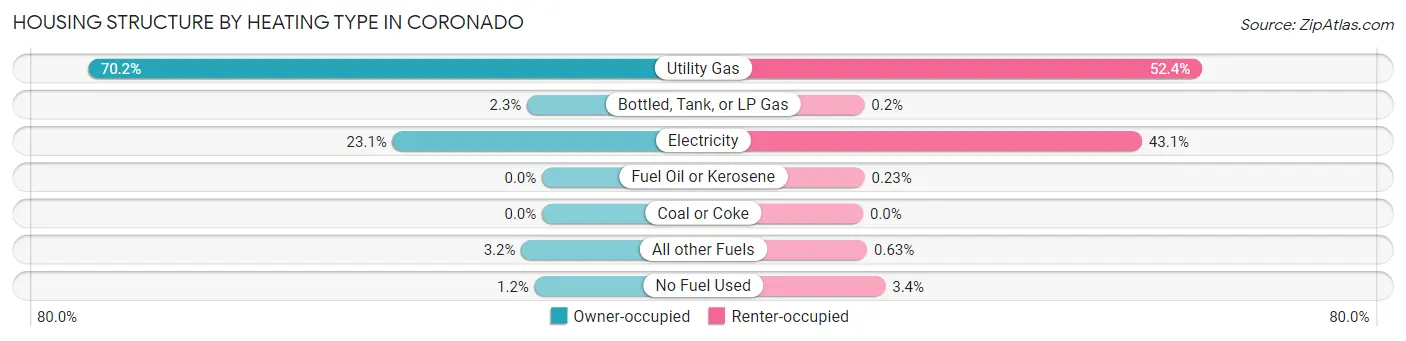
| Heating Type | Owner-occupied | Renter-occupied |
| Utility Gas | 2,496 (70.2%) | 1,569 (52.4%) |
| Bottled, Tank, or LP Gas | 82 (2.3%) | 6 (0.2%) |
| Electricity | 821 (23.1%) | 1,291 (43.1%) |
| Fuel Oil or Kerosene | 0 (0.0%) | 7 (0.2%) |
| Coal or Coke | 0 (0.0%) | 0 (0.0%) |
| All other Fuels | 114 (3.2%) | 19 (0.6%) |
| No Fuel Used | 41 (1.1%) | 103 (3.4%) |
| Total | 3,554 (100.0%) | 2,995 (100.0%) |
Household Vehicle Usage in Coronado
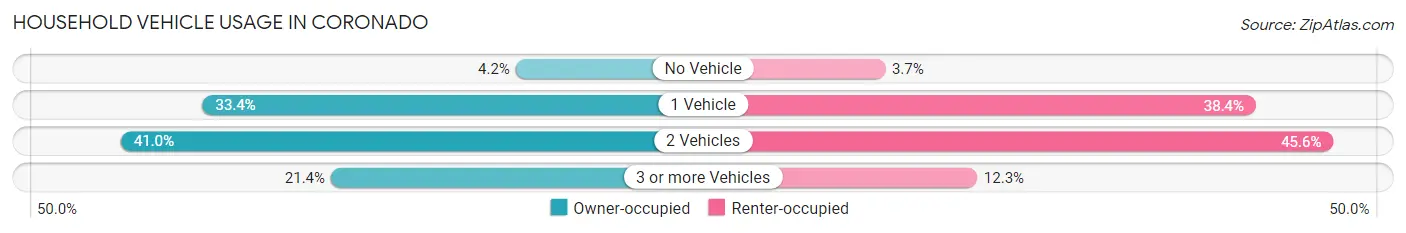
| Vehicles per Household | Owner-occupied | Renter-occupied |
| No Vehicle | 148 (4.2%) | 112 (3.7%) |
| 1 Vehicle | 1,187 (33.4%) | 1,149 (38.4%) |
| 2 Vehicles | 1,458 (41.0%) | 1,365 (45.6%) |
| 3 or more Vehicles | 761 (21.4%) | 369 (12.3%) |
| Total | 3,554 (100.0%) | 2,995 (100.0%) |
Real Estate & Mortgages in Coronado
Real Estate and Mortgage Overview in Coronado
| Characteristic | Without Mortgage | With Mortgage |
| Housing Units | 1,604 | 1,950 |
| Median Property Value | $1,757,500 | $1,948,500 |
| Median Household Income | $116,154 | $1,159 |
| Monthly Housing Costs | $1,281 | $1,593 |
| Real Estate Taxes | $7,284 | $21 |
Property Value by Mortgage Status in Coronado
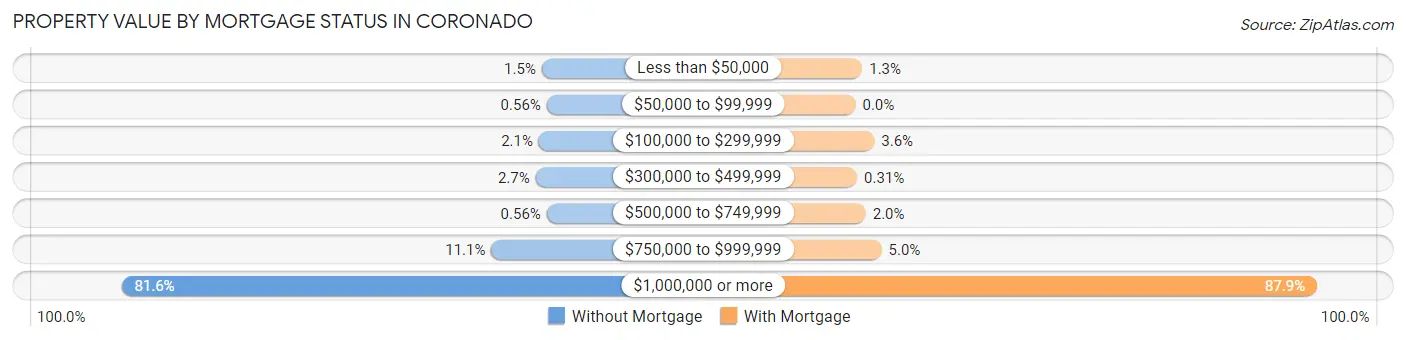
| Property Value | Without Mortgage | With Mortgage |
| Less than $50,000 | 24 (1.5%) | 25 (1.3%) |
| $50,000 to $99,999 | 9 (0.6%) | 0 (0.0%) |
| $100,000 to $299,999 | 33 (2.1%) | 70 (3.6%) |
| $300,000 to $499,999 | 43 (2.7%) | 6 (0.3%) |
| $500,000 to $749,999 | 9 (0.6%) | 38 (1.9%) |
| $750,000 to $999,999 | 178 (11.1%) | 97 (5.0%) |
| $1,000,000 or more | 1,308 (81.6%) | 1,714 (87.9%) |
| Total | 1,604 (100.0%) | 1,950 (100.0%) |
Household Income by Mortgage Status in Coronado
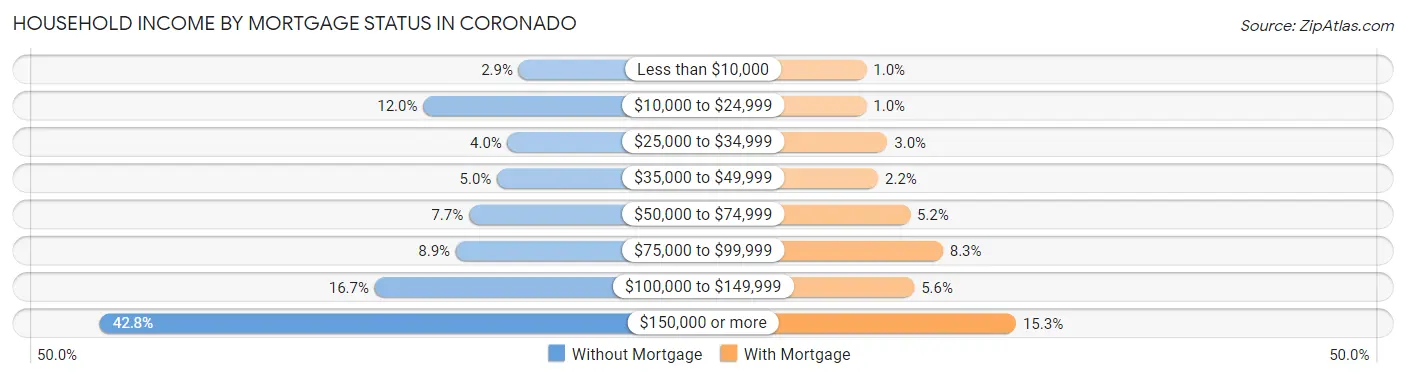
| Household Income | Without Mortgage | With Mortgage |
| Less than $10,000 | 47 (2.9%) | 20 (1.0%) |
| $10,000 to $24,999 | 193 (12.0%) | 20 (1.0%) |
| $25,000 to $34,999 | 64 (4.0%) | 59 (3.0%) |
| $35,000 to $49,999 | 80 (5.0%) | 42 (2.1%) |
| $50,000 to $74,999 | 123 (7.7%) | 101 (5.2%) |
| $75,000 to $99,999 | 143 (8.9%) | 162 (8.3%) |
| $100,000 to $149,999 | 267 (16.7%) | 109 (5.6%) |
| $150,000 or more | 687 (42.8%) | 298 (15.3%) |
| Total | 1,604 (100.0%) | 1,950 (100.0%) |
Property Value to Household Income Ratio in Coronado
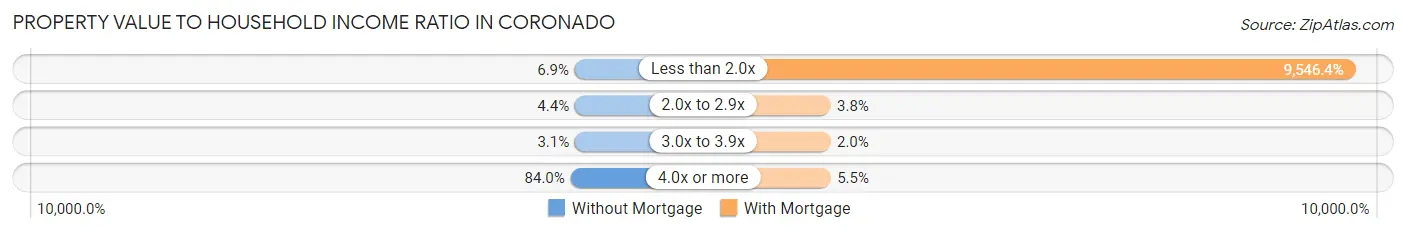
| Value-to-Income Ratio | Without Mortgage | With Mortgage |
| Less than 2.0x | 110 (6.9%) | 186,154 (9,546.4%) |
| 2.0x to 2.9x | 71 (4.4%) | 74 (3.8%) |
| 3.0x to 3.9x | 49 (3.0%) | 39 (2.0%) |
| 4.0x or more | 1,347 (84.0%) | 108 (5.5%) |
| Total | 1,604 (100.0%) | 1,950 (100.0%) |
Real Estate Taxes by Mortgage Status in Coronado
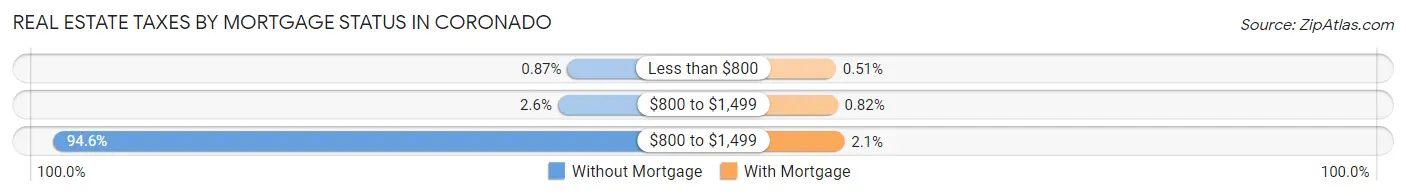
| Property Taxes | Without Mortgage | With Mortgage |
| Less than $800 | 14 (0.9%) | 10 (0.5%) |
| $800 to $1,499 | 42 (2.6%) | 16 (0.8%) |
| $800 to $1,499 | 1,518 (94.6%) | 40 (2.1%) |
| Total | 1,604 (100.0%) | 1,950 (100.0%) |
Health & Disability in Coronado
Health Insurance Coverage by Age in Coronado
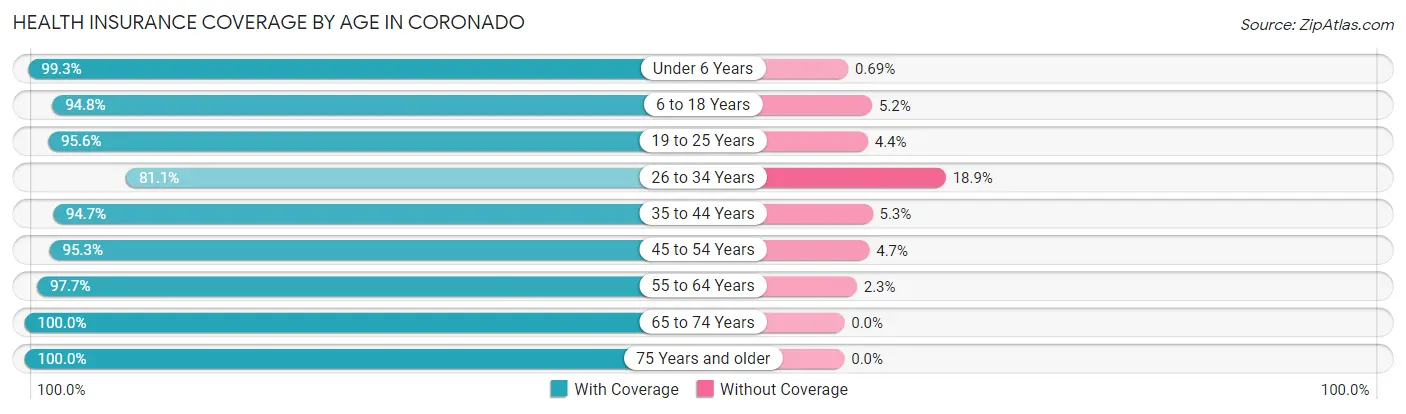
| Age Bracket | With Coverage | Without Coverage |
| Under 6 Years | 860 (99.3%) | 6 (0.7%) |
| 6 to 18 Years | 2,406 (94.8%) | 131 (5.2%) |
| 19 to 25 Years | 808 (95.6%) | 37 (4.4%) |
| 26 to 34 Years | 935 (81.1%) | 218 (18.9%) |
| 35 to 44 Years | 1,383 (94.7%) | 77 (5.3%) |
| 45 to 54 Years | 1,843 (95.3%) | 90 (4.7%) |
| 55 to 64 Years | 2,009 (97.7%) | 48 (2.3%) |
| 65 to 74 Years | 1,643 (100.0%) | 0 (0.0%) |
| 75 Years and older | 2,140 (100.0%) | 0 (0.0%) |
| Total | 14,027 (95.9%) | 607 (4.2%) |
Health Insurance Coverage by Citizenship Status in Coronado
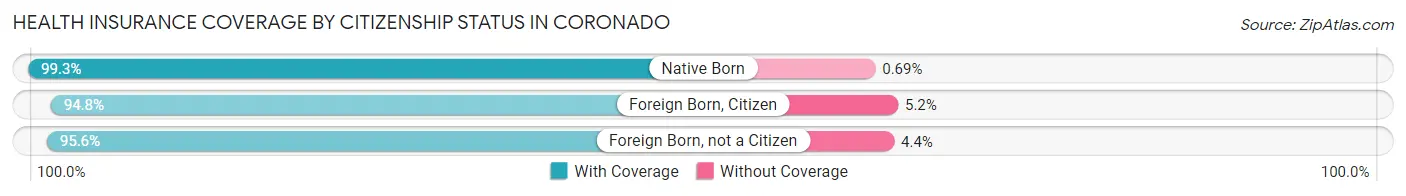
| Citizenship Status | With Coverage | Without Coverage |
| Native Born | 860 (99.3%) | 6 (0.7%) |
| Foreign Born, Citizen | 2,406 (94.8%) | 131 (5.2%) |
| Foreign Born, not a Citizen | 808 (95.6%) | 37 (4.4%) |
Health Insurance Coverage by Household Income in Coronado
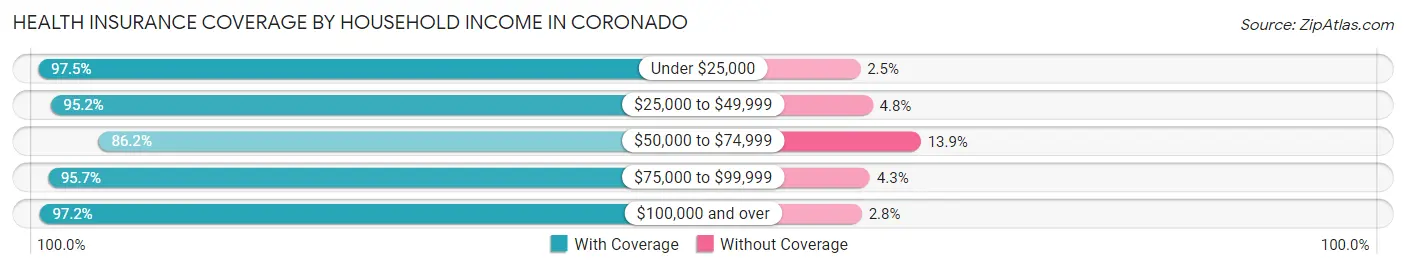
| Household Income | With Coverage | Without Coverage |
| Under $25,000 | 888 (97.5%) | 23 (2.5%) |
| $25,000 to $49,999 | 1,199 (95.2%) | 61 (4.8%) |
| $50,000 to $74,999 | 1,238 (86.2%) | 199 (13.9%) |
| $75,000 to $99,999 | 949 (95.7%) | 43 (4.3%) |
| $100,000 and over | 9,749 (97.2%) | 280 (2.8%) |
Public vs Private Health Insurance Coverage by Age in Coronado
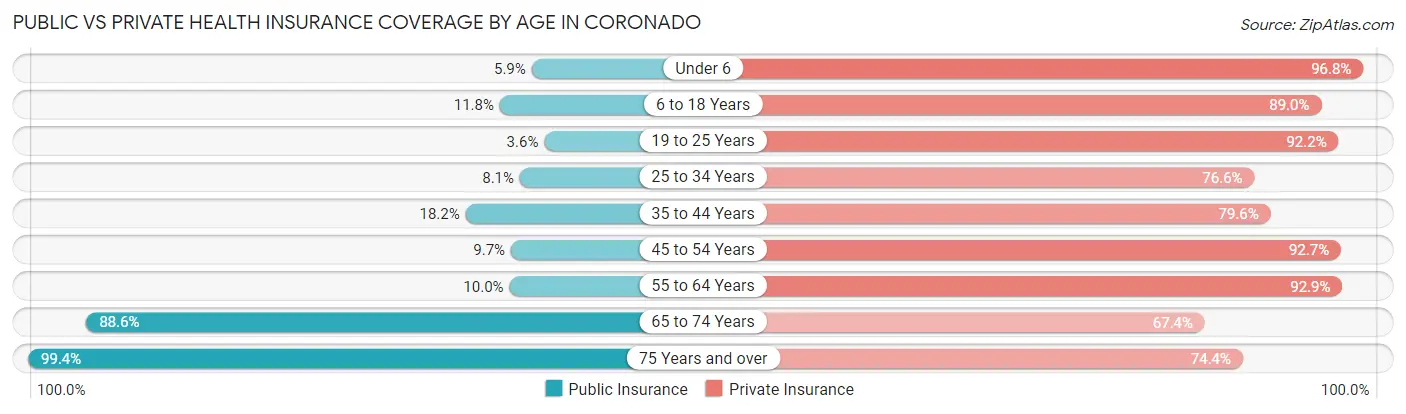
| Age Bracket | Public Insurance | Private Insurance |
| Under 6 | 51 (5.9%) | 838 (96.8%) |
| 6 to 18 Years | 299 (11.8%) | 2,258 (89.0%) |
| 19 to 25 Years | 30 (3.5%) | 779 (92.2%) |
| 25 to 34 Years | 93 (8.1%) | 883 (76.6%) |
| 35 to 44 Years | 265 (18.1%) | 1,162 (79.6%) |
| 45 to 54 Years | 188 (9.7%) | 1,791 (92.6%) |
| 55 to 64 Years | 206 (10.0%) | 1,911 (92.9%) |
| 65 to 74 Years | 1,455 (88.6%) | 1,107 (67.4%) |
| 75 Years and over | 2,127 (99.4%) | 1,593 (74.4%) |
| Total | 4,714 (32.2%) | 12,322 (84.2%) |
Disability Status by Sex by Age in Coronado
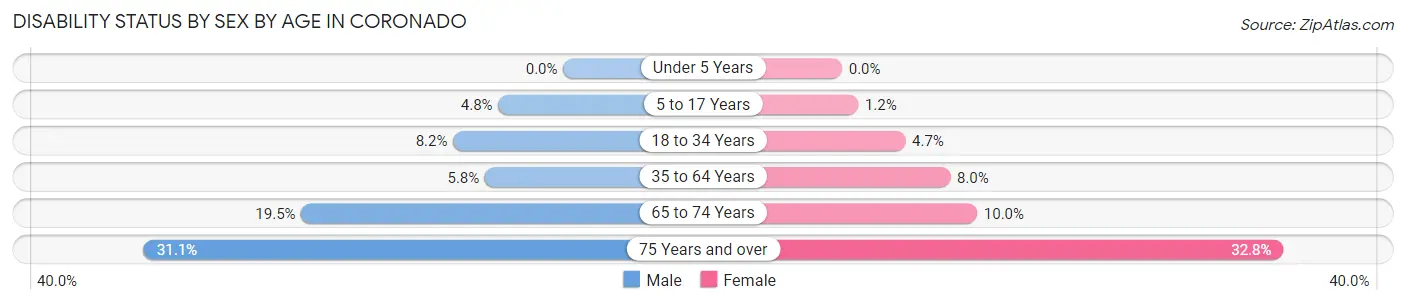
| Age Bracket | Male | Female |
| Under 5 Years | 0 (0.0%) | 0 (0.0%) |
| 5 to 17 Years | 66 (4.8%) | 15 (1.2%) |
| 18 to 34 Years | 81 (8.2%) | 54 (4.7%) |
| 35 to 64 Years | 148 (5.8%) | 233 (8.0%) |
| 65 to 74 Years | 149 (19.5%) | 88 (10.0%) |
| 75 Years and over | 331 (31.1%) | 353 (32.8%) |
Disability Class by Sex by Age in Coronado
Disability Class: Hearing Difficulty
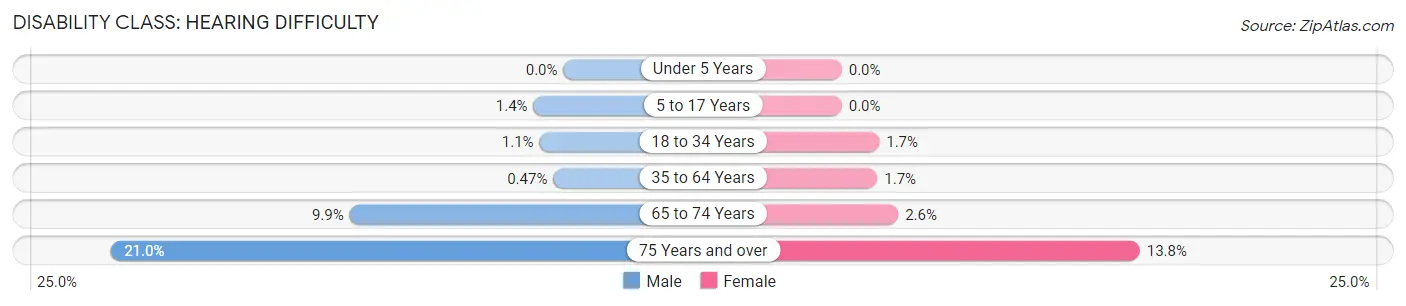
| Age Bracket | Male | Female |
| Under 5 Years | 0 (0.0%) | 0 (0.0%) |
| 5 to 17 Years | 19 (1.4%) | 0 (0.0%) |
| 18 to 34 Years | 11 (1.1%) | 20 (1.7%) |
| 35 to 64 Years | 12 (0.5%) | 48 (1.7%) |
| 65 to 74 Years | 76 (9.9%) | 23 (2.6%) |
| 75 Years and over | 223 (21.0%) | 149 (13.8%) |
Disability Class: Vision Difficulty
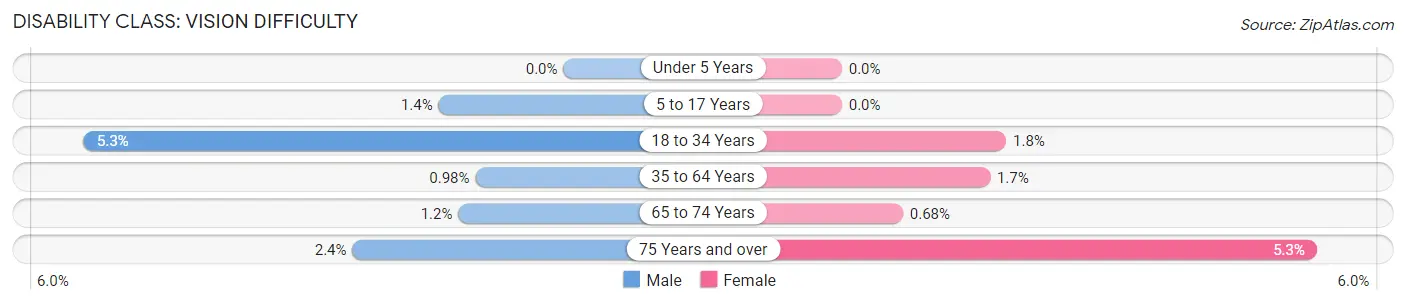
| Age Bracket | Male | Female |
| Under 5 Years | 0 (0.0%) | 0 (0.0%) |
| 5 to 17 Years | 19 (1.4%) | 0 (0.0%) |
| 18 to 34 Years | 53 (5.3%) | 21 (1.8%) |
| 35 to 64 Years | 25 (1.0%) | 48 (1.7%) |
| 65 to 74 Years | 9 (1.2%) | 6 (0.7%) |
| 75 Years and over | 25 (2.4%) | 57 (5.3%) |
Disability Class: Cognitive Difficulty
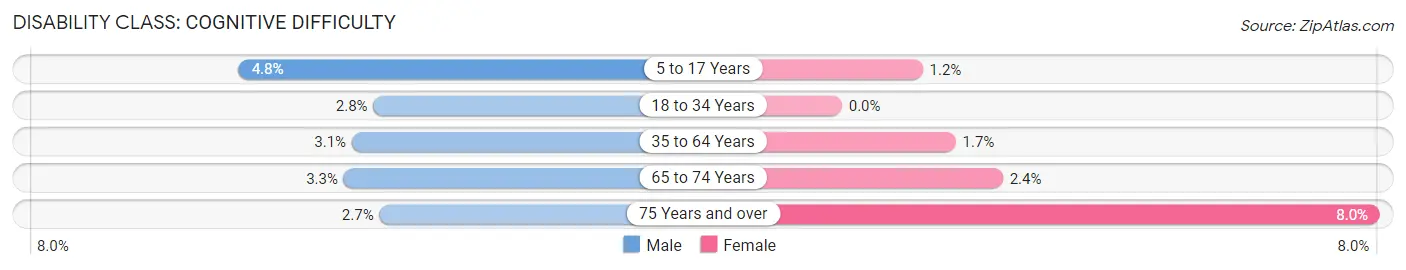
| Age Bracket | Male | Female |
| 5 to 17 Years | 66 (4.8%) | 15 (1.2%) |
| 18 to 34 Years | 28 (2.8%) | 0 (0.0%) |
| 35 to 64 Years | 80 (3.1%) | 49 (1.7%) |
| 65 to 74 Years | 25 (3.3%) | 21 (2.4%) |
| 75 Years and over | 29 (2.7%) | 86 (8.0%) |
Disability Class: Ambulatory Difficulty
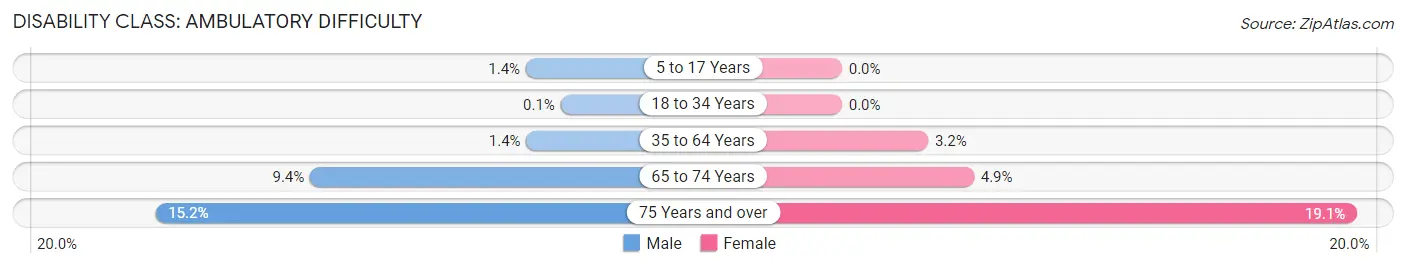
| Age Bracket | Male | Female |
| 5 to 17 Years | 19 (1.4%) | 0 (0.0%) |
| 18 to 34 Years | 1 (0.1%) | 0 (0.0%) |
| 35 to 64 Years | 35 (1.4%) | 93 (3.2%) |
| 65 to 74 Years | 72 (9.4%) | 43 (4.9%) |
| 75 Years and over | 161 (15.1%) | 206 (19.1%) |
Disability Class: Self-Care Difficulty
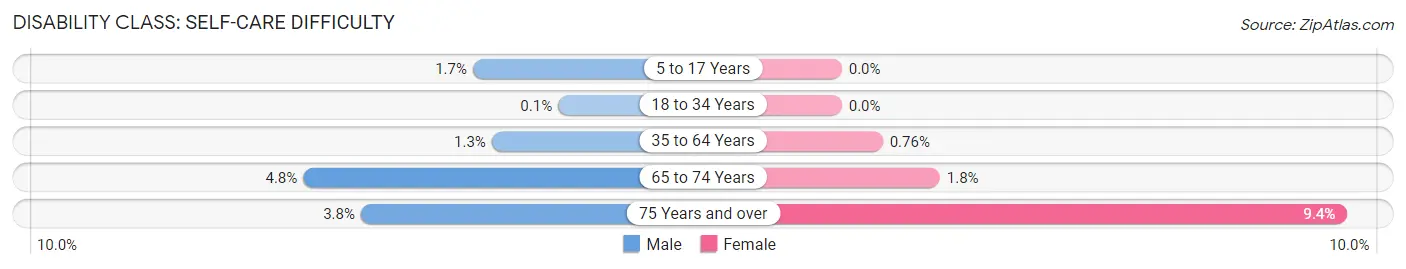
| Age Bracket | Male | Female |
| 5 to 17 Years | 23 (1.7%) | 0 (0.0%) |
| 18 to 34 Years | 1 (0.1%) | 0 (0.0%) |
| 35 to 64 Years | 34 (1.3%) | 22 (0.8%) |
| 65 to 74 Years | 37 (4.8%) | 16 (1.8%) |
| 75 Years and over | 40 (3.8%) | 101 (9.4%) |
Technology Access in Coronado
Computing Device Access in Coronado
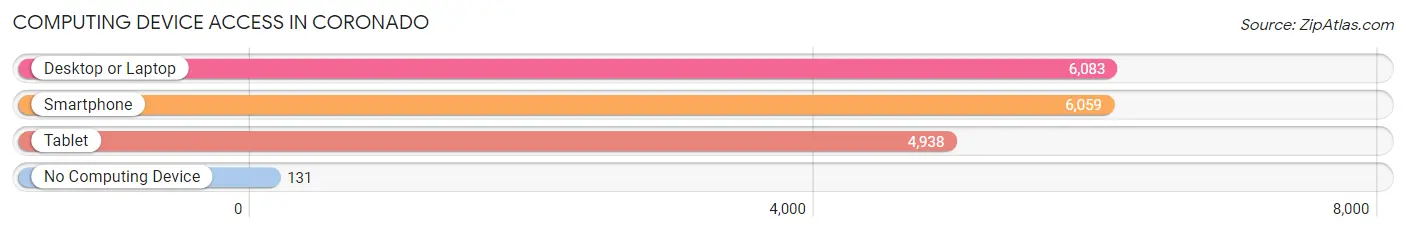
| Device Type | # Households | % Households |
| Desktop or Laptop | 6,083 | 92.9% |
| Smartphone | 6,059 | 92.5% |
| Tablet | 4,938 | 75.4% |
| No Computing Device | 131 | 2.0% |
| Total | 6,549 | 100.0% |
Internet Access in Coronado
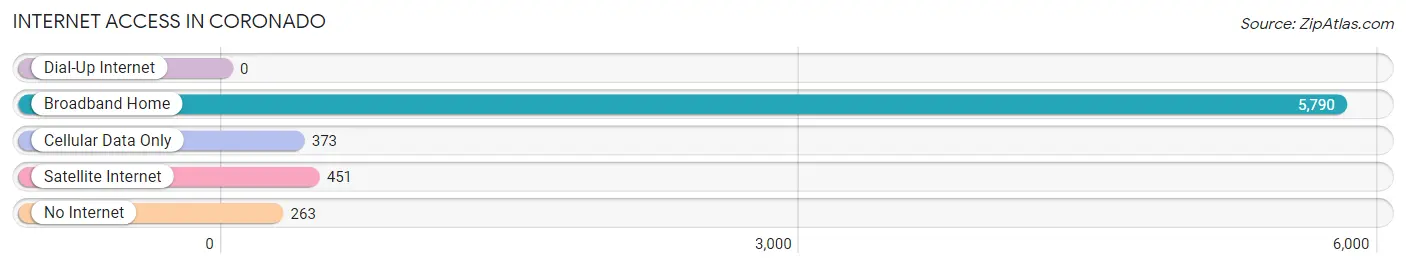
| Internet Type | # Households | % Households |
| Dial-Up Internet | 0 | 0.0% |
| Broadband Home | 5,790 | 88.4% |
| Cellular Data Only | 373 | 5.7% |
| Satellite Internet | 451 | 6.9% |
| No Internet | 263 | 4.0% |
| Total | 6,549 | 100.0% |
Coronado Summary
Coronado, California is a small city located in San Diego County, California. It is situated on a peninsula across the San Diego Bay from downtown San Diego. Coronado is known for its beautiful beaches, its historic downtown, and its iconic Hotel del Coronado. The city has a population of 24,697 as of the 2010 census, making it one of the most densely populated cities in the county.
History
Coronado was first inhabited by the Kumeyaay people, who lived in the area for thousands of years before the arrival of Europeans. The first Europeans to explore the area were Spanish explorers, who arrived in the late 1700s. The area was named Coronado in honor of the Spanish explorer Francisco Vásquez de Coronado, who explored the area in 1540.
In 1885, the Hotel del Coronado was built, and it quickly became a popular destination for wealthy travelers from around the world. The city was officially incorporated in 1890, and it has remained a popular tourist destination ever since.
Geography
Coronado is located on a peninsula across the San Diego Bay from downtown San Diego. The city is bordered by the Pacific Ocean to the west, the San Diego Bay to the north, and the Silver Strand to the south. The city covers an area of 4.6 square miles, and it has a population density of 5,400 people per square mile.
The city has a Mediterranean climate, with mild temperatures year-round. The average high temperature in the summer is 78 degrees Fahrenheit, and the average low temperature in the winter is 55 degrees Fahrenheit.
Economy
Coronado’s economy is largely driven by tourism. The city is home to the iconic Hotel del Coronado, which is one of the most popular tourist destinations in the area. The city also has a number of other attractions, including the Coronado Ferry Landing, the Coronado Beach, and the Coronado Municipal Golf Course.
The city also has a number of retail and dining establishments, as well as a number of small businesses. The city’s economy is also supported by the nearby Naval Air Station North Island, which is the largest employer in the city.
Demographics
As of the 2010 census, Coronado had a population of 24,697. The racial makeup of the city was 79.2% White, 8.3% Asian, 6.2% Hispanic or Latino, 4.2% African American, and 2.1% from other races.
The median household income in Coronado was $90,845, and the median family income was $106,845. The per capita income in the city was $50,845. The city’s poverty rate was 5.2%.
Coronado is a small city with a rich history and a vibrant economy. It is known for its beautiful beaches, its historic downtown, and its iconic Hotel del Coronado. The city has a diverse population and a strong economy, and it is a popular destination for tourists from around the world.
Common Questions
What is Per Capita Income in Coronado?
Per Capita income in Coronado is $72,266.
What is the Median Family Income in Coronado?
Median Family Income in Coronado is $151,357.
What is the Median Household income in Coronado?
Median Household Income in Coronado is $125,558.
What is Income or Wage Gap in Coronado?
Income or Wage Gap in Coronado is 18.9%.
Women in Coronado earn 81.1 cents for every dollar earned by a man.
What is Family Income Deficit in Coronado?
Family Income Deficit in Coronado is $14,904.
Families that are below poverty line in Coronado earn $14,904 less on average than the poverty threshold level.
What is Inequality or Gini Index in Coronado?
Inequality or Gini Index in Coronado is 0.50.
What is the Total Population of Coronado?
Total Population of Coronado is 18,871.
What is the Total Male Population of Coronado?
Total Male Population of Coronado is 10,766.
What is the Total Female Population of Coronado?
Total Female Population of Coronado is 8,105.
What is the Ratio of Males per 100 Females in Coronado?
There are 132.83 Males per 100 Females in Coronado.
What is the Ratio of Females per 100 Males in Coronado?
There are 75.28 Females per 100 Males in Coronado.
What is the Median Population Age in Coronado?
Median Population Age in Coronado is 40.3 Years.
What is the Average Family Size in Coronado
Average Family Size in Coronado is 2.8 People.
What is the Average Household Size in Coronado
Average Household Size in Coronado is 2.4 People.
How Large is the Labor Force in Coronado?
There are 10,458 People in the Labor Forcein in Coronado.
What is the Percentage of People in the Labor Force in Coronado?
65.1% of People are in the Labor Force in Coronado.
What is the Unemployment Rate in Coronado?
Unemployment Rate in Coronado is 5.0%.