Colusa, CA Map & Demographics
Colusa Map
Colusa Overview
$30,046
PER CAPITA INCOME
$68,408
AVG FAMILY INCOME
$59,400
AVG HOUSEHOLD INCOME
24.0%
WAGE / INCOME GAP [ % ]
76.0¢/ $1
WAGE / INCOME GAP [ $ ]
0.46
INEQUALITY / GINI INDEX
6,380
TOTAL POPULATION
3,219
MALE POPULATION
3,161
FEMALE POPULATION
101.83
MALES / 100 FEMALES
98.20
FEMALES / 100 MALES
38.7
MEDIAN AGE
3.1
AVG FAMILY SIZE
2.5
AVG HOUSEHOLD SIZE
2,886
LABOR FORCE [ PEOPLE ]
60.9%
PERCENT IN LABOR FORCE
6.2%
UNEMPLOYMENT RATE
Colusa Zip Codes
Colusa Area Codes
Income in Colusa
Income Overview in Colusa
Per Capita Income in Colusa is $30,046, while median incomes of families and households are $68,408 and $59,400 respectively.
| Characteristic | Number | Measure |
| Per Capita Income | 6,380 | $30,046 |
| Median Family Income | 1,673 | $68,408 |
| Mean Family Income | 1,673 | $88,855 |
| Median Household Income | 2,472 | $59,400 |
| Mean Household Income | 2,472 | $75,073 |
| Income Deficit | 1,673 | $0 |
| Wage / Income Gap (%) | 6,380 | 24.01% |
| Wage / Income Gap ($) | 6,380 | 75.99¢ per $1 |
| Gini / Inequality Index | 6,380 | 0.46 |
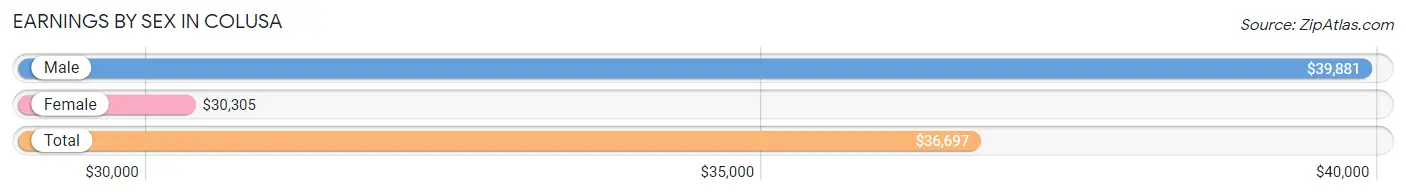
Earnings by Sex in Colusa
Average Earnings in Colusa are $36,697, $39,881 for men and $30,305 for women, a difference of 24.0%.
| Sex | Number | Average Earnings |
| Male | 1,552 (54.0%) | $39,881 |
| Female | 1,324 (46.0%) | $30,305 |
| Total | 2,876 (100.0%) | $36,697 |
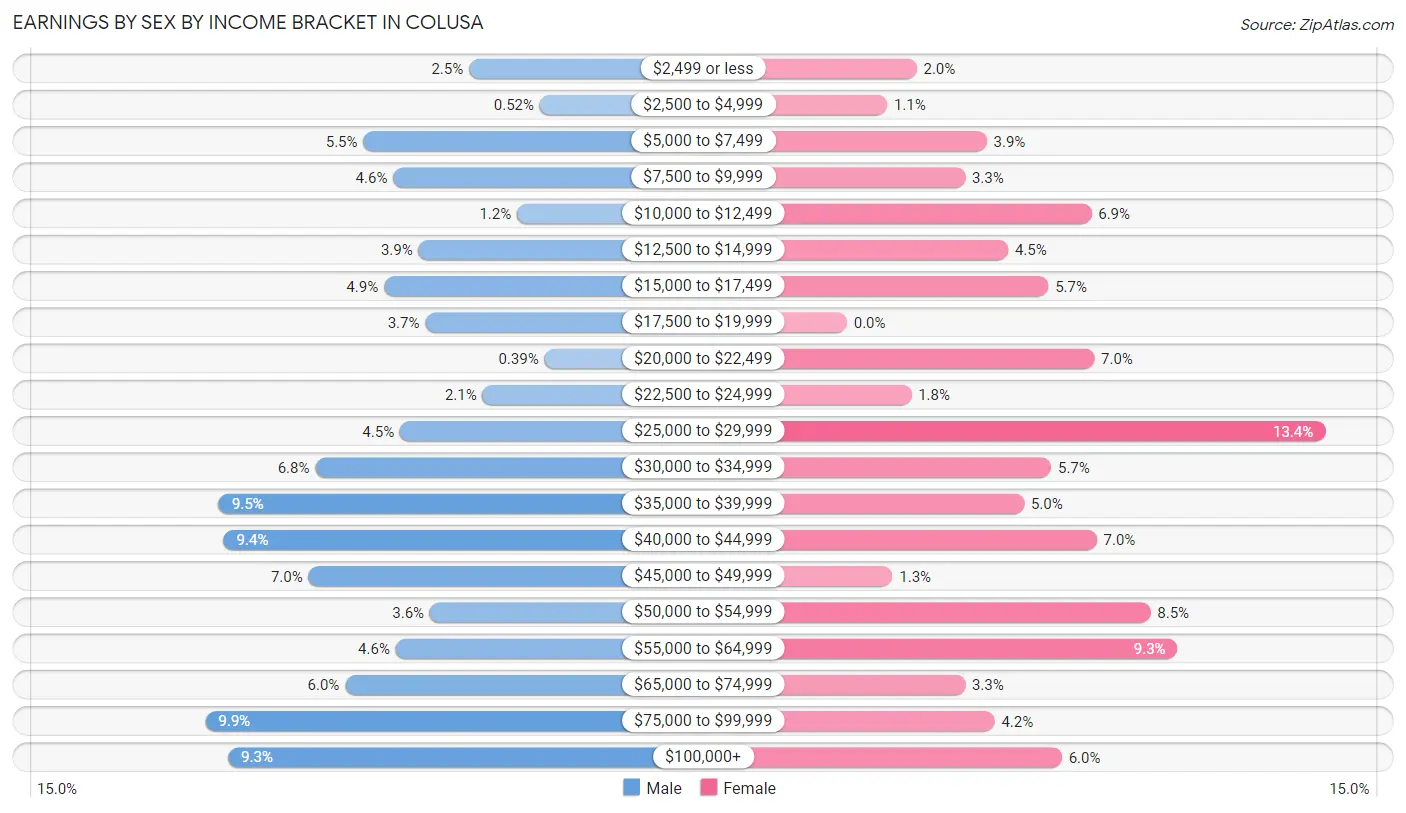
Earnings by Sex by Income Bracket in Colusa
The most common earnings brackets in Colusa are $75,000 to $99,999 for men (154 | 9.9%) and $25,000 to $29,999 for women (178 | 13.4%).
| Income | Male | Female |
| $2,499 or less | 39 (2.5%) | 26 (2.0%) |
| $2,500 to $4,999 | 8 (0.5%) | 15 (1.1%) |
| $5,000 to $7,499 | 85 (5.5%) | 52 (3.9%) |
| $7,500 to $9,999 | 72 (4.6%) | 44 (3.3%) |
| $10,000 to $12,499 | 18 (1.2%) | 91 (6.9%) |
| $12,500 to $14,999 | 61 (3.9%) | 60 (4.5%) |
| $15,000 to $17,499 | 76 (4.9%) | 75 (5.7%) |
| $17,500 to $19,999 | 58 (3.7%) | 0 (0.0%) |
| $20,000 to $22,499 | 6 (0.4%) | 92 (7.0%) |
| $22,500 to $24,999 | 33 (2.1%) | 24 (1.8%) |
| $25,000 to $29,999 | 69 (4.4%) | 178 (13.4%) |
| $30,000 to $34,999 | 106 (6.8%) | 76 (5.7%) |
| $35,000 to $39,999 | 148 (9.5%) | 66 (5.0%) |
| $40,000 to $44,999 | 146 (9.4%) | 93 (7.0%) |
| $45,000 to $49,999 | 109 (7.0%) | 17 (1.3%) |
| $50,000 to $54,999 | 56 (3.6%) | 113 (8.5%) |
| $55,000 to $64,999 | 71 (4.6%) | 123 (9.3%) |
| $65,000 to $74,999 | 93 (6.0%) | 44 (3.3%) |
| $75,000 to $99,999 | 154 (9.9%) | 55 (4.2%) |
| $100,000+ | 144 (9.3%) | 80 (6.0%) |
| Total | 1,552 (100.0%) | 1,324 (100.0%) |
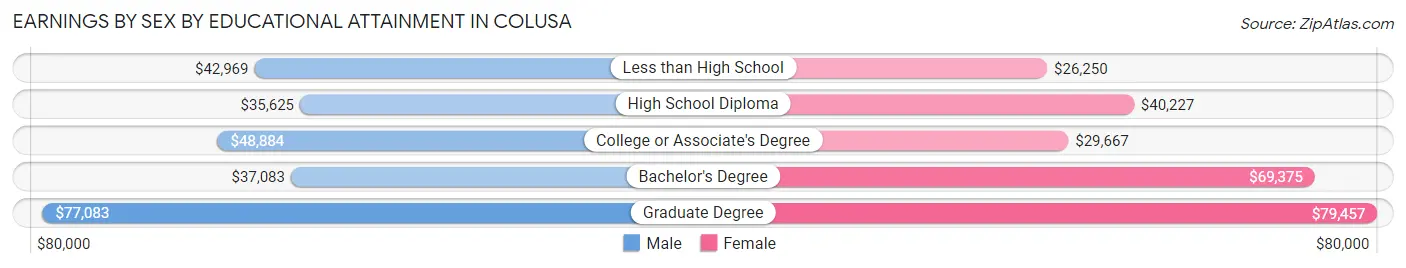
Earnings by Sex by Educational Attainment in Colusa
Average earnings in Colusa are $42,694 for men and $33,464 for women, a difference of 21.6%. Men with an educational attainment of graduate degree enjoy the highest average annual earnings of $77,083, while those with high school diploma education earn the least with $35,625. Women with an educational attainment of graduate degree earn the most with the average annual earnings of $79,457, while those with less than high school education have the smallest earnings of $26,250.
| Educational Attainment | Male Income | Female Income |
| Less than High School | $42,969 | $26,250 |
| High School Diploma | $35,625 | $40,227 |
| College or Associate's Degree | $48,884 | $29,667 |
| Bachelor's Degree | $37,083 | $69,375 |
| Graduate Degree | $77,083 | $79,457 |
| Total | $42,694 | $33,464 |
Family Income in Colusa
Family Income Brackets in Colusa
According to the Colusa family income data, there are 291 families falling into the $50,000 to $74,999 income range, which is the most common income bracket and makes up 17.4% of all families. Conversely, the $10,000 to $14,999 income bracket is the least frequent group with only 17 families (1.0%) belonging to this category.
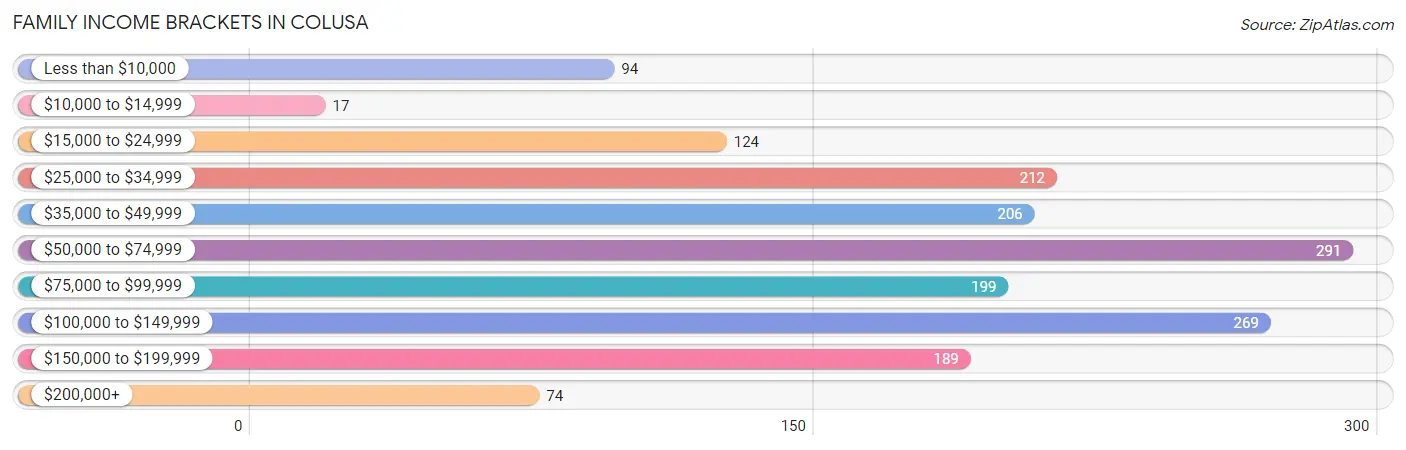
| Income Bracket | # Families | % Families |
| Less than $10,000 | 94 | 5.6% |
| $10,000 to $14,999 | 17 | 1.0% |
| $15,000 to $24,999 | 124 | 7.4% |
| $25,000 to $34,999 | 212 | 12.7% |
| $35,000 to $49,999 | 206 | 12.3% |
| $50,000 to $74,999 | 291 | 17.4% |
| $75,000 to $99,999 | 199 | 11.9% |
| $100,000 to $149,999 | 269 | 16.1% |
| $150,000 to $199,999 | 189 | 11.3% |
| $200,000+ | 74 | 4.4% |
Family Income by Famaliy Size in Colusa
4-person families (356 | 21.3%) account for the highest median family income in Colusa with $130,729 per family, while 4-person families (356 | 21.3%) have the highest median income of $32,682 per family member.
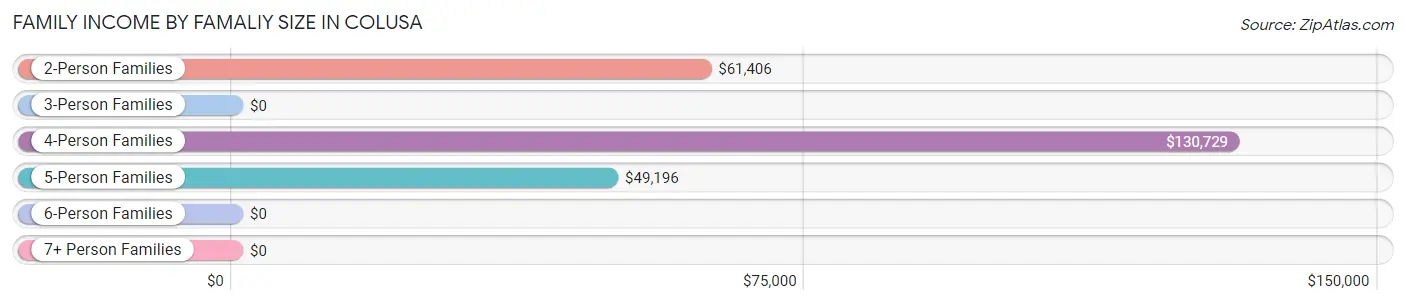
| Income Bracket | # Families | Median Income |
| 2-Person Families | 855 (51.1%) | $61,406 |
| 3-Person Families | 223 (13.3%) | $0 |
| 4-Person Families | 356 (21.3%) | $130,729 |
| 5-Person Families | 228 (13.6%) | $49,196 |
| 6-Person Families | 3 (0.2%) | $0 |
| 7+ Person Families | 8 (0.5%) | $0 |
| Total | 1,673 (100.0%) | $68,408 |
Family Income by Number of Earners in Colusa
The median family income in Colusa is $68,408, with families comprising 3+ earners (147) having the highest median family income of $121,736, while families with 1 earner (623) have the lowest median family income of $37,112, accounting for 8.8% and 37.2% of families, respectively.
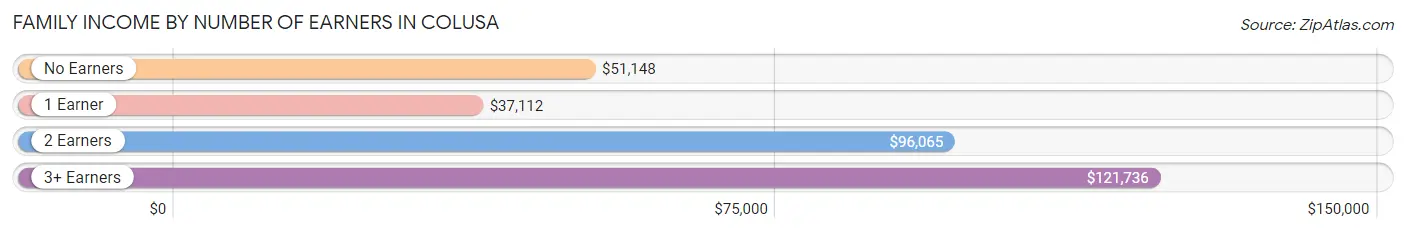
| Number of Earners | # Families | Median Income |
| No Earners | 340 (20.3%) | $51,148 |
| 1 Earner | 623 (37.2%) | $37,112 |
| 2 Earners | 563 (33.7%) | $96,065 |
| 3+ Earners | 147 (8.8%) | $121,736 |
| Total | 1,673 (100.0%) | $68,408 |
Household Income in Colusa
Household Income Brackets in Colusa
With 420 households falling in the category, the $50,000 to $74,999 income range is the most frequent in Colusa, accounting for 17.0% of all households. In contrast, only 74 households (3.0%) fall into the $200,000+ income bracket, making it the least populous group.
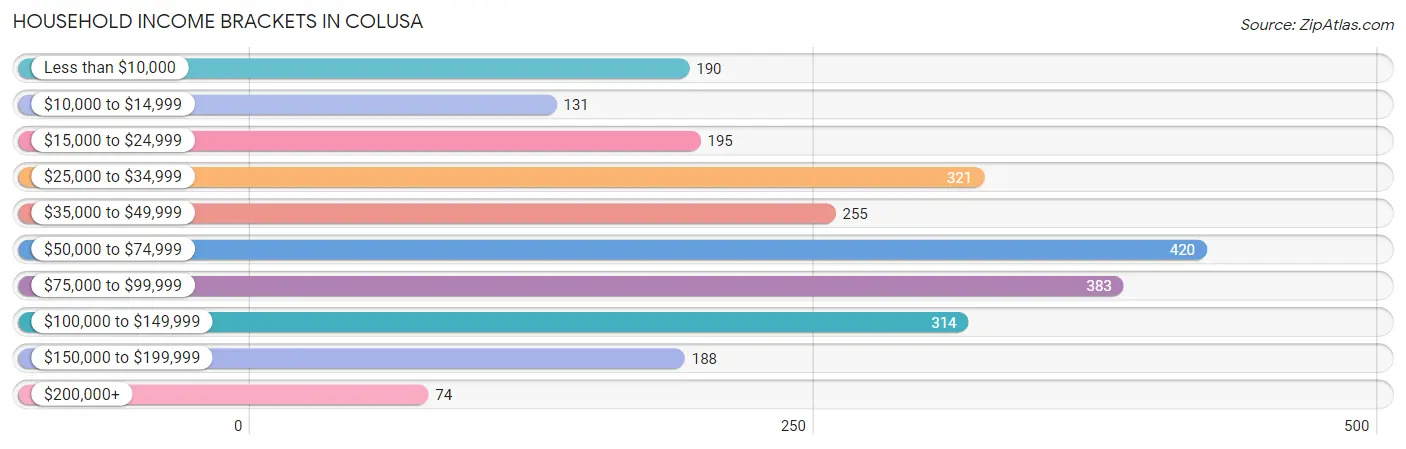
| Income Bracket | # Households | % Households |
| Less than $10,000 | 190 | 7.7% |
| $10,000 to $14,999 | 131 | 5.3% |
| $15,000 to $24,999 | 195 | 7.9% |
| $25,000 to $34,999 | 321 | 13.0% |
| $35,000 to $49,999 | 255 | 10.3% |
| $50,000 to $74,999 | 420 | 17.0% |
| $75,000 to $99,999 | 383 | 15.5% |
| $100,000 to $149,999 | 314 | 12.7% |
| $150,000 to $199,999 | 188 | 7.6% |
| $200,000+ | 74 | 3.0% |
Household Income by Householder Age in Colusa
The median household income in Colusa is $59,400, with the highest median household income of $71,523 found in the 45 to 64 years age bracket for the primary householder. A total of 777 households (31.4%) fall into this category. Meanwhile, the 15 to 24 years age bracket for the primary householder has the lowest median household income of $33,421, with 34 households (1.4%) in this group.
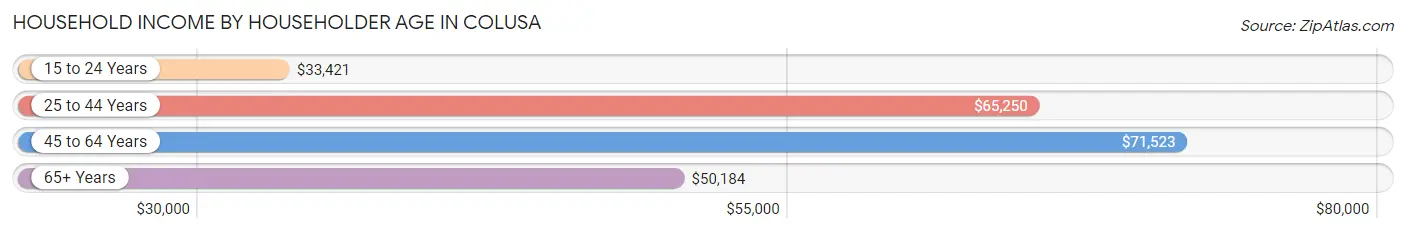
| Income Bracket | # Households | Median Income |
| 15 to 24 Years | 34 (1.4%) | $33,421 |
| 25 to 44 Years | 906 (36.6%) | $65,250 |
| 45 to 64 Years | 777 (31.4%) | $71,523 |
| 65+ Years | 755 (30.5%) | $50,184 |
| Total | 2,472 (100.0%) | $59,400 |
Poverty in Colusa
Income Below Poverty by Sex and Age in Colusa
With 14.2% poverty level for males and 18.3% for females among the residents of Colusa, under 5 year old males and 15 year old females are the most vulnerable to poverty, with 80 males (45.5%) and 29 females (39.7%) in their respective age groups living below the poverty level.
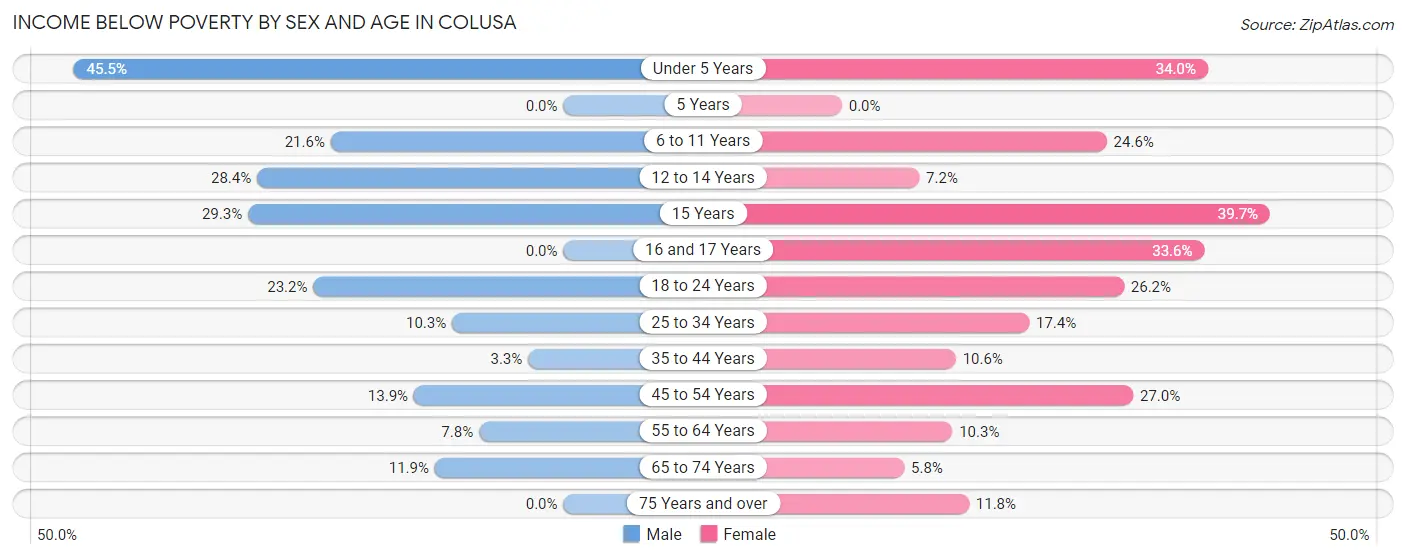
| Age Bracket | Male | Female |
| Under 5 Years | 80 (45.5%) | 72 (34.0%) |
| 5 Years | 0 (0.0%) | 0 (0.0%) |
| 6 to 11 Years | 95 (21.6%) | 59 (24.6%) |
| 12 to 14 Years | 29 (28.4%) | 13 (7.2%) |
| 15 Years | 36 (29.3%) | 29 (39.7%) |
| 16 and 17 Years | 0 (0.0%) | 37 (33.6%) |
| 18 to 24 Years | 39 (23.2%) | 61 (26.2%) |
| 25 to 34 Years | 34 (10.3%) | 65 (17.4%) |
| 35 to 44 Years | 17 (3.3%) | 46 (10.6%) |
| 45 to 54 Years | 43 (13.9%) | 110 (27.0%) |
| 55 to 64 Years | 30 (7.8%) | 29 (10.2%) |
| 65 to 74 Years | 47 (11.9%) | 16 (5.8%) |
| 75 Years and over | 0 (0.0%) | 33 (11.8%) |
| Total | 450 (14.2%) | 570 (18.3%) |
Income Above Poverty by Sex and Age in Colusa
According to the poverty statistics in Colusa, males aged 5 years and females aged 5 years are the age groups that are most secure financially, with 100.0% of males and 100.0% of females in these age groups living above the poverty line.
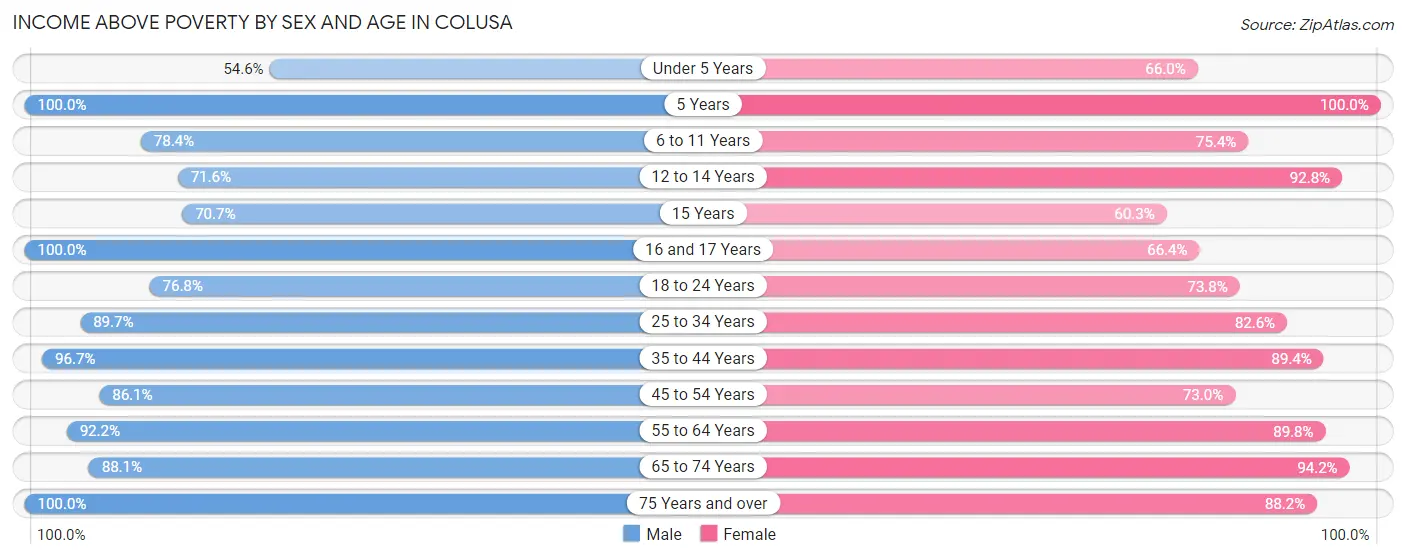
| Age Bracket | Male | Female |
| Under 5 Years | 96 (54.5%) | 140 (66.0%) |
| 5 Years | 46 (100.0%) | 9 (100.0%) |
| 6 to 11 Years | 345 (78.4%) | 181 (75.4%) |
| 12 to 14 Years | 73 (71.6%) | 168 (92.8%) |
| 15 Years | 87 (70.7%) | 44 (60.3%) |
| 16 and 17 Years | 35 (100.0%) | 73 (66.4%) |
| 18 to 24 Years | 129 (76.8%) | 172 (73.8%) |
| 25 to 34 Years | 295 (89.7%) | 309 (82.6%) |
| 35 to 44 Years | 503 (96.7%) | 389 (89.4%) |
| 45 to 54 Years | 267 (86.1%) | 297 (73.0%) |
| 55 to 64 Years | 353 (92.2%) | 254 (89.7%) |
| 65 to 74 Years | 347 (88.1%) | 261 (94.2%) |
| 75 Years and over | 148 (100.0%) | 247 (88.2%) |
| Total | 2,724 (85.8%) | 2,544 (81.7%) |
Income Below Poverty Among Married-Couple Families in Colusa
The poverty statistics for married-couple families in Colusa show that 3.9% or 42 of the total 1,072 families live below the poverty line. Families with 3 or 4 children have the highest poverty rate of 36.4%, comprising of 28 families. On the other hand, families with no children have the lowest poverty rate of 0.0%, which includes 0 families.
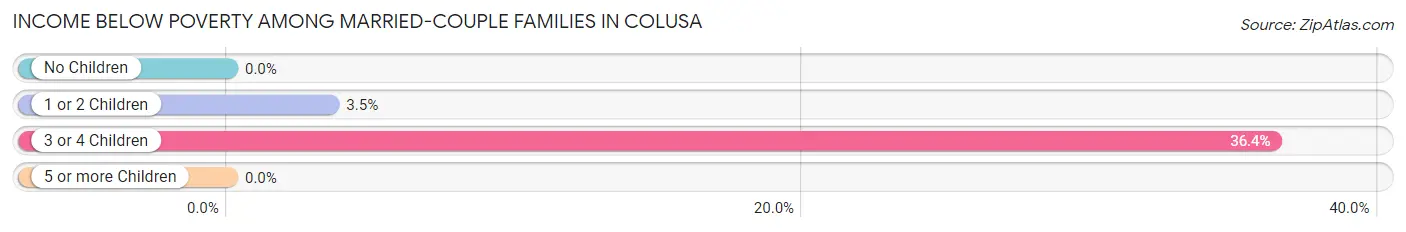
| Children | Above Poverty | Below Poverty |
| No Children | 598 (100.0%) | 0 (0.0%) |
| 1 or 2 Children | 383 (96.5%) | 14 (3.5%) |
| 3 or 4 Children | 49 (63.6%) | 28 (36.4%) |
| 5 or more Children | 0 (0.0%) | 0 (0.0%) |
| Total | 1,030 (96.1%) | 42 (3.9%) |
Income Below Poverty Among Single-Parent Households in Colusa
According to the poverty data in Colusa, 10.0% or 20 single-father households and 43.9% or 176 single-mother households are living below the poverty line. Among single-father households, those with no children have the highest poverty rate, with 20 households (21.3%) experiencing poverty. Likewise, among single-mother households, those with 3 or 4 children have the highest poverty rate, with 83 households (89.2%) falling below the poverty line.
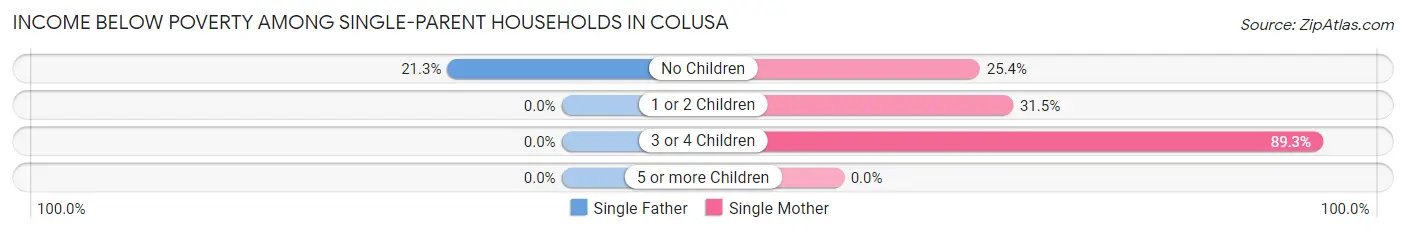
| Children | Single Father | Single Mother |
| No Children | 20 (21.3%) | 17 (25.4%) |
| 1 or 2 Children | 0 (0.0%) | 76 (31.5%) |
| 3 or 4 Children | 0 (0.0%) | 83 (89.2%) |
| 5 or more Children | 0 (0.0%) | 0 (0.0%) |
| Total | 20 (10.0%) | 176 (43.9%) |
Income Below Poverty Among Married-Couple vs Single-Parent Households in Colusa
The poverty data for Colusa shows that 42 of the married-couple family households (3.9%) and 196 of the single-parent households (32.6%) are living below the poverty level. Within the married-couple family households, those with 3 or 4 children have the highest poverty rate, with 28 households (36.4%) falling below the poverty line. Among the single-parent households, those with 3 or 4 children have the highest poverty rate, with 83 household (77.6%) living below poverty.
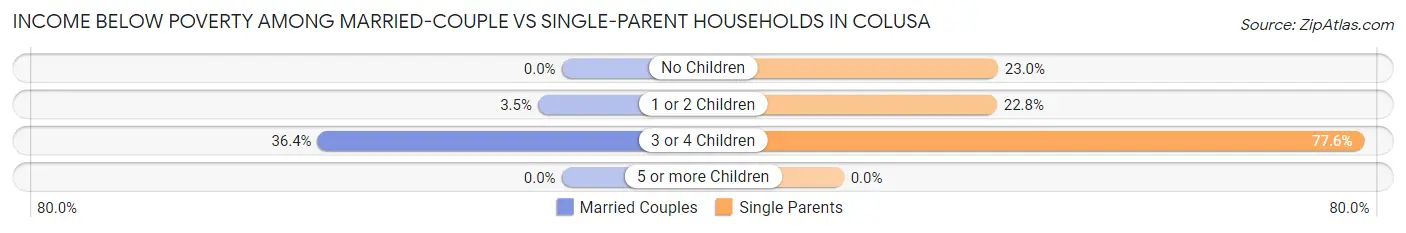
| Children | Married-Couple Families | Single-Parent Households |
| No Children | 0 (0.0%) | 37 (23.0%) |
| 1 or 2 Children | 14 (3.5%) | 76 (22.8%) |
| 3 or 4 Children | 28 (36.4%) | 83 (77.6%) |
| 5 or more Children | 0 (0.0%) | 0 (0.0%) |
| Total | 42 (3.9%) | 196 (32.6%) |
Race in Colusa
The most populous races in Colusa are Hispanic or Latino (3,661 | 57.4%), White / Caucasian (3,443 | 54.0%), and Some other Race (1,433 | 22.5%).
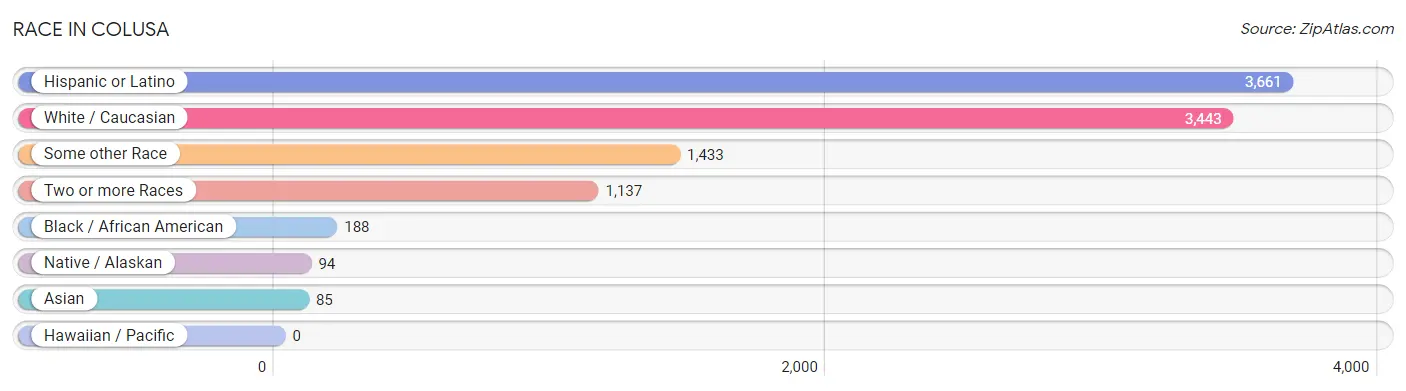
| Race | # Population | % Population |
| Asian | 85 | 1.3% |
| Black / African American | 188 | 2.9% |
| Hawaiian / Pacific | 0 | 0.0% |
| Hispanic or Latino | 3,661 | 57.4% |
| Native / Alaskan | 94 | 1.5% |
| White / Caucasian | 3,443 | 54.0% |
| Two or more Races | 1,137 | 17.8% |
| Some other Race | 1,433 | 22.5% |
| Total | 6,380 | 100.0% |
Ancestry in Colusa
The most populous ancestries reported in Colusa are Mexican (3,584 | 56.2%), German (485 | 7.6%), Irish (451 | 7.1%), English (364 | 5.7%), and Italian (164 | 2.6%), together accounting for 79.1% of all Colusa residents.
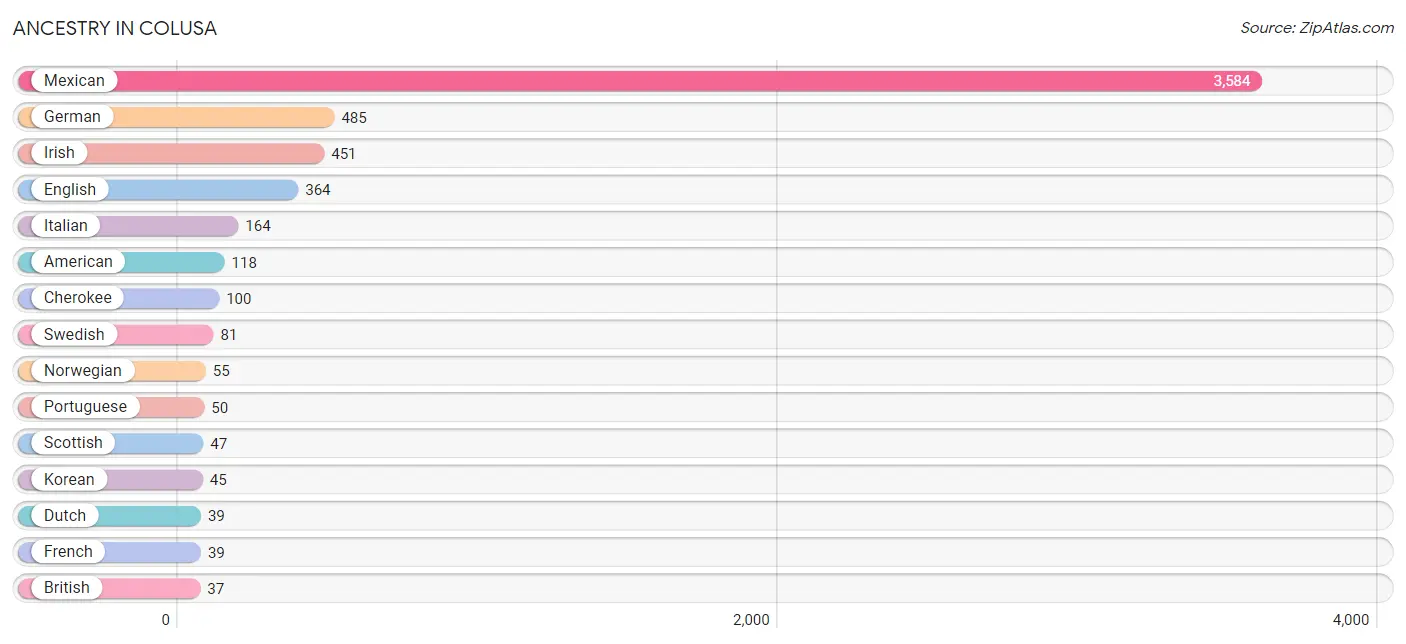
| Ancestry | # Population | % Population |
| American | 118 | 1.8% |
| Austrian | 23 | 0.4% |
| Blackfeet | 11 | 0.2% |
| Brazilian | 1 | 0.0% |
| British | 37 | 0.6% |
| Canadian | 1 | 0.0% |
| Central American | 32 | 0.5% |
| Cherokee | 100 | 1.6% |
| Danish | 27 | 0.4% |
| Dutch | 39 | 0.6% |
| Eastern European | 28 | 0.4% |
| English | 364 | 5.7% |
| European | 32 | 0.5% |
| Finnish | 12 | 0.2% |
| French | 39 | 0.6% |
| French Canadian | 17 | 0.3% |
| German | 485 | 7.6% |
| Greek | 5 | 0.1% |
| Hungarian | 3 | 0.1% |
| Indian (Asian) | 22 | 0.3% |
| Irish | 451 | 7.1% |
| Italian | 164 | 2.6% |
| Japanese | 26 | 0.4% |
| Korean | 45 | 0.7% |
| Lithuanian | 6 | 0.1% |
| Mexican | 3,584 | 56.2% |
| Mexican American Indian | 25 | 0.4% |
| Nicaraguan | 20 | 0.3% |
| Northern European | 2 | 0.0% |
| Norwegian | 55 | 0.9% |
| Polish | 23 | 0.4% |
| Portuguese | 50 | 0.8% |
| Potawatomi | 27 | 0.4% |
| Russian | 3 | 0.1% |
| Salvadoran | 12 | 0.2% |
| Scandinavian | 33 | 0.5% |
| Scotch-Irish | 29 | 0.4% |
| Scottish | 47 | 0.7% |
| Spaniard | 7 | 0.1% |
| Spanish | 6 | 0.1% |
| Swedish | 81 | 1.3% |
| Swiss | 36 | 0.6% |
| Ukrainian | 7 | 0.1% |
| Welsh | 8 | 0.1% | View All 44 Rows |
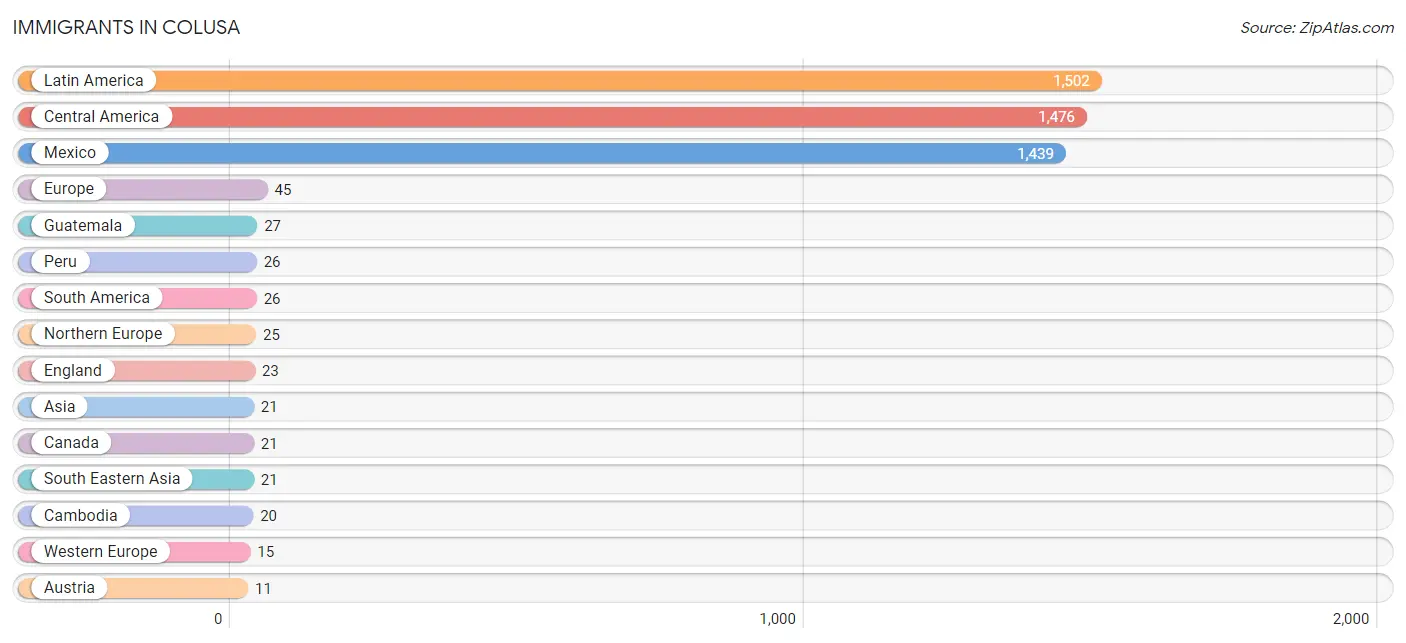
Immigrants in Colusa
The most numerous immigrant groups reported in Colusa came from Latin America (1,502 | 23.5%), Central America (1,476 | 23.1%), Mexico (1,439 | 22.6%), Europe (45 | 0.7%), and Guatemala (27 | 0.4%), together accounting for 70.4% of all Colusa residents.
| Immigration Origin | # Population | % Population |
| Asia | 21 | 0.3% |
| Austria | 11 | 0.2% |
| Azores | 5 | 0.1% |
| Cambodia | 20 | 0.3% |
| Canada | 21 | 0.3% |
| Central America | 1,476 | 23.1% |
| El Salvador | 10 | 0.2% |
| England | 23 | 0.4% |
| Europe | 45 | 0.7% |
| France | 4 | 0.1% |
| Guatemala | 27 | 0.4% |
| Latin America | 1,502 | 23.5% |
| Mexico | 1,439 | 22.6% |
| Northern Europe | 25 | 0.4% |
| Norway | 2 | 0.0% |
| Peru | 26 | 0.4% |
| Philippines | 1 | 0.0% |
| Portugal | 5 | 0.1% |
| South America | 26 | 0.4% |
| South Eastern Asia | 21 | 0.3% |
| Southern Europe | 5 | 0.1% |
| Western Europe | 15 | 0.2% | View All 22 Rows |
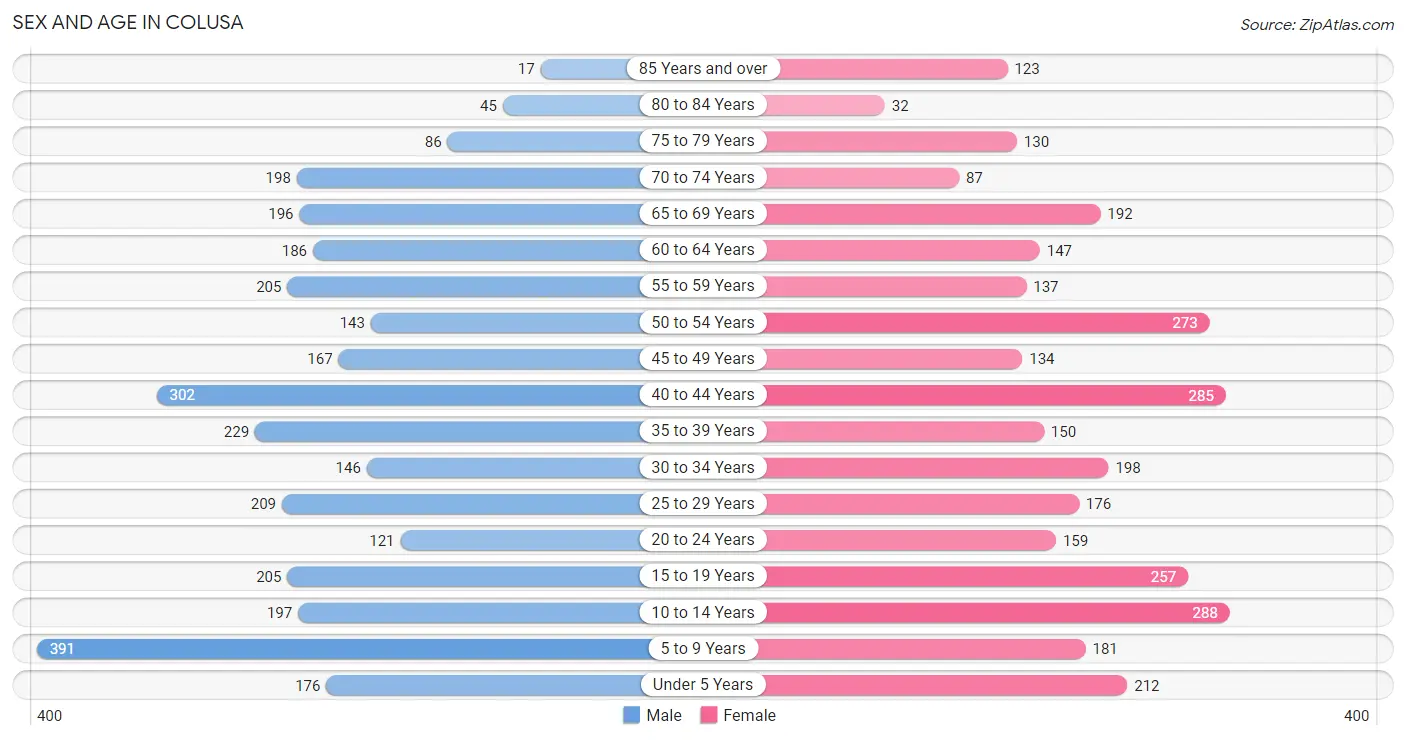
Sex and Age in Colusa
Sex and Age in Colusa
The most populous age groups in Colusa are 5 to 9 Years (391 | 12.1%) for men and 10 to 14 Years (288 | 9.1%) for women.
| Age Bracket | Male | Female |
| Under 5 Years | 176 (5.5%) | 212 (6.7%) |
| 5 to 9 Years | 391 (12.1%) | 181 (5.7%) |
| 10 to 14 Years | 197 (6.1%) | 288 (9.1%) |
| 15 to 19 Years | 205 (6.4%) | 257 (8.1%) |
| 20 to 24 Years | 121 (3.8%) | 159 (5.0%) |
| 25 to 29 Years | 209 (6.5%) | 176 (5.6%) |
| 30 to 34 Years | 146 (4.5%) | 198 (6.3%) |
| 35 to 39 Years | 229 (7.1%) | 150 (4.8%) |
| 40 to 44 Years | 302 (9.4%) | 285 (9.0%) |
| 45 to 49 Years | 167 (5.2%) | 134 (4.2%) |
| 50 to 54 Years | 143 (4.4%) | 273 (8.6%) |
| 55 to 59 Years | 205 (6.4%) | 137 (4.3%) |
| 60 to 64 Years | 186 (5.8%) | 147 (4.6%) |
| 65 to 69 Years | 196 (6.1%) | 192 (6.1%) |
| 70 to 74 Years | 198 (6.1%) | 87 (2.8%) |
| 75 to 79 Years | 86 (2.7%) | 130 (4.1%) |
| 80 to 84 Years | 45 (1.4%) | 32 (1.0%) |
| 85 Years and over | 17 (0.5%) | 123 (3.9%) |
| Total | 3,219 (100.0%) | 3,161 (100.0%) |
Families and Households in Colusa
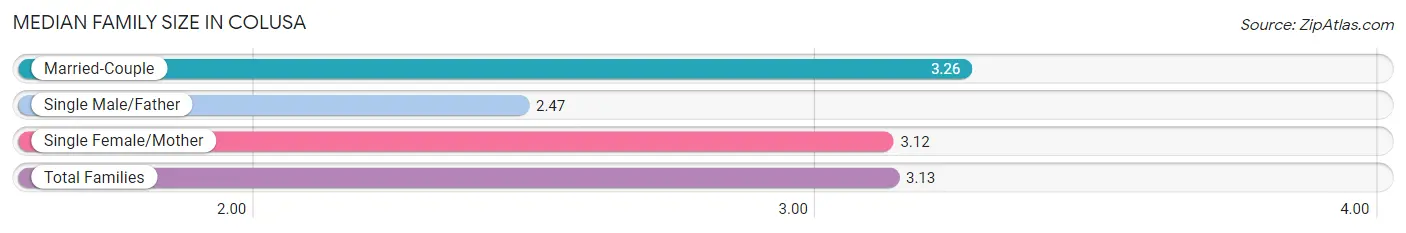
Median Family Size in Colusa
The median family size in Colusa is 3.13 persons per family, with married-couple families (1,072 | 64.1%) accounting for the largest median family size of 3.26 persons per family. On the other hand, single male/father families (200 | 11.9%) represent the smallest median family size with 2.47 persons per family.
| Family Type | # Families | Family Size |
| Married-Couple | 1,072 (64.1%) | 3.26 |
| Single Male/Father | 200 (11.9%) | 2.47 |
| Single Female/Mother | 401 (24.0%) | 3.12 |
| Total Families | 1,673 (100.0%) | 3.13 |
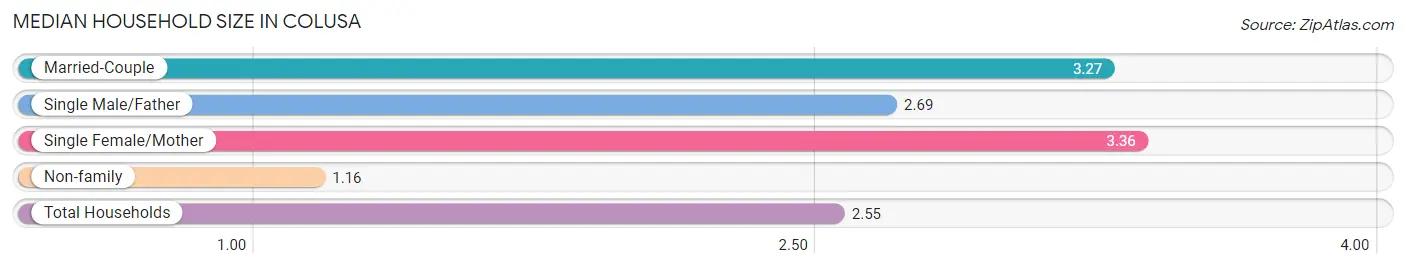
Median Household Size in Colusa
The median household size in Colusa is 2.55 persons per household, with single female/mother households (401 | 16.2%) accounting for the largest median household size of 3.36 persons per household. non-family households (799 | 32.3%) represent the smallest median household size with 1.16 persons per household.
| Household Type | # Households | Household Size |
| Married-Couple | 1,072 (43.4%) | 3.27 |
| Single Male/Father | 200 (8.1%) | 2.69 |
| Single Female/Mother | 401 (16.2%) | 3.36 |
| Non-family | 799 (32.3%) | 1.16 |
| Total Households | 2,472 (100.0%) | 2.55 |
Household Size by Marriage Status in Colusa
Out of a total of 2,472 households in Colusa, 1,673 (67.7%) are family households, while 799 (32.3%) are nonfamily households. The most numerous type of family households are 2-person households, comprising 787, and the most common type of nonfamily households are 1-person households, comprising 661.
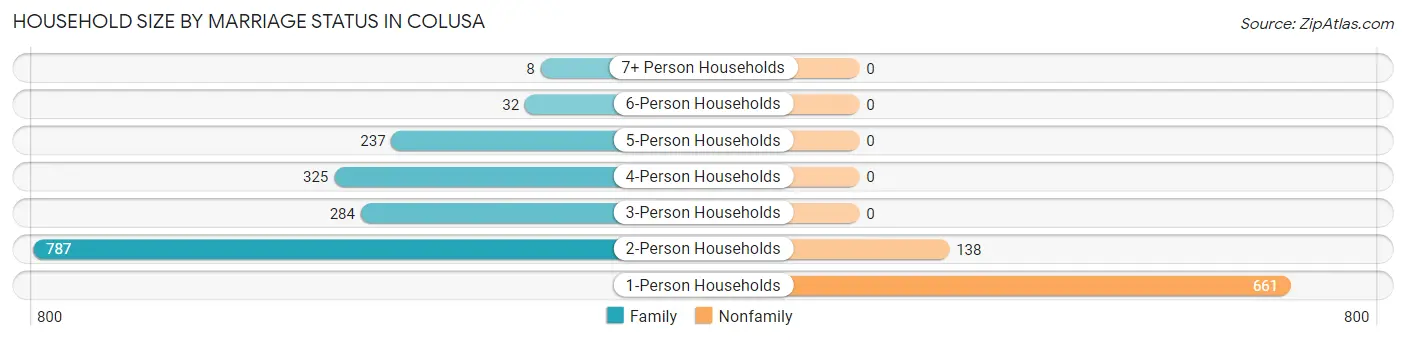
| Household Size | Family Households | Nonfamily Households |
| 1-Person Households | - | 661 (26.7%) |
| 2-Person Households | 787 (31.8%) | 138 (5.6%) |
| 3-Person Households | 284 (11.5%) | 0 (0.0%) |
| 4-Person Households | 325 (13.2%) | 0 (0.0%) |
| 5-Person Households | 237 (9.6%) | 0 (0.0%) |
| 6-Person Households | 32 (1.3%) | 0 (0.0%) |
| 7+ Person Households | 8 (0.3%) | 0 (0.0%) |
| Total | 1,673 (67.7%) | 799 (32.3%) |
Female Fertility in Colusa
Fertility by Age in Colusa
Average fertility rate in Colusa is 23.0 births per 1,000 women. Women in the age bracket of 20 to 34 years have the highest fertility rate with 60.0 births per 1,000 women. Women in the age bracket of 20 to 34 years acount for 100.0% of all women with births.
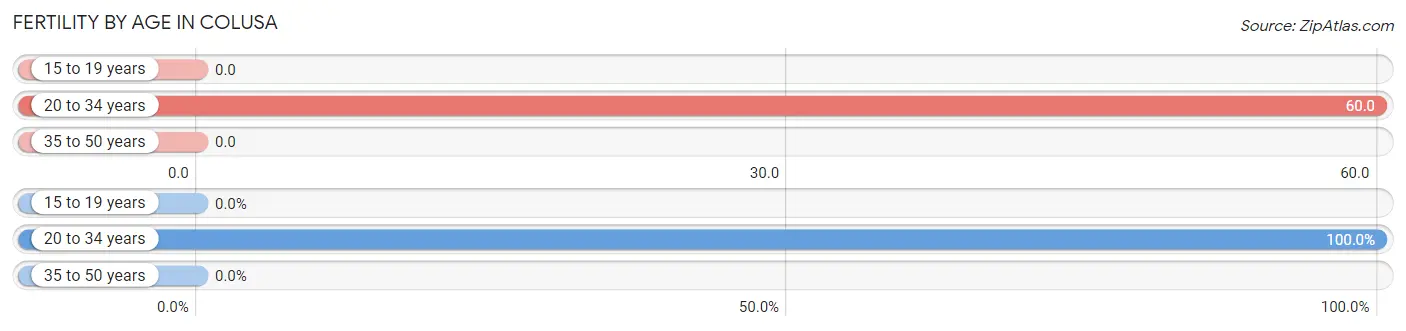
| Age Bracket | Women with Births | Births / 1,000 Women |
| 15 to 19 years | 0 (0.0%) | 0.0 |
| 20 to 34 years | 32 (100.0%) | 60.0 |
| 35 to 50 years | 0 (0.0%) | 0.0 |
| Total | 32 (100.0%) | 23.0 |
Fertility by Age by Marriage Status in Colusa
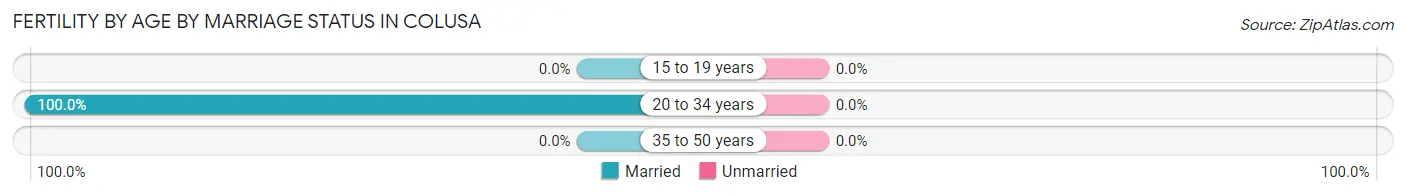
| Age Bracket | Married | Unmarried |
| 15 to 19 years | 0 (0.0%) | 0 (0.0%) |
| 20 to 34 years | 32 (100.0%) | 0 (0.0%) |
| 35 to 50 years | 0 (0.0%) | 0 (0.0%) |
| Total | 32 (100.0%) | 0 (0.0%) |
Fertility by Education in Colusa
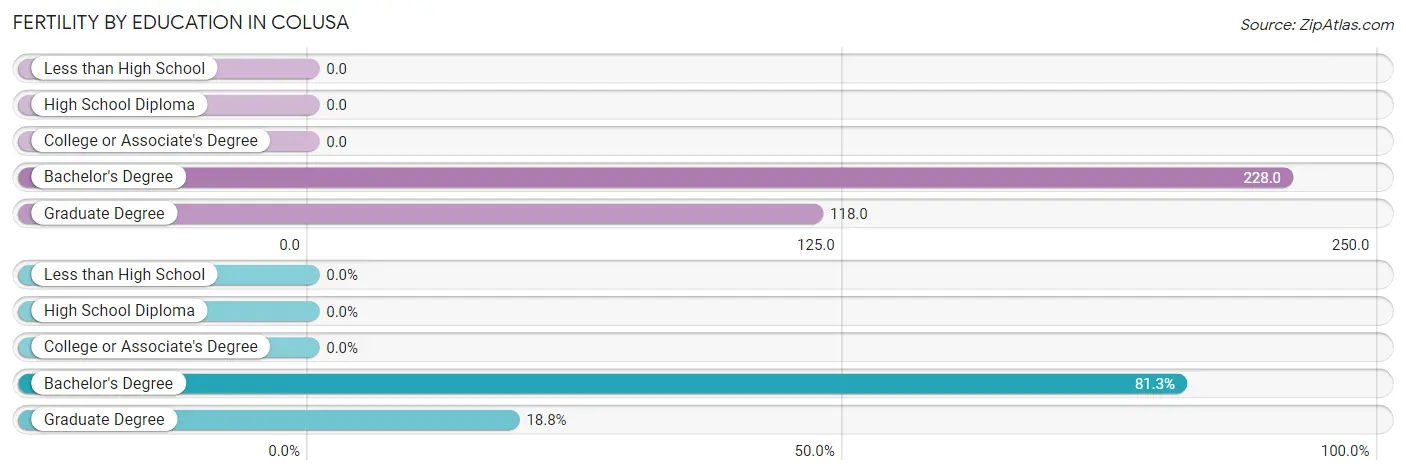
| Educational Attainment | Women with Births | Births / 1,000 Women |
| Less than High School | 0 (0.0%) | 0.0 |
| High School Diploma | 0 (0.0%) | 0.0 |
| College or Associate's Degree | 0 (0.0%) | 0.0 |
| Bachelor's Degree | 26 (81.2%) | 228.0 |
| Graduate Degree | 6 (18.8%) | 118.0 |
| Total | 32 (100.0%) | 23.0 |
Fertility by Education by Marriage Status in Colusa
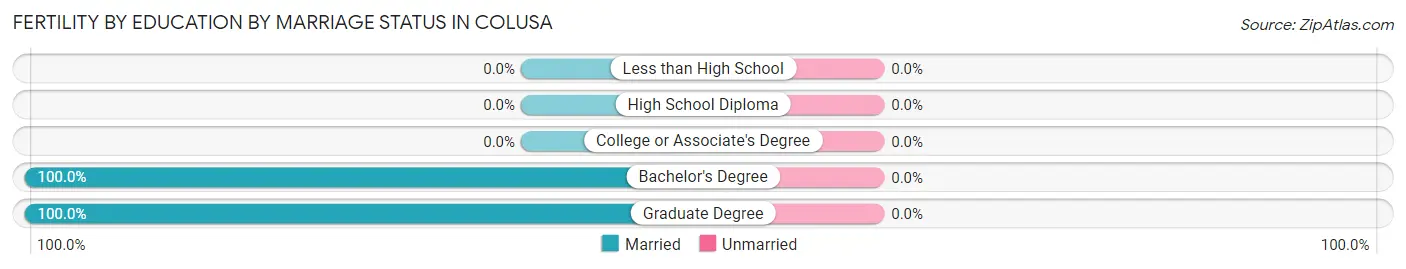
| Educational Attainment | Married | Unmarried |
| Less than High School | 0 (0.0%) | 0 (0.0%) |
| High School Diploma | 0 (0.0%) | 0 (0.0%) |
| College or Associate's Degree | 0 (0.0%) | 0 (0.0%) |
| Bachelor's Degree | 26 (100.0%) | 0 (0.0%) |
| Graduate Degree | 6 (100.0%) | 0 (0.0%) |
| Total | 32 (100.0%) | 0 (0.0%) |
Employment Characteristics in Colusa
Employment by Class of Employer in Colusa
Among the 2,605 employed individuals in Colusa, private company employees (1,672 | 64.2%), local government employees (485 | 18.6%), and not-for-profit organizations (191 | 7.3%) make up the most common classes of employment.
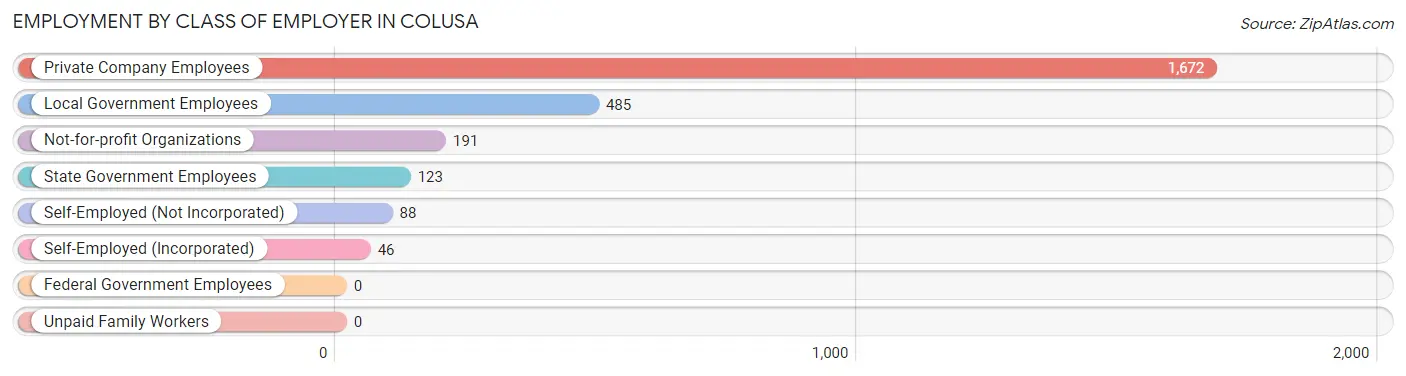
| Employer Class | # Employees | % Employees |
| Private Company Employees | 1,672 | 64.2% |
| Self-Employed (Incorporated) | 46 | 1.8% |
| Self-Employed (Not Incorporated) | 88 | 3.4% |
| Not-for-profit Organizations | 191 | 7.3% |
| Local Government Employees | 485 | 18.6% |
| State Government Employees | 123 | 4.7% |
| Federal Government Employees | 0 | 0.0% |
| Unpaid Family Workers | 0 | 0.0% |
| Total | 2,605 | 100.0% |
Employment Status by Age in Colusa
According to the labor force statistics for Colusa, out of the total population over 16 years of age (4,739), 60.9% or 2,886 individuals are in the labor force, with 6.2% or 179 of them unemployed. The age group with the highest labor force participation rate is 20 to 24 years, with 94.6% or 265 individuals in the labor force. Within the labor force, the 16 to 19 years age range has the highest percentage of unemployed individuals, with 69.4% or 34 of them being unemployed.
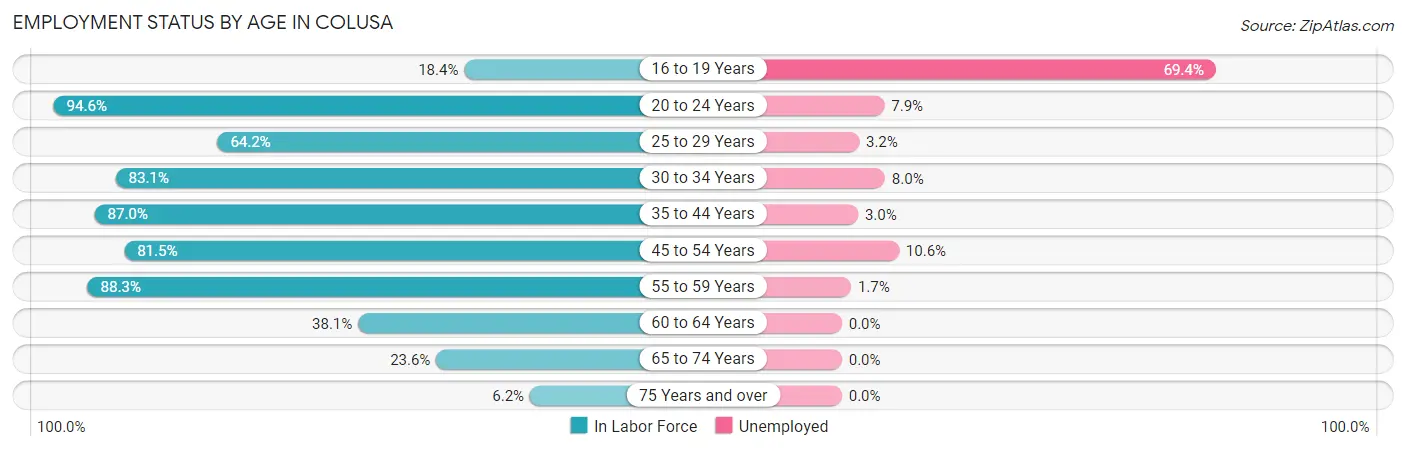
| Age Bracket | In Labor Force | Unemployed |
| 16 to 19 Years | 49 (18.4%) | 34 (69.4%) |
| 20 to 24 Years | 265 (94.6%) | 21 (7.9%) |
| 25 to 29 Years | 247 (64.2%) | 8 (3.2%) |
| 30 to 34 Years | 286 (83.1%) | 23 (8.0%) |
| 35 to 44 Years | 840 (87.0%) | 25 (3.0%) |
| 45 to 54 Years | 584 (81.5%) | 62 (10.6%) |
| 55 to 59 Years | 302 (88.3%) | 5 (1.7%) |
| 60 to 64 Years | 127 (38.1%) | 0 (0.0%) |
| 65 to 74 Years | 159 (23.6%) | 0 (0.0%) |
| 75 Years and over | 27 (6.2%) | 0 (0.0%) |
| Total | 2,886 (60.9%) | 179 (6.2%) |
Employment Status by Educational Attainment in Colusa
According to labor force statistics for Colusa, 77.3% of individuals (2,386) out of the total population between 25 and 64 years of age (3,087) are in the labor force, with 5.2% or 124 of them being unemployed. The group with the highest labor force participation rate are those with the educational attainment of less than high school, with 88.6% or 574 individuals in the labor force. Within the labor force, individuals with less than high school education have the highest percentage of unemployment, with 11.1% or 64 of them being unemployed.
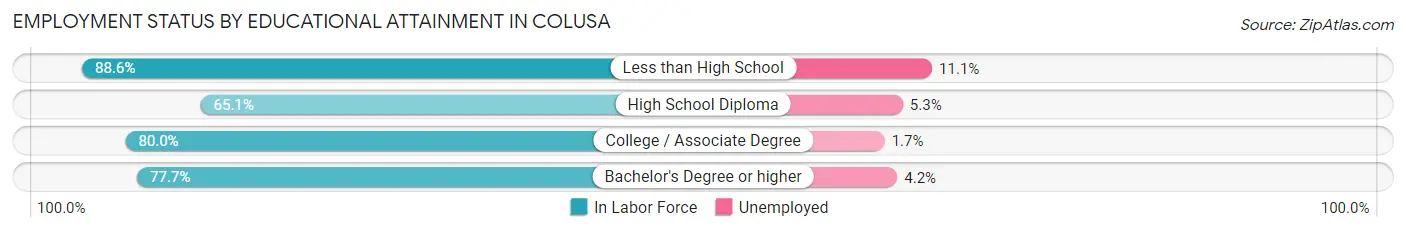
| Educational Attainment | In Labor Force | Unemployed |
| Less than High School | 574 (88.6%) | 72 (11.1%) |
| High School Diploma | 567 (65.1%) | 46 (5.3%) |
| College / Associate Degree | 938 (80.0%) | 20 (1.7%) |
| Bachelor's Degree or higher | 307 (77.7%) | 17 (4.2%) |
| Total | 2,386 (77.3%) | 161 (5.2%) |
Employment Occupations by Sex in Colusa
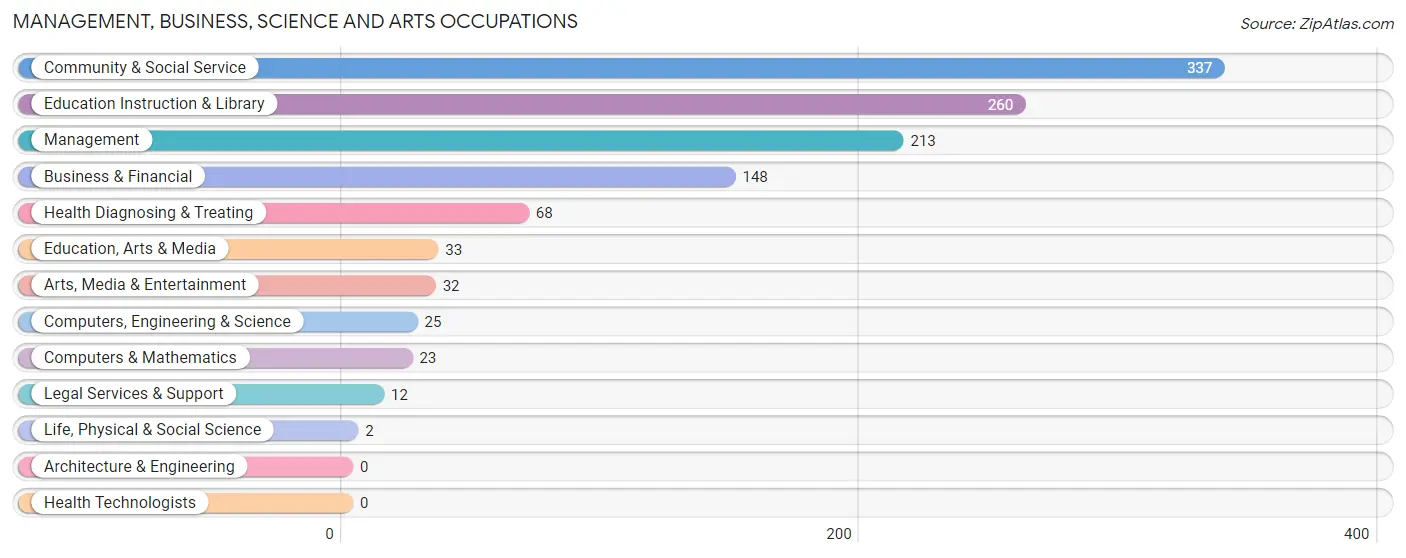
Management, Business, Science and Arts Occupations
The most common Management, Business, Science and Arts occupations in Colusa are Community & Social Service (337 | 12.4%), Education Instruction & Library (260 | 9.6%), Management (213 | 7.9%), Business & Financial (148 | 5.5%), and Health Diagnosing & Treating (68 | 2.5%).
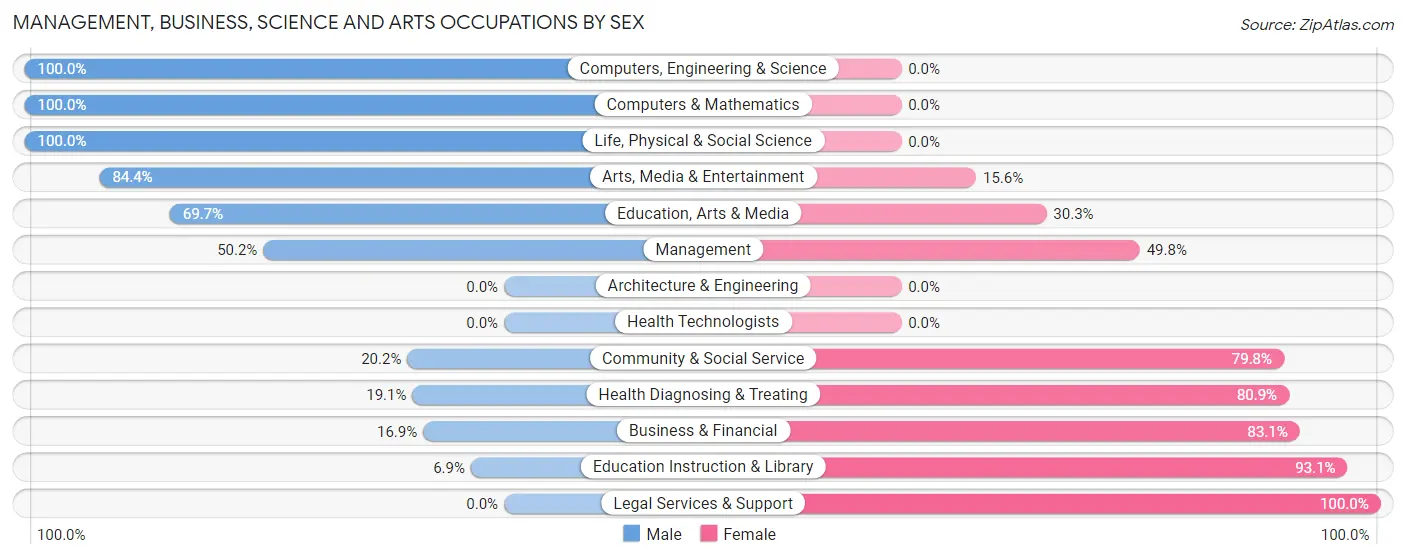
Management, Business, Science and Arts Occupations by Sex
Within the Management, Business, Science and Arts occupations in Colusa, the most male-oriented occupations are Computers, Engineering & Science (100.0%), Computers & Mathematics (100.0%), and Life, Physical & Social Science (100.0%), while the most female-oriented occupations are Legal Services & Support (100.0%), Education Instruction & Library (93.1%), and Business & Financial (83.1%).
| Occupation | Male | Female |
| Management | 107 (50.2%) | 106 (49.8%) |
| Business & Financial | 25 (16.9%) | 123 (83.1%) |
| Computers, Engineering & Science | 25 (100.0%) | 0 (0.0%) |
| Computers & Mathematics | 23 (100.0%) | 0 (0.0%) |
| Architecture & Engineering | 0 (0.0%) | 0 (0.0%) |
| Life, Physical & Social Science | 2 (100.0%) | 0 (0.0%) |
| Community & Social Service | 68 (20.2%) | 269 (79.8%) |
| Education, Arts & Media | 23 (69.7%) | 10 (30.3%) |
| Legal Services & Support | 0 (0.0%) | 12 (100.0%) |
| Education Instruction & Library | 18 (6.9%) | 242 (93.1%) |
| Arts, Media & Entertainment | 27 (84.4%) | 5 (15.6%) |
| Health Diagnosing & Treating | 13 (19.1%) | 55 (80.9%) |
| Health Technologists | 0 (0.0%) | 0 (0.0%) |
| Total (Category) | 238 (30.1%) | 553 (69.9%) |
| Total (Overall) | 1,466 (54.1%) | 1,242 (45.9%) |
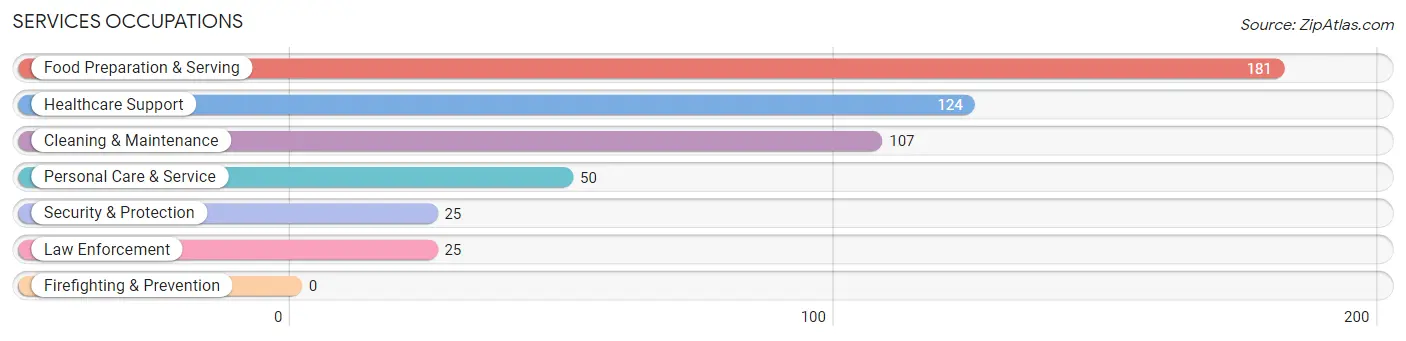
Services Occupations
The most common Services occupations in Colusa are Food Preparation & Serving (181 | 6.7%), Healthcare Support (124 | 4.6%), Cleaning & Maintenance (107 | 4.0%), Personal Care & Service (50 | 1.8%), and Security & Protection (25 | 0.9%).
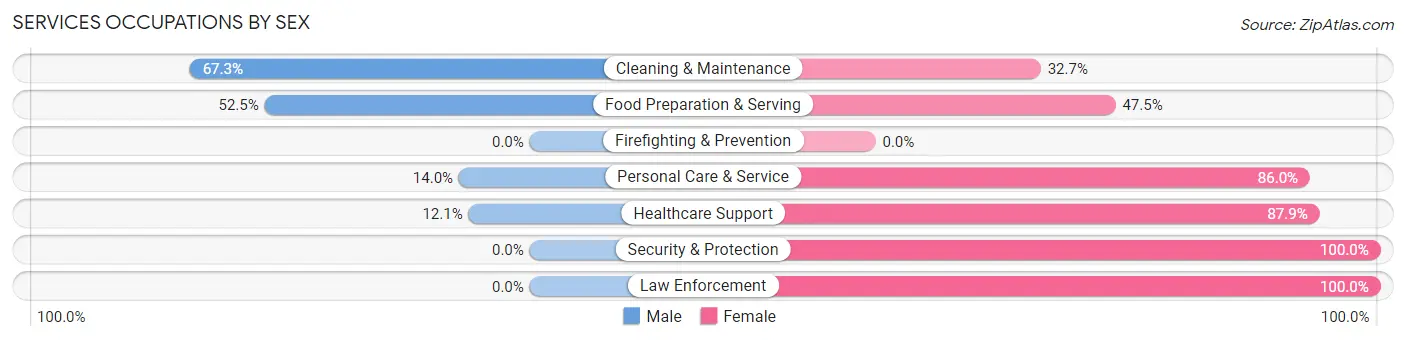
Services Occupations by Sex
Within the Services occupations in Colusa, the most male-oriented occupations are Cleaning & Maintenance (67.3%), Food Preparation & Serving (52.5%), and Personal Care & Service (14.0%), while the most female-oriented occupations are Security & Protection (100.0%), Law Enforcement (100.0%), and Healthcare Support (87.9%).
| Occupation | Male | Female |
| Healthcare Support | 15 (12.1%) | 109 (87.9%) |
| Security & Protection | 0 (0.0%) | 25 (100.0%) |
| Firefighting & Prevention | 0 (0.0%) | 0 (0.0%) |
| Law Enforcement | 0 (0.0%) | 25 (100.0%) |
| Food Preparation & Serving | 95 (52.5%) | 86 (47.5%) |
| Cleaning & Maintenance | 72 (67.3%) | 35 (32.7%) |
| Personal Care & Service | 7 (14.0%) | 43 (86.0%) |
| Total (Category) | 189 (38.8%) | 298 (61.2%) |
| Total (Overall) | 1,466 (54.1%) | 1,242 (45.9%) |
Sales and Office Occupations
The most common Sales and Office occupations in Colusa are Office & Administration (236 | 8.7%), and Sales & Related (96 | 3.5%).
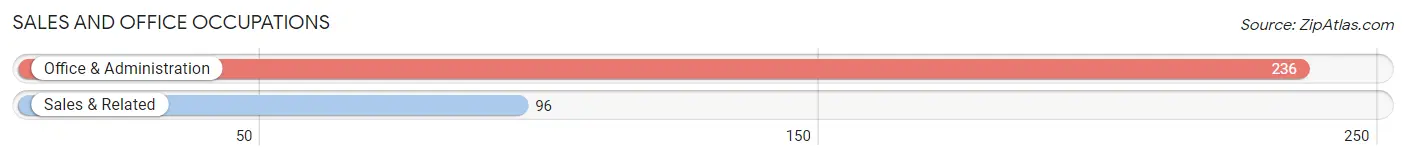
Sales and Office Occupations by Sex

| Occupation | Male | Female |
| Sales & Related | 21 (21.9%) | 75 (78.1%) |
| Office & Administration | 41 (17.4%) | 195 (82.6%) |
| Total (Category) | 62 (18.7%) | 270 (81.3%) |
| Total (Overall) | 1,466 (54.1%) | 1,242 (45.9%) |
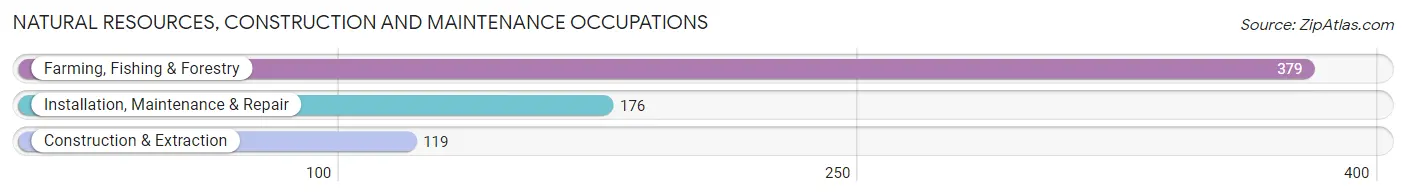
Natural Resources, Construction and Maintenance Occupations
The most common Natural Resources, Construction and Maintenance occupations in Colusa are Farming, Fishing & Forestry (379 | 14.0%), Installation, Maintenance & Repair (176 | 6.5%), and Construction & Extraction (119 | 4.4%).
Natural Resources, Construction and Maintenance Occupations by Sex
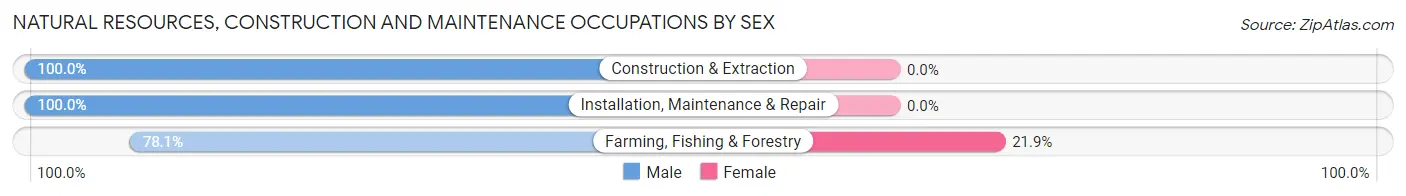
| Occupation | Male | Female |
| Farming, Fishing & Forestry | 296 (78.1%) | 83 (21.9%) |
| Construction & Extraction | 119 (100.0%) | 0 (0.0%) |
| Installation, Maintenance & Repair | 176 (100.0%) | 0 (0.0%) |
| Total (Category) | 591 (87.7%) | 83 (12.3%) |
| Total (Overall) | 1,466 (54.1%) | 1,242 (45.9%) |
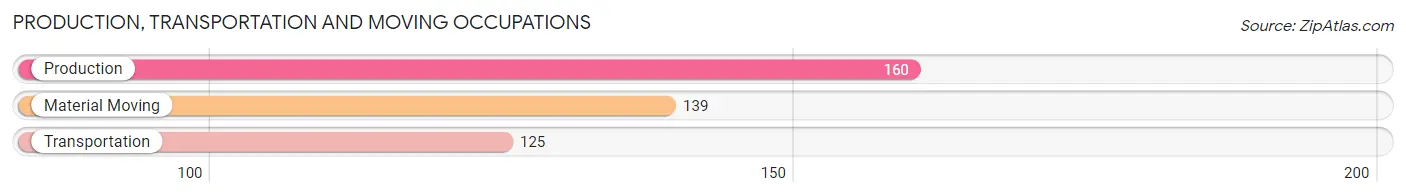
Production, Transportation and Moving Occupations
The most common Production, Transportation and Moving occupations in Colusa are Production (160 | 5.9%), Material Moving (139 | 5.1%), and Transportation (125 | 4.6%).
Production, Transportation and Moving Occupations by Sex
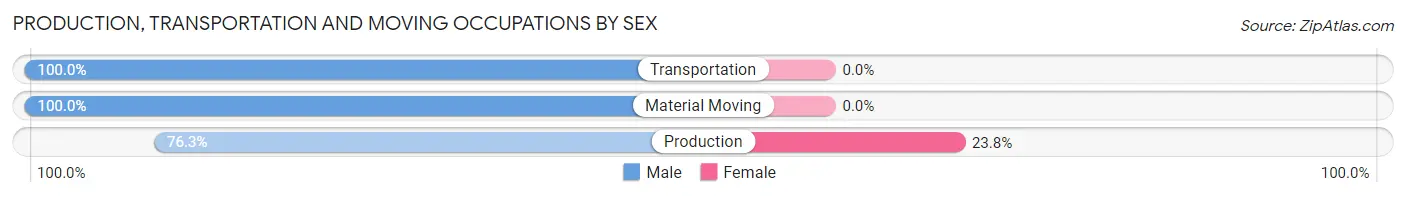
| Occupation | Male | Female |
| Production | 122 (76.2%) | 38 (23.7%) |
| Transportation | 125 (100.0%) | 0 (0.0%) |
| Material Moving | 139 (100.0%) | 0 (0.0%) |
| Total (Category) | 386 (91.0%) | 38 (9.0%) |
| Total (Overall) | 1,466 (54.1%) | 1,242 (45.9%) |
Employment Industries by Sex in Colusa
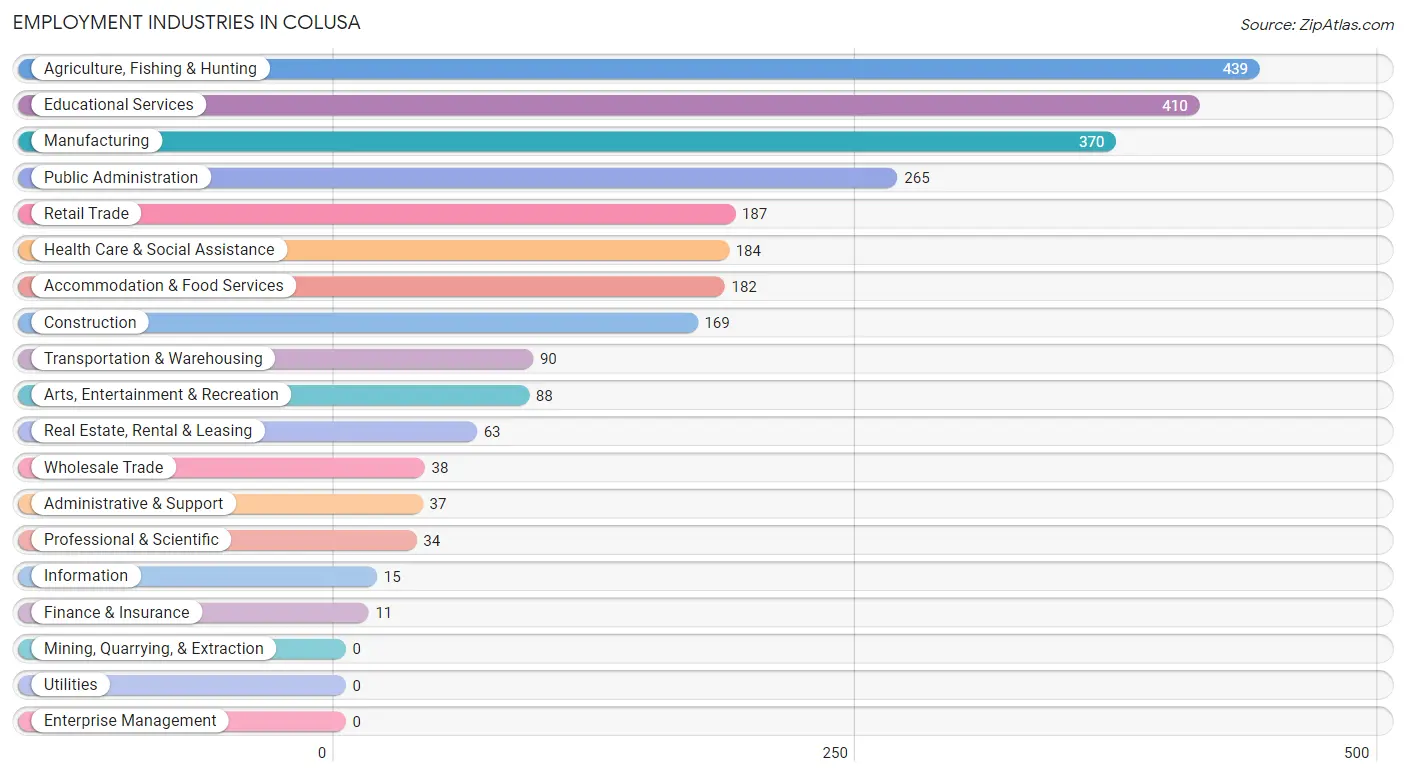
Employment Industries in Colusa
The major employment industries in Colusa include Agriculture, Fishing & Hunting (439 | 16.2%), Educational Services (410 | 15.1%), Manufacturing (370 | 13.7%), Public Administration (265 | 9.8%), and Retail Trade (187 | 6.9%).
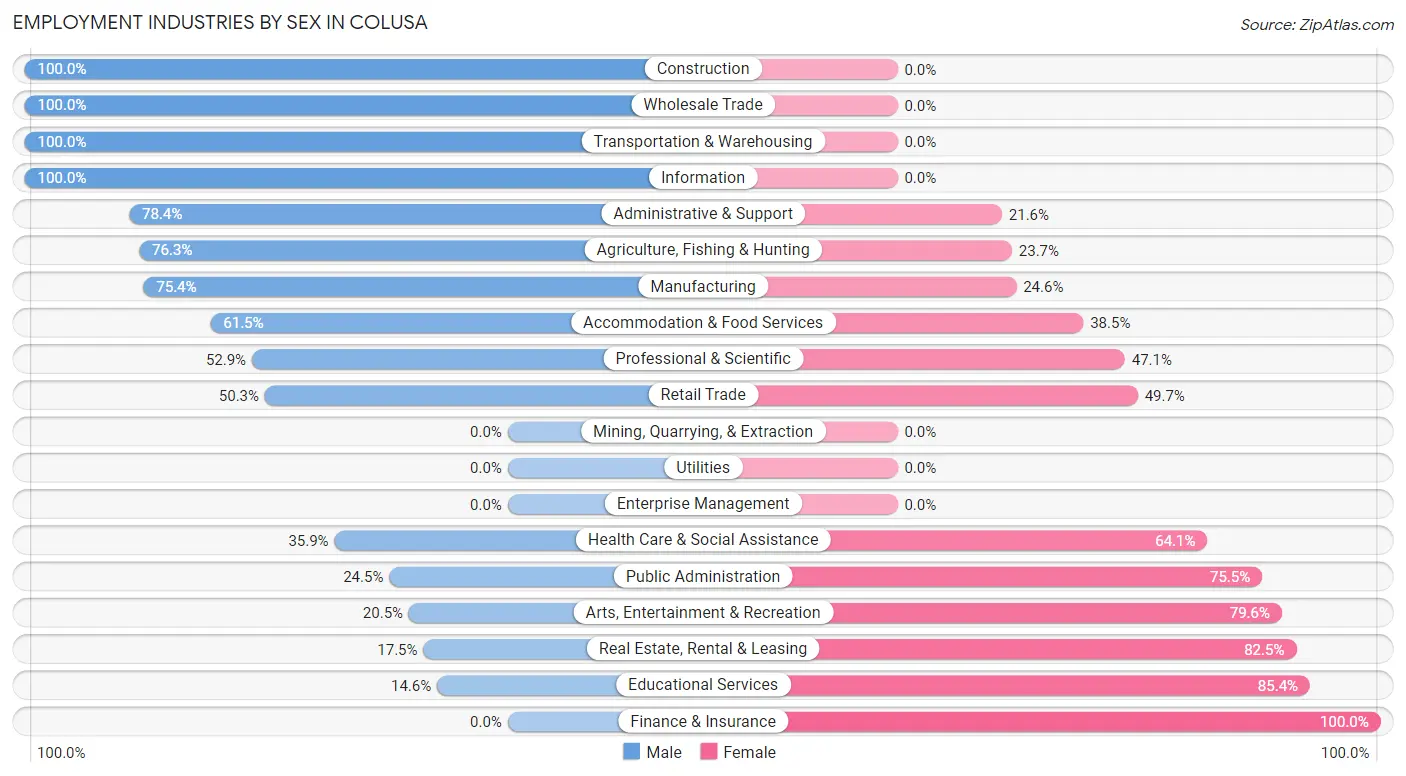
Employment Industries by Sex in Colusa
The Colusa industries that see more men than women are Construction (100.0%), Wholesale Trade (100.0%), and Transportation & Warehousing (100.0%), whereas the industries that tend to have a higher number of women are Finance & Insurance (100.0%), Educational Services (85.4%), and Real Estate, Rental & Leasing (82.5%).
| Industry | Male | Female |
| Agriculture, Fishing & Hunting | 335 (76.3%) | 104 (23.7%) |
| Mining, Quarrying, & Extraction | 0 (0.0%) | 0 (0.0%) |
| Construction | 169 (100.0%) | 0 (0.0%) |
| Manufacturing | 279 (75.4%) | 91 (24.6%) |
| Wholesale Trade | 38 (100.0%) | 0 (0.0%) |
| Retail Trade | 94 (50.3%) | 93 (49.7%) |
| Transportation & Warehousing | 90 (100.0%) | 0 (0.0%) |
| Utilities | 0 (0.0%) | 0 (0.0%) |
| Information | 15 (100.0%) | 0 (0.0%) |
| Finance & Insurance | 0 (0.0%) | 11 (100.0%) |
| Real Estate, Rental & Leasing | 11 (17.5%) | 52 (82.5%) |
| Professional & Scientific | 18 (52.9%) | 16 (47.1%) |
| Enterprise Management | 0 (0.0%) | 0 (0.0%) |
| Administrative & Support | 29 (78.4%) | 8 (21.6%) |
| Educational Services | 60 (14.6%) | 350 (85.4%) |
| Health Care & Social Assistance | 66 (35.9%) | 118 (64.1%) |
| Arts, Entertainment & Recreation | 18 (20.4%) | 70 (79.5%) |
| Accommodation & Food Services | 112 (61.5%) | 70 (38.5%) |
| Public Administration | 65 (24.5%) | 200 (75.5%) |
| Total | 1,466 (54.1%) | 1,242 (45.9%) |
Education in Colusa
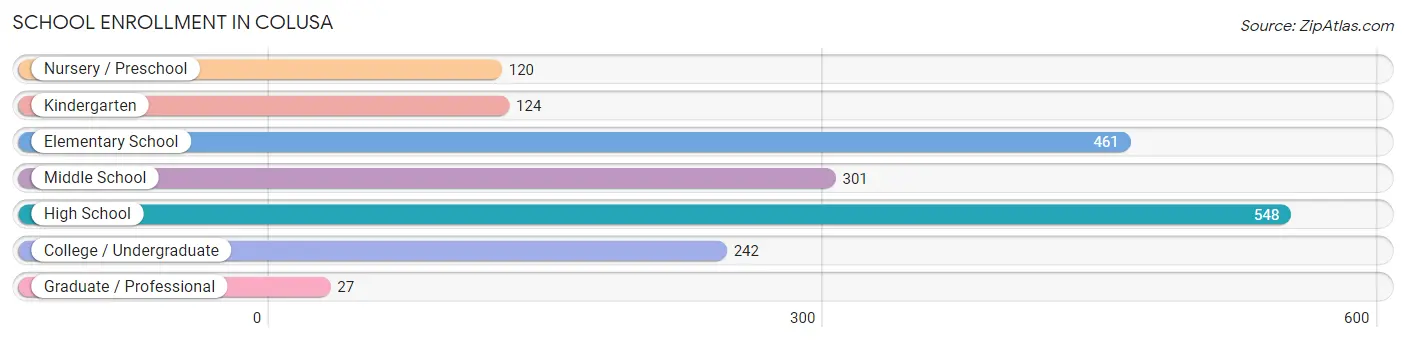
School Enrollment in Colusa
The most common levels of schooling among the 1,823 students in Colusa are high school (548 | 30.1%), elementary school (461 | 25.3%), and middle school (301 | 16.5%).
| School Level | # Students | % Students |
| Nursery / Preschool | 120 | 6.6% |
| Kindergarten | 124 | 6.8% |
| Elementary School | 461 | 25.3% |
| Middle School | 301 | 16.5% |
| High School | 548 | 30.1% |
| College / Undergraduate | 242 | 13.3% |
| Graduate / Professional | 27 | 1.5% |
| Total | 1,823 | 100.0% |
School Enrollment by Age by Funding Source in Colusa
Out of a total of 1,823 students who are enrolled in schools in Colusa, 89 (4.9%) attend a private institution, while the remaining 1,734 (95.1%) are enrolled in public schools. The age group of 35 years and over has the highest likelihood of being enrolled in private schools, with 8 (27.6% in the age bracket) enrolled. Conversely, the age group of 5 to 9 year old has the lowest likelihood of being enrolled in a private school, with 562 (100.0% in the age bracket) attending a public institution.
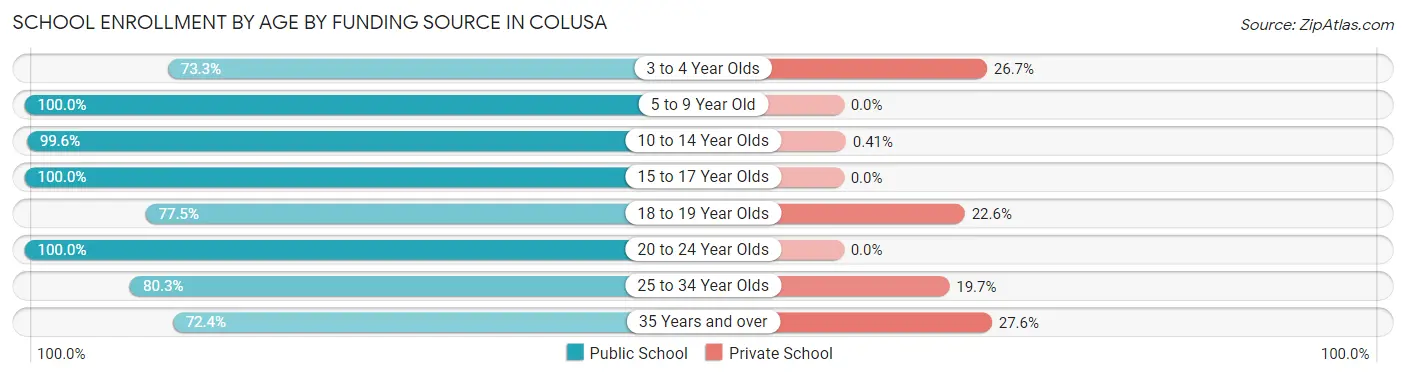
| Age Bracket | Public School | Private School |
| 3 to 4 Year Olds | 88 (73.3%) | 32 (26.7%) |
| 5 to 9 Year Old | 562 (100.0%) | 0 (0.0%) |
| 10 to 14 Year Olds | 480 (99.6%) | 2 (0.4%) |
| 15 to 17 Year Olds | 333 (100.0%) | 0 (0.0%) |
| 18 to 19 Year Olds | 79 (77.4%) | 23 (22.6%) |
| 20 to 24 Year Olds | 73 (100.0%) | 0 (0.0%) |
| 25 to 34 Year Olds | 98 (80.3%) | 24 (19.7%) |
| 35 Years and over | 21 (72.4%) | 8 (27.6%) |
| Total | 1,734 (95.1%) | 89 (4.9%) |
Educational Attainment by Field of Study in Colusa
Education (136 | 20.4%), business (128 | 19.2%), bio, nature & agricultural (95 | 14.2%), visual & performing arts (49 | 7.3%), and computers & mathematics (44 | 6.6%) are the most common fields of study among 667 individuals in Colusa who have obtained a bachelor's degree or higher.
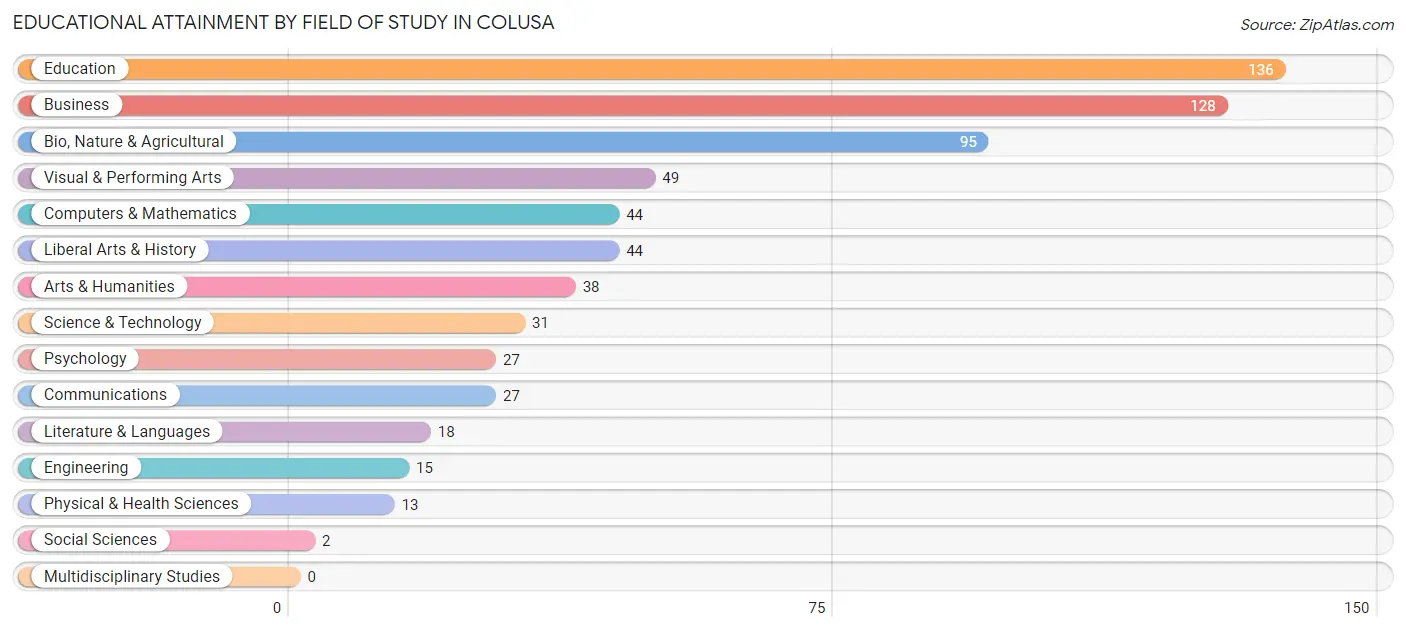
| Field of Study | # Graduates | % Graduates |
| Computers & Mathematics | 44 | 6.6% |
| Bio, Nature & Agricultural | 95 | 14.2% |
| Physical & Health Sciences | 13 | 1.9% |
| Psychology | 27 | 4.1% |
| Social Sciences | 2 | 0.3% |
| Engineering | 15 | 2.2% |
| Multidisciplinary Studies | 0 | 0.0% |
| Science & Technology | 31 | 4.6% |
| Business | 128 | 19.2% |
| Education | 136 | 20.4% |
| Literature & Languages | 18 | 2.7% |
| Liberal Arts & History | 44 | 6.6% |
| Visual & Performing Arts | 49 | 7.3% |
| Communications | 27 | 4.1% |
| Arts & Humanities | 38 | 5.7% |
| Total | 667 | 100.0% |
Transportation & Commute in Colusa
Vehicle Availability by Sex in Colusa
The most prevalent vehicle ownership categories in Colusa are males with 3 vehicles (556, accounting for 38.7%) and females with 3 vehicles (455, making up 47.6%).
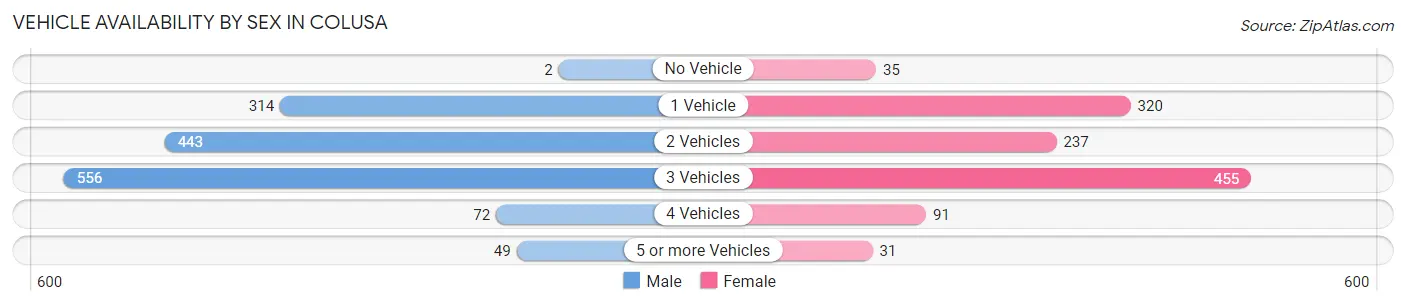
| Vehicles Available | Male | Female |
| No Vehicle | 2 (0.1%) | 35 (3.0%) |
| 1 Vehicle | 314 (21.9%) | 320 (27.4%) |
| 2 Vehicles | 443 (30.8%) | 237 (20.3%) |
| 3 Vehicles | 556 (38.7%) | 455 (38.9%) |
| 4 Vehicles | 72 (5.0%) | 91 (7.8%) |
| 5 or more Vehicles | 49 (3.4%) | 31 (2.6%) |
| Total | 1,436 (100.0%) | 1,169 (100.0%) |
Commute Time in Colusa
The most frequently occuring commute durations in Colusa are 5 to 9 minutes (414 commuters, 16.3%), 15 to 19 minutes (360 commuters, 14.2%), and 20 to 24 minutes (318 commuters, 12.5%).
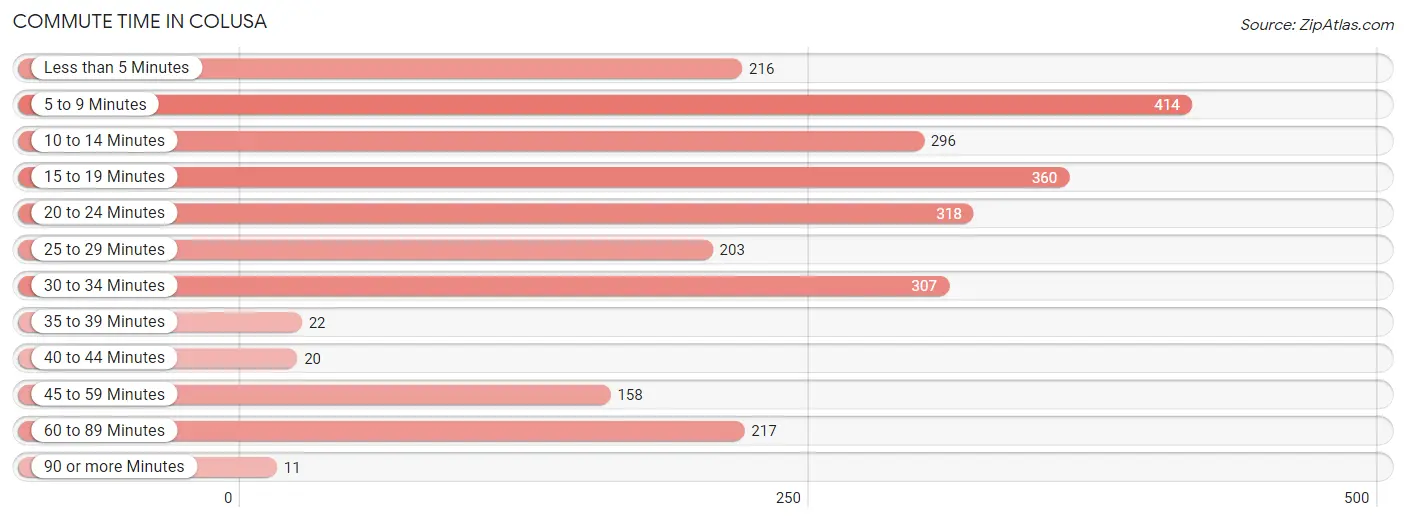
| Commute Time | # Commuters | % Commuters |
| Less than 5 Minutes | 216 | 8.5% |
| 5 to 9 Minutes | 414 | 16.3% |
| 10 to 14 Minutes | 296 | 11.6% |
| 15 to 19 Minutes | 360 | 14.2% |
| 20 to 24 Minutes | 318 | 12.5% |
| 25 to 29 Minutes | 203 | 8.0% |
| 30 to 34 Minutes | 307 | 12.1% |
| 35 to 39 Minutes | 22 | 0.9% |
| 40 to 44 Minutes | 20 | 0.8% |
| 45 to 59 Minutes | 158 | 6.2% |
| 60 to 89 Minutes | 217 | 8.5% |
| 90 or more Minutes | 11 | 0.4% |
Commute Time by Sex in Colusa
The most common commute times in Colusa are 5 to 9 minutes (233 commuters, 16.2%) for males and 5 to 9 minutes (181 commuters, 16.4%) for females.
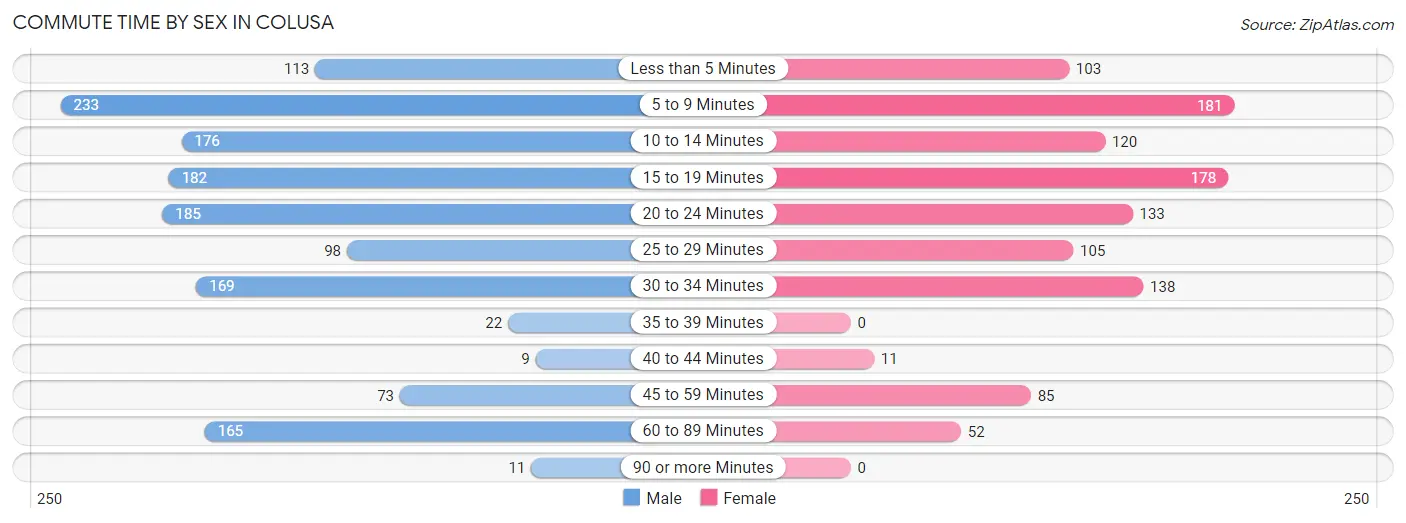
| Commute Time | Male | Female |
| Less than 5 Minutes | 113 (7.9%) | 103 (9.3%) |
| 5 to 9 Minutes | 233 (16.2%) | 181 (16.4%) |
| 10 to 14 Minutes | 176 (12.3%) | 120 (10.8%) |
| 15 to 19 Minutes | 182 (12.7%) | 178 (16.1%) |
| 20 to 24 Minutes | 185 (12.9%) | 133 (12.0%) |
| 25 to 29 Minutes | 98 (6.8%) | 105 (9.5%) |
| 30 to 34 Minutes | 169 (11.8%) | 138 (12.5%) |
| 35 to 39 Minutes | 22 (1.5%) | 0 (0.0%) |
| 40 to 44 Minutes | 9 (0.6%) | 11 (1.0%) |
| 45 to 59 Minutes | 73 (5.1%) | 85 (7.7%) |
| 60 to 89 Minutes | 165 (11.5%) | 52 (4.7%) |
| 90 or more Minutes | 11 (0.8%) | 0 (0.0%) |
Time of Departure to Work by Sex in Colusa
The most frequent times of departure to work in Colusa are 8:00 AM to 8:29 AM (268, 18.7%) for males and 7:00 AM to 7:29 AM (235, 21.2%) for females.
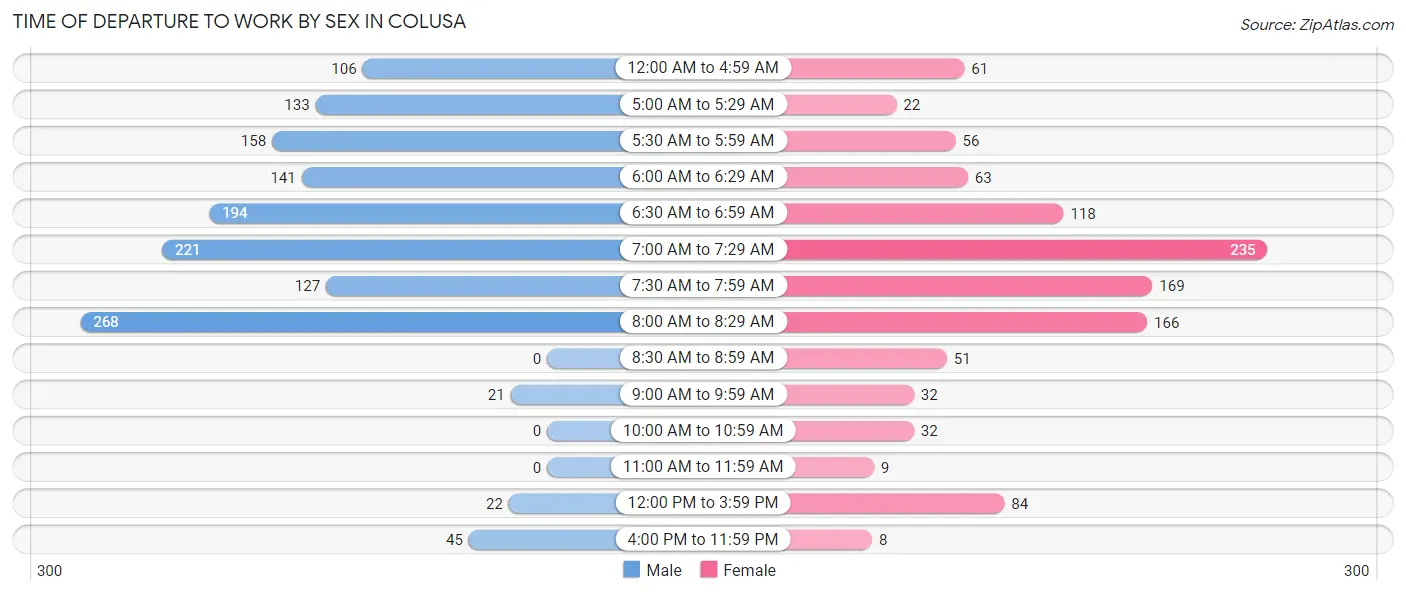
| Time of Departure | Male | Female |
| 12:00 AM to 4:59 AM | 106 (7.4%) | 61 (5.5%) |
| 5:00 AM to 5:29 AM | 133 (9.3%) | 22 (2.0%) |
| 5:30 AM to 5:59 AM | 158 (11.0%) | 56 (5.1%) |
| 6:00 AM to 6:29 AM | 141 (9.8%) | 63 (5.7%) |
| 6:30 AM to 6:59 AM | 194 (13.5%) | 118 (10.7%) |
| 7:00 AM to 7:29 AM | 221 (15.4%) | 235 (21.2%) |
| 7:30 AM to 7:59 AM | 127 (8.8%) | 169 (15.3%) |
| 8:00 AM to 8:29 AM | 268 (18.7%) | 166 (15.0%) |
| 8:30 AM to 8:59 AM | 0 (0.0%) | 51 (4.6%) |
| 9:00 AM to 9:59 AM | 21 (1.5%) | 32 (2.9%) |
| 10:00 AM to 10:59 AM | 0 (0.0%) | 32 (2.9%) |
| 11:00 AM to 11:59 AM | 0 (0.0%) | 9 (0.8%) |
| 12:00 PM to 3:59 PM | 22 (1.5%) | 84 (7.6%) |
| 4:00 PM to 11:59 PM | 45 (3.1%) | 8 (0.7%) |
| Total | 1,436 (100.0%) | 1,106 (100.0%) |
Housing Occupancy in Colusa
Occupancy by Ownership in Colusa
Of the total 2,472 dwellings in Colusa, owner-occupied units account for 1,428 (57.8%), while renter-occupied units make up 1,044 (42.2%).
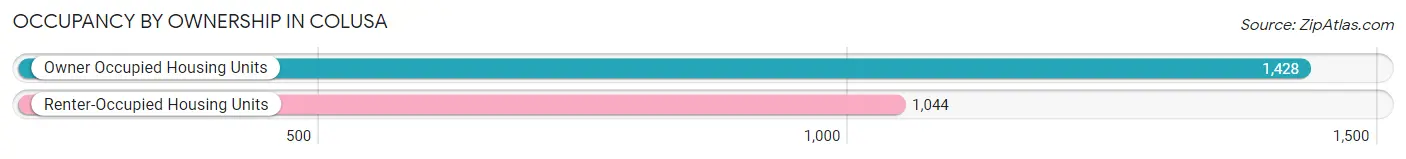
| Occupancy | # Housing Units | % Housing Units |
| Owner Occupied Housing Units | 1,428 | 57.8% |
| Renter-Occupied Housing Units | 1,044 | 42.2% |
| Total Occupied Housing Units | 2,472 | 100.0% |
Occupancy by Household Size in Colusa
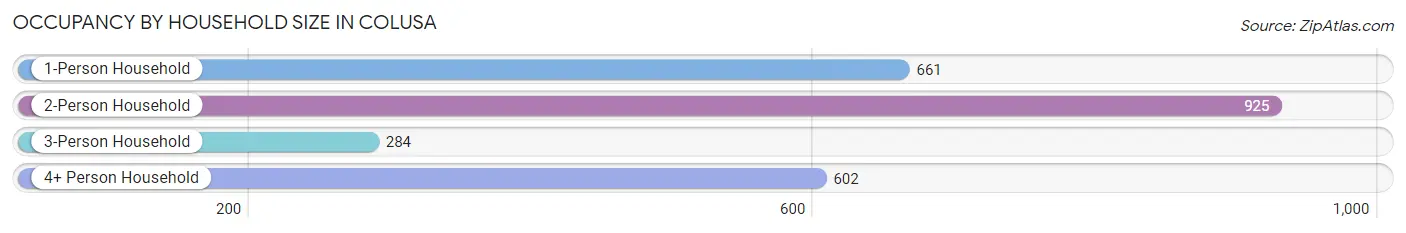
| Household Size | # Housing Units | % Housing Units |
| 1-Person Household | 661 | 26.7% |
| 2-Person Household | 925 | 37.4% |
| 3-Person Household | 284 | 11.5% |
| 4+ Person Household | 602 | 24.3% |
| Total Housing Units | 2,472 | 100.0% |
Occupancy by Ownership by Household Size in Colusa
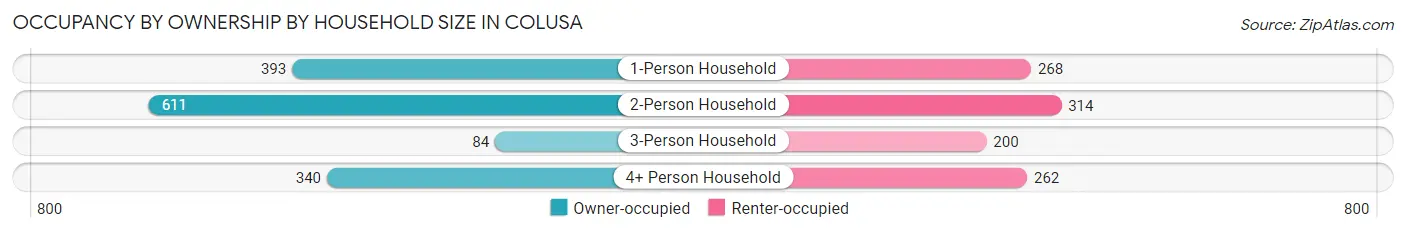
| Household Size | Owner-occupied | Renter-occupied |
| 1-Person Household | 393 (59.5%) | 268 (40.5%) |
| 2-Person Household | 611 (66.0%) | 314 (34.0%) |
| 3-Person Household | 84 (29.6%) | 200 (70.4%) |
| 4+ Person Household | 340 (56.5%) | 262 (43.5%) |
| Total Housing Units | 1,428 (57.8%) | 1,044 (42.2%) |
Occupancy by Educational Attainment in Colusa
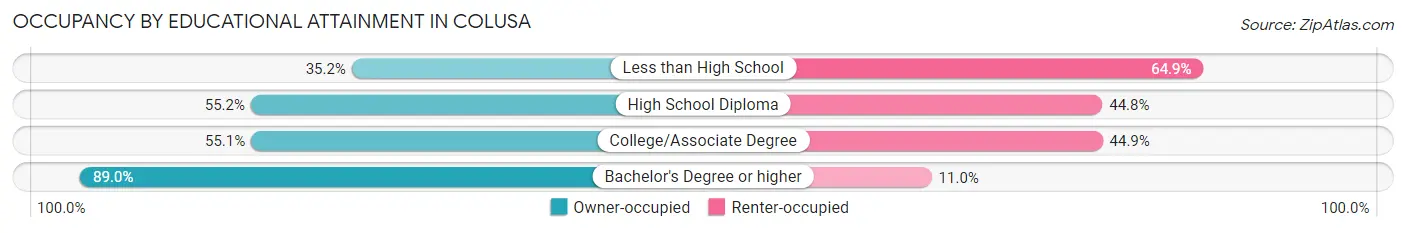
| Household Size | Owner-occupied | Renter-occupied |
| Less than High School | 129 (35.1%) | 238 (64.8%) |
| High School Diploma | 326 (55.2%) | 265 (44.8%) |
| College/Associate Degree | 609 (55.1%) | 496 (44.9%) |
| Bachelor's Degree or higher | 364 (89.0%) | 45 (11.0%) |
Occupancy by Age of Householder in Colusa
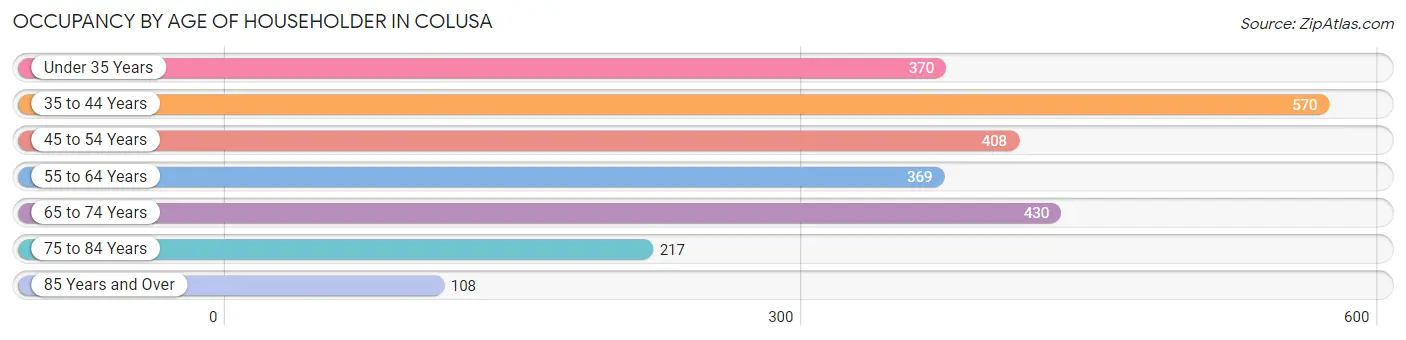
| Age Bracket | # Households | % Households |
| Under 35 Years | 370 | 15.0% |
| 35 to 44 Years | 570 | 23.1% |
| 45 to 54 Years | 408 | 16.5% |
| 55 to 64 Years | 369 | 14.9% |
| 65 to 74 Years | 430 | 17.4% |
| 75 to 84 Years | 217 | 8.8% |
| 85 Years and Over | 108 | 4.4% |
| Total | 2,472 | 100.0% |
Housing Finances in Colusa
Median Income by Occupancy in Colusa
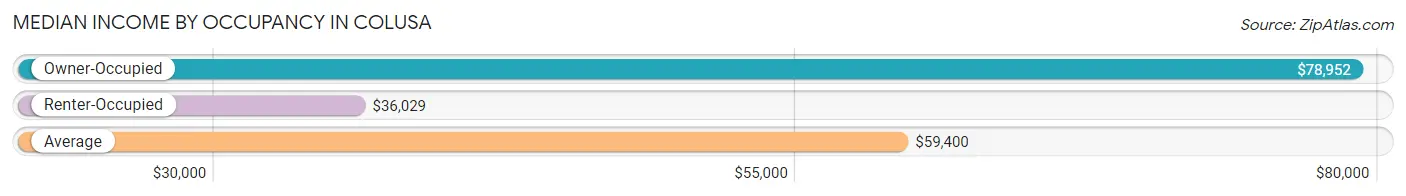
| Occupancy Type | # Households | Median Income |
| Owner-Occupied | 1,428 (57.8%) | $78,952 |
| Renter-Occupied | 1,044 (42.2%) | $36,029 |
| Average | 2,472 (100.0%) | $59,400 |
Occupancy by Householder Income Bracket in Colusa
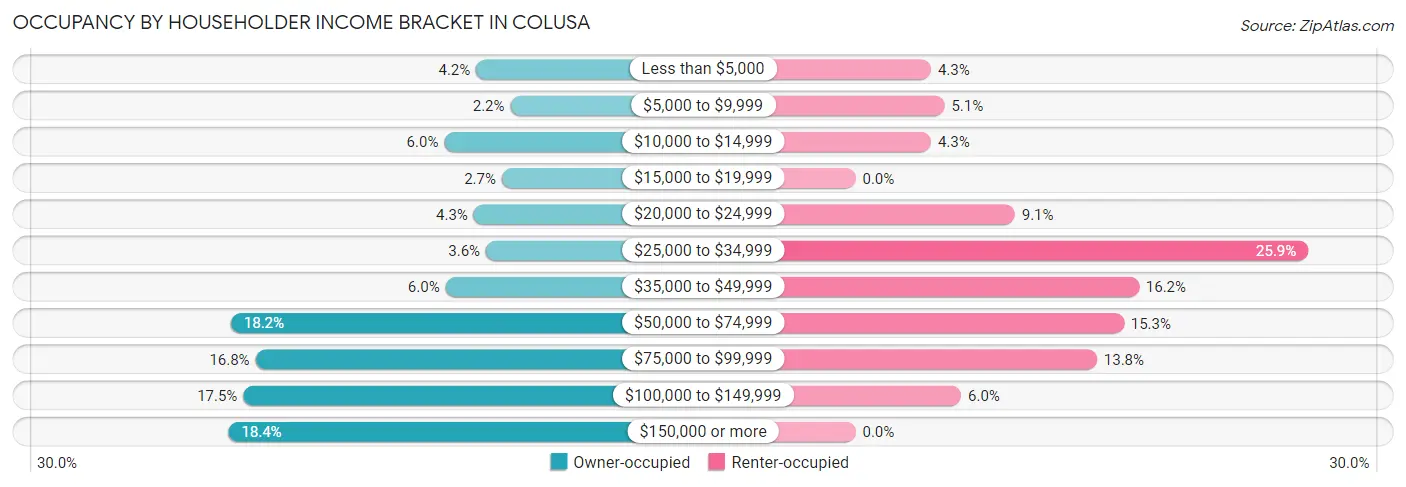
| Income Bracket | Owner-occupied | Renter-occupied |
| Less than $5,000 | 60 (4.2%) | 45 (4.3%) |
| $5,000 to $9,999 | 32 (2.2%) | 53 (5.1%) |
| $10,000 to $14,999 | 86 (6.0%) | 45 (4.3%) |
| $15,000 to $19,999 | 39 (2.7%) | 0 (0.0%) |
| $20,000 to $24,999 | 62 (4.3%) | 95 (9.1%) |
| $25,000 to $34,999 | 52 (3.6%) | 270 (25.9%) |
| $35,000 to $49,999 | 85 (5.9%) | 169 (16.2%) |
| $50,000 to $74,999 | 260 (18.2%) | 160 (15.3%) |
| $75,000 to $99,999 | 240 (16.8%) | 144 (13.8%) |
| $100,000 to $149,999 | 250 (17.5%) | 63 (6.0%) |
| $150,000 or more | 262 (18.3%) | 0 (0.0%) |
| Total | 1,428 (100.0%) | 1,044 (100.0%) |
Monthly Housing Cost Tiers in Colusa
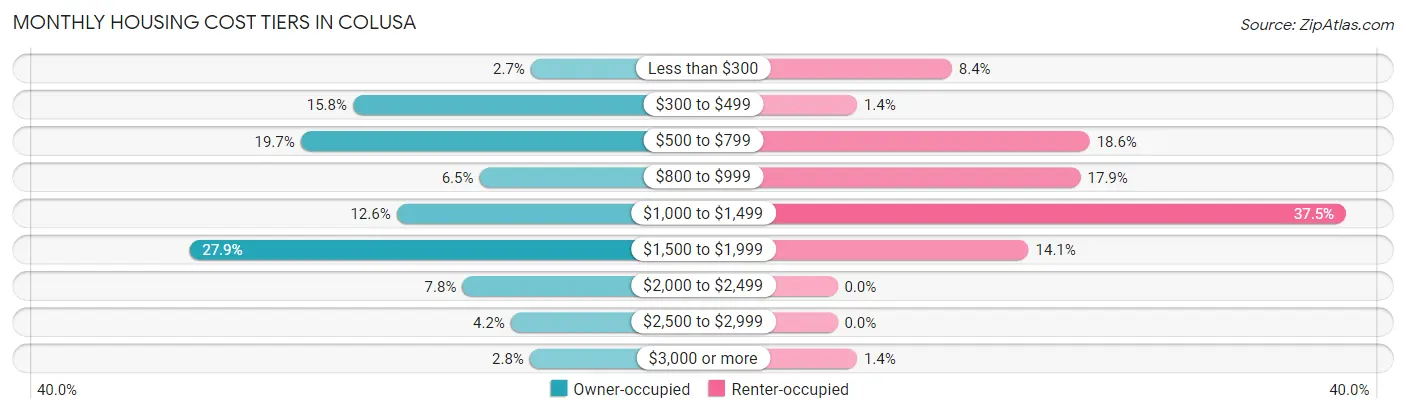
| Monthly Cost | Owner-occupied | Renter-occupied |
| Less than $300 | 39 (2.7%) | 88 (8.4%) |
| $300 to $499 | 226 (15.8%) | 15 (1.4%) |
| $500 to $799 | 281 (19.7%) | 194 (18.6%) |
| $800 to $999 | 93 (6.5%) | 187 (17.9%) |
| $1,000 to $1,499 | 180 (12.6%) | 391 (37.4%) |
| $1,500 to $1,999 | 398 (27.9%) | 147 (14.1%) |
| $2,000 to $2,499 | 111 (7.8%) | 0 (0.0%) |
| $2,500 to $2,999 | 60 (4.2%) | 0 (0.0%) |
| $3,000 or more | 40 (2.8%) | 15 (1.4%) |
| Total | 1,428 (100.0%) | 1,044 (100.0%) |
Physical Housing Characteristics in Colusa
Housing Structures in Colusa
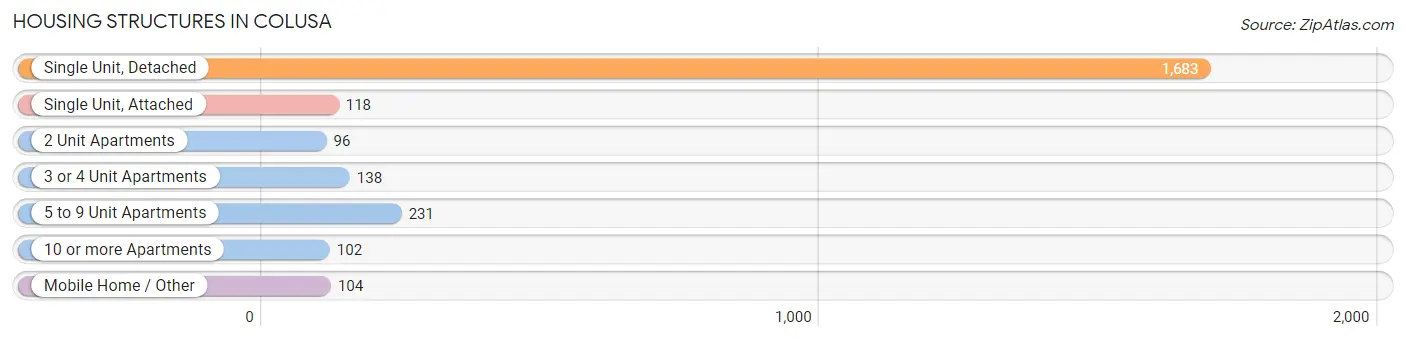
| Structure Type | # Housing Units | % Housing Units |
| Single Unit, Detached | 1,683 | 68.1% |
| Single Unit, Attached | 118 | 4.8% |
| 2 Unit Apartments | 96 | 3.9% |
| 3 or 4 Unit Apartments | 138 | 5.6% |
| 5 to 9 Unit Apartments | 231 | 9.3% |
| 10 or more Apartments | 102 | 4.1% |
| Mobile Home / Other | 104 | 4.2% |
| Total | 2,472 | 100.0% |
Housing Structures by Occupancy in Colusa
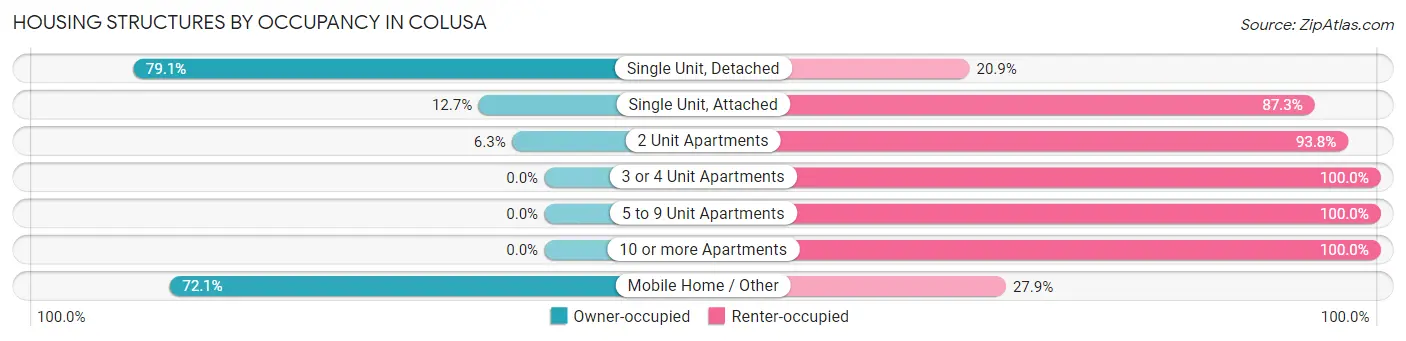
| Structure Type | Owner-occupied | Renter-occupied |
| Single Unit, Detached | 1,332 (79.1%) | 351 (20.9%) |
| Single Unit, Attached | 15 (12.7%) | 103 (87.3%) |
| 2 Unit Apartments | 6 (6.2%) | 90 (93.8%) |
| 3 or 4 Unit Apartments | 0 (0.0%) | 138 (100.0%) |
| 5 to 9 Unit Apartments | 0 (0.0%) | 231 (100.0%) |
| 10 or more Apartments | 0 (0.0%) | 102 (100.0%) |
| Mobile Home / Other | 75 (72.1%) | 29 (27.9%) |
| Total | 1,428 (57.8%) | 1,044 (42.2%) |
Housing Structures by Number of Rooms in Colusa
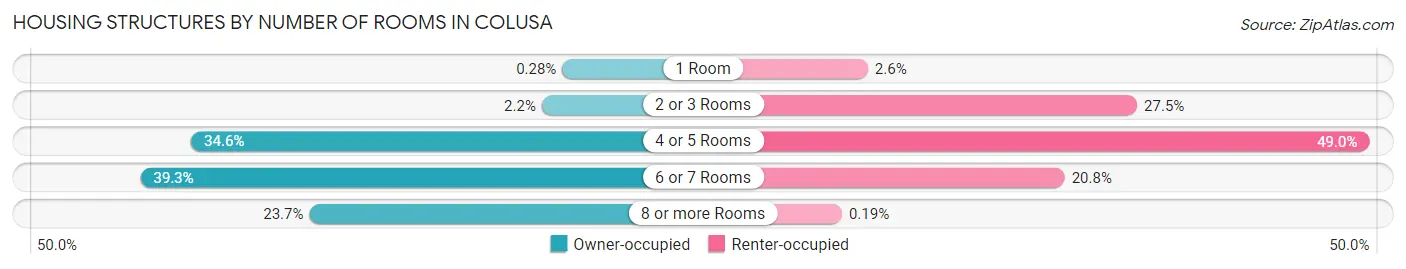
| Number of Rooms | Owner-occupied | Renter-occupied |
| 1 Room | 4 (0.3%) | 27 (2.6%) |
| 2 or 3 Rooms | 31 (2.2%) | 287 (27.5%) |
| 4 or 5 Rooms | 494 (34.6%) | 511 (48.9%) |
| 6 or 7 Rooms | 561 (39.3%) | 217 (20.8%) |
| 8 or more Rooms | 338 (23.7%) | 2 (0.2%) |
| Total | 1,428 (100.0%) | 1,044 (100.0%) |
Housing Structure by Heating Type in Colusa
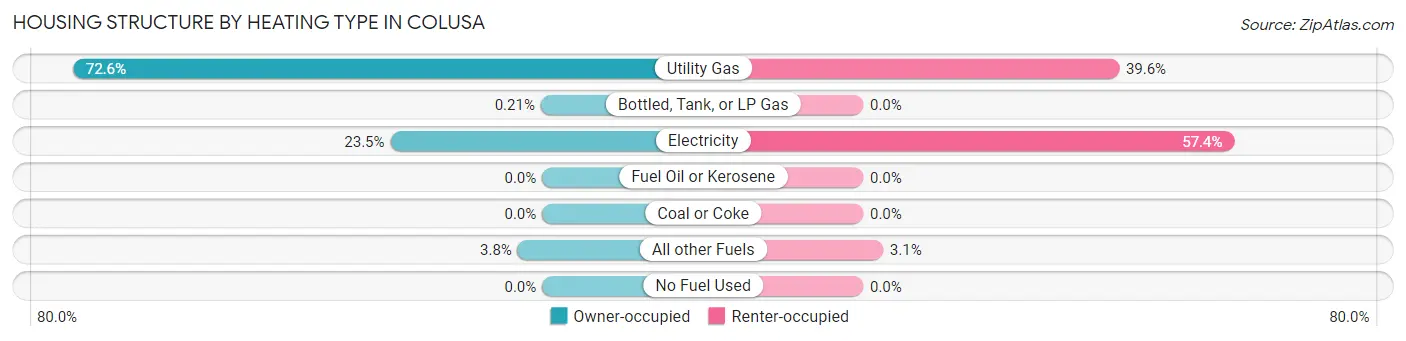
| Heating Type | Owner-occupied | Renter-occupied |
| Utility Gas | 1,036 (72.6%) | 413 (39.6%) |
| Bottled, Tank, or LP Gas | 3 (0.2%) | 0 (0.0%) |
| Electricity | 335 (23.5%) | 599 (57.4%) |
| Fuel Oil or Kerosene | 0 (0.0%) | 0 (0.0%) |
| Coal or Coke | 0 (0.0%) | 0 (0.0%) |
| All other Fuels | 54 (3.8%) | 32 (3.1%) |
| No Fuel Used | 0 (0.0%) | 0 (0.0%) |
| Total | 1,428 (100.0%) | 1,044 (100.0%) |
Household Vehicle Usage in Colusa
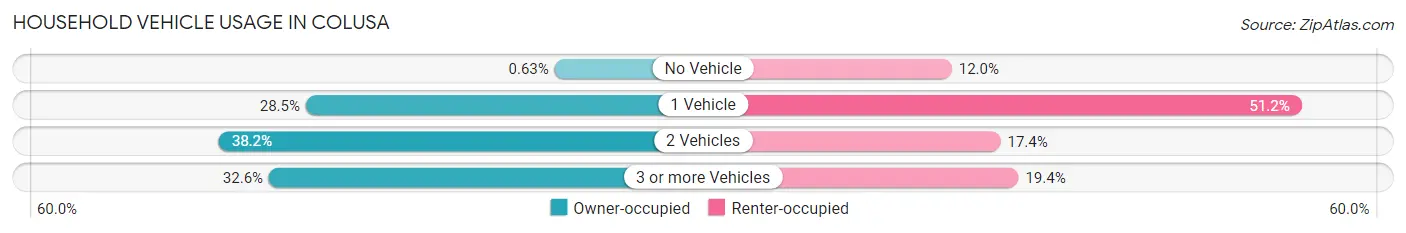
| Vehicles per Household | Owner-occupied | Renter-occupied |
| No Vehicle | 9 (0.6%) | 125 (12.0%) |
| 1 Vehicle | 407 (28.5%) | 534 (51.1%) |
| 2 Vehicles | 546 (38.2%) | 182 (17.4%) |
| 3 or more Vehicles | 466 (32.6%) | 203 (19.4%) |
| Total | 1,428 (100.0%) | 1,044 (100.0%) |
Real Estate & Mortgages in Colusa
Real Estate and Mortgage Overview in Colusa
| Characteristic | Without Mortgage | With Mortgage |
| Housing Units | 624 | 804 |
| Median Property Value | $294,700 | $357,600 |
| Median Household Income | $64,286 | $182 |
| Monthly Housing Costs | $561 | $40 |
| Real Estate Taxes | $1,685 | $5 |
Property Value by Mortgage Status in Colusa
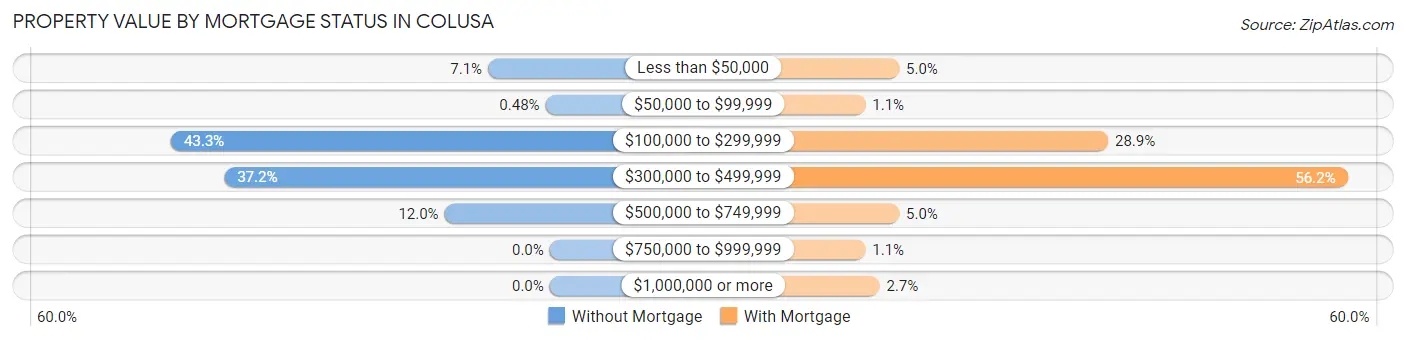
| Property Value | Without Mortgage | With Mortgage |
| Less than $50,000 | 44 (7.0%) | 40 (5.0%) |
| $50,000 to $99,999 | 3 (0.5%) | 9 (1.1%) |
| $100,000 to $299,999 | 270 (43.3%) | 232 (28.9%) |
| $300,000 to $499,999 | 232 (37.2%) | 452 (56.2%) |
| $500,000 to $749,999 | 75 (12.0%) | 40 (5.0%) |
| $750,000 to $999,999 | 0 (0.0%) | 9 (1.1%) |
| $1,000,000 or more | 0 (0.0%) | 22 (2.7%) |
| Total | 624 (100.0%) | 804 (100.0%) |
Household Income by Mortgage Status in Colusa
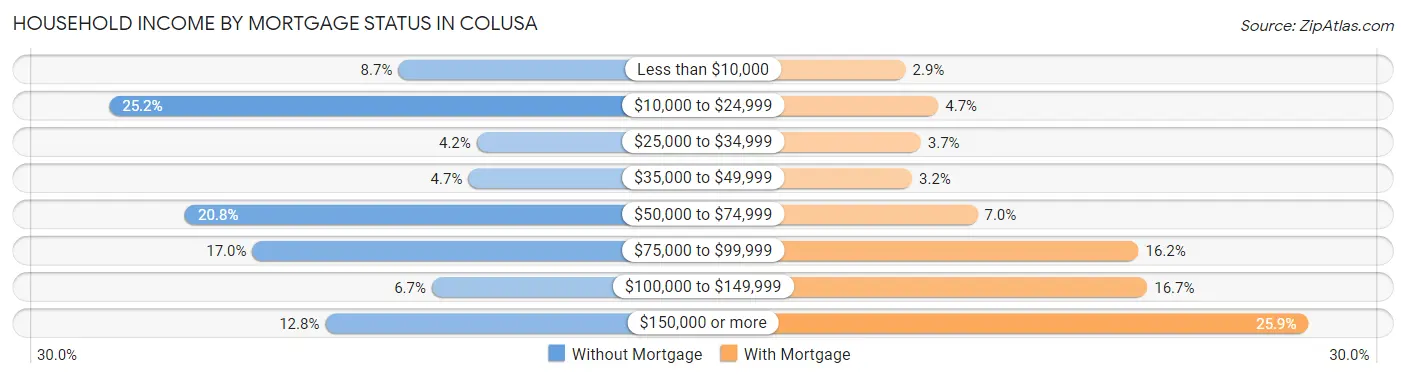
| Household Income | Without Mortgage | With Mortgage |
| Less than $10,000 | 54 (8.6%) | 23 (2.9%) |
| $10,000 to $24,999 | 157 (25.2%) | 38 (4.7%) |
| $25,000 to $34,999 | 26 (4.2%) | 30 (3.7%) |
| $35,000 to $49,999 | 29 (4.6%) | 26 (3.2%) |
| $50,000 to $74,999 | 130 (20.8%) | 56 (7.0%) |
| $75,000 to $99,999 | 106 (17.0%) | 130 (16.2%) |
| $100,000 to $149,999 | 42 (6.7%) | 134 (16.7%) |
| $150,000 or more | 80 (12.8%) | 208 (25.9%) |
| Total | 624 (100.0%) | 804 (100.0%) |
Property Value to Household Income Ratio in Colusa
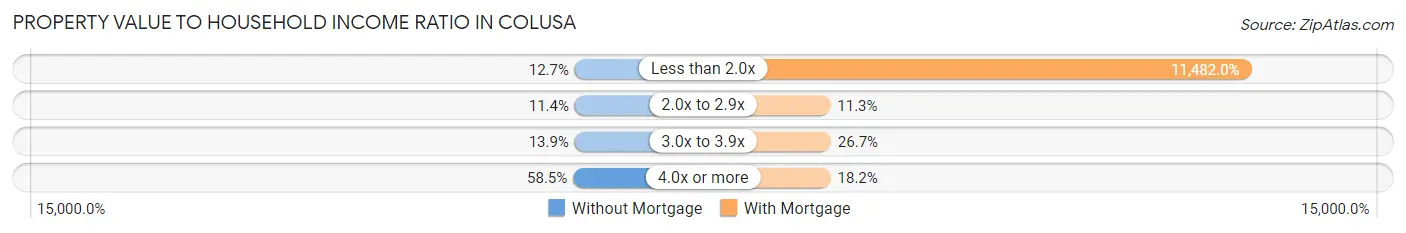
| Value-to-Income Ratio | Without Mortgage | With Mortgage |
| Less than 2.0x | 79 (12.7%) | 92,315 (11,482.0%) |
| 2.0x to 2.9x | 71 (11.4%) | 91 (11.3%) |
| 3.0x to 3.9x | 87 (13.9%) | 215 (26.7%) |
| 4.0x or more | 365 (58.5%) | 146 (18.2%) |
| Total | 624 (100.0%) | 804 (100.0%) |
Real Estate Taxes by Mortgage Status in Colusa
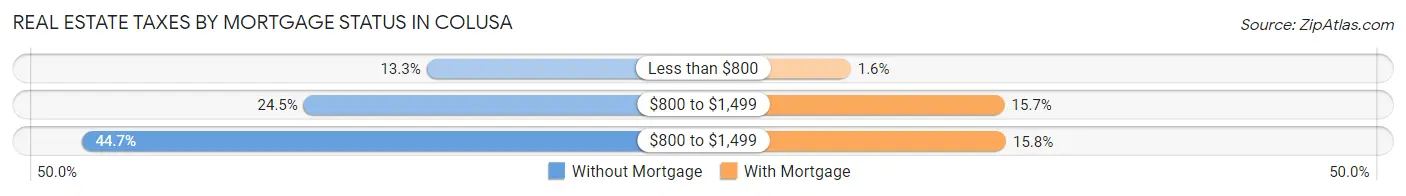
| Property Taxes | Without Mortgage | With Mortgage |
| Less than $800 | 83 (13.3%) | 13 (1.6%) |
| $800 to $1,499 | 153 (24.5%) | 126 (15.7%) |
| $800 to $1,499 | 279 (44.7%) | 127 (15.8%) |
| Total | 624 (100.0%) | 804 (100.0%) |
Health & Disability in Colusa
Health Insurance Coverage by Age in Colusa
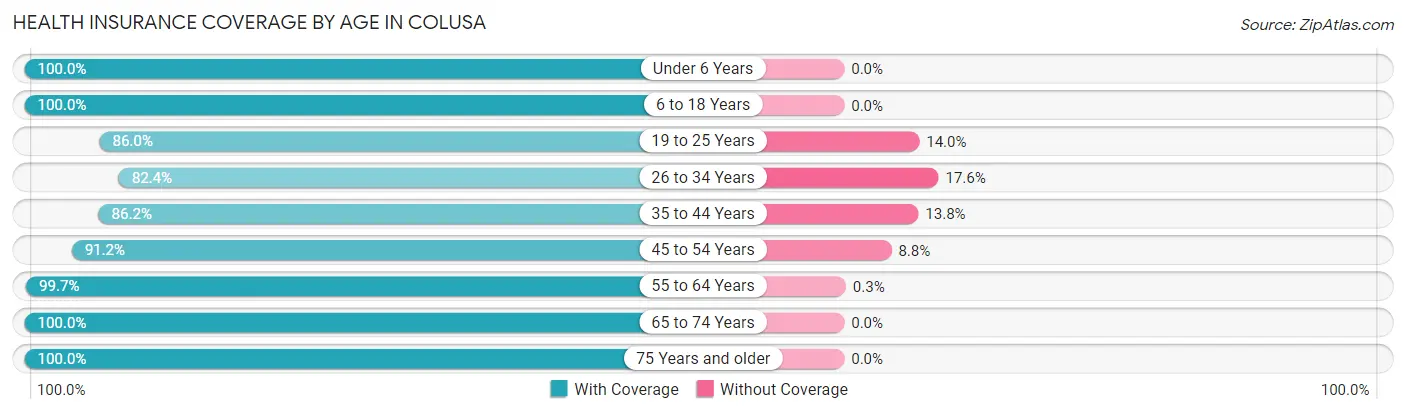
| Age Bracket | With Coverage | Without Coverage |
| Under 6 Years | 443 (100.0%) | 0 (0.0%) |
| 6 to 18 Years | 1,446 (100.0%) | 0 (0.0%) |
| 19 to 25 Years | 357 (86.0%) | 58 (14.0%) |
| 26 to 34 Years | 483 (82.4%) | 103 (17.6%) |
| 35 to 44 Years | 823 (86.2%) | 132 (13.8%) |
| 45 to 54 Years | 654 (91.2%) | 63 (8.8%) |
| 55 to 64 Years | 664 (99.7%) | 2 (0.3%) |
| 65 to 74 Years | 671 (100.0%) | 0 (0.0%) |
| 75 Years and older | 428 (100.0%) | 0 (0.0%) |
| Total | 5,969 (94.3%) | 358 (5.7%) |
Health Insurance Coverage by Citizenship Status in Colusa
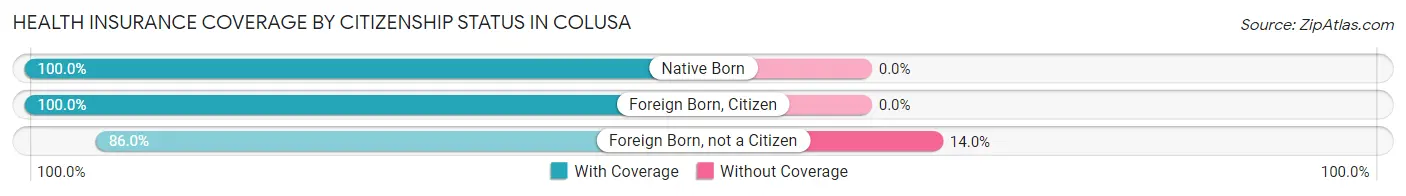
| Citizenship Status | With Coverage | Without Coverage |
| Native Born | 443 (100.0%) | 0 (0.0%) |
| Foreign Born, Citizen | 1,446 (100.0%) | 0 (0.0%) |
| Foreign Born, not a Citizen | 357 (86.0%) | 58 (14.0%) |
Health Insurance Coverage by Household Income in Colusa
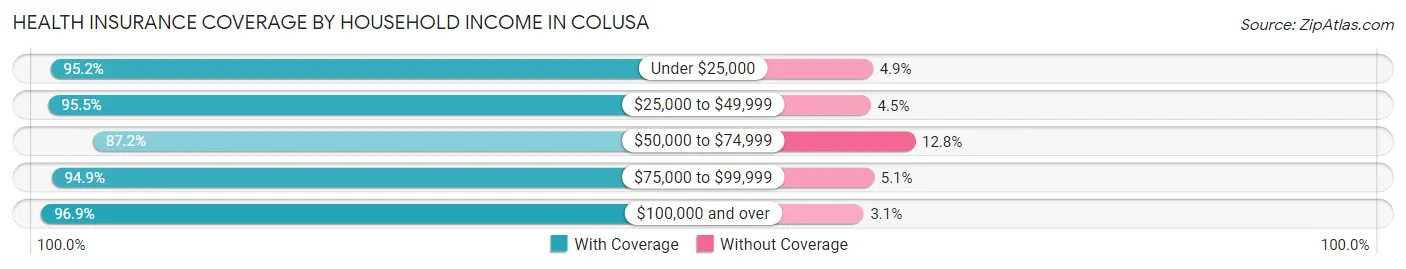
| Household Income | With Coverage | Without Coverage |
| Under $25,000 | 864 (95.2%) | 44 (4.9%) |
| $25,000 to $49,999 | 1,196 (95.5%) | 56 (4.5%) |
| $50,000 to $74,999 | 949 (87.2%) | 139 (12.8%) |
| $75,000 to $99,999 | 1,088 (94.9%) | 58 (5.1%) |
| $100,000 and over | 1,860 (96.9%) | 60 (3.1%) |
Public vs Private Health Insurance Coverage by Age in Colusa
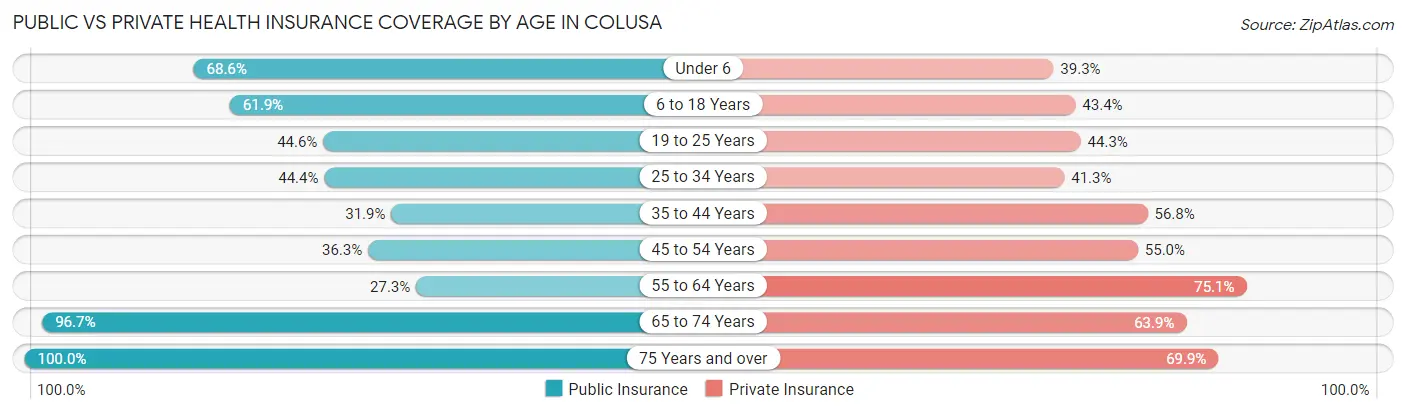
| Age Bracket | Public Insurance | Private Insurance |
| Under 6 | 304 (68.6%) | 174 (39.3%) |
| 6 to 18 Years | 895 (61.9%) | 627 (43.4%) |
| 19 to 25 Years | 185 (44.6%) | 184 (44.3%) |
| 25 to 34 Years | 260 (44.4%) | 242 (41.3%) |
| 35 to 44 Years | 305 (31.9%) | 542 (56.8%) |
| 45 to 54 Years | 260 (36.3%) | 394 (54.9%) |
| 55 to 64 Years | 182 (27.3%) | 500 (75.1%) |
| 65 to 74 Years | 649 (96.7%) | 429 (63.9%) |
| 75 Years and over | 428 (100.0%) | 299 (69.9%) |
| Total | 3,468 (54.8%) | 3,391 (53.6%) |
Disability Status by Sex by Age in Colusa
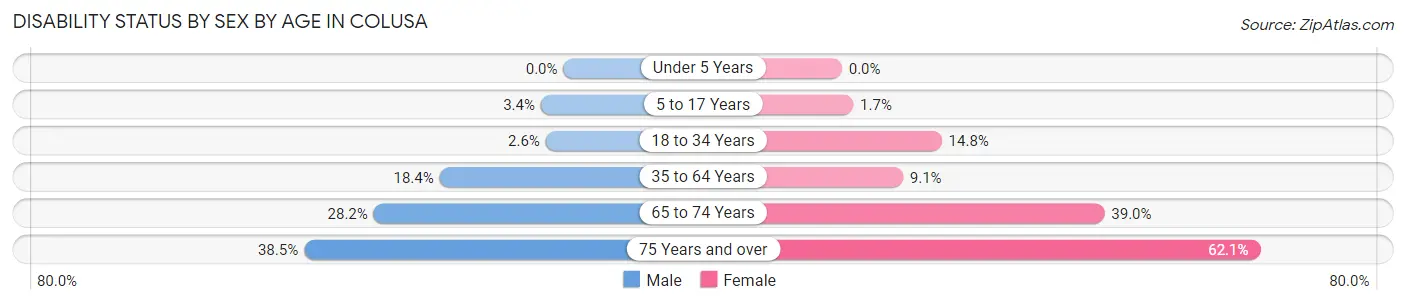
| Age Bracket | Male | Female |
| Under 5 Years | 0 (0.0%) | 0 (0.0%) |
| 5 to 17 Years | 25 (3.4%) | 11 (1.7%) |
| 18 to 34 Years | 13 (2.6%) | 90 (14.8%) |
| 35 to 64 Years | 223 (18.4%) | 102 (9.1%) |
| 65 to 74 Years | 111 (28.2%) | 108 (39.0%) |
| 75 Years and over | 57 (38.5%) | 174 (62.1%) |
Disability Class by Sex by Age in Colusa
Disability Class: Hearing Difficulty
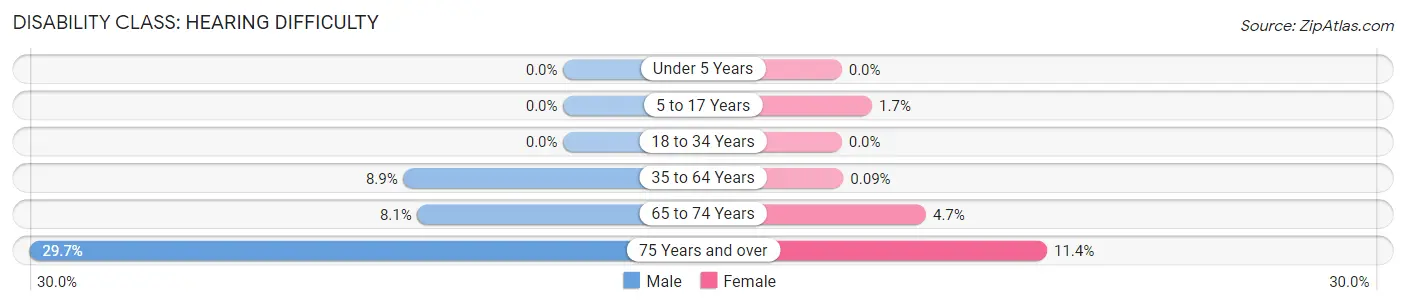
| Age Bracket | Male | Female |
| Under 5 Years | 0 (0.0%) | 0 (0.0%) |
| 5 to 17 Years | 0 (0.0%) | 11 (1.7%) |
| 18 to 34 Years | 0 (0.0%) | 0 (0.0%) |
| 35 to 64 Years | 108 (8.9%) | 1 (0.1%) |
| 65 to 74 Years | 32 (8.1%) | 13 (4.7%) |
| 75 Years and over | 44 (29.7%) | 32 (11.4%) |
Disability Class: Vision Difficulty
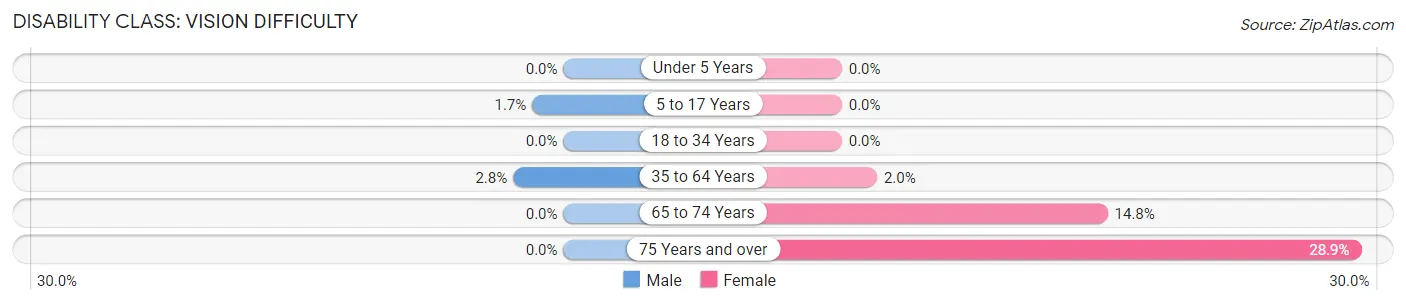
| Age Bracket | Male | Female |
| Under 5 Years | 0 (0.0%) | 0 (0.0%) |
| 5 to 17 Years | 13 (1.7%) | 0 (0.0%) |
| 18 to 34 Years | 0 (0.0%) | 0 (0.0%) |
| 35 to 64 Years | 34 (2.8%) | 22 (2.0%) |
| 65 to 74 Years | 0 (0.0%) | 41 (14.8%) |
| 75 Years and over | 0 (0.0%) | 81 (28.9%) |
Disability Class: Cognitive Difficulty
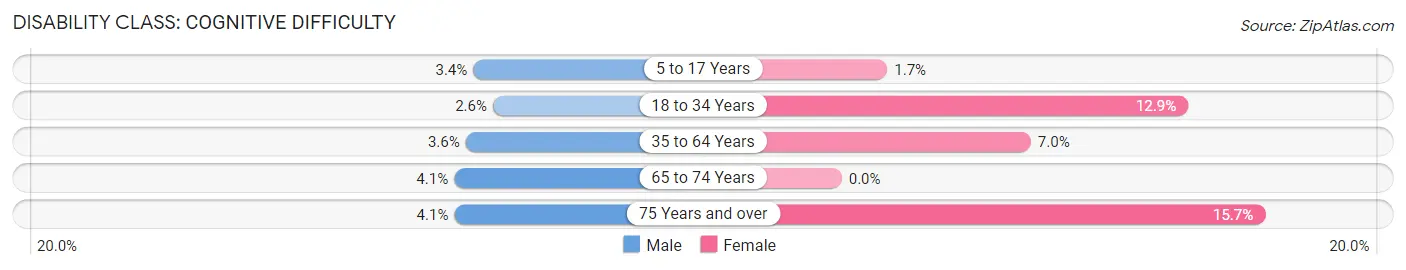
| Age Bracket | Male | Female |
| 5 to 17 Years | 25 (3.4%) | 11 (1.7%) |
| 18 to 34 Years | 13 (2.6%) | 78 (12.9%) |
| 35 to 64 Years | 44 (3.6%) | 79 (7.0%) |
| 65 to 74 Years | 16 (4.1%) | 0 (0.0%) |
| 75 Years and over | 6 (4.1%) | 44 (15.7%) |
Disability Class: Ambulatory Difficulty
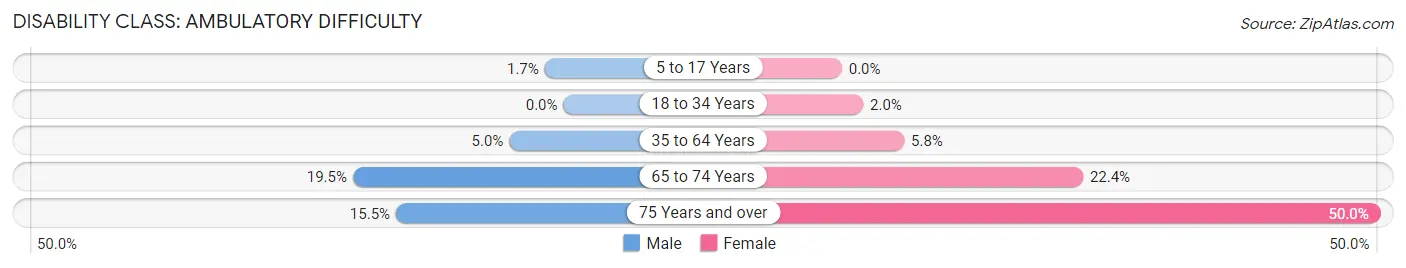
| Age Bracket | Male | Female |
| 5 to 17 Years | 13 (1.7%) | 0 (0.0%) |
| 18 to 34 Years | 0 (0.0%) | 12 (2.0%) |
| 35 to 64 Years | 61 (5.0%) | 65 (5.8%) |
| 65 to 74 Years | 77 (19.5%) | 62 (22.4%) |
| 75 Years and over | 23 (15.5%) | 140 (50.0%) |
Disability Class: Self-Care Difficulty
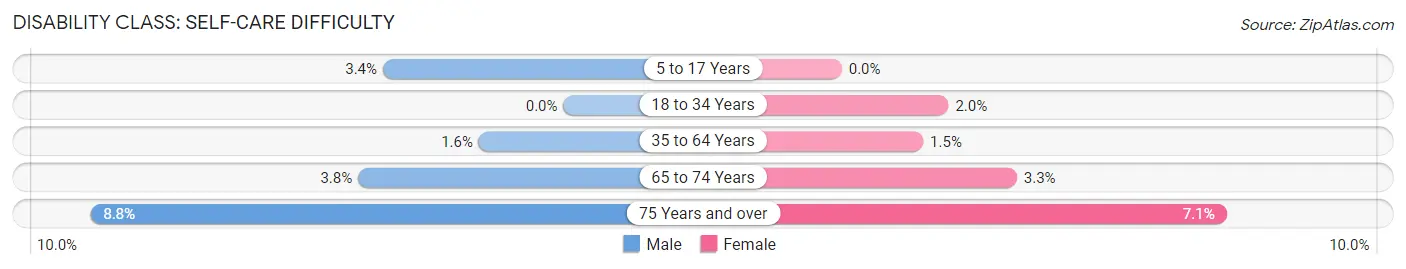
| Age Bracket | Male | Female |
| 5 to 17 Years | 25 (3.4%) | 0 (0.0%) |
| 18 to 34 Years | 0 (0.0%) | 12 (2.0%) |
| 35 to 64 Years | 19 (1.6%) | 17 (1.5%) |
| 65 to 74 Years | 15 (3.8%) | 9 (3.3%) |
| 75 Years and over | 13 (8.8%) | 20 (7.1%) |
Technology Access in Colusa
Computing Device Access in Colusa
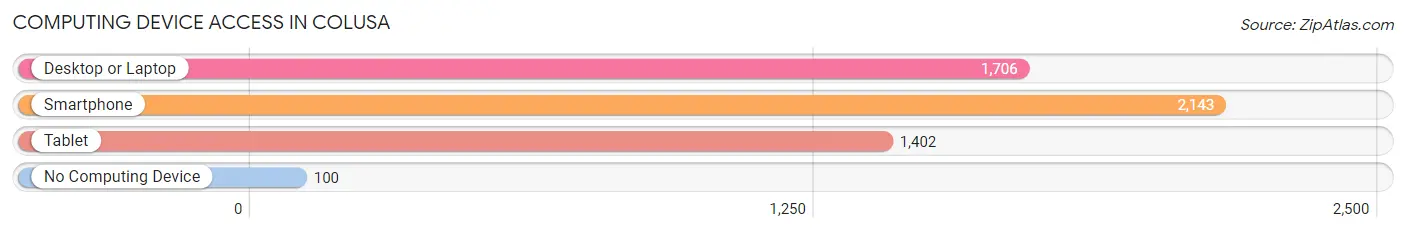
| Device Type | # Households | % Households |
| Desktop or Laptop | 1,706 | 69.0% |
| Smartphone | 2,143 | 86.7% |
| Tablet | 1,402 | 56.7% |
| No Computing Device | 100 | 4.1% |
| Total | 2,472 | 100.0% |
Internet Access in Colusa
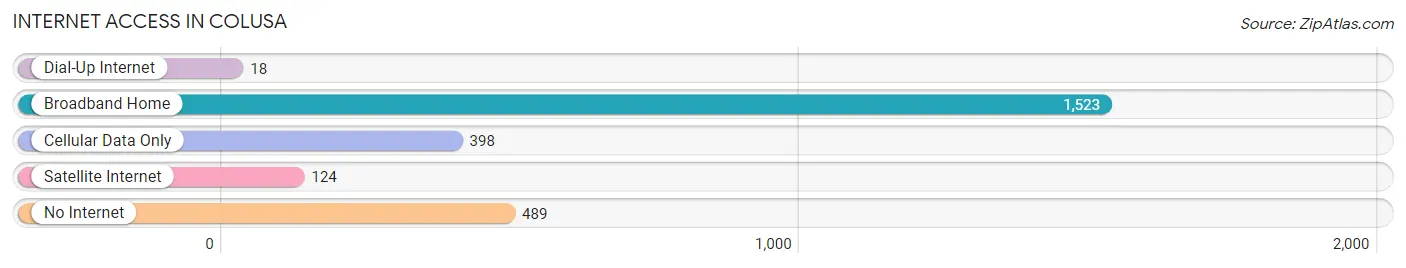
| Internet Type | # Households | % Households |
| Dial-Up Internet | 18 | 0.7% |
| Broadband Home | 1,523 | 61.6% |
| Cellular Data Only | 398 | 16.1% |
| Satellite Internet | 124 | 5.0% |
| No Internet | 489 | 19.8% |
| Total | 2,472 | 100.0% |
Colusa Summary
Colusa, California is a small city located in the Central Valley of California, about halfway between Sacramento and the Oregon border. It is the county seat of Colusa County and has a population of 5,971 as of the 2010 census. The city is situated on the banks of the Sacramento River and is surrounded by agricultural land.
History
Colusa was founded in 1845 by John Bidwell, a pioneer and explorer who was one of the first settlers in the area. He named the city after the Native American tribe that lived in the area, the Colus. The city was incorporated in 1868 and has since grown to become the county seat of Colusa County.
The city was an important stop on the California Trail, a route used by settlers to travel to the West Coast. It was also a major hub for the California Gold Rush, as it was located near the Feather River, which was a major source of gold.
Geography
Colusa is located in the Central Valley of California, about halfway between Sacramento and the Oregon border. It is situated on the banks of the Sacramento River and is surrounded by agricultural land. The city has a total area of 2.3 square miles, all of which is land.
The climate in Colusa is hot and dry in the summer and mild in the winter. The average temperature in the summer is around 90°F and in the winter it is around 50°F. The average annual precipitation is around 18 inches.
Economy
The economy of Colusa is largely based on agriculture. The city is surrounded by agricultural land and is home to several large farms and ranches. The main crops grown in the area are rice, tomatoes, corn, and wheat.
The city also has a small manufacturing sector, with several small businesses producing a variety of products. The city is also home to a number of retail stores, restaurants, and other businesses.
Demographics
As of the 2010 census, Colusa had a population of 5,971. The racial makeup of the city was 68.3% White, 0.7% African American, 1.2% Native American, 0.7% Asian, 0.1% Pacific Islander, 25.3% from other races, and 3.9% from two or more races. Hispanic or Latino of any race were 44.2% of the population.
The median income for a household in Colusa was $37,917, and the median income for a family was $45,917. The per capita income for the city was $17,845. About 17.2% of families and 21.3% of the population were below the poverty line, including 28.3% of those under age 18 and 11.2% of those age 65 or over.
Colusa is a small city with a rich history and a diverse population. It is surrounded by agricultural land and is home to a number of businesses and industries. The city has a mild climate and is a great place to live and work.
Common Questions
What is Per Capita Income in Colusa?
Per Capita income in Colusa is $30,046.
What is the Median Family Income in Colusa?
Median Family Income in Colusa is $68,408.
What is the Median Household income in Colusa?
Median Household Income in Colusa is $59,400.
What is Income or Wage Gap in Colusa?
Income or Wage Gap in Colusa is 24.0%.
Women in Colusa earn 76.0 cents for every dollar earned by a man.
What is Inequality or Gini Index in Colusa?
Inequality or Gini Index in Colusa is 0.46.
What is the Total Population of Colusa?
Total Population of Colusa is 6,380.
What is the Total Male Population of Colusa?
Total Male Population of Colusa is 3,219.
What is the Total Female Population of Colusa?
Total Female Population of Colusa is 3,161.
What is the Ratio of Males per 100 Females in Colusa?
There are 101.83 Males per 100 Females in Colusa.
What is the Ratio of Females per 100 Males in Colusa?
There are 98.20 Females per 100 Males in Colusa.
What is the Median Population Age in Colusa?
Median Population Age in Colusa is 38.7 Years.
What is the Average Family Size in Colusa
Average Family Size in Colusa is 3.1 People.
What is the Average Household Size in Colusa
Average Household Size in Colusa is 2.5 People.
How Large is the Labor Force in Colusa?
There are 2,886 People in the Labor Forcein in Colusa.
What is the Percentage of People in the Labor Force in Colusa?
60.9% of People are in the Labor Force in Colusa.
What is the Unemployment Rate in Colusa?
Unemployment Rate in Colusa is 6.2%.