Colfax, CA Map & Demographics
Colfax Map
Colfax Overview
$38,262
PER CAPITA INCOME
$88,646
AVG FAMILY INCOME
$70,720
AVG HOUSEHOLD INCOME
33.8%
WAGE / INCOME GAP [ % ]
66.2¢/ $1
WAGE / INCOME GAP [ $ ]
0.44
INEQUALITY / GINI INDEX
2,230
TOTAL POPULATION
1,099
MALE POPULATION
1,131
FEMALE POPULATION
97.17
MALES / 100 FEMALES
102.91
FEMALES / 100 MALES
35.8
MEDIAN AGE
3.2
AVG FAMILY SIZE
2.5
AVG HOUSEHOLD SIZE
1,146
LABOR FORCE [ PEOPLE ]
65.4%
PERCENT IN LABOR FORCE
7.7%
UNEMPLOYMENT RATE
Colfax Zip Codes
Colfax Area Codes
Income in Colfax
Income Overview in Colfax
Per Capita Income in Colfax is $38,262, while median incomes of families and households are $88,646 and $70,720 respectively.
| Characteristic | Number | Measure |
| Per Capita Income | 2,230 | $38,262 |
| Median Family Income | 495 | $88,646 |
| Mean Family Income | 495 | $94,641 |
| Median Household Income | 909 | $70,720 |
| Mean Household Income | 909 | $92,213 |
| Income Deficit | 495 | $0 |
| Wage / Income Gap (%) | 2,230 | 33.78% |
| Wage / Income Gap ($) | 2,230 | 66.22¢ per $1 |
| Gini / Inequality Index | 2,230 | 0.44 |
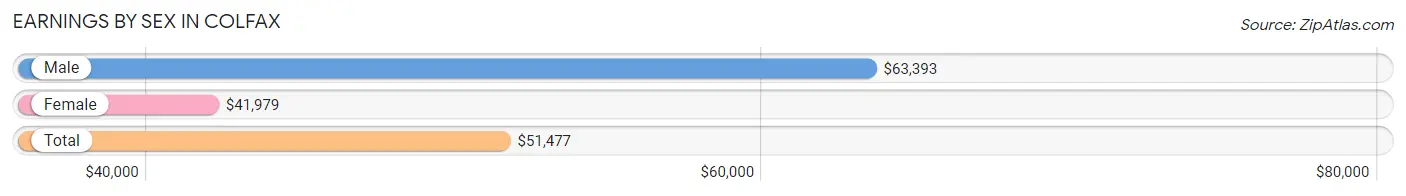
Earnings by Sex in Colfax
Average Earnings in Colfax are $51,477, $63,393 for men and $41,979 for women, a difference of 33.8%.
| Sex | Number | Average Earnings |
| Male | 660 (56.3%) | $63,393 |
| Female | 513 (43.7%) | $41,979 |
| Total | 1,173 (100.0%) | $51,477 |
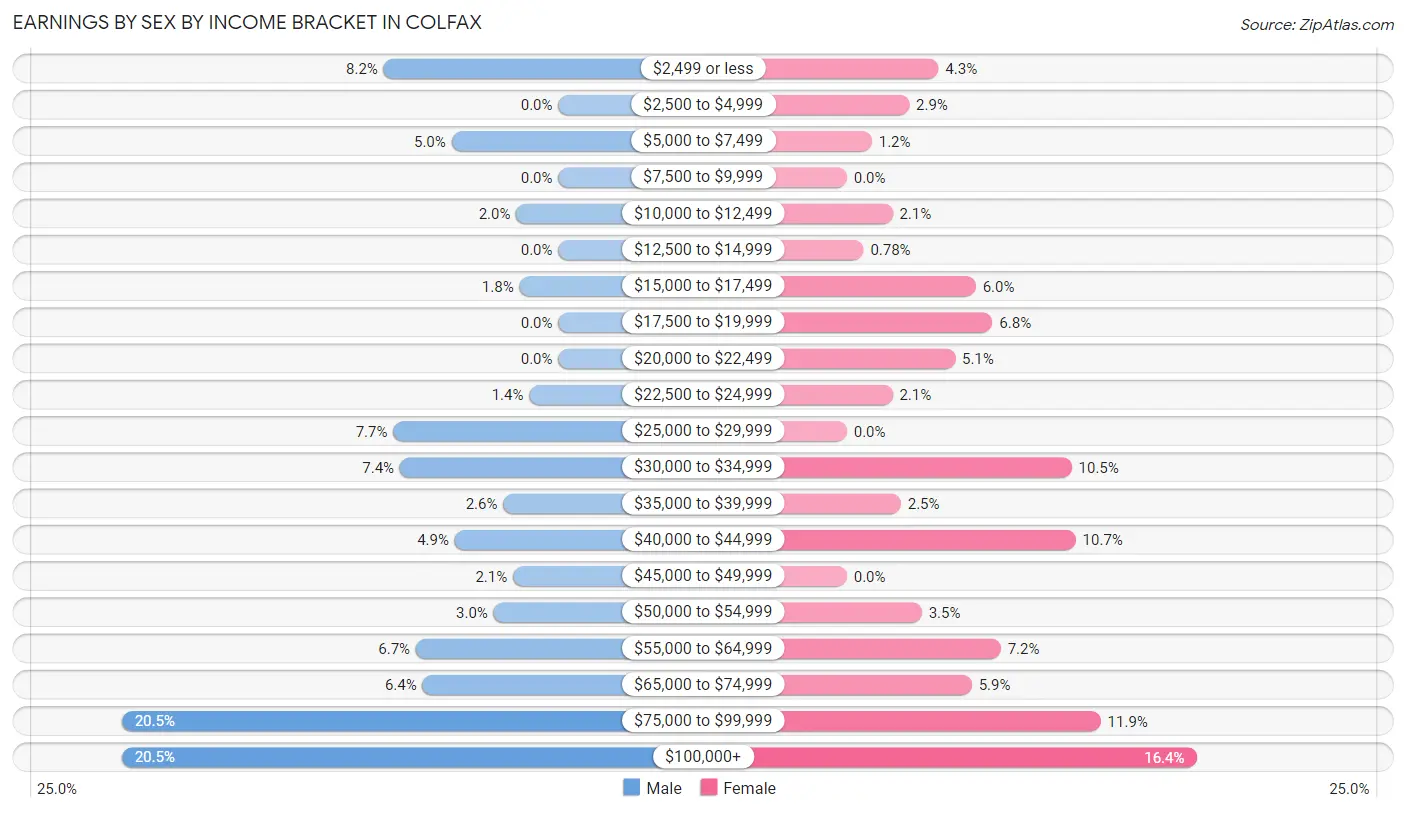
Earnings by Sex by Income Bracket in Colfax
The most common earnings brackets in Colfax are $75,000 to $99,999 for men (135 | 20.4%) and $100,000+ for women (84 | 16.4%).
| Income | Male | Female |
| $2,499 or less | 54 (8.2%) | 22 (4.3%) |
| $2,500 to $4,999 | 0 (0.0%) | 15 (2.9%) |
| $5,000 to $7,499 | 33 (5.0%) | 6 (1.2%) |
| $7,500 to $9,999 | 0 (0.0%) | 0 (0.0%) |
| $10,000 to $12,499 | 13 (2.0%) | 11 (2.1%) |
| $12,500 to $14,999 | 0 (0.0%) | 4 (0.8%) |
| $15,000 to $17,499 | 12 (1.8%) | 31 (6.0%) |
| $17,500 to $19,999 | 0 (0.0%) | 35 (6.8%) |
| $20,000 to $22,499 | 0 (0.0%) | 26 (5.1%) |
| $22,500 to $24,999 | 9 (1.4%) | 11 (2.1%) |
| $25,000 to $29,999 | 51 (7.7%) | 0 (0.0%) |
| $30,000 to $34,999 | 49 (7.4%) | 54 (10.5%) |
| $35,000 to $39,999 | 17 (2.6%) | 13 (2.5%) |
| $40,000 to $44,999 | 32 (4.9%) | 55 (10.7%) |
| $45,000 to $49,999 | 14 (2.1%) | 0 (0.0%) |
| $50,000 to $54,999 | 20 (3.0%) | 18 (3.5%) |
| $55,000 to $64,999 | 44 (6.7%) | 37 (7.2%) |
| $65,000 to $74,999 | 42 (6.4%) | 30 (5.9%) |
| $75,000 to $99,999 | 135 (20.4%) | 61 (11.9%) |
| $100,000+ | 135 (20.4%) | 84 (16.4%) |
| Total | 660 (100.0%) | 513 (100.0%) |
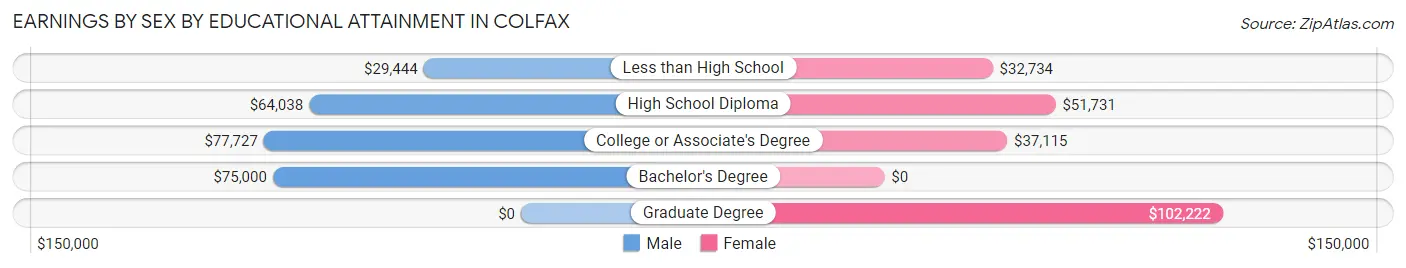
Earnings by Sex by Educational Attainment in Colfax
Average earnings in Colfax are $70,568 for men and $43,684 for women, a difference of 38.1%. Men with an educational attainment of college or associate's degree enjoy the highest average annual earnings of $77,727, while those with less than high school education earn the least with $29,444. Women with an educational attainment of graduate degree earn the most with the average annual earnings of $102,222, while those with less than high school education have the smallest earnings of $32,734.
| Educational Attainment | Male Income | Female Income |
| Less than High School | $29,444 | $32,734 |
| High School Diploma | $64,038 | $51,731 |
| College or Associate's Degree | $77,727 | $37,115 |
| Bachelor's Degree | $75,000 | $0 |
| Graduate Degree | - | - |
| Total | $70,568 | $43,684 |
Family Income in Colfax
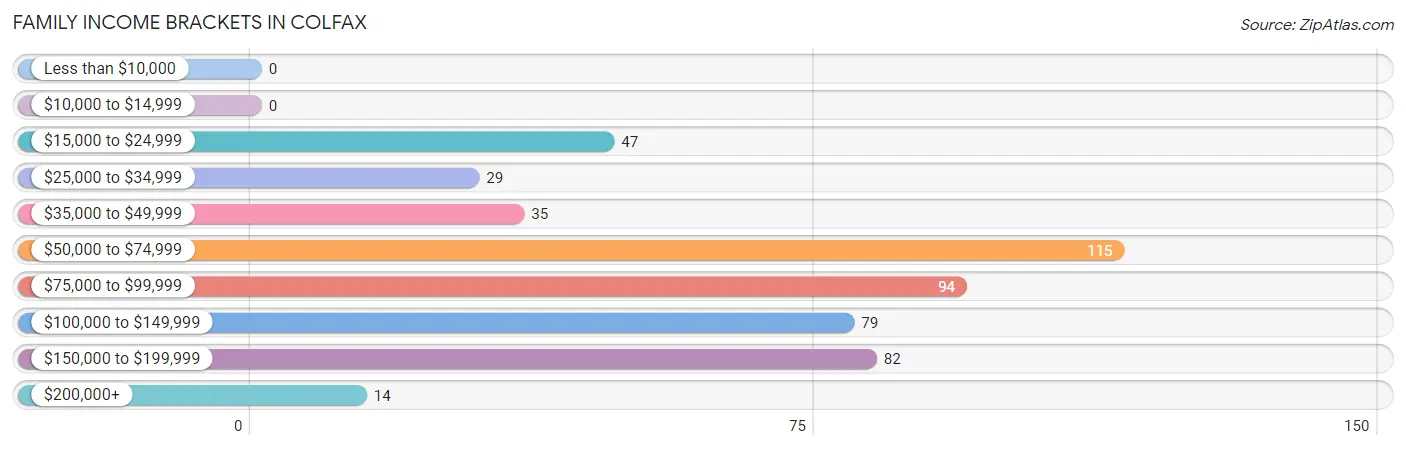
Family Income Brackets in Colfax
According to the Colfax family income data, there are 115 families falling into the $50,000 to $74,999 income range, which is the most common income bracket and makes up 23.2% of all families.
| Income Bracket | # Families | % Families |
| Less than $10,000 | 0 | 0.0% |
| $10,000 to $14,999 | 0 | 0.0% |
| $15,000 to $24,999 | 47 | 9.5% |
| $25,000 to $34,999 | 29 | 5.9% |
| $35,000 to $49,999 | 35 | 7.1% |
| $50,000 to $74,999 | 115 | 23.2% |
| $75,000 to $99,999 | 94 | 19.0% |
| $100,000 to $149,999 | 79 | 16.0% |
| $150,000 to $199,999 | 82 | 16.6% |
| $200,000+ | 14 | 2.8% |
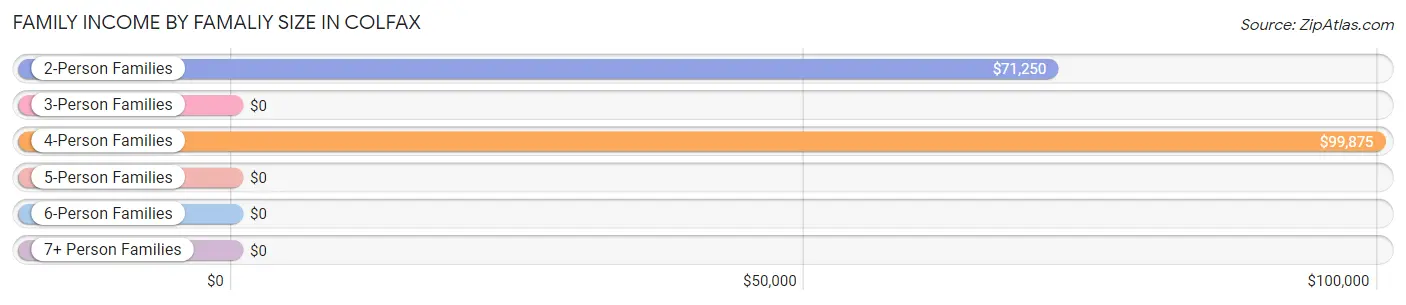
Family Income by Famaliy Size in Colfax
4-person families (176 | 35.6%) account for the highest median family income in Colfax with $99,875 per family, while 2-person families (196 | 39.6%) have the highest median income of $35,625 per family member.
| Income Bracket | # Families | Median Income |
| 2-Person Families | 196 (39.6%) | $71,250 |
| 3-Person Families | 81 (16.4%) | $0 |
| 4-Person Families | 176 (35.6%) | $99,875 |
| 5-Person Families | 15 (3.0%) | $0 |
| 6-Person Families | 13 (2.6%) | $0 |
| 7+ Person Families | 14 (2.8%) | $0 |
| Total | 495 (100.0%) | $88,646 |
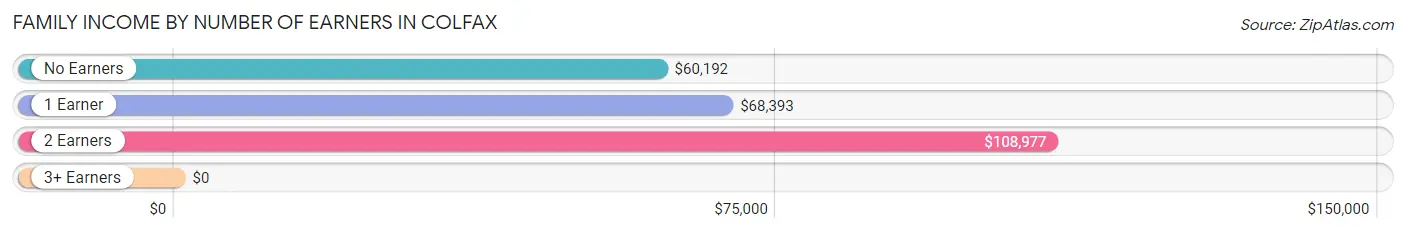
Family Income by Number of Earners in Colfax
| Number of Earners | # Families | Median Income |
| No Earners | 48 (9.7%) | $60,192 |
| 1 Earner | 160 (32.3%) | $68,393 |
| 2 Earners | 273 (55.1%) | $108,977 |
| 3+ Earners | 14 (2.8%) | $0 |
| Total | 495 (100.0%) | $88,646 |
Household Income in Colfax
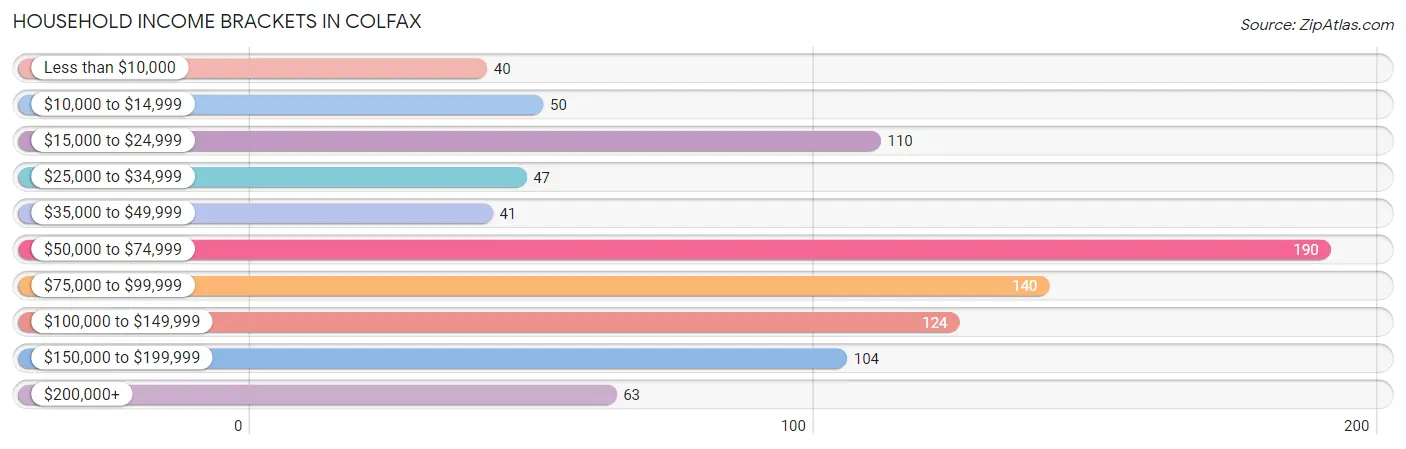
Household Income Brackets in Colfax
With 190 households falling in the category, the $50,000 to $74,999 income range is the most frequent in Colfax, accounting for 20.9% of all households. In contrast, only 40 households (4.4%) fall into the less than $10,000 income bracket, making it the least populous group.
| Income Bracket | # Households | % Households |
| Less than $10,000 | 40 | 4.4% |
| $10,000 to $14,999 | 50 | 5.5% |
| $15,000 to $24,999 | 110 | 12.1% |
| $25,000 to $34,999 | 47 | 5.2% |
| $35,000 to $49,999 | 41 | 4.5% |
| $50,000 to $74,999 | 190 | 20.9% |
| $75,000 to $99,999 | 140 | 15.4% |
| $100,000 to $149,999 | 124 | 13.6% |
| $150,000 to $199,999 | 104 | 11.4% |
| $200,000+ | 63 | 6.9% |
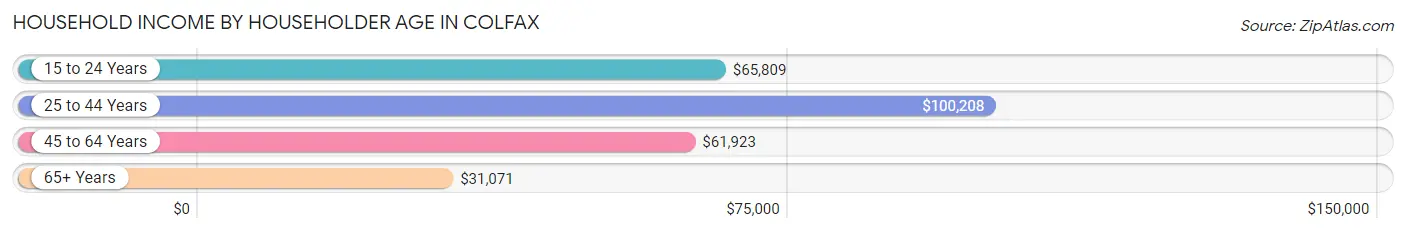
Household Income by Householder Age in Colfax
The median household income in Colfax is $70,720, with the highest median household income of $100,208 found in the 25 to 44 years age bracket for the primary householder. A total of 396 households (43.6%) fall into this category. Meanwhile, the 65+ years age bracket for the primary householder has the lowest median household income of $31,071, with 194 households (21.3%) in this group.
| Income Bracket | # Households | Median Income |
| 15 to 24 Years | 61 (6.7%) | $65,809 |
| 25 to 44 Years | 396 (43.6%) | $100,208 |
| 45 to 64 Years | 258 (28.4%) | $61,923 |
| 65+ Years | 194 (21.3%) | $31,071 |
| Total | 909 (100.0%) | $70,720 |
Poverty in Colfax
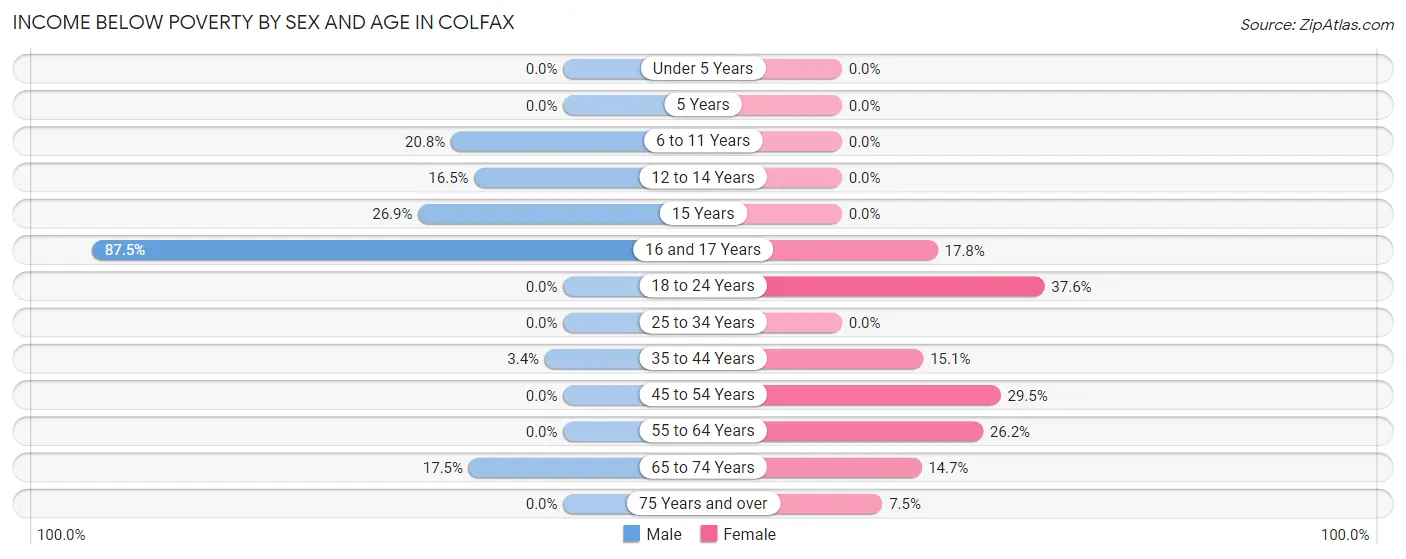
Income Below Poverty by Sex and Age in Colfax
With 8.1% poverty level for males and 14.9% for females among the residents of Colfax, 16 and 17 year old males and 18 to 24 year old females are the most vulnerable to poverty, with 21 males (87.5%) and 41 females (37.6%) in their respective age groups living below the poverty level.
| Age Bracket | Male | Female |
| Under 5 Years | 0 (0.0%) | 0 (0.0%) |
| 5 Years | 0 (0.0%) | 0 (0.0%) |
| 6 to 11 Years | 10 (20.8%) | 0 (0.0%) |
| 12 to 14 Years | 18 (16.5%) | 0 (0.0%) |
| 15 Years | 21 (26.9%) | 0 (0.0%) |
| 16 and 17 Years | 21 (87.5%) | 8 (17.8%) |
| 18 to 24 Years | 0 (0.0%) | 41 (37.6%) |
| 25 to 34 Years | 0 (0.0%) | 0 (0.0%) |
| 35 to 44 Years | 8 (3.4%) | 39 (15.1%) |
| 45 to 54 Years | 0 (0.0%) | 28 (29.5%) |
| 55 to 64 Years | 0 (0.0%) | 33 (26.2%) |
| 65 to 74 Years | 10 (17.5%) | 14 (14.7%) |
| 75 Years and over | 0 (0.0%) | 6 (7.5%) |
| Total | 88 (8.1%) | 169 (14.9%) |
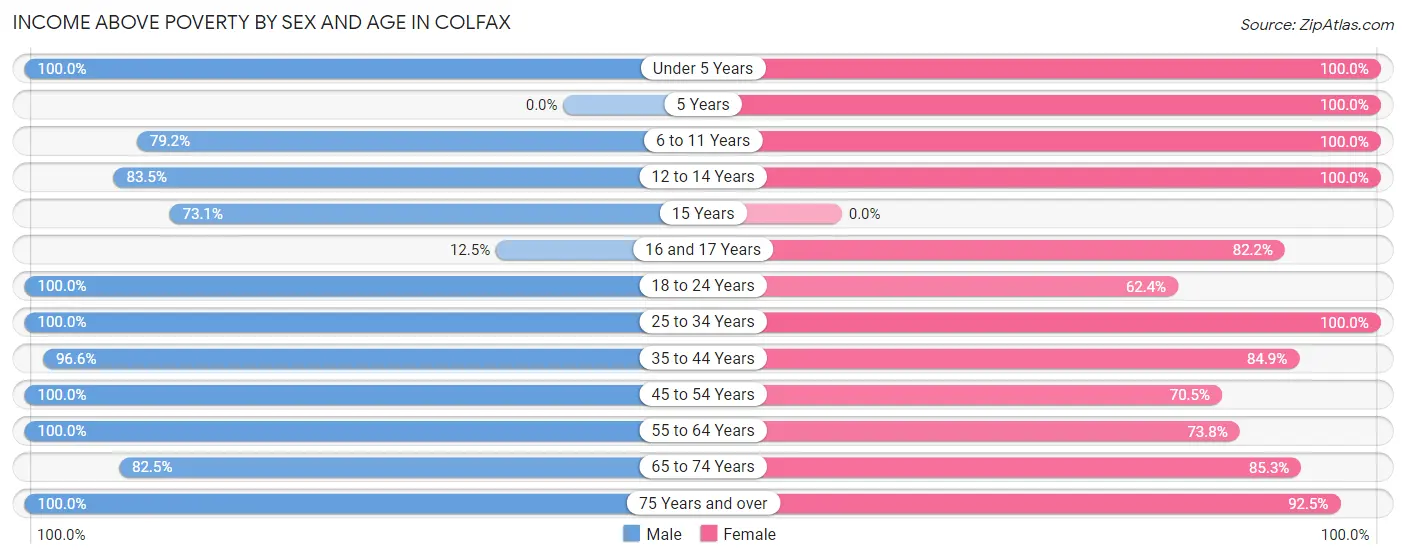
Income Above Poverty by Sex and Age in Colfax
According to the poverty statistics in Colfax, males aged under 5 years and females aged under 5 years are the age groups that are most secure financially, with 100.0% of males and 100.0% of females in these age groups living above the poverty line.
| Age Bracket | Male | Female |
| Under 5 Years | 30 (100.0%) | 15 (100.0%) |
| 5 Years | 0 (0.0%) | 27 (100.0%) |
| 6 to 11 Years | 38 (79.2%) | 141 (100.0%) |
| 12 to 14 Years | 91 (83.5%) | 20 (100.0%) |
| 15 Years | 57 (73.1%) | 0 (0.0%) |
| 16 and 17 Years | 3 (12.5%) | 37 (82.2%) |
| 18 to 24 Years | 99 (100.0%) | 68 (62.4%) |
| 25 to 34 Years | 182 (100.0%) | 120 (100.0%) |
| 35 to 44 Years | 226 (96.6%) | 219 (84.9%) |
| 45 to 54 Years | 88 (100.0%) | 67 (70.5%) |
| 55 to 64 Years | 100 (100.0%) | 93 (73.8%) |
| 65 to 74 Years | 47 (82.5%) | 81 (85.3%) |
| 75 Years and over | 41 (100.0%) | 74 (92.5%) |
| Total | 1,002 (91.9%) | 962 (85.1%) |
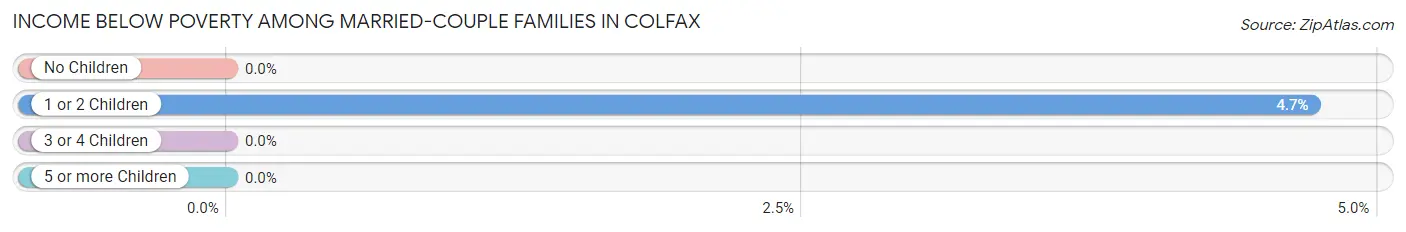
Income Below Poverty Among Married-Couple Families in Colfax
The poverty statistics for married-couple families in Colfax show that 2.4% or 8 of the total 340 families live below the poverty line. Families with 1 or 2 children have the highest poverty rate of 4.7%, comprising of 8 families. On the other hand, families with no children have the lowest poverty rate of 0.0%, which includes 0 families.
| Children | Above Poverty | Below Poverty |
| No Children | 128 (100.0%) | 0 (0.0%) |
| 1 or 2 Children | 162 (95.3%) | 8 (4.7%) |
| 3 or 4 Children | 42 (100.0%) | 0 (0.0%) |
| 5 or more Children | 0 (0.0%) | 0 (0.0%) |
| Total | 332 (97.7%) | 8 (2.4%) |
Income Below Poverty Among Single-Parent Households in Colfax
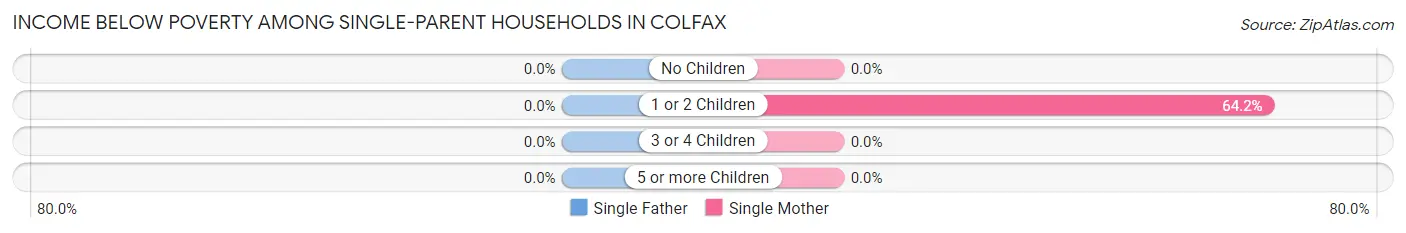
| Children | Single Father | Single Mother |
| No Children | 0 (0.0%) | 0 (0.0%) |
| 1 or 2 Children | 0 (0.0%) | 43 (64.2%) |
| 3 or 4 Children | 0 (0.0%) | 0 (0.0%) |
| 5 or more Children | 0 (0.0%) | 0 (0.0%) |
| Total | 0 (0.0%) | 43 (35.2%) |
Income Below Poverty Among Married-Couple vs Single-Parent Households in Colfax
The poverty data for Colfax shows that 8 of the married-couple family households (2.4%) and 43 of the single-parent households (27.7%) are living below the poverty level. Within the married-couple family households, those with 1 or 2 children have the highest poverty rate, with 8 households (4.7%) falling below the poverty line. Among the single-parent households, those with 1 or 2 children have the highest poverty rate, with 43 household (50.6%) living below poverty.
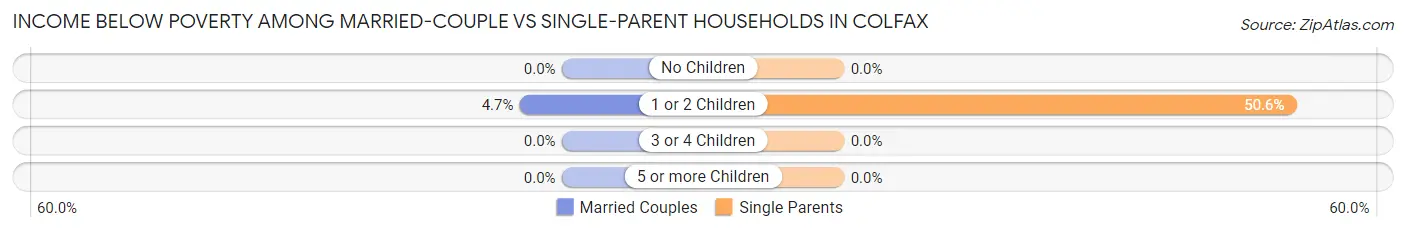
| Children | Married-Couple Families | Single-Parent Households |
| No Children | 0 (0.0%) | 0 (0.0%) |
| 1 or 2 Children | 8 (4.7%) | 43 (50.6%) |
| 3 or 4 Children | 0 (0.0%) | 0 (0.0%) |
| 5 or more Children | 0 (0.0%) | 0 (0.0%) |
| Total | 8 (2.4%) | 43 (27.7%) |
Race in Colfax
The most populous races in Colfax are White / Caucasian (1,919 | 86.1%), Hispanic or Latino (260 | 11.7%), and Two or more Races (228 | 10.2%).
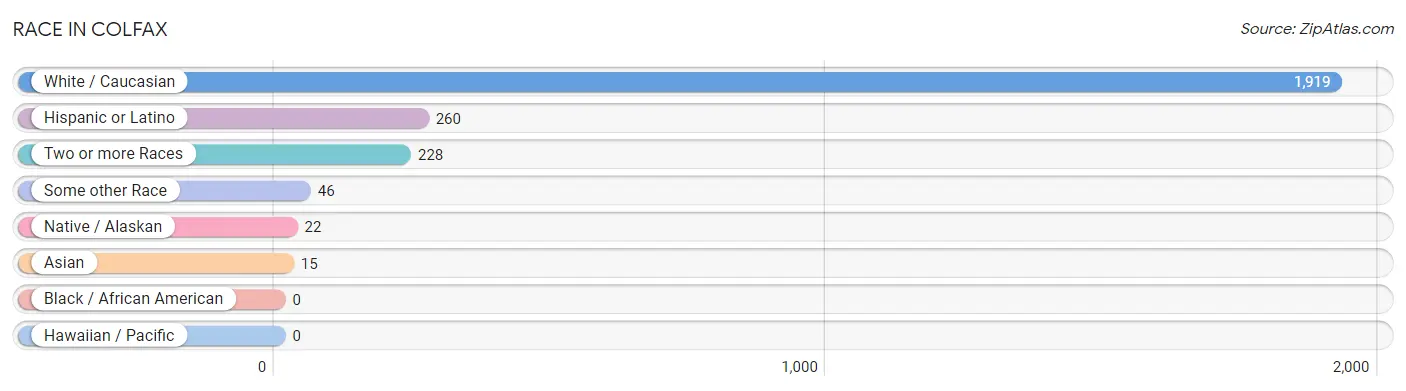
| Race | # Population | % Population |
| Asian | 15 | 0.7% |
| Black / African American | 0 | 0.0% |
| Hawaiian / Pacific | 0 | 0.0% |
| Hispanic or Latino | 260 | 11.7% |
| Native / Alaskan | 22 | 1.0% |
| White / Caucasian | 1,919 | 86.1% |
| Two or more Races | 228 | 10.2% |
| Some other Race | 46 | 2.1% |
| Total | 2,230 | 100.0% |
Ancestry in Colfax
The most populous ancestries reported in Colfax are German (322 | 14.4%), Mexican (256 | 11.5%), Irish (255 | 11.4%), English (199 | 8.9%), and European (161 | 7.2%), together accounting for 53.5% of all Colfax residents.
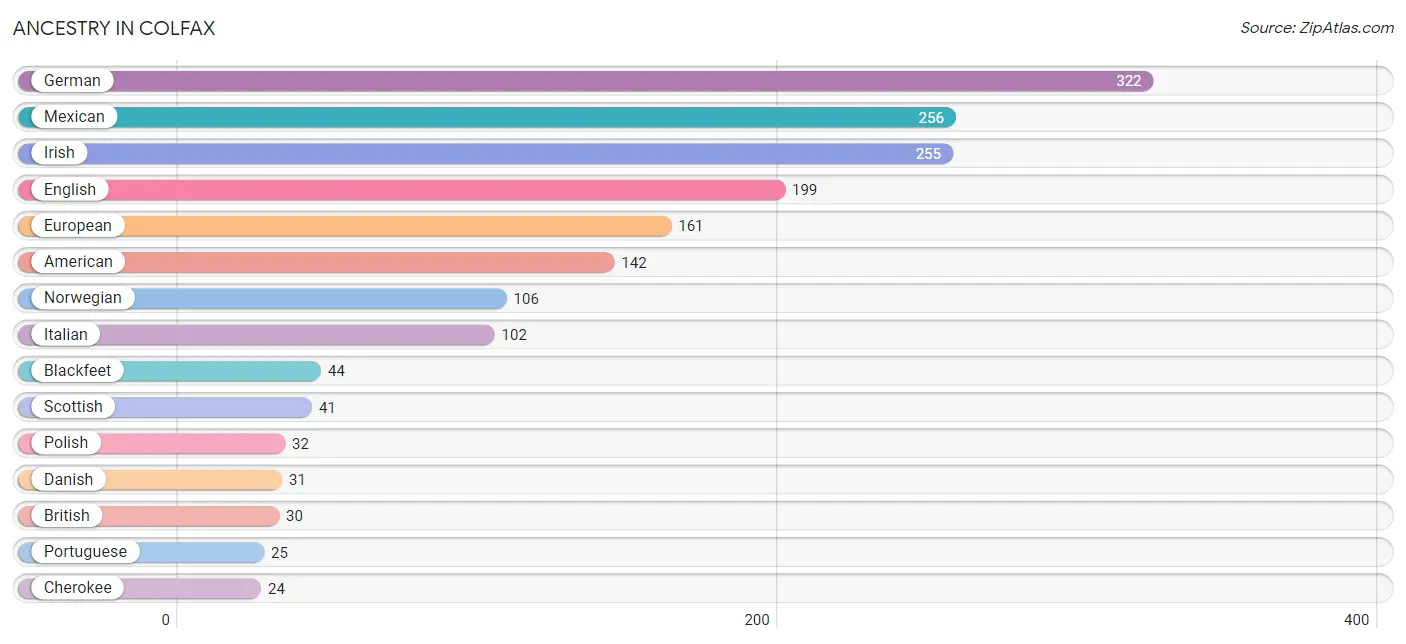
| Ancestry | # Population | % Population |
| American | 142 | 6.4% |
| Armenian | 15 | 0.7% |
| Australian | 12 | 0.5% |
| Bhutanese | 3 | 0.1% |
| Blackfeet | 44 | 2.0% |
| British | 30 | 1.3% |
| Canadian | 6 | 0.3% |
| Central American Indian | 7 | 0.3% |
| Cherokee | 24 | 1.1% |
| Cuban | 4 | 0.2% |
| Danish | 31 | 1.4% |
| Eastern European | 7 | 0.3% |
| English | 199 | 8.9% |
| European | 161 | 7.2% |
| Filipino | 4 | 0.2% |
| French | 15 | 0.7% |
| French American Indian | 6 | 0.3% |
| French Canadian | 13 | 0.6% |
| German | 322 | 14.4% |
| Greek | 7 | 0.3% |
| Irish | 255 | 11.4% |
| Italian | 102 | 4.6% |
| Korean | 23 | 1.0% |
| Lithuanian | 3 | 0.1% |
| Mexican | 256 | 11.5% |
| Norwegian | 106 | 4.8% |
| Osage | 8 | 0.4% |
| Polish | 32 | 1.4% |
| Portuguese | 25 | 1.1% |
| Romanian | 4 | 0.2% |
| Russian | 21 | 0.9% |
| Scotch-Irish | 10 | 0.4% |
| Scottish | 41 | 1.8% |
| Swedish | 23 | 1.0% |
| Welsh | 4 | 0.2% | View All 35 Rows |
Immigrants in Colfax
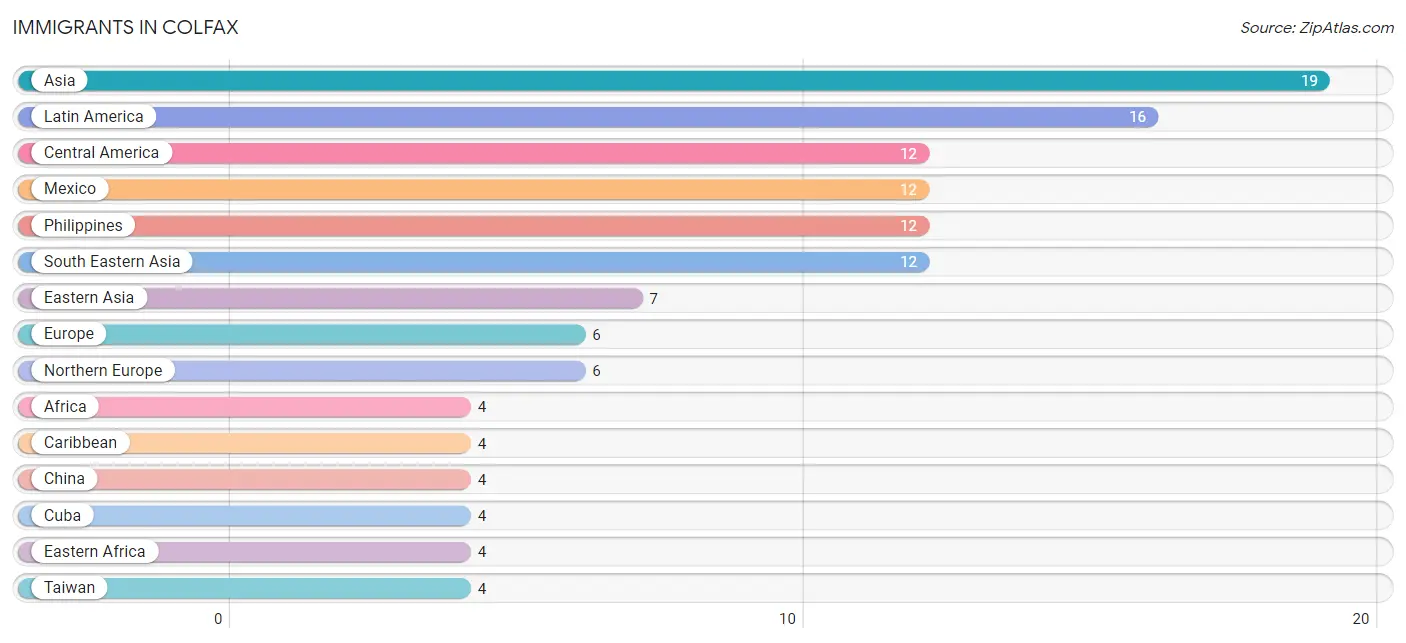
The most numerous immigrant groups reported in Colfax came from Asia (19 | 0.9%), Latin America (16 | 0.7%), Central America (12 | 0.5%), Mexico (12 | 0.5%), and Philippines (12 | 0.5%), together accounting for 3.2% of all Colfax residents.
| Immigration Origin | # Population | % Population |
| Africa | 4 | 0.2% |
| Asia | 19 | 0.9% |
| Caribbean | 4 | 0.2% |
| Central America | 12 | 0.5% |
| China | 4 | 0.2% |
| Cuba | 4 | 0.2% |
| Eastern Africa | 4 | 0.2% |
| Eastern Asia | 7 | 0.3% |
| Europe | 6 | 0.3% |
| Japan | 3 | 0.1% |
| Latin America | 16 | 0.7% |
| Mexico | 12 | 0.5% |
| Northern Europe | 6 | 0.3% |
| Philippines | 12 | 0.5% |
| South Eastern Asia | 12 | 0.5% |
| Taiwan | 4 | 0.2% | View All 16 Rows |
Sex and Age in Colfax
Sex and Age in Colfax
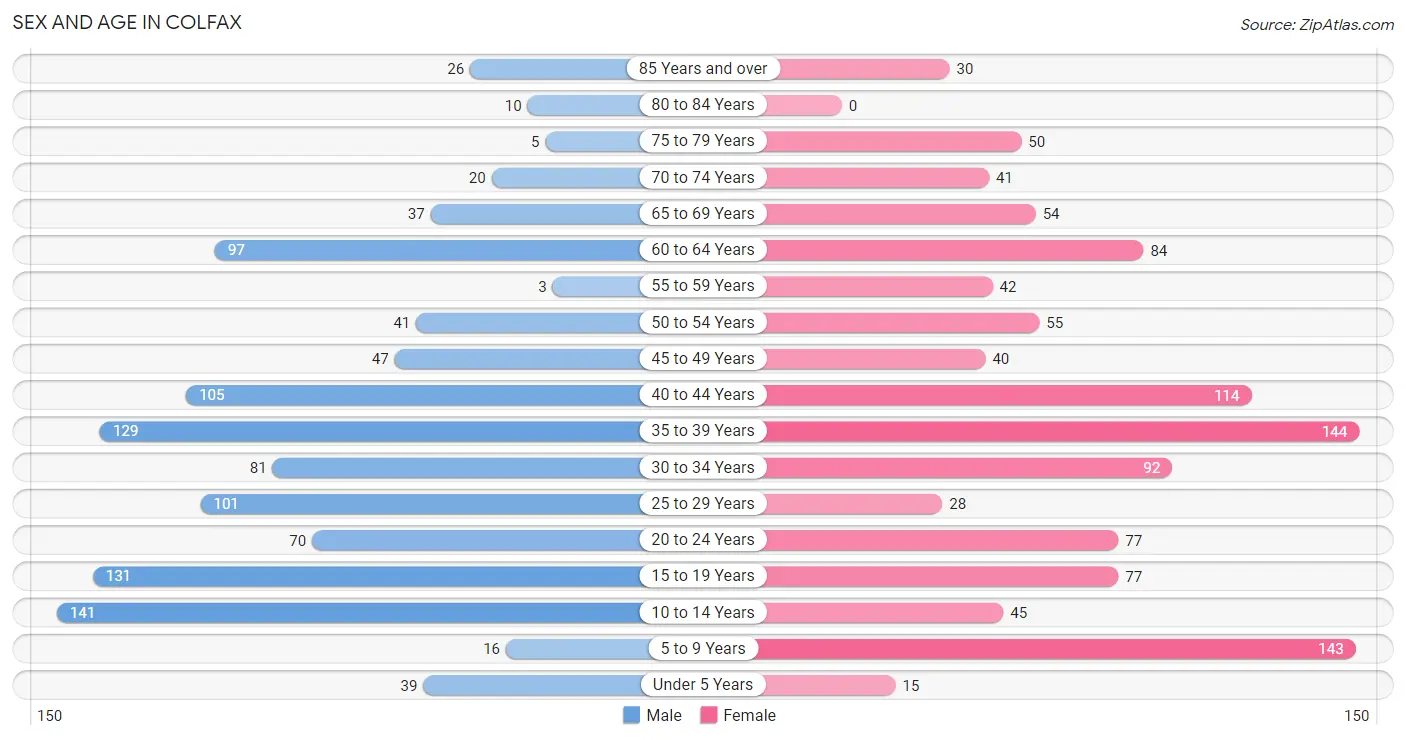
The most populous age groups in Colfax are 10 to 14 Years (141 | 12.8%) for men and 35 to 39 Years (144 | 12.7%) for women.
| Age Bracket | Male | Female |
| Under 5 Years | 39 (3.5%) | 15 (1.3%) |
| 5 to 9 Years | 16 (1.5%) | 143 (12.6%) |
| 10 to 14 Years | 141 (12.8%) | 45 (4.0%) |
| 15 to 19 Years | 131 (11.9%) | 77 (6.8%) |
| 20 to 24 Years | 70 (6.4%) | 77 (6.8%) |
| 25 to 29 Years | 101 (9.2%) | 28 (2.5%) |
| 30 to 34 Years | 81 (7.4%) | 92 (8.1%) |
| 35 to 39 Years | 129 (11.7%) | 144 (12.7%) |
| 40 to 44 Years | 105 (9.6%) | 114 (10.1%) |
| 45 to 49 Years | 47 (4.3%) | 40 (3.5%) |
| 50 to 54 Years | 41 (3.7%) | 55 (4.9%) |
| 55 to 59 Years | 3 (0.3%) | 42 (3.7%) |
| 60 to 64 Years | 97 (8.8%) | 84 (7.4%) |
| 65 to 69 Years | 37 (3.4%) | 54 (4.8%) |
| 70 to 74 Years | 20 (1.8%) | 41 (3.6%) |
| 75 to 79 Years | 5 (0.4%) | 50 (4.4%) |
| 80 to 84 Years | 10 (0.9%) | 0 (0.0%) |
| 85 Years and over | 26 (2.4%) | 30 (2.6%) |
| Total | 1,099 (100.0%) | 1,131 (100.0%) |
Families and Households in Colfax
Median Family Size in Colfax
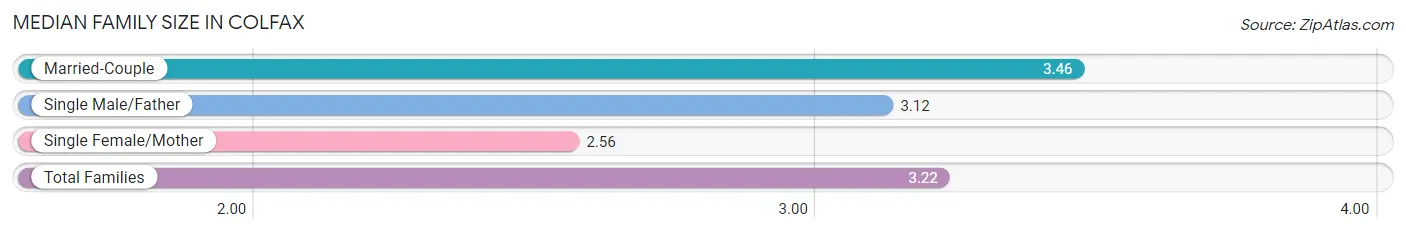
The median family size in Colfax is 3.22 persons per family, with married-couple families (340 | 68.7%) accounting for the largest median family size of 3.46 persons per family. On the other hand, single female/mother families (122 | 24.6%) represent the smallest median family size with 2.56 persons per family.
| Family Type | # Families | Family Size |
| Married-Couple | 340 (68.7%) | 3.46 |
| Single Male/Father | 33 (6.7%) | 3.12 |
| Single Female/Mother | 122 (24.6%) | 2.56 |
| Total Families | 495 (100.0%) | 3.22 |
Median Household Size in Colfax
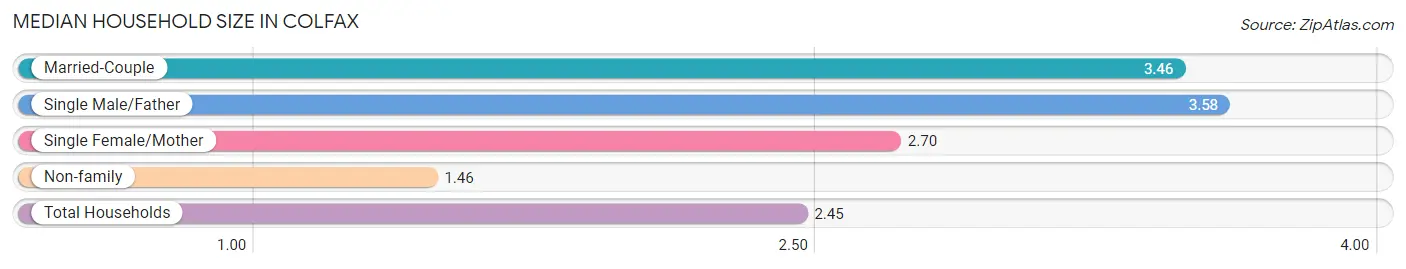
The median household size in Colfax is 2.45 persons per household, with single male/father households (33 | 3.6%) accounting for the largest median household size of 3.58 persons per household. non-family households (414 | 45.5%) represent the smallest median household size with 1.46 persons per household.
| Household Type | # Households | Household Size |
| Married-Couple | 340 (37.4%) | 3.46 |
| Single Male/Father | 33 (3.6%) | 3.58 |
| Single Female/Mother | 122 (13.4%) | 2.70 |
| Non-family | 414 (45.5%) | 1.46 |
| Total Households | 909 (100.0%) | 2.45 |
Household Size by Marriage Status in Colfax
Out of a total of 909 households in Colfax, 495 (54.5%) are family households, while 414 (45.5%) are nonfamily households. The most numerous type of family households are 4-person households, comprising 176, and the most common type of nonfamily households are 1-person households, comprising 294.
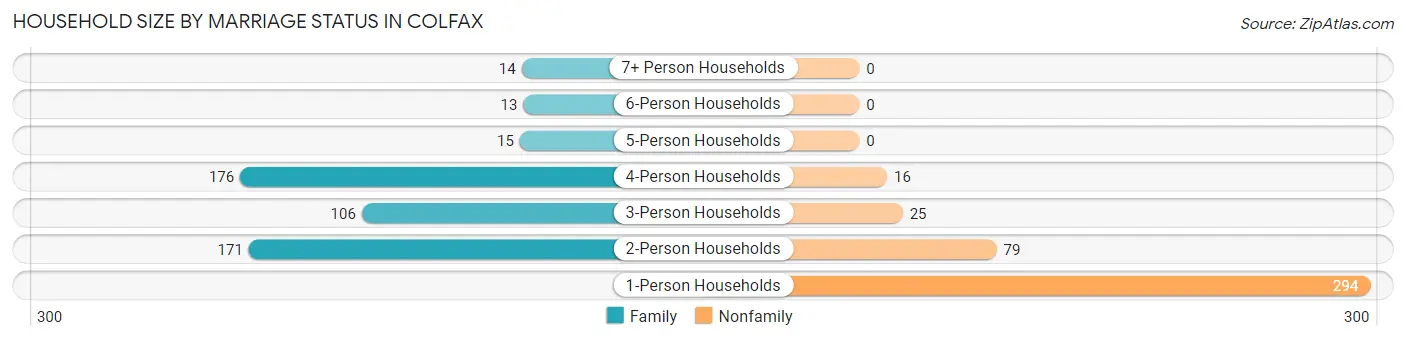
| Household Size | Family Households | Nonfamily Households |
| 1-Person Households | - | 294 (32.3%) |
| 2-Person Households | 171 (18.8%) | 79 (8.7%) |
| 3-Person Households | 106 (11.7%) | 25 (2.8%) |
| 4-Person Households | 176 (19.4%) | 16 (1.8%) |
| 5-Person Households | 15 (1.7%) | 0 (0.0%) |
| 6-Person Households | 13 (1.4%) | 0 (0.0%) |
| 7+ Person Households | 14 (1.5%) | 0 (0.0%) |
| Total | 495 (54.5%) | 414 (45.5%) |
Female Fertility in Colfax
Fertility by Age in Colfax
Average fertility rate in Colfax is 54.0 births per 1,000 women. Women in the age bracket of 20 to 34 years have the highest fertility rate with 157.0 births per 1,000 women. Women in the age bracket of 20 to 34 years acount for 100.0% of all women with births.
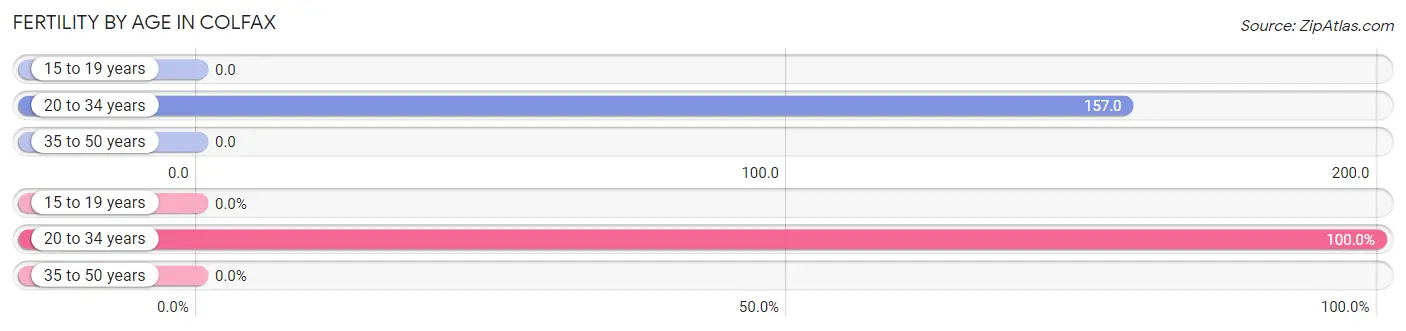
| Age Bracket | Women with Births | Births / 1,000 Women |
| 15 to 19 years | 0 (0.0%) | 0.0 |
| 20 to 34 years | 31 (100.0%) | 157.0 |
| 35 to 50 years | 0 (0.0%) | 0.0 |
| Total | 31 (100.0%) | 54.0 |
Fertility by Age by Marriage Status in Colfax
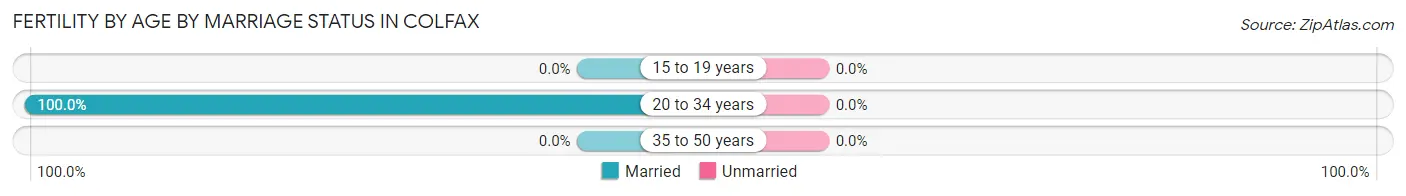
| Age Bracket | Married | Unmarried |
| 15 to 19 years | 0 (0.0%) | 0 (0.0%) |
| 20 to 34 years | 31 (100.0%) | 0 (0.0%) |
| 35 to 50 years | 0 (0.0%) | 0 (0.0%) |
| Total | 31 (100.0%) | 0 (0.0%) |
Fertility by Education in Colfax
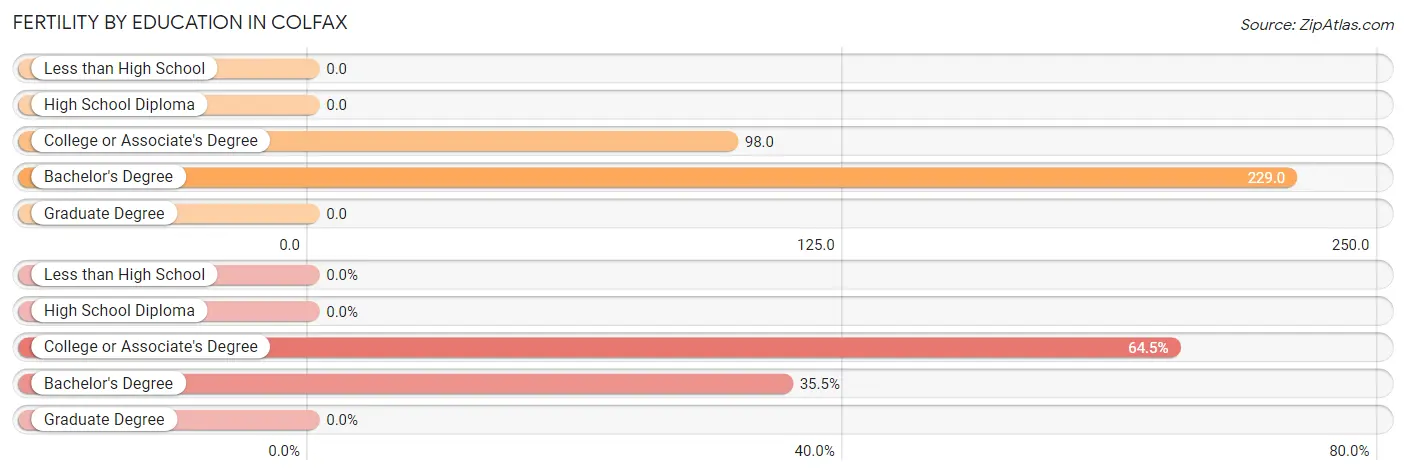
| Educational Attainment | Women with Births | Births / 1,000 Women |
| Less than High School | 0 (0.0%) | 0.0 |
| High School Diploma | 0 (0.0%) | 0.0 |
| College or Associate's Degree | 20 (64.5%) | 98.0 |
| Bachelor's Degree | 11 (35.5%) | 229.0 |
| Graduate Degree | 0 (0.0%) | 0.0 |
| Total | 31 (100.0%) | 54.0 |
Fertility by Education by Marriage Status in Colfax
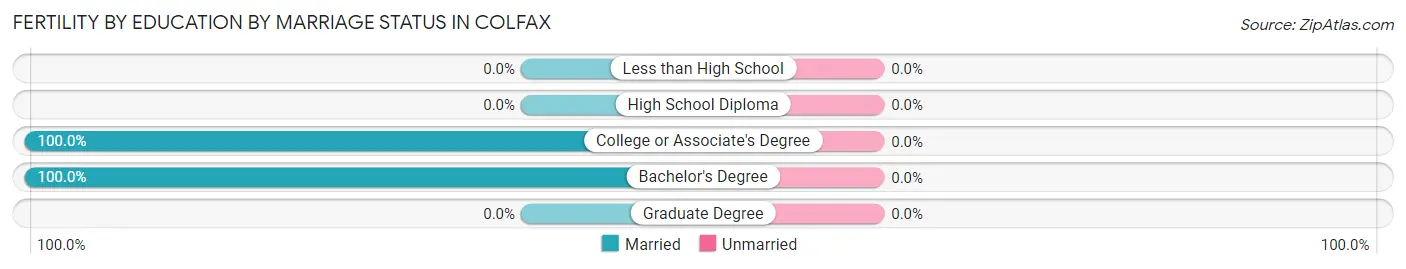
| Educational Attainment | Married | Unmarried |
| Less than High School | 0 (0.0%) | 0 (0.0%) |
| High School Diploma | 0 (0.0%) | 0 (0.0%) |
| College or Associate's Degree | 20 (100.0%) | 0 (0.0%) |
| Bachelor's Degree | 11 (100.0%) | 0 (0.0%) |
| Graduate Degree | 0 (0.0%) | 0 (0.0%) |
| Total | 31 (100.0%) | 0 (0.0%) |
Employment Characteristics in Colfax
Employment by Class of Employer in Colfax
Among the 1,057 employed individuals in Colfax, private company employees (734 | 69.4%), local government employees (129 | 12.2%), and state government employees (63 | 6.0%) make up the most common classes of employment.
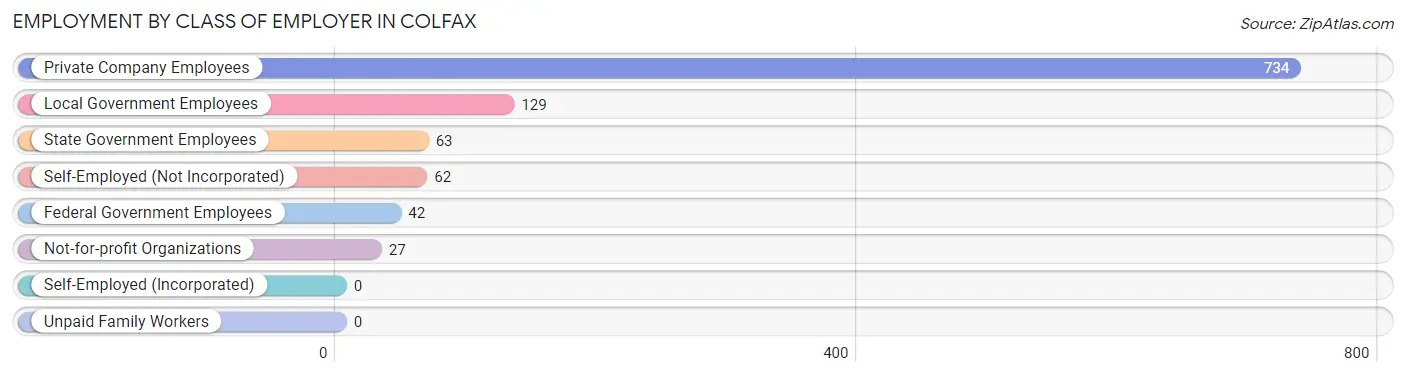
| Employer Class | # Employees | % Employees |
| Private Company Employees | 734 | 69.4% |
| Self-Employed (Incorporated) | 0 | 0.0% |
| Self-Employed (Not Incorporated) | 62 | 5.9% |
| Not-for-profit Organizations | 27 | 2.5% |
| Local Government Employees | 129 | 12.2% |
| State Government Employees | 63 | 6.0% |
| Federal Government Employees | 42 | 4.0% |
| Unpaid Family Workers | 0 | 0.0% |
| Total | 1,057 | 100.0% |
Employment Status by Age in Colfax
According to the labor force statistics for Colfax, out of the total population over 16 years of age (1,753), 65.4% or 1,146 individuals are in the labor force, with 7.7% or 88 of them unemployed. The age group with the highest labor force participation rate is 30 to 34 years, with 92.5% or 160 individuals in the labor force. Within the labor force, the 45 to 54 years age range has the highest percentage of unemployed individuals, with 29.3% or 49 of them being unemployed.
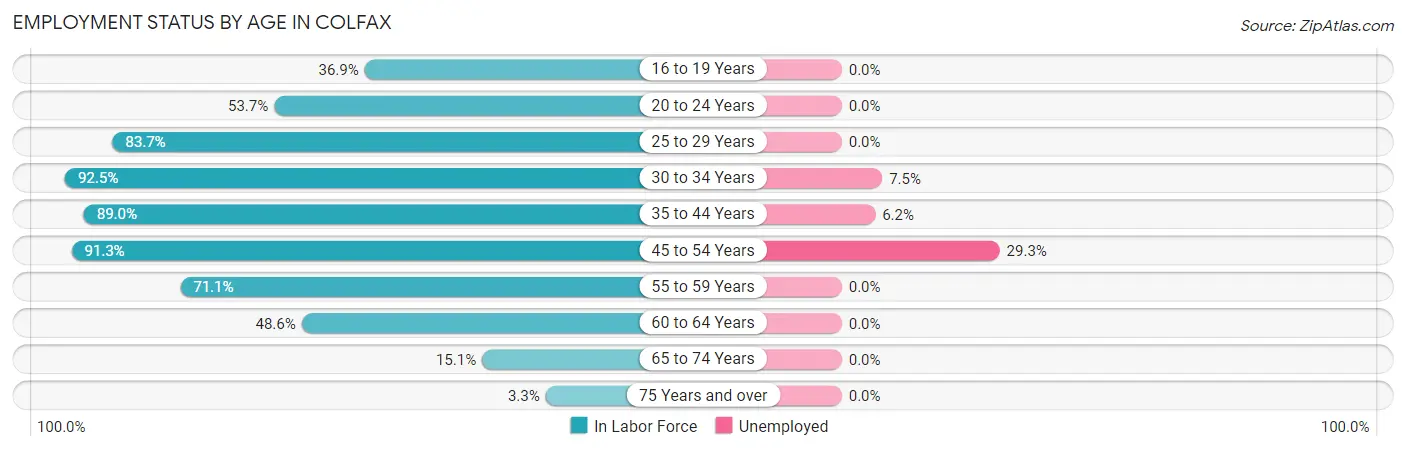
| Age Bracket | In Labor Force | Unemployed |
| 16 to 19 Years | 48 (36.9%) | 0 (0.0%) |
| 20 to 24 Years | 79 (53.7%) | 0 (0.0%) |
| 25 to 29 Years | 108 (83.7%) | 0 (0.0%) |
| 30 to 34 Years | 160 (92.5%) | 12 (7.5%) |
| 35 to 44 Years | 438 (89.0%) | 27 (6.2%) |
| 45 to 54 Years | 167 (91.3%) | 49 (29.3%) |
| 55 to 59 Years | 32 (71.1%) | 0 (0.0%) |
| 60 to 64 Years | 88 (48.6%) | 0 (0.0%) |
| 65 to 74 Years | 23 (15.1%) | 0 (0.0%) |
| 75 Years and over | 4 (3.3%) | 0 (0.0%) |
| Total | 1,146 (65.4%) | 88 (7.7%) |
Employment Status by Educational Attainment in Colfax
According to labor force statistics for Colfax, 82.5% of individuals (992) out of the total population between 25 and 64 years of age (1,203) are in the labor force, with 8.9% or 88 of them being unemployed. The group with the highest labor force participation rate are those with the educational attainment of less than high school, with 93.3% or 83 individuals in the labor force. Within the labor force, individuals with bachelor's degree or higher education have the highest percentage of unemployment, with 19.3% or 45 of them being unemployed.
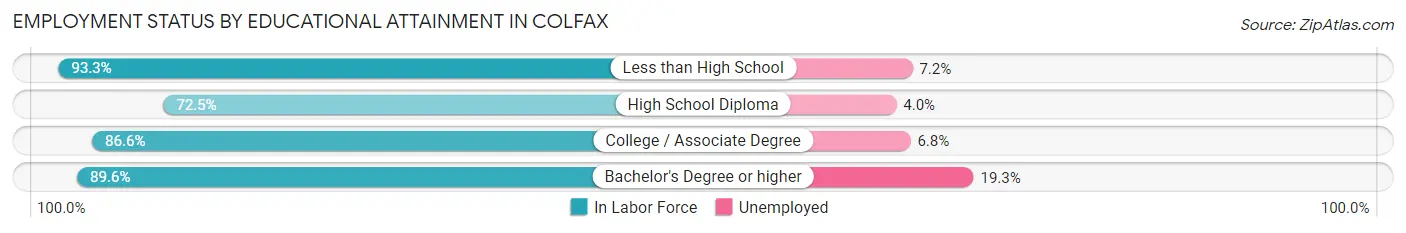
| Educational Attainment | In Labor Force | Unemployed |
| Less than High School | 83 (93.3%) | 6 (7.2%) |
| High School Diploma | 322 (72.5%) | 18 (4.0%) |
| College / Associate Degree | 355 (86.6%) | 28 (6.8%) |
| Bachelor's Degree or higher | 233 (89.6%) | 50 (19.3%) |
| Total | 992 (82.5%) | 107 (8.9%) |
Employment Occupations by Sex in Colfax
Management, Business, Science and Arts Occupations
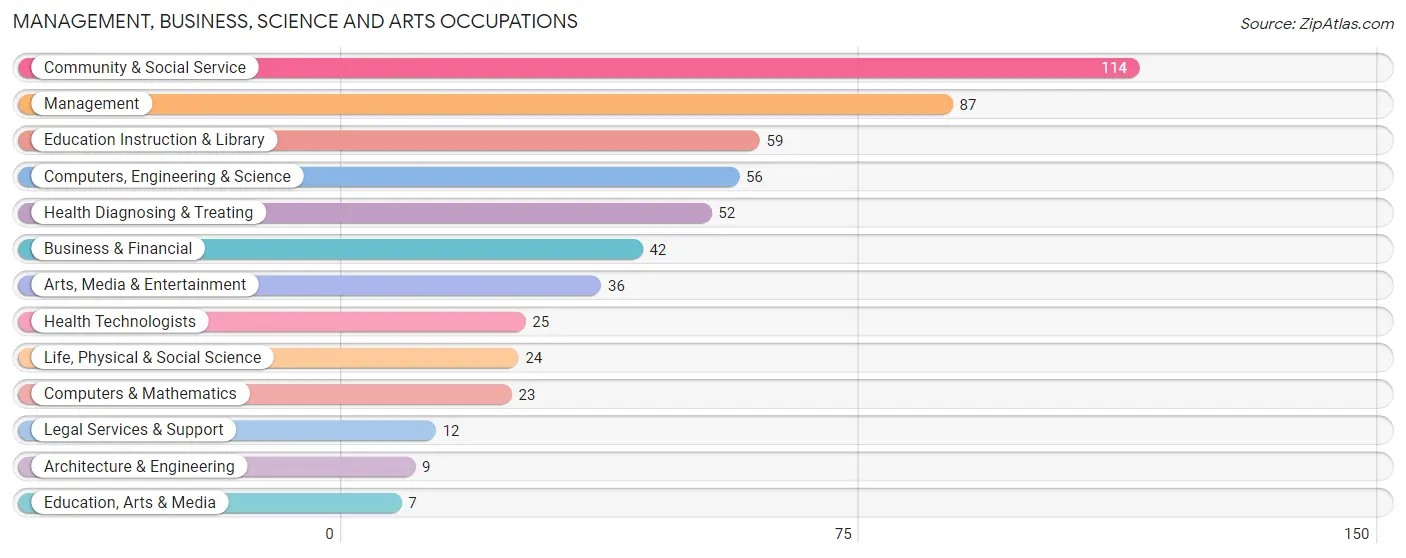
The most common Management, Business, Science and Arts occupations in Colfax are Community & Social Service (114 | 10.8%), Management (87 | 8.2%), Education Instruction & Library (59 | 5.6%), Computers, Engineering & Science (56 | 5.3%), and Health Diagnosing & Treating (52 | 4.9%).
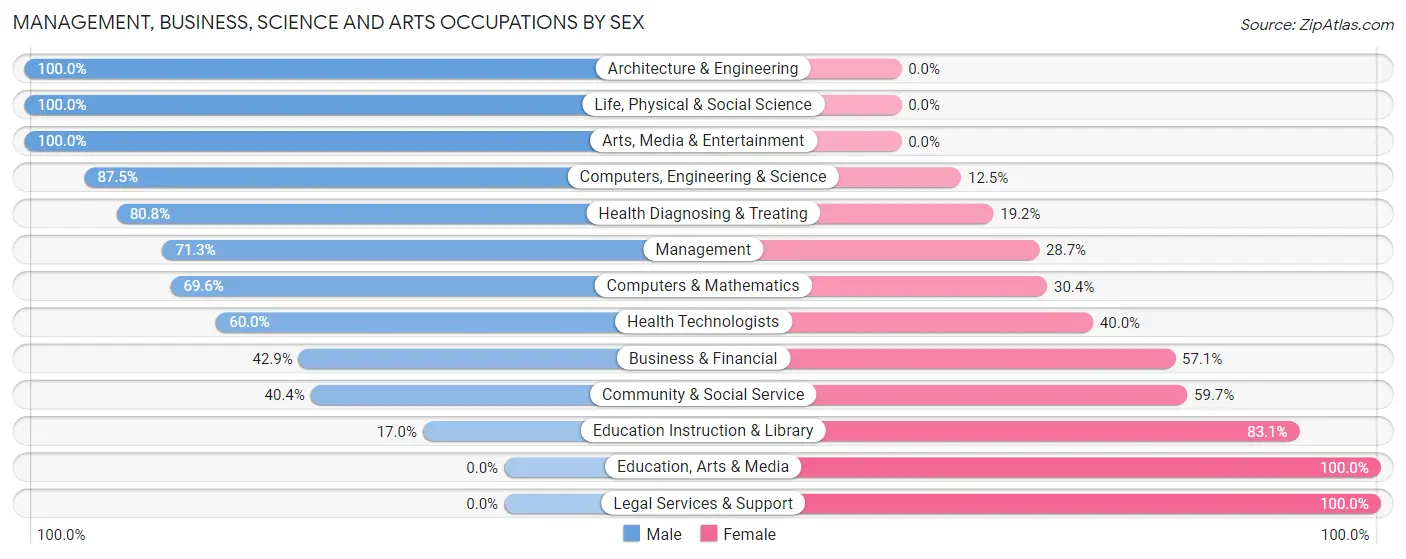
Management, Business, Science and Arts Occupations by Sex
Within the Management, Business, Science and Arts occupations in Colfax, the most male-oriented occupations are Architecture & Engineering (100.0%), Life, Physical & Social Science (100.0%), and Arts, Media & Entertainment (100.0%), while the most female-oriented occupations are Education, Arts & Media (100.0%), Legal Services & Support (100.0%), and Education Instruction & Library (83.1%).
| Occupation | Male | Female |
| Management | 62 (71.3%) | 25 (28.7%) |
| Business & Financial | 18 (42.9%) | 24 (57.1%) |
| Computers, Engineering & Science | 49 (87.5%) | 7 (12.5%) |
| Computers & Mathematics | 16 (69.6%) | 7 (30.4%) |
| Architecture & Engineering | 9 (100.0%) | 0 (0.0%) |
| Life, Physical & Social Science | 24 (100.0%) | 0 (0.0%) |
| Community & Social Service | 46 (40.4%) | 68 (59.7%) |
| Education, Arts & Media | 0 (0.0%) | 7 (100.0%) |
| Legal Services & Support | 0 (0.0%) | 12 (100.0%) |
| Education Instruction & Library | 10 (17.0%) | 49 (83.1%) |
| Arts, Media & Entertainment | 36 (100.0%) | 0 (0.0%) |
| Health Diagnosing & Treating | 42 (80.8%) | 10 (19.2%) |
| Health Technologists | 15 (60.0%) | 10 (40.0%) |
| Total (Category) | 217 (61.8%) | 134 (38.2%) |
| Total (Overall) | 612 (57.8%) | 447 (42.2%) |
Services Occupations
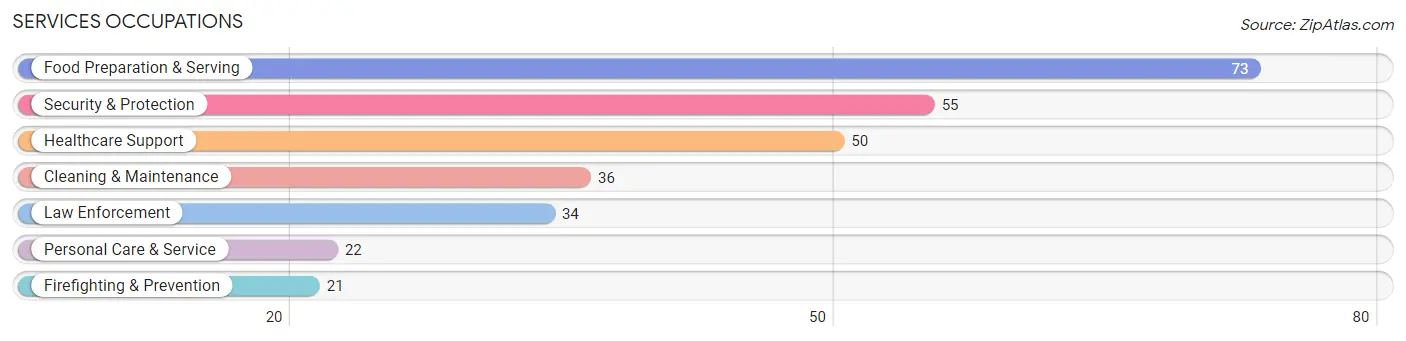
The most common Services occupations in Colfax are Food Preparation & Serving (73 | 6.9%), Security & Protection (55 | 5.2%), Healthcare Support (50 | 4.7%), Cleaning & Maintenance (36 | 3.4%), and Law Enforcement (34 | 3.2%).
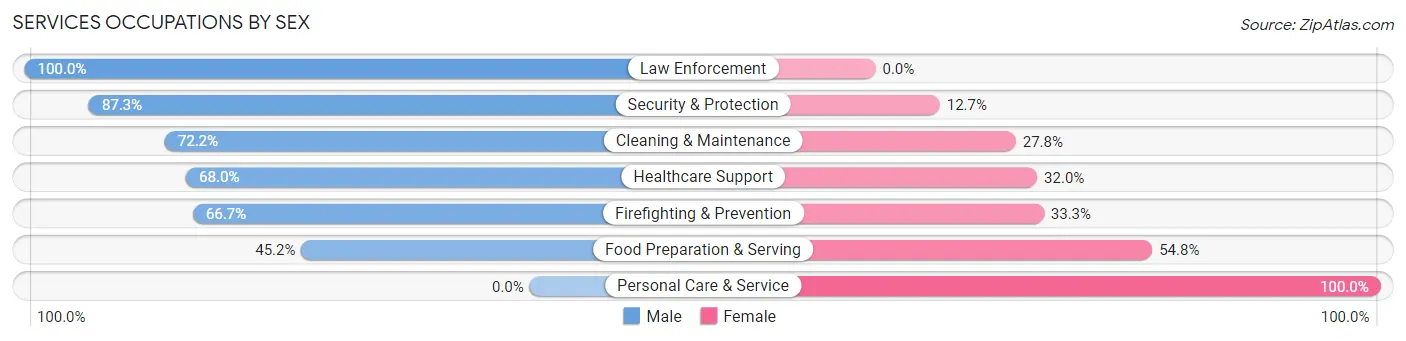
Services Occupations by Sex
Within the Services occupations in Colfax, the most male-oriented occupations are Law Enforcement (100.0%), Security & Protection (87.3%), and Cleaning & Maintenance (72.2%), while the most female-oriented occupations are Personal Care & Service (100.0%), Food Preparation & Serving (54.8%), and Firefighting & Prevention (33.3%).
| Occupation | Male | Female |
| Healthcare Support | 34 (68.0%) | 16 (32.0%) |
| Security & Protection | 48 (87.3%) | 7 (12.7%) |
| Firefighting & Prevention | 14 (66.7%) | 7 (33.3%) |
| Law Enforcement | 34 (100.0%) | 0 (0.0%) |
| Food Preparation & Serving | 33 (45.2%) | 40 (54.8%) |
| Cleaning & Maintenance | 26 (72.2%) | 10 (27.8%) |
| Personal Care & Service | 0 (0.0%) | 22 (100.0%) |
| Total (Category) | 141 (59.8%) | 95 (40.3%) |
| Total (Overall) | 612 (57.8%) | 447 (42.2%) |
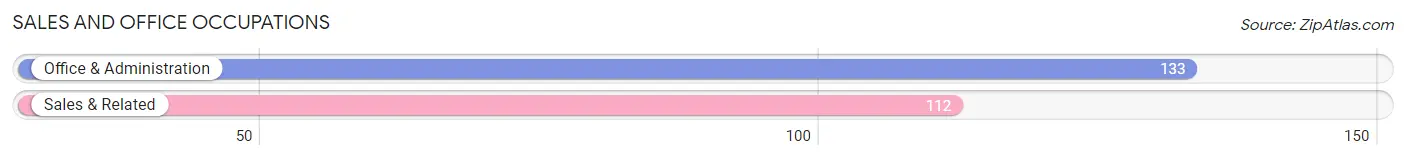
Sales and Office Occupations
The most common Sales and Office occupations in Colfax are Office & Administration (133 | 12.6%), and Sales & Related (112 | 10.6%).
Sales and Office Occupations by Sex
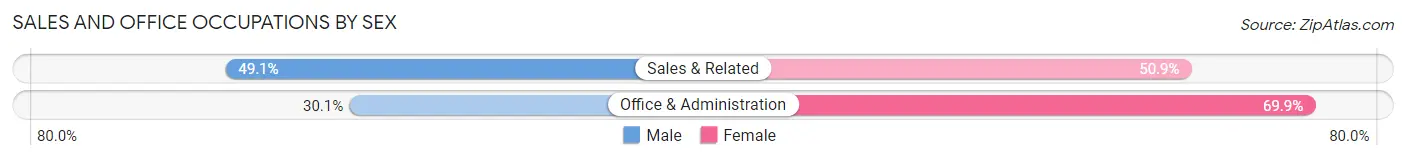
| Occupation | Male | Female |
| Sales & Related | 55 (49.1%) | 57 (50.9%) |
| Office & Administration | 40 (30.1%) | 93 (69.9%) |
| Total (Category) | 95 (38.8%) | 150 (61.2%) |
| Total (Overall) | 612 (57.8%) | 447 (42.2%) |
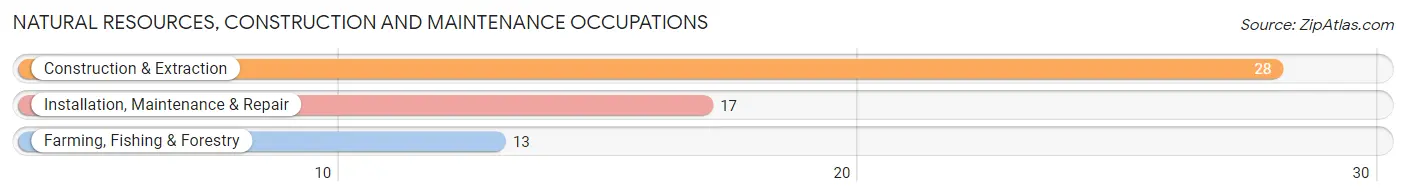
Natural Resources, Construction and Maintenance Occupations
The most common Natural Resources, Construction and Maintenance occupations in Colfax are Construction & Extraction (28 | 2.6%), Installation, Maintenance & Repair (17 | 1.6%), and Farming, Fishing & Forestry (13 | 1.2%).
Natural Resources, Construction and Maintenance Occupations by Sex
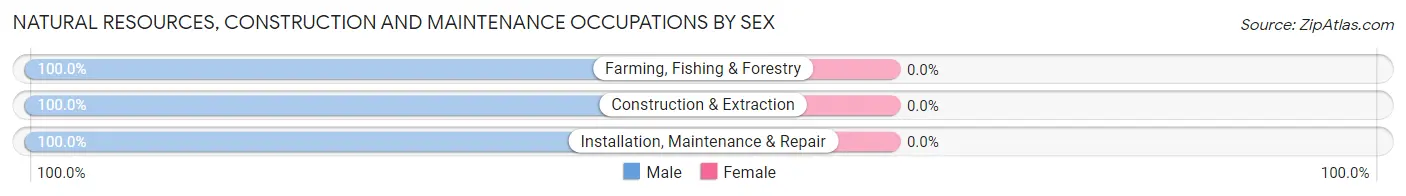
| Occupation | Male | Female |
| Farming, Fishing & Forestry | 13 (100.0%) | 0 (0.0%) |
| Construction & Extraction | 28 (100.0%) | 0 (0.0%) |
| Installation, Maintenance & Repair | 17 (100.0%) | 0 (0.0%) |
| Total (Category) | 58 (100.0%) | 0 (0.0%) |
| Total (Overall) | 612 (57.8%) | 447 (42.2%) |
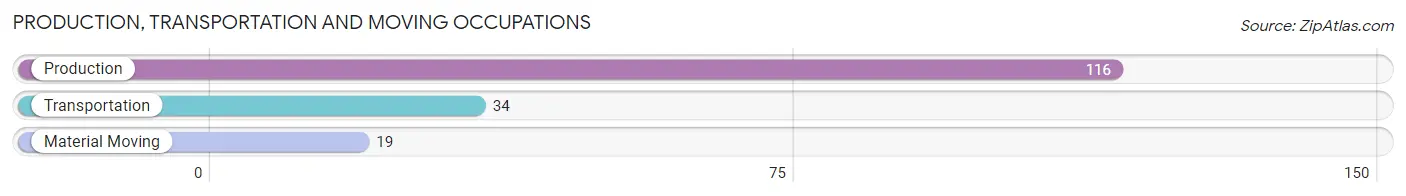
Production, Transportation and Moving Occupations
The most common Production, Transportation and Moving occupations in Colfax are Production (116 | 11.0%), Transportation (34 | 3.2%), and Material Moving (19 | 1.8%).
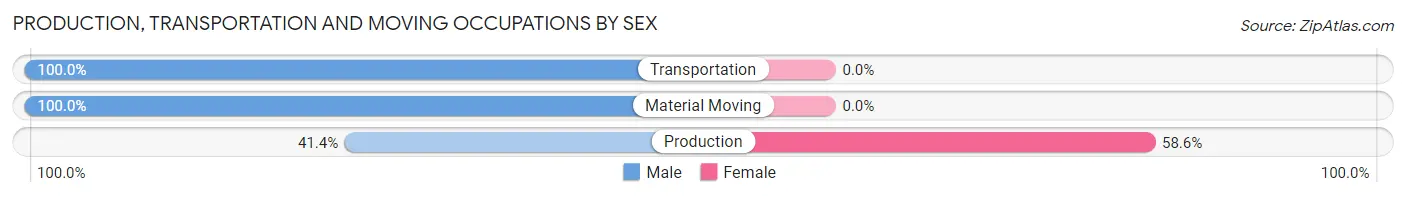
Production, Transportation and Moving Occupations by Sex
| Occupation | Male | Female |
| Production | 48 (41.4%) | 68 (58.6%) |
| Transportation | 34 (100.0%) | 0 (0.0%) |
| Material Moving | 19 (100.0%) | 0 (0.0%) |
| Total (Category) | 101 (59.8%) | 68 (40.2%) |
| Total (Overall) | 612 (57.8%) | 447 (42.2%) |
Employment Industries by Sex in Colfax
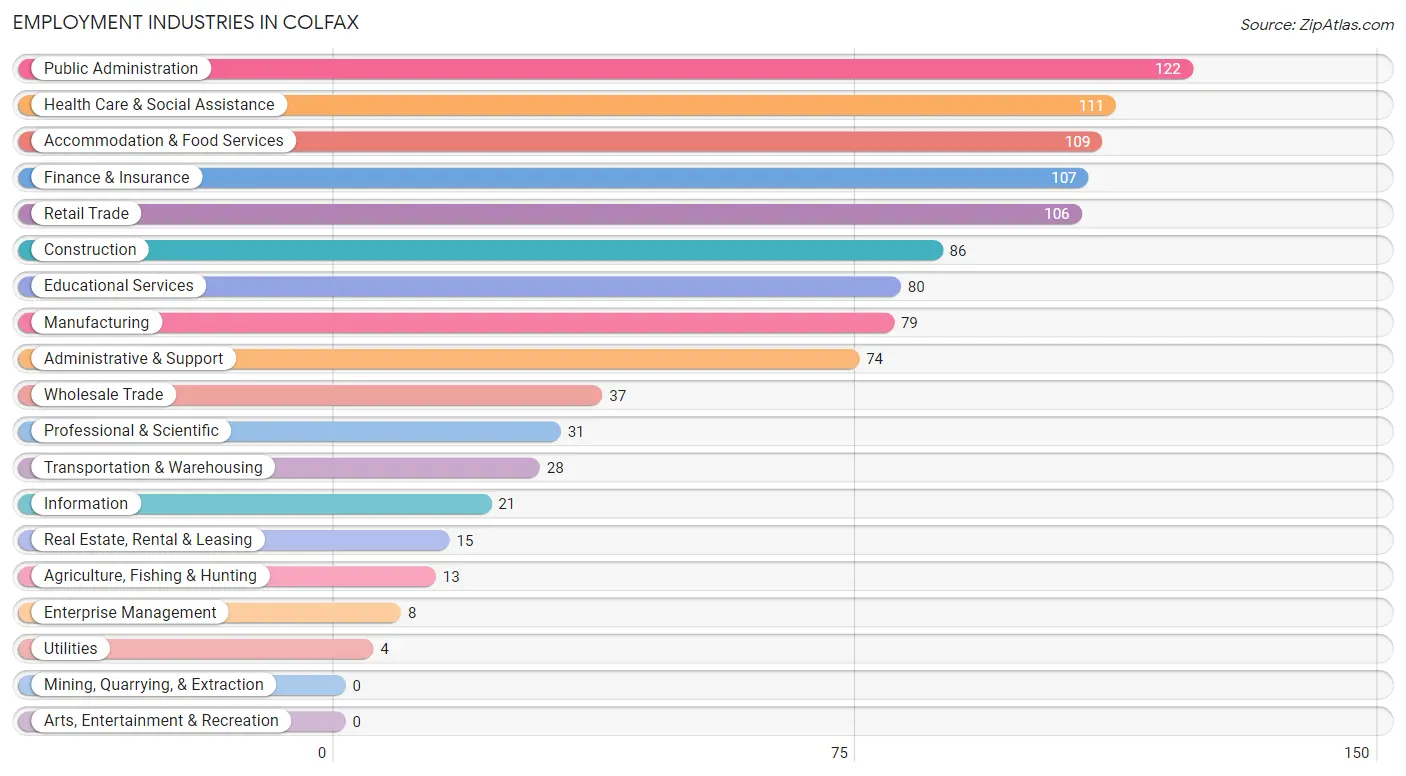
Employment Industries in Colfax
The major employment industries in Colfax include Public Administration (122 | 11.5%), Health Care & Social Assistance (111 | 10.5%), Accommodation & Food Services (109 | 10.3%), Finance & Insurance (107 | 10.1%), and Retail Trade (106 | 10.0%).
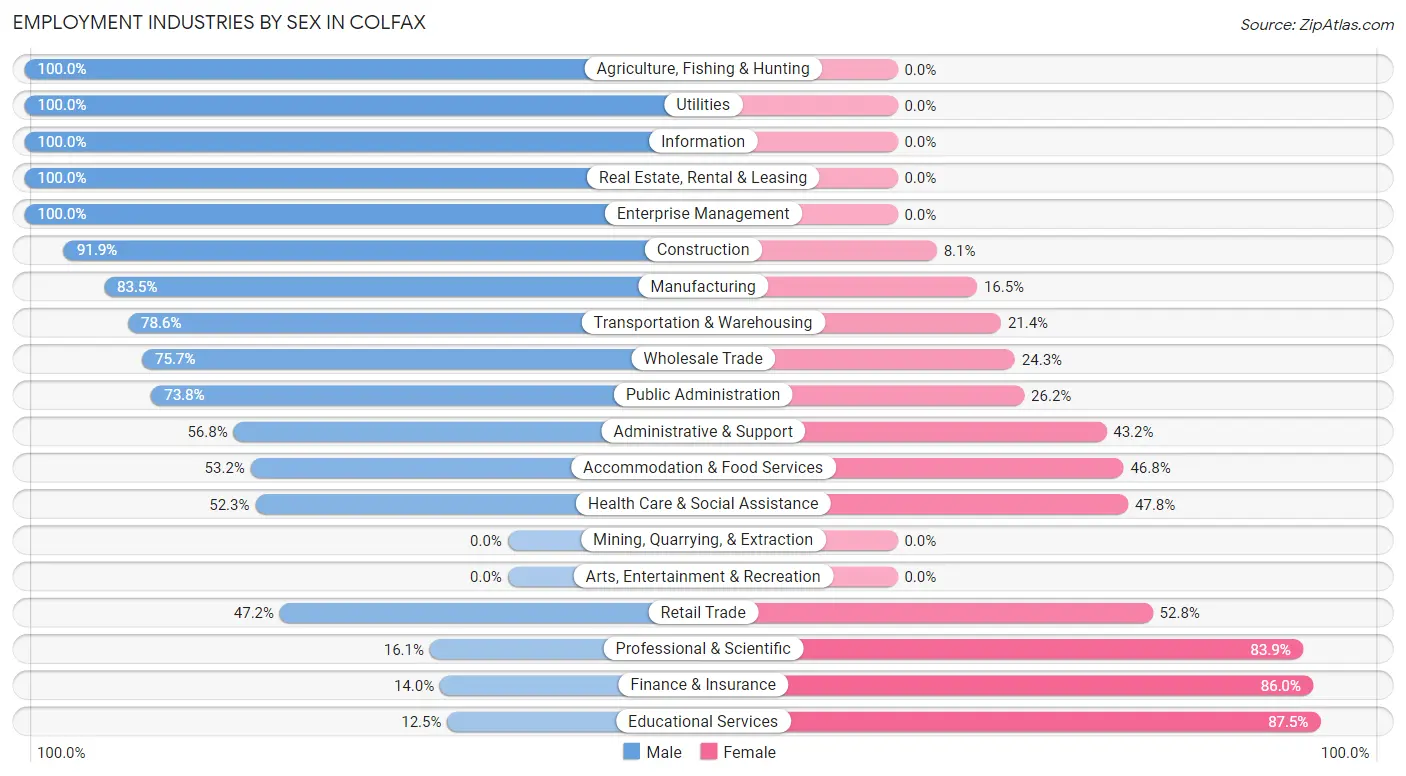
Employment Industries by Sex in Colfax
The Colfax industries that see more men than women are Agriculture, Fishing & Hunting (100.0%), Utilities (100.0%), and Information (100.0%), whereas the industries that tend to have a higher number of women are Educational Services (87.5%), Finance & Insurance (86.0%), and Professional & Scientific (83.9%).
| Industry | Male | Female |
| Agriculture, Fishing & Hunting | 13 (100.0%) | 0 (0.0%) |
| Mining, Quarrying, & Extraction | 0 (0.0%) | 0 (0.0%) |
| Construction | 79 (91.9%) | 7 (8.1%) |
| Manufacturing | 66 (83.5%) | 13 (16.5%) |
| Wholesale Trade | 28 (75.7%) | 9 (24.3%) |
| Retail Trade | 50 (47.2%) | 56 (52.8%) |
| Transportation & Warehousing | 22 (78.6%) | 6 (21.4%) |
| Utilities | 4 (100.0%) | 0 (0.0%) |
| Information | 21 (100.0%) | 0 (0.0%) |
| Finance & Insurance | 15 (14.0%) | 92 (86.0%) |
| Real Estate, Rental & Leasing | 15 (100.0%) | 0 (0.0%) |
| Professional & Scientific | 5 (16.1%) | 26 (83.9%) |
| Enterprise Management | 8 (100.0%) | 0 (0.0%) |
| Administrative & Support | 42 (56.8%) | 32 (43.2%) |
| Educational Services | 10 (12.5%) | 70 (87.5%) |
| Health Care & Social Assistance | 58 (52.2%) | 53 (47.7%) |
| Arts, Entertainment & Recreation | 0 (0.0%) | 0 (0.0%) |
| Accommodation & Food Services | 58 (53.2%) | 51 (46.8%) |
| Public Administration | 90 (73.8%) | 32 (26.2%) |
| Total | 612 (57.8%) | 447 (42.2%) |
Education in Colfax
School Enrollment in Colfax
The most common levels of schooling among the 587 students in Colfax are high school (205 | 34.9%), middle school (128 | 21.8%), and elementary school (120 | 20.4%).
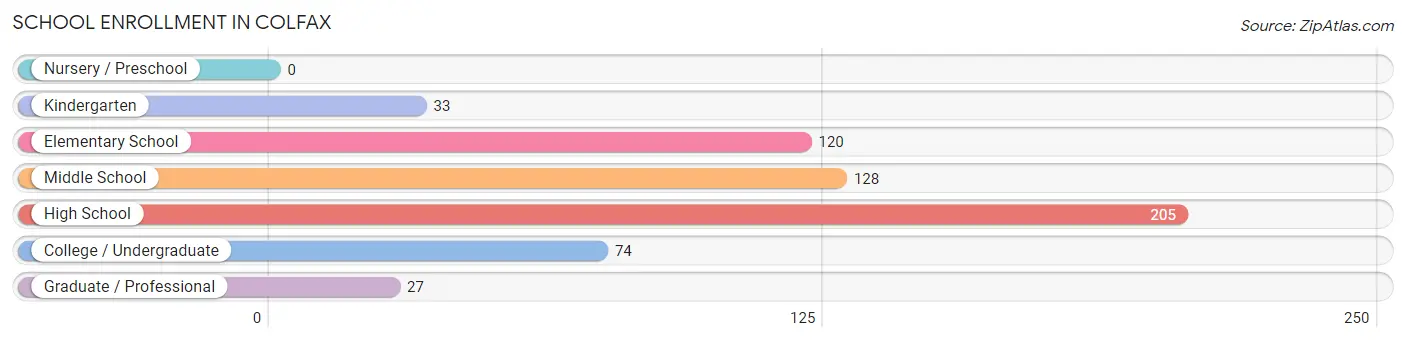
| School Level | # Students | % Students |
| Nursery / Preschool | 0 | 0.0% |
| Kindergarten | 33 | 5.6% |
| Elementary School | 120 | 20.4% |
| Middle School | 128 | 21.8% |
| High School | 205 | 34.9% |
| College / Undergraduate | 74 | 12.6% |
| Graduate / Professional | 27 | 4.6% |
| Total | 587 | 100.0% |
School Enrollment by Age by Funding Source in Colfax
Out of a total of 587 students who are enrolled in schools in Colfax, 53 (9.0%) attend a private institution, while the remaining 534 (91.0%) are enrolled in public schools. The age group of 25 to 34 year olds has the highest likelihood of being enrolled in private schools, with 6 (26.1% in the age bracket) enrolled. Conversely, the age group of 15 to 17 year olds has the lowest likelihood of being enrolled in a private school, with 147 (100.0% in the age bracket) attending a public institution.
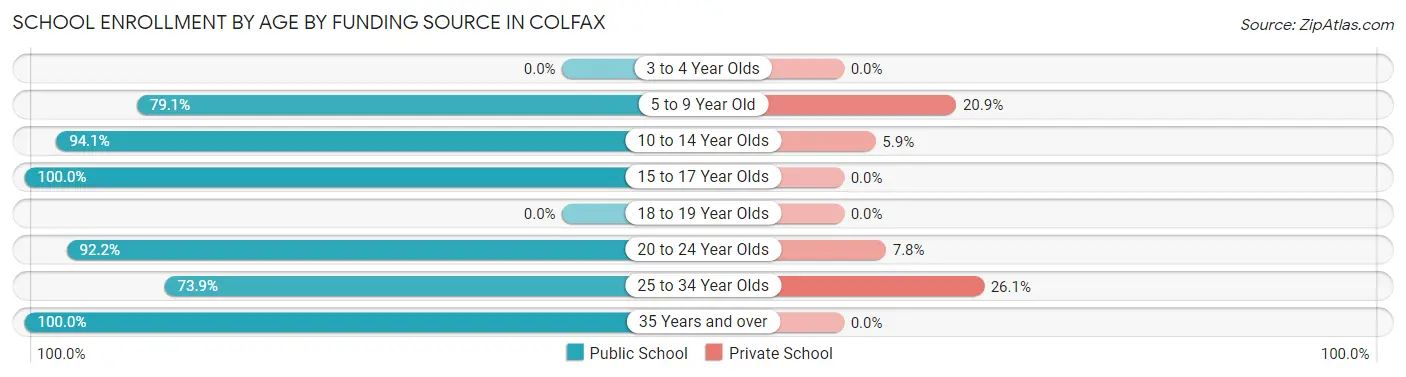
| Age Bracket | Public School | Private School |
| 3 to 4 Year Olds | 0 (0.0%) | 0 (0.0%) |
| 5 to 9 Year Old | 121 (79.1%) | 32 (20.9%) |
| 10 to 14 Year Olds | 175 (94.1%) | 11 (5.9%) |
| 15 to 17 Year Olds | 147 (100.0%) | 0 (0.0%) |
| 18 to 19 Year Olds | 0 (0.0%) | 0 (0.0%) |
| 20 to 24 Year Olds | 47 (92.2%) | 4 (7.8%) |
| 25 to 34 Year Olds | 17 (73.9%) | 6 (26.1%) |
| 35 Years and over | 27 (100.0%) | 0 (0.0%) |
| Total | 534 (91.0%) | 53 (9.0%) |
Educational Attainment by Field of Study in Colfax
Business (73 | 19.5%), literature & languages (62 | 16.6%), social sciences (42 | 11.2%), physical & health sciences (41 | 11.0%), and arts & humanities (35 | 9.4%) are the most common fields of study among 374 individuals in Colfax who have obtained a bachelor's degree or higher.
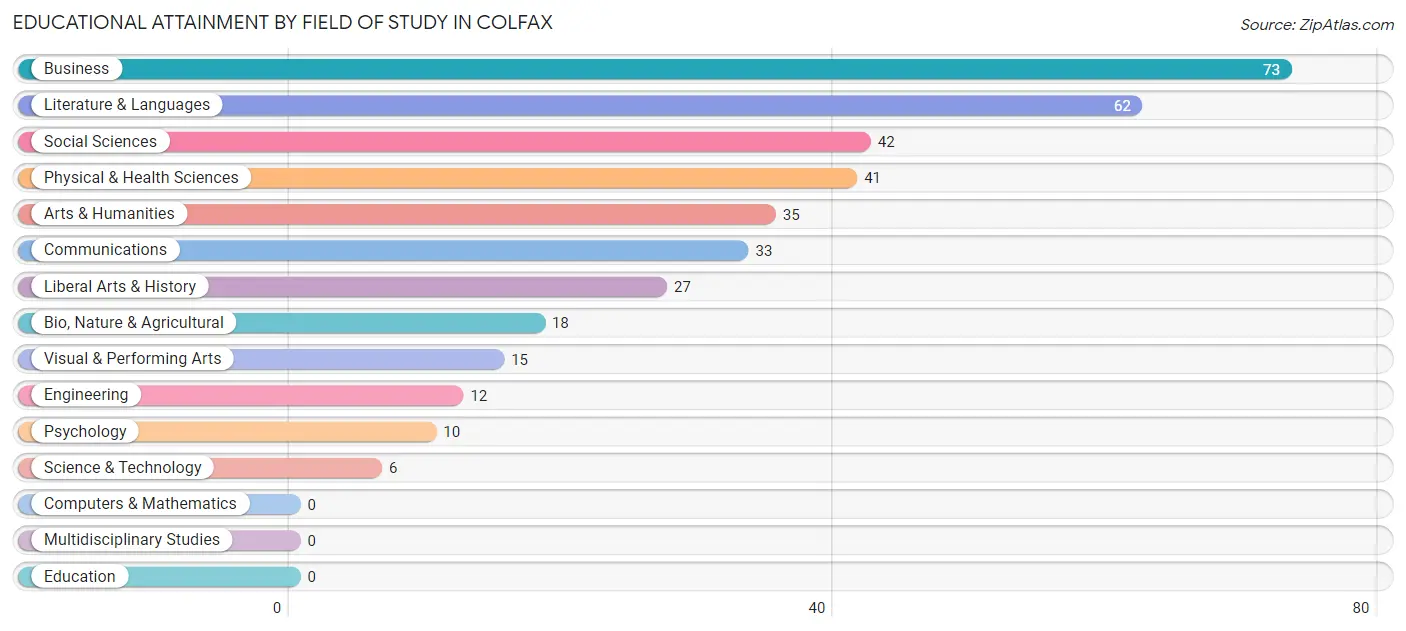
| Field of Study | # Graduates | % Graduates |
| Computers & Mathematics | 0 | 0.0% |
| Bio, Nature & Agricultural | 18 | 4.8% |
| Physical & Health Sciences | 41 | 11.0% |
| Psychology | 10 | 2.7% |
| Social Sciences | 42 | 11.2% |
| Engineering | 12 | 3.2% |
| Multidisciplinary Studies | 0 | 0.0% |
| Science & Technology | 6 | 1.6% |
| Business | 73 | 19.5% |
| Education | 0 | 0.0% |
| Literature & Languages | 62 | 16.6% |
| Liberal Arts & History | 27 | 7.2% |
| Visual & Performing Arts | 15 | 4.0% |
| Communications | 33 | 8.8% |
| Arts & Humanities | 35 | 9.4% |
| Total | 374 | 100.0% |
Transportation & Commute in Colfax
Vehicle Availability by Sex in Colfax
The most prevalent vehicle ownership categories in Colfax are males with 2 vehicles (248, accounting for 40.7%) and females with 2 vehicles (190, making up 55.5%).
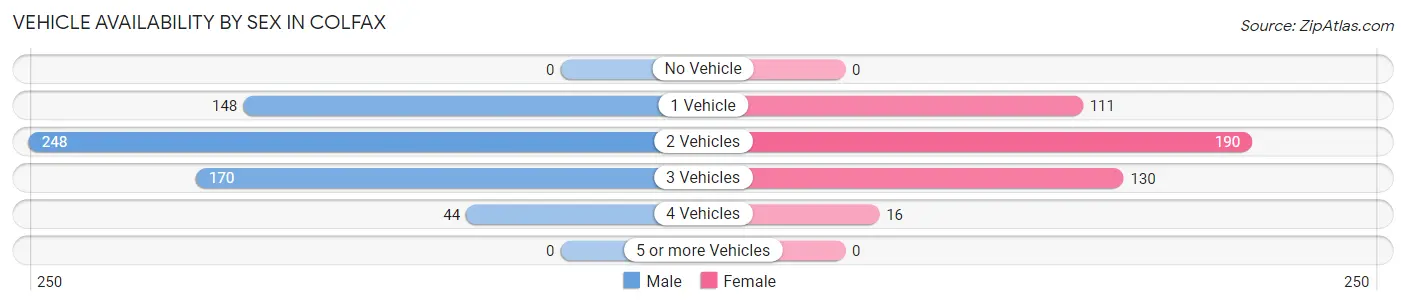
| Vehicles Available | Male | Female |
| No Vehicle | 0 (0.0%) | 0 (0.0%) |
| 1 Vehicle | 148 (24.3%) | 111 (24.8%) |
| 2 Vehicles | 248 (40.7%) | 190 (42.5%) |
| 3 Vehicles | 170 (27.9%) | 130 (29.1%) |
| 4 Vehicles | 44 (7.2%) | 16 (3.6%) |
| 5 or more Vehicles | 0 (0.0%) | 0 (0.0%) |
| Total | 610 (100.0%) | 447 (100.0%) |
Commute Time in Colfax
The most frequently occuring commute durations in Colfax are 5 to 9 minutes (180 commuters, 20.6%), 15 to 19 minutes (123 commuters, 14.1%), and 20 to 24 minutes (118 commuters, 13.5%).
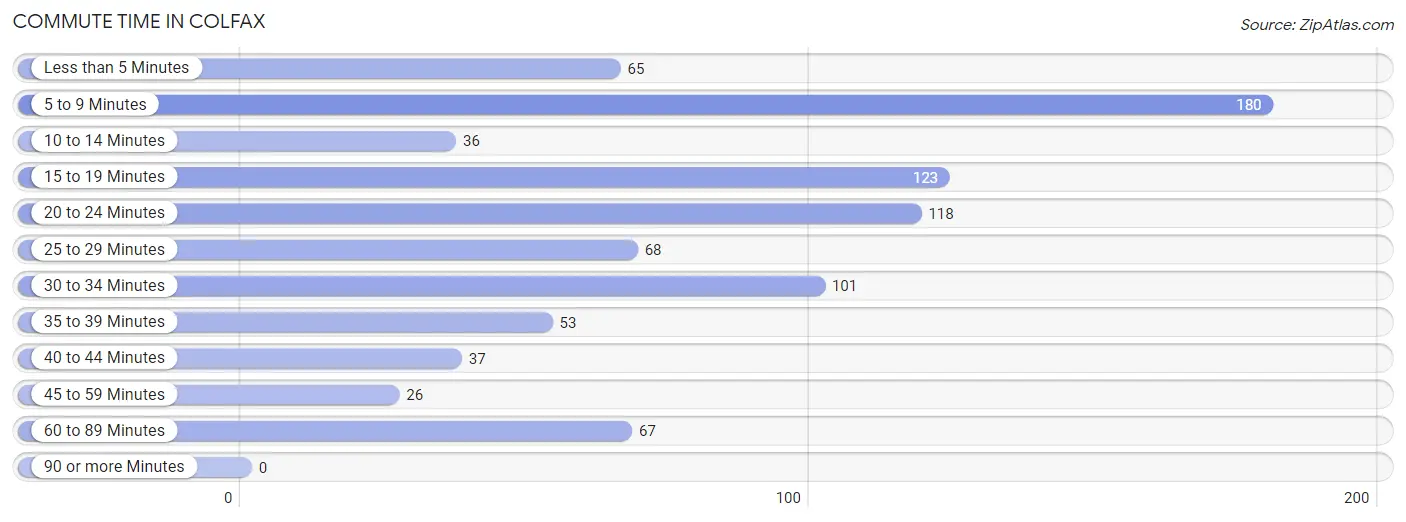
| Commute Time | # Commuters | % Commuters |
| Less than 5 Minutes | 65 | 7.4% |
| 5 to 9 Minutes | 180 | 20.6% |
| 10 to 14 Minutes | 36 | 4.1% |
| 15 to 19 Minutes | 123 | 14.1% |
| 20 to 24 Minutes | 118 | 13.5% |
| 25 to 29 Minutes | 68 | 7.8% |
| 30 to 34 Minutes | 101 | 11.6% |
| 35 to 39 Minutes | 53 | 6.1% |
| 40 to 44 Minutes | 37 | 4.2% |
| 45 to 59 Minutes | 26 | 3.0% |
| 60 to 89 Minutes | 67 | 7.7% |
| 90 or more Minutes | 0 | 0.0% |
Commute Time by Sex in Colfax
The most common commute times in Colfax are 5 to 9 minutes (134 commuters, 26.2%) for males and 20 to 24 minutes (67 commuters, 18.5%) for females.
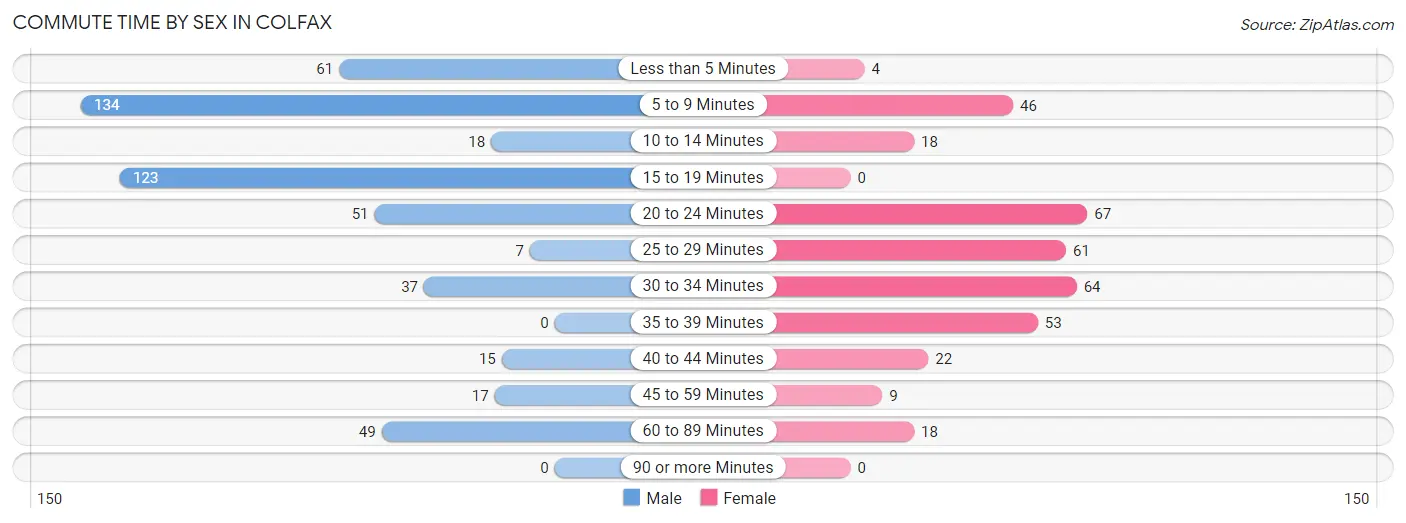
| Commute Time | Male | Female |
| Less than 5 Minutes | 61 (11.9%) | 4 (1.1%) |
| 5 to 9 Minutes | 134 (26.2%) | 46 (12.7%) |
| 10 to 14 Minutes | 18 (3.5%) | 18 (5.0%) |
| 15 to 19 Minutes | 123 (24.0%) | 0 (0.0%) |
| 20 to 24 Minutes | 51 (10.0%) | 67 (18.5%) |
| 25 to 29 Minutes | 7 (1.4%) | 61 (16.9%) |
| 30 to 34 Minutes | 37 (7.2%) | 64 (17.7%) |
| 35 to 39 Minutes | 0 (0.0%) | 53 (14.6%) |
| 40 to 44 Minutes | 15 (2.9%) | 22 (6.1%) |
| 45 to 59 Minutes | 17 (3.3%) | 9 (2.5%) |
| 60 to 89 Minutes | 49 (9.6%) | 18 (5.0%) |
| 90 or more Minutes | 0 (0.0%) | 0 (0.0%) |
Time of Departure to Work by Sex in Colfax
The most frequent times of departure to work in Colfax are 7:00 AM to 7:29 AM (89, 17.4%) for males and 7:00 AM to 7:29 AM (100, 27.6%) for females.
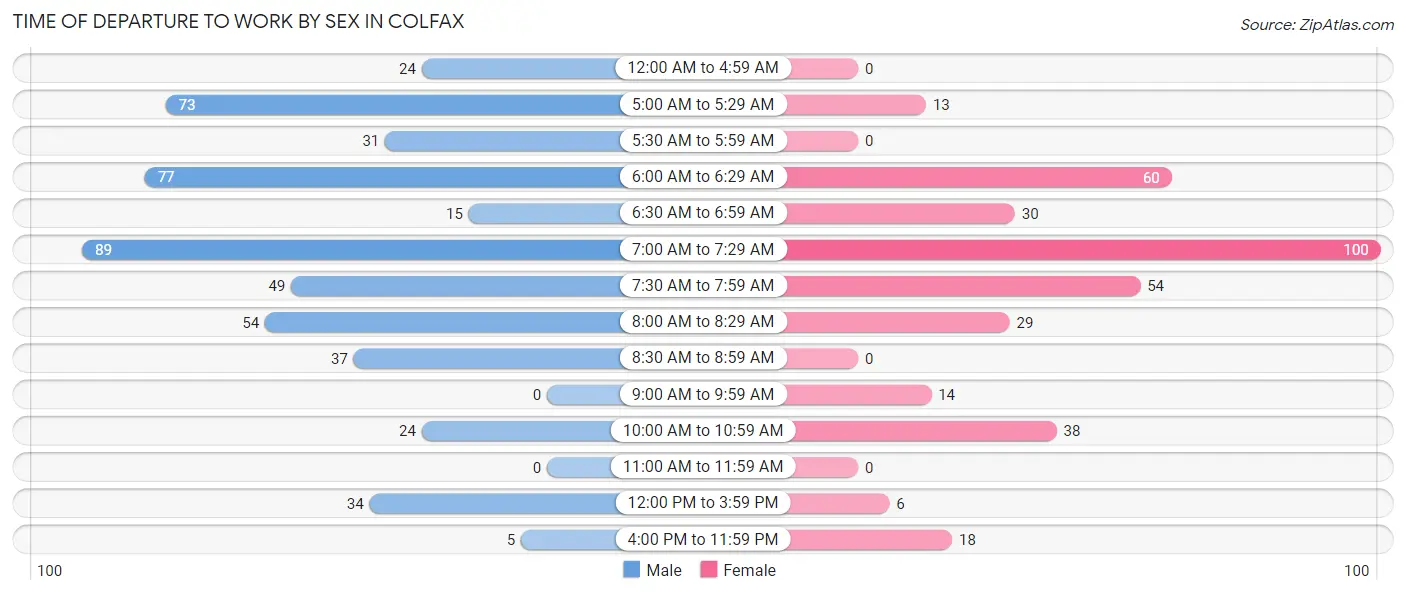
| Time of Departure | Male | Female |
| 12:00 AM to 4:59 AM | 24 (4.7%) | 0 (0.0%) |
| 5:00 AM to 5:29 AM | 73 (14.3%) | 13 (3.6%) |
| 5:30 AM to 5:59 AM | 31 (6.0%) | 0 (0.0%) |
| 6:00 AM to 6:29 AM | 77 (15.0%) | 60 (16.6%) |
| 6:30 AM to 6:59 AM | 15 (2.9%) | 30 (8.3%) |
| 7:00 AM to 7:29 AM | 89 (17.4%) | 100 (27.6%) |
| 7:30 AM to 7:59 AM | 49 (9.6%) | 54 (14.9%) |
| 8:00 AM to 8:29 AM | 54 (10.5%) | 29 (8.0%) |
| 8:30 AM to 8:59 AM | 37 (7.2%) | 0 (0.0%) |
| 9:00 AM to 9:59 AM | 0 (0.0%) | 14 (3.9%) |
| 10:00 AM to 10:59 AM | 24 (4.7%) | 38 (10.5%) |
| 11:00 AM to 11:59 AM | 0 (0.0%) | 0 (0.0%) |
| 12:00 PM to 3:59 PM | 34 (6.6%) | 6 (1.7%) |
| 4:00 PM to 11:59 PM | 5 (1.0%) | 18 (5.0%) |
| Total | 512 (100.0%) | 362 (100.0%) |
Housing Occupancy in Colfax
Occupancy by Ownership in Colfax
Of the total 909 dwellings in Colfax, owner-occupied units account for 444 (48.8%), while renter-occupied units make up 465 (51.2%).
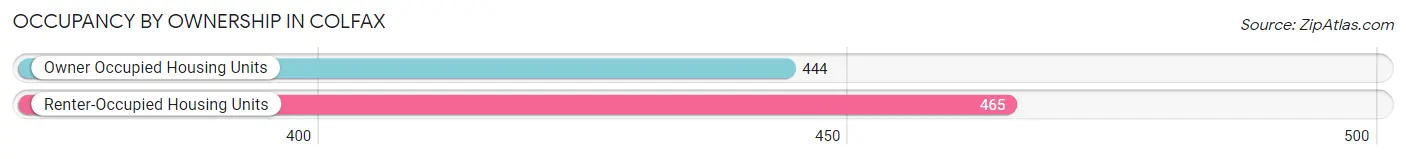
| Occupancy | # Housing Units | % Housing Units |
| Owner Occupied Housing Units | 444 | 48.8% |
| Renter-Occupied Housing Units | 465 | 51.2% |
| Total Occupied Housing Units | 909 | 100.0% |
Occupancy by Household Size in Colfax
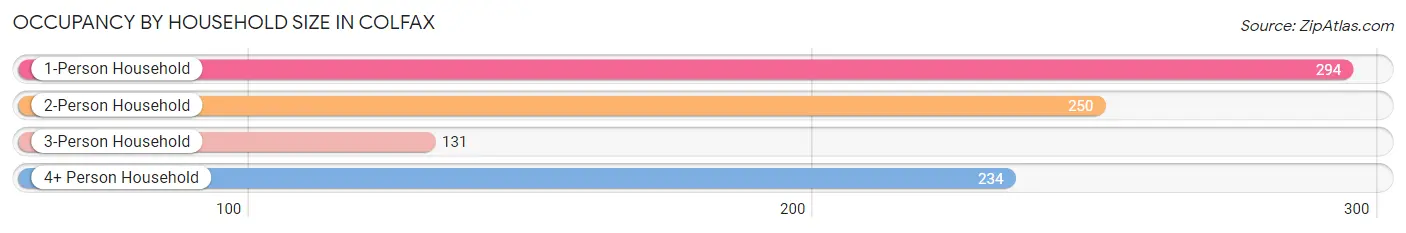
| Household Size | # Housing Units | % Housing Units |
| 1-Person Household | 294 | 32.3% |
| 2-Person Household | 250 | 27.5% |
| 3-Person Household | 131 | 14.4% |
| 4+ Person Household | 234 | 25.7% |
| Total Housing Units | 909 | 100.0% |
Occupancy by Ownership by Household Size in Colfax
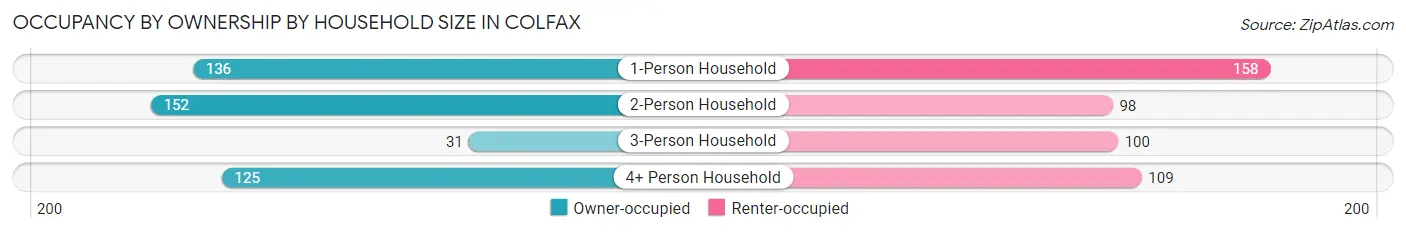
| Household Size | Owner-occupied | Renter-occupied |
| 1-Person Household | 136 (46.3%) | 158 (53.7%) |
| 2-Person Household | 152 (60.8%) | 98 (39.2%) |
| 3-Person Household | 31 (23.7%) | 100 (76.3%) |
| 4+ Person Household | 125 (53.4%) | 109 (46.6%) |
| Total Housing Units | 444 (48.8%) | 465 (51.2%) |
Occupancy by Educational Attainment in Colfax
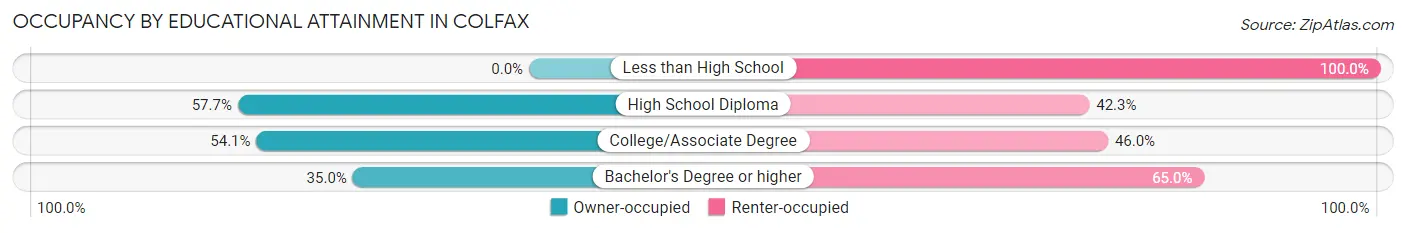
| Household Size | Owner-occupied | Renter-occupied |
| Less than High School | 0 (0.0%) | 17 (100.0%) |
| High School Diploma | 138 (57.7%) | 101 (42.3%) |
| College/Associate Degree | 220 (54.0%) | 187 (46.0%) |
| Bachelor's Degree or higher | 86 (35.0%) | 160 (65.0%) |
Occupancy by Age of Householder in Colfax
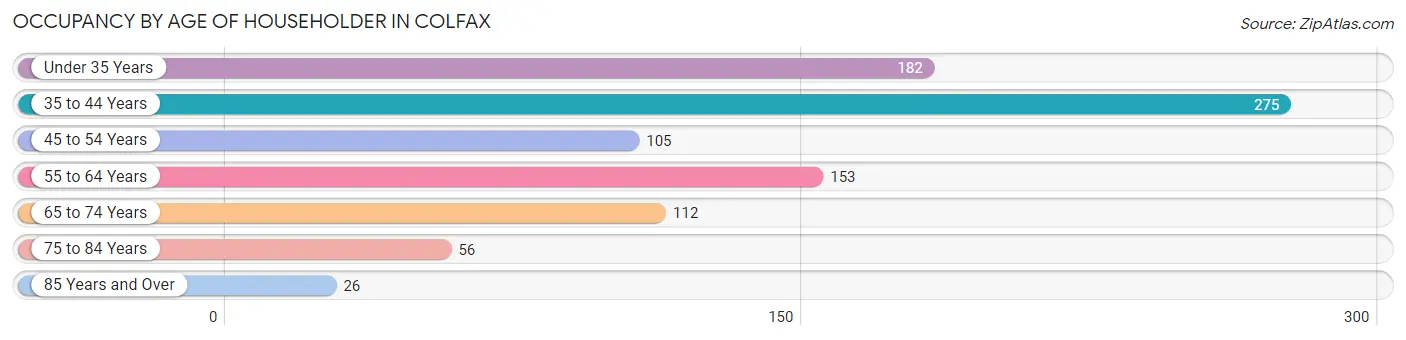
| Age Bracket | # Households | % Households |
| Under 35 Years | 182 | 20.0% |
| 35 to 44 Years | 275 | 30.2% |
| 45 to 54 Years | 105 | 11.6% |
| 55 to 64 Years | 153 | 16.8% |
| 65 to 74 Years | 112 | 12.3% |
| 75 to 84 Years | 56 | 6.2% |
| 85 Years and Over | 26 | 2.9% |
| Total | 909 | 100.0% |
Housing Finances in Colfax
Median Income by Occupancy in Colfax
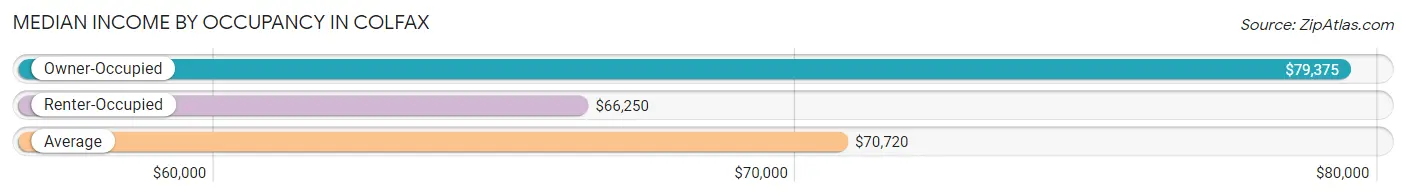
| Occupancy Type | # Households | Median Income |
| Owner-Occupied | 444 (48.8%) | $79,375 |
| Renter-Occupied | 465 (51.2%) | $66,250 |
| Average | 909 (100.0%) | $70,720 |
Occupancy by Householder Income Bracket in Colfax
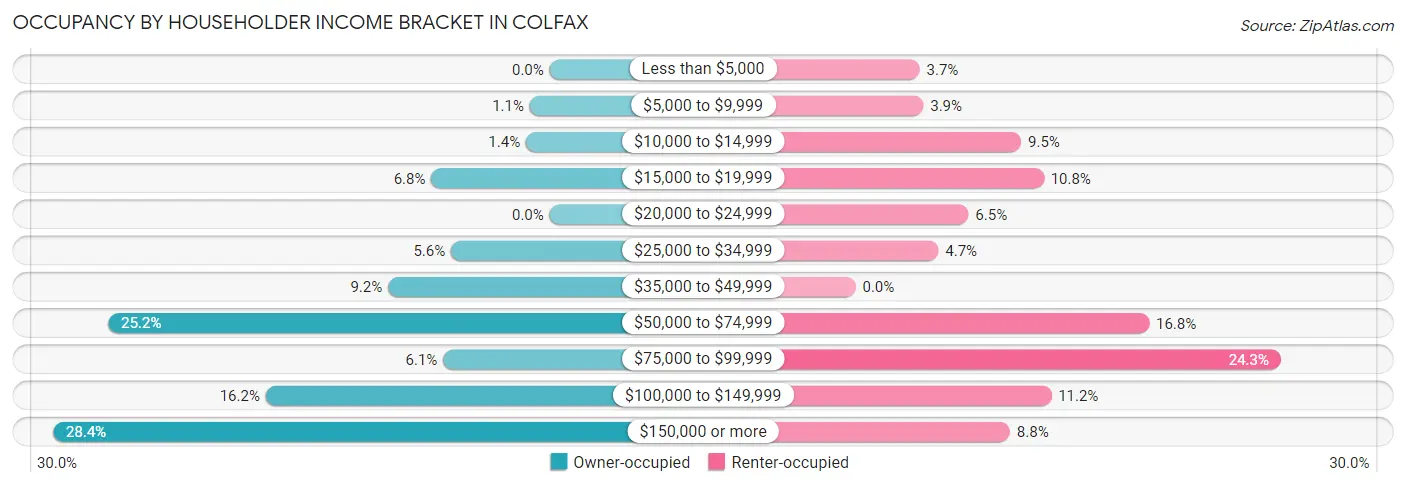
| Income Bracket | Owner-occupied | Renter-occupied |
| Less than $5,000 | 0 (0.0%) | 17 (3.7%) |
| $5,000 to $9,999 | 5 (1.1%) | 18 (3.9%) |
| $10,000 to $14,999 | 6 (1.3%) | 44 (9.5%) |
| $15,000 to $19,999 | 30 (6.8%) | 50 (10.7%) |
| $20,000 to $24,999 | 0 (0.0%) | 30 (6.5%) |
| $25,000 to $34,999 | 25 (5.6%) | 22 (4.7%) |
| $35,000 to $49,999 | 41 (9.2%) | 0 (0.0%) |
| $50,000 to $74,999 | 112 (25.2%) | 78 (16.8%) |
| $75,000 to $99,999 | 27 (6.1%) | 113 (24.3%) |
| $100,000 to $149,999 | 72 (16.2%) | 52 (11.2%) |
| $150,000 or more | 126 (28.4%) | 41 (8.8%) |
| Total | 444 (100.0%) | 465 (100.0%) |
Monthly Housing Cost Tiers in Colfax
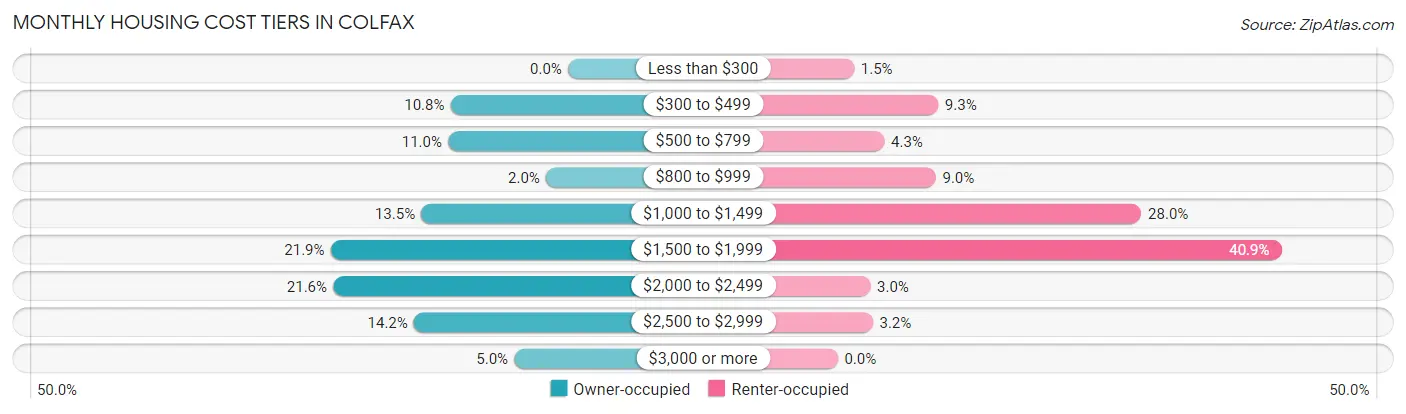
| Monthly Cost | Owner-occupied | Renter-occupied |
| Less than $300 | 0 (0.0%) | 7 (1.5%) |
| $300 to $499 | 48 (10.8%) | 43 (9.2%) |
| $500 to $799 | 49 (11.0%) | 20 (4.3%) |
| $800 to $999 | 9 (2.0%) | 42 (9.0%) |
| $1,000 to $1,499 | 60 (13.5%) | 130 (28.0%) |
| $1,500 to $1,999 | 97 (21.8%) | 190 (40.9%) |
| $2,000 to $2,499 | 96 (21.6%) | 14 (3.0%) |
| $2,500 to $2,999 | 63 (14.2%) | 15 (3.2%) |
| $3,000 or more | 22 (5.0%) | 0 (0.0%) |
| Total | 444 (100.0%) | 465 (100.0%) |
Physical Housing Characteristics in Colfax
Housing Structures in Colfax
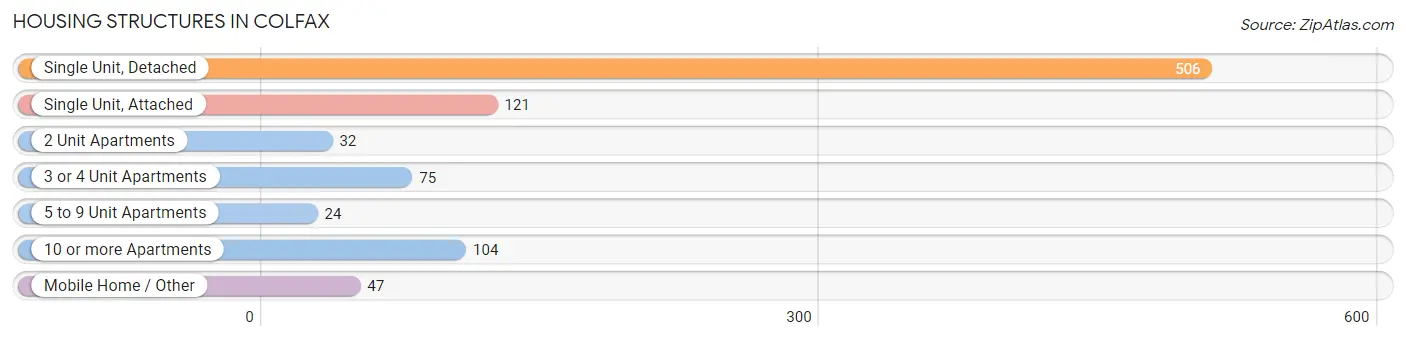
| Structure Type | # Housing Units | % Housing Units |
| Single Unit, Detached | 506 | 55.7% |
| Single Unit, Attached | 121 | 13.3% |
| 2 Unit Apartments | 32 | 3.5% |
| 3 or 4 Unit Apartments | 75 | 8.3% |
| 5 to 9 Unit Apartments | 24 | 2.6% |
| 10 or more Apartments | 104 | 11.4% |
| Mobile Home / Other | 47 | 5.2% |
| Total | 909 | 100.0% |
Housing Structures by Occupancy in Colfax
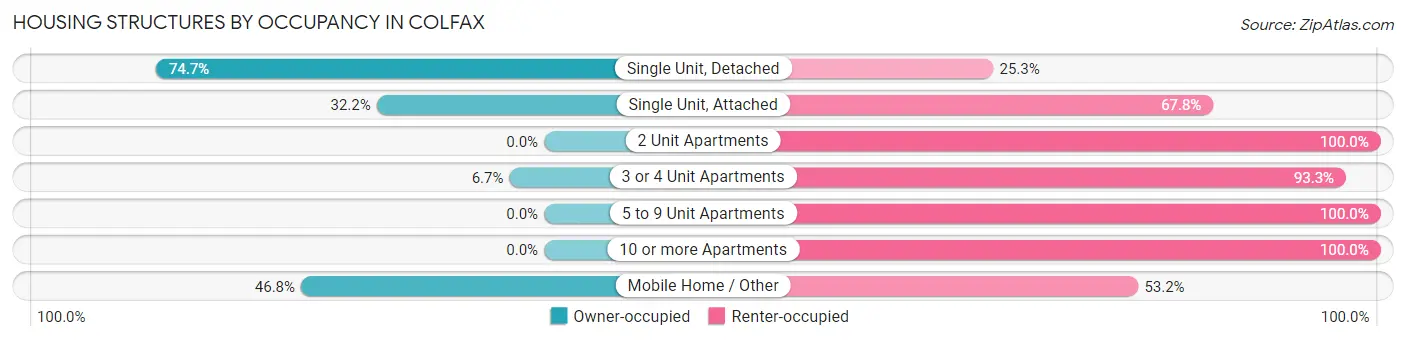
| Structure Type | Owner-occupied | Renter-occupied |
| Single Unit, Detached | 378 (74.7%) | 128 (25.3%) |
| Single Unit, Attached | 39 (32.2%) | 82 (67.8%) |
| 2 Unit Apartments | 0 (0.0%) | 32 (100.0%) |
| 3 or 4 Unit Apartments | 5 (6.7%) | 70 (93.3%) |
| 5 to 9 Unit Apartments | 0 (0.0%) | 24 (100.0%) |
| 10 or more Apartments | 0 (0.0%) | 104 (100.0%) |
| Mobile Home / Other | 22 (46.8%) | 25 (53.2%) |
| Total | 444 (48.8%) | 465 (51.2%) |
Housing Structures by Number of Rooms in Colfax
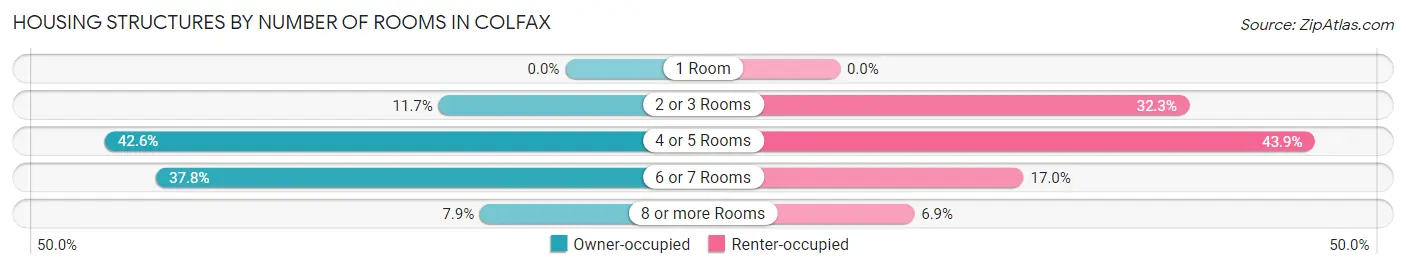
| Number of Rooms | Owner-occupied | Renter-occupied |
| 1 Room | 0 (0.0%) | 0 (0.0%) |
| 2 or 3 Rooms | 52 (11.7%) | 150 (32.3%) |
| 4 or 5 Rooms | 189 (42.6%) | 204 (43.9%) |
| 6 or 7 Rooms | 168 (37.8%) | 79 (17.0%) |
| 8 or more Rooms | 35 (7.9%) | 32 (6.9%) |
| Total | 444 (100.0%) | 465 (100.0%) |
Housing Structure by Heating Type in Colfax
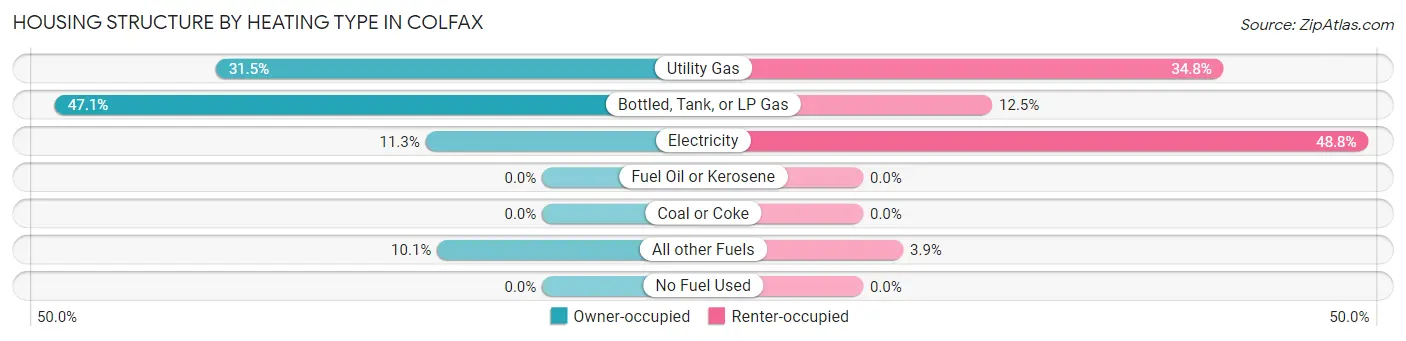
| Heating Type | Owner-occupied | Renter-occupied |
| Utility Gas | 140 (31.5%) | 162 (34.8%) |
| Bottled, Tank, or LP Gas | 209 (47.1%) | 58 (12.5%) |
| Electricity | 50 (11.3%) | 227 (48.8%) |
| Fuel Oil or Kerosene | 0 (0.0%) | 0 (0.0%) |
| Coal or Coke | 0 (0.0%) | 0 (0.0%) |
| All other Fuels | 45 (10.1%) | 18 (3.9%) |
| No Fuel Used | 0 (0.0%) | 0 (0.0%) |
| Total | 444 (100.0%) | 465 (100.0%) |
Household Vehicle Usage in Colfax
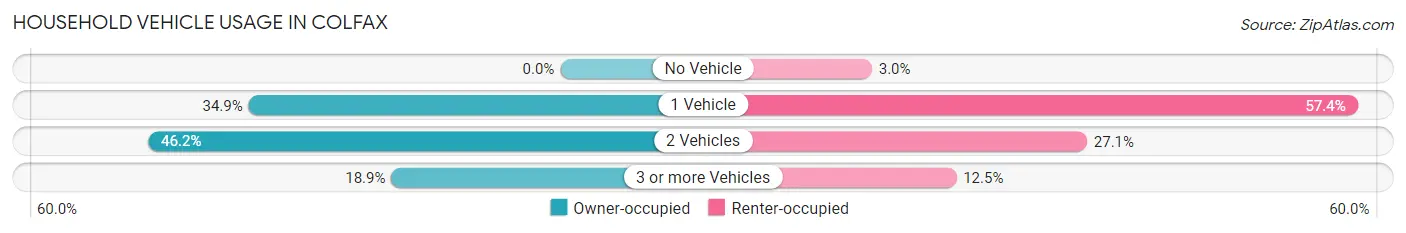
| Vehicles per Household | Owner-occupied | Renter-occupied |
| No Vehicle | 0 (0.0%) | 14 (3.0%) |
| 1 Vehicle | 155 (34.9%) | 267 (57.4%) |
| 2 Vehicles | 205 (46.2%) | 126 (27.1%) |
| 3 or more Vehicles | 84 (18.9%) | 58 (12.5%) |
| Total | 444 (100.0%) | 465 (100.0%) |
Real Estate & Mortgages in Colfax
Real Estate and Mortgage Overview in Colfax
| Characteristic | Without Mortgage | With Mortgage |
| Housing Units | 139 | 305 |
| Median Property Value | $318,800 | $359,900 |
| Median Household Income | $46,625 | $100 |
| Monthly Housing Costs | $638 | $22 |
| Real Estate Taxes | $2,093 | $0 |
Property Value by Mortgage Status in Colfax
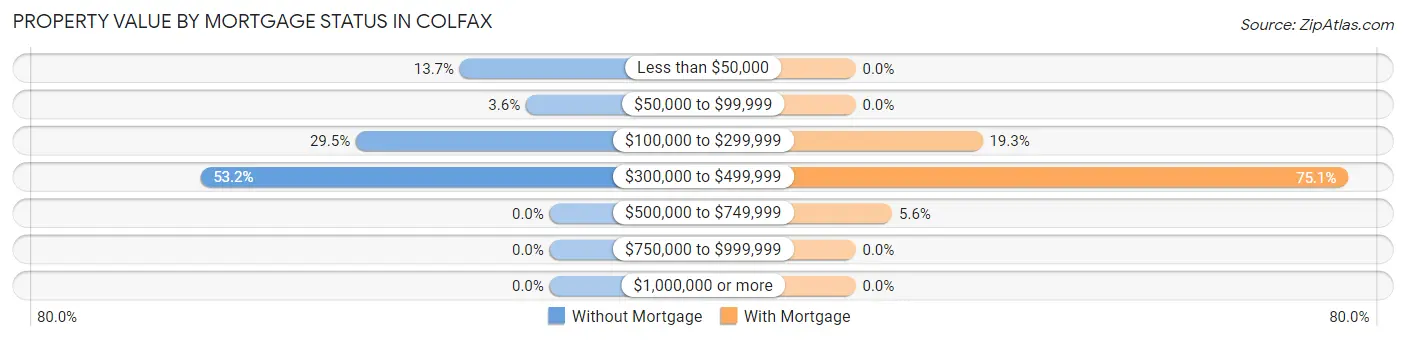
| Property Value | Without Mortgage | With Mortgage |
| Less than $50,000 | 19 (13.7%) | 0 (0.0%) |
| $50,000 to $99,999 | 5 (3.6%) | 0 (0.0%) |
| $100,000 to $299,999 | 41 (29.5%) | 59 (19.3%) |
| $300,000 to $499,999 | 74 (53.2%) | 229 (75.1%) |
| $500,000 to $749,999 | 0 (0.0%) | 17 (5.6%) |
| $750,000 to $999,999 | 0 (0.0%) | 0 (0.0%) |
| $1,000,000 or more | 0 (0.0%) | 0 (0.0%) |
| Total | 139 (100.0%) | 305 (100.0%) |
Household Income by Mortgage Status in Colfax
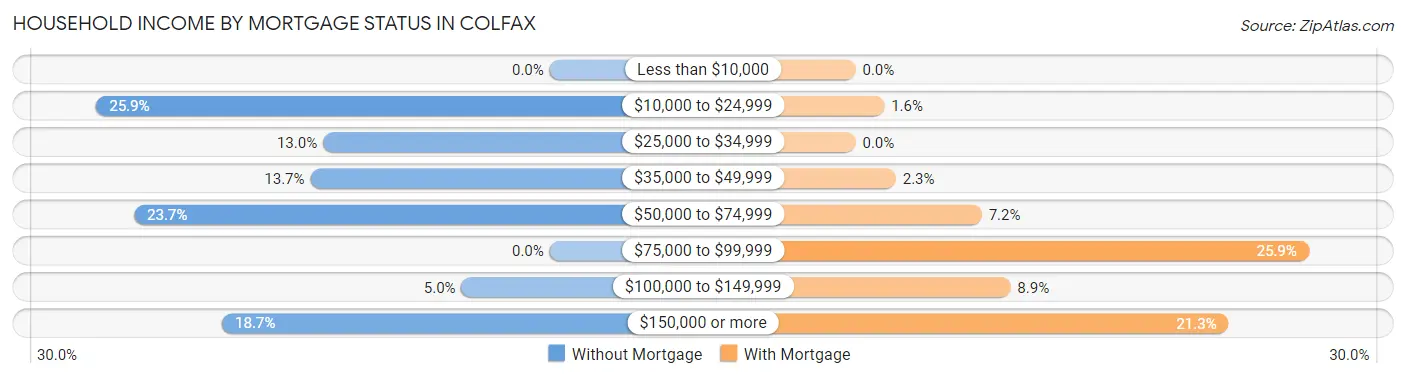
| Household Income | Without Mortgage | With Mortgage |
| Less than $10,000 | 0 (0.0%) | 0 (0.0%) |
| $10,000 to $24,999 | 36 (25.9%) | 5 (1.6%) |
| $25,000 to $34,999 | 18 (13.0%) | 0 (0.0%) |
| $35,000 to $49,999 | 19 (13.7%) | 7 (2.3%) |
| $50,000 to $74,999 | 33 (23.7%) | 22 (7.2%) |
| $75,000 to $99,999 | 0 (0.0%) | 79 (25.9%) |
| $100,000 to $149,999 | 7 (5.0%) | 27 (8.8%) |
| $150,000 or more | 26 (18.7%) | 65 (21.3%) |
| Total | 139 (100.0%) | 305 (100.0%) |
Property Value to Household Income Ratio in Colfax
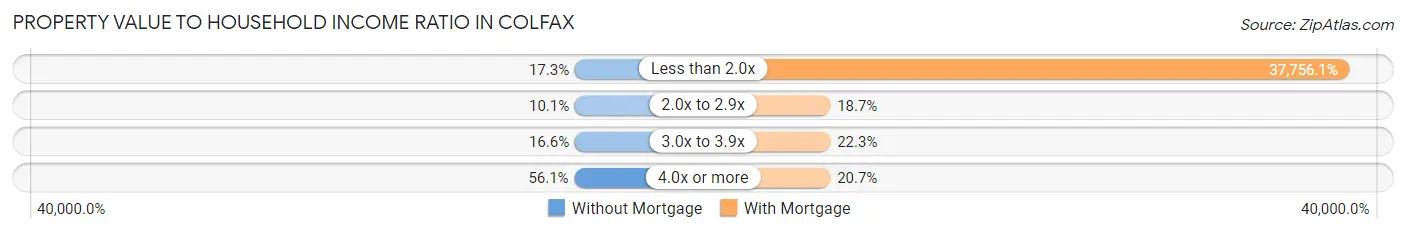
| Value-to-Income Ratio | Without Mortgage | With Mortgage |
| Less than 2.0x | 24 (17.3%) | 115,156 (37,756.1%) |
| 2.0x to 2.9x | 14 (10.1%) | 57 (18.7%) |
| 3.0x to 3.9x | 23 (16.6%) | 68 (22.3%) |
| 4.0x or more | 78 (56.1%) | 63 (20.7%) |
| Total | 139 (100.0%) | 305 (100.0%) |
Real Estate Taxes by Mortgage Status in Colfax
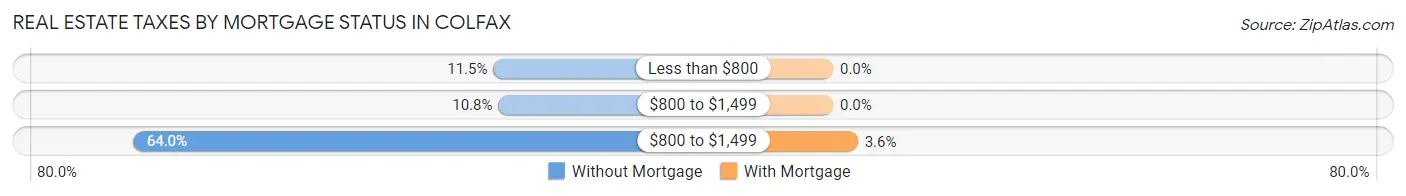
| Property Taxes | Without Mortgage | With Mortgage |
| Less than $800 | 16 (11.5%) | 0 (0.0%) |
| $800 to $1,499 | 15 (10.8%) | 0 (0.0%) |
| $800 to $1,499 | 89 (64.0%) | 11 (3.6%) |
| Total | 139 (100.0%) | 305 (100.0%) |
Health & Disability in Colfax
Health Insurance Coverage by Age in Colfax
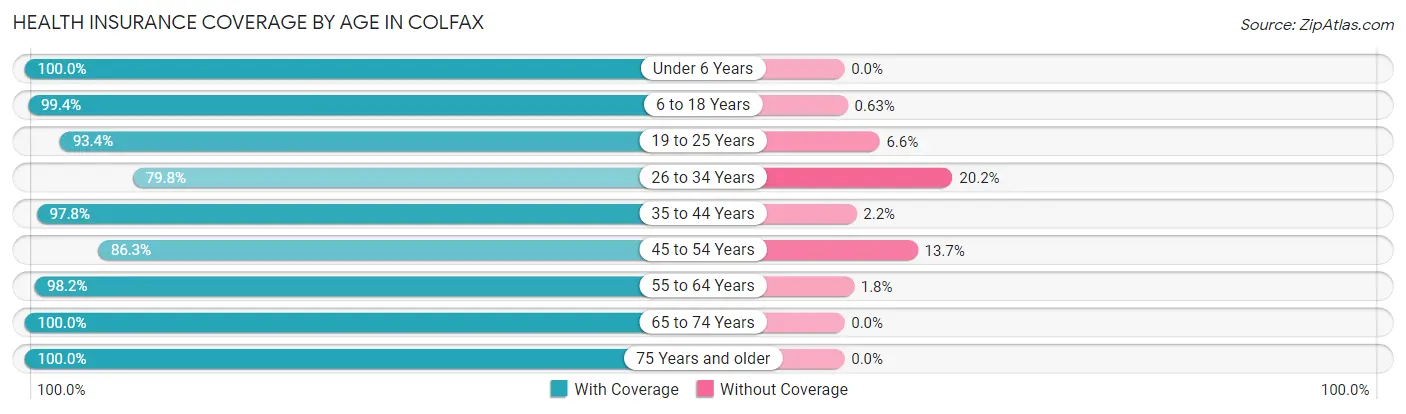
| Age Bracket | With Coverage | Without Coverage |
| Under 6 Years | 81 (100.0%) | 0 (0.0%) |
| 6 to 18 Years | 475 (99.4%) | 3 (0.6%) |
| 19 to 25 Years | 228 (93.4%) | 16 (6.6%) |
| 26 to 34 Years | 202 (79.8%) | 51 (20.2%) |
| 35 to 44 Years | 481 (97.8%) | 11 (2.2%) |
| 45 to 54 Years | 158 (86.3%) | 25 (13.7%) |
| 55 to 64 Years | 222 (98.2%) | 4 (1.8%) |
| 65 to 74 Years | 152 (100.0%) | 0 (0.0%) |
| 75 Years and older | 121 (100.0%) | 0 (0.0%) |
| Total | 2,120 (95.1%) | 110 (4.9%) |
Health Insurance Coverage by Citizenship Status in Colfax
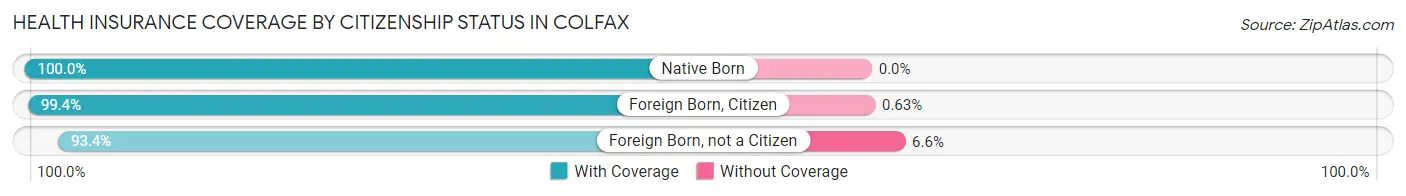
| Citizenship Status | With Coverage | Without Coverage |
| Native Born | 81 (100.0%) | 0 (0.0%) |
| Foreign Born, Citizen | 475 (99.4%) | 3 (0.6%) |
| Foreign Born, not a Citizen | 228 (93.4%) | 16 (6.6%) |
Health Insurance Coverage by Household Income in Colfax
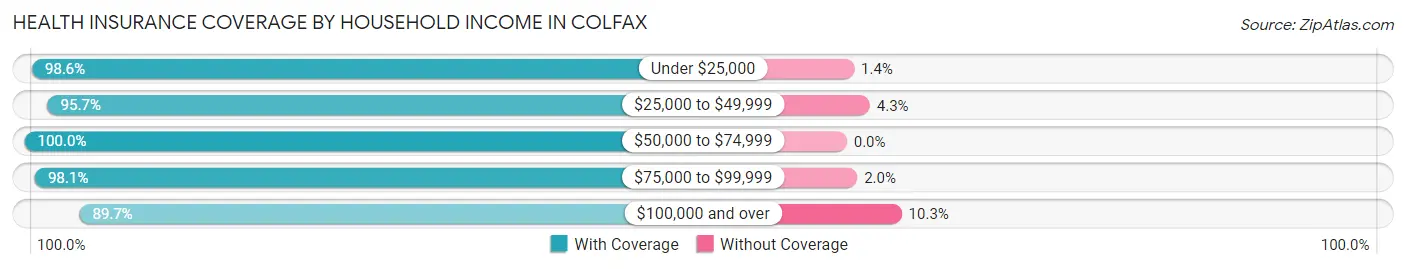
| Household Income | With Coverage | Without Coverage |
| Under $25,000 | 289 (98.6%) | 4 (1.4%) |
| $25,000 to $49,999 | 155 (95.7%) | 7 (4.3%) |
| $50,000 to $74,999 | 480 (100.0%) | 0 (0.0%) |
| $75,000 to $99,999 | 402 (98.1%) | 8 (1.9%) |
| $100,000 and over | 794 (89.7%) | 91 (10.3%) |
Public vs Private Health Insurance Coverage by Age in Colfax
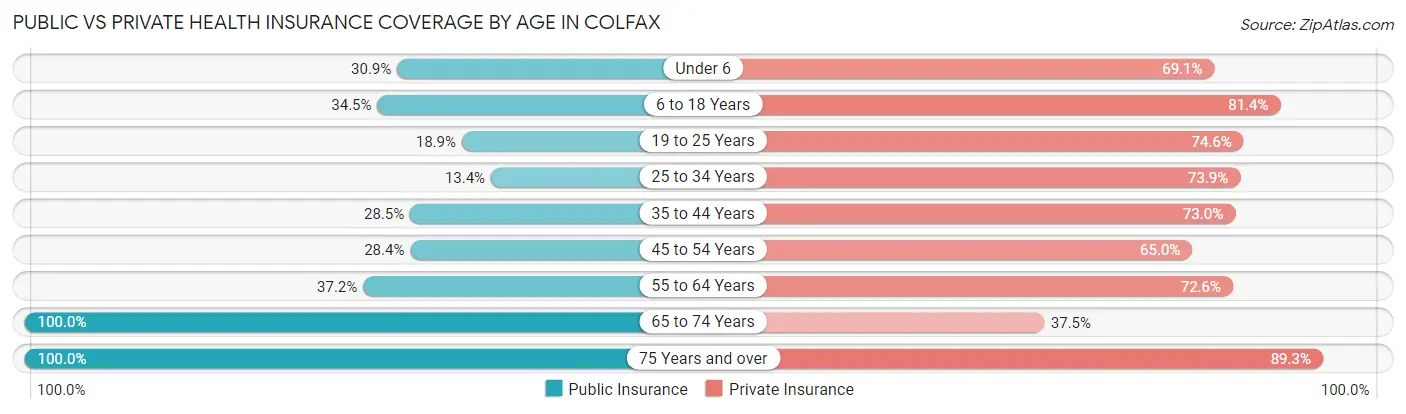
| Age Bracket | Public Insurance | Private Insurance |
| Under 6 | 25 (30.9%) | 56 (69.1%) |
| 6 to 18 Years | 165 (34.5%) | 389 (81.4%) |
| 19 to 25 Years | 46 (18.9%) | 182 (74.6%) |
| 25 to 34 Years | 34 (13.4%) | 187 (73.9%) |
| 35 to 44 Years | 140 (28.5%) | 359 (73.0%) |
| 45 to 54 Years | 52 (28.4%) | 119 (65.0%) |
| 55 to 64 Years | 84 (37.2%) | 164 (72.6%) |
| 65 to 74 Years | 152 (100.0%) | 57 (37.5%) |
| 75 Years and over | 121 (100.0%) | 108 (89.3%) |
| Total | 819 (36.7%) | 1,621 (72.7%) |
Disability Status by Sex by Age in Colfax
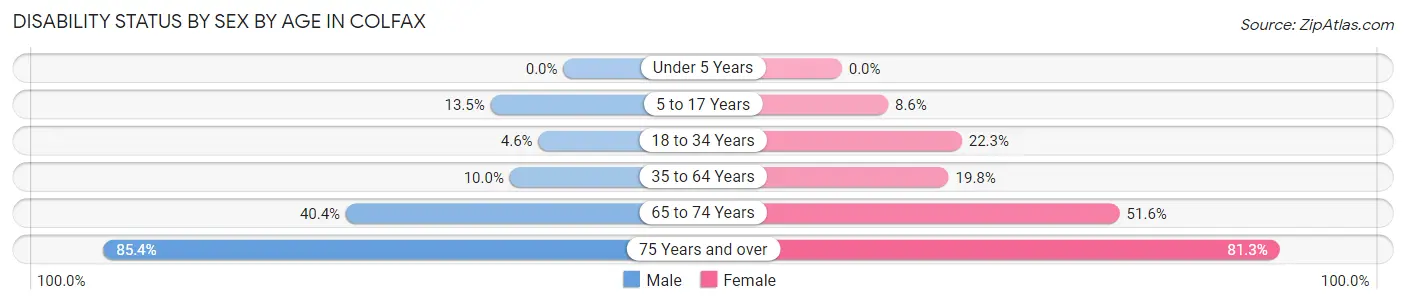
| Age Bracket | Male | Female |
| Under 5 Years | 0 (0.0%) | 0 (0.0%) |
| 5 to 17 Years | 35 (13.5%) | 20 (8.6%) |
| 18 to 34 Years | 13 (4.6%) | 51 (22.3%) |
| 35 to 64 Years | 42 (10.0%) | 95 (19.8%) |
| 65 to 74 Years | 23 (40.4%) | 49 (51.6%) |
| 75 Years and over | 35 (85.4%) | 65 (81.2%) |
Disability Class by Sex by Age in Colfax
Disability Class: Hearing Difficulty
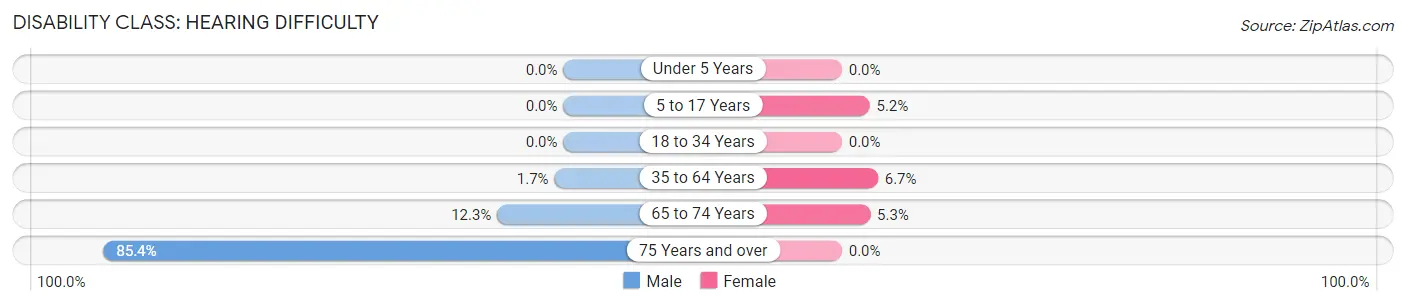
| Age Bracket | Male | Female |
| Under 5 Years | 0 (0.0%) | 0 (0.0%) |
| 5 to 17 Years | 0 (0.0%) | 12 (5.1%) |
| 18 to 34 Years | 0 (0.0%) | 0 (0.0%) |
| 35 to 64 Years | 7 (1.7%) | 32 (6.7%) |
| 65 to 74 Years | 7 (12.3%) | 5 (5.3%) |
| 75 Years and over | 35 (85.4%) | 0 (0.0%) |
Disability Class: Vision Difficulty
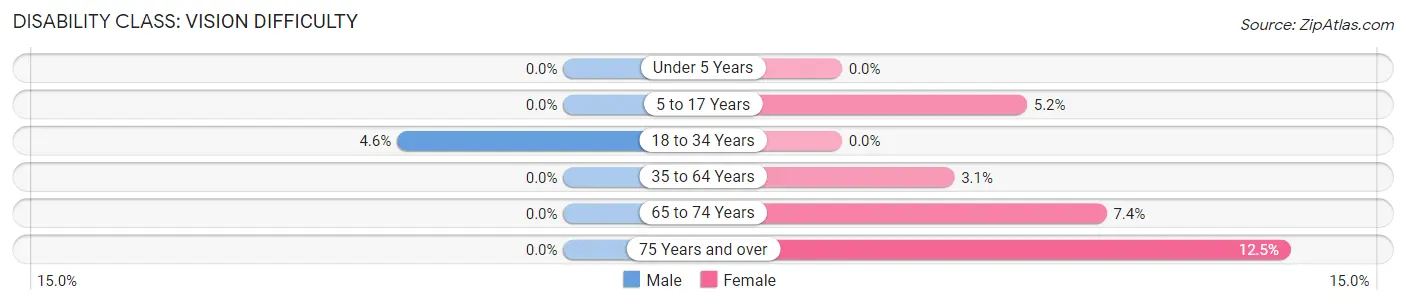
| Age Bracket | Male | Female |
| Under 5 Years | 0 (0.0%) | 0 (0.0%) |
| 5 to 17 Years | 0 (0.0%) | 12 (5.1%) |
| 18 to 34 Years | 13 (4.6%) | 0 (0.0%) |
| 35 to 64 Years | 0 (0.0%) | 15 (3.1%) |
| 65 to 74 Years | 0 (0.0%) | 7 (7.4%) |
| 75 Years and over | 0 (0.0%) | 10 (12.5%) |
Disability Class: Cognitive Difficulty
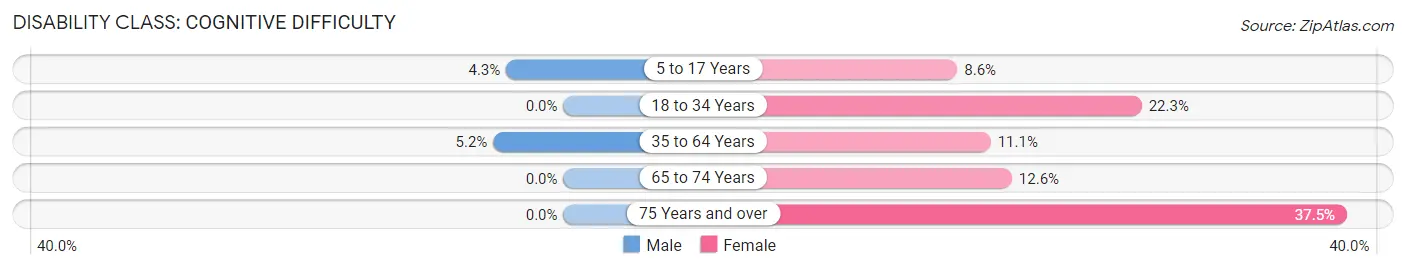
| Age Bracket | Male | Female |
| 5 to 17 Years | 11 (4.3%) | 20 (8.6%) |
| 18 to 34 Years | 0 (0.0%) | 51 (22.3%) |
| 35 to 64 Years | 22 (5.2%) | 53 (11.1%) |
| 65 to 74 Years | 0 (0.0%) | 12 (12.6%) |
| 75 Years and over | 0 (0.0%) | 30 (37.5%) |
Disability Class: Ambulatory Difficulty
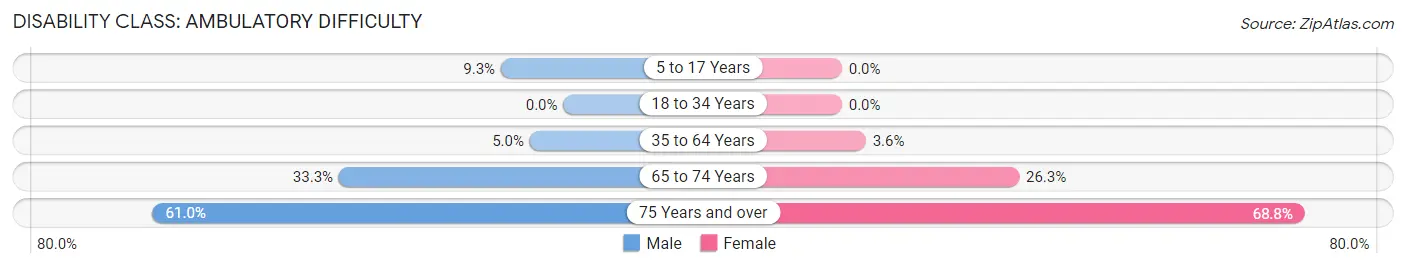
| Age Bracket | Male | Female |
| 5 to 17 Years | 24 (9.3%) | 0 (0.0%) |
| 18 to 34 Years | 0 (0.0%) | 0 (0.0%) |
| 35 to 64 Years | 21 (5.0%) | 17 (3.5%) |
| 65 to 74 Years | 19 (33.3%) | 25 (26.3%) |
| 75 Years and over | 25 (61.0%) | 55 (68.8%) |
Disability Class: Self-Care Difficulty
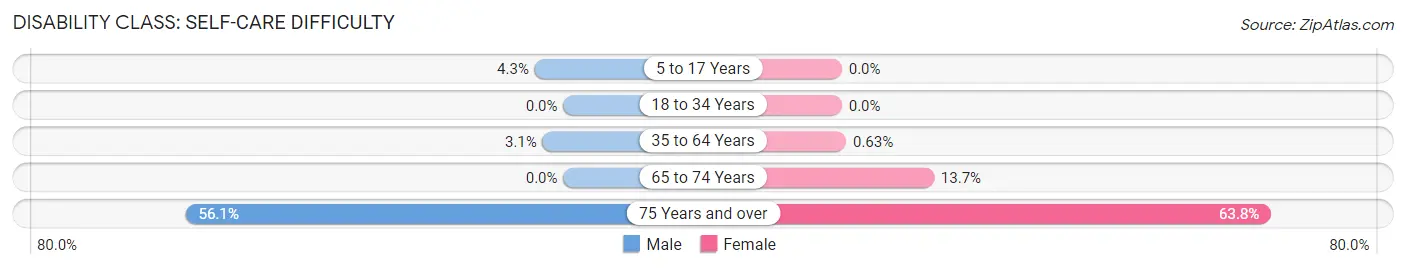
| Age Bracket | Male | Female |
| 5 to 17 Years | 11 (4.3%) | 0 (0.0%) |
| 18 to 34 Years | 0 (0.0%) | 0 (0.0%) |
| 35 to 64 Years | 13 (3.1%) | 3 (0.6%) |
| 65 to 74 Years | 0 (0.0%) | 13 (13.7%) |
| 75 Years and over | 23 (56.1%) | 51 (63.7%) |
Technology Access in Colfax
Computing Device Access in Colfax
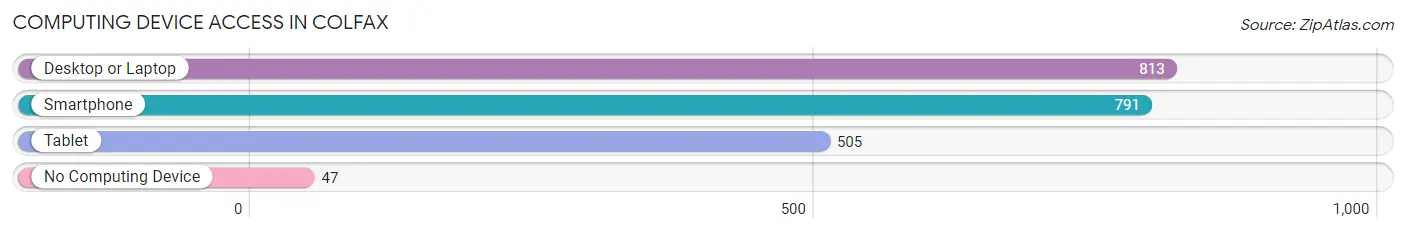
| Device Type | # Households | % Households |
| Desktop or Laptop | 813 | 89.4% |
| Smartphone | 791 | 87.0% |
| Tablet | 505 | 55.6% |
| No Computing Device | 47 | 5.2% |
| Total | 909 | 100.0% |
Internet Access in Colfax
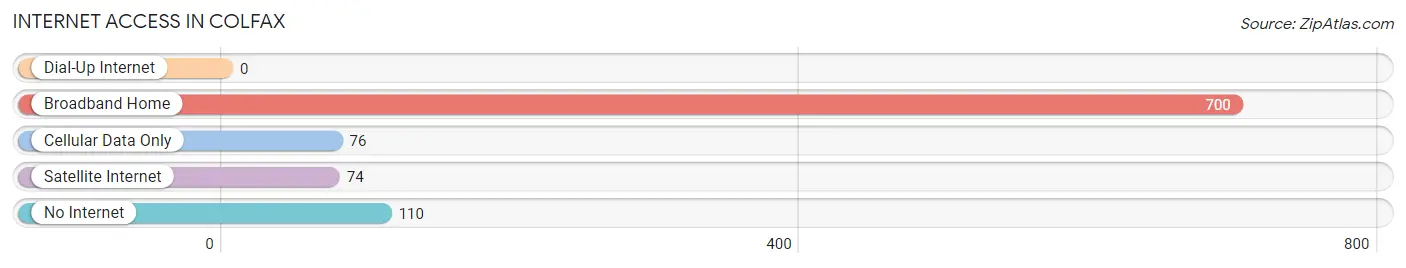
| Internet Type | # Households | % Households |
| Dial-Up Internet | 0 | 0.0% |
| Broadband Home | 700 | 77.0% |
| Cellular Data Only | 76 | 8.4% |
| Satellite Internet | 74 | 8.1% |
| No Internet | 110 | 12.1% |
| Total | 909 | 100.0% |
Colfax Summary
Colfax is a small town located in Placer County, California, United States. It is situated in the Sierra Nevada foothills, approximately 40 miles northeast of Sacramento. The population was 1,963 at the 2010 census.
History
Colfax was founded in 1852 by Dr. William Colfax, a physician from Indiana. He purchased a large tract of land in the area and established a stagecoach stop. The town was named after him.
In 1855, the Central Pacific Railroad arrived in Colfax, connecting the town to the rest of the state. This allowed for the growth of the town, as it became a popular stop for travelers.
In the late 19th century, Colfax was a popular destination for wealthy San Franciscans who wanted to escape the city and enjoy the rural atmosphere. The town was known for its mineral springs, which were believed to have healing properties.
In the early 20th century, Colfax was a popular destination for tourists. The town was home to several resorts, including the Colfax Hotel, which was built in 1906.
Geography
Colfax is located at 39°7′17″N 120°57′17″W (39.1214, -120.9547). It is situated in the Sierra Nevada foothills, at an elevation of 2,072 feet (631 m).
The town is located in the Bear River watershed, which is part of the larger Sacramento River watershed. The Bear River flows through the town, and is a tributary of the Feather River.
The town is surrounded by rolling hills and forests. The nearby Sierra Nevada mountains provide a scenic backdrop.
Economy
Colfax is a small town with a limited economy. The main industries in the area are tourism, agriculture, and light manufacturing.
The town is home to several small businesses, including restaurants, shops, and a movie theater. There are also several wineries in the area.
The town is also home to a small airport which is used for private and recreational flights
Demographics
As of the 2010 census, the population of Colfax was 1,963. The racial makeup of the town was 87.3% White, 0.7% African American, 0.7% Native American, 0.7% Asian, 0.2% Pacific Islander, 8.2% from other races, and 2.2% from two or more races. Hispanic or Latino of any race were 16.3% of the population.
The median household income in Colfax was $45,938, and the median family income was $50,938. The per capita income was $20,938. About 11.3% of families and 14.2% of the population were below the poverty line, including 19.2% of those under age 18 and 8.3% of those age 65 or over.
Common Questions
What is Per Capita Income in Colfax?
Per Capita income in Colfax is $38,262.
What is the Median Family Income in Colfax?
Median Family Income in Colfax is $88,646.
What is the Median Household income in Colfax?
Median Household Income in Colfax is $70,720.
What is Income or Wage Gap in Colfax?
Income or Wage Gap in Colfax is 33.8%.
Women in Colfax earn 66.2 cents for every dollar earned by a man.
What is Inequality or Gini Index in Colfax?
Inequality or Gini Index in Colfax is 0.44.
What is the Total Population of Colfax?
Total Population of Colfax is 2,230.
What is the Total Male Population of Colfax?
Total Male Population of Colfax is 1,099.
What is the Total Female Population of Colfax?
Total Female Population of Colfax is 1,131.
What is the Ratio of Males per 100 Females in Colfax?
There are 97.17 Males per 100 Females in Colfax.
What is the Ratio of Females per 100 Males in Colfax?
There are 102.91 Females per 100 Males in Colfax.
What is the Median Population Age in Colfax?
Median Population Age in Colfax is 35.8 Years.
What is the Average Family Size in Colfax
Average Family Size in Colfax is 3.2 People.
What is the Average Household Size in Colfax
Average Household Size in Colfax is 2.5 People.
How Large is the Labor Force in Colfax?
There are 1,146 People in the Labor Forcein in Colfax.
What is the Percentage of People in the Labor Force in Colfax?
65.4% of People are in the Labor Force in Colfax.
What is the Unemployment Rate in Colfax?
Unemployment Rate in Colfax is 7.7%.