Clyde, CA Map & Demographics
Clyde Map
Clyde Overview
$51,916
PER CAPITA INCOME
$94,792
AVG FAMILY INCOME
$73,910
AVG HOUSEHOLD INCOME
24.5%
WAGE / INCOME GAP [ % ]
75.5¢/ $1
WAGE / INCOME GAP [ $ ]
0.45
INEQUALITY / GINI INDEX
721
TOTAL POPULATION
346
MALE POPULATION
375
FEMALE POPULATION
92.27
MALES / 100 FEMALES
108.38
FEMALES / 100 MALES
51.2
MEDIAN AGE
2.7
AVG FAMILY SIZE
2.5
AVG HOUSEHOLD SIZE
393
LABOR FORCE [ PEOPLE ]
58.8%
PERCENT IN LABOR FORCE
5.6%
UNEMPLOYMENT RATE
Income in Clyde
Income Overview in Clyde
Per Capita Income in Clyde is $51,916, while median incomes of families and households are $94,792 and $73,910 respectively.
| Characteristic | Number | Measure |
| Per Capita Income | 721 | $51,916 |
| Median Family Income | 214 | $94,792 |
| Mean Family Income | 214 | $139,460 |
| Median Household Income | 288 | $73,910 |
| Mean Household Income | 288 | $123,980 |
| Income Deficit | 214 | $0 |
| Wage / Income Gap (%) | 721 | 24.46% |
| Wage / Income Gap ($) | 721 | 75.54¢ per $1 |
| Gini / Inequality Index | 721 | 0.45 |
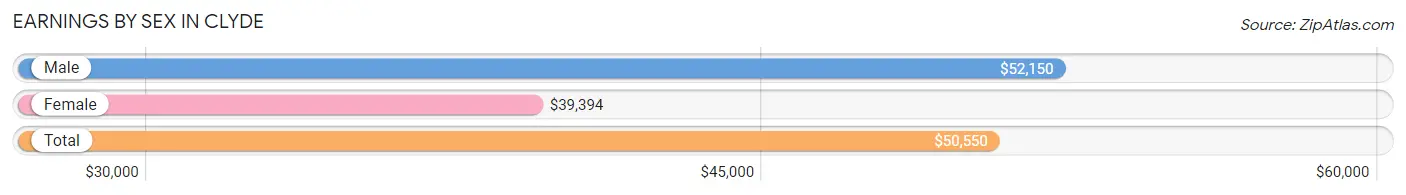
Earnings by Sex in Clyde
Average Earnings in Clyde are $50,550, $52,150 for men and $39,394 for women, a difference of 24.5%.
| Sex | Number | Average Earnings |
| Male | 181 (45.6%) | $52,150 |
| Female | 216 (54.4%) | $39,394 |
| Total | 397 (100.0%) | $50,550 |
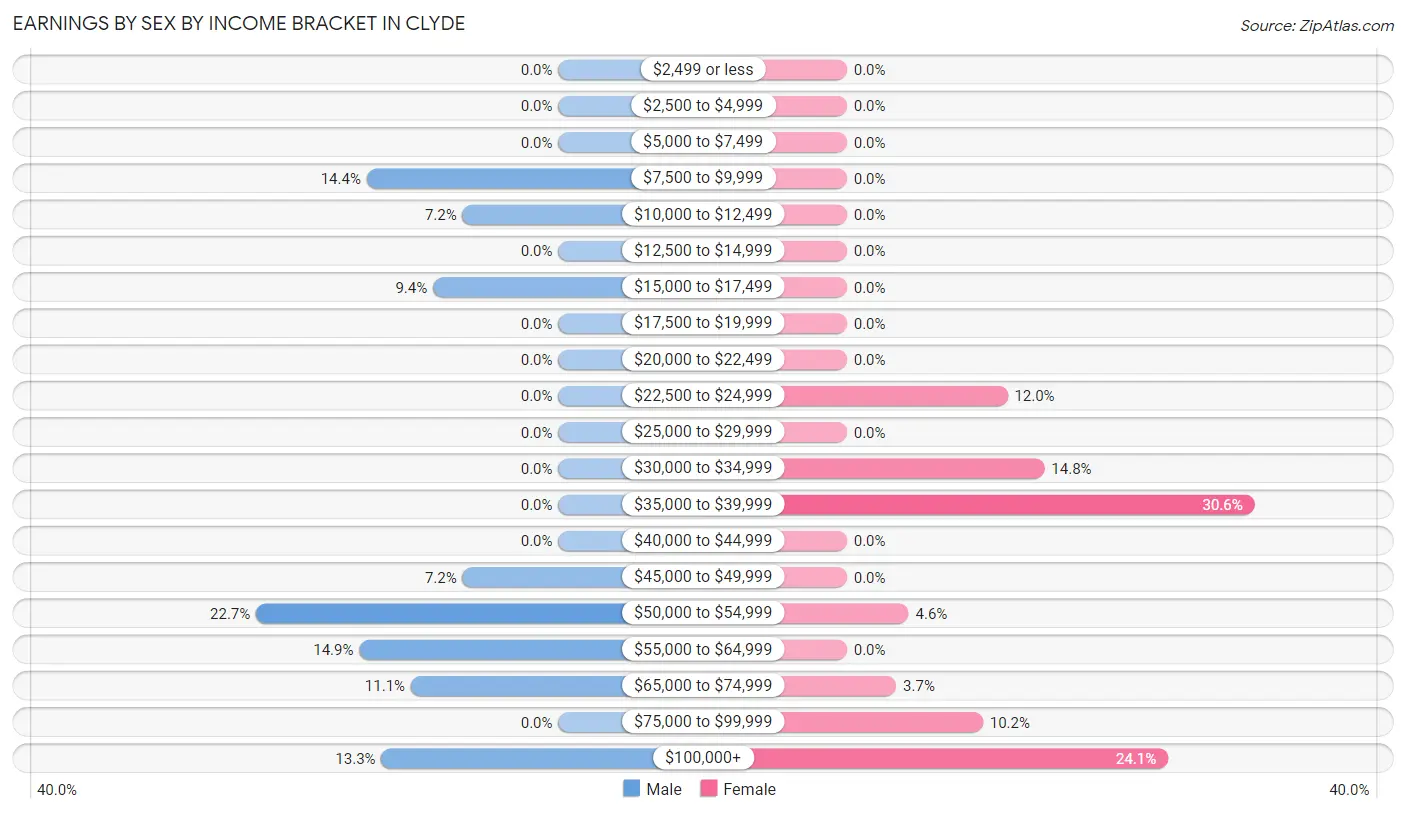
Earnings by Sex by Income Bracket in Clyde
The most common earnings brackets in Clyde are $50,000 to $54,999 for men (41 | 22.7%) and $35,000 to $39,999 for women (66 | 30.6%).
| Income | Male | Female |
| $2,499 or less | 0 (0.0%) | 0 (0.0%) |
| $2,500 to $4,999 | 0 (0.0%) | 0 (0.0%) |
| $5,000 to $7,499 | 0 (0.0%) | 0 (0.0%) |
| $7,500 to $9,999 | 26 (14.4%) | 0 (0.0%) |
| $10,000 to $12,499 | 13 (7.2%) | 0 (0.0%) |
| $12,500 to $14,999 | 0 (0.0%) | 0 (0.0%) |
| $15,000 to $17,499 | 17 (9.4%) | 0 (0.0%) |
| $17,500 to $19,999 | 0 (0.0%) | 0 (0.0%) |
| $20,000 to $22,499 | 0 (0.0%) | 0 (0.0%) |
| $22,500 to $24,999 | 0 (0.0%) | 26 (12.0%) |
| $25,000 to $29,999 | 0 (0.0%) | 0 (0.0%) |
| $30,000 to $34,999 | 0 (0.0%) | 32 (14.8%) |
| $35,000 to $39,999 | 0 (0.0%) | 66 (30.6%) |
| $40,000 to $44,999 | 0 (0.0%) | 0 (0.0%) |
| $45,000 to $49,999 | 13 (7.2%) | 0 (0.0%) |
| $50,000 to $54,999 | 41 (22.7%) | 10 (4.6%) |
| $55,000 to $64,999 | 27 (14.9%) | 0 (0.0%) |
| $65,000 to $74,999 | 20 (11.1%) | 8 (3.7%) |
| $75,000 to $99,999 | 0 (0.0%) | 22 (10.2%) |
| $100,000+ | 24 (13.3%) | 52 (24.1%) |
| Total | 181 (100.0%) | 216 (100.0%) |
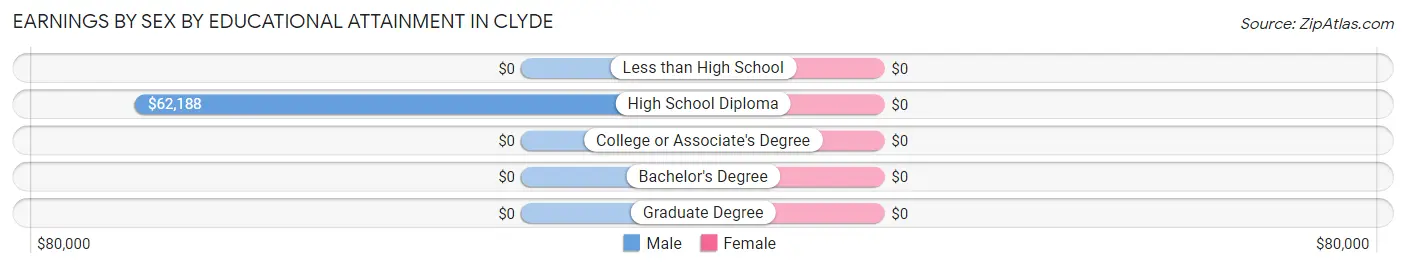
Earnings by Sex by Educational Attainment in Clyde
| Educational Attainment | Male Income | Female Income |
| Less than High School | - | - |
| High School Diploma | $62,188 | $0 |
| College or Associate's Degree | - | - |
| Bachelor's Degree | - | - |
| Graduate Degree | - | - |
| Total | $52,969 | $0 |
Family Income in Clyde
Family Income Brackets in Clyde
According to the Clyde family income data, there are 67 families falling into the $50,000 to $74,999 income range, which is the most common income bracket and makes up 31.3% of all families.
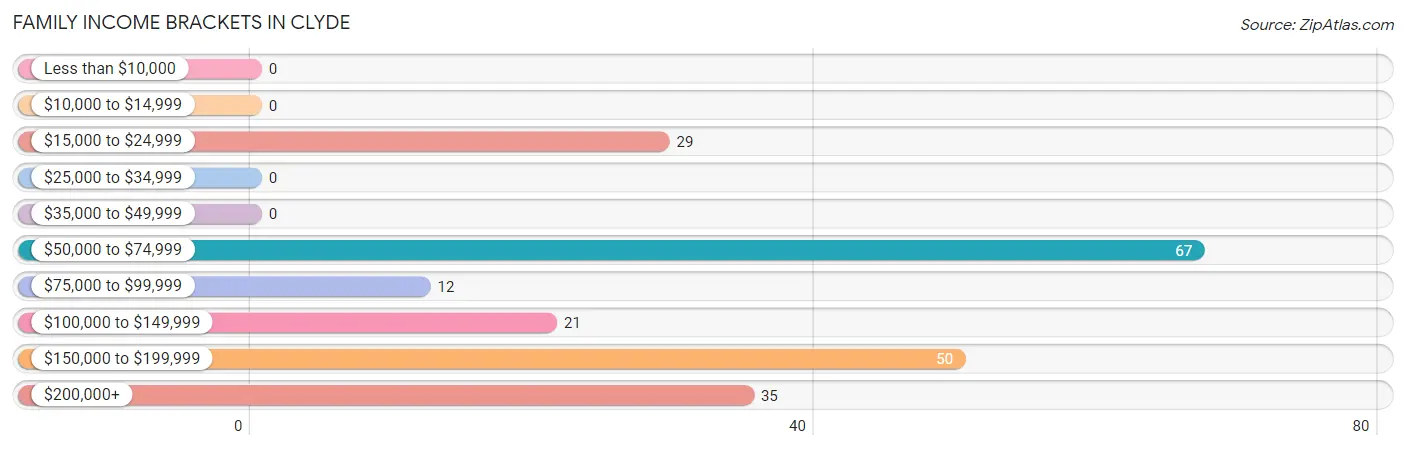
| Income Bracket | # Families | % Families |
| Less than $10,000 | 0 | 0.0% |
| $10,000 to $14,999 | 0 | 0.0% |
| $15,000 to $24,999 | 29 | 13.6% |
| $25,000 to $34,999 | 0 | 0.0% |
| $35,000 to $49,999 | 0 | 0.0% |
| $50,000 to $74,999 | 67 | 31.3% |
| $75,000 to $99,999 | 12 | 5.6% |
| $100,000 to $149,999 | 21 | 9.8% |
| $150,000 to $199,999 | 50 | 23.4% |
| $200,000+ | 35 | 16.4% |
Family Income by Famaliy Size in Clyde
3-person families (70 | 32.7%) account for the highest median family income in Clyde with $114,167 per family, while 3-person families (70 | 32.7%) have the highest median income of $38,056 per family member.
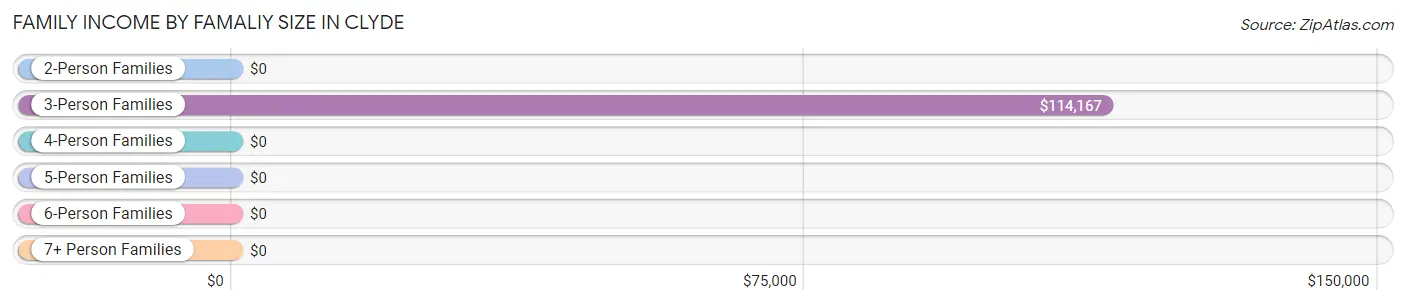
| Income Bracket | # Families | Median Income |
| 2-Person Families | 127 (59.4%) | $0 |
| 3-Person Families | 70 (32.7%) | $114,167 |
| 4-Person Families | 17 (7.9%) | $0 |
| 5-Person Families | 0 (0.0%) | $0 |
| 6-Person Families | 0 (0.0%) | $0 |
| 7+ Person Families | 0 (0.0%) | $0 |
| Total | 214 (100.0%) | $94,792 |
Family Income by Number of Earners in Clyde
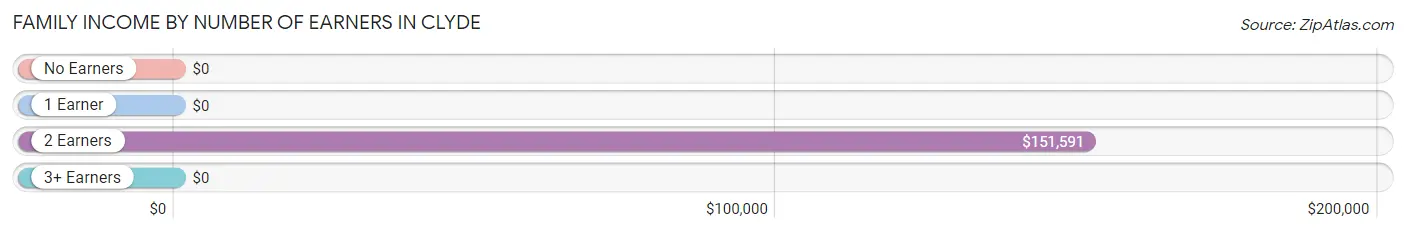
| Number of Earners | # Families | Median Income |
| No Earners | 42 (19.6%) | $0 |
| 1 Earner | 62 (29.0%) | $0 |
| 2 Earners | 86 (40.2%) | $151,591 |
| 3+ Earners | 24 (11.2%) | $0 |
| Total | 214 (100.0%) | $94,792 |
Household Income in Clyde
Household Income Brackets in Clyde
With 97 households falling in the category, the $50,000 to $74,999 income range is the most frequent in Clyde, accounting for 33.7% of all households.
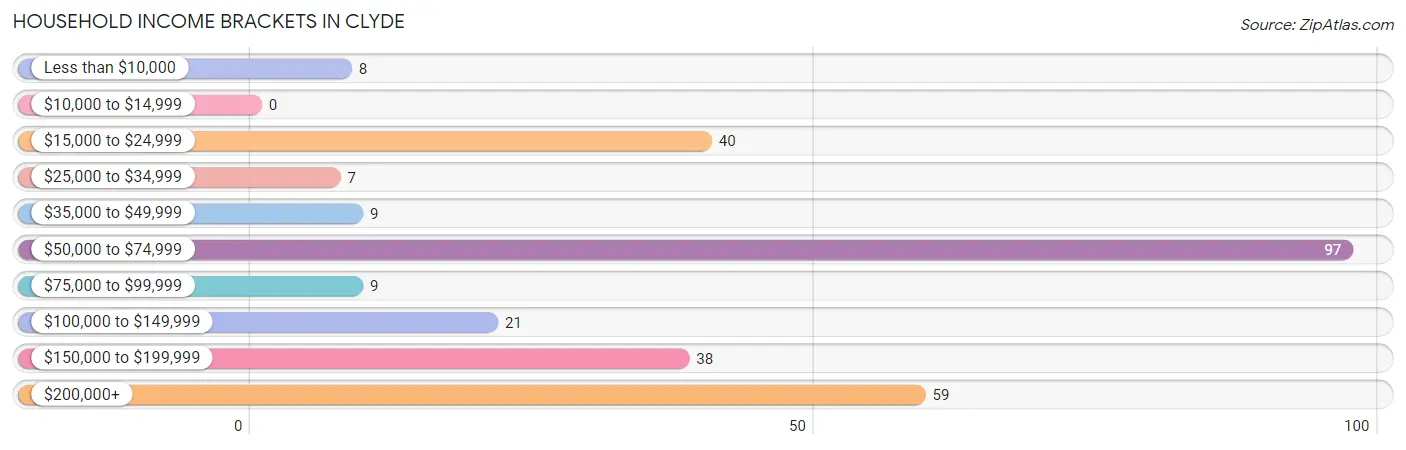
| Income Bracket | # Households | % Households |
| Less than $10,000 | 8 | 2.8% |
| $10,000 to $14,999 | 0 | 0.0% |
| $15,000 to $24,999 | 40 | 13.9% |
| $25,000 to $34,999 | 7 | 2.4% |
| $35,000 to $49,999 | 9 | 3.1% |
| $50,000 to $74,999 | 97 | 33.7% |
| $75,000 to $99,999 | 9 | 3.1% |
| $100,000 to $149,999 | 21 | 7.3% |
| $150,000 to $199,999 | 38 | 13.2% |
| $200,000+ | 59 | 20.5% |
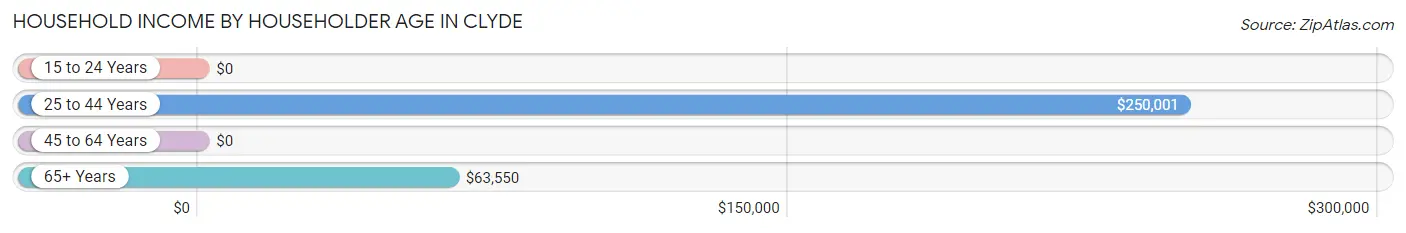
Household Income by Householder Age in Clyde
The median household income in Clyde is $73,910, with the highest median household income of $250,001 found in the 25 to 44 years age bracket for the primary householder. A total of 42 households (14.6%) fall into this category.
| Income Bracket | # Households | Median Income |
| 15 to 24 Years | 0 (0.0%) | $0 |
| 25 to 44 Years | 42 (14.6%) | $250,001 |
| 45 to 64 Years | 141 (49.0%) | $0 |
| 65+ Years | 105 (36.5%) | $63,550 |
| Total | 288 (100.0%) | $73,910 |
Poverty in Clyde
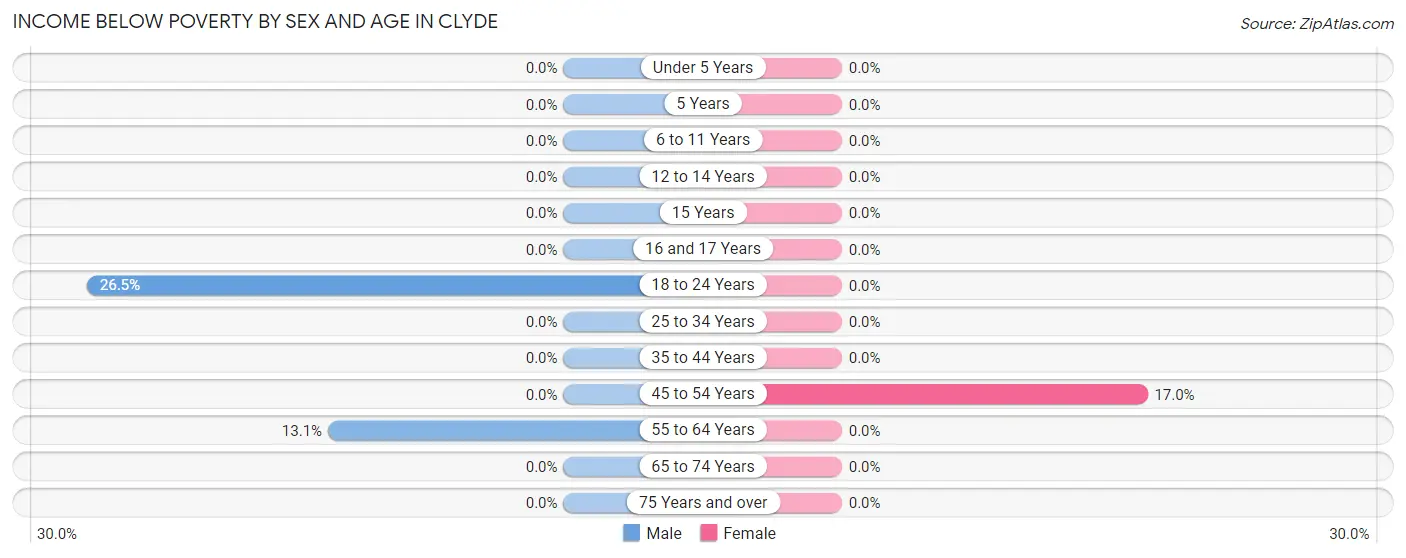
Income Below Poverty by Sex and Age in Clyde
With 6.1% poverty level for males and 2.1% for females among the residents of Clyde, 18 to 24 year old males and 45 to 54 year old females are the most vulnerable to poverty, with 13 males (26.5%) and 8 females (17.0%) in their respective age groups living below the poverty level.
| Age Bracket | Male | Female |
| Under 5 Years | 0 (0.0%) | 0 (0.0%) |
| 5 Years | 0 (0.0%) | 0 (0.0%) |
| 6 to 11 Years | 0 (0.0%) | 0 (0.0%) |
| 12 to 14 Years | 0 (0.0%) | 0 (0.0%) |
| 15 Years | 0 (0.0%) | 0 (0.0%) |
| 16 and 17 Years | 0 (0.0%) | 0 (0.0%) |
| 18 to 24 Years | 13 (26.5%) | 0 (0.0%) |
| 25 to 34 Years | 0 (0.0%) | 0 (0.0%) |
| 35 to 44 Years | 0 (0.0%) | 0 (0.0%) |
| 45 to 54 Years | 0 (0.0%) | 8 (17.0%) |
| 55 to 64 Years | 8 (13.1%) | 0 (0.0%) |
| 65 to 74 Years | 0 (0.0%) | 0 (0.0%) |
| 75 Years and over | 0 (0.0%) | 0 (0.0%) |
| Total | 21 (6.1%) | 8 (2.1%) |
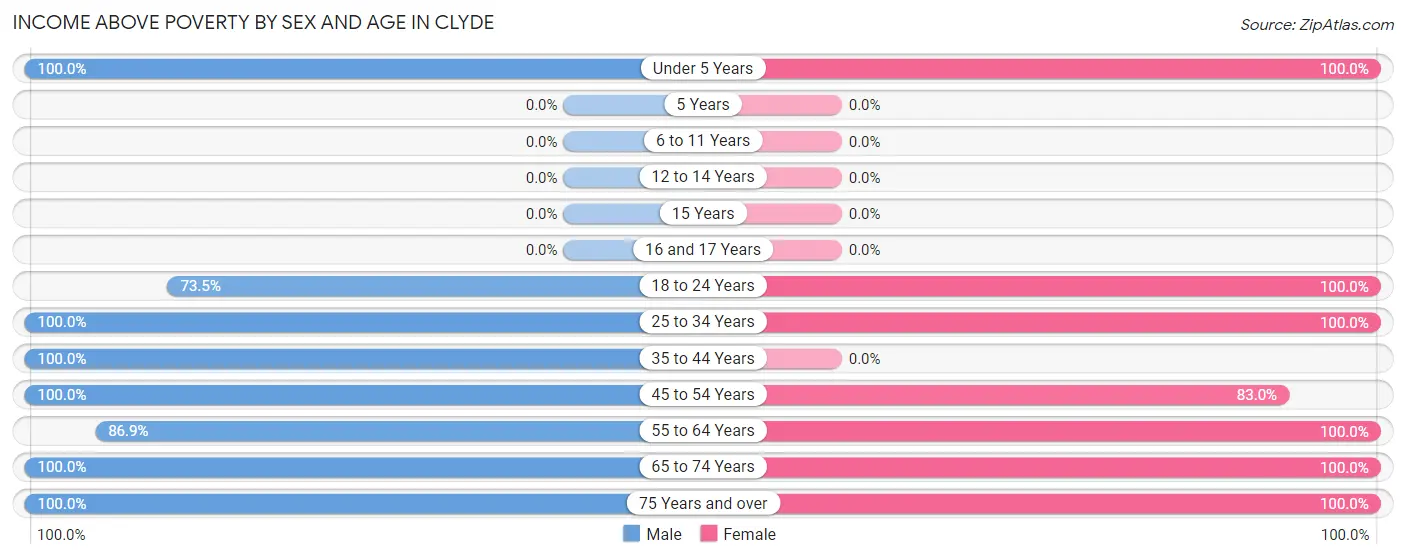
Income Above Poverty by Sex and Age in Clyde
According to the poverty statistics in Clyde, males aged under 5 years and females aged under 5 years are the age groups that are most secure financially, with 100.0% of males and 100.0% of females in these age groups living above the poverty line.
| Age Bracket | Male | Female |
| Under 5 Years | 34 (100.0%) | 19 (100.0%) |
| 5 Years | 0 (0.0%) | 0 (0.0%) |
| 6 to 11 Years | 0 (0.0%) | 0 (0.0%) |
| 12 to 14 Years | 0 (0.0%) | 0 (0.0%) |
| 15 Years | 0 (0.0%) | 0 (0.0%) |
| 16 and 17 Years | 0 (0.0%) | 0 (0.0%) |
| 18 to 24 Years | 36 (73.5%) | 47 (100.0%) |
| 25 to 34 Years | 67 (100.0%) | 71 (100.0%) |
| 35 to 44 Years | 36 (100.0%) | 0 (0.0%) |
| 45 to 54 Years | 20 (100.0%) | 39 (83.0%) |
| 55 to 64 Years | 53 (86.9%) | 101 (100.0%) |
| 65 to 74 Years | 46 (100.0%) | 38 (100.0%) |
| 75 Years and over | 33 (100.0%) | 52 (100.0%) |
| Total | 325 (93.9%) | 367 (97.9%) |
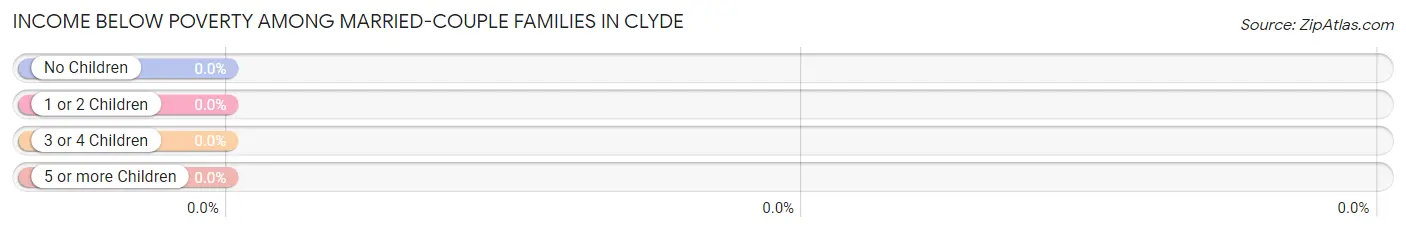
Income Below Poverty Among Married-Couple Families in Clyde
| Children | Above Poverty | Below Poverty |
| No Children | 100 (100.0%) | 0 (0.0%) |
| 1 or 2 Children | 19 (100.0%) | 0 (0.0%) |
| 3 or 4 Children | 0 (0.0%) | 0 (0.0%) |
| 5 or more Children | 0 (0.0%) | 0 (0.0%) |
| Total | 119 (100.0%) | 0 (0.0%) |
Income Below Poverty Among Single-Parent Households in Clyde
| Children | Single Father | Single Mother |
| No Children | 0 (0.0%) | 0 (0.0%) |
| 1 or 2 Children | 0 (0.0%) | 0 (0.0%) |
| 3 or 4 Children | 0 (0.0%) | 0 (0.0%) |
| 5 or more Children | 0 (0.0%) | 0 (0.0%) |
| Total | 0 (0.0%) | 0 (0.0%) |
Income Below Poverty Among Married-Couple vs Single-Parent Households in Clyde
| Children | Married-Couple Families | Single-Parent Households |
| No Children | 0 (0.0%) | 0 (0.0%) |
| 1 or 2 Children | 0 (0.0%) | 0 (0.0%) |
| 3 or 4 Children | 0 (0.0%) | 0 (0.0%) |
| 5 or more Children | 0 (0.0%) | 0 (0.0%) |
| Total | 0 (0.0%) | 0 (0.0%) |
Race in Clyde
The most populous races in Clyde are White / Caucasian (516 | 71.6%), Hispanic or Latino (151 | 20.9%), and Two or more Races (108 | 15.0%).
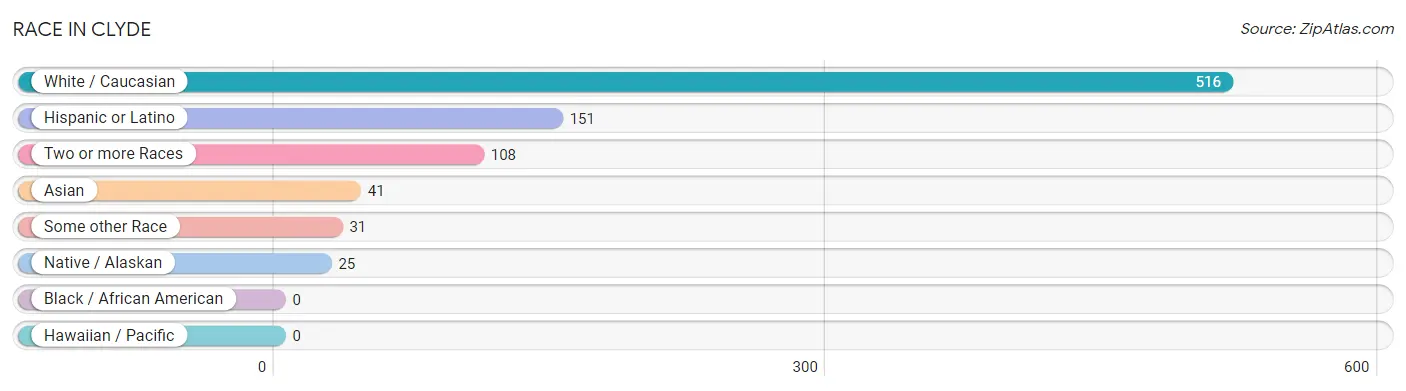
| Race | # Population | % Population |
| Asian | 41 | 5.7% |
| Black / African American | 0 | 0.0% |
| Hawaiian / Pacific | 0 | 0.0% |
| Hispanic or Latino | 151 | 20.9% |
| Native / Alaskan | 25 | 3.5% |
| White / Caucasian | 516 | 71.6% |
| Two or more Races | 108 | 15.0% |
| Some other Race | 31 | 4.3% |
| Total | 721 | 100.0% |
Ancestry in Clyde
The most populous ancestries reported in Clyde are English (205 | 28.4%), Mexican (125 | 17.3%), Italian (74 | 10.3%), Irish (70 | 9.7%), and Mexican American Indian (70 | 9.7%), together accounting for 75.4% of all Clyde residents.
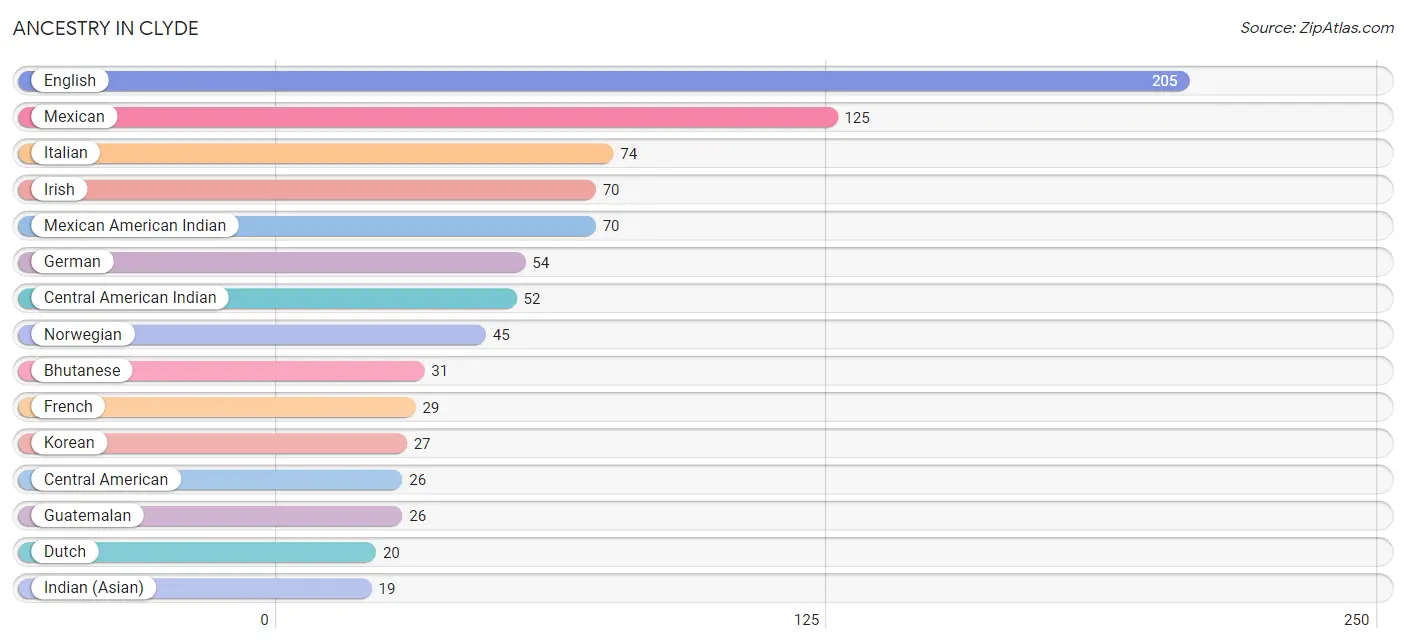
| Ancestry | # Population | % Population |
| American | 8 | 1.1% |
| Bhutanese | 31 | 4.3% |
| Central American | 26 | 3.6% |
| Central American Indian | 52 | 7.2% |
| Choctaw | 8 | 1.1% |
| Danish | 10 | 1.4% |
| Dutch | 20 | 2.8% |
| English | 205 | 28.4% |
| French | 29 | 4.0% |
| German | 54 | 7.5% |
| Guatemalan | 26 | 3.6% |
| Indian (Asian) | 19 | 2.6% |
| Irish | 70 | 9.7% |
| Italian | 74 | 10.3% |
| Korean | 27 | 3.7% |
| Mexican | 125 | 17.3% |
| Mexican American Indian | 70 | 9.7% |
| Norwegian | 45 | 6.2% |
| Scottish | 8 | 1.1% |
| Swedish | 13 | 1.8% | View All 20 Rows |
Immigrants in Clyde
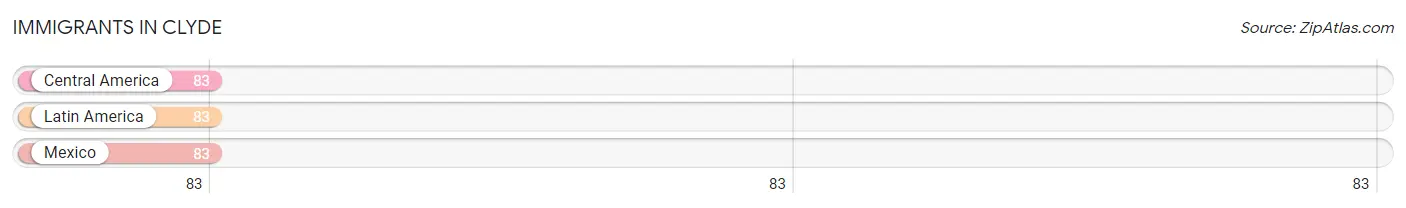
The most numerous immigrant groups reported in Clyde came from Central America (83 | 11.5%), Latin America (83 | 11.5%), and Mexico (83 | 11.5%), together accounting for 34.5% of all Clyde residents.
| Immigration Origin | # Population | % Population |
| Central America | 83 | 11.5% |
| Latin America | 83 | 11.5% |
| Mexico | 83 | 11.5% | View All 3 Rows |
Sex and Age in Clyde
Sex and Age in Clyde
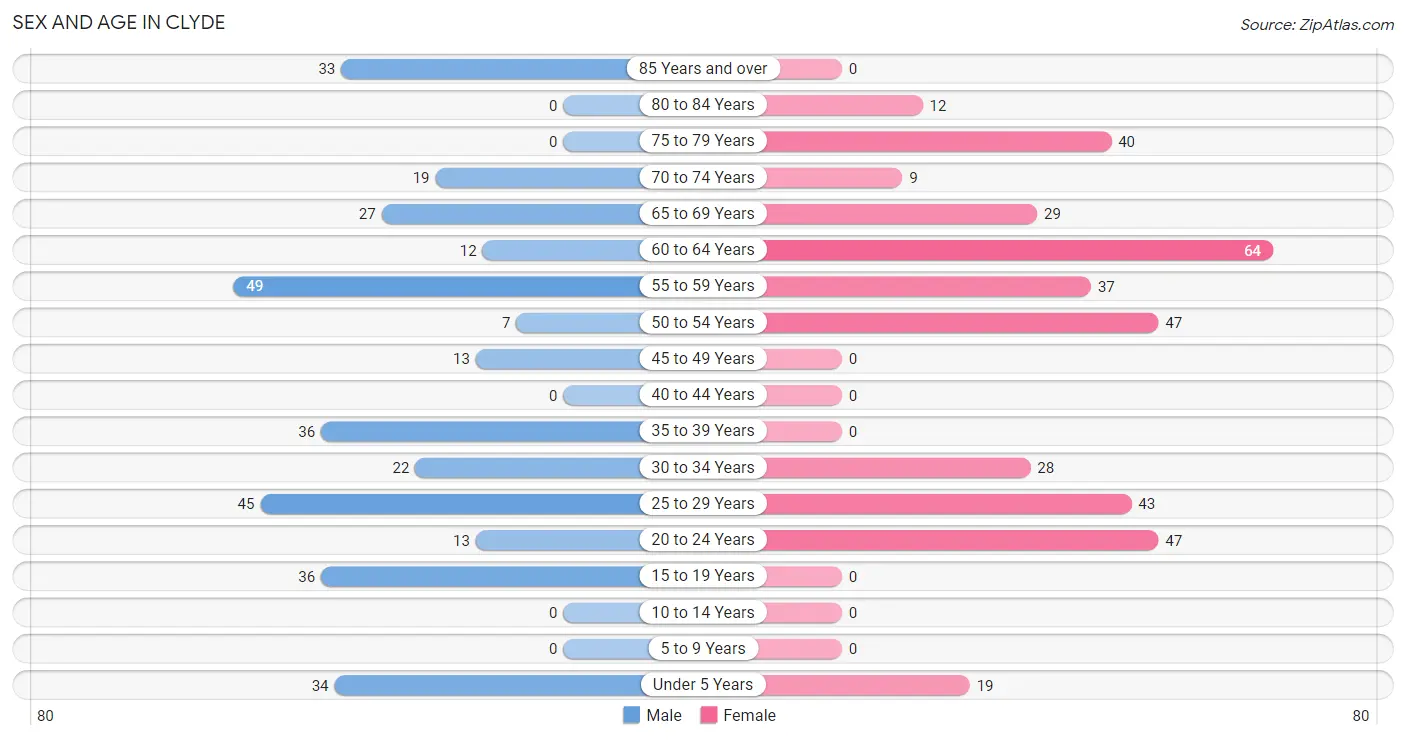
The most populous age groups in Clyde are 55 to 59 Years (49 | 14.2%) for men and 60 to 64 Years (64 | 17.1%) for women.
| Age Bracket | Male | Female |
| Under 5 Years | 34 (9.8%) | 19 (5.1%) |
| 5 to 9 Years | 0 (0.0%) | 0 (0.0%) |
| 10 to 14 Years | 0 (0.0%) | 0 (0.0%) |
| 15 to 19 Years | 36 (10.4%) | 0 (0.0%) |
| 20 to 24 Years | 13 (3.8%) | 47 (12.5%) |
| 25 to 29 Years | 45 (13.0%) | 43 (11.5%) |
| 30 to 34 Years | 22 (6.4%) | 28 (7.5%) |
| 35 to 39 Years | 36 (10.4%) | 0 (0.0%) |
| 40 to 44 Years | 0 (0.0%) | 0 (0.0%) |
| 45 to 49 Years | 13 (3.8%) | 0 (0.0%) |
| 50 to 54 Years | 7 (2.0%) | 47 (12.5%) |
| 55 to 59 Years | 49 (14.2%) | 37 (9.9%) |
| 60 to 64 Years | 12 (3.5%) | 64 (17.1%) |
| 65 to 69 Years | 27 (7.8%) | 29 (7.7%) |
| 70 to 74 Years | 19 (5.5%) | 9 (2.4%) |
| 75 to 79 Years | 0 (0.0%) | 40 (10.7%) |
| 80 to 84 Years | 0 (0.0%) | 12 (3.2%) |
| 85 Years and over | 33 (9.5%) | 0 (0.0%) |
| Total | 346 (100.0%) | 375 (100.0%) |
Families and Households in Clyde
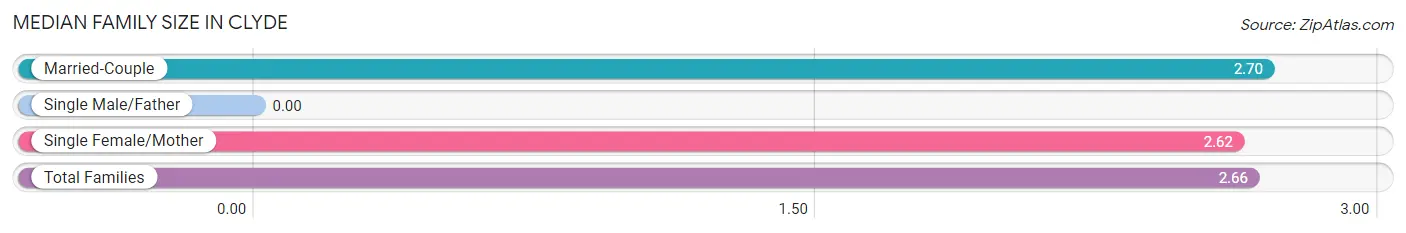
Median Family Size in Clyde
| Family Type | # Families | Family Size |
| Married-Couple | 119 (55.6%) | 2.70 |
| Single Male/Father | 0 (0.0%) | - |
| Single Female/Mother | 95 (44.4%) | 2.62 |
| Total Families | 214 (100.0%) | 2.66 |
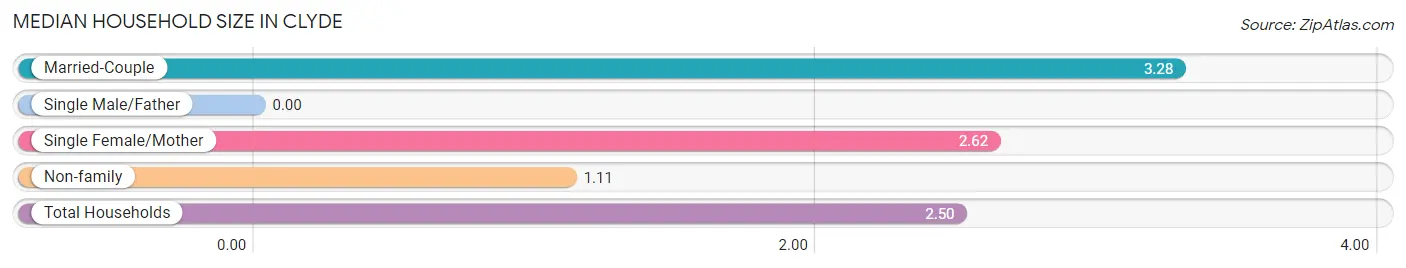
Median Household Size in Clyde
| Household Type | # Households | Household Size |
| Married-Couple | 119 (41.3%) | 3.28 |
| Single Male/Father | 0 (0.0%) | - |
| Single Female/Mother | 95 (33.0%) | 2.62 |
| Non-family | 74 (25.7%) | 1.11 |
| Total Households | 288 (100.0%) | 2.50 |
Household Size by Marriage Status in Clyde
Out of a total of 288 households in Clyde, 214 (74.3%) are family households, while 74 (25.7%) are nonfamily households. The most numerous type of family households are 2-person households, comprising 127, and the most common type of nonfamily households are 1-person households, comprising 67.
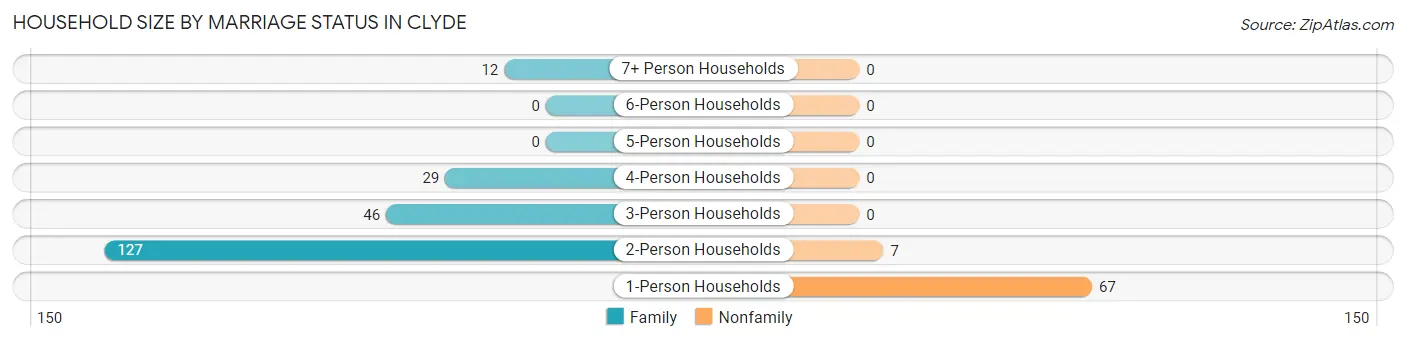
| Household Size | Family Households | Nonfamily Households |
| 1-Person Households | - | 67 (23.3%) |
| 2-Person Households | 127 (44.1%) | 7 (2.4%) |
| 3-Person Households | 46 (16.0%) | 0 (0.0%) |
| 4-Person Households | 29 (10.1%) | 0 (0.0%) |
| 5-Person Households | 0 (0.0%) | 0 (0.0%) |
| 6-Person Households | 0 (0.0%) | 0 (0.0%) |
| 7+ Person Households | 12 (4.2%) | 0 (0.0%) |
| Total | 214 (74.3%) | 74 (25.7%) |
Female Fertility in Clyde
Fertility by Age in Clyde
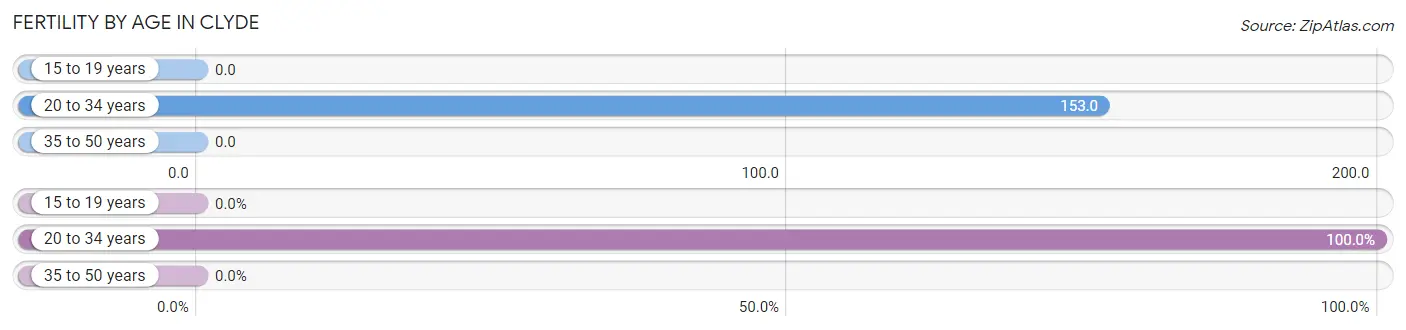
Average fertility rate in Clyde is 132.0 births per 1,000 women. Women in the age bracket of 20 to 34 years have the highest fertility rate with 153.0 births per 1,000 women. Women in the age bracket of 20 to 34 years acount for 100.0% of all women with births.
| Age Bracket | Women with Births | Births / 1,000 Women |
| 15 to 19 years | 0 (0.0%) | 0.0 |
| 20 to 34 years | 18 (100.0%) | 153.0 |
| 35 to 50 years | 0 (0.0%) | 0.0 |
| Total | 18 (100.0%) | 132.0 |
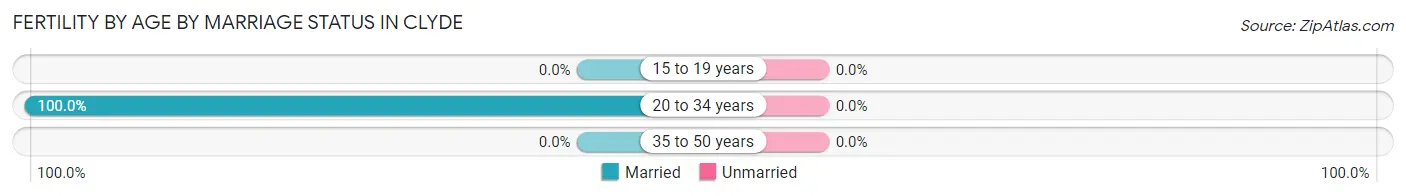
Fertility by Age by Marriage Status in Clyde
| Age Bracket | Married | Unmarried |
| 15 to 19 years | 0 (0.0%) | 0 (0.0%) |
| 20 to 34 years | 18 (100.0%) | 0 (0.0%) |
| 35 to 50 years | 0 (0.0%) | 0 (0.0%) |
| Total | 18 (100.0%) | 0 (0.0%) |
Fertility by Education in Clyde
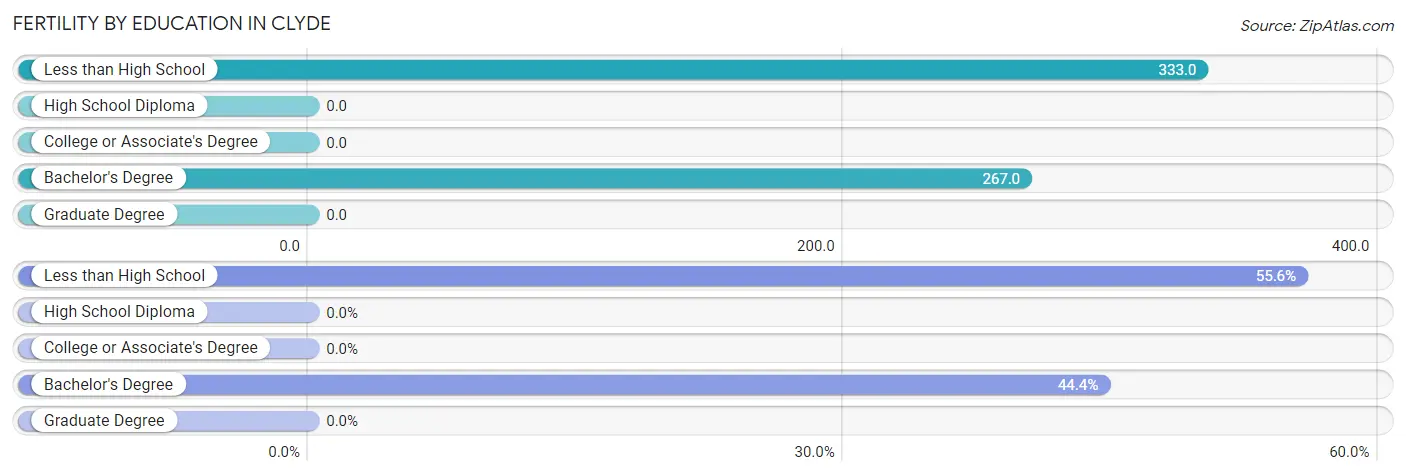
| Educational Attainment | Women with Births | Births / 1,000 Women |
| Less than High School | 10 (55.6%) | 333.0 |
| High School Diploma | 0 (0.0%) | 0.0 |
| College or Associate's Degree | 0 (0.0%) | 0.0 |
| Bachelor's Degree | 8 (44.4%) | 267.0 |
| Graduate Degree | 0 (0.0%) | 0.0 |
| Total | 18 (100.0%) | 132.0 |
Fertility by Education by Marriage Status in Clyde
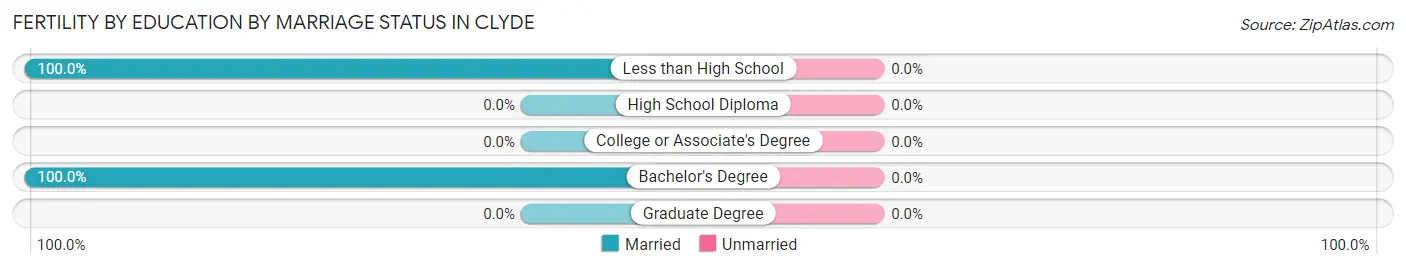
| Educational Attainment | Married | Unmarried |
| Less than High School | 10 (100.0%) | 0 (0.0%) |
| High School Diploma | 0 (0.0%) | 0 (0.0%) |
| College or Associate's Degree | 0 (0.0%) | 0 (0.0%) |
| Bachelor's Degree | 8 (100.0%) | 0 (0.0%) |
| Graduate Degree | 0 (0.0%) | 0 (0.0%) |
| Total | 18 (100.0%) | 0 (0.0%) |
Employment Characteristics in Clyde
Employment by Class of Employer in Clyde
Among the 343 employed individuals in Clyde, private company employees (243 | 70.9%), local government employees (49 | 14.3%), and not-for-profit organizations (15 | 4.4%) make up the most common classes of employment.
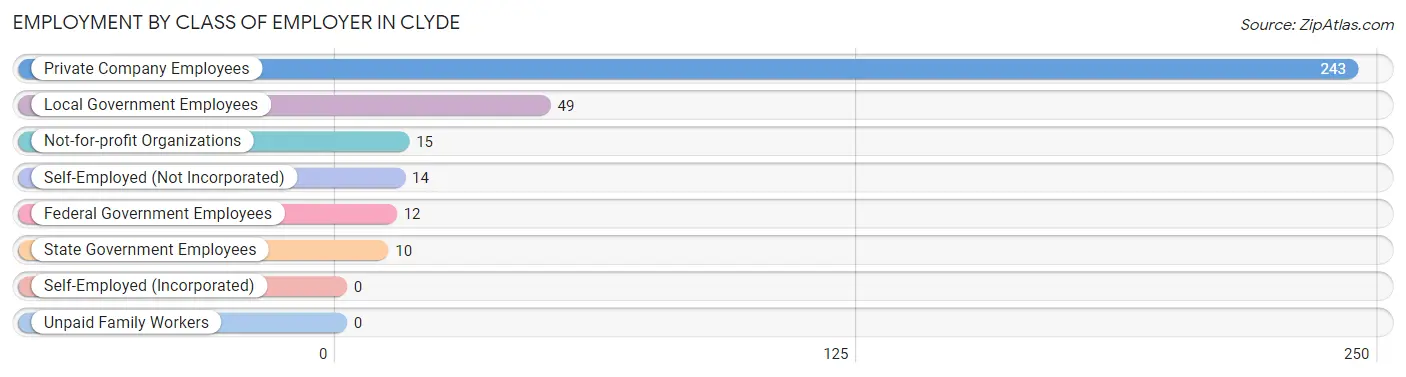
| Employer Class | # Employees | % Employees |
| Private Company Employees | 243 | 70.9% |
| Self-Employed (Incorporated) | 0 | 0.0% |
| Self-Employed (Not Incorporated) | 14 | 4.1% |
| Not-for-profit Organizations | 15 | 4.4% |
| Local Government Employees | 49 | 14.3% |
| State Government Employees | 10 | 2.9% |
| Federal Government Employees | 12 | 3.5% |
| Unpaid Family Workers | 0 | 0.0% |
| Total | 343 | 100.0% |
Employment Status by Age in Clyde
According to the labor force statistics for Clyde, out of the total population over 16 years of age (668), 58.8% or 393 individuals are in the labor force, with 5.6% or 22 of them unemployed. The age group with the highest labor force participation rate is 20 to 24 years, with 100.0% or 60 individuals in the labor force. Within the labor force, the 25 to 29 years age range has the highest percentage of unemployed individuals, with 20.3% or 14 of them being unemployed.
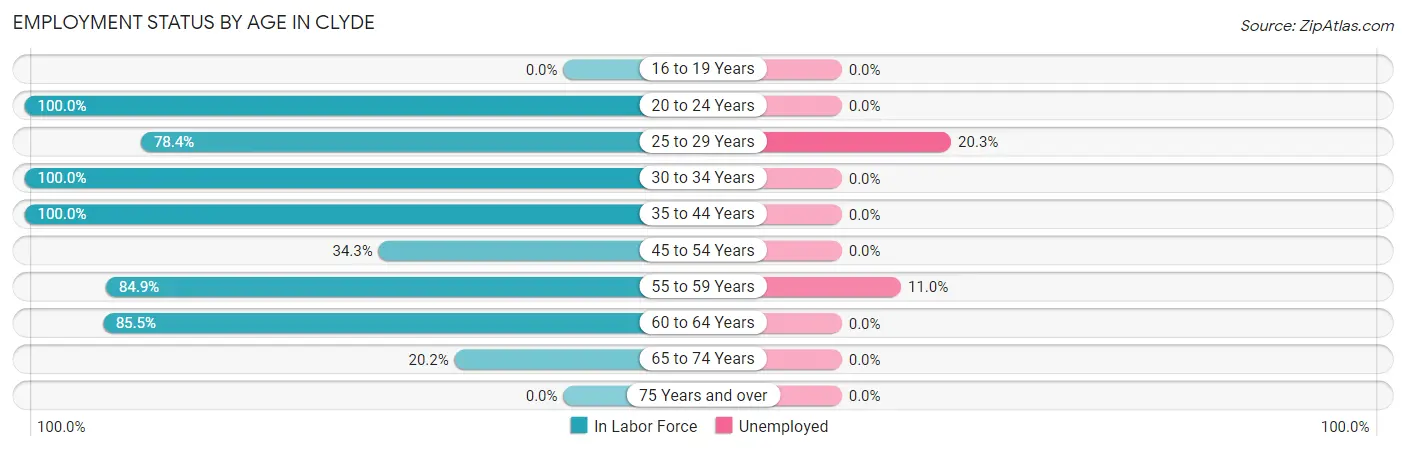
| Age Bracket | In Labor Force | Unemployed |
| 16 to 19 Years | 0 (0.0%) | 0 (0.0%) |
| 20 to 24 Years | 60 (100.0%) | 0 (0.0%) |
| 25 to 29 Years | 69 (78.4%) | 14 (20.3%) |
| 30 to 34 Years | 50 (100.0%) | 0 (0.0%) |
| 35 to 44 Years | 36 (100.0%) | 0 (0.0%) |
| 45 to 54 Years | 23 (34.3%) | 0 (0.0%) |
| 55 to 59 Years | 73 (84.9%) | 8 (11.0%) |
| 60 to 64 Years | 65 (85.5%) | 0 (0.0%) |
| 65 to 74 Years | 17 (20.2%) | 0 (0.0%) |
| 75 Years and over | 0 (0.0%) | 0 (0.0%) |
| Total | 393 (58.8%) | 22 (5.6%) |
Employment Status by Educational Attainment in Clyde
According to labor force statistics for Clyde, 78.4% of individuals (316) out of the total population between 25 and 64 years of age (403) are in the labor force, with 7.0% or 22 of them being unemployed. The group with the highest labor force participation rate are those with the educational attainment of less than high school, with 100.0% or 48 individuals in the labor force. Within the labor force, individuals with college / associate degree education have the highest percentage of unemployment, with 40.0% or 22 of them being unemployed.
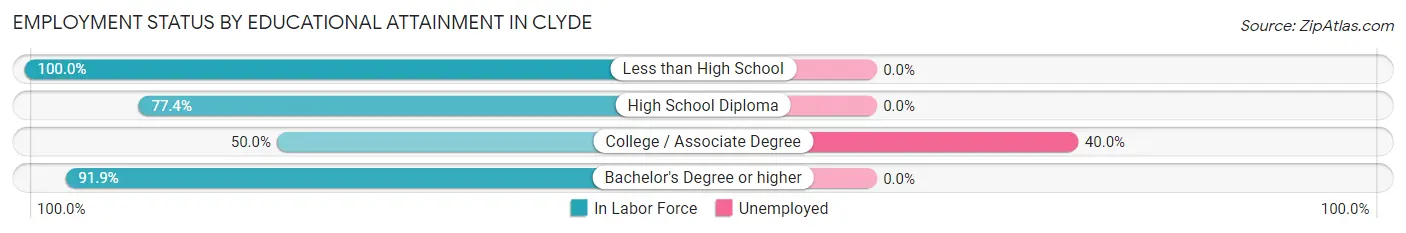
| Educational Attainment | In Labor Force | Unemployed |
| Less than High School | 48 (100.0%) | 0 (0.0%) |
| High School Diploma | 65 (77.4%) | 0 (0.0%) |
| College / Associate Degree | 55 (50.0%) | 44 (40.0%) |
| Bachelor's Degree or higher | 148 (91.9%) | 0 (0.0%) |
| Total | 316 (78.4%) | 28 (7.0%) |
Employment Occupations by Sex in Clyde
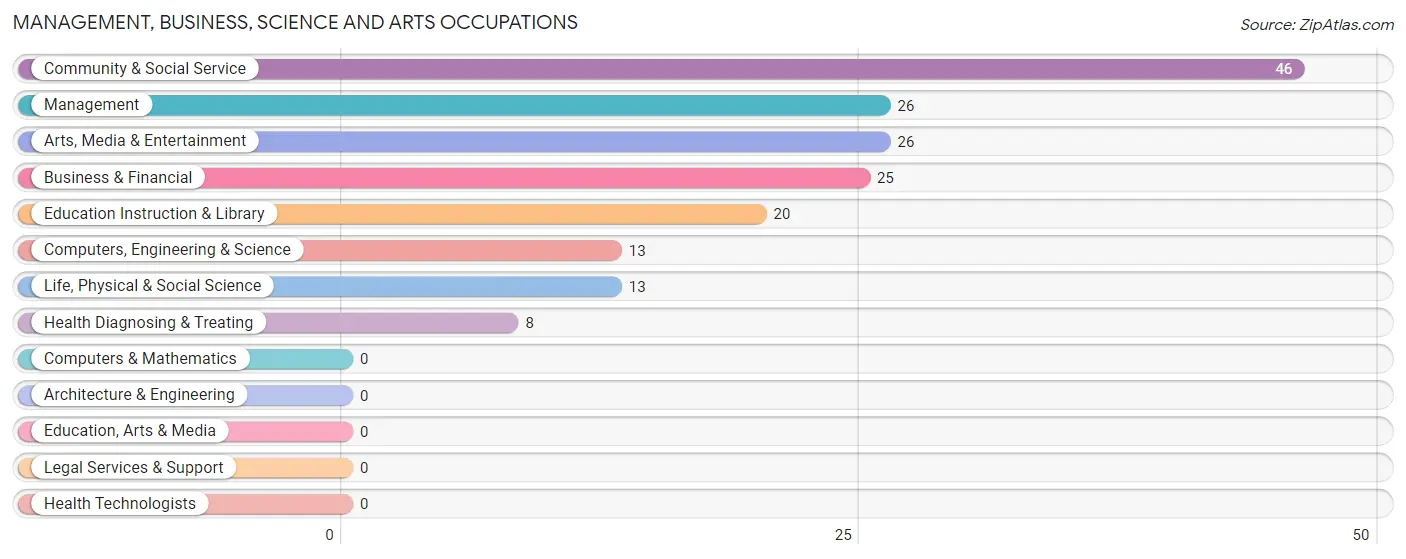
Management, Business, Science and Arts Occupations
The most common Management, Business, Science and Arts occupations in Clyde are Community & Social Service (46 | 12.4%), Management (26 | 7.0%), Arts, Media & Entertainment (26 | 7.0%), Business & Financial (25 | 6.7%), and Education Instruction & Library (20 | 5.4%).
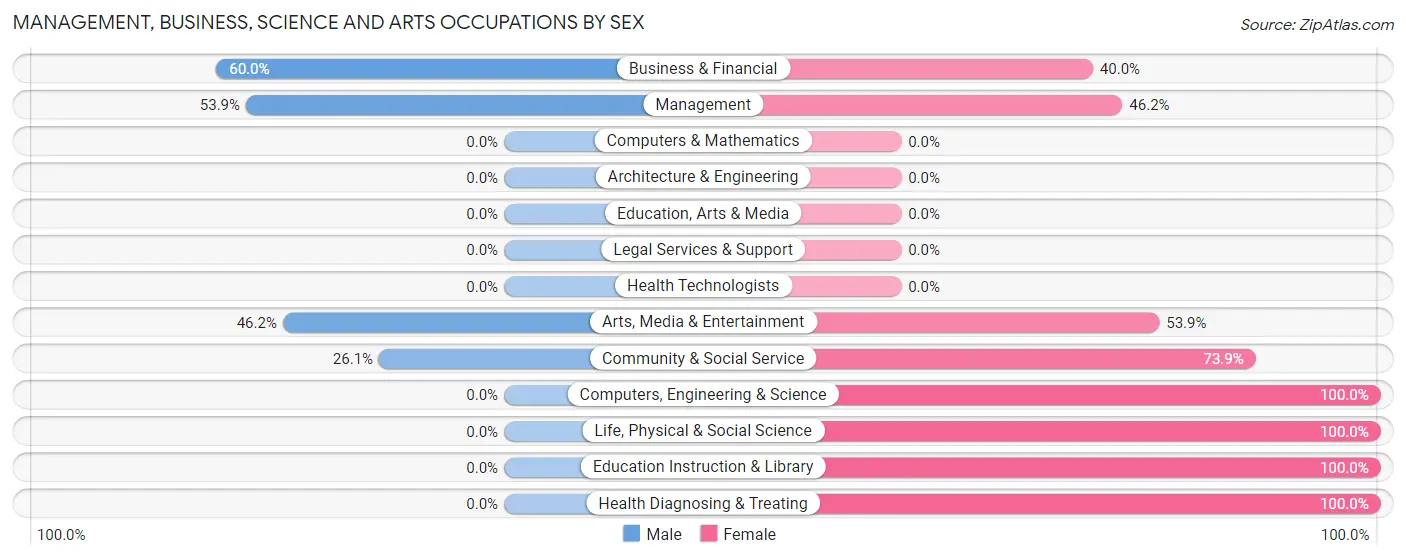
Management, Business, Science and Arts Occupations by Sex
Within the Management, Business, Science and Arts occupations in Clyde, the most male-oriented occupations are Business & Financial (60.0%), Management (53.8%), and Arts, Media & Entertainment (46.2%), while the most female-oriented occupations are Computers, Engineering & Science (100.0%), Life, Physical & Social Science (100.0%), and Education Instruction & Library (100.0%).
| Occupation | Male | Female |
| Management | 14 (53.8%) | 12 (46.2%) |
| Business & Financial | 15 (60.0%) | 10 (40.0%) |
| Computers, Engineering & Science | 0 (0.0%) | 13 (100.0%) |
| Computers & Mathematics | 0 (0.0%) | 0 (0.0%) |
| Architecture & Engineering | 0 (0.0%) | 0 (0.0%) |
| Life, Physical & Social Science | 0 (0.0%) | 13 (100.0%) |
| Community & Social Service | 12 (26.1%) | 34 (73.9%) |
| Education, Arts & Media | 0 (0.0%) | 0 (0.0%) |
| Legal Services & Support | 0 (0.0%) | 0 (0.0%) |
| Education Instruction & Library | 0 (0.0%) | 20 (100.0%) |
| Arts, Media & Entertainment | 12 (46.2%) | 14 (53.8%) |
| Health Diagnosing & Treating | 0 (0.0%) | 8 (100.0%) |
| Health Technologists | 0 (0.0%) | 0 (0.0%) |
| Total (Category) | 41 (34.7%) | 77 (65.2%) |
| Total (Overall) | 155 (41.8%) | 216 (58.2%) |
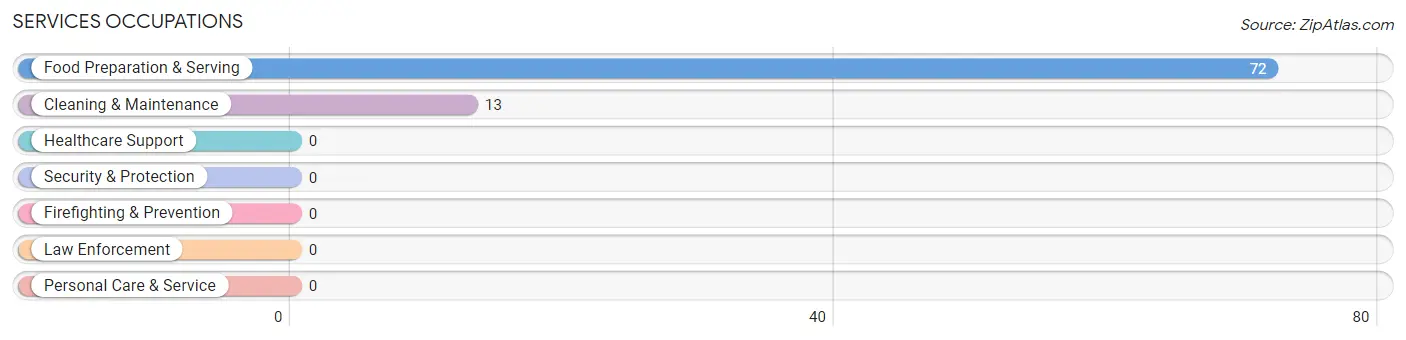
Services Occupations
The most common Services occupations in Clyde are Food Preparation & Serving (72 | 19.4%), and Cleaning & Maintenance (13 | 3.5%).
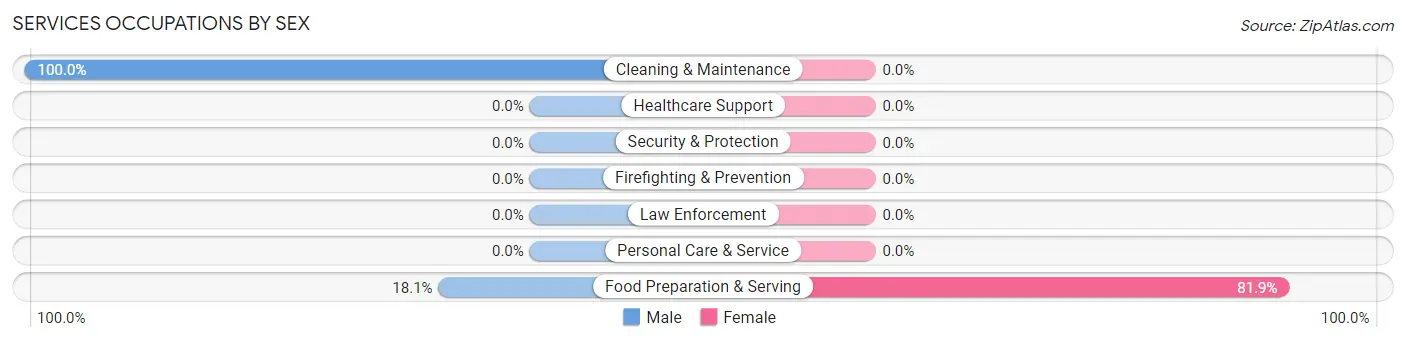
Services Occupations by Sex
| Occupation | Male | Female |
| Healthcare Support | 0 (0.0%) | 0 (0.0%) |
| Security & Protection | 0 (0.0%) | 0 (0.0%) |
| Firefighting & Prevention | 0 (0.0%) | 0 (0.0%) |
| Law Enforcement | 0 (0.0%) | 0 (0.0%) |
| Food Preparation & Serving | 13 (18.1%) | 59 (81.9%) |
| Cleaning & Maintenance | 13 (100.0%) | 0 (0.0%) |
| Personal Care & Service | 0 (0.0%) | 0 (0.0%) |
| Total (Category) | 26 (30.6%) | 59 (69.4%) |
| Total (Overall) | 155 (41.8%) | 216 (58.2%) |
Sales and Office Occupations
The most common Sales and Office occupations in Clyde are Office & Administration (88 | 23.7%), and Sales & Related (12 | 3.2%).
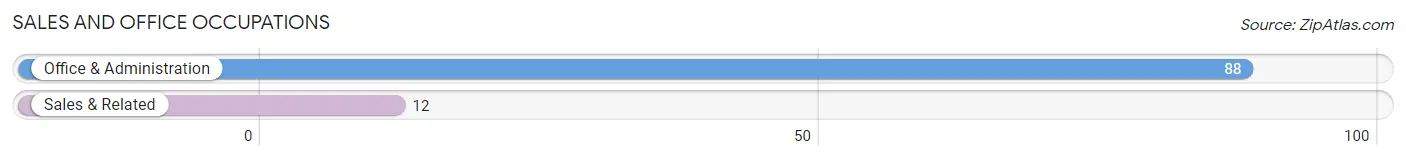
Sales and Office Occupations by Sex
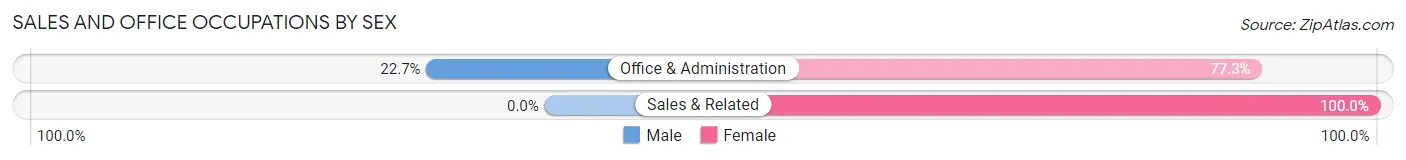
| Occupation | Male | Female |
| Sales & Related | 0 (0.0%) | 12 (100.0%) |
| Office & Administration | 20 (22.7%) | 68 (77.3%) |
| Total (Category) | 20 (20.0%) | 80 (80.0%) |
| Total (Overall) | 155 (41.8%) | 216 (58.2%) |
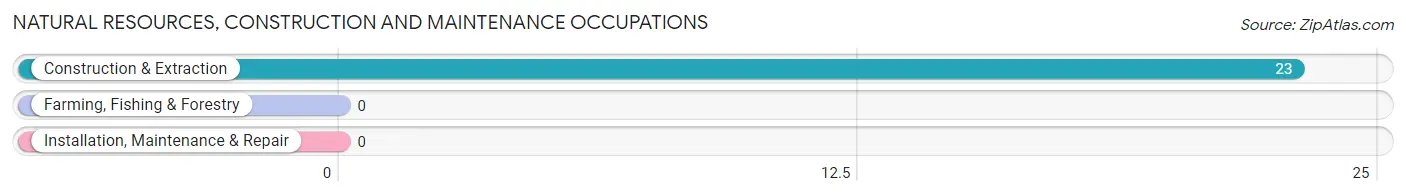
Natural Resources, Construction and Maintenance Occupations
The most common Natural Resources, Construction and Maintenance occupations in Clyde are , and Construction & Extraction (23 | 6.2%).
Natural Resources, Construction and Maintenance Occupations by Sex
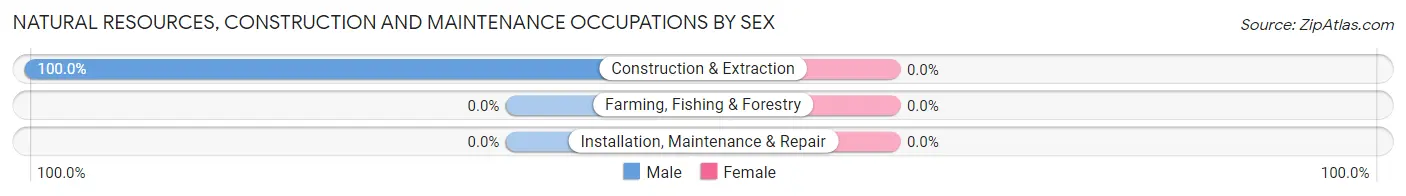
| Occupation | Male | Female |
| Farming, Fishing & Forestry | 0 (0.0%) | 0 (0.0%) |
| Construction & Extraction | 23 (100.0%) | 0 (0.0%) |
| Installation, Maintenance & Repair | 0 (0.0%) | 0 (0.0%) |
| Total (Category) | 23 (100.0%) | 0 (0.0%) |
| Total (Overall) | 155 (41.8%) | 216 (58.2%) |
Production, Transportation and Moving Occupations
The most common Production, Transportation and Moving occupations in Clyde are , and Material Moving (45 | 12.1%).
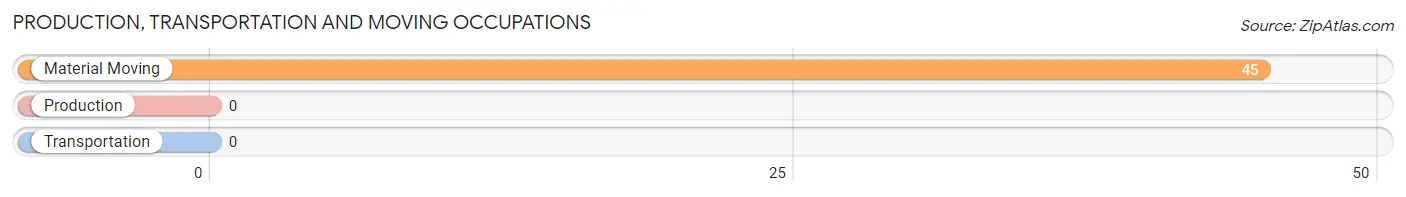
Production, Transportation and Moving Occupations by Sex
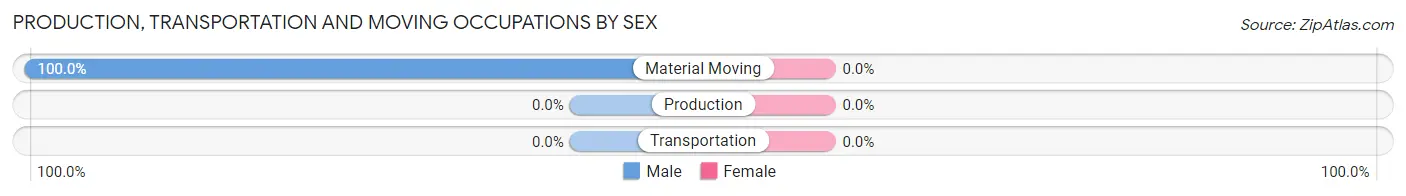
| Occupation | Male | Female |
| Production | 0 (0.0%) | 0 (0.0%) |
| Transportation | 0 (0.0%) | 0 (0.0%) |
| Material Moving | 45 (100.0%) | 0 (0.0%) |
| Total (Category) | 45 (100.0%) | 0 (0.0%) |
| Total (Overall) | 155 (41.8%) | 216 (58.2%) |
Employment Industries by Sex in Clyde
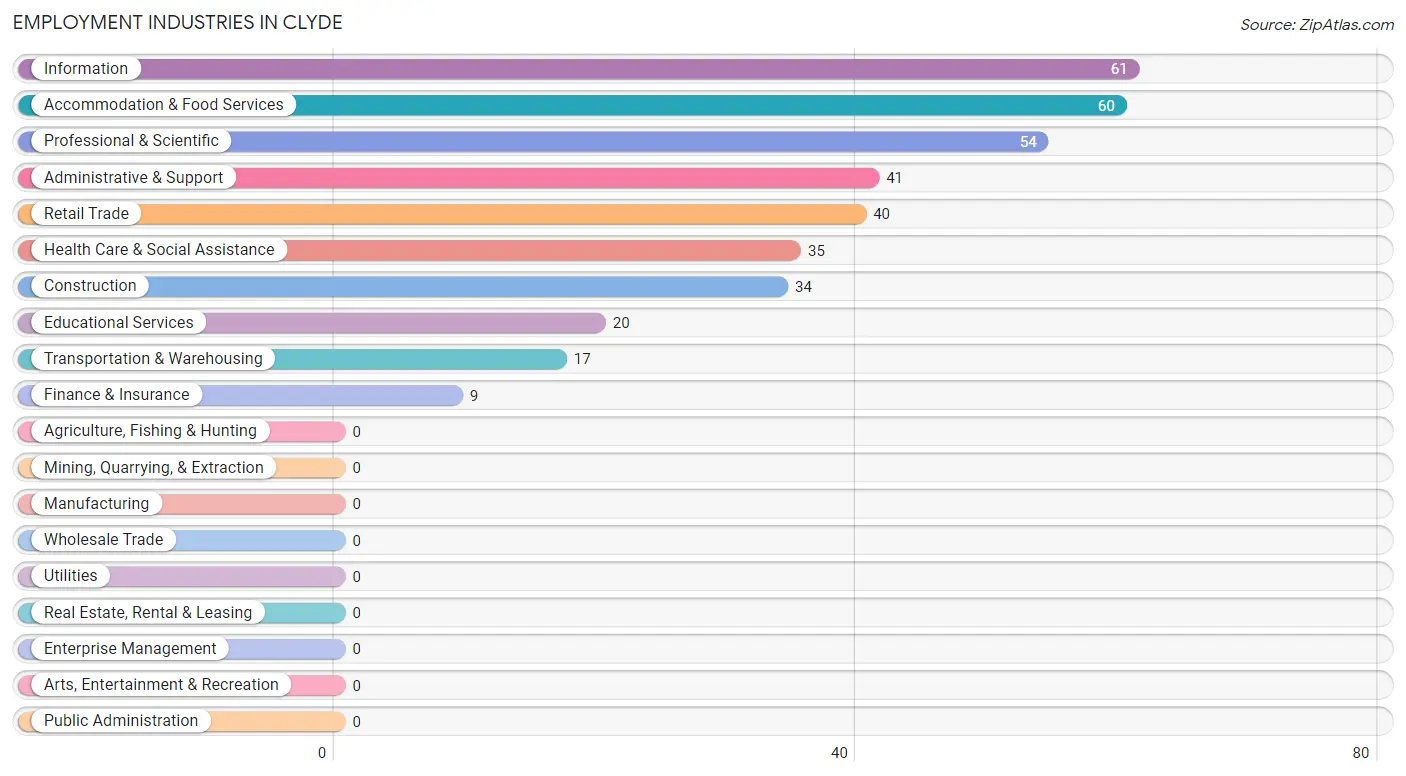
Employment Industries in Clyde
The major employment industries in Clyde include Information (61 | 16.4%), Accommodation & Food Services (60 | 16.2%), Professional & Scientific (54 | 14.6%), Administrative & Support (41 | 11.1%), and Retail Trade (40 | 10.8%).
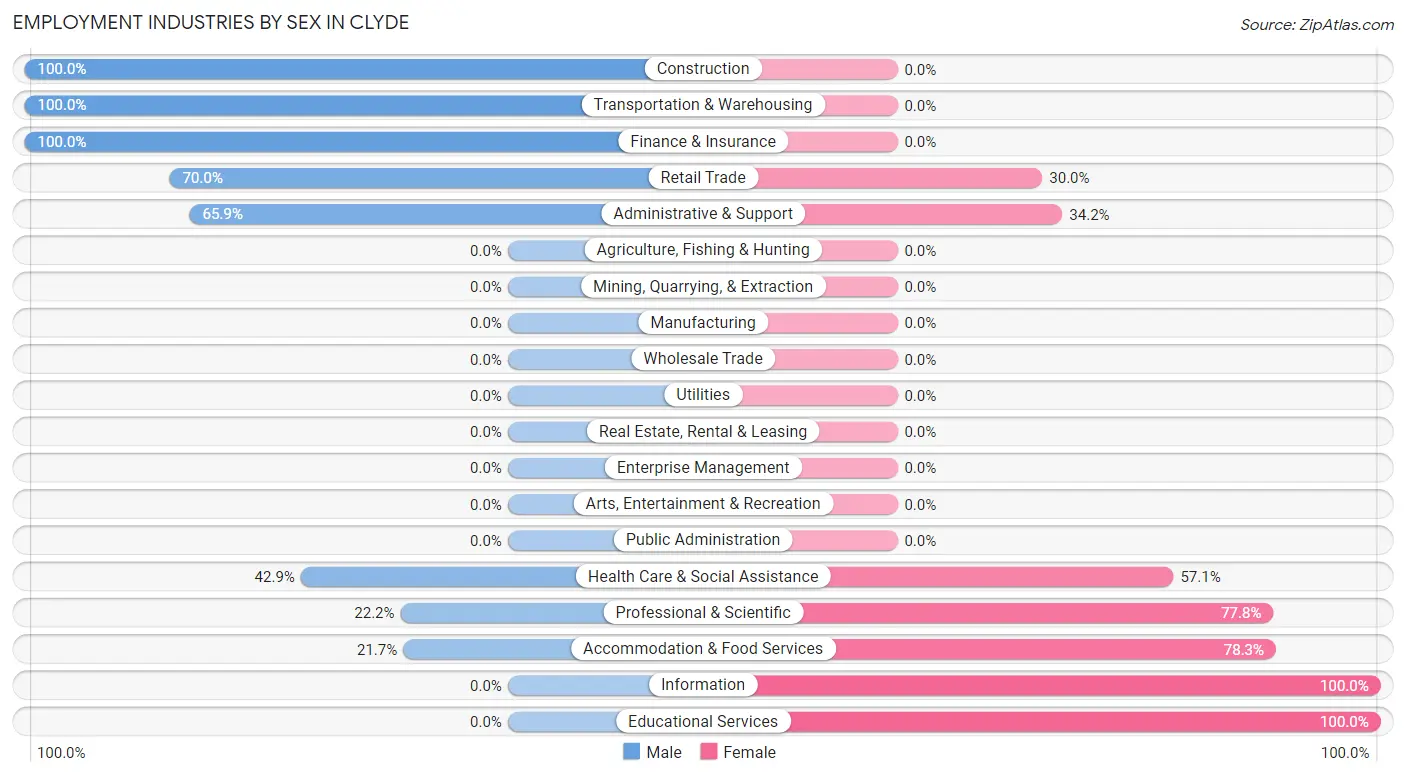
Employment Industries by Sex in Clyde
The Clyde industries that see more men than women are Construction (100.0%), Transportation & Warehousing (100.0%), and Finance & Insurance (100.0%), whereas the industries that tend to have a higher number of women are Information (100.0%), Educational Services (100.0%), and Accommodation & Food Services (78.3%).
| Industry | Male | Female |
| Agriculture, Fishing & Hunting | 0 (0.0%) | 0 (0.0%) |
| Mining, Quarrying, & Extraction | 0 (0.0%) | 0 (0.0%) |
| Construction | 34 (100.0%) | 0 (0.0%) |
| Manufacturing | 0 (0.0%) | 0 (0.0%) |
| Wholesale Trade | 0 (0.0%) | 0 (0.0%) |
| Retail Trade | 28 (70.0%) | 12 (30.0%) |
| Transportation & Warehousing | 17 (100.0%) | 0 (0.0%) |
| Utilities | 0 (0.0%) | 0 (0.0%) |
| Information | 0 (0.0%) | 61 (100.0%) |
| Finance & Insurance | 9 (100.0%) | 0 (0.0%) |
| Real Estate, Rental & Leasing | 0 (0.0%) | 0 (0.0%) |
| Professional & Scientific | 12 (22.2%) | 42 (77.8%) |
| Enterprise Management | 0 (0.0%) | 0 (0.0%) |
| Administrative & Support | 27 (65.8%) | 14 (34.2%) |
| Educational Services | 0 (0.0%) | 20 (100.0%) |
| Health Care & Social Assistance | 15 (42.9%) | 20 (57.1%) |
| Arts, Entertainment & Recreation | 0 (0.0%) | 0 (0.0%) |
| Accommodation & Food Services | 13 (21.7%) | 47 (78.3%) |
| Public Administration | 0 (0.0%) | 0 (0.0%) |
| Total | 155 (41.8%) | 216 (58.2%) |
Education in Clyde
School Enrollment in Clyde
The most common levels of schooling among the 77 students in Clyde are high school (36 | 46.8%), college / undergraduate (30 | 39.0%), and graduate / professional (11 | 14.3%).
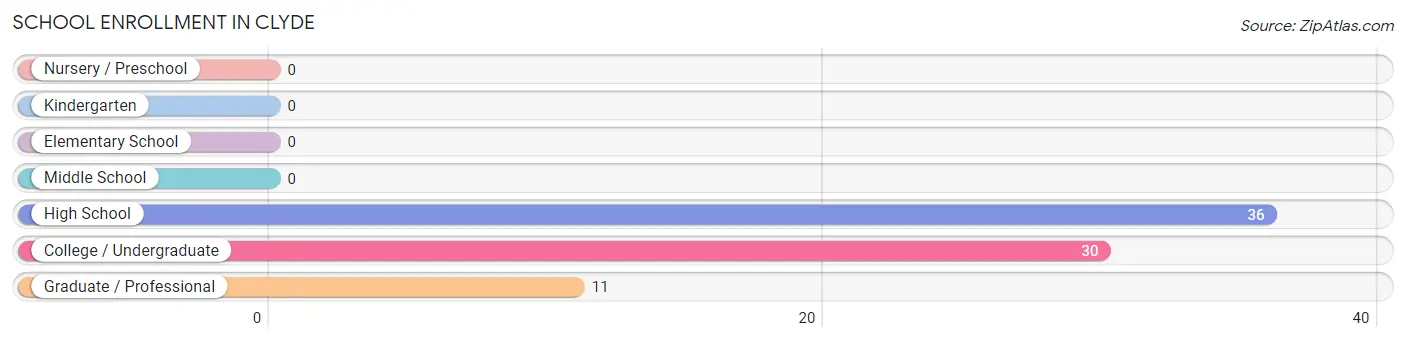
| School Level | # Students | % Students |
| Nursery / Preschool | 0 | 0.0% |
| Kindergarten | 0 | 0.0% |
| Elementary School | 0 | 0.0% |
| Middle School | 0 | 0.0% |
| High School | 36 | 46.8% |
| College / Undergraduate | 30 | 39.0% |
| Graduate / Professional | 11 | 14.3% |
| Total | 77 | 100.0% |
School Enrollment by Age by Funding Source in Clyde
Out of a total of 77 students who are enrolled in schools in Clyde, 8 (10.4%) attend a private institution, while the remaining 69 (89.6%) are enrolled in public schools. The age group of 25 to 34 year olds has the highest likelihood of being enrolled in private schools, with 8 (100.0% in the age bracket) enrolled. Conversely, the age group of 18 to 19 year olds has the lowest likelihood of being enrolled in a private school, with 36 (100.0% in the age bracket) attending a public institution.
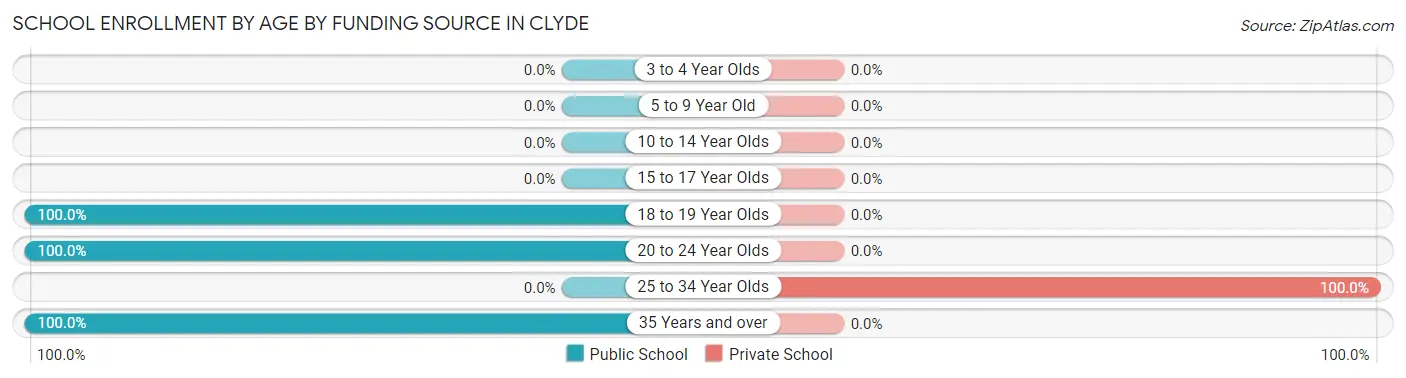
| Age Bracket | Public School | Private School |
| 3 to 4 Year Olds | 0 (0.0%) | 0 (0.0%) |
| 5 to 9 Year Old | 0 (0.0%) | 0 (0.0%) |
| 10 to 14 Year Olds | 0 (0.0%) | 0 (0.0%) |
| 15 to 17 Year Olds | 0 (0.0%) | 0 (0.0%) |
| 18 to 19 Year Olds | 36 (100.0%) | 0 (0.0%) |
| 20 to 24 Year Olds | 13 (100.0%) | 0 (0.0%) |
| 25 to 34 Year Olds | 0 (0.0%) | 8 (100.0%) |
| 35 Years and over | 20 (100.0%) | 0 (0.0%) |
| Total | 69 (89.6%) | 8 (10.4%) |
Educational Attainment by Field of Study in Clyde
Business (43 | 23.6%), science & technology (39 | 21.4%), bio, nature & agricultural (21 | 11.5%), visual & performing arts (14 | 7.7%), and physical & health sciences (13 | 7.1%) are the most common fields of study among 182 individuals in Clyde who have obtained a bachelor's degree or higher.
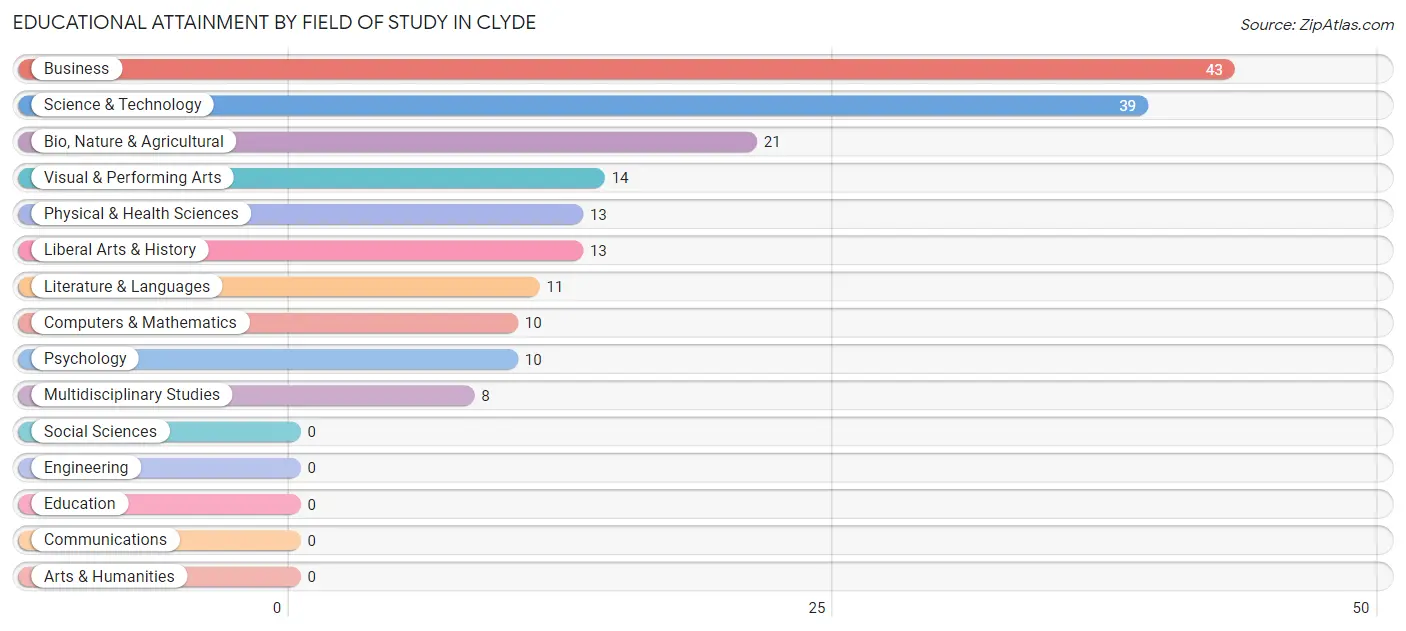
| Field of Study | # Graduates | % Graduates |
| Computers & Mathematics | 10 | 5.5% |
| Bio, Nature & Agricultural | 21 | 11.5% |
| Physical & Health Sciences | 13 | 7.1% |
| Psychology | 10 | 5.5% |
| Social Sciences | 0 | 0.0% |
| Engineering | 0 | 0.0% |
| Multidisciplinary Studies | 8 | 4.4% |
| Science & Technology | 39 | 21.4% |
| Business | 43 | 23.6% |
| Education | 0 | 0.0% |
| Literature & Languages | 11 | 6.0% |
| Liberal Arts & History | 13 | 7.1% |
| Visual & Performing Arts | 14 | 7.7% |
| Communications | 0 | 0.0% |
| Arts & Humanities | 0 | 0.0% |
| Total | 182 | 100.0% |
Transportation & Commute in Clyde
Vehicle Availability by Sex in Clyde
The most prevalent vehicle ownership categories in Clyde are males with 4 vehicles (70, accounting for 45.2%) and females with 4 vehicles (12, making up 37.2%).
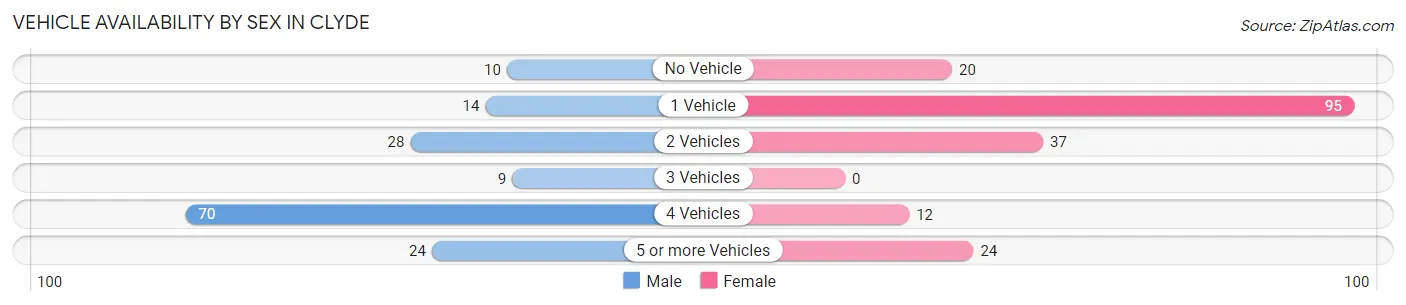
| Vehicles Available | Male | Female |
| No Vehicle | 10 (6.5%) | 20 (10.6%) |
| 1 Vehicle | 14 (9.0%) | 95 (50.5%) |
| 2 Vehicles | 28 (18.1%) | 37 (19.7%) |
| 3 Vehicles | 9 (5.8%) | 0 (0.0%) |
| 4 Vehicles | 70 (45.2%) | 12 (6.4%) |
| 5 or more Vehicles | 24 (15.5%) | 24 (12.8%) |
| Total | 155 (100.0%) | 188 (100.0%) |
Commute Time in Clyde
The most frequently occuring commute durations in Clyde are 45 to 59 minutes (74 commuters, 24.5%), 40 to 44 minutes (63 commuters, 20.9%), and 15 to 19 minutes (44 commuters, 14.6%).
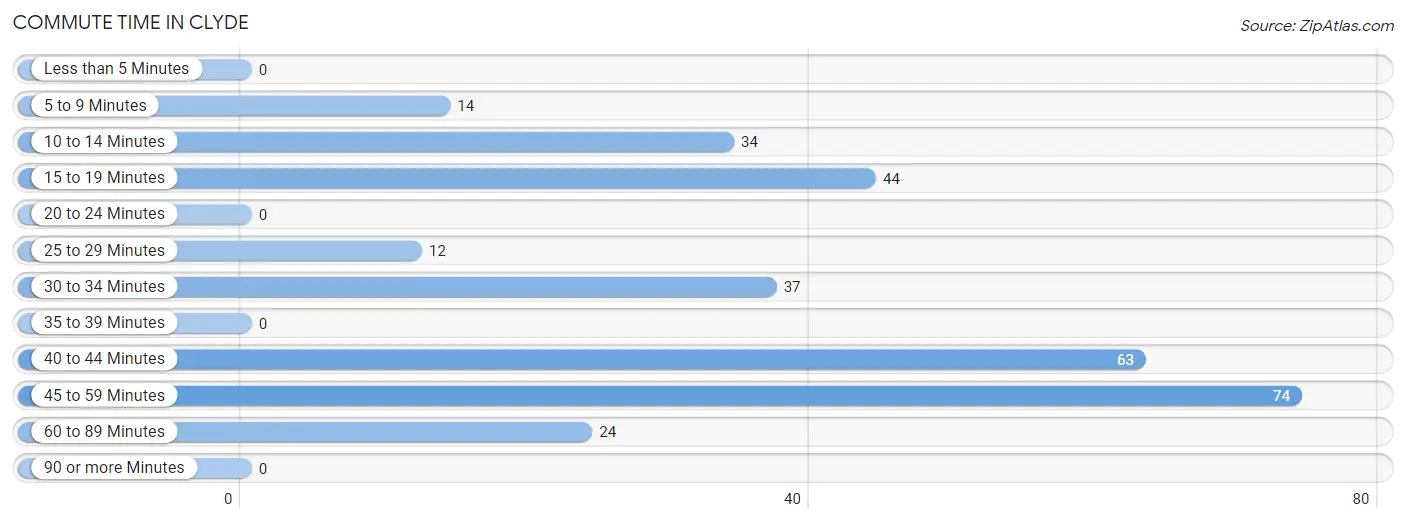
| Commute Time | # Commuters | % Commuters |
| Less than 5 Minutes | 0 | 0.0% |
| 5 to 9 Minutes | 14 | 4.6% |
| 10 to 14 Minutes | 34 | 11.3% |
| 15 to 19 Minutes | 44 | 14.6% |
| 20 to 24 Minutes | 0 | 0.0% |
| 25 to 29 Minutes | 12 | 4.0% |
| 30 to 34 Minutes | 37 | 12.2% |
| 35 to 39 Minutes | 0 | 0.0% |
| 40 to 44 Minutes | 63 | 20.9% |
| 45 to 59 Minutes | 74 | 24.5% |
| 60 to 89 Minutes | 24 | 8.0% |
| 90 or more Minutes | 0 | 0.0% |
Commute Time by Sex in Clyde
The most common commute times in Clyde are 40 to 44 minutes (63 commuters, 40.6%) for males and 45 to 59 minutes (39 commuters, 26.5%) for females.
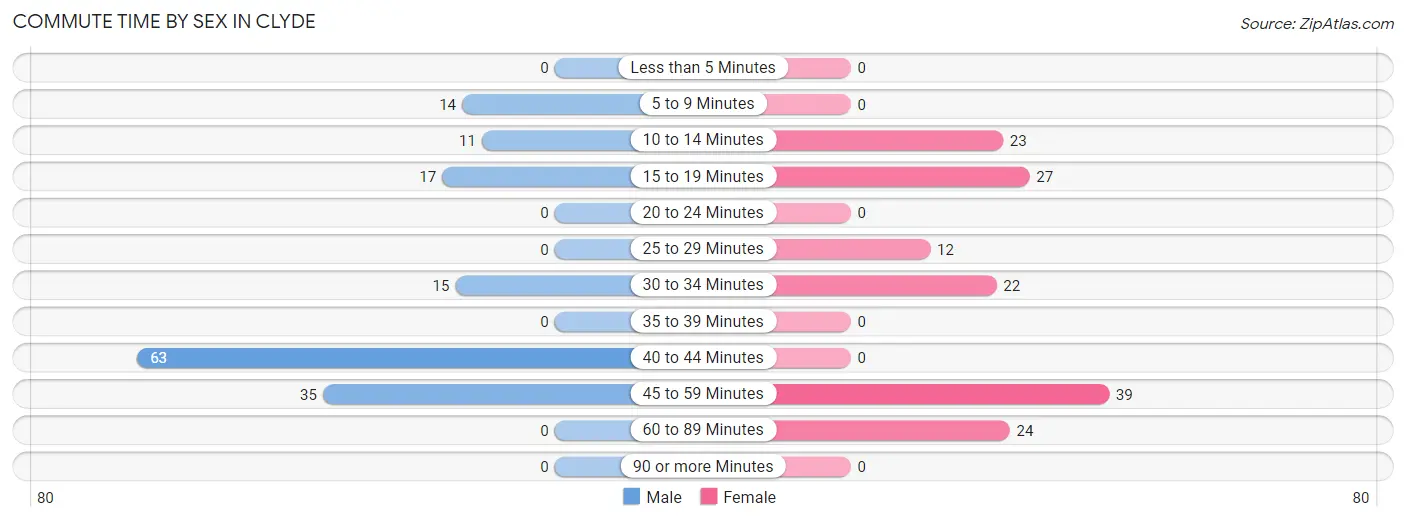
| Commute Time | Male | Female |
| Less than 5 Minutes | 0 (0.0%) | 0 (0.0%) |
| 5 to 9 Minutes | 14 (9.0%) | 0 (0.0%) |
| 10 to 14 Minutes | 11 (7.1%) | 23 (15.7%) |
| 15 to 19 Minutes | 17 (11.0%) | 27 (18.4%) |
| 20 to 24 Minutes | 0 (0.0%) | 0 (0.0%) |
| 25 to 29 Minutes | 0 (0.0%) | 12 (8.2%) |
| 30 to 34 Minutes | 15 (9.7%) | 22 (15.0%) |
| 35 to 39 Minutes | 0 (0.0%) | 0 (0.0%) |
| 40 to 44 Minutes | 63 (40.6%) | 0 (0.0%) |
| 45 to 59 Minutes | 35 (22.6%) | 39 (26.5%) |
| 60 to 89 Minutes | 0 (0.0%) | 24 (16.3%) |
| 90 or more Minutes | 0 (0.0%) | 0 (0.0%) |
Time of Departure to Work by Sex in Clyde
The most frequent times of departure to work in Clyde are 12:00 AM to 4:59 AM (50, 32.3%) for males and 9:00 AM to 9:59 AM (39, 26.5%) for females.
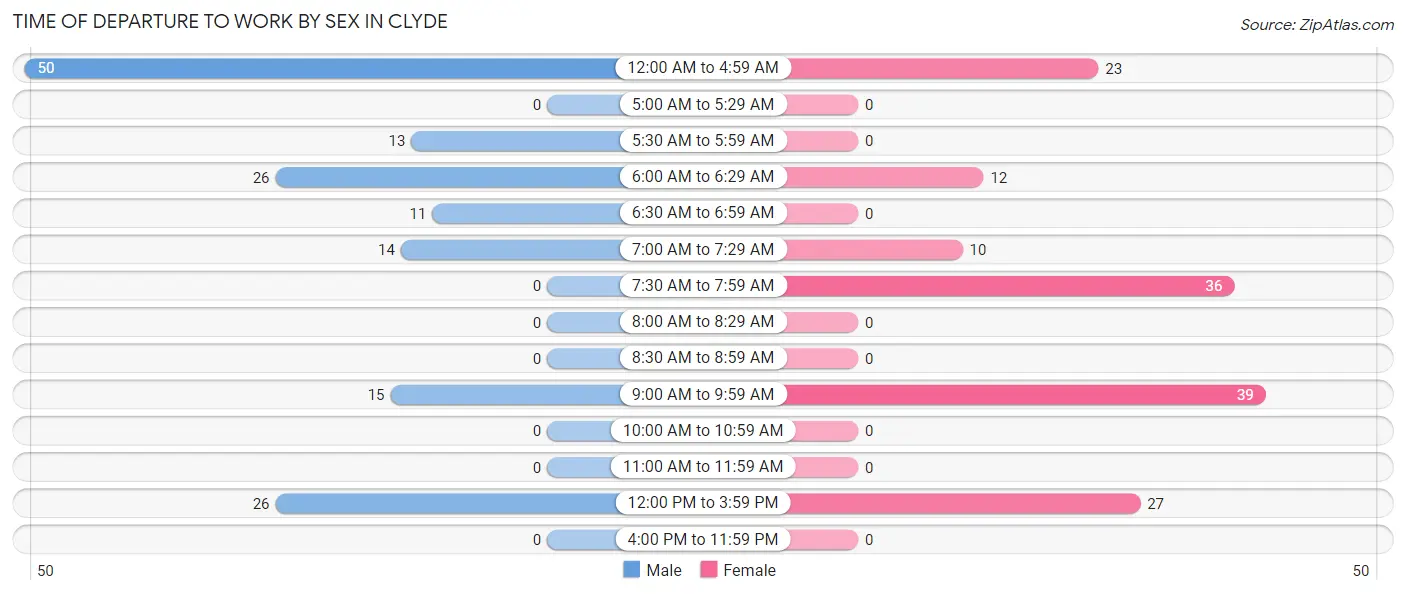
| Time of Departure | Male | Female |
| 12:00 AM to 4:59 AM | 50 (32.3%) | 23 (15.7%) |
| 5:00 AM to 5:29 AM | 0 (0.0%) | 0 (0.0%) |
| 5:30 AM to 5:59 AM | 13 (8.4%) | 0 (0.0%) |
| 6:00 AM to 6:29 AM | 26 (16.8%) | 12 (8.2%) |
| 6:30 AM to 6:59 AM | 11 (7.1%) | 0 (0.0%) |
| 7:00 AM to 7:29 AM | 14 (9.0%) | 10 (6.8%) |
| 7:30 AM to 7:59 AM | 0 (0.0%) | 36 (24.5%) |
| 8:00 AM to 8:29 AM | 0 (0.0%) | 0 (0.0%) |
| 8:30 AM to 8:59 AM | 0 (0.0%) | 0 (0.0%) |
| 9:00 AM to 9:59 AM | 15 (9.7%) | 39 (26.5%) |
| 10:00 AM to 10:59 AM | 0 (0.0%) | 0 (0.0%) |
| 11:00 AM to 11:59 AM | 0 (0.0%) | 0 (0.0%) |
| 12:00 PM to 3:59 PM | 26 (16.8%) | 27 (18.4%) |
| 4:00 PM to 11:59 PM | 0 (0.0%) | 0 (0.0%) |
| Total | 155 (100.0%) | 147 (100.0%) |
Housing Occupancy in Clyde
Occupancy by Ownership in Clyde
Of the total 288 dwellings in Clyde, owner-occupied units account for 241 (83.7%), while renter-occupied units make up 47 (16.3%).
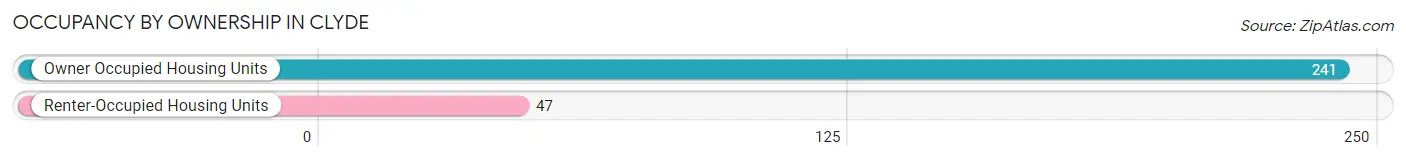
| Occupancy | # Housing Units | % Housing Units |
| Owner Occupied Housing Units | 241 | 83.7% |
| Renter-Occupied Housing Units | 47 | 16.3% |
| Total Occupied Housing Units | 288 | 100.0% |
Occupancy by Household Size in Clyde
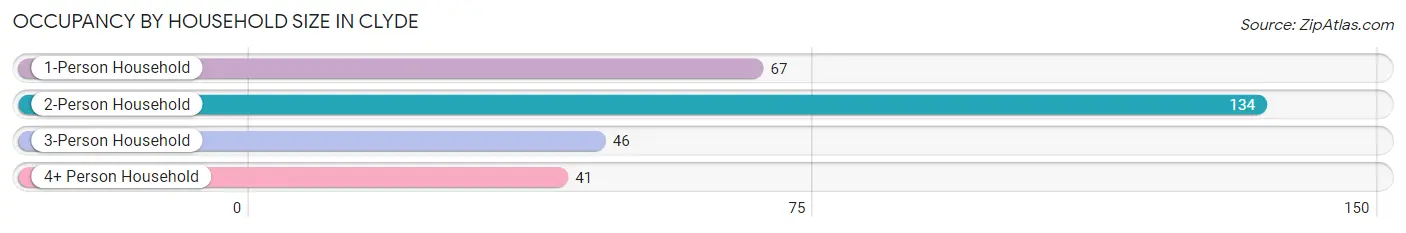
| Household Size | # Housing Units | % Housing Units |
| 1-Person Household | 67 | 23.3% |
| 2-Person Household | 134 | 46.5% |
| 3-Person Household | 46 | 16.0% |
| 4+ Person Household | 41 | 14.2% |
| Total Housing Units | 288 | 100.0% |
Occupancy by Ownership by Household Size in Clyde
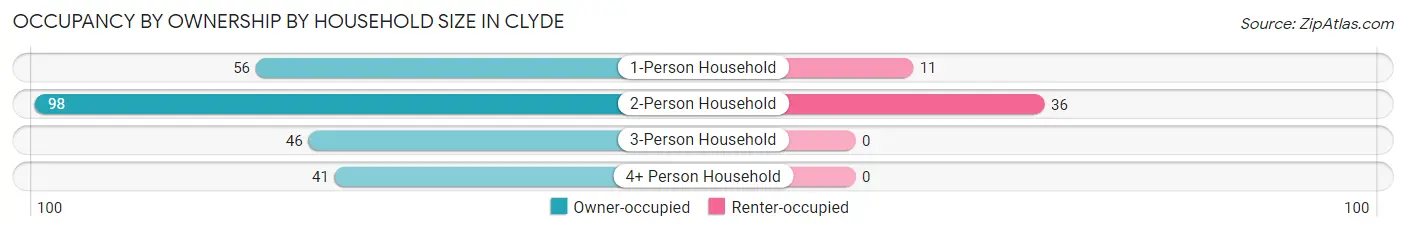
| Household Size | Owner-occupied | Renter-occupied |
| 1-Person Household | 56 (83.6%) | 11 (16.4%) |
| 2-Person Household | 98 (73.1%) | 36 (26.9%) |
| 3-Person Household | 46 (100.0%) | 0 (0.0%) |
| 4+ Person Household | 41 (100.0%) | 0 (0.0%) |
| Total Housing Units | 241 (83.7%) | 47 (16.3%) |
Occupancy by Educational Attainment in Clyde
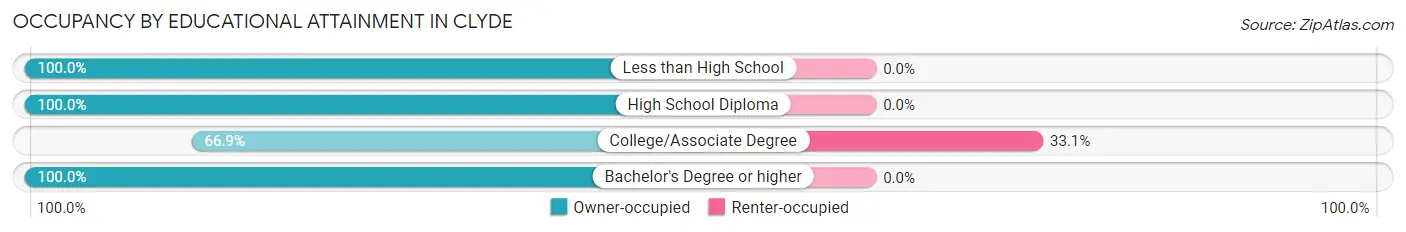
| Household Size | Owner-occupied | Renter-occupied |
| Less than High School | 12 (100.0%) | 0 (0.0%) |
| High School Diploma | 49 (100.0%) | 0 (0.0%) |
| College/Associate Degree | 95 (66.9%) | 47 (33.1%) |
| Bachelor's Degree or higher | 85 (100.0%) | 0 (0.0%) |
Occupancy by Age of Householder in Clyde
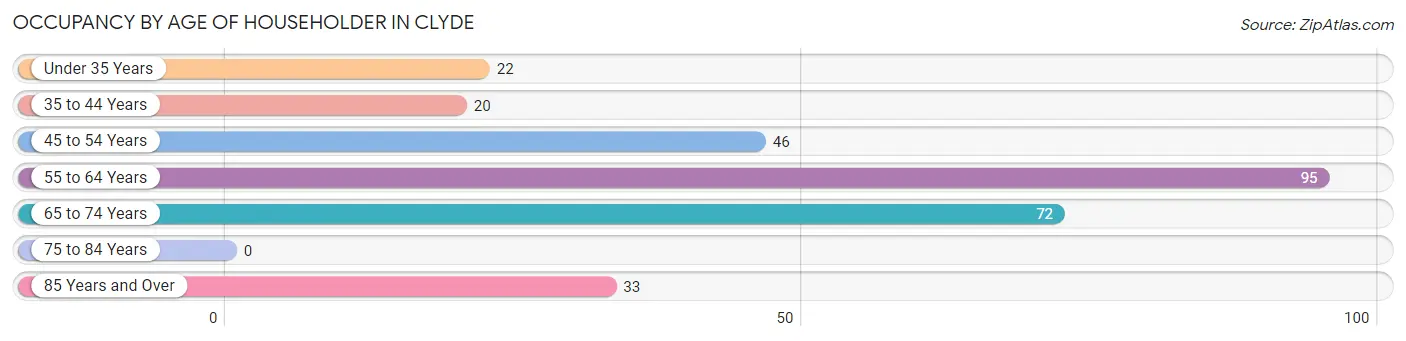
| Age Bracket | # Households | % Households |
| Under 35 Years | 22 | 7.6% |
| 35 to 44 Years | 20 | 6.9% |
| 45 to 54 Years | 46 | 16.0% |
| 55 to 64 Years | 95 | 33.0% |
| 65 to 74 Years | 72 | 25.0% |
| 75 to 84 Years | 0 | 0.0% |
| 85 Years and Over | 33 | 11.5% |
| Total | 288 | 100.0% |
Housing Finances in Clyde
Median Income by Occupancy in Clyde
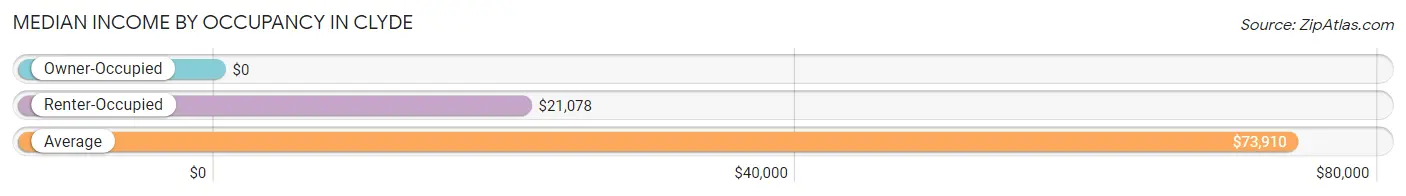
| Occupancy Type | # Households | Median Income |
| Owner-Occupied | 241 (83.7%) | $0 |
| Renter-Occupied | 47 (16.3%) | $21,078 |
| Average | 288 (100.0%) | $73,910 |
Occupancy by Householder Income Bracket in Clyde
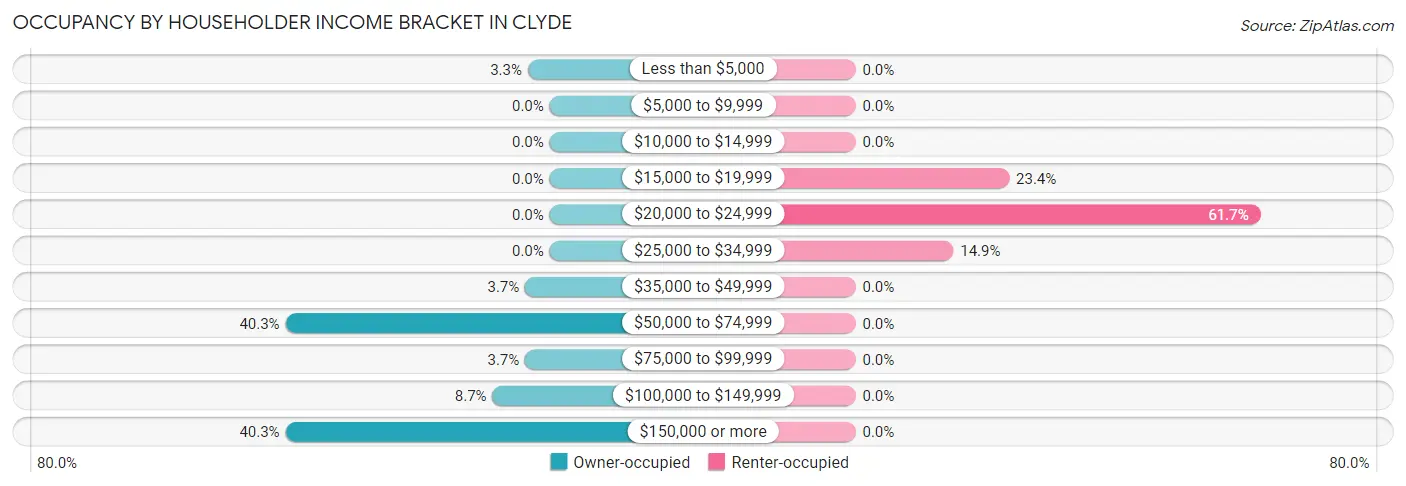
| Income Bracket | Owner-occupied | Renter-occupied |
| Less than $5,000 | 8 (3.3%) | 0 (0.0%) |
| $5,000 to $9,999 | 0 (0.0%) | 0 (0.0%) |
| $10,000 to $14,999 | 0 (0.0%) | 0 (0.0%) |
| $15,000 to $19,999 | 0 (0.0%) | 11 (23.4%) |
| $20,000 to $24,999 | 0 (0.0%) | 29 (61.7%) |
| $25,000 to $34,999 | 0 (0.0%) | 7 (14.9%) |
| $35,000 to $49,999 | 9 (3.7%) | 0 (0.0%) |
| $50,000 to $74,999 | 97 (40.3%) | 0 (0.0%) |
| $75,000 to $99,999 | 9 (3.7%) | 0 (0.0%) |
| $100,000 to $149,999 | 21 (8.7%) | 0 (0.0%) |
| $150,000 or more | 97 (40.3%) | 0 (0.0%) |
| Total | 241 (100.0%) | 47 (100.0%) |
Monthly Housing Cost Tiers in Clyde
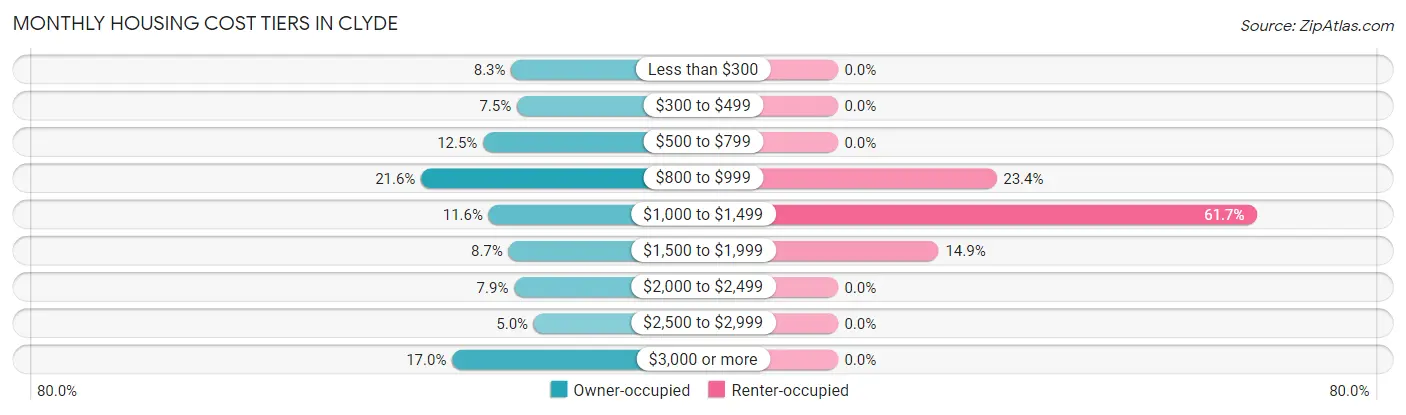
| Monthly Cost | Owner-occupied | Renter-occupied |
| Less than $300 | 20 (8.3%) | 0 (0.0%) |
| $300 to $499 | 18 (7.5%) | 0 (0.0%) |
| $500 to $799 | 30 (12.4%) | 0 (0.0%) |
| $800 to $999 | 52 (21.6%) | 11 (23.4%) |
| $1,000 to $1,499 | 28 (11.6%) | 29 (61.7%) |
| $1,500 to $1,999 | 21 (8.7%) | 7 (14.9%) |
| $2,000 to $2,499 | 19 (7.9%) | 0 (0.0%) |
| $2,500 to $2,999 | 12 (5.0%) | 0 (0.0%) |
| $3,000 or more | 41 (17.0%) | 0 (0.0%) |
| Total | 241 (100.0%) | 47 (100.0%) |
Physical Housing Characteristics in Clyde
Housing Structures in Clyde
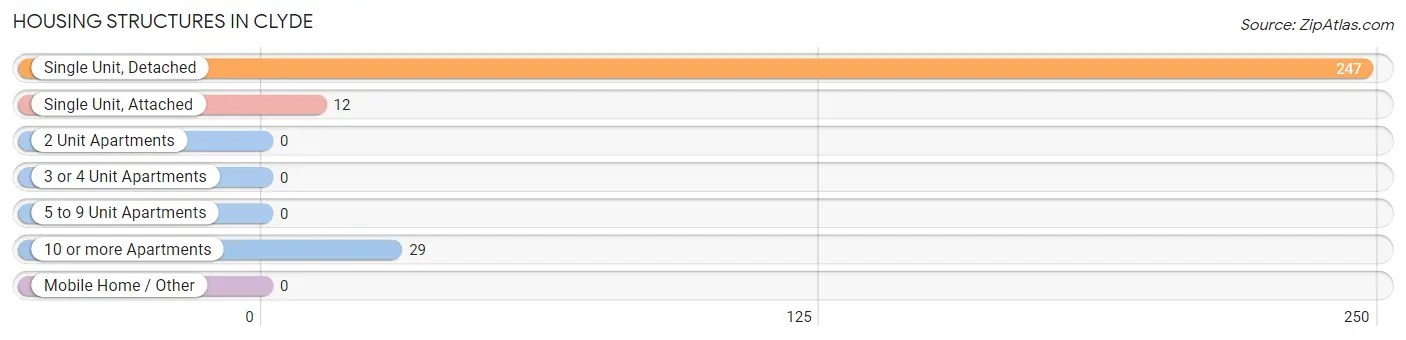
| Structure Type | # Housing Units | % Housing Units |
| Single Unit, Detached | 247 | 85.8% |
| Single Unit, Attached | 12 | 4.2% |
| 2 Unit Apartments | 0 | 0.0% |
| 3 or 4 Unit Apartments | 0 | 0.0% |
| 5 to 9 Unit Apartments | 0 | 0.0% |
| 10 or more Apartments | 29 | 10.1% |
| Mobile Home / Other | 0 | 0.0% |
| Total | 288 | 100.0% |
Housing Structures by Occupancy in Clyde
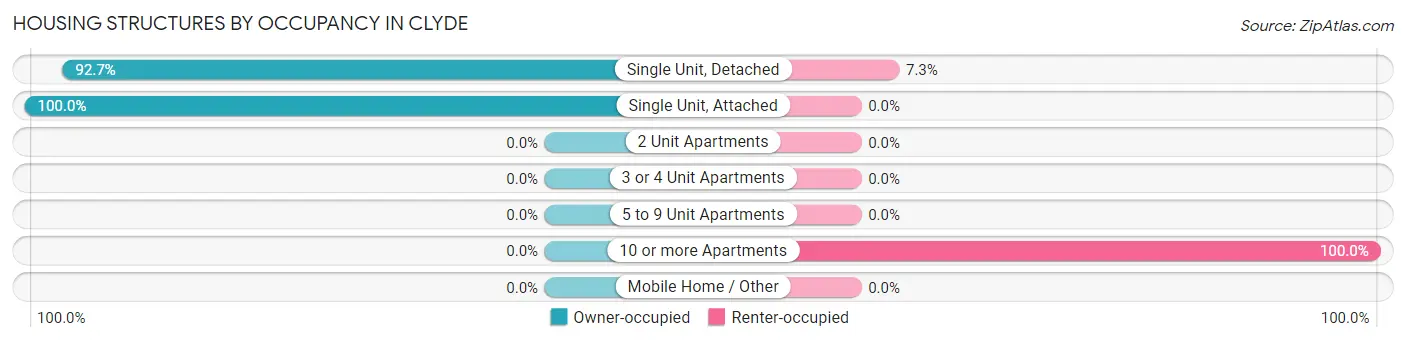
| Structure Type | Owner-occupied | Renter-occupied |
| Single Unit, Detached | 229 (92.7%) | 18 (7.3%) |
| Single Unit, Attached | 12 (100.0%) | 0 (0.0%) |
| 2 Unit Apartments | 0 (0.0%) | 0 (0.0%) |
| 3 or 4 Unit Apartments | 0 (0.0%) | 0 (0.0%) |
| 5 to 9 Unit Apartments | 0 (0.0%) | 0 (0.0%) |
| 10 or more Apartments | 0 (0.0%) | 29 (100.0%) |
| Mobile Home / Other | 0 (0.0%) | 0 (0.0%) |
| Total | 241 (83.7%) | 47 (16.3%) |
Housing Structures by Number of Rooms in Clyde
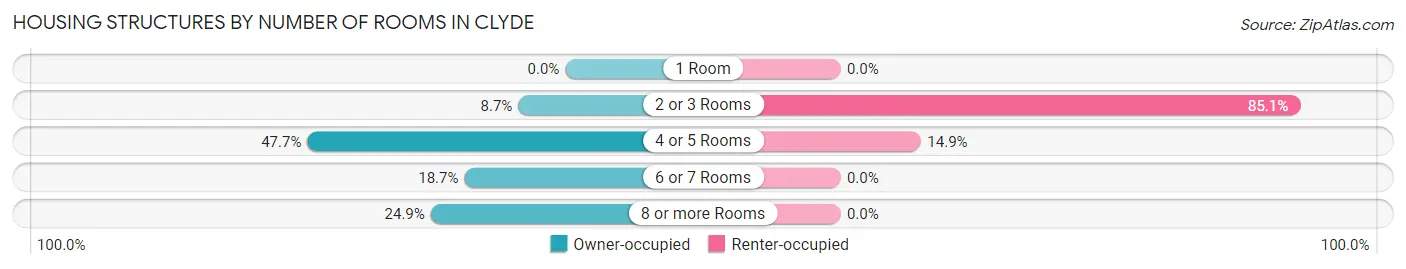
| Number of Rooms | Owner-occupied | Renter-occupied |
| 1 Room | 0 (0.0%) | 0 (0.0%) |
| 2 or 3 Rooms | 21 (8.7%) | 40 (85.1%) |
| 4 or 5 Rooms | 115 (47.7%) | 7 (14.9%) |
| 6 or 7 Rooms | 45 (18.7%) | 0 (0.0%) |
| 8 or more Rooms | 60 (24.9%) | 0 (0.0%) |
| Total | 241 (100.0%) | 47 (100.0%) |
Housing Structure by Heating Type in Clyde
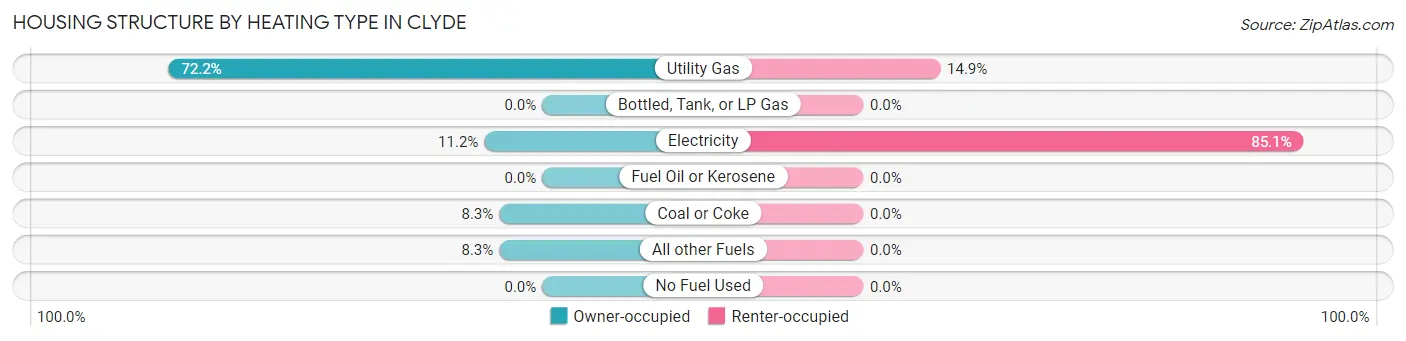
| Heating Type | Owner-occupied | Renter-occupied |
| Utility Gas | 174 (72.2%) | 7 (14.9%) |
| Bottled, Tank, or LP Gas | 0 (0.0%) | 0 (0.0%) |
| Electricity | 27 (11.2%) | 40 (85.1%) |
| Fuel Oil or Kerosene | 0 (0.0%) | 0 (0.0%) |
| Coal or Coke | 20 (8.3%) | 0 (0.0%) |
| All other Fuels | 20 (8.3%) | 0 (0.0%) |
| No Fuel Used | 0 (0.0%) | 0 (0.0%) |
| Total | 241 (100.0%) | 47 (100.0%) |
Household Vehicle Usage in Clyde
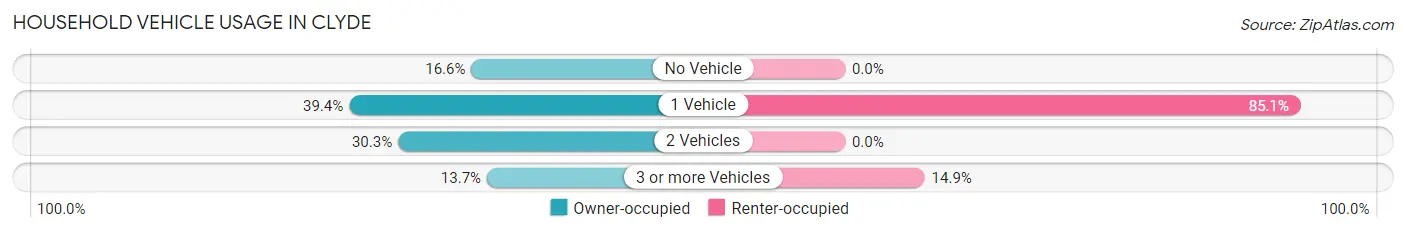
| Vehicles per Household | Owner-occupied | Renter-occupied |
| No Vehicle | 40 (16.6%) | 0 (0.0%) |
| 1 Vehicle | 95 (39.4%) | 40 (85.1%) |
| 2 Vehicles | 73 (30.3%) | 0 (0.0%) |
| 3 or more Vehicles | 33 (13.7%) | 7 (14.9%) |
| Total | 241 (100.0%) | 47 (100.0%) |
Real Estate & Mortgages in Clyde
Real Estate and Mortgage Overview in Clyde
| Characteristic | Without Mortgage | With Mortgage |
| Housing Units | 133 | 108 |
| Median Property Value | $594,600 | $640,600 |
| Median Household Income | $73,558 | $62 |
| Monthly Housing Costs | $693 | $41 |
| Real Estate Taxes | $2,596 | $0 |
Property Value by Mortgage Status in Clyde
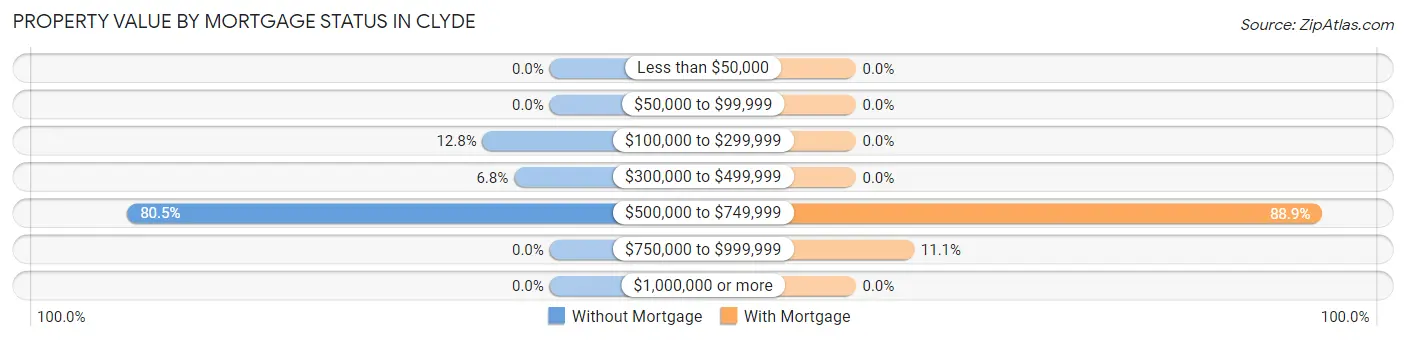
| Property Value | Without Mortgage | With Mortgage |
| Less than $50,000 | 0 (0.0%) | 0 (0.0%) |
| $50,000 to $99,999 | 0 (0.0%) | 0 (0.0%) |
| $100,000 to $299,999 | 17 (12.8%) | 0 (0.0%) |
| $300,000 to $499,999 | 9 (6.8%) | 0 (0.0%) |
| $500,000 to $749,999 | 107 (80.4%) | 96 (88.9%) |
| $750,000 to $999,999 | 0 (0.0%) | 12 (11.1%) |
| $1,000,000 or more | 0 (0.0%) | 0 (0.0%) |
| Total | 133 (100.0%) | 108 (100.0%) |
Household Income by Mortgage Status in Clyde
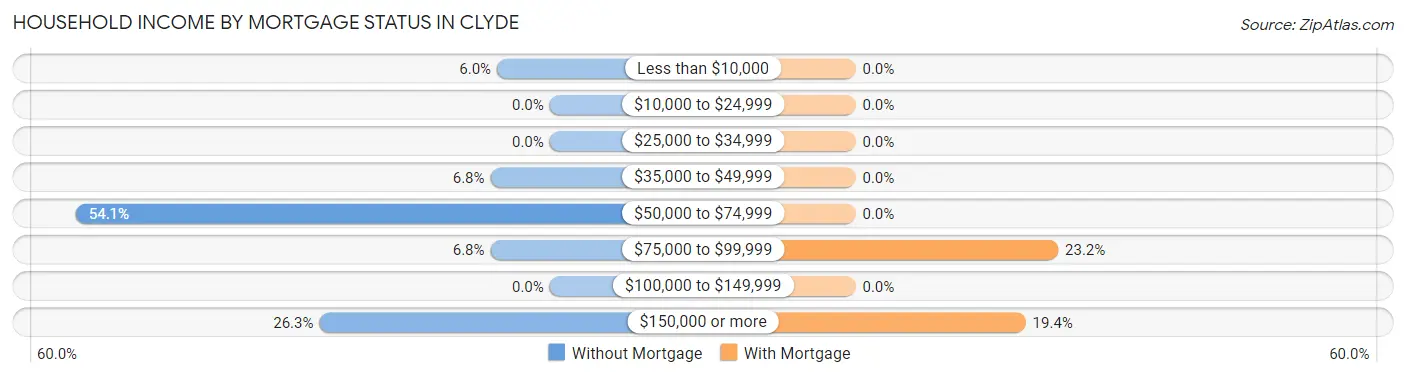
| Household Income | Without Mortgage | With Mortgage |
| Less than $10,000 | 8 (6.0%) | 0 (0.0%) |
| $10,000 to $24,999 | 0 (0.0%) | 0 (0.0%) |
| $25,000 to $34,999 | 0 (0.0%) | 0 (0.0%) |
| $35,000 to $49,999 | 9 (6.8%) | 0 (0.0%) |
| $50,000 to $74,999 | 72 (54.1%) | 0 (0.0%) |
| $75,000 to $99,999 | 9 (6.8%) | 25 (23.2%) |
| $100,000 to $149,999 | 0 (0.0%) | 0 (0.0%) |
| $150,000 or more | 35 (26.3%) | 21 (19.4%) |
| Total | 133 (100.0%) | 108 (100.0%) |
Property Value to Household Income Ratio in Clyde
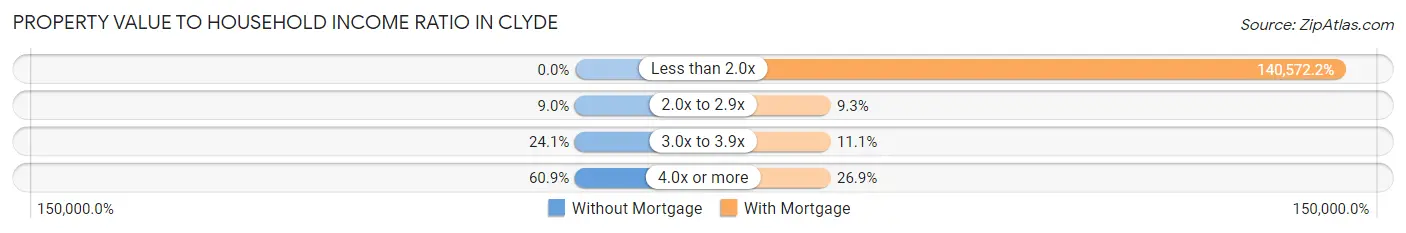
| Value-to-Income Ratio | Without Mortgage | With Mortgage |
| Less than 2.0x | 0 (0.0%) | 151,818 (140,572.2%) |
| 2.0x to 2.9x | 12 (9.0%) | 10 (9.3%) |
| 3.0x to 3.9x | 32 (24.1%) | 12 (11.1%) |
| 4.0x or more | 81 (60.9%) | 29 (26.9%) |
| Total | 133 (100.0%) | 108 (100.0%) |
Real Estate Taxes by Mortgage Status in Clyde
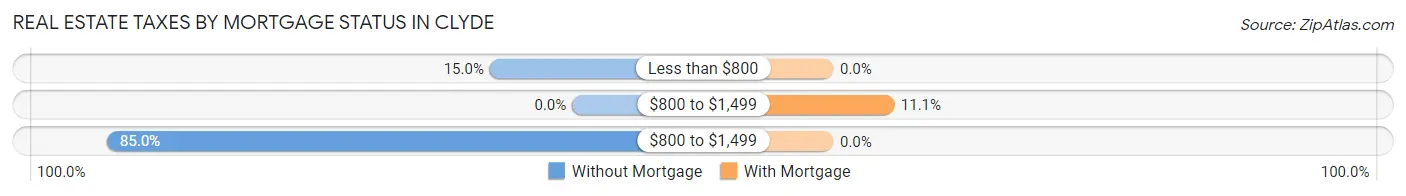
| Property Taxes | Without Mortgage | With Mortgage |
| Less than $800 | 20 (15.0%) | 0 (0.0%) |
| $800 to $1,499 | 0 (0.0%) | 12 (11.1%) |
| $800 to $1,499 | 113 (85.0%) | 0 (0.0%) |
| Total | 133 (100.0%) | 108 (100.0%) |
Health & Disability in Clyde
Health Insurance Coverage by Age in Clyde
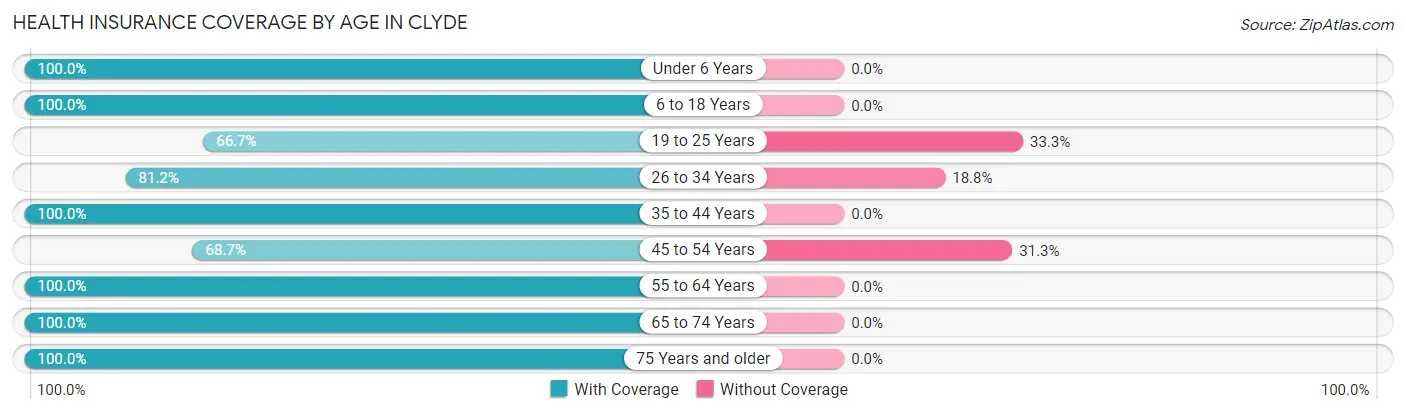
| Age Bracket | With Coverage | Without Coverage |
| Under 6 Years | 53 (100.0%) | 0 (0.0%) |
| 6 to 18 Years | 36 (100.0%) | 0 (0.0%) |
| 19 to 25 Years | 40 (66.7%) | 20 (33.3%) |
| 26 to 34 Years | 112 (81.2%) | 26 (18.8%) |
| 35 to 44 Years | 36 (100.0%) | 0 (0.0%) |
| 45 to 54 Years | 46 (68.7%) | 21 (31.3%) |
| 55 to 64 Years | 162 (100.0%) | 0 (0.0%) |
| 65 to 74 Years | 84 (100.0%) | 0 (0.0%) |
| 75 Years and older | 85 (100.0%) | 0 (0.0%) |
| Total | 654 (90.7%) | 67 (9.3%) |
Health Insurance Coverage by Citizenship Status in Clyde
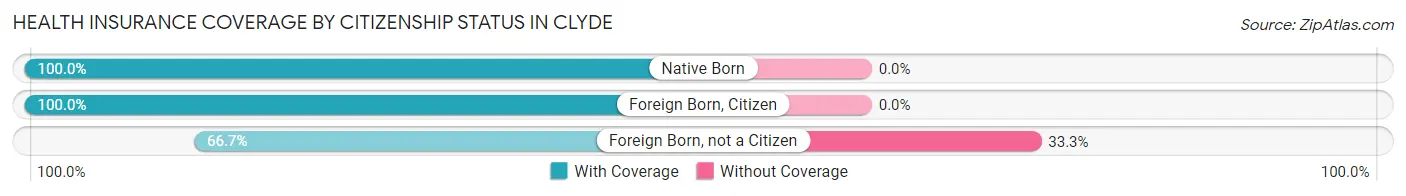
| Citizenship Status | With Coverage | Without Coverage |
| Native Born | 53 (100.0%) | 0 (0.0%) |
| Foreign Born, Citizen | 36 (100.0%) | 0 (0.0%) |
| Foreign Born, not a Citizen | 40 (66.7%) | 20 (33.3%) |
Health Insurance Coverage by Household Income in Clyde
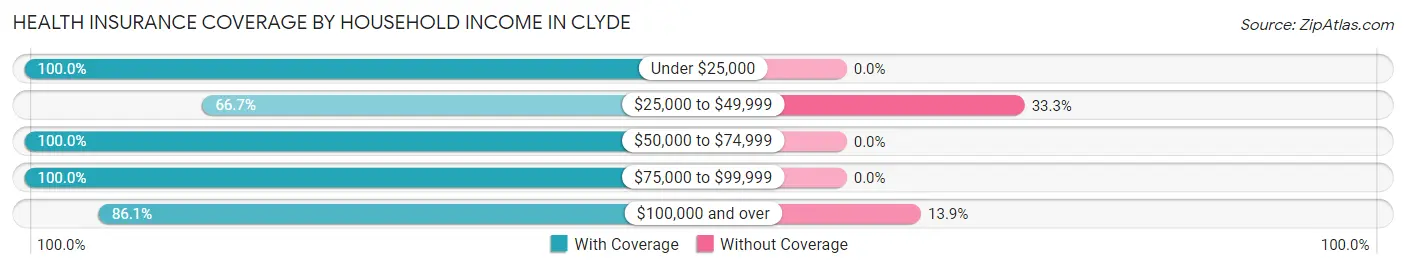
| Household Income | With Coverage | Without Coverage |
| Under $25,000 | 84 (100.0%) | 0 (0.0%) |
| $25,000 to $49,999 | 16 (66.7%) | 8 (33.3%) |
| $50,000 to $74,999 | 180 (100.0%) | 0 (0.0%) |
| $75,000 to $99,999 | 9 (100.0%) | 0 (0.0%) |
| $100,000 and over | 365 (86.1%) | 59 (13.9%) |
Public vs Private Health Insurance Coverage by Age in Clyde
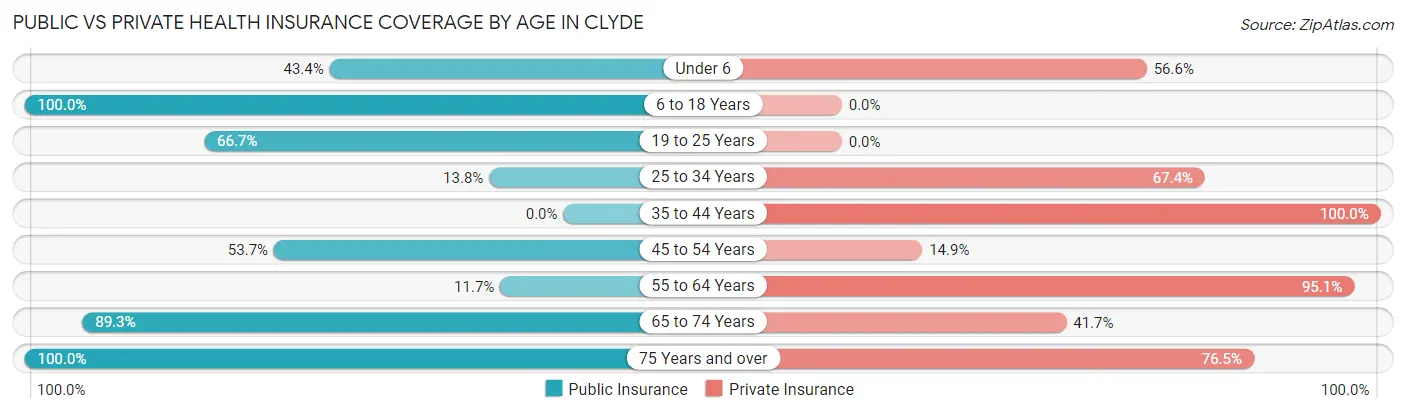
| Age Bracket | Public Insurance | Private Insurance |
| Under 6 | 23 (43.4%) | 30 (56.6%) |
| 6 to 18 Years | 36 (100.0%) | 0 (0.0%) |
| 19 to 25 Years | 40 (66.7%) | 0 (0.0%) |
| 25 to 34 Years | 19 (13.8%) | 93 (67.4%) |
| 35 to 44 Years | 0 (0.0%) | 36 (100.0%) |
| 45 to 54 Years | 36 (53.7%) | 10 (14.9%) |
| 55 to 64 Years | 19 (11.7%) | 154 (95.1%) |
| 65 to 74 Years | 75 (89.3%) | 35 (41.7%) |
| 75 Years and over | 85 (100.0%) | 65 (76.5%) |
| Total | 333 (46.2%) | 423 (58.7%) |
Disability Status by Sex by Age in Clyde
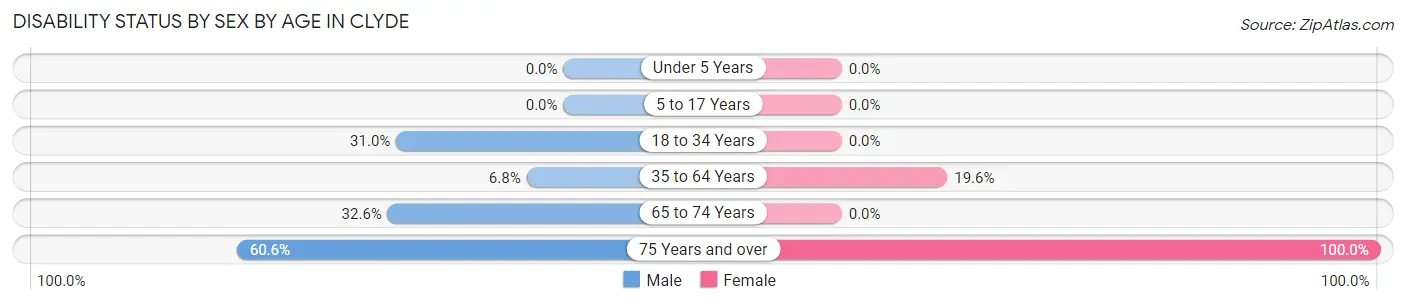
| Age Bracket | Male | Female |
| Under 5 Years | 0 (0.0%) | 0 (0.0%) |
| 5 to 17 Years | 0 (0.0%) | 0 (0.0%) |
| 18 to 34 Years | 36 (31.0%) | 0 (0.0%) |
| 35 to 64 Years | 8 (6.8%) | 29 (19.6%) |
| 65 to 74 Years | 15 (32.6%) | 0 (0.0%) |
| 75 Years and over | 20 (60.6%) | 52 (100.0%) |
Disability Class by Sex by Age in Clyde
Disability Class: Hearing Difficulty
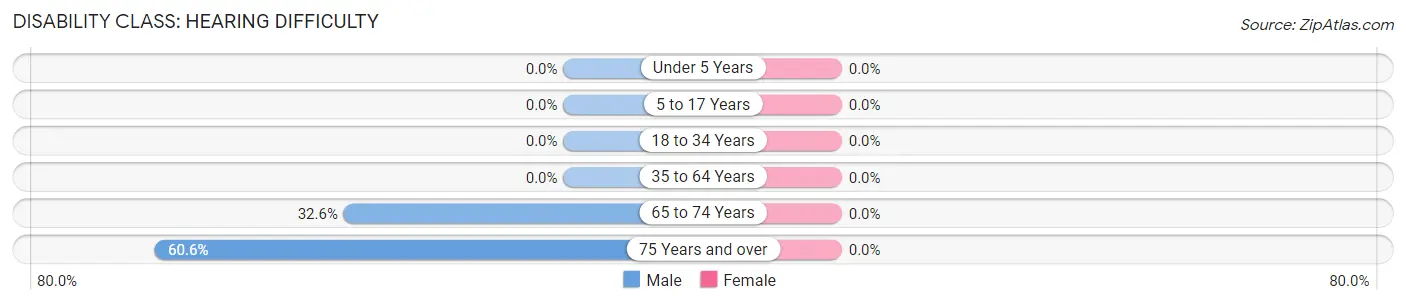
| Age Bracket | Male | Female |
| Under 5 Years | 0 (0.0%) | 0 (0.0%) |
| 5 to 17 Years | 0 (0.0%) | 0 (0.0%) |
| 18 to 34 Years | 0 (0.0%) | 0 (0.0%) |
| 35 to 64 Years | 0 (0.0%) | 0 (0.0%) |
| 65 to 74 Years | 15 (32.6%) | 0 (0.0%) |
| 75 Years and over | 20 (60.6%) | 0 (0.0%) |
Disability Class: Vision Difficulty
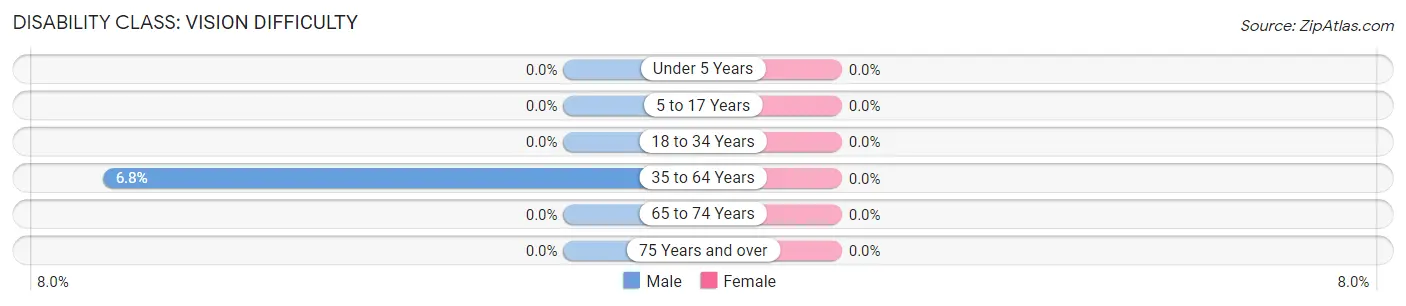
| Age Bracket | Male | Female |
| Under 5 Years | 0 (0.0%) | 0 (0.0%) |
| 5 to 17 Years | 0 (0.0%) | 0 (0.0%) |
| 18 to 34 Years | 0 (0.0%) | 0 (0.0%) |
| 35 to 64 Years | 8 (6.8%) | 0 (0.0%) |
| 65 to 74 Years | 0 (0.0%) | 0 (0.0%) |
| 75 Years and over | 0 (0.0%) | 0 (0.0%) |
Disability Class: Cognitive Difficulty
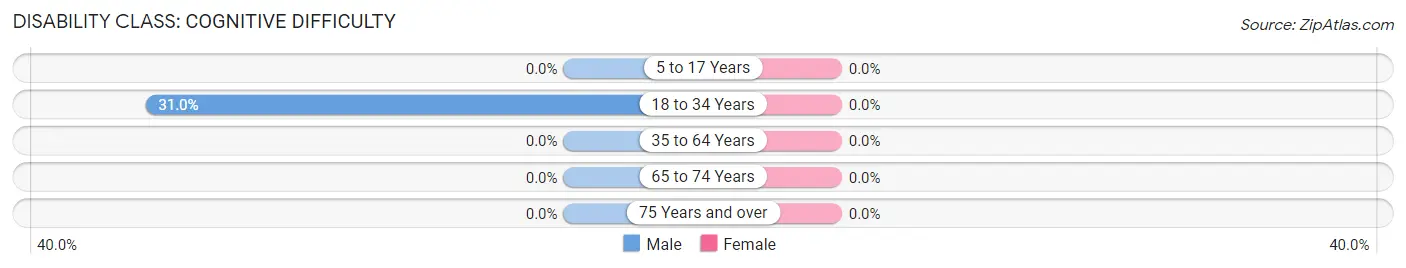
| Age Bracket | Male | Female |
| 5 to 17 Years | 0 (0.0%) | 0 (0.0%) |
| 18 to 34 Years | 36 (31.0%) | 0 (0.0%) |
| 35 to 64 Years | 0 (0.0%) | 0 (0.0%) |
| 65 to 74 Years | 0 (0.0%) | 0 (0.0%) |
| 75 Years and over | 0 (0.0%) | 0 (0.0%) |
Disability Class: Ambulatory Difficulty
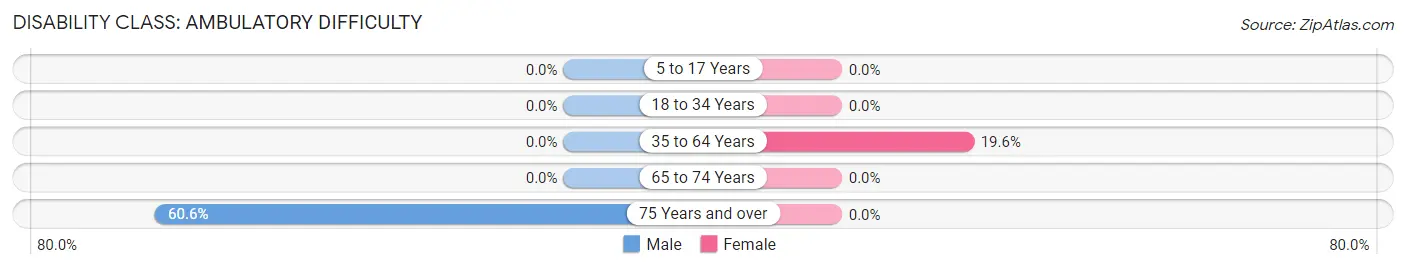
| Age Bracket | Male | Female |
| 5 to 17 Years | 0 (0.0%) | 0 (0.0%) |
| 18 to 34 Years | 0 (0.0%) | 0 (0.0%) |
| 35 to 64 Years | 0 (0.0%) | 29 (19.6%) |
| 65 to 74 Years | 0 (0.0%) | 0 (0.0%) |
| 75 Years and over | 20 (60.6%) | 0 (0.0%) |
Disability Class: Self-Care Difficulty
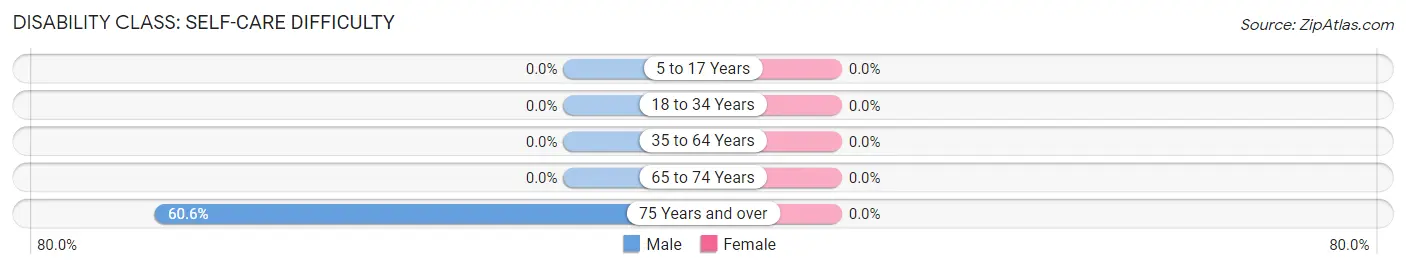
| Age Bracket | Male | Female |
| 5 to 17 Years | 0 (0.0%) | 0 (0.0%) |
| 18 to 34 Years | 0 (0.0%) | 0 (0.0%) |
| 35 to 64 Years | 0 (0.0%) | 0 (0.0%) |
| 65 to 74 Years | 0 (0.0%) | 0 (0.0%) |
| 75 Years and over | 20 (60.6%) | 0 (0.0%) |
Technology Access in Clyde
Computing Device Access in Clyde
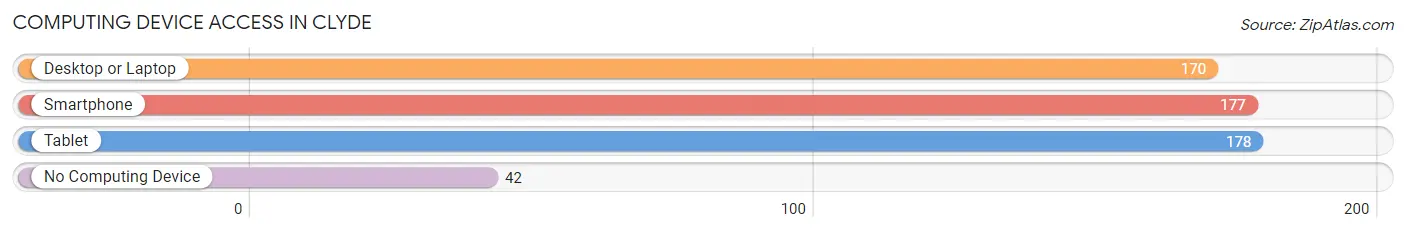
| Device Type | # Households | % Households |
| Desktop or Laptop | 170 | 59.0% |
| Smartphone | 177 | 61.5% |
| Tablet | 178 | 61.8% |
| No Computing Device | 42 | 14.6% |
| Total | 288 | 100.0% |
Internet Access in Clyde
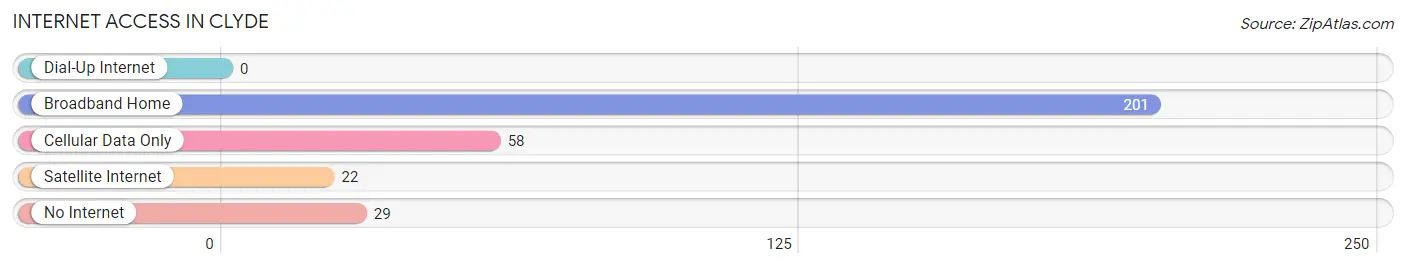
| Internet Type | # Households | % Households |
| Dial-Up Internet | 0 | 0.0% |
| Broadband Home | 201 | 69.8% |
| Cellular Data Only | 58 | 20.1% |
| Satellite Internet | 22 | 7.6% |
| No Internet | 29 | 10.1% |
| Total | 288 | 100.0% |
Clyde Summary
Clyde is a small unincorporated community located in the San Benito County of California. It is situated in the foothills of the Gabilan Mountains, approximately 8 miles east of Hollister. The population of Clyde was estimated to be around 1,000 in 2000.
History
Clyde was founded in 1868 by a group of settlers from the East Coast. The town was named after a local rancher, Clyde Smith. The town was originally a farming community, with the main crops being wheat, barley, and oats. In the late 19th century, the town began to grow as a result of the railroad coming through the area. The railroad brought in new businesses and industries, such as a flour mill, a brickyard, and a lumber mill.
In the early 20th century, Clyde became a popular tourist destination due to its proximity to the San Benito River. The town was also known for its hot springs, which were believed to have healing properties.
Geography
Clyde is located in the San Benito County of California. It is situated in the foothills of the Gabilan Mountains, approximately 8 miles east of Hollister. The town is surrounded by rolling hills and open fields. The climate in Clyde is mild, with temperatures ranging from the mid-50s to the mid-80s.
Economy
Clyde’s economy is largely based on agriculture. The main crops grown in the area are wheat, barley, oats, and hay. The town also has a few small businesses, such as a gas station, a grocery store, and a few restaurants.
Demographics
As of 2000, the population of Clyde was estimated to be around 1,000. The racial makeup of the town was 94.2% White, 0.7% African American, 0.3% Native American, 0.7% Asian, 0.1% Pacific Islander, and 3.9% from other races. The median household income was $41,250, and the median family income was $45,000. The per capita income was $17,000. The unemployment rate was 5.2%.
Common Questions
What is Per Capita Income in Clyde?
Per Capita income in Clyde is $51,916.
What is the Median Family Income in Clyde?
Median Family Income in Clyde is $94,792.
What is the Median Household income in Clyde?
Median Household Income in Clyde is $73,910.
What is Income or Wage Gap in Clyde?
Income or Wage Gap in Clyde is 24.5%.
Women in Clyde earn 75.5 cents for every dollar earned by a man.
What is Inequality or Gini Index in Clyde?
Inequality or Gini Index in Clyde is 0.45.
What is the Total Population of Clyde?
Total Population of Clyde is 721.
What is the Total Male Population of Clyde?
Total Male Population of Clyde is 346.
What is the Total Female Population of Clyde?
Total Female Population of Clyde is 375.
What is the Ratio of Males per 100 Females in Clyde?
There are 92.27 Males per 100 Females in Clyde.
What is the Ratio of Females per 100 Males in Clyde?
There are 108.38 Females per 100 Males in Clyde.
What is the Median Population Age in Clyde?
Median Population Age in Clyde is 51.2 Years.
What is the Average Family Size in Clyde
Average Family Size in Clyde is 2.7 People.
What is the Average Household Size in Clyde
Average Household Size in Clyde is 2.5 People.
How Large is the Labor Force in Clyde?
There are 393 People in the Labor Forcein in Clyde.
What is the Percentage of People in the Labor Force in Clyde?
58.8% of People are in the Labor Force in Clyde.
What is the Unemployment Rate in Clyde?
Unemployment Rate in Clyde is 5.6%.