Clarksburg, CA Map & Demographics
Clarksburg Map
Clarksburg Overview
$54,746
PER CAPITA INCOME
0.37
INEQUALITY / GINI INDEX
302
TOTAL POPULATION
163
MALE POPULATION
139
FEMALE POPULATION
117.27
MALES / 100 FEMALES
85.28
FEMALES / 100 MALES
51.3
MEDIAN AGE
2.6
AVG FAMILY SIZE
2.3
AVG HOUSEHOLD SIZE
258
LABOR FORCE [ PEOPLE ]
98.1%
PERCENT IN LABOR FORCE
19.8%
UNEMPLOYMENT RATE
Clarksburg Zip Codes
Clarksburg Area Codes
Income in Clarksburg
Income Overview in Clarksburg
| Characteristic | Number | Measure |
| Per Capita Income | 302 | $54,746 |
| Median Family Income | 108 | $0 |
| Mean Family Income | 108 | $149,619 |
| Median Household Income | 129 | $0 |
| Mean Household Income | 129 | $131,636 |
| Income Deficit | 108 | $0 |
| Wage / Income Gap (%) | 302 | 0.00% |
| Wage / Income Gap ($) | 302 | 100.00¢ per $1 |
| Gini / Inequality Index | 302 | 0.37 |
Earnings by Sex in Clarksburg
| Sex | Number | Average Earnings |
| Male | 139 (59.4%) | $0 |
| Female | 95 (40.6%) | $0 |
| Total | 234 (100.0%) | $0 |
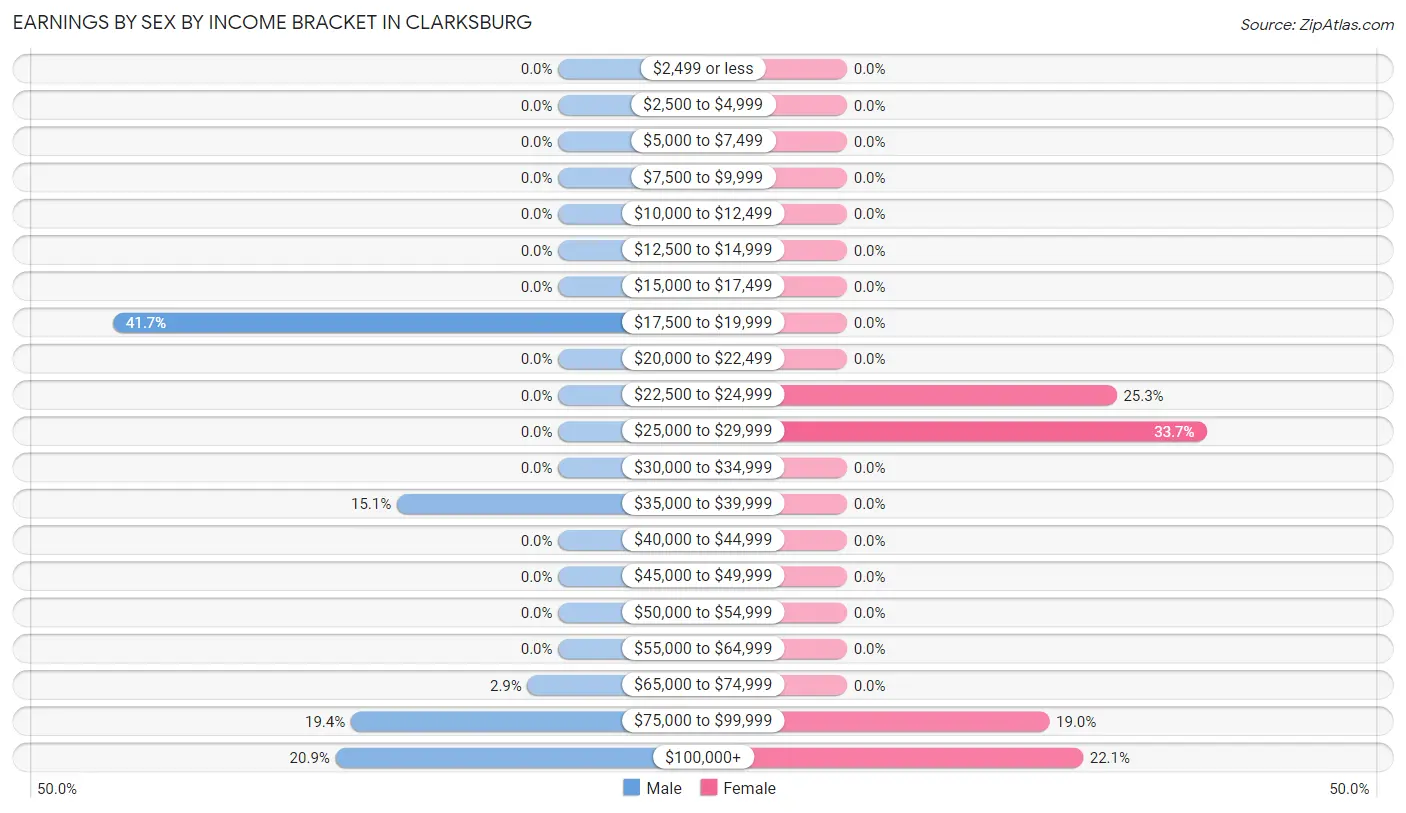
Earnings by Sex by Income Bracket in Clarksburg
The most common earnings brackets in Clarksburg are $17,500 to $19,999 for men (58 | 41.7%) and $25,000 to $29,999 for women (32 | 33.7%).
| Income | Male | Female |
| $2,499 or less | 0 (0.0%) | 0 (0.0%) |
| $2,500 to $4,999 | 0 (0.0%) | 0 (0.0%) |
| $5,000 to $7,499 | 0 (0.0%) | 0 (0.0%) |
| $7,500 to $9,999 | 0 (0.0%) | 0 (0.0%) |
| $10,000 to $12,499 | 0 (0.0%) | 0 (0.0%) |
| $12,500 to $14,999 | 0 (0.0%) | 0 (0.0%) |
| $15,000 to $17,499 | 0 (0.0%) | 0 (0.0%) |
| $17,500 to $19,999 | 58 (41.7%) | 0 (0.0%) |
| $20,000 to $22,499 | 0 (0.0%) | 0 (0.0%) |
| $22,500 to $24,999 | 0 (0.0%) | 24 (25.3%) |
| $25,000 to $29,999 | 0 (0.0%) | 32 (33.7%) |
| $30,000 to $34,999 | 0 (0.0%) | 0 (0.0%) |
| $35,000 to $39,999 | 21 (15.1%) | 0 (0.0%) |
| $40,000 to $44,999 | 0 (0.0%) | 0 (0.0%) |
| $45,000 to $49,999 | 0 (0.0%) | 0 (0.0%) |
| $50,000 to $54,999 | 0 (0.0%) | 0 (0.0%) |
| $55,000 to $64,999 | 0 (0.0%) | 0 (0.0%) |
| $65,000 to $74,999 | 4 (2.9%) | 0 (0.0%) |
| $75,000 to $99,999 | 27 (19.4%) | 18 (19.0%) |
| $100,000+ | 29 (20.9%) | 21 (22.1%) |
| Total | 139 (100.0%) | 95 (100.0%) |
Earnings by Sex by Educational Attainment in Clarksburg
| Educational Attainment | Male Income | Female Income |
| Less than High School | - | - |
| High School Diploma | - | - |
| College or Associate's Degree | - | - |
| Bachelor's Degree | - | - |
| Graduate Degree | - | - |
| Total | $81,435 | $0 |
Family Income in Clarksburg
Family Income Brackets in Clarksburg
According to the Clarksburg family income data, there are 48 families falling into the $200,000+ income range, which is the most common income bracket and makes up 44.4% of all families.
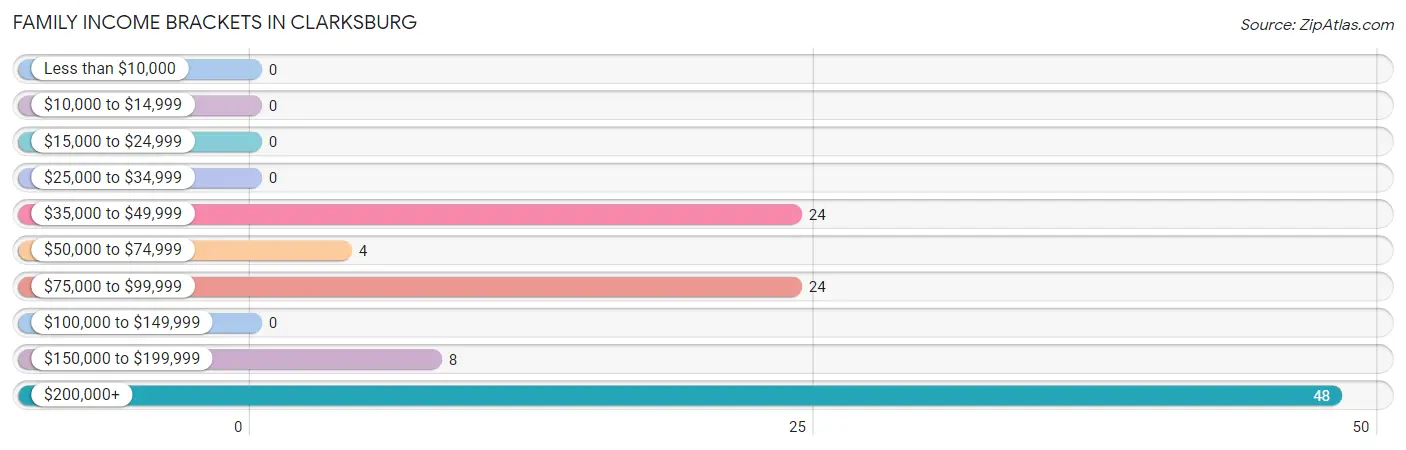
| Income Bracket | # Families | % Families |
| Less than $10,000 | 0 | 0.0% |
| $10,000 to $14,999 | 0 | 0.0% |
| $15,000 to $24,999 | 0 | 0.0% |
| $25,000 to $34,999 | 0 | 0.0% |
| $35,000 to $49,999 | 24 | 22.2% |
| $50,000 to $74,999 | 4 | 3.7% |
| $75,000 to $99,999 | 24 | 22.2% |
| $100,000 to $149,999 | 0 | 0.0% |
| $150,000 to $199,999 | 8 | 7.4% |
| $200,000+ | 48 | 44.4% |
Family Income by Famaliy Size in Clarksburg
| Income Bracket | # Families | Median Income |
| 2-Person Families | 81 (75.0%) | $0 |
| 3-Person Families | 0 (0.0%) | $0 |
| 4-Person Families | 27 (25.0%) | $0 |
| 5-Person Families | 0 (0.0%) | $0 |
| 6-Person Families | 0 (0.0%) | $0 |
| 7+ Person Families | 0 (0.0%) | $0 |
| Total | 108 (100.0%) | $0 |
Family Income by Number of Earners in Clarksburg
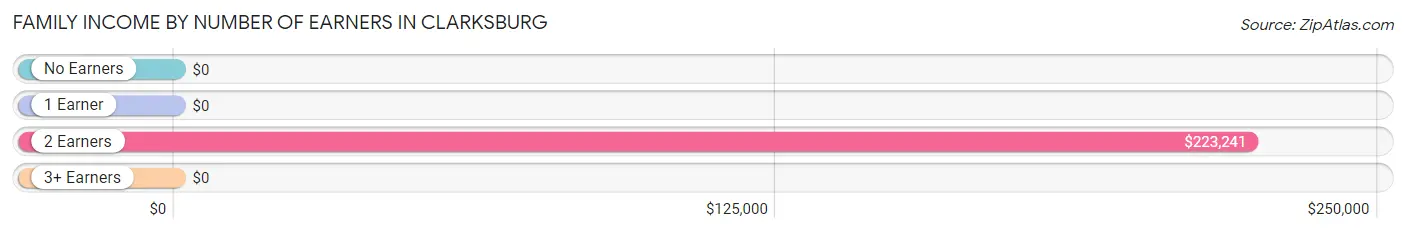
| Number of Earners | # Families | Median Income |
| No Earners | 0 (0.0%) | $0 |
| 1 Earner | 28 (25.9%) | $0 |
| 2 Earners | 80 (74.1%) | $223,241 |
| 3+ Earners | 0 (0.0%) | $0 |
| Total | 108 (100.0%) | $0 |
Household Income in Clarksburg
Household Income Brackets in Clarksburg
With 48 households falling in the category, the $200,000+ income range is the most frequent in Clarksburg, accounting for 37.2% of all households.
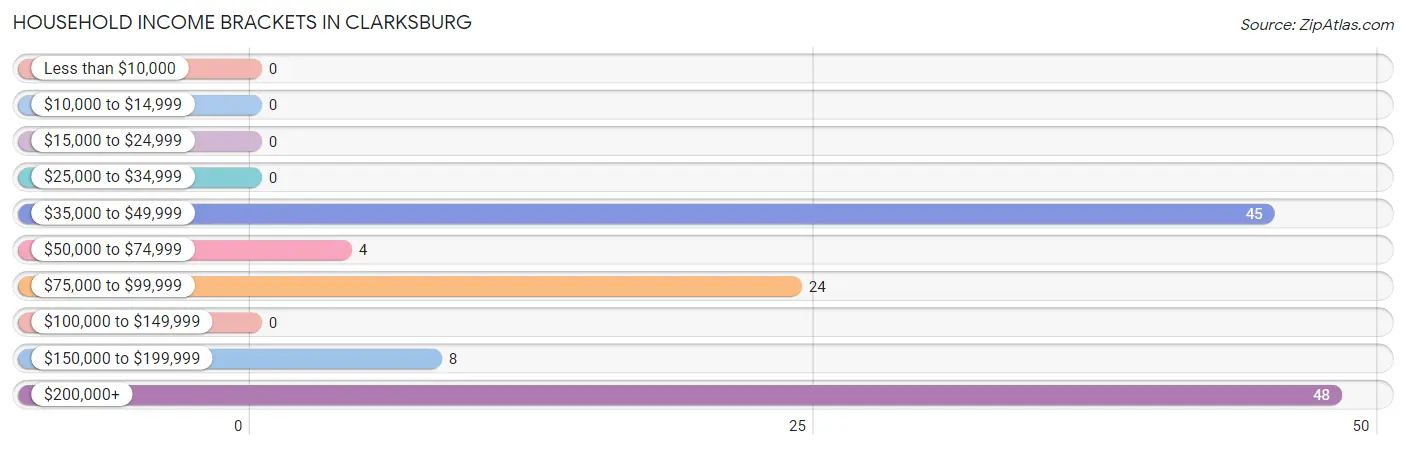
| Income Bracket | # Households | % Households |
| Less than $10,000 | 0 | 0.0% |
| $10,000 to $14,999 | 0 | 0.0% |
| $15,000 to $24,999 | 0 | 0.0% |
| $25,000 to $34,999 | 0 | 0.0% |
| $35,000 to $49,999 | 45 | 34.9% |
| $50,000 to $74,999 | 4 | 3.1% |
| $75,000 to $99,999 | 24 | 18.6% |
| $100,000 to $149,999 | 0 | 0.0% |
| $150,000 to $199,999 | 8 | 6.2% |
| $200,000+ | 48 | 37.2% |
Household Income by Householder Age in Clarksburg
| Income Bracket | # Households | Median Income |
| 15 to 24 Years | 0 (0.0%) | $0 |
| 25 to 44 Years | 0 (0.0%) | $0 |
| 45 to 64 Years | 93 (72.1%) | $0 |
| 65+ Years | 36 (27.9%) | $0 |
| Total | 129 (100.0%) | $0 |
Poverty in Clarksburg
Income Below Poverty by Sex and Age in Clarksburg
| Age Bracket | Male | Female |
| Under 5 Years | 0 (0.0%) | 0 (0.0%) |
| 5 Years | 0 (0.0%) | 0 (0.0%) |
| 6 to 11 Years | 0 (0.0%) | 0 (0.0%) |
| 12 to 14 Years | 0 (0.0%) | 0 (0.0%) |
| 15 Years | 0 (0.0%) | 0 (0.0%) |
| 16 and 17 Years | 0 (0.0%) | 0 (0.0%) |
| 18 to 24 Years | 0 (0.0%) | 0 (0.0%) |
| 25 to 34 Years | 0 (0.0%) | 0 (0.0%) |
| 35 to 44 Years | 0 (0.0%) | 0 (0.0%) |
| 45 to 54 Years | 0 (0.0%) | 0 (0.0%) |
| 55 to 64 Years | 0 (0.0%) | 0 (0.0%) |
| 65 to 74 Years | 0 (0.0%) | 0 (0.0%) |
| 75 Years and over | 0 (0.0%) | 0 (0.0%) |
| Total | 0 (0.0%) | 0 (0.0%) |
Income Above Poverty by Sex and Age in Clarksburg
According to the poverty statistics in Clarksburg, males aged 18 to 24 years and females aged 6 to 11 years are the age groups that are most secure financially, with 100.0% of males and 100.0% of females in these age groups living above the poverty line.
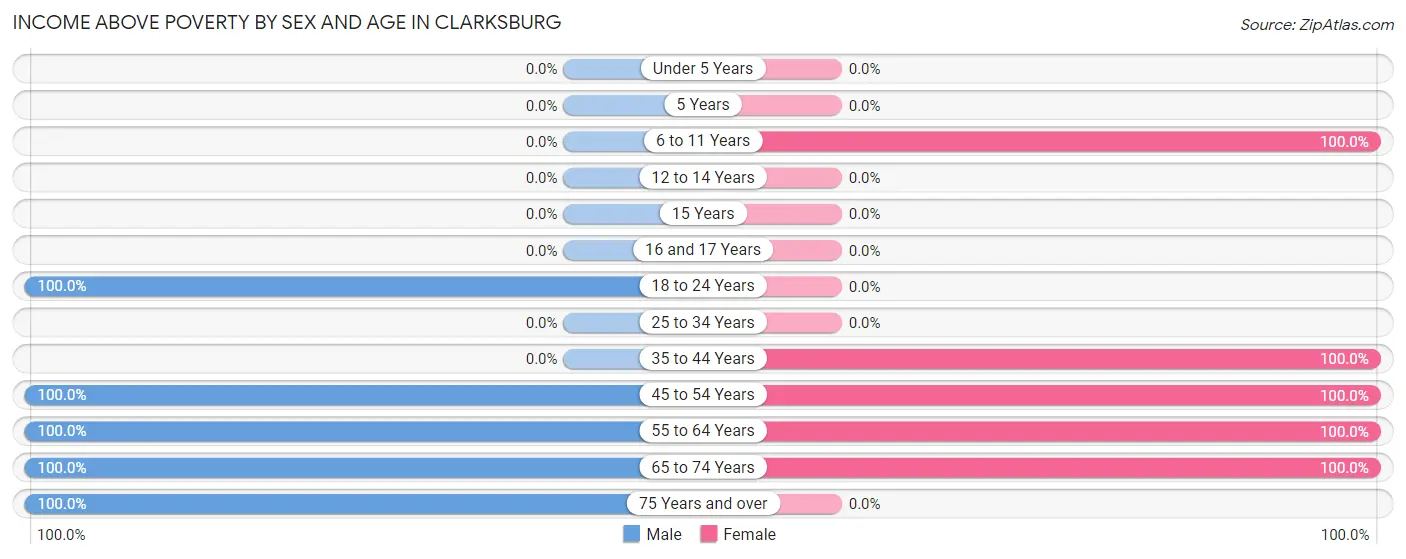
| Age Bracket | Male | Female |
| Under 5 Years | 0 (0.0%) | 0 (0.0%) |
| 5 Years | 0 (0.0%) | 0 (0.0%) |
| 6 to 11 Years | 0 (0.0%) | 39 (100.0%) |
| 12 to 14 Years | 0 (0.0%) | 0 (0.0%) |
| 15 Years | 0 (0.0%) | 0 (0.0%) |
| 16 and 17 Years | 0 (0.0%) | 0 (0.0%) |
| 18 to 24 Years | 58 (100.0%) | 0 (0.0%) |
| 25 to 34 Years | 0 (0.0%) | 0 (0.0%) |
| 35 to 44 Years | 0 (0.0%) | 21 (100.0%) |
| 45 to 54 Years | 27 (100.0%) | 18 (100.0%) |
| 55 to 64 Years | 42 (100.0%) | 56 (100.0%) |
| 65 to 74 Years | 32 (100.0%) | 5 (100.0%) |
| 75 Years and over | 4 (100.0%) | 0 (0.0%) |
| Total | 163 (100.0%) | 139 (100.0%) |
Income Below Poverty Among Married-Couple Families in Clarksburg
| Children | Above Poverty | Below Poverty |
| No Children | 57 (100.0%) | 0 (0.0%) |
| 1 or 2 Children | 27 (100.0%) | 0 (0.0%) |
| 3 or 4 Children | 0 (0.0%) | 0 (0.0%) |
| 5 or more Children | 0 (0.0%) | 0 (0.0%) |
| Total | 84 (100.0%) | 0 (0.0%) |
Income Below Poverty Among Single-Parent Households in Clarksburg
| Children | Single Father | Single Mother |
| No Children | 0 (0.0%) | 0 (0.0%) |
| 1 or 2 Children | 0 (0.0%) | 0 (0.0%) |
| 3 or 4 Children | 0 (0.0%) | 0 (0.0%) |
| 5 or more Children | 0 (0.0%) | 0 (0.0%) |
| Total | 0 (0.0%) | 0 (0.0%) |
Income Below Poverty Among Married-Couple vs Single-Parent Households in Clarksburg
| Children | Married-Couple Families | Single-Parent Households |
| No Children | 0 (0.0%) | 0 (0.0%) |
| 1 or 2 Children | 0 (0.0%) | 0 (0.0%) |
| 3 or 4 Children | 0 (0.0%) | 0 (0.0%) |
| 5 or more Children | 0 (0.0%) | 0 (0.0%) |
| Total | 0 (0.0%) | 0 (0.0%) |
Race in Clarksburg
The most populous races in Clarksburg are White / Caucasian (297 | 98.3%), Hispanic or Latino (5 | 1.7%), and Some other Race (5 | 1.7%).
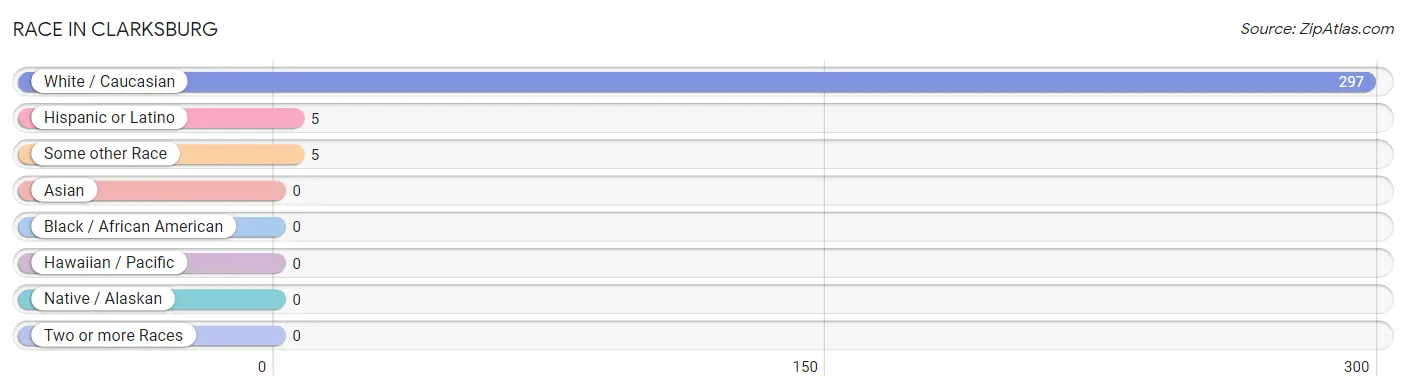
| Race | # Population | % Population |
| Asian | 0 | 0.0% |
| Black / African American | 0 | 0.0% |
| Hawaiian / Pacific | 0 | 0.0% |
| Hispanic or Latino | 5 | 1.7% |
| Native / Alaskan | 0 | 0.0% |
| White / Caucasian | 297 | 98.3% |
| Two or more Races | 0 | 0.0% |
| Some other Race | 5 | 1.7% |
| Total | 302 | 100.0% |
Ancestry in Clarksburg
The most populous ancestries reported in Clarksburg are German (82 | 27.2%), Portuguese (81 | 26.8%), Irish (74 | 24.5%), Norwegian (66 | 21.8%), and English (37 | 12.2%), together accounting for 112.6% of all Clarksburg residents.
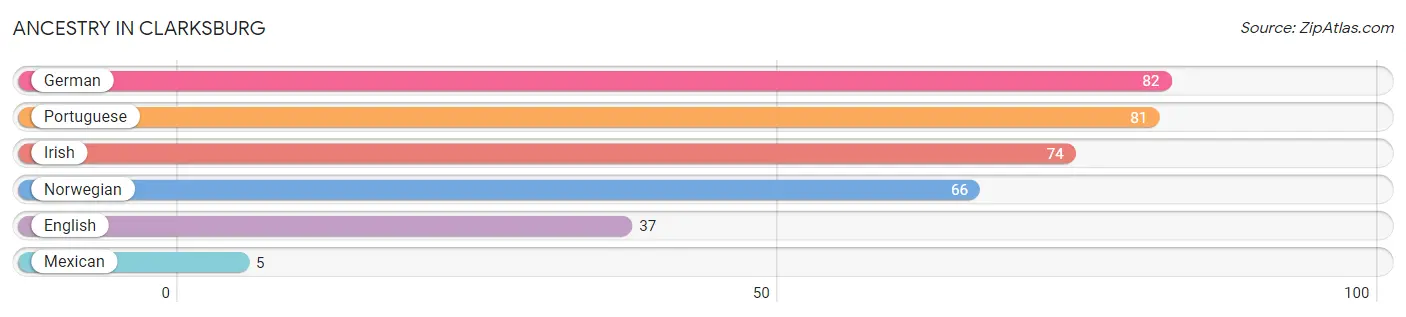
| Ancestry | # Population | % Population |
| English | 37 | 12.2% |
| German | 82 | 27.2% |
| Irish | 74 | 24.5% |
| Mexican | 5 | 1.7% |
| Norwegian | 66 | 21.8% |
| Portuguese | 81 | 26.8% | View All 6 Rows |
Immigrants in Clarksburg

| Immigration Origin | # Population | % Population | View All 0 Rows |
Sex and Age in Clarksburg
Sex and Age in Clarksburg
The most populous age groups in Clarksburg are 15 to 19 Years (58 | 35.6%) for men and 5 to 9 Years (39 | 28.1%) for women.
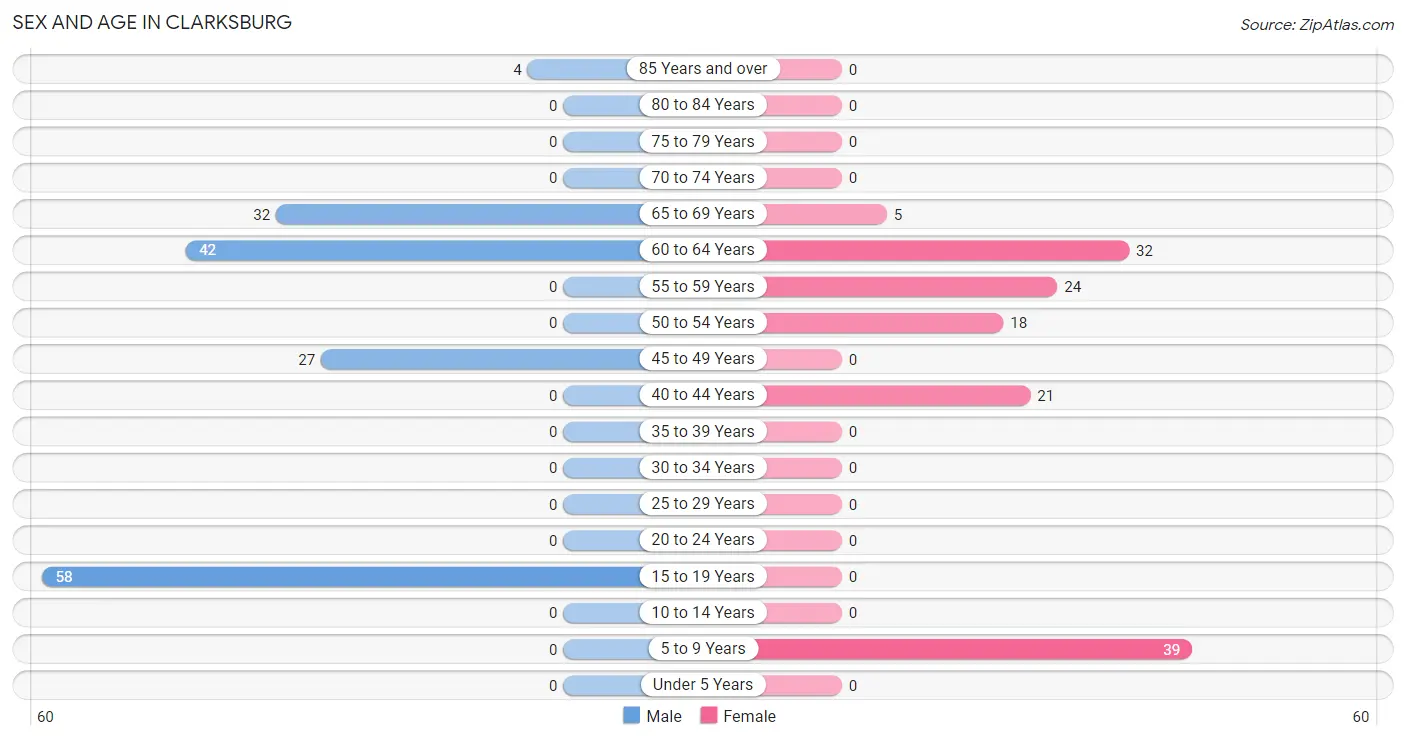
| Age Bracket | Male | Female |
| Under 5 Years | 0 (0.0%) | 0 (0.0%) |
| 5 to 9 Years | 0 (0.0%) | 39 (28.1%) |
| 10 to 14 Years | 0 (0.0%) | 0 (0.0%) |
| 15 to 19 Years | 58 (35.6%) | 0 (0.0%) |
| 20 to 24 Years | 0 (0.0%) | 0 (0.0%) |
| 25 to 29 Years | 0 (0.0%) | 0 (0.0%) |
| 30 to 34 Years | 0 (0.0%) | 0 (0.0%) |
| 35 to 39 Years | 0 (0.0%) | 0 (0.0%) |
| 40 to 44 Years | 0 (0.0%) | 21 (15.1%) |
| 45 to 49 Years | 27 (16.6%) | 0 (0.0%) |
| 50 to 54 Years | 0 (0.0%) | 18 (13.0%) |
| 55 to 59 Years | 0 (0.0%) | 24 (17.3%) |
| 60 to 64 Years | 42 (25.8%) | 32 (23.0%) |
| 65 to 69 Years | 32 (19.6%) | 5 (3.6%) |
| 70 to 74 Years | 0 (0.0%) | 0 (0.0%) |
| 75 to 79 Years | 0 (0.0%) | 0 (0.0%) |
| 80 to 84 Years | 0 (0.0%) | 0 (0.0%) |
| 85 Years and over | 4 (2.5%) | 0 (0.0%) |
| Total | 163 (100.0%) | 139 (100.0%) |
Families and Households in Clarksburg
Median Family Size in Clarksburg
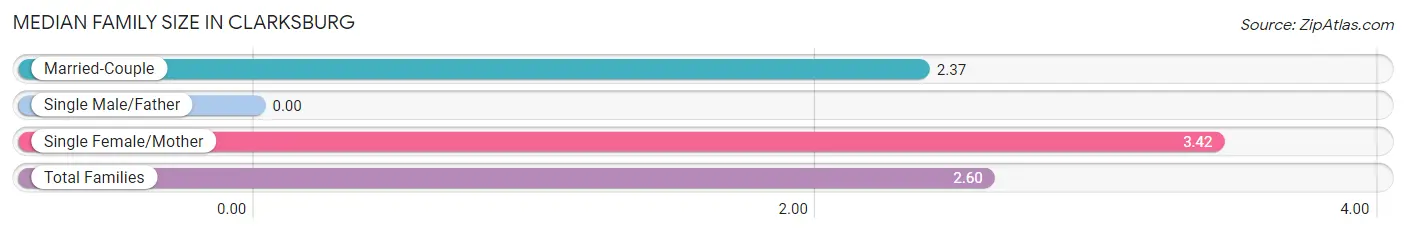
| Family Type | # Families | Family Size |
| Married-Couple | 84 (77.8%) | 2.37 |
| Single Male/Father | 0 (0.0%) | - |
| Single Female/Mother | 24 (22.2%) | 3.42 |
| Total Families | 108 (100.0%) | 2.60 |
Median Household Size in Clarksburg
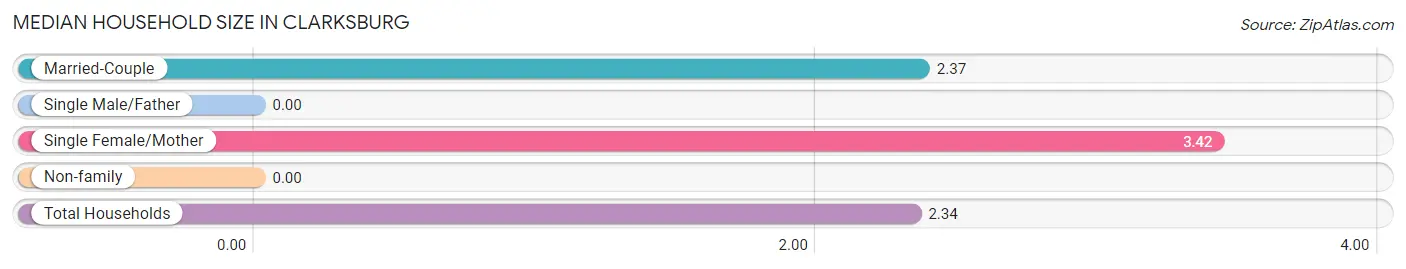
| Household Type | # Households | Household Size |
| Married-Couple | 84 (65.1%) | 2.37 |
| Single Male/Father | 0 (0.0%) | - |
| Single Female/Mother | 24 (18.6%) | 3.42 |
| Non-family | 21 (16.3%) | - |
| Total Households | 129 (100.0%) | 2.34 |
Household Size by Marriage Status in Clarksburg
Out of a total of 129 households in Clarksburg, 108 (83.7%) are family households, while 21 (16.3%) are nonfamily households. The most numerous type of family households are 2-person households, comprising 81, and the most common type of nonfamily households are 1-person households, comprising 21.
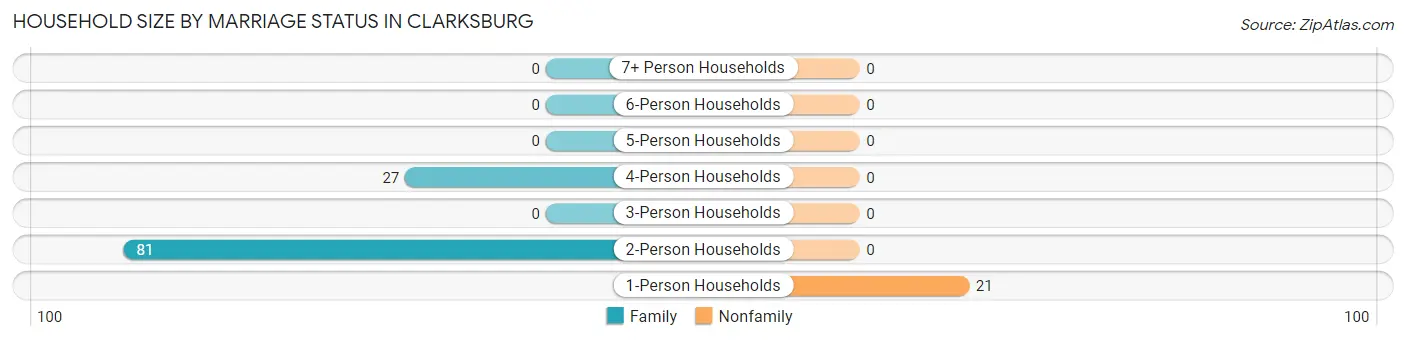
| Household Size | Family Households | Nonfamily Households |
| 1-Person Households | - | 21 (16.3%) |
| 2-Person Households | 81 (62.8%) | 0 (0.0%) |
| 3-Person Households | 0 (0.0%) | 0 (0.0%) |
| 4-Person Households | 27 (20.9%) | 0 (0.0%) |
| 5-Person Households | 0 (0.0%) | 0 (0.0%) |
| 6-Person Households | 0 (0.0%) | 0 (0.0%) |
| 7+ Person Households | 0 (0.0%) | 0 (0.0%) |
| Total | 108 (83.7%) | 21 (16.3%) |
Female Fertility in Clarksburg
Fertility by Age in Clarksburg
| Age Bracket | Women with Births | Births / 1,000 Women |
| 15 to 19 years | 0 (0.0%) | 0.0 |
| 20 to 34 years | 0 (0.0%) | 0.0 |
| 35 to 50 years | 0 (0.0%) | 0.0 |
| Total | 0 (0.0%) | 0.0 |
Fertility by Age by Marriage Status in Clarksburg
| Age Bracket | Married | Unmarried |
| 15 to 19 years | 0 (0.0%) | 0 (0.0%) |
| 20 to 34 years | 0 (0.0%) | 0 (0.0%) |
| 35 to 50 years | 0 (0.0%) | 0 (0.0%) |
| Total | 0 (0.0%) | 0 (0.0%) |
Fertility by Education in Clarksburg
| Educational Attainment | Women with Births | Births / 1,000 Women |
| Less than High School | 0 (0.0%) | 0.0 |
| High School Diploma | 0 (0.0%) | 0.0 |
| College or Associate's Degree | 0 (0.0%) | 0.0 |
| Bachelor's Degree | 0 (0.0%) | 0.0 |
| Graduate Degree | 0 (0.0%) | 0.0 |
| Total | 0 (0.0%) | 0.0 |
Fertility by Education by Marriage Status in Clarksburg
| Educational Attainment | Married | Unmarried |
| Less than High School | 0 (0.0%) | 0 (0.0%) |
| High School Diploma | 0 (0.0%) | 0 (0.0%) |
| College or Associate's Degree | 0 (0.0%) | 0 (0.0%) |
| Bachelor's Degree | 0 (0.0%) | 0 (0.0%) |
| Graduate Degree | 0 (0.0%) | 0 (0.0%) |
| Total | 0 (0.0%) | 0 (0.0%) |
Employment Characteristics in Clarksburg
Employment by Class of Employer in Clarksburg
Among the 207 employed individuals in Clarksburg, private company employees (154 | 74.4%), self-employed (incorporated) (29 | 14.0%), and self-employed (not incorporated) (24 | 11.6%) make up the most common classes of employment.
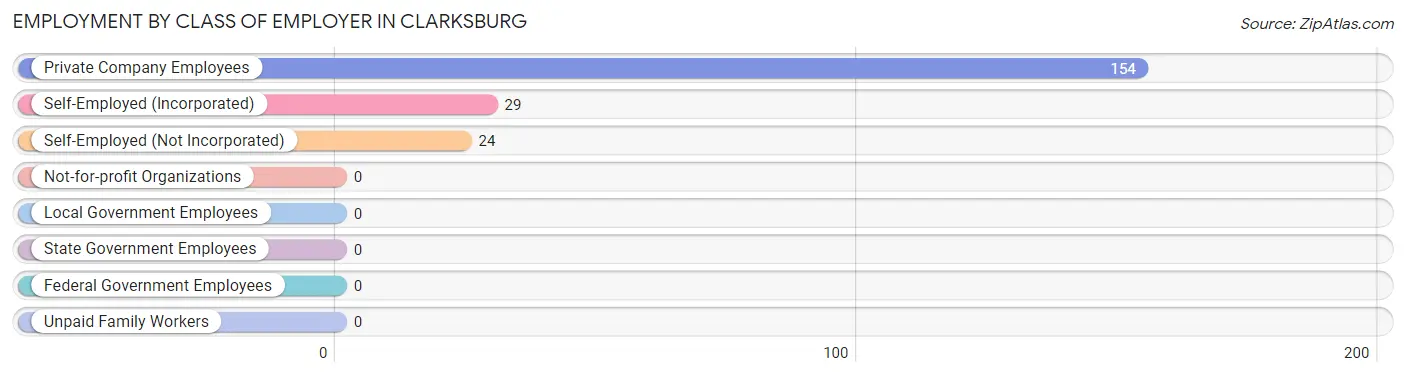
| Employer Class | # Employees | % Employees |
| Private Company Employees | 154 | 74.4% |
| Self-Employed (Incorporated) | 29 | 14.0% |
| Self-Employed (Not Incorporated) | 24 | 11.6% |
| Not-for-profit Organizations | 0 | 0.0% |
| Local Government Employees | 0 | 0.0% |
| State Government Employees | 0 | 0.0% |
| Federal Government Employees | 0 | 0.0% |
| Unpaid Family Workers | 0 | 0.0% |
| Total | 207 | 100.0% |
Employment Status by Age in Clarksburg
According to the labor force statistics for Clarksburg, out of the total population over 16 years of age (263), 98.1% or 258 individuals are in the labor force, with 19.8% or 51 of them unemployed. The age group with the highest labor force participation rate is 16 to 19 years, with 100.0% or 58 individuals in the labor force. Within the labor force, the 65 to 74 years age range has the highest percentage of unemployed individuals, with 75.0% or 24 of them being unemployed.
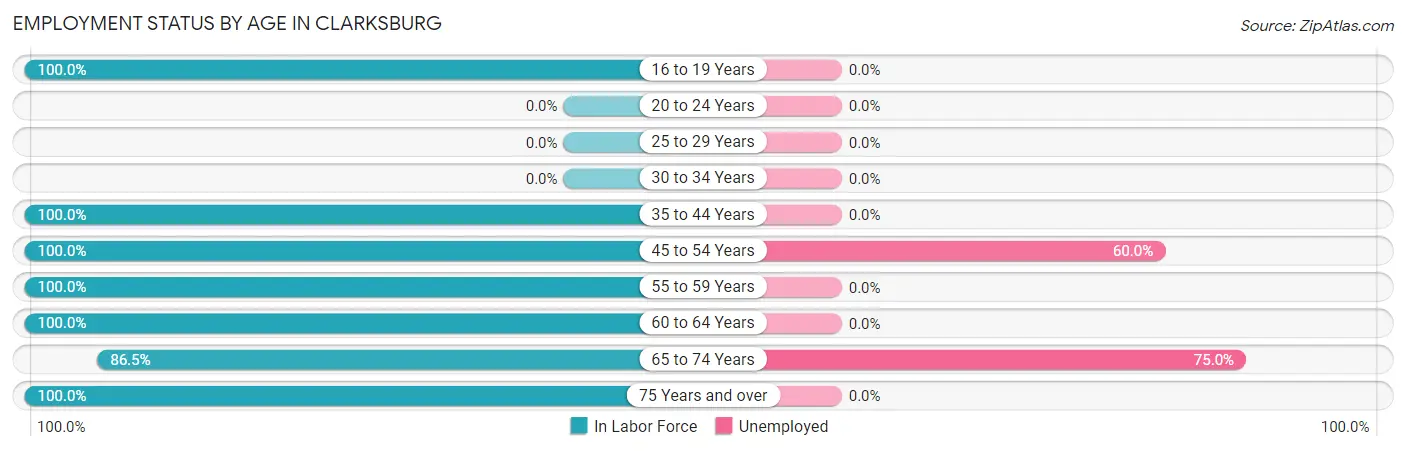
| Age Bracket | In Labor Force | Unemployed |
| 16 to 19 Years | 58 (100.0%) | 0 (0.0%) |
| 20 to 24 Years | 0 (0.0%) | 0 (0.0%) |
| 25 to 29 Years | 0 (0.0%) | 0 (0.0%) |
| 30 to 34 Years | 0 (0.0%) | 0 (0.0%) |
| 35 to 44 Years | 21 (100.0%) | 0 (0.0%) |
| 45 to 54 Years | 45 (100.0%) | 27 (60.0%) |
| 55 to 59 Years | 24 (100.0%) | 0 (0.0%) |
| 60 to 64 Years | 74 (100.0%) | 0 (0.0%) |
| 65 to 74 Years | 32 (86.5%) | 24 (75.0%) |
| 75 Years and over | 4 (100.0%) | 0 (0.0%) |
| Total | 258 (98.1%) | 51 (19.8%) |
Employment Status by Educational Attainment in Clarksburg
According to labor force statistics for Clarksburg, 100.0% of individuals (164) out of the total population between 25 and 64 years of age (164) are in the labor force, with 16.5% or 27 of them being unemployed. The group with the highest labor force participation rate are those with the educational attainment of high school diploma, with 100.0% or 27 individuals in the labor force. Within the labor force, individuals with high school diploma education have the highest percentage of unemployment, with 100.0% or 27 of them being unemployed.
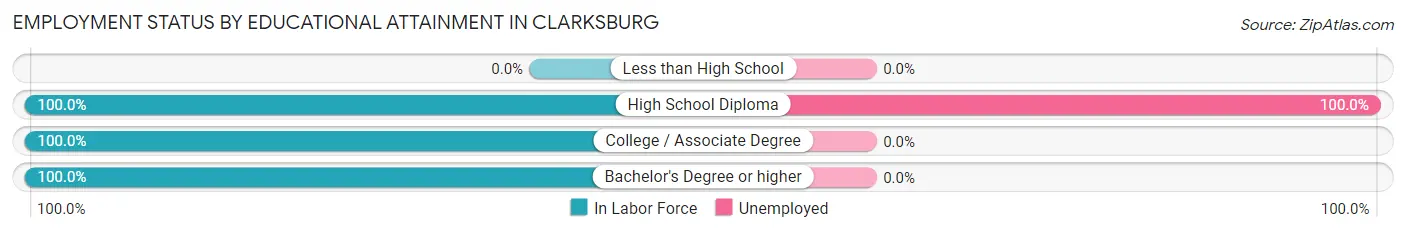
| Educational Attainment | In Labor Force | Unemployed |
| Less than High School | 0 (0.0%) | 0 (0.0%) |
| High School Diploma | 27 (100.0%) | 27 (100.0%) |
| College / Associate Degree | 92 (100.0%) | 0 (0.0%) |
| Bachelor's Degree or higher | 45 (100.0%) | 0 (0.0%) |
| Total | 164 (100.0%) | 27 (16.5%) |
Employment Occupations by Sex in Clarksburg
Management, Business, Science and Arts Occupations
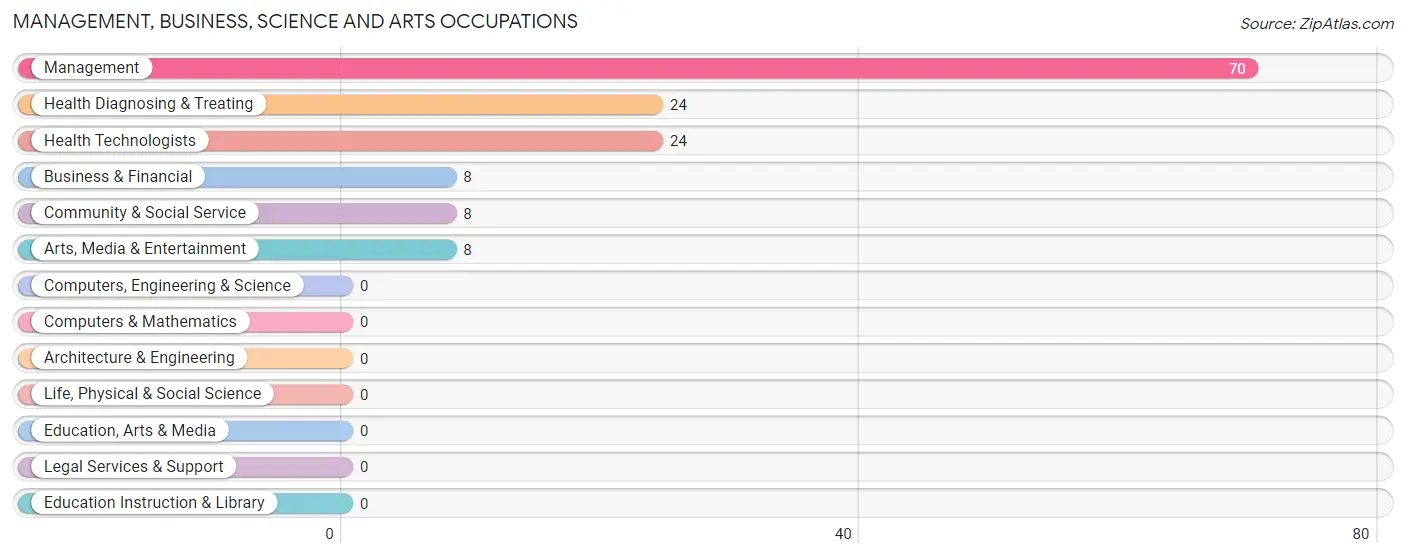
The most common Management, Business, Science and Arts occupations in Clarksburg are Management (70 | 33.8%), Health Diagnosing & Treating (24 | 11.6%), Health Technologists (24 | 11.6%), Business & Financial (8 | 3.9%), and Community & Social Service (8 | 3.9%).
Management, Business, Science and Arts Occupations by Sex
Within the Management, Business, Science and Arts occupations in Clarksburg, the most male-oriented occupations are Business & Financial (100.0%), and Management (35.7%), while the most female-oriented occupations are Community & Social Service (100.0%), Arts, Media & Entertainment (100.0%), and Health Diagnosing & Treating (100.0%).
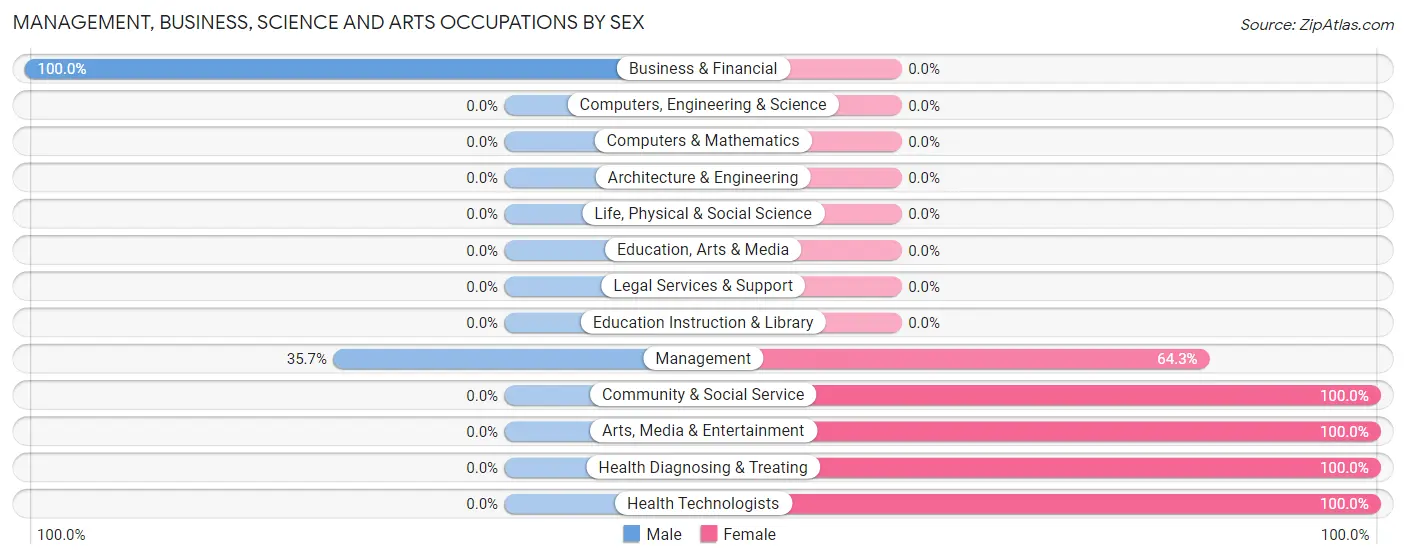
| Occupation | Male | Female |
| Management | 25 (35.7%) | 45 (64.3%) |
| Business & Financial | 8 (100.0%) | 0 (0.0%) |
| Computers, Engineering & Science | 0 (0.0%) | 0 (0.0%) |
| Computers & Mathematics | 0 (0.0%) | 0 (0.0%) |
| Architecture & Engineering | 0 (0.0%) | 0 (0.0%) |
| Life, Physical & Social Science | 0 (0.0%) | 0 (0.0%) |
| Community & Social Service | 0 (0.0%) | 8 (100.0%) |
| Education, Arts & Media | 0 (0.0%) | 0 (0.0%) |
| Legal Services & Support | 0 (0.0%) | 0 (0.0%) |
| Education Instruction & Library | 0 (0.0%) | 0 (0.0%) |
| Arts, Media & Entertainment | 0 (0.0%) | 8 (100.0%) |
| Health Diagnosing & Treating | 0 (0.0%) | 24 (100.0%) |
| Health Technologists | 0 (0.0%) | 24 (100.0%) |
| Total (Category) | 33 (30.0%) | 77 (70.0%) |
| Total (Overall) | 112 (54.1%) | 95 (45.9%) |
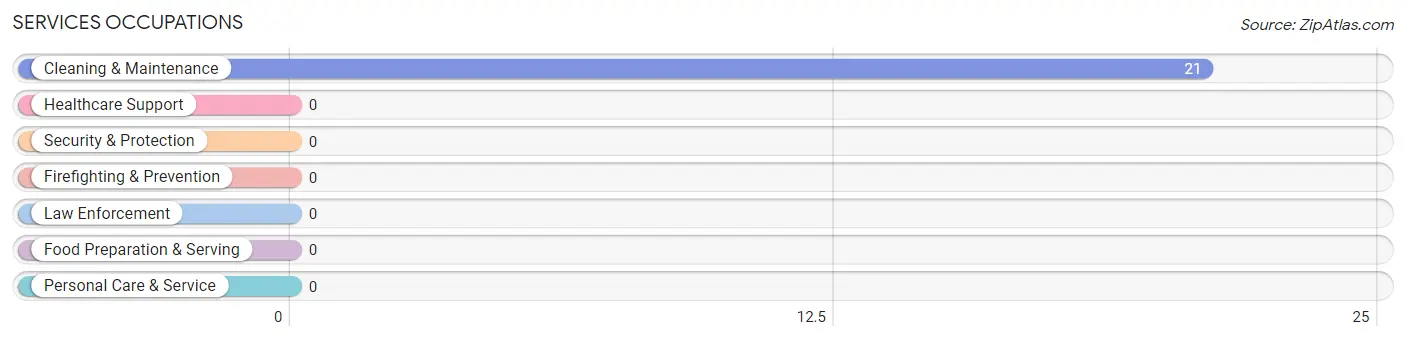
Services Occupations
The most common Services occupations in Clarksburg are , and Cleaning & Maintenance (21 | 10.1%).
Services Occupations by Sex
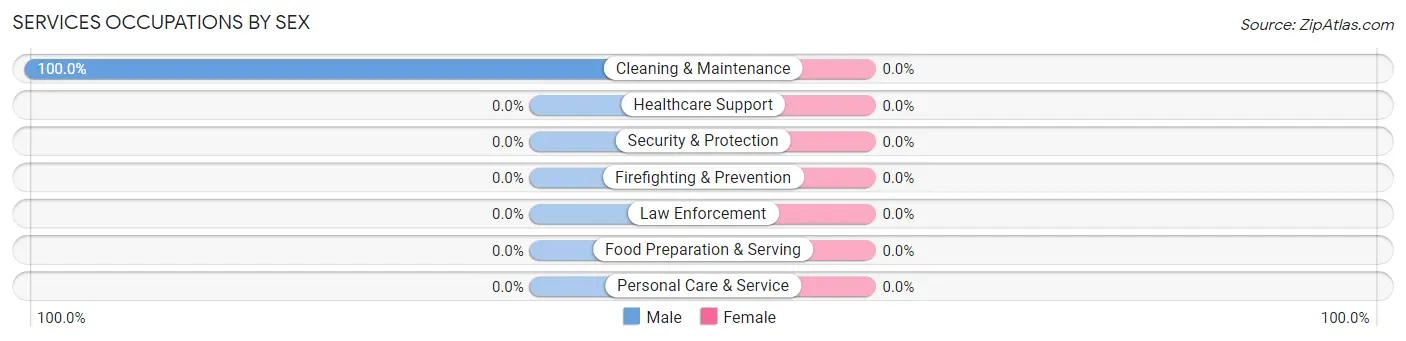
| Occupation | Male | Female |
| Healthcare Support | 0 (0.0%) | 0 (0.0%) |
| Security & Protection | 0 (0.0%) | 0 (0.0%) |
| Firefighting & Prevention | 0 (0.0%) | 0 (0.0%) |
| Law Enforcement | 0 (0.0%) | 0 (0.0%) |
| Food Preparation & Serving | 0 (0.0%) | 0 (0.0%) |
| Cleaning & Maintenance | 21 (100.0%) | 0 (0.0%) |
| Personal Care & Service | 0 (0.0%) | 0 (0.0%) |
| Total (Category) | 21 (100.0%) | 0 (0.0%) |
| Total (Overall) | 112 (54.1%) | 95 (45.9%) |
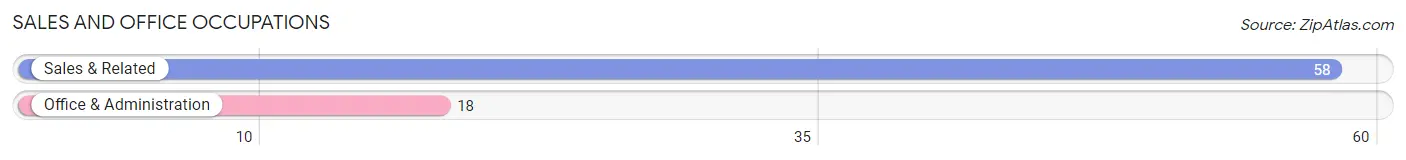
Sales and Office Occupations
The most common Sales and Office occupations in Clarksburg are Sales & Related (58 | 28.0%), and Office & Administration (18 | 8.7%).
Sales and Office Occupations by Sex
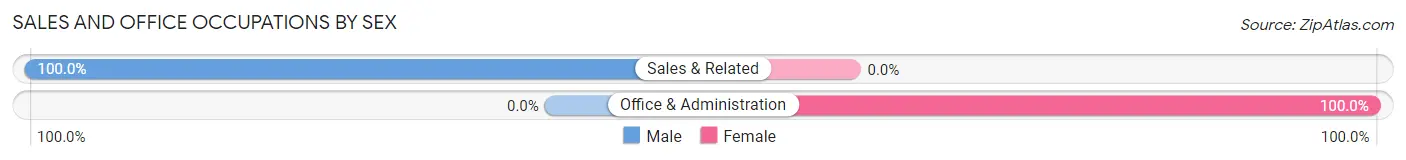
| Occupation | Male | Female |
| Sales & Related | 58 (100.0%) | 0 (0.0%) |
| Office & Administration | 0 (0.0%) | 18 (100.0%) |
| Total (Category) | 58 (76.3%) | 18 (23.7%) |
| Total (Overall) | 112 (54.1%) | 95 (45.9%) |
Natural Resources, Construction and Maintenance Occupations
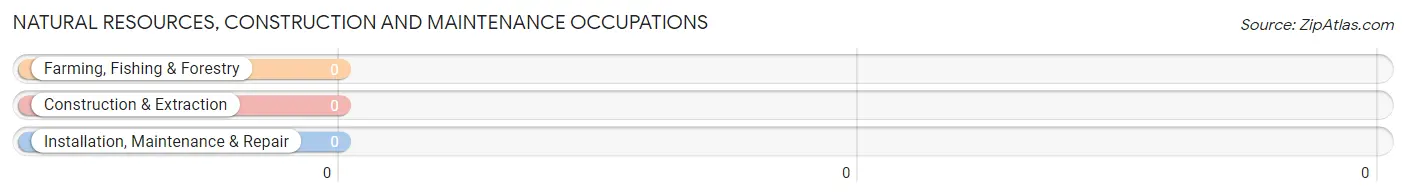
Natural Resources, Construction and Maintenance Occupations by Sex
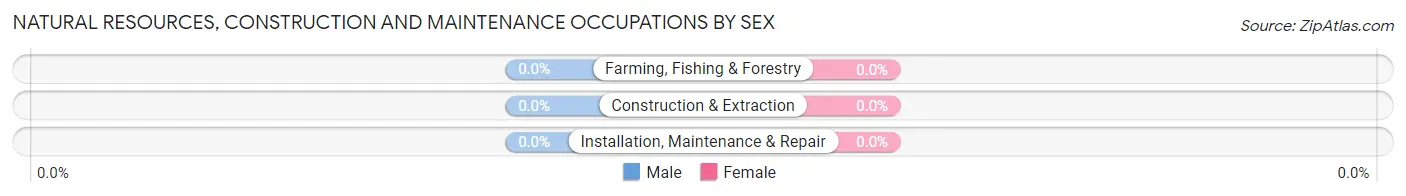
| Occupation | Male | Female |
| Farming, Fishing & Forestry | 0 (0.0%) | 0 (0.0%) |
| Construction & Extraction | 0 (0.0%) | 0 (0.0%) |
| Installation, Maintenance & Repair | 0 (0.0%) | 0 (0.0%) |
| Total (Category) | 0 (0.0%) | 0 (0.0%) |
| Total (Overall) | 112 (54.1%) | 95 (45.9%) |
Production, Transportation and Moving Occupations
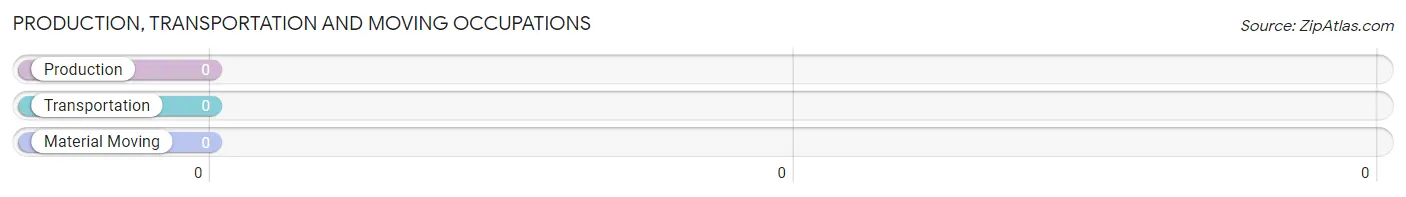
Production, Transportation and Moving Occupations by Sex
| Occupation | Male | Female |
| Production | 0 (0.0%) | 0 (0.0%) |
| Transportation | 0 (0.0%) | 0 (0.0%) |
| Material Moving | 0 (0.0%) | 0 (0.0%) |
| Total (Category) | 0 (0.0%) | 0 (0.0%) |
| Total (Overall) | 112 (54.1%) | 95 (45.9%) |
Employment Industries by Sex in Clarksburg
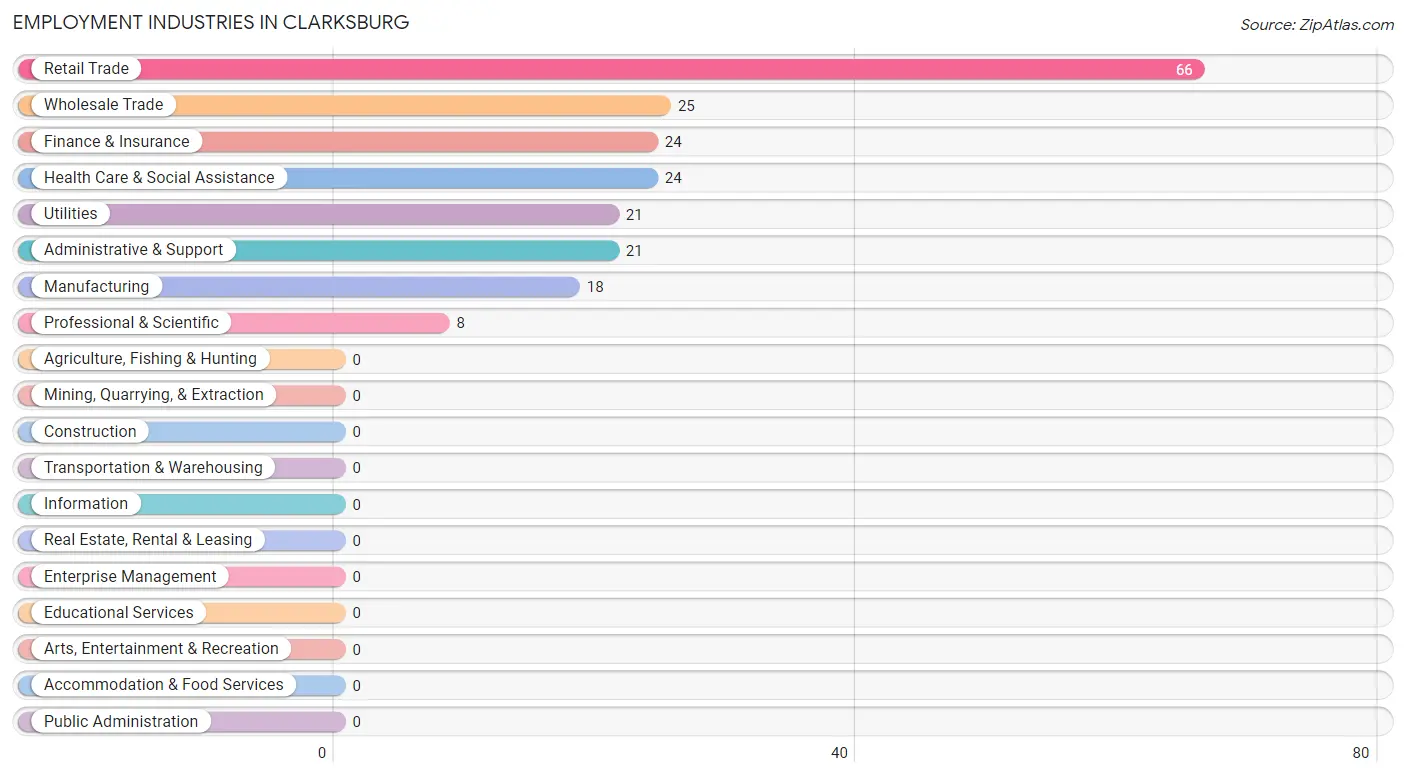
Employment Industries in Clarksburg
The major employment industries in Clarksburg include Retail Trade (66 | 31.9%), Wholesale Trade (25 | 12.1%), Finance & Insurance (24 | 11.6%), Health Care & Social Assistance (24 | 11.6%), and Utilities (21 | 10.1%).
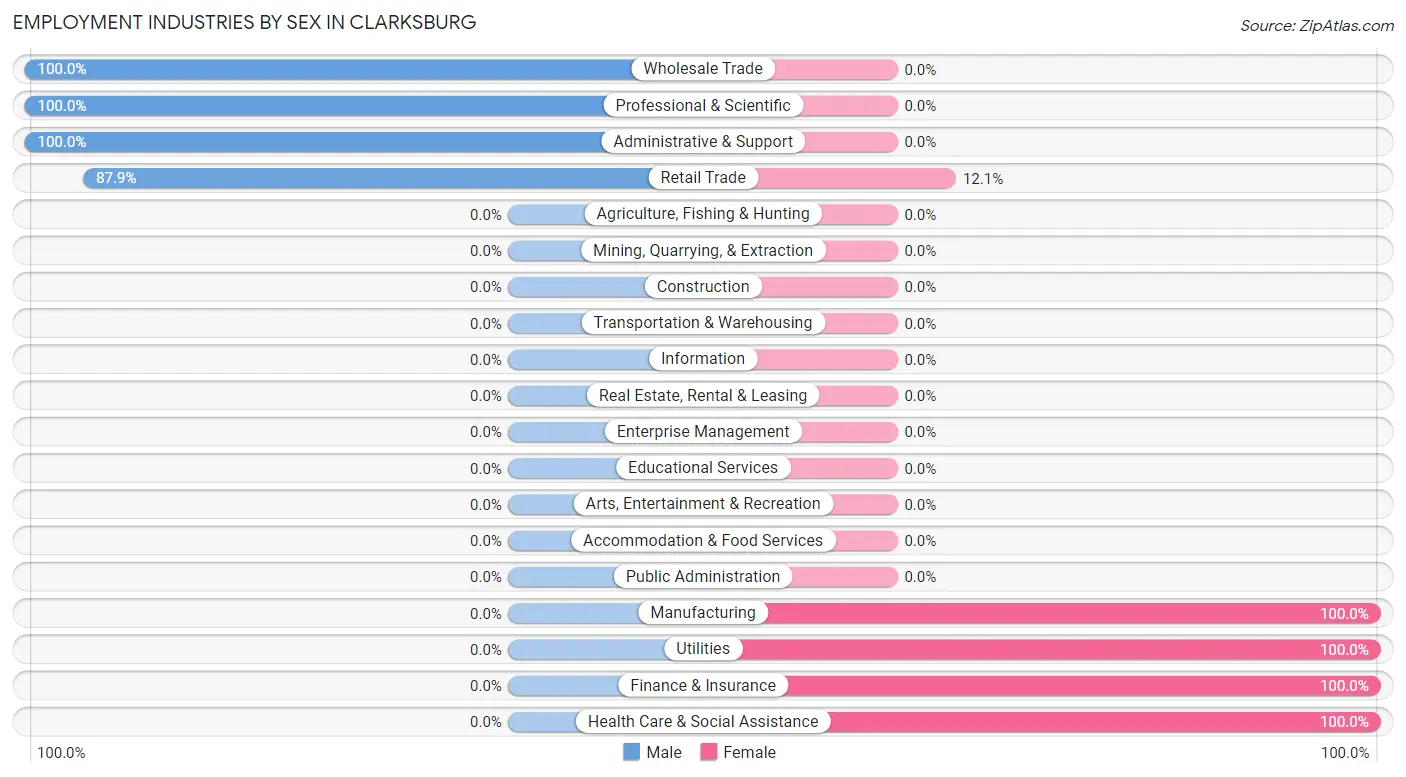
Employment Industries by Sex in Clarksburg
The Clarksburg industries that see more men than women are Wholesale Trade (100.0%), Professional & Scientific (100.0%), and Administrative & Support (100.0%), whereas the industries that tend to have a higher number of women are Manufacturing (100.0%), Utilities (100.0%), and Finance & Insurance (100.0%).
| Industry | Male | Female |
| Agriculture, Fishing & Hunting | 0 (0.0%) | 0 (0.0%) |
| Mining, Quarrying, & Extraction | 0 (0.0%) | 0 (0.0%) |
| Construction | 0 (0.0%) | 0 (0.0%) |
| Manufacturing | 0 (0.0%) | 18 (100.0%) |
| Wholesale Trade | 25 (100.0%) | 0 (0.0%) |
| Retail Trade | 58 (87.9%) | 8 (12.1%) |
| Transportation & Warehousing | 0 (0.0%) | 0 (0.0%) |
| Utilities | 0 (0.0%) | 21 (100.0%) |
| Information | 0 (0.0%) | 0 (0.0%) |
| Finance & Insurance | 0 (0.0%) | 24 (100.0%) |
| Real Estate, Rental & Leasing | 0 (0.0%) | 0 (0.0%) |
| Professional & Scientific | 8 (100.0%) | 0 (0.0%) |
| Enterprise Management | 0 (0.0%) | 0 (0.0%) |
| Administrative & Support | 21 (100.0%) | 0 (0.0%) |
| Educational Services | 0 (0.0%) | 0 (0.0%) |
| Health Care & Social Assistance | 0 (0.0%) | 24 (100.0%) |
| Arts, Entertainment & Recreation | 0 (0.0%) | 0 (0.0%) |
| Accommodation & Food Services | 0 (0.0%) | 0 (0.0%) |
| Public Administration | 0 (0.0%) | 0 (0.0%) |
| Total | 112 (54.1%) | 95 (45.9%) |
Education in Clarksburg
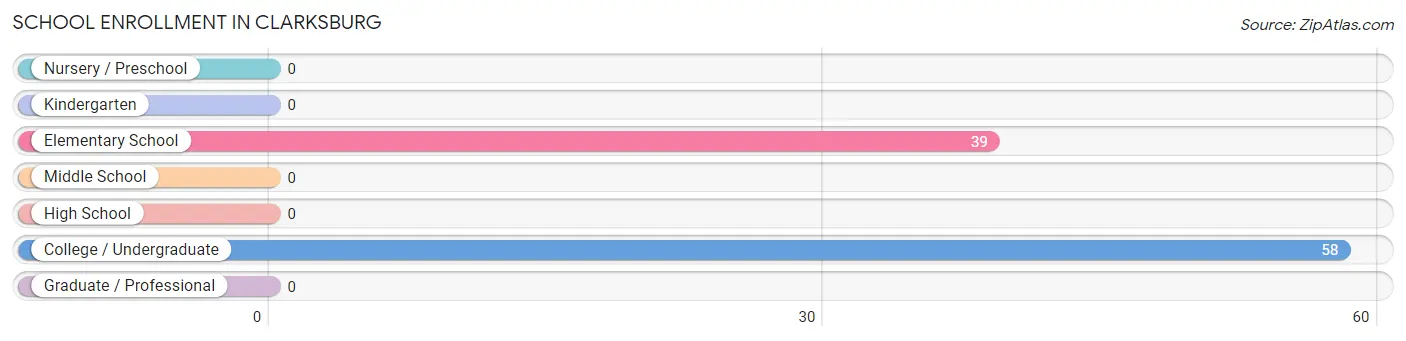
School Enrollment in Clarksburg
The most common levels of schooling among the 97 students in Clarksburg are college / undergraduate (58 | 59.8%), and elementary school (39 | 40.2%).
| School Level | # Students | % Students |
| Nursery / Preschool | 0 | 0.0% |
| Kindergarten | 0 | 0.0% |
| Elementary School | 39 | 40.2% |
| Middle School | 0 | 0.0% |
| High School | 0 | 0.0% |
| College / Undergraduate | 58 | 59.8% |
| Graduate / Professional | 0 | 0.0% |
| Total | 97 | 100.0% |
School Enrollment by Age by Funding Source in Clarksburg
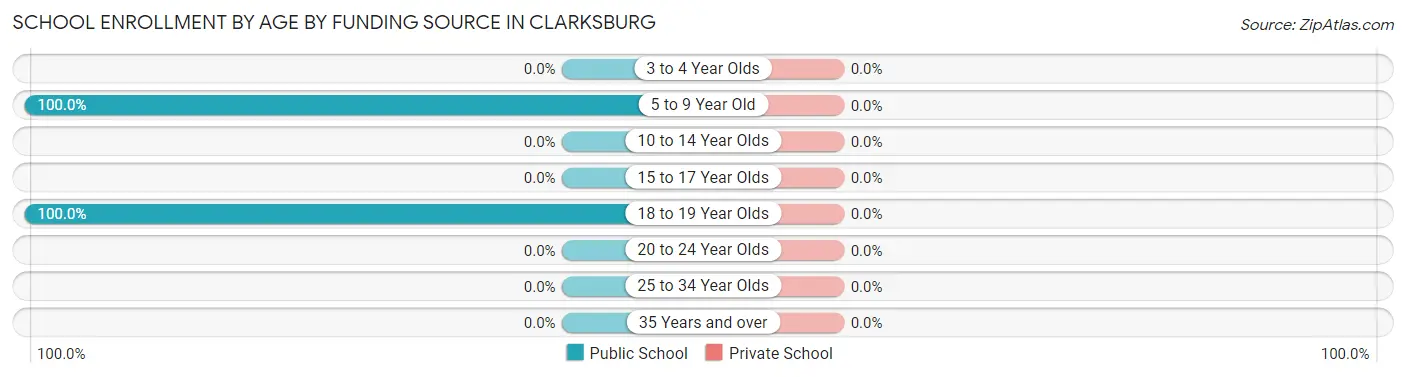
| Age Bracket | Public School | Private School |
| 3 to 4 Year Olds | 0 (0.0%) | 0 (0.0%) |
| 5 to 9 Year Old | 39 (100.0%) | 0 (0.0%) |
| 10 to 14 Year Olds | 0 (0.0%) | 0 (0.0%) |
| 15 to 17 Year Olds | 0 (0.0%) | 0 (0.0%) |
| 18 to 19 Year Olds | 58 (100.0%) | 0 (0.0%) |
| 20 to 24 Year Olds | 0 (0.0%) | 0 (0.0%) |
| 25 to 34 Year Olds | 0 (0.0%) | 0 (0.0%) |
| 35 Years and over | 0 (0.0%) | 0 (0.0%) |
| Total | 97 (100.0%) | 0 (0.0%) |
Educational Attainment by Field of Study in Clarksburg
Science & technology (24 | 45.3%), physical & health sciences (21 | 39.6%), and social sciences (8 | 15.1%) are the most common fields of study among 53 individuals in Clarksburg who have obtained a bachelor's degree or higher.
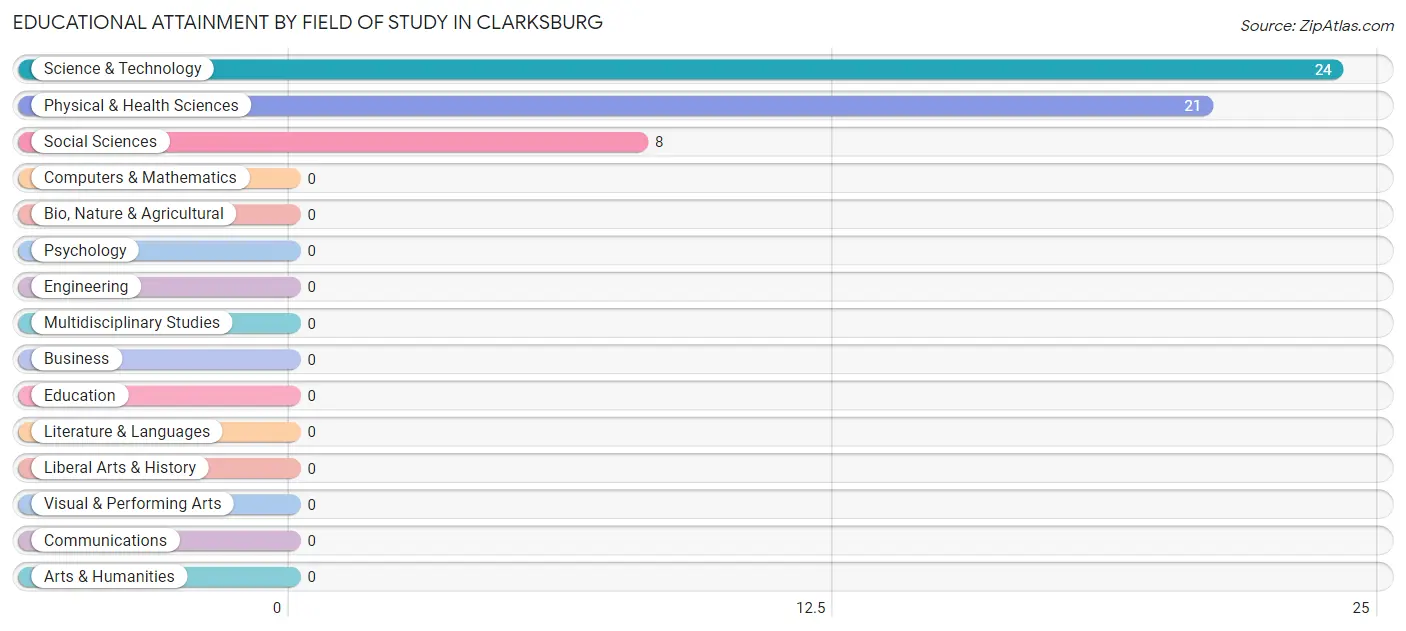
| Field of Study | # Graduates | % Graduates |
| Computers & Mathematics | 0 | 0.0% |
| Bio, Nature & Agricultural | 0 | 0.0% |
| Physical & Health Sciences | 21 | 39.6% |
| Psychology | 0 | 0.0% |
| Social Sciences | 8 | 15.1% |
| Engineering | 0 | 0.0% |
| Multidisciplinary Studies | 0 | 0.0% |
| Science & Technology | 24 | 45.3% |
| Business | 0 | 0.0% |
| Education | 0 | 0.0% |
| Literature & Languages | 0 | 0.0% |
| Liberal Arts & History | 0 | 0.0% |
| Visual & Performing Arts | 0 | 0.0% |
| Communications | 0 | 0.0% |
| Arts & Humanities | 0 | 0.0% |
| Total | 53 | 100.0% |
Transportation & Commute in Clarksburg
Vehicle Availability by Sex in Clarksburg
The most prevalent vehicle ownership categories in Clarksburg are males with 2 vehicles (62, accounting for 55.4%) and females with 2 vehicles (45, making up 65.3%).
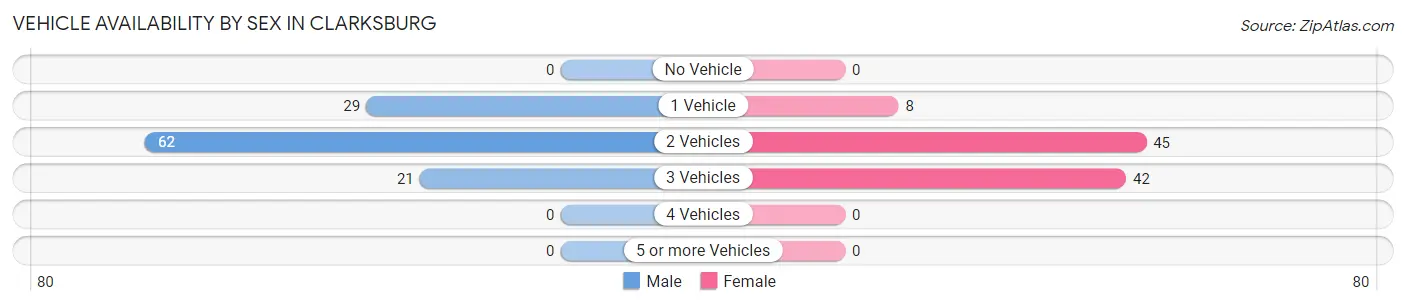
| Vehicles Available | Male | Female |
| No Vehicle | 0 (0.0%) | 0 (0.0%) |
| 1 Vehicle | 29 (25.9%) | 8 (8.4%) |
| 2 Vehicles | 62 (55.4%) | 45 (47.4%) |
| 3 Vehicles | 21 (18.8%) | 42 (44.2%) |
| 4 Vehicles | 0 (0.0%) | 0 (0.0%) |
| 5 or more Vehicles | 0 (0.0%) | 0 (0.0%) |
| Total | 112 (100.0%) | 95 (100.0%) |
Commute Time in Clarksburg
The most frequently occuring commute durations in Clarksburg are 30 to 34 minutes (97 commuters, 54.5%), 25 to 29 minutes (24 commuters, 13.5%), and 40 to 44 minutes (24 commuters, 13.5%).
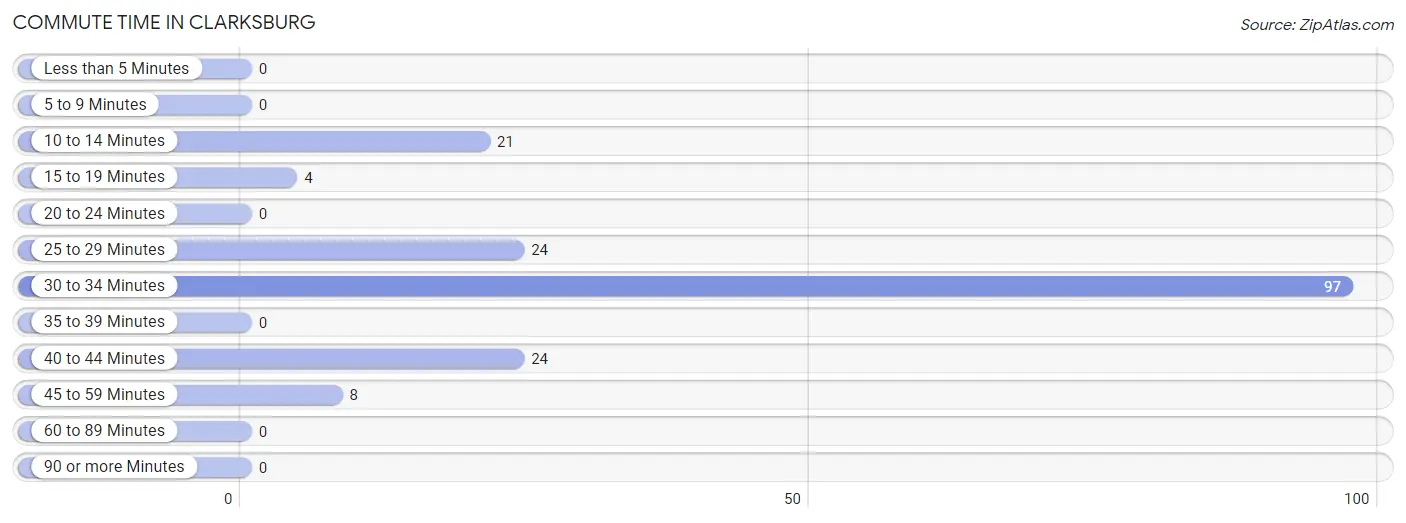
| Commute Time | # Commuters | % Commuters |
| Less than 5 Minutes | 0 | 0.0% |
| 5 to 9 Minutes | 0 | 0.0% |
| 10 to 14 Minutes | 21 | 11.8% |
| 15 to 19 Minutes | 4 | 2.2% |
| 20 to 24 Minutes | 0 | 0.0% |
| 25 to 29 Minutes | 24 | 13.5% |
| 30 to 34 Minutes | 97 | 54.5% |
| 35 to 39 Minutes | 0 | 0.0% |
| 40 to 44 Minutes | 24 | 13.5% |
| 45 to 59 Minutes | 8 | 4.5% |
| 60 to 89 Minutes | 0 | 0.0% |
| 90 or more Minutes | 0 | 0.0% |
Commute Time by Sex in Clarksburg
The most common commute times in Clarksburg are 30 to 34 minutes (58 commuters, 69.9%) for males and 30 to 34 minutes (39 commuters, 41.0%) for females.
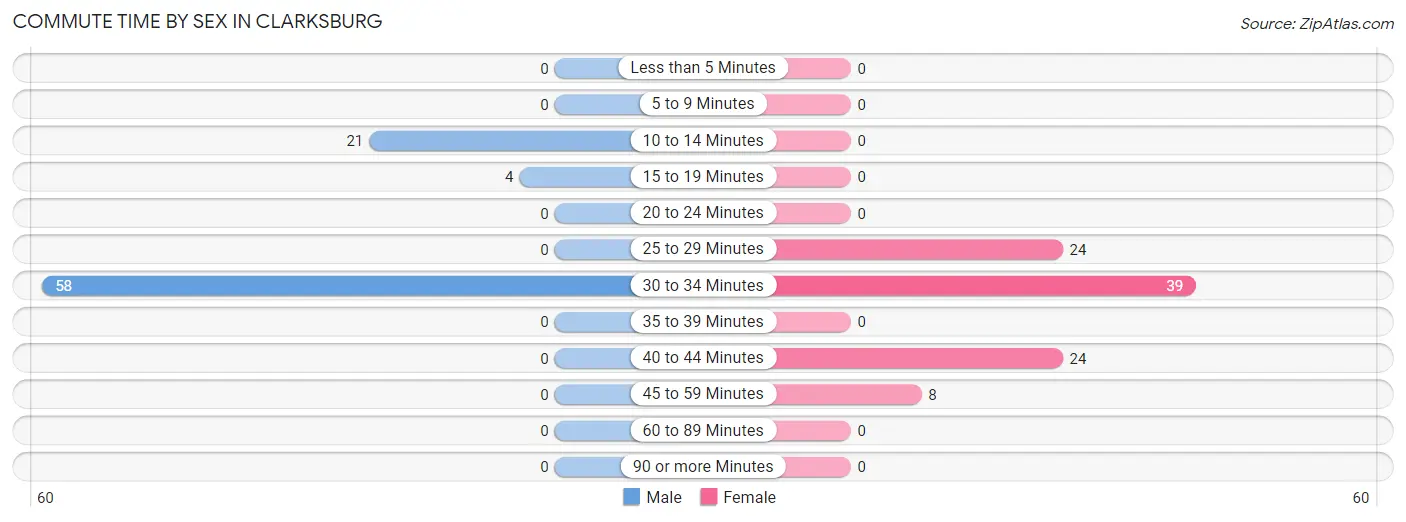
| Commute Time | Male | Female |
| Less than 5 Minutes | 0 (0.0%) | 0 (0.0%) |
| 5 to 9 Minutes | 0 (0.0%) | 0 (0.0%) |
| 10 to 14 Minutes | 21 (25.3%) | 0 (0.0%) |
| 15 to 19 Minutes | 4 (4.8%) | 0 (0.0%) |
| 20 to 24 Minutes | 0 (0.0%) | 0 (0.0%) |
| 25 to 29 Minutes | 0 (0.0%) | 24 (25.3%) |
| 30 to 34 Minutes | 58 (69.9%) | 39 (41.0%) |
| 35 to 39 Minutes | 0 (0.0%) | 0 (0.0%) |
| 40 to 44 Minutes | 0 (0.0%) | 24 (25.3%) |
| 45 to 59 Minutes | 0 (0.0%) | 8 (8.4%) |
| 60 to 89 Minutes | 0 (0.0%) | 0 (0.0%) |
| 90 or more Minutes | 0 (0.0%) | 0 (0.0%) |
Time of Departure to Work by Sex in Clarksburg
The most frequent times of departure to work in Clarksburg are 8:00 AM to 8:29 AM (58, 69.9%) for males and 8:00 AM to 8:29 AM (39, 41.0%) for females.
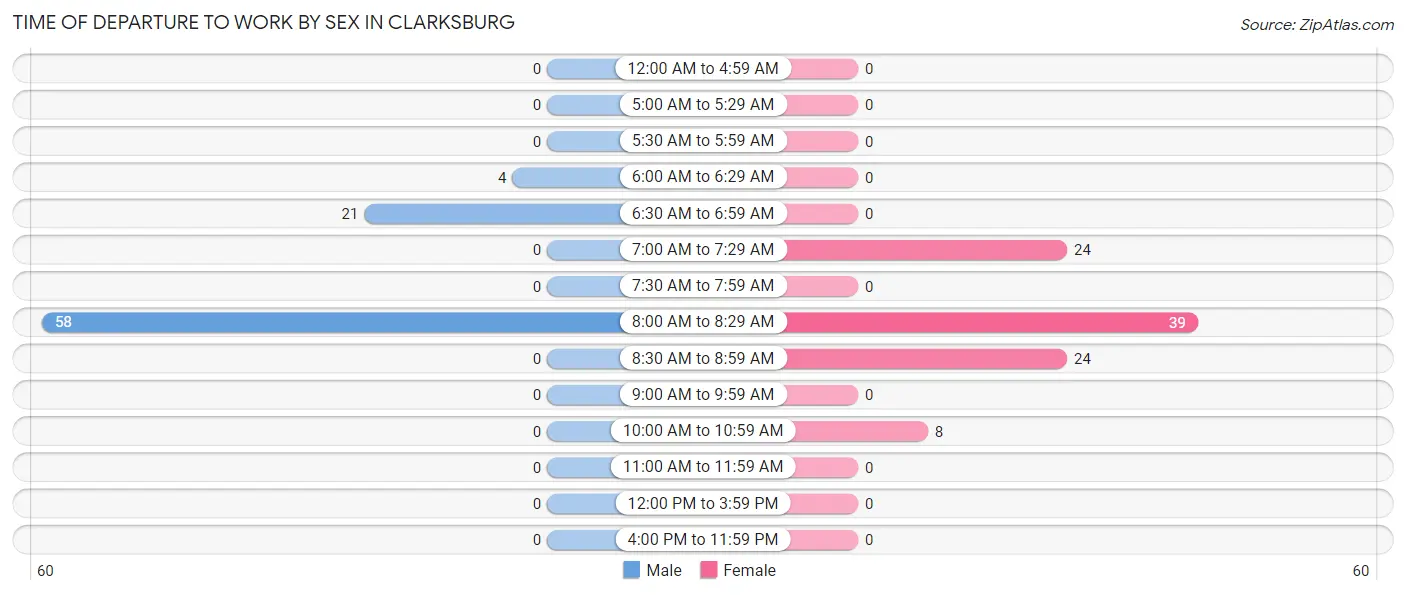
| Time of Departure | Male | Female |
| 12:00 AM to 4:59 AM | 0 (0.0%) | 0 (0.0%) |
| 5:00 AM to 5:29 AM | 0 (0.0%) | 0 (0.0%) |
| 5:30 AM to 5:59 AM | 0 (0.0%) | 0 (0.0%) |
| 6:00 AM to 6:29 AM | 4 (4.8%) | 0 (0.0%) |
| 6:30 AM to 6:59 AM | 21 (25.3%) | 0 (0.0%) |
| 7:00 AM to 7:29 AM | 0 (0.0%) | 24 (25.3%) |
| 7:30 AM to 7:59 AM | 0 (0.0%) | 0 (0.0%) |
| 8:00 AM to 8:29 AM | 58 (69.9%) | 39 (41.0%) |
| 8:30 AM to 8:59 AM | 0 (0.0%) | 24 (25.3%) |
| 9:00 AM to 9:59 AM | 0 (0.0%) | 0 (0.0%) |
| 10:00 AM to 10:59 AM | 0 (0.0%) | 8 (8.4%) |
| 11:00 AM to 11:59 AM | 0 (0.0%) | 0 (0.0%) |
| 12:00 PM to 3:59 PM | 0 (0.0%) | 0 (0.0%) |
| 4:00 PM to 11:59 PM | 0 (0.0%) | 0 (0.0%) |
| Total | 83 (100.0%) | 95 (100.0%) |
Housing Occupancy in Clarksburg
Occupancy by Ownership in Clarksburg
Of the total 129 dwellings in Clarksburg, owner-occupied units account for 48 (37.2%), while renter-occupied units make up 81 (62.8%).
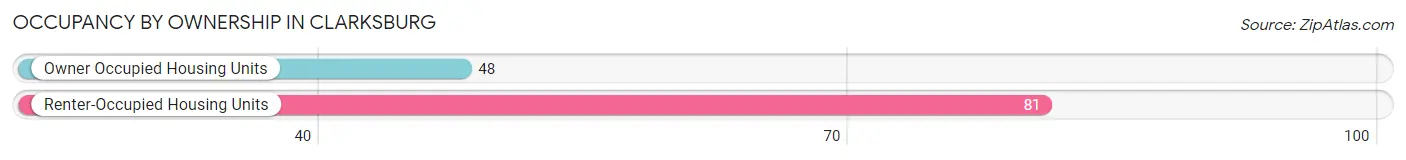
| Occupancy | # Housing Units | % Housing Units |
| Owner Occupied Housing Units | 48 | 37.2% |
| Renter-Occupied Housing Units | 81 | 62.8% |
| Total Occupied Housing Units | 129 | 100.0% |
Occupancy by Household Size in Clarksburg
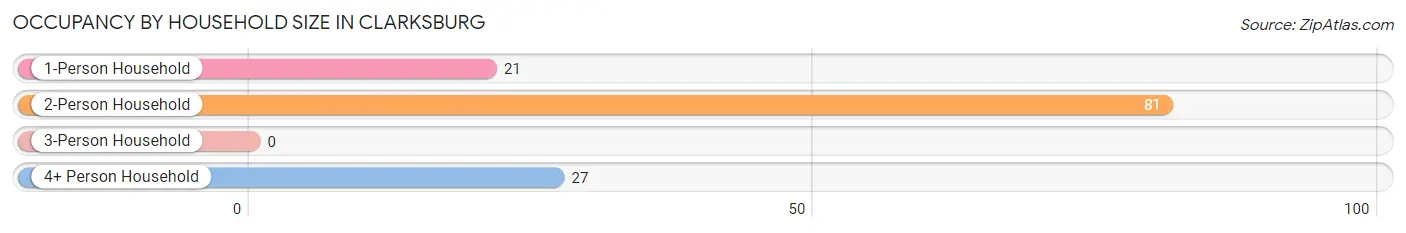
| Household Size | # Housing Units | % Housing Units |
| 1-Person Household | 21 | 16.3% |
| 2-Person Household | 81 | 62.8% |
| 3-Person Household | 0 | 0.0% |
| 4+ Person Household | 27 | 20.9% |
| Total Housing Units | 129 | 100.0% |
Occupancy by Ownership by Household Size in Clarksburg
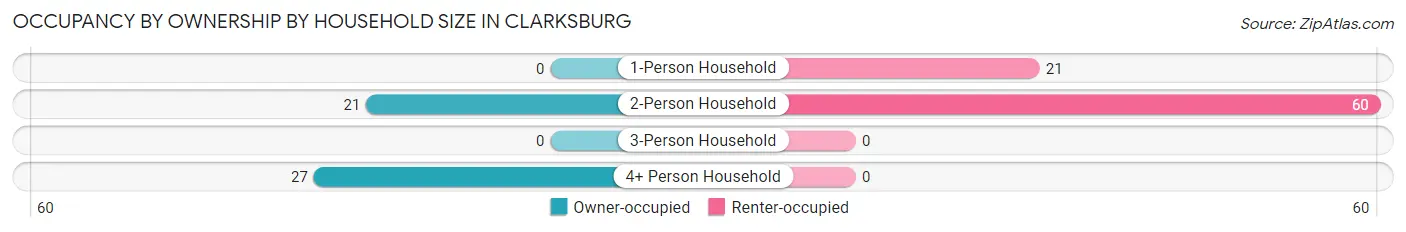
| Household Size | Owner-occupied | Renter-occupied |
| 1-Person Household | 0 (0.0%) | 21 (100.0%) |
| 2-Person Household | 21 (25.9%) | 60 (74.1%) |
| 3-Person Household | 0 (0.0%) | 0 (0.0%) |
| 4+ Person Household | 27 (100.0%) | 0 (0.0%) |
| Total Housing Units | 48 (37.2%) | 81 (62.8%) |
Occupancy by Educational Attainment in Clarksburg
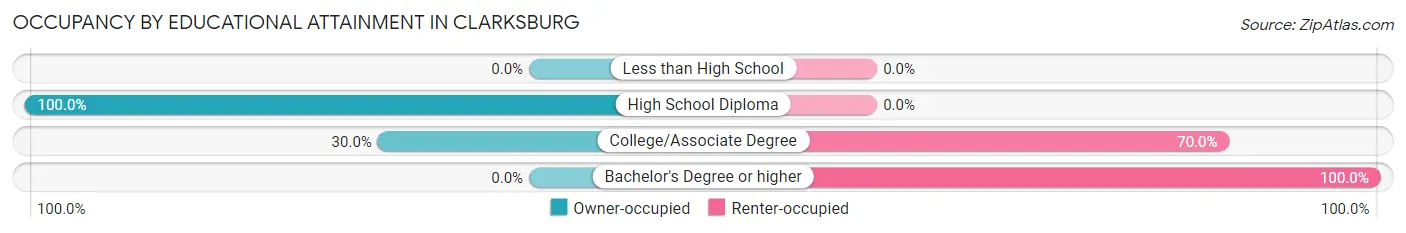
| Household Size | Owner-occupied | Renter-occupied |
| Less than High School | 0 (0.0%) | 0 (0.0%) |
| High School Diploma | 27 (100.0%) | 0 (0.0%) |
| College/Associate Degree | 21 (30.0%) | 49 (70.0%) |
| Bachelor's Degree or higher | 0 (0.0%) | 32 (100.0%) |
Occupancy by Age of Householder in Clarksburg
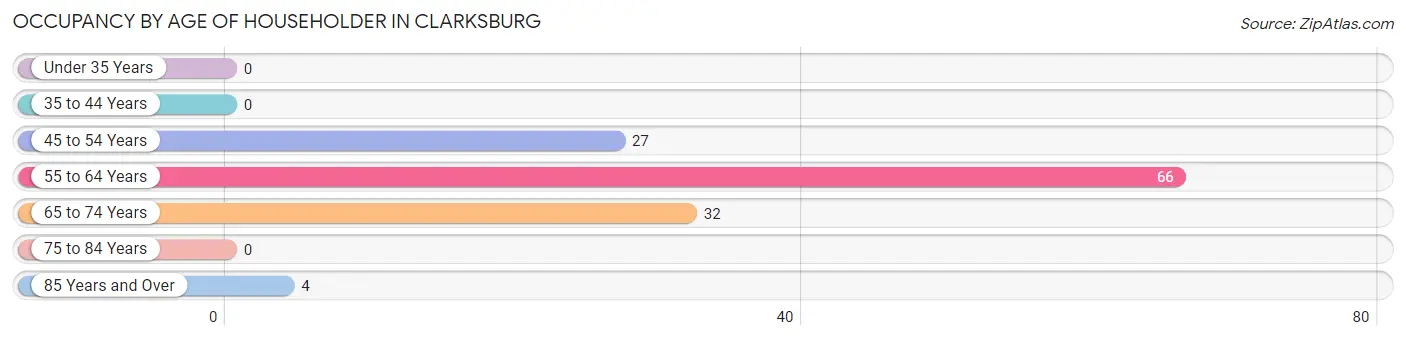
| Age Bracket | # Households | % Households |
| Under 35 Years | 0 | 0.0% |
| 35 to 44 Years | 0 | 0.0% |
| 45 to 54 Years | 27 | 20.9% |
| 55 to 64 Years | 66 | 51.2% |
| 65 to 74 Years | 32 | 24.8% |
| 75 to 84 Years | 0 | 0.0% |
| 85 Years and Over | 4 | 3.1% |
| Total | 129 | 100.0% |
Housing Finances in Clarksburg
Median Income by Occupancy in Clarksburg
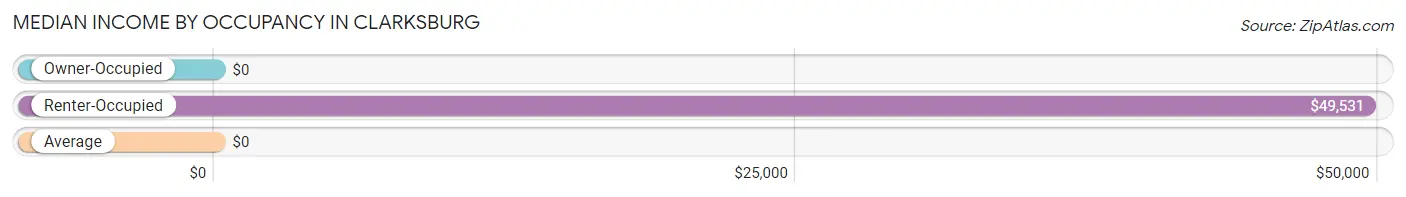
| Occupancy Type | # Households | Median Income |
| Owner-Occupied | 48 (37.2%) | $0 |
| Renter-Occupied | 81 (62.8%) | $49,531 |
| Average | 129 (100.0%) | $0 |
Occupancy by Householder Income Bracket in Clarksburg
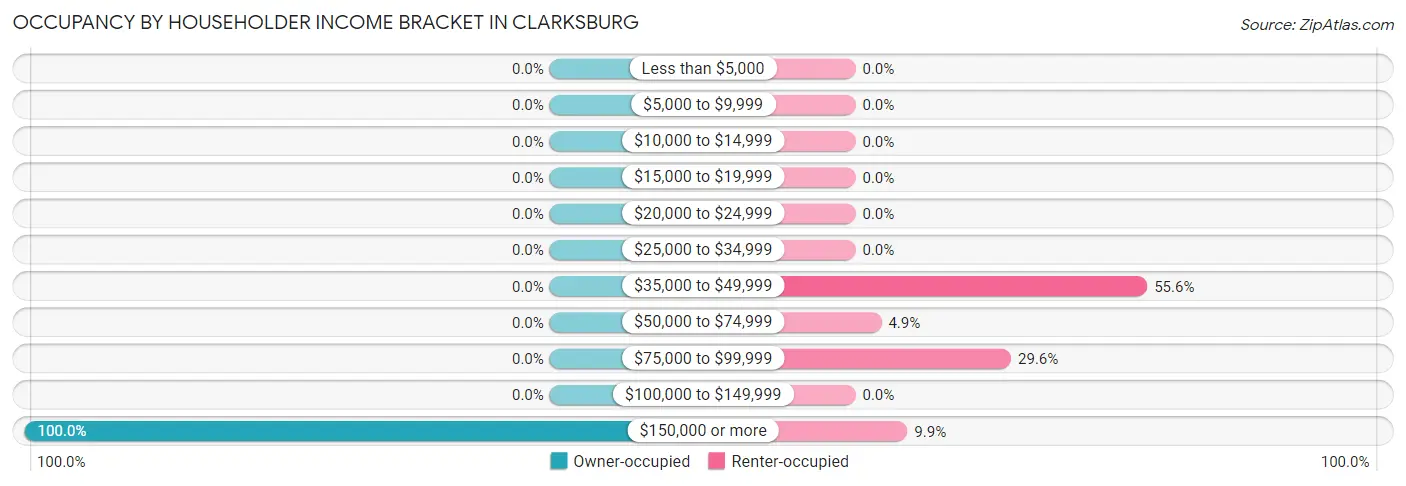
| Income Bracket | Owner-occupied | Renter-occupied |
| Less than $5,000 | 0 (0.0%) | 0 (0.0%) |
| $5,000 to $9,999 | 0 (0.0%) | 0 (0.0%) |
| $10,000 to $14,999 | 0 (0.0%) | 0 (0.0%) |
| $15,000 to $19,999 | 0 (0.0%) | 0 (0.0%) |
| $20,000 to $24,999 | 0 (0.0%) | 0 (0.0%) |
| $25,000 to $34,999 | 0 (0.0%) | 0 (0.0%) |
| $35,000 to $49,999 | 0 (0.0%) | 45 (55.6%) |
| $50,000 to $74,999 | 0 (0.0%) | 4 (4.9%) |
| $75,000 to $99,999 | 0 (0.0%) | 24 (29.6%) |
| $100,000 to $149,999 | 0 (0.0%) | 0 (0.0%) |
| $150,000 or more | 48 (100.0%) | 8 (9.9%) |
| Total | 48 (100.0%) | 81 (100.0%) |
Monthly Housing Cost Tiers in Clarksburg
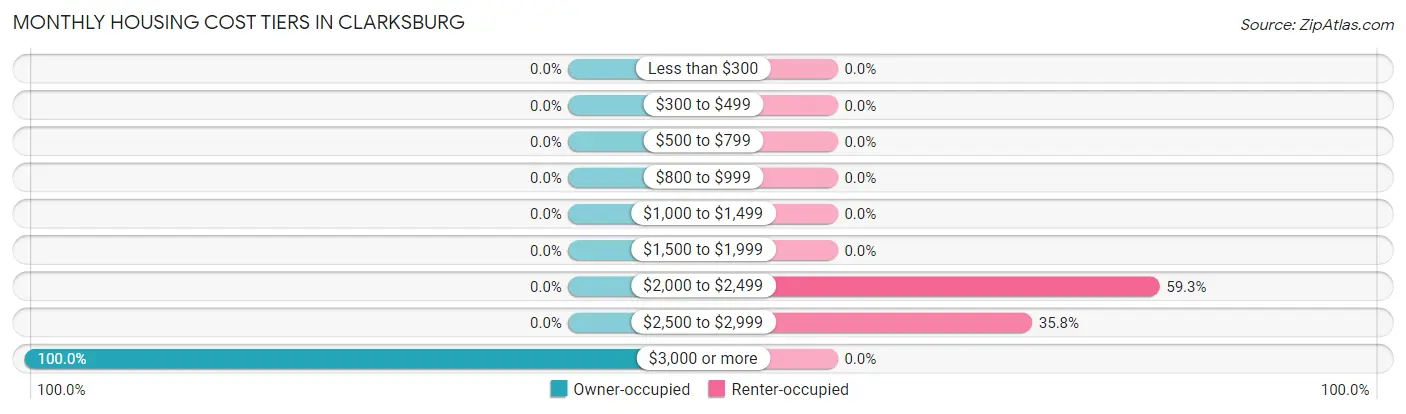
| Monthly Cost | Owner-occupied | Renter-occupied |
| Less than $300 | 0 (0.0%) | 0 (0.0%) |
| $300 to $499 | 0 (0.0%) | 0 (0.0%) |
| $500 to $799 | 0 (0.0%) | 0 (0.0%) |
| $800 to $999 | 0 (0.0%) | 0 (0.0%) |
| $1,000 to $1,499 | 0 (0.0%) | 0 (0.0%) |
| $1,500 to $1,999 | 0 (0.0%) | 0 (0.0%) |
| $2,000 to $2,499 | 0 (0.0%) | 48 (59.3%) |
| $2,500 to $2,999 | 0 (0.0%) | 29 (35.8%) |
| $3,000 or more | 48 (100.0%) | 0 (0.0%) |
| Total | 48 (100.0%) | 81 (100.0%) |
Physical Housing Characteristics in Clarksburg
Housing Structures in Clarksburg
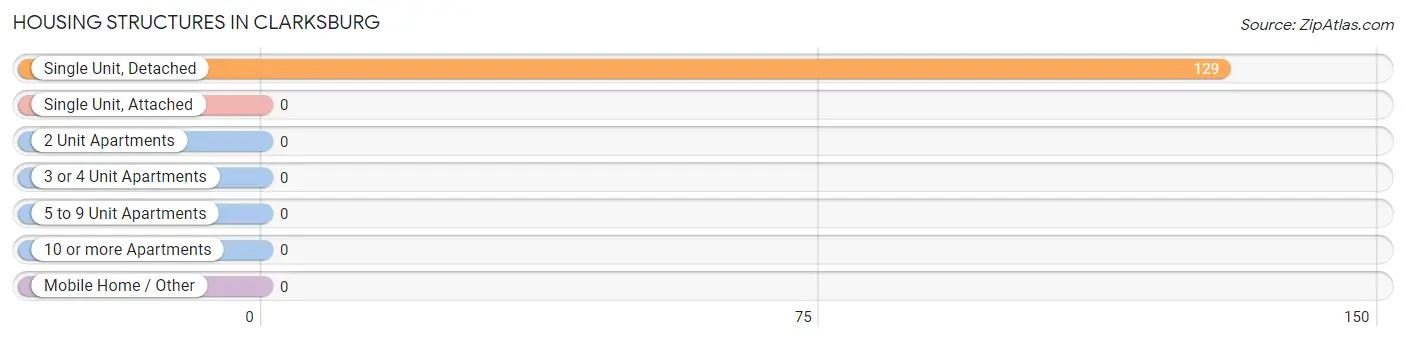
| Structure Type | # Housing Units | % Housing Units |
| Single Unit, Detached | 129 | 100.0% |
| Single Unit, Attached | 0 | 0.0% |
| 2 Unit Apartments | 0 | 0.0% |
| 3 or 4 Unit Apartments | 0 | 0.0% |
| 5 to 9 Unit Apartments | 0 | 0.0% |
| 10 or more Apartments | 0 | 0.0% |
| Mobile Home / Other | 0 | 0.0% |
| Total | 129 | 100.0% |
Housing Structures by Occupancy in Clarksburg
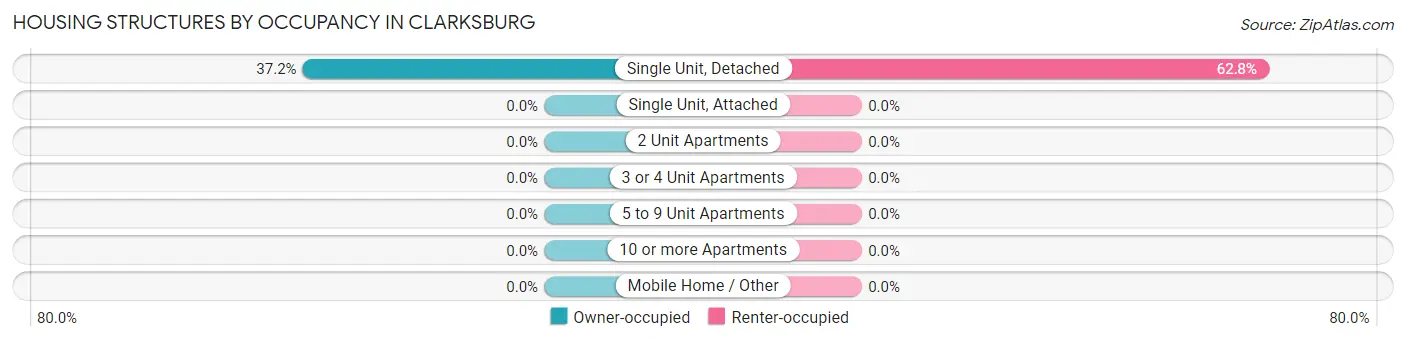
| Structure Type | Owner-occupied | Renter-occupied |
| Single Unit, Detached | 48 (37.2%) | 81 (62.8%) |
| Single Unit, Attached | 0 (0.0%) | 0 (0.0%) |
| 2 Unit Apartments | 0 (0.0%) | 0 (0.0%) |
| 3 or 4 Unit Apartments | 0 (0.0%) | 0 (0.0%) |
| 5 to 9 Unit Apartments | 0 (0.0%) | 0 (0.0%) |
| 10 or more Apartments | 0 (0.0%) | 0 (0.0%) |
| Mobile Home / Other | 0 (0.0%) | 0 (0.0%) |
| Total | 48 (37.2%) | 81 (62.8%) |
Housing Structures by Number of Rooms in Clarksburg
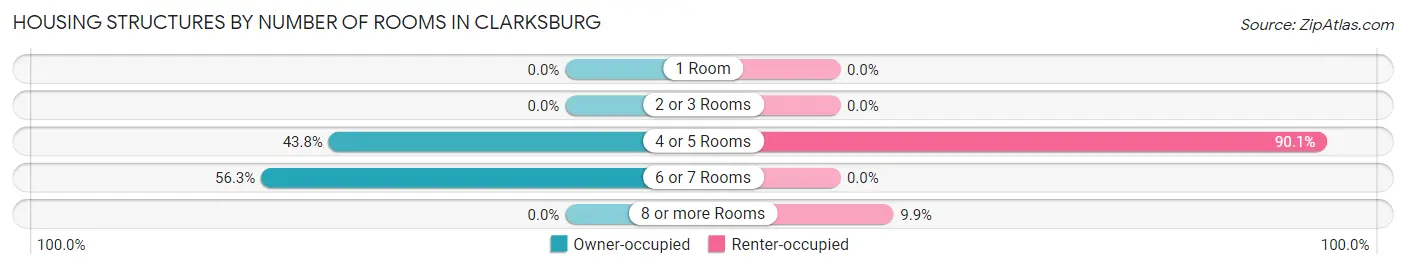
| Number of Rooms | Owner-occupied | Renter-occupied |
| 1 Room | 0 (0.0%) | 0 (0.0%) |
| 2 or 3 Rooms | 0 (0.0%) | 0 (0.0%) |
| 4 or 5 Rooms | 21 (43.8%) | 73 (90.1%) |
| 6 or 7 Rooms | 27 (56.2%) | 0 (0.0%) |
| 8 or more Rooms | 0 (0.0%) | 8 (9.9%) |
| Total | 48 (100.0%) | 81 (100.0%) |
Housing Structure by Heating Type in Clarksburg
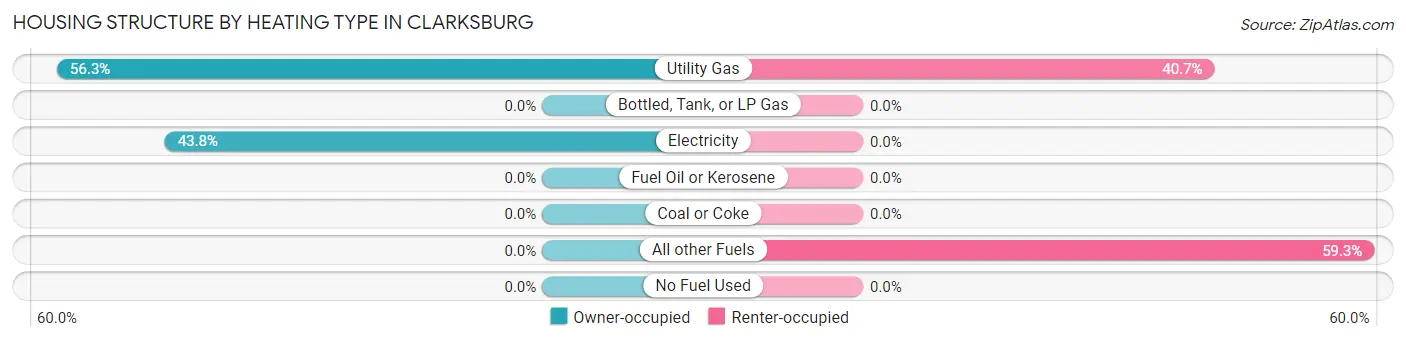
| Heating Type | Owner-occupied | Renter-occupied |
| Utility Gas | 27 (56.2%) | 33 (40.7%) |
| Bottled, Tank, or LP Gas | 0 (0.0%) | 0 (0.0%) |
| Electricity | 21 (43.8%) | 0 (0.0%) |
| Fuel Oil or Kerosene | 0 (0.0%) | 0 (0.0%) |
| Coal or Coke | 0 (0.0%) | 0 (0.0%) |
| All other Fuels | 0 (0.0%) | 48 (59.3%) |
| No Fuel Used | 0 (0.0%) | 0 (0.0%) |
| Total | 48 (100.0%) | 81 (100.0%) |
Household Vehicle Usage in Clarksburg
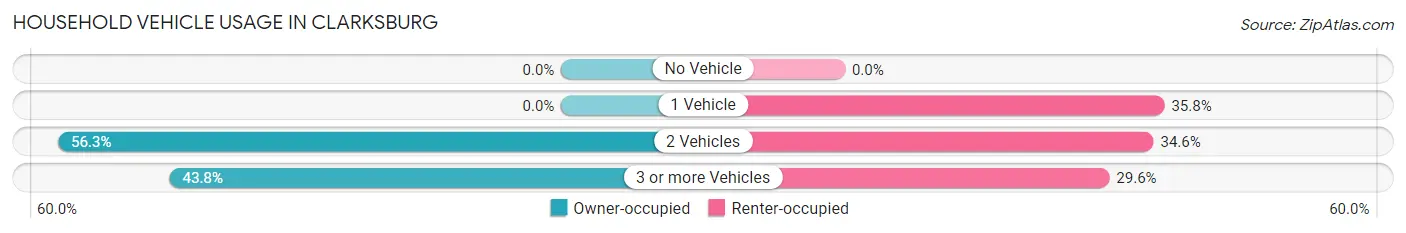
| Vehicles per Household | Owner-occupied | Renter-occupied |
| No Vehicle | 0 (0.0%) | 0 (0.0%) |
| 1 Vehicle | 0 (0.0%) | 29 (35.8%) |
| 2 Vehicles | 27 (56.2%) | 28 (34.6%) |
| 3 or more Vehicles | 21 (43.8%) | 24 (29.6%) |
| Total | 48 (100.0%) | 81 (100.0%) |
Real Estate & Mortgages in Clarksburg
Real Estate and Mortgage Overview in Clarksburg
| Characteristic | Without Mortgage | With Mortgage |
| Housing Units | 0 | 48 |
| Median Property Value | - | - |
| Median Household Income | - | - |
| Monthly Housing Costs | - | - |
| Real Estate Taxes | - | - |
Property Value by Mortgage Status in Clarksburg
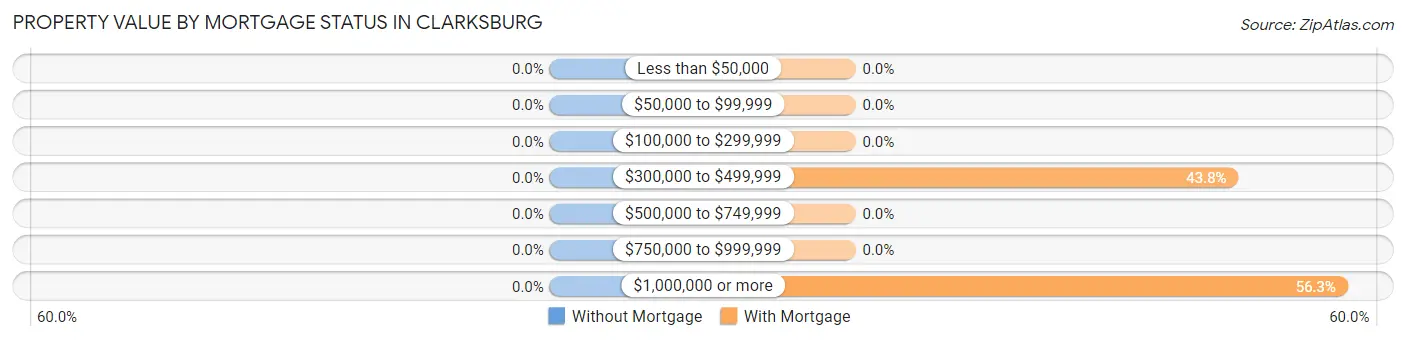
| Property Value | Without Mortgage | With Mortgage |
| Less than $50,000 | 0 (0.0%) | 0 (0.0%) |
| $50,000 to $99,999 | 0 (0.0%) | 0 (0.0%) |
| $100,000 to $299,999 | 0 (0.0%) | 0 (0.0%) |
| $300,000 to $499,999 | 0 (0.0%) | 21 (43.8%) |
| $500,000 to $749,999 | 0 (0.0%) | 0 (0.0%) |
| $750,000 to $999,999 | 0 (0.0%) | 0 (0.0%) |
| $1,000,000 or more | 0 (0.0%) | 27 (56.2%) |
| Total | 0 (0.0%) | 48 (100.0%) |
Household Income by Mortgage Status in Clarksburg
| Household Income | Without Mortgage | With Mortgage |
| Less than $10,000 | 0 (0.0%) | 0 (0.0%) |
| $10,000 to $24,999 | 0 (0.0%) | 0 (0.0%) |
| $25,000 to $34,999 | 0 (0.0%) | 0 (0.0%) |
| $35,000 to $49,999 | 0 (0.0%) | 0 (0.0%) |
| $50,000 to $74,999 | 0 (0.0%) | 0 (0.0%) |
| $75,000 to $99,999 | 0 (0.0%) | 0 (0.0%) |
| $100,000 to $149,999 | 0 (0.0%) | 0 (0.0%) |
| $150,000 or more | 0 (0.0%) | 0 (0.0%) |
| Total | 0 (0.0%) | 48 (100.0%) |
Property Value to Household Income Ratio in Clarksburg
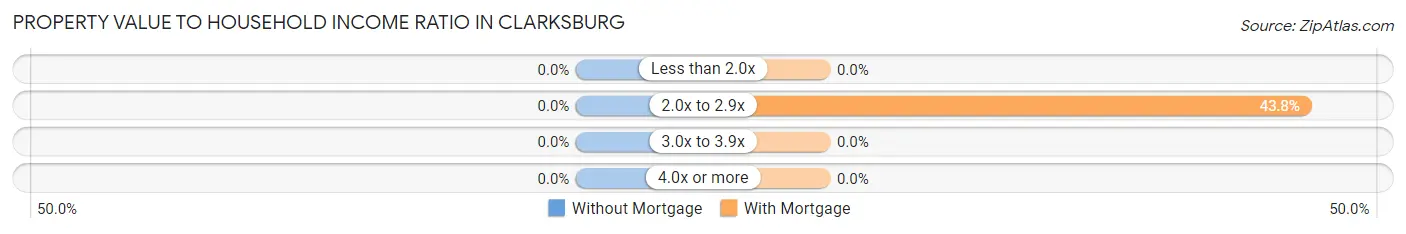
| Value-to-Income Ratio | Without Mortgage | With Mortgage |
| Less than 2.0x | 0 (0.0%) | 0 (0.0%) |
| 2.0x to 2.9x | 0 (0.0%) | 21 (43.8%) |
| 3.0x to 3.9x | 0 (0.0%) | 0 (0.0%) |
| 4.0x or more | 0 (0.0%) | 0 (0.0%) |
| Total | 0 (0.0%) | 48 (100.0%) |
Real Estate Taxes by Mortgage Status in Clarksburg
| Property Taxes | Without Mortgage | With Mortgage |
| Less than $800 | 0 (0.0%) | 0 (0.0%) |
| $800 to $1,499 | 0 (0.0%) | 0 (0.0%) |
| $800 to $1,499 | 0 (0.0%) | 0 (0.0%) |
| Total | 0 (0.0%) | 48 (100.0%) |
Health & Disability in Clarksburg
Health Insurance Coverage by Age in Clarksburg
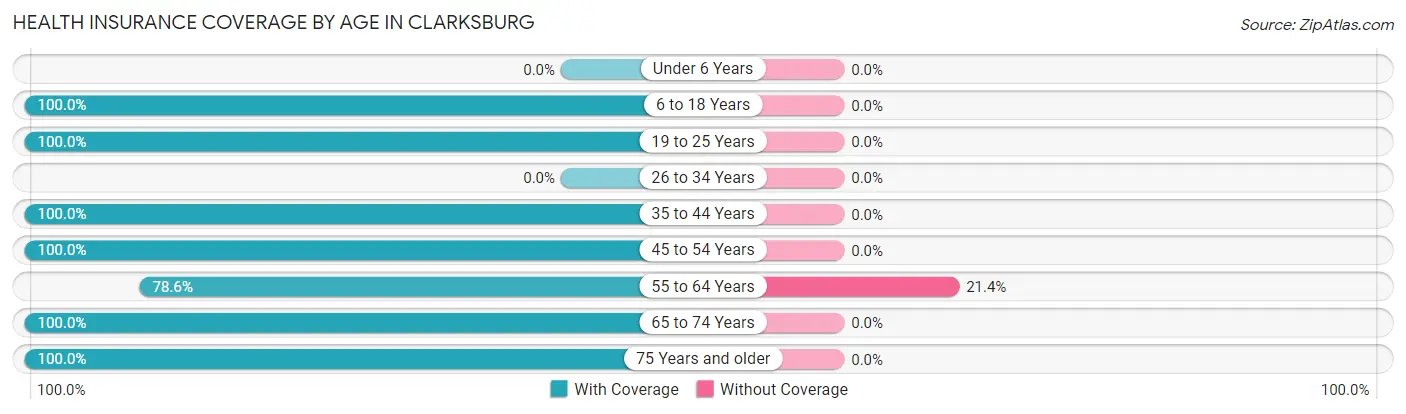
| Age Bracket | With Coverage | Without Coverage |
| Under 6 Years | 0 (0.0%) | 0 (0.0%) |
| 6 to 18 Years | 39 (100.0%) | 0 (0.0%) |
| 19 to 25 Years | 58 (100.0%) | 0 (0.0%) |
| 26 to 34 Years | 0 (0.0%) | 0 (0.0%) |
| 35 to 44 Years | 21 (100.0%) | 0 (0.0%) |
| 45 to 54 Years | 45 (100.0%) | 0 (0.0%) |
| 55 to 64 Years | 77 (78.6%) | 21 (21.4%) |
| 65 to 74 Years | 37 (100.0%) | 0 (0.0%) |
| 75 Years and older | 4 (100.0%) | 0 (0.0%) |
| Total | 281 (93.0%) | 21 (7.0%) |
Health Insurance Coverage by Citizenship Status in Clarksburg
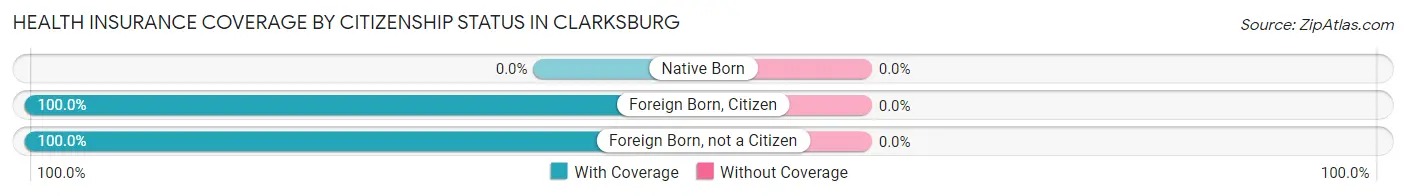
| Citizenship Status | With Coverage | Without Coverage |
| Native Born | 0 (0.0%) | 0 (0.0%) |
| Foreign Born, Citizen | 39 (100.0%) | 0 (0.0%) |
| Foreign Born, not a Citizen | 58 (100.0%) | 0 (0.0%) |
Health Insurance Coverage by Household Income in Clarksburg
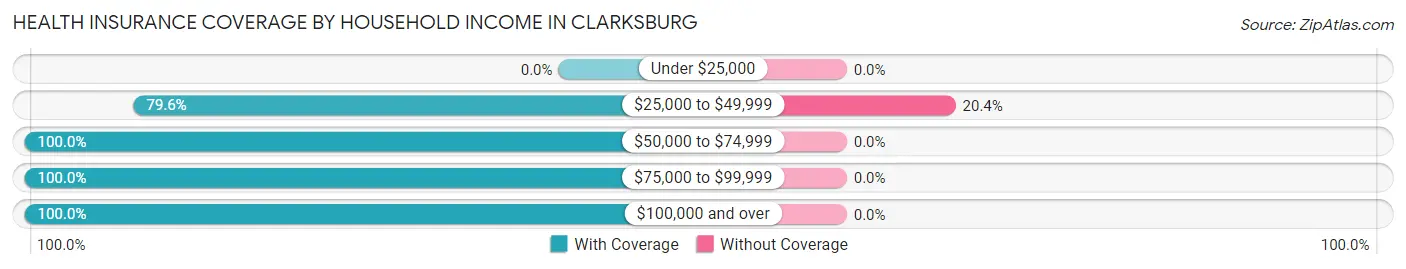
| Household Income | With Coverage | Without Coverage |
| Under $25,000 | 0 (0.0%) | 0 (0.0%) |
| $25,000 to $49,999 | 82 (79.6%) | 21 (20.4%) |
| $50,000 to $74,999 | 9 (100.0%) | 0 (0.0%) |
| $75,000 to $99,999 | 48 (100.0%) | 0 (0.0%) |
| $100,000 and over | 142 (100.0%) | 0 (0.0%) |
Public vs Private Health Insurance Coverage by Age in Clarksburg
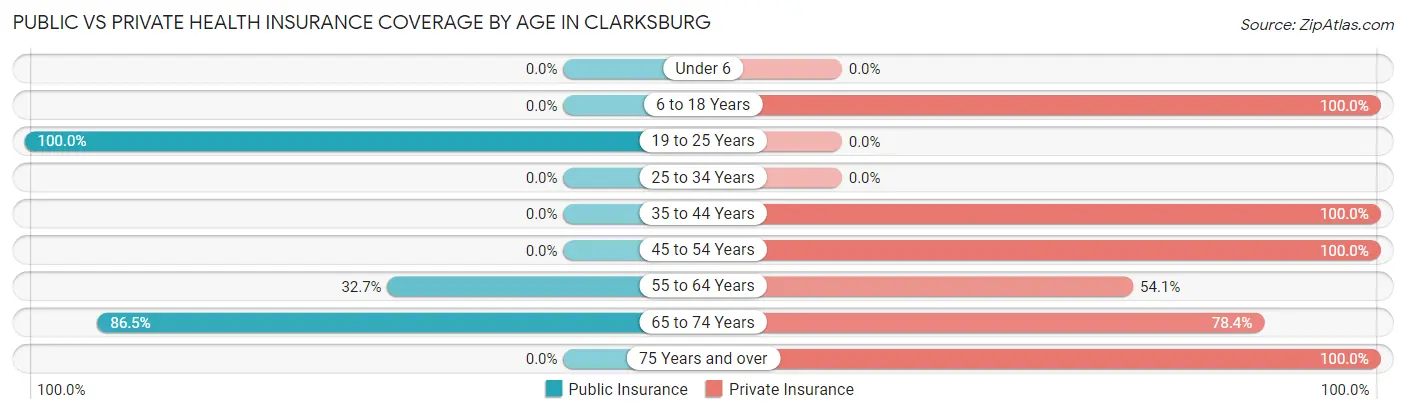
| Age Bracket | Public Insurance | Private Insurance |
| Under 6 | 0 (0.0%) | 0 (0.0%) |
| 6 to 18 Years | 0 (0.0%) | 39 (100.0%) |
| 19 to 25 Years | 58 (100.0%) | 0 (0.0%) |
| 25 to 34 Years | 0 (0.0%) | 0 (0.0%) |
| 35 to 44 Years | 0 (0.0%) | 21 (100.0%) |
| 45 to 54 Years | 0 (0.0%) | 45 (100.0%) |
| 55 to 64 Years | 32 (32.7%) | 53 (54.1%) |
| 65 to 74 Years | 32 (86.5%) | 29 (78.4%) |
| 75 Years and over | 0 (0.0%) | 4 (100.0%) |
| Total | 122 (40.4%) | 191 (63.2%) |
Disability Status by Sex by Age in Clarksburg
| Age Bracket | Male | Female |
| Under 5 Years | 0 (0.0%) | 0 (0.0%) |
| 5 to 17 Years | 0 (0.0%) | 0 (0.0%) |
| 18 to 34 Years | 0 (0.0%) | 0 (0.0%) |
| 35 to 64 Years | 0 (0.0%) | 0 (0.0%) |
| 65 to 74 Years | 0 (0.0%) | 0 (0.0%) |
| 75 Years and over | 0 (0.0%) | 0 (0.0%) |
Disability Class by Sex by Age in Clarksburg
Disability Class: Hearing Difficulty
| Age Bracket | Male | Female |
| Under 5 Years | 0 (0.0%) | 0 (0.0%) |
| 5 to 17 Years | 0 (0.0%) | 0 (0.0%) |
| 18 to 34 Years | 0 (0.0%) | 0 (0.0%) |
| 35 to 64 Years | 0 (0.0%) | 0 (0.0%) |
| 65 to 74 Years | 0 (0.0%) | 0 (0.0%) |
| 75 Years and over | 0 (0.0%) | 0 (0.0%) |
Disability Class: Vision Difficulty
| Age Bracket | Male | Female |
| Under 5 Years | 0 (0.0%) | 0 (0.0%) |
| 5 to 17 Years | 0 (0.0%) | 0 (0.0%) |
| 18 to 34 Years | 0 (0.0%) | 0 (0.0%) |
| 35 to 64 Years | 0 (0.0%) | 0 (0.0%) |
| 65 to 74 Years | 0 (0.0%) | 0 (0.0%) |
| 75 Years and over | 0 (0.0%) | 0 (0.0%) |
Disability Class: Cognitive Difficulty

| Age Bracket | Male | Female |
| 5 to 17 Years | 0 (0.0%) | 0 (0.0%) |
| 18 to 34 Years | 0 (0.0%) | 0 (0.0%) |
| 35 to 64 Years | 0 (0.0%) | 0 (0.0%) |
| 65 to 74 Years | 0 (0.0%) | 0 (0.0%) |
| 75 Years and over | 0 (0.0%) | 0 (0.0%) |
Disability Class: Ambulatory Difficulty
| Age Bracket | Male | Female |
| 5 to 17 Years | 0 (0.0%) | 0 (0.0%) |
| 18 to 34 Years | 0 (0.0%) | 0 (0.0%) |
| 35 to 64 Years | 0 (0.0%) | 0 (0.0%) |
| 65 to 74 Years | 0 (0.0%) | 0 (0.0%) |
| 75 Years and over | 0 (0.0%) | 0 (0.0%) |
Disability Class: Self-Care Difficulty
| Age Bracket | Male | Female |
| 5 to 17 Years | 0 (0.0%) | 0 (0.0%) |
| 18 to 34 Years | 0 (0.0%) | 0 (0.0%) |
| 35 to 64 Years | 0 (0.0%) | 0 (0.0%) |
| 65 to 74 Years | 0 (0.0%) | 0 (0.0%) |
| 75 Years and over | 0 (0.0%) | 0 (0.0%) |
Technology Access in Clarksburg
Computing Device Access in Clarksburg
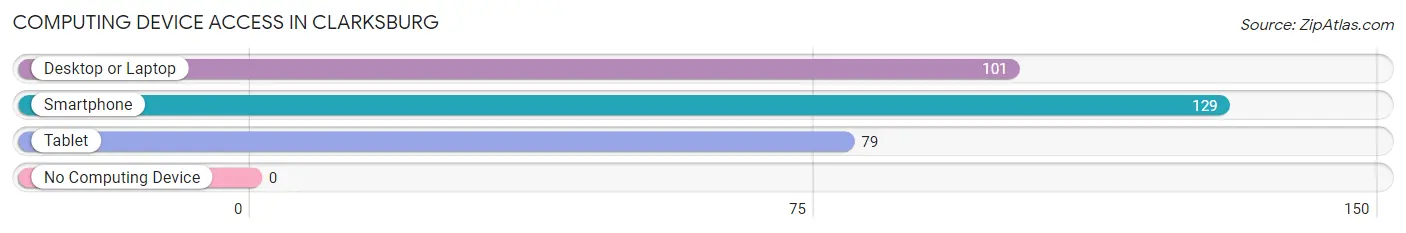
| Device Type | # Households | % Households |
| Desktop or Laptop | 101 | 78.3% |
| Smartphone | 129 | 100.0% |
| Tablet | 79 | 61.2% |
| No Computing Device | 0 | 0.0% |
| Total | 129 | 100.0% |
Internet Access in Clarksburg
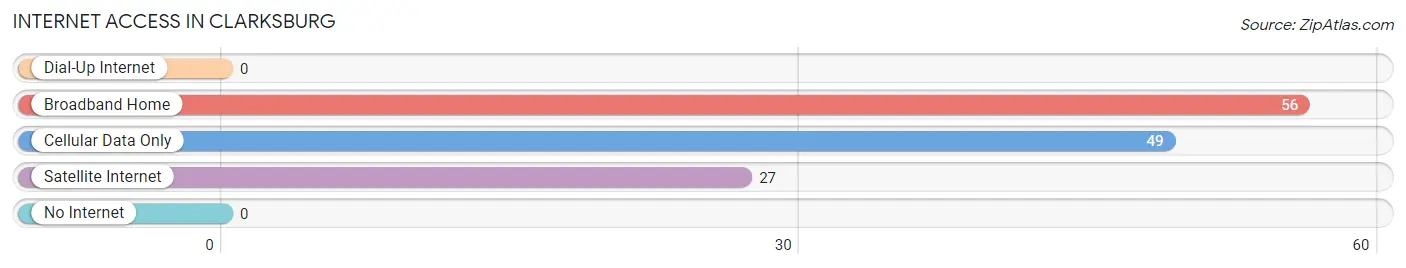
| Internet Type | # Households | % Households |
| Dial-Up Internet | 0 | 0.0% |
| Broadband Home | 56 | 43.4% |
| Cellular Data Only | 49 | 38.0% |
| Satellite Internet | 27 | 20.9% |
| No Internet | 0 | 0.0% |
| Total | 129 | 100.0% |
Clarksburg Summary
Clarksburg, California is a small unincorporated community located in Yolo County, California. It is situated on the Sacramento River, approximately 10 miles south of the city of Sacramento. The population of Clarksburg was estimated to be 1,743 in 2019.
History
Clarksburg was founded in 1851 by William Clark, a settler from Missouri. He named the town after himself and it quickly became a thriving agricultural community. The town was incorporated in 1872 and was the first incorporated town in Yolo County.
In the late 19th century, Clarksburg was a major shipping port for the Sacramento River. It was also a popular destination for steamboats and paddlewheelers. The town was also home to a number of businesses, including a hotel, a general store, a blacksmith shop, and a saloon.
In the early 20th century, Clarksburg began to decline as the railroad bypassed the town and the river shipping industry declined. The town was eventually annexed by the city of Sacramento in the 1950s.
Geography
Clarksburg is located in Yolo County, California, approximately 10 miles south of the city of Sacramento. It is situated on the Sacramento River, which forms the western boundary of the town. The town is located in the Central Valley of California, which is a large agricultural region. The climate in Clarksburg is mild and temperate, with hot summers and cool winters.
The town is surrounded by agricultural land, including vineyards, orchards, and fields of crops. The nearby Sacramento River provides recreational opportunities, such as fishing, boating, and swimming.
Economy
The economy of Clarksburg is largely based on agriculture. The town is surrounded by vineyards, orchards, and fields of crops. The nearby Sacramento River provides recreational opportunities, such as fishing, boating, and swimming.
The town is also home to a number of businesses, including a hotel, a general store, a blacksmith shop, and a saloon. In addition, there are several wineries in the area, as well as a number of restaurants and bars.
Demographics
The population of Clarksburg was estimated to be 1,743 in 2019. The racial makeup of the town is predominantly white (83.3%), followed by Hispanic or Latino (7.7%), Asian (3.7%), and African American (2.3%). The median household income in Clarksburg is $63,917, and the median age is 39.7 years.
Conclusion
Clarksburg, California is a small unincorporated community located in Yolo County, California. It is situated on the Sacramento River, approximately 10 miles south of the city of Sacramento. The population of Clarksburg was estimated to be 1,743 in 2019. The town is largely based on agriculture, with vineyards, orchards, and fields of crops surrounding the town. The nearby Sacramento River provides recreational opportunities, such as fishing, boating, and swimming. The racial makeup of the town is predominantly white, followed by Hispanic or Latino, Asian, and African American. The median household income in Clarksburg is $63,917, and the median age is 39.7 years.
Common Questions
What is Per Capita Income in Clarksburg?
Per Capita income in Clarksburg is $54,746.
What is Inequality or Gini Index in Clarksburg?
Inequality or Gini Index in Clarksburg is 0.37.
What is the Total Population of Clarksburg?
Total Population of Clarksburg is 302.
What is the Total Male Population of Clarksburg?
Total Male Population of Clarksburg is 163.
What is the Total Female Population of Clarksburg?
Total Female Population of Clarksburg is 139.
What is the Ratio of Males per 100 Females in Clarksburg?
There are 117.27 Males per 100 Females in Clarksburg.
What is the Ratio of Females per 100 Males in Clarksburg?
There are 85.28 Females per 100 Males in Clarksburg.
What is the Median Population Age in Clarksburg?
Median Population Age in Clarksburg is 51.3 Years.
What is the Average Family Size in Clarksburg
Average Family Size in Clarksburg is 2.6 People.
What is the Average Household Size in Clarksburg
Average Household Size in Clarksburg is 2.3 People.
How Large is the Labor Force in Clarksburg?
There are 258 People in the Labor Forcein in Clarksburg.
What is the Percentage of People in the Labor Force in Clarksburg?
98.1% of People are in the Labor Force in Clarksburg.
What is the Unemployment Rate in Clarksburg?
Unemployment Rate in Clarksburg is 19.8%.