Chualar, CA Map & Demographics
Chualar Map
Chualar Overview
$18,942
PER CAPITA INCOME
$55,000
AVG FAMILY INCOME
18.8%
WAGE / INCOME GAP [ % ]
81.2¢/ $1
WAGE / INCOME GAP [ $ ]
0.42
INEQUALITY / GINI INDEX
959
TOTAL POPULATION
521
MALE POPULATION
438
FEMALE POPULATION
118.95
MALES / 100 FEMALES
84.07
FEMALES / 100 MALES
31.4
MEDIAN AGE
4.8
AVG FAMILY SIZE
4.6
AVG HOUSEHOLD SIZE
419
LABOR FORCE [ PEOPLE ]
60.6%
PERCENT IN LABOR FORCE
1.7%
UNEMPLOYMENT RATE
Chualar Zip Codes
Chualar Area Codes
Income in Chualar
Income Overview in Chualar
| Characteristic | Number | Measure |
| Per Capita Income | 959 | $18,942 |
| Median Family Income | 182 | $55,000 |
| Mean Family Income | 182 | $76,338 |
| Median Household Income | 207 | $0 |
| Mean Household Income | 207 | $88,721 |
| Income Deficit | 182 | $0 |
| Wage / Income Gap (%) | 959 | 18.78% |
| Wage / Income Gap ($) | 959 | 81.22¢ per $1 |
| Gini / Inequality Index | 959 | 0.42 |
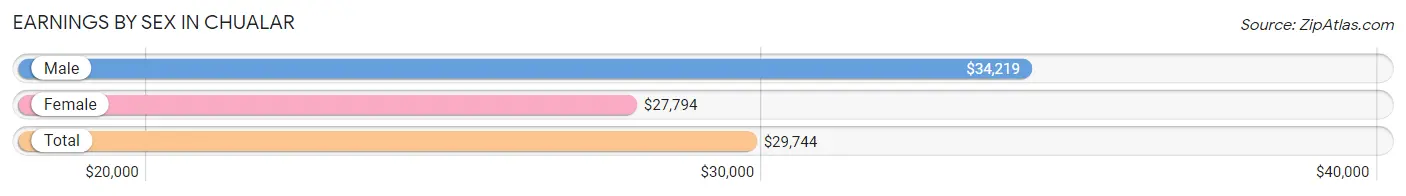
Earnings by Sex in Chualar
Average Earnings in Chualar are $29,744, $34,219 for men and $27,794 for women, a difference of 18.8%.
| Sex | Number | Average Earnings |
| Male | 254 (56.4%) | $34,219 |
| Female | 196 (43.6%) | $27,794 |
| Total | 450 (100.0%) | $29,744 |
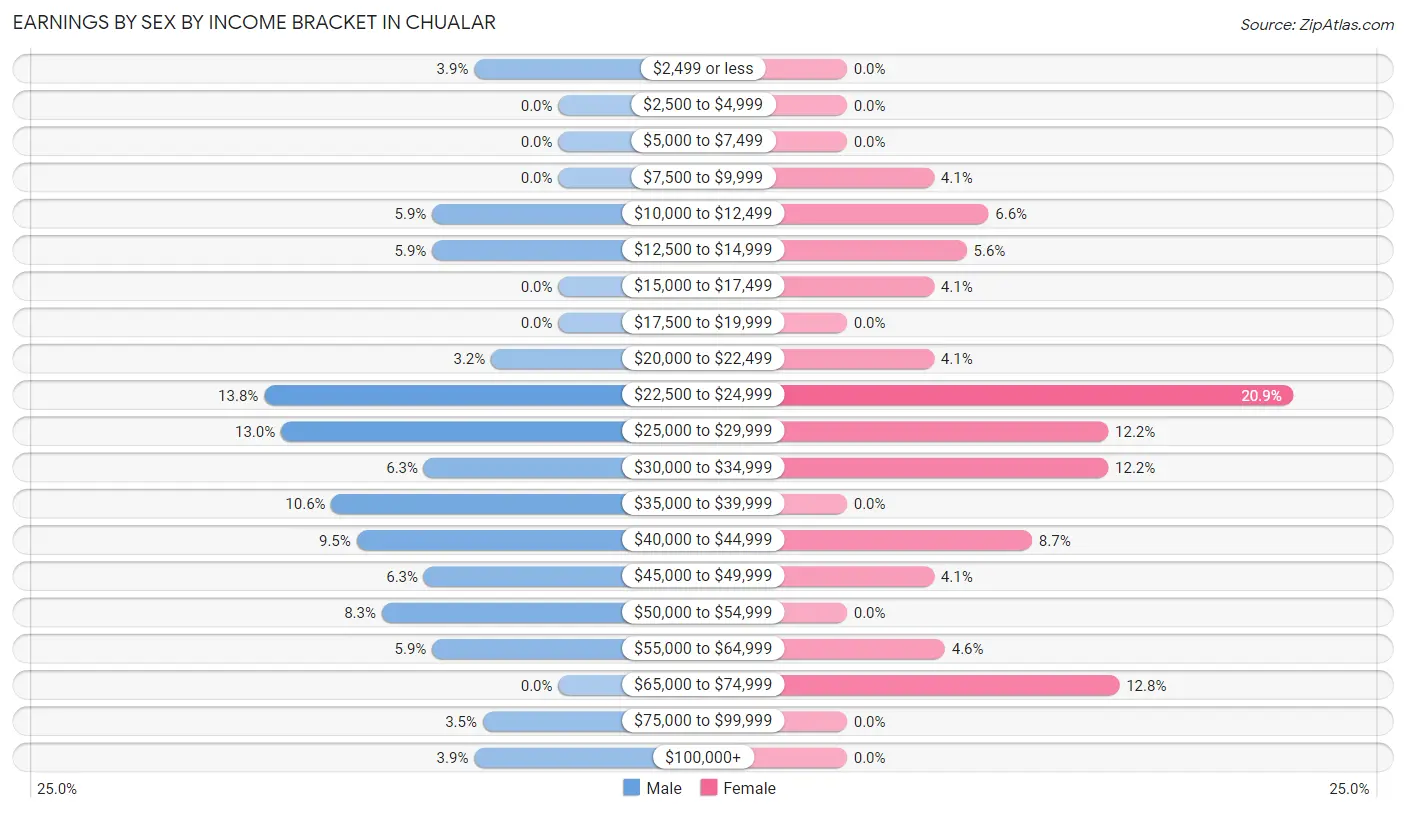
Earnings by Sex by Income Bracket in Chualar
The most common earnings brackets in Chualar are $22,500 to $24,999 for men (35 | 13.8%) and $22,500 to $24,999 for women (41 | 20.9%).
| Income | Male | Female |
| $2,499 or less | 10 (3.9%) | 0 (0.0%) |
| $2,500 to $4,999 | 0 (0.0%) | 0 (0.0%) |
| $5,000 to $7,499 | 0 (0.0%) | 0 (0.0%) |
| $7,500 to $9,999 | 0 (0.0%) | 8 (4.1%) |
| $10,000 to $12,499 | 15 (5.9%) | 13 (6.6%) |
| $12,500 to $14,999 | 15 (5.9%) | 11 (5.6%) |
| $15,000 to $17,499 | 0 (0.0%) | 8 (4.1%) |
| $17,500 to $19,999 | 0 (0.0%) | 0 (0.0%) |
| $20,000 to $22,499 | 8 (3.2%) | 8 (4.1%) |
| $22,500 to $24,999 | 35 (13.8%) | 41 (20.9%) |
| $25,000 to $29,999 | 33 (13.0%) | 24 (12.2%) |
| $30,000 to $34,999 | 16 (6.3%) | 24 (12.2%) |
| $35,000 to $39,999 | 27 (10.6%) | 0 (0.0%) |
| $40,000 to $44,999 | 24 (9.5%) | 17 (8.7%) |
| $45,000 to $49,999 | 16 (6.3%) | 8 (4.1%) |
| $50,000 to $54,999 | 21 (8.3%) | 0 (0.0%) |
| $55,000 to $64,999 | 15 (5.9%) | 9 (4.6%) |
| $65,000 to $74,999 | 0 (0.0%) | 25 (12.8%) |
| $75,000 to $99,999 | 9 (3.5%) | 0 (0.0%) |
| $100,000+ | 10 (3.9%) | 0 (0.0%) |
| Total | 254 (100.0%) | 196 (100.0%) |
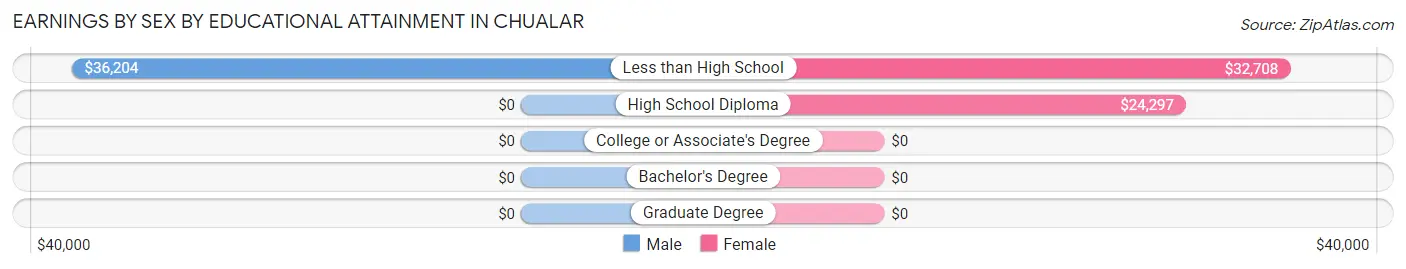
Earnings by Sex by Educational Attainment in Chualar
Average earnings in Chualar are $36,343 for men and $29,044 for women, a difference of 20.1%. Men with an educational attainment of less than high school enjoy the highest average annual earnings of $36,204, while those with less than high school education earn the least with $36,204. Women with an educational attainment of less than high school earn the most with the average annual earnings of $32,708, while those with high school diploma education have the smallest earnings of $24,297.
| Educational Attainment | Male Income | Female Income |
| Less than High School | $36,204 | $32,708 |
| High School Diploma | - | - |
| College or Associate's Degree | - | - |
| Bachelor's Degree | - | - |
| Graduate Degree | - | - |
| Total | $36,343 | $29,044 |
Family Income in Chualar
Family Income Brackets in Chualar
According to the Chualar family income data, there are 42 families falling into the $100,000 to $149,999 income range, which is the most common income bracket and makes up 23.1% of all families.
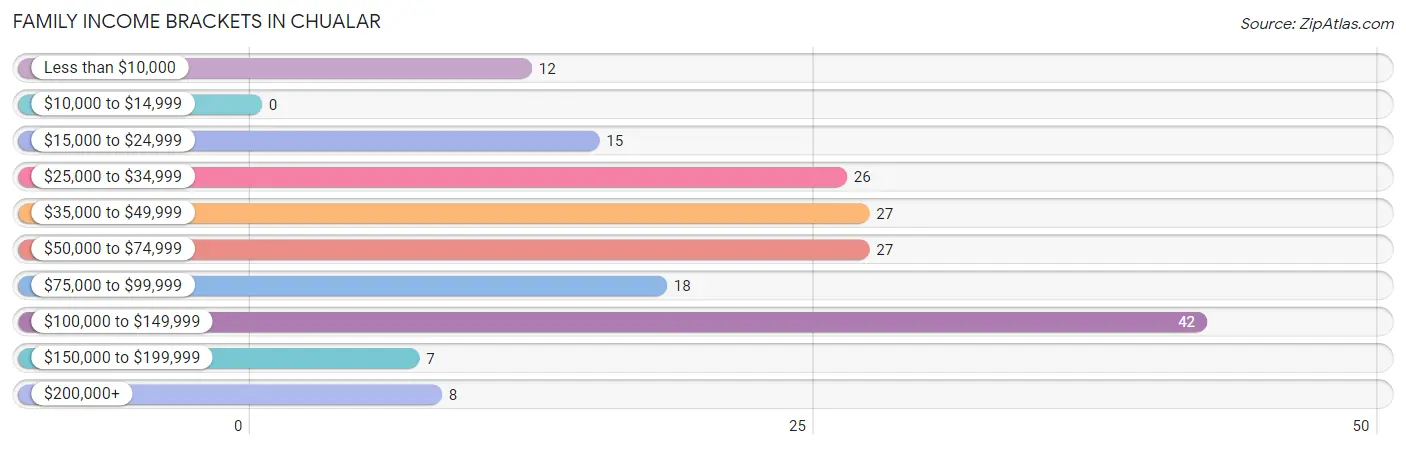
| Income Bracket | # Families | % Families |
| Less than $10,000 | 12 | 6.6% |
| $10,000 to $14,999 | 0 | 0.0% |
| $15,000 to $24,999 | 15 | 8.2% |
| $25,000 to $34,999 | 26 | 14.3% |
| $35,000 to $49,999 | 27 | 14.8% |
| $50,000 to $74,999 | 27 | 14.8% |
| $75,000 to $99,999 | 18 | 9.9% |
| $100,000 to $149,999 | 42 | 23.1% |
| $150,000 to $199,999 | 7 | 3.8% |
| $200,000+ | 8 | 4.4% |
Family Income by Famaliy Size in Chualar
7+ person families (38 | 20.9%) account for the highest median family income in Chualar with $120,833 per family, while 2-person families (34 | 18.7%) have the highest median income of $17,625 per family member.
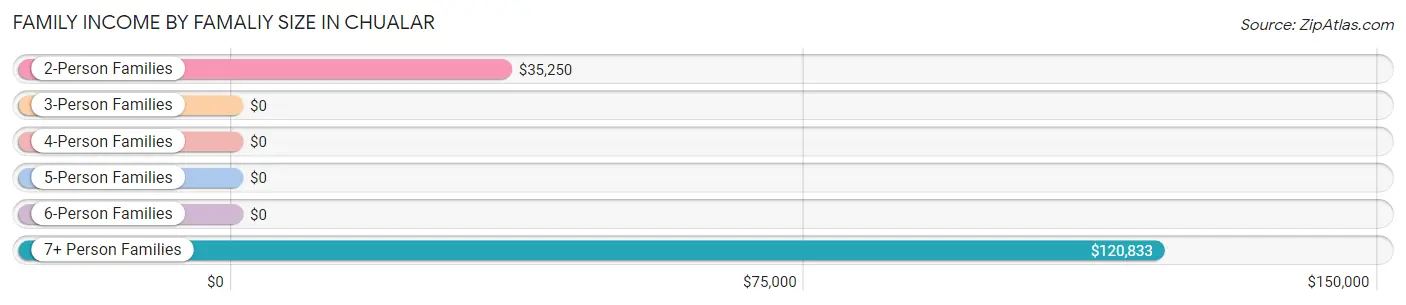
| Income Bracket | # Families | Median Income |
| 2-Person Families | 34 (18.7%) | $35,250 |
| 3-Person Families | 33 (18.1%) | $0 |
| 4-Person Families | 57 (31.3%) | $0 |
| 5-Person Families | 12 (6.6%) | $0 |
| 6-Person Families | 8 (4.4%) | $0 |
| 7+ Person Families | 38 (20.9%) | $120,833 |
| Total | 182 (100.0%) | $55,000 |
Family Income by Number of Earners in Chualar
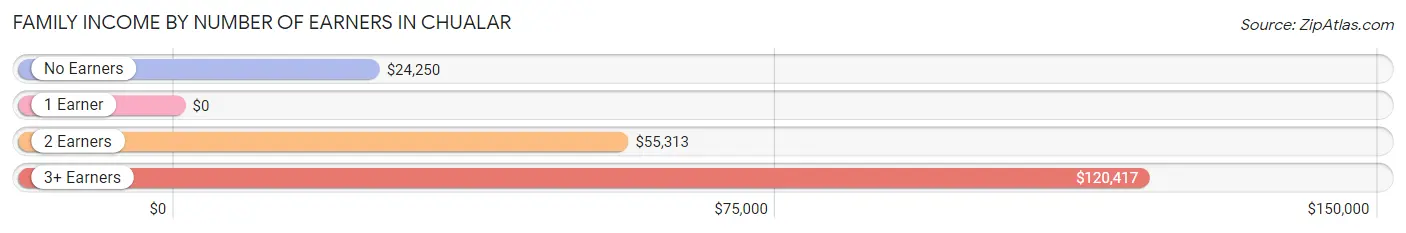
| Number of Earners | # Families | Median Income |
| No Earners | 45 (24.7%) | $24,250 |
| 1 Earner | 17 (9.3%) | $0 |
| 2 Earners | 80 (44.0%) | $55,313 |
| 3+ Earners | 40 (22.0%) | $120,417 |
| Total | 182 (100.0%) | $55,000 |
Household Income in Chualar
Household Income Brackets in Chualar
With 68 households falling in the category, the $100,000 to $149,999 income range is the most frequent in Chualar, accounting for 32.9% of all households.
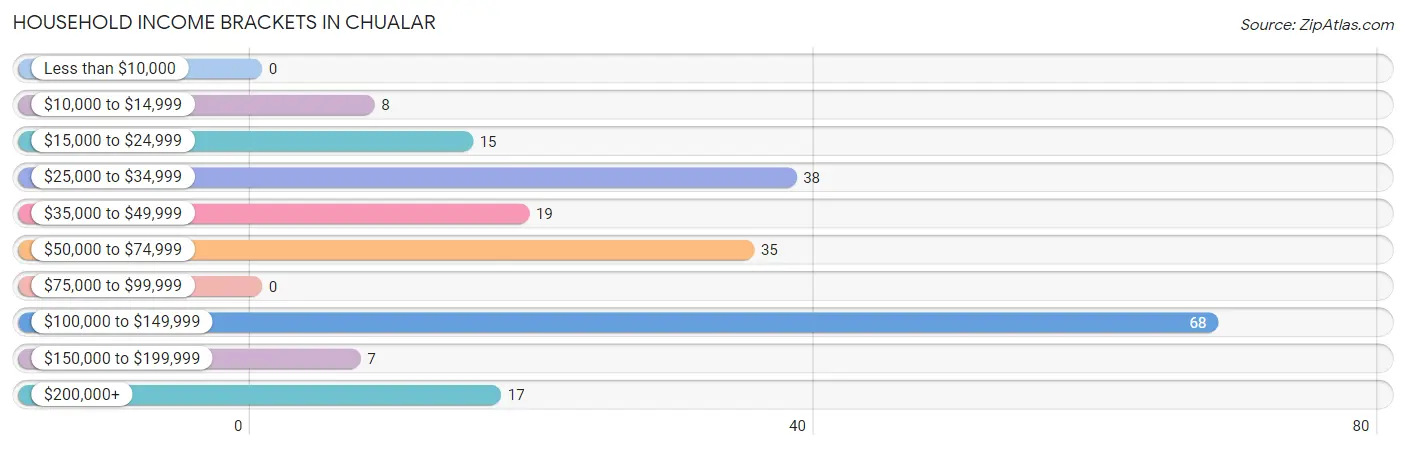
| Income Bracket | # Households | % Households |
| Less than $10,000 | 0 | 0.0% |
| $10,000 to $14,999 | 8 | 3.9% |
| $15,000 to $24,999 | 15 | 7.2% |
| $25,000 to $34,999 | 38 | 18.4% |
| $35,000 to $49,999 | 19 | 9.2% |
| $50,000 to $74,999 | 35 | 16.9% |
| $75,000 to $99,999 | 0 | 0.0% |
| $100,000 to $149,999 | 68 | 32.9% |
| $150,000 to $199,999 | 7 | 3.4% |
| $200,000+ | 17 | 8.2% |
Household Income by Householder Age in Chualar
The median household income in Chualar is $0, with the highest median household income of $102,344 found in the 45 to 64 years age bracket for the primary householder. A total of 117 households (56.5%) fall into this category.
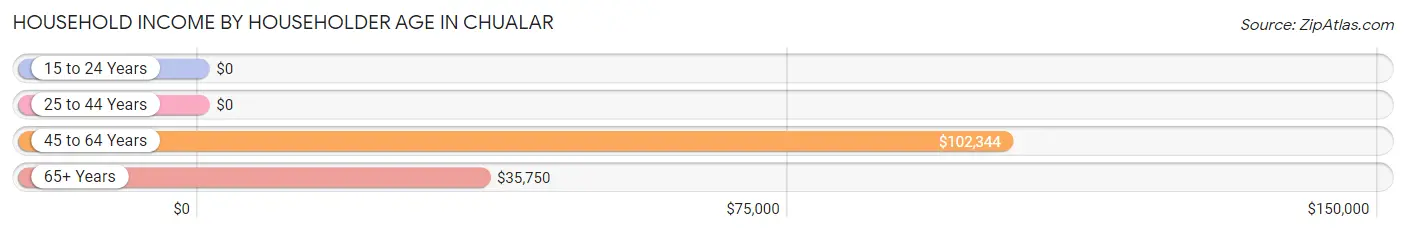
| Income Bracket | # Households | Median Income |
| 15 to 24 Years | 0 (0.0%) | $0 |
| 25 to 44 Years | 54 (26.1%) | $0 |
| 45 to 64 Years | 117 (56.5%) | $102,344 |
| 65+ Years | 36 (17.4%) | $35,750 |
| Total | 207 (100.0%) | $0 |
Poverty in Chualar
Income Below Poverty by Sex and Age in Chualar
With 16.8% poverty level for males and 29.2% for females among the residents of Chualar, 16 and 17 year old males and 5 year old females are the most vulnerable to poverty, with 8 males (50.0%) and 14 females (100.0%) in their respective age groups living below the poverty level.
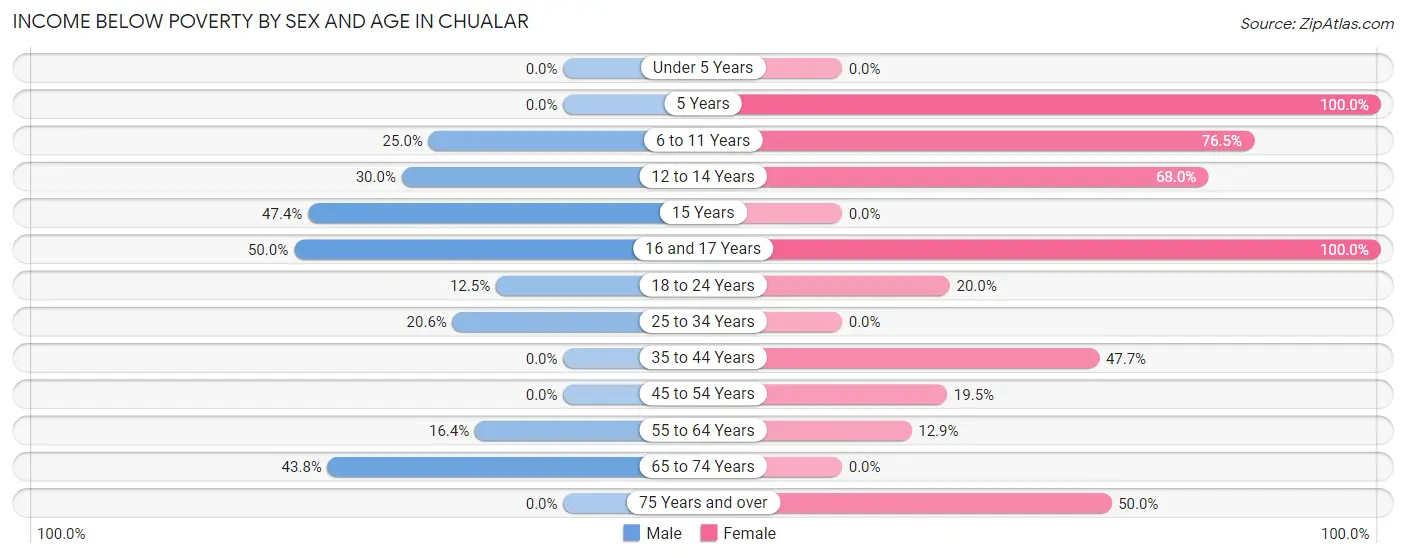
| Age Bracket | Male | Female |
| Under 5 Years | 0 (0.0%) | 0 (0.0%) |
| 5 Years | 0 (0.0%) | 14 (100.0%) |
| 6 to 11 Years | 15 (25.0%) | 26 (76.5%) |
| 12 to 14 Years | 15 (30.0%) | 17 (68.0%) |
| 15 Years | 9 (47.4%) | 0 (0.0%) |
| 16 and 17 Years | 8 (50.0%) | 14 (100.0%) |
| 18 to 24 Years | 7 (12.5%) | 10 (20.0%) |
| 25 to 34 Years | 15 (20.5%) | 0 (0.0%) |
| 35 to 44 Years | 0 (0.0%) | 21 (47.7%) |
| 45 to 54 Years | 0 (0.0%) | 8 (19.5%) |
| 55 to 64 Years | 10 (16.4%) | 8 (12.9%) |
| 65 to 74 Years | 7 (43.8%) | 0 (0.0%) |
| 75 Years and over | 0 (0.0%) | 10 (50.0%) |
| Total | 86 (16.8%) | 128 (29.2%) |
Income Above Poverty by Sex and Age in Chualar
According to the poverty statistics in Chualar, males aged under 5 years and females aged under 5 years are the age groups that are most secure financially, with 100.0% of males and 100.0% of females in these age groups living above the poverty line.
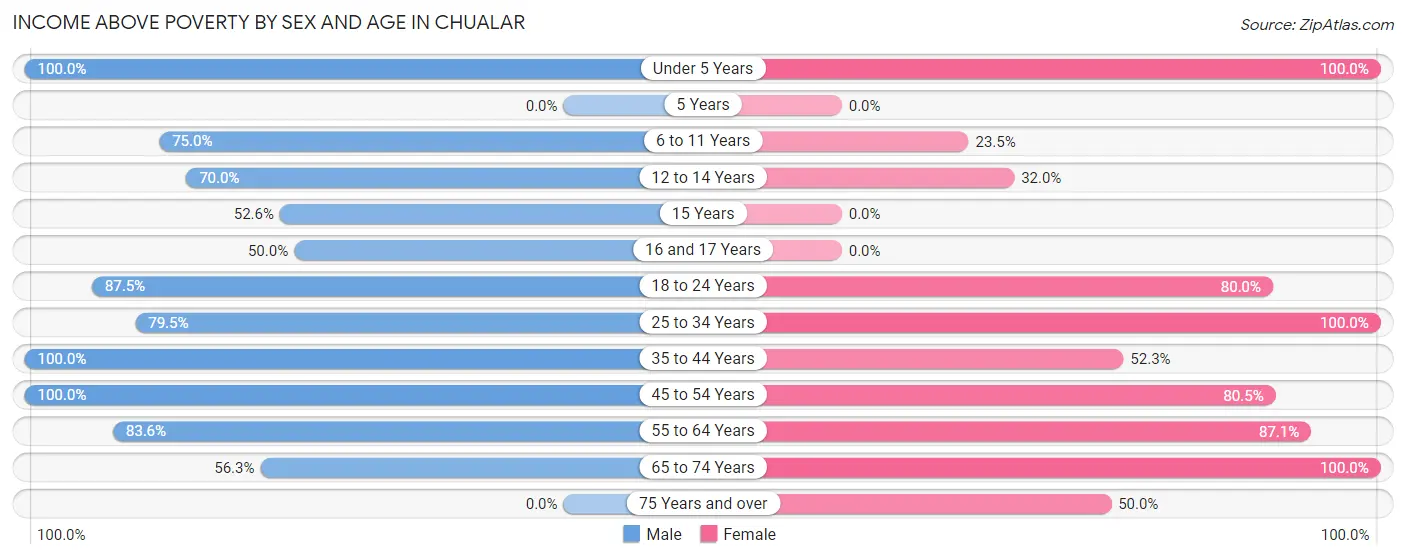
| Age Bracket | Male | Female |
| Under 5 Years | 28 (100.0%) | 30 (100.0%) |
| 5 Years | 0 (0.0%) | 0 (0.0%) |
| 6 to 11 Years | 45 (75.0%) | 8 (23.5%) |
| 12 to 14 Years | 35 (70.0%) | 8 (32.0%) |
| 15 Years | 10 (52.6%) | 0 (0.0%) |
| 16 and 17 Years | 8 (50.0%) | 0 (0.0%) |
| 18 to 24 Years | 49 (87.5%) | 40 (80.0%) |
| 25 to 34 Years | 58 (79.4%) | 77 (100.0%) |
| 35 to 44 Years | 55 (100.0%) | 23 (52.3%) |
| 45 to 54 Years | 79 (100.0%) | 33 (80.5%) |
| 55 to 64 Years | 51 (83.6%) | 54 (87.1%) |
| 65 to 74 Years | 9 (56.2%) | 27 (100.0%) |
| 75 Years and over | 0 (0.0%) | 10 (50.0%) |
| Total | 427 (83.2%) | 310 (70.8%) |
Income Below Poverty Among Married-Couple Families in Chualar
The poverty statistics for married-couple families in Chualar show that 13.4% or 17 of the total 127 families live below the poverty line. Families with 1 or 2 children have the highest poverty rate of 22.2%, comprising of 10 families. On the other hand, families with 3 or 4 children have the lowest poverty rate of 0.0%, which includes 0 families.
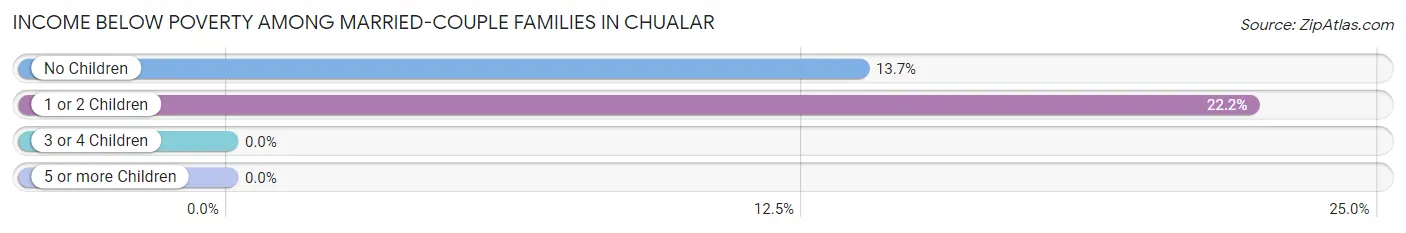
| Children | Above Poverty | Below Poverty |
| No Children | 44 (86.3%) | 7 (13.7%) |
| 1 or 2 Children | 35 (77.8%) | 10 (22.2%) |
| 3 or 4 Children | 23 (100.0%) | 0 (0.0%) |
| 5 or more Children | 8 (100.0%) | 0 (0.0%) |
| Total | 110 (86.6%) | 17 (13.4%) |
Income Below Poverty Among Single-Parent Households in Chualar
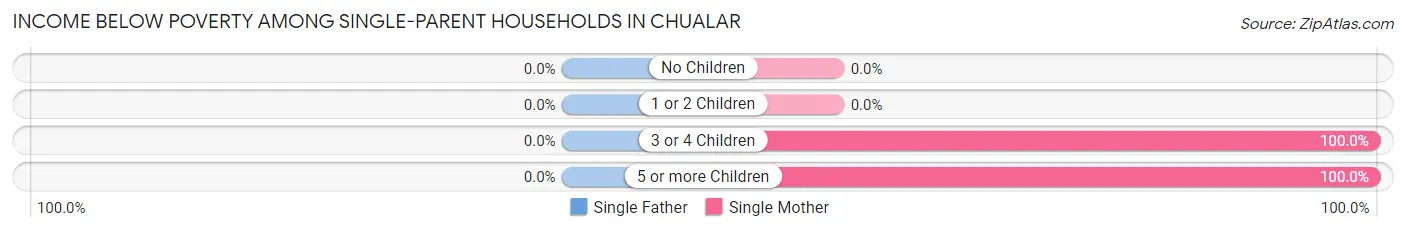
| Children | Single Father | Single Mother |
| No Children | 0 (0.0%) | 0 (0.0%) |
| 1 or 2 Children | 0 (0.0%) | 0 (0.0%) |
| 3 or 4 Children | 0 (0.0%) | 12 (100.0%) |
| 5 or more Children | 0 (0.0%) | 8 (100.0%) |
| Total | 0 (0.0%) | 20 (52.6%) |
Income Below Poverty Among Married-Couple vs Single-Parent Households in Chualar
The poverty data for Chualar shows that 17 of the married-couple family households (13.4%) and 20 of the single-parent households (36.4%) are living below the poverty level. Within the married-couple family households, those with 1 or 2 children have the highest poverty rate, with 10 households (22.2%) falling below the poverty line. Among the single-parent households, those with 3 or 4 children have the highest poverty rate, with 12 household (100.0%) living below poverty.
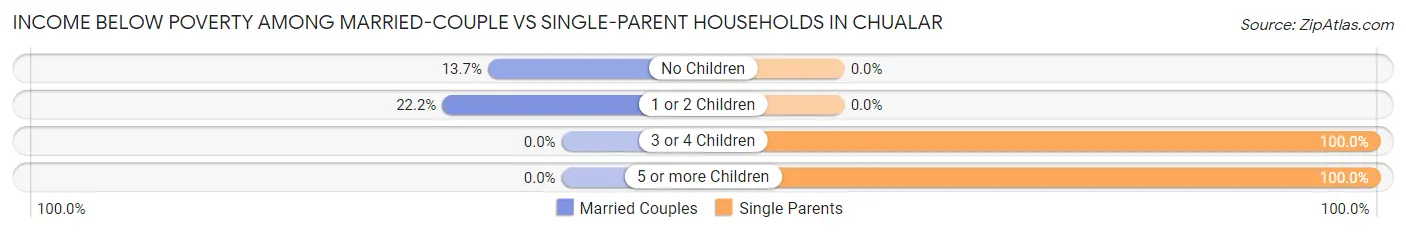
| Children | Married-Couple Families | Single-Parent Households |
| No Children | 7 (13.7%) | 0 (0.0%) |
| 1 or 2 Children | 10 (22.2%) | 0 (0.0%) |
| 3 or 4 Children | 0 (0.0%) | 12 (100.0%) |
| 5 or more Children | 0 (0.0%) | 8 (100.0%) |
| Total | 17 (13.4%) | 20 (36.4%) |
Race in Chualar
The most populous races in Chualar are Hispanic or Latino (942 | 98.2%), Some other Race (851 | 88.7%), and White / Caucasian (78 | 8.1%).
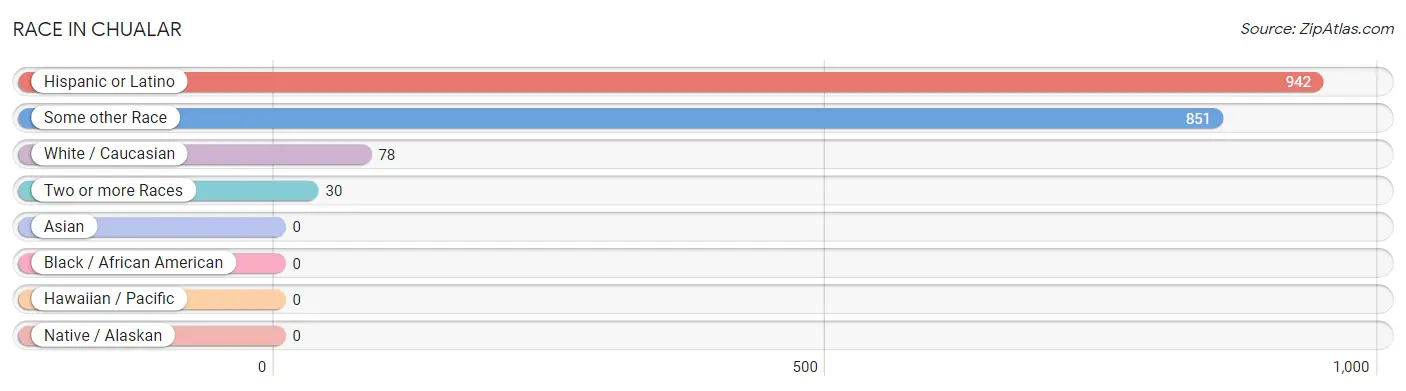
| Race | # Population | % Population |
| Asian | 0 | 0.0% |
| Black / African American | 0 | 0.0% |
| Hawaiian / Pacific | 0 | 0.0% |
| Hispanic or Latino | 942 | 98.2% |
| Native / Alaskan | 0 | 0.0% |
| White / Caucasian | 78 | 8.1% |
| Two or more Races | 30 | 3.1% |
| Some other Race | 851 | 88.7% |
| Total | 959 | 100.0% |
Ancestry in Chualar
The most populous ancestries reported in Chualar are Mexican (920 | 95.9%), Central American (22 | 2.3%), Korean (17 | 1.8%), Native Hawaiian (17 | 1.8%), and Irish (13 | 1.4%), together accounting for 103.1% of all Chualar residents.
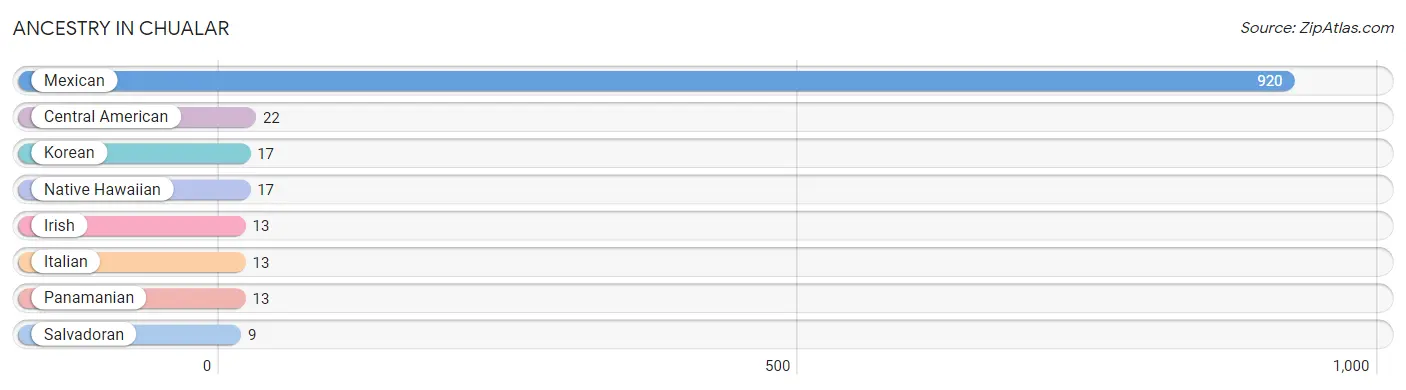
| Ancestry | # Population | % Population |
| Central American | 22 | 2.3% |
| Irish | 13 | 1.4% |
| Italian | 13 | 1.4% |
| Korean | 17 | 1.8% |
| Mexican | 920 | 95.9% |
| Native Hawaiian | 17 | 1.8% |
| Panamanian | 13 | 1.4% |
| Salvadoran | 9 | 0.9% | View All 8 Rows |
Immigrants in Chualar
The most numerous immigrant groups reported in Chualar came from Central America (381 | 39.7%), Latin America (381 | 39.7%), and Mexico (381 | 39.7%), together accounting for 119.2% of all Chualar residents.
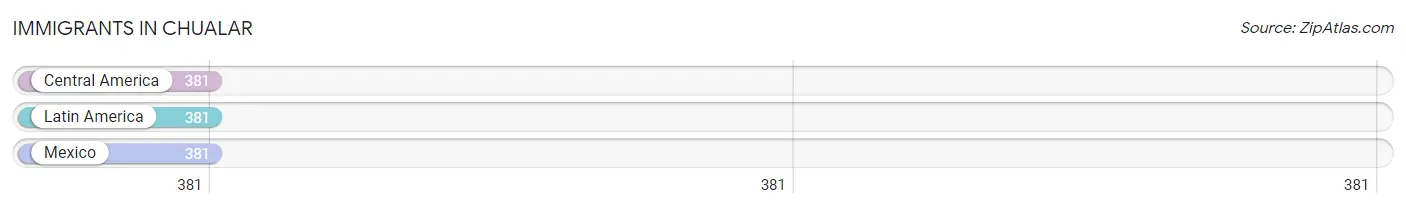
| Immigration Origin | # Population | % Population |
| Central America | 381 | 39.7% |
| Latin America | 381 | 39.7% |
| Mexico | 381 | 39.7% | View All 3 Rows |
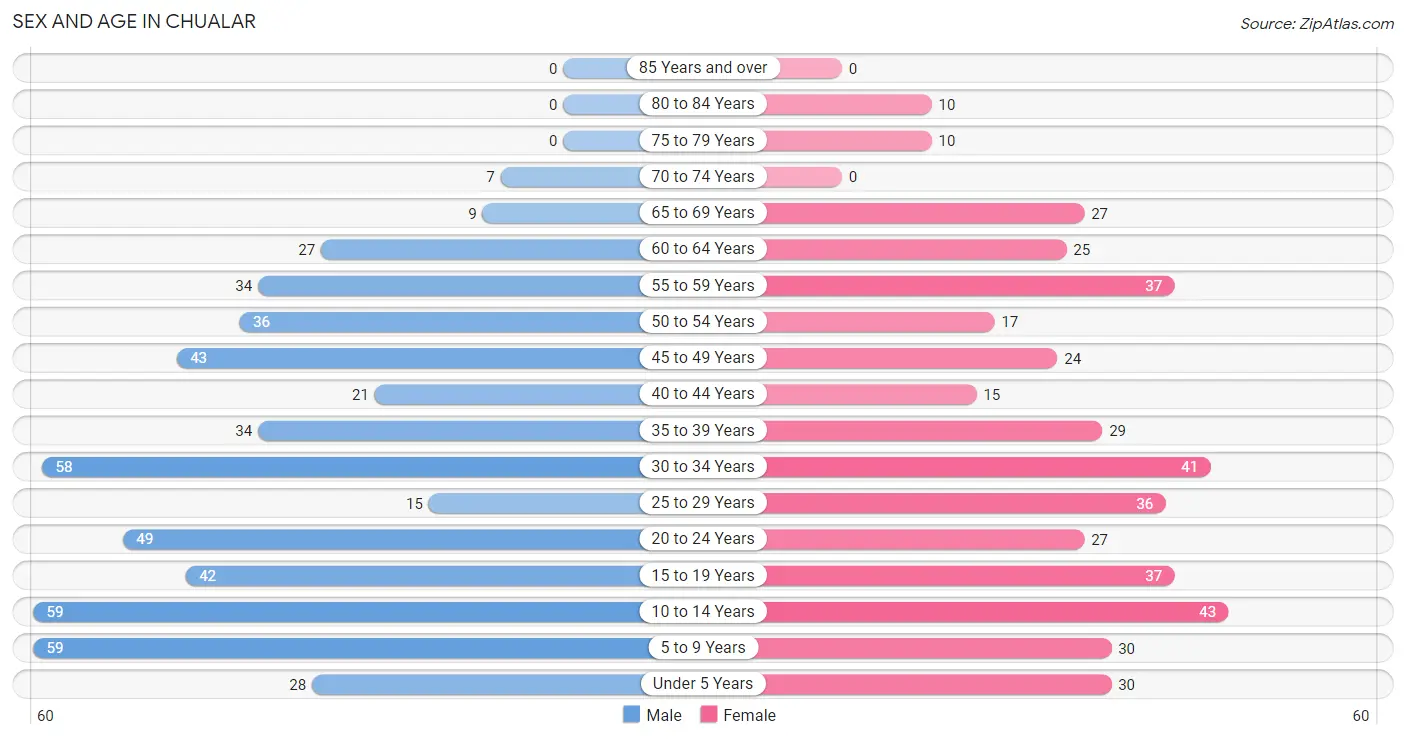
Sex and Age in Chualar
Sex and Age in Chualar
The most populous age groups in Chualar are 5 to 9 Years (59 | 11.3%) for men and 10 to 14 Years (43 | 9.8%) for women.
| Age Bracket | Male | Female |
| Under 5 Years | 28 (5.4%) | 30 (6.9%) |
| 5 to 9 Years | 59 (11.3%) | 30 (6.9%) |
| 10 to 14 Years | 59 (11.3%) | 43 (9.8%) |
| 15 to 19 Years | 42 (8.1%) | 37 (8.5%) |
| 20 to 24 Years | 49 (9.4%) | 27 (6.2%) |
| 25 to 29 Years | 15 (2.9%) | 36 (8.2%) |
| 30 to 34 Years | 58 (11.1%) | 41 (9.4%) |
| 35 to 39 Years | 34 (6.5%) | 29 (6.6%) |
| 40 to 44 Years | 21 (4.0%) | 15 (3.4%) |
| 45 to 49 Years | 43 (8.3%) | 24 (5.5%) |
| 50 to 54 Years | 36 (6.9%) | 17 (3.9%) |
| 55 to 59 Years | 34 (6.5%) | 37 (8.5%) |
| 60 to 64 Years | 27 (5.2%) | 25 (5.7%) |
| 65 to 69 Years | 9 (1.7%) | 27 (6.2%) |
| 70 to 74 Years | 7 (1.3%) | 0 (0.0%) |
| 75 to 79 Years | 0 (0.0%) | 10 (2.3%) |
| 80 to 84 Years | 0 (0.0%) | 10 (2.3%) |
| 85 Years and over | 0 (0.0%) | 0 (0.0%) |
| Total | 521 (100.0%) | 438 (100.0%) |
Families and Households in Chualar
Median Family Size in Chualar
The median family size in Chualar is 4.76 persons per family, with married-couple families (127 | 69.8%) accounting for the largest median family size of 5.04 persons per family. On the other hand, single male/father families (17 | 9.3%) represent the smallest median family size with 2.71 persons per family.
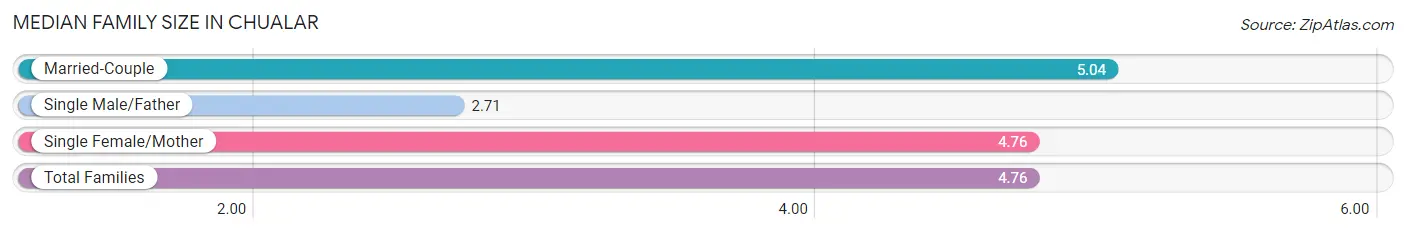
| Family Type | # Families | Family Size |
| Married-Couple | 127 (69.8%) | 5.04 |
| Single Male/Father | 17 (9.3%) | 2.71 |
| Single Female/Mother | 38 (20.9%) | 4.76 |
| Total Families | 182 (100.0%) | 4.76 |
Median Household Size in Chualar
The median household size in Chualar is 4.63 persons per household, with single female/mother households (38 | 18.4%) accounting for the largest median household size of 5.34 persons per household. non-family households (25 | 12.1%) represent the smallest median household size with 1.52 persons per household.
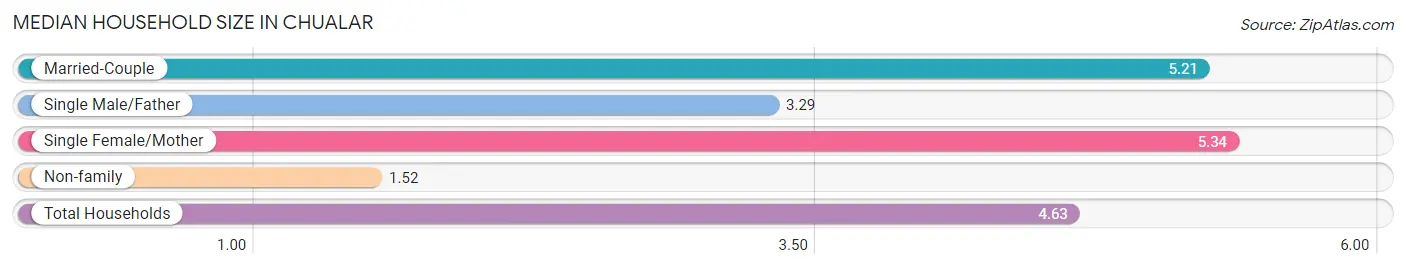
| Household Type | # Households | Household Size |
| Married-Couple | 127 (61.4%) | 5.21 |
| Single Male/Father | 17 (8.2%) | 3.29 |
| Single Female/Mother | 38 (18.4%) | 5.34 |
| Non-family | 25 (12.1%) | 1.52 |
| Total Households | 207 (100.0%) | 4.63 |
Household Size by Marriage Status in Chualar
Out of a total of 207 households in Chualar, 182 (87.9%) are family households, while 25 (12.1%) are nonfamily households. The most numerous type of family households are 4-person households, comprising 74, and the most common type of nonfamily households are 2-person households, comprising 17.
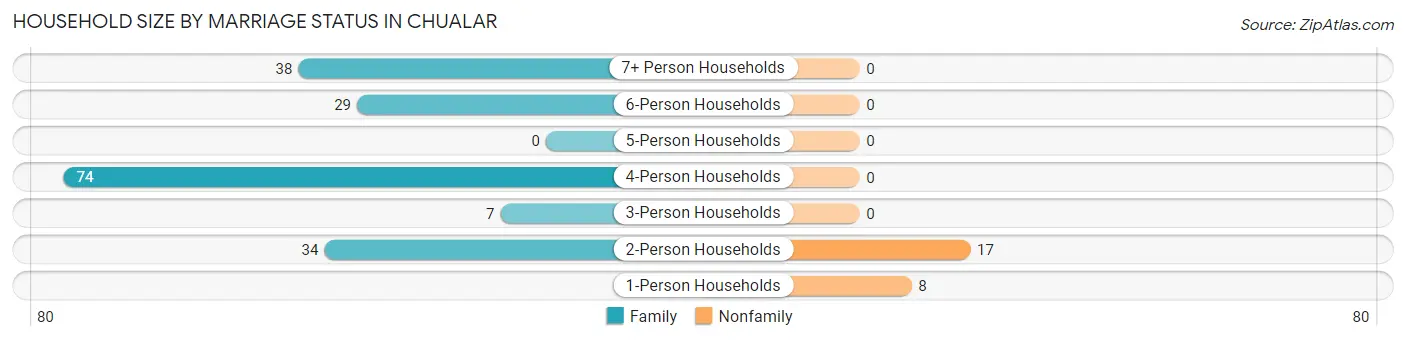
| Household Size | Family Households | Nonfamily Households |
| 1-Person Households | - | 8 (3.9%) |
| 2-Person Households | 34 (16.4%) | 17 (8.2%) |
| 3-Person Households | 7 (3.4%) | 0 (0.0%) |
| 4-Person Households | 74 (35.7%) | 0 (0.0%) |
| 5-Person Households | 0 (0.0%) | 0 (0.0%) |
| 6-Person Households | 29 (14.0%) | 0 (0.0%) |
| 7+ Person Households | 38 (18.4%) | 0 (0.0%) |
| Total | 182 (87.9%) | 25 (12.1%) |
Female Fertility in Chualar
Fertility by Age in Chualar
Average fertility rate in Chualar is 115.0 births per 1,000 women. Women in the age bracket of 20 to 34 years have the highest fertility rate with 231.0 births per 1,000 women. Women in the age bracket of 20 to 34 years acount for 100.0% of all women with births.
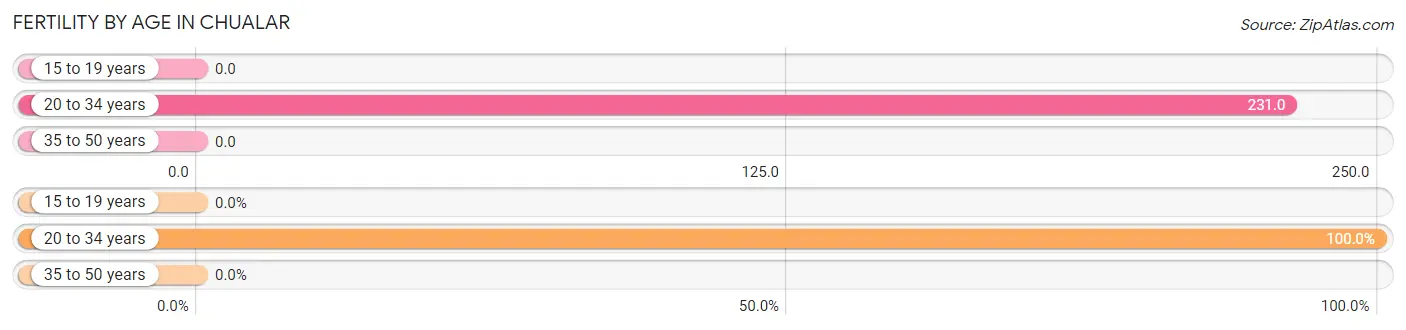
| Age Bracket | Women with Births | Births / 1,000 Women |
| 15 to 19 years | 0 (0.0%) | 0.0 |
| 20 to 34 years | 24 (100.0%) | 231.0 |
| 35 to 50 years | 0 (0.0%) | 0.0 |
| Total | 24 (100.0%) | 115.0 |
Fertility by Age by Marriage Status in Chualar
66.7% of women with births (24) in Chualar are married. The highest percentage of unmarried women with births falls into 20 to 34 years age bracket with 33.3% of them unmarried at the time of birth, while the lowest percentage of unmarried women with births belong to 20 to 34 years age bracket with 33.3% of them unmarried.
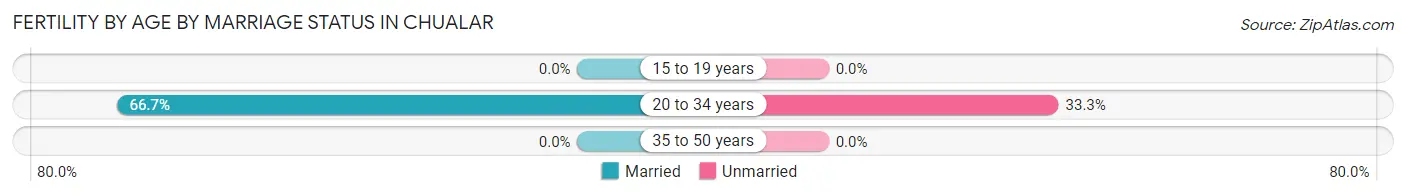
| Age Bracket | Married | Unmarried |
| 15 to 19 years | 0 (0.0%) | 0 (0.0%) |
| 20 to 34 years | 16 (66.7%) | 8 (33.3%) |
| 35 to 50 years | 0 (0.0%) | 0 (0.0%) |
| Total | 16 (66.7%) | 8 (33.3%) |
Fertility by Education in Chualar
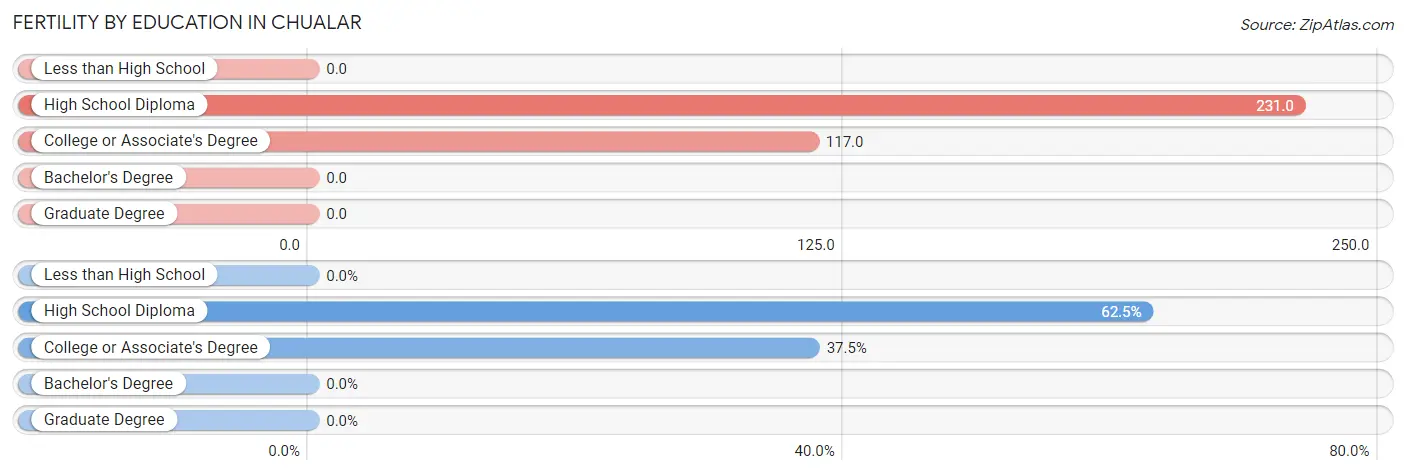
| Educational Attainment | Women with Births | Births / 1,000 Women |
| Less than High School | 0 (0.0%) | 0.0 |
| High School Diploma | 15 (62.5%) | 231.0 |
| College or Associate's Degree | 9 (37.5%) | 117.0 |
| Bachelor's Degree | 0 (0.0%) | 0.0 |
| Graduate Degree | 0 (0.0%) | 0.0 |
| Total | 24 (100.0%) | 115.0 |
Fertility by Education by Marriage Status in Chualar
33.3% of women with births in Chualar are unmarried. Women with the educational attainment of college or associate's degree are most likely to be married with 100.0% of them married at childbirth, while women with the educational attainment of high school diploma are least likely to be married with 53.3% of them unmarried at childbirth.
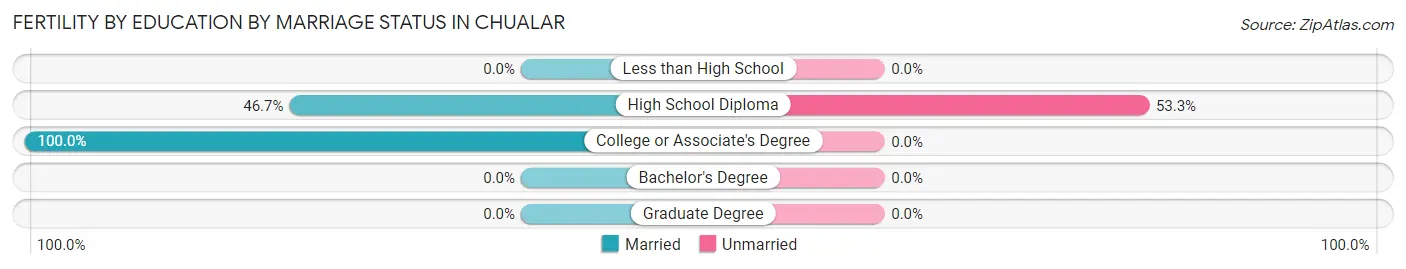
| Educational Attainment | Married | Unmarried |
| Less than High School | 0 (0.0%) | 0 (0.0%) |
| High School Diploma | 7 (46.7%) | 8 (53.3%) |
| College or Associate's Degree | 9 (100.0%) | 0 (0.0%) |
| Bachelor's Degree | 0 (0.0%) | 0 (0.0%) |
| Graduate Degree | 0 (0.0%) | 0 (0.0%) |
| Total | 16 (66.7%) | 8 (33.3%) |
Employment Characteristics in Chualar
Employment by Class of Employer in Chualar
Among the 412 employed individuals in Chualar, private company employees (302 | 73.3%), local government employees (30 | 7.3%), and state government employees (26 | 6.3%) make up the most common classes of employment.
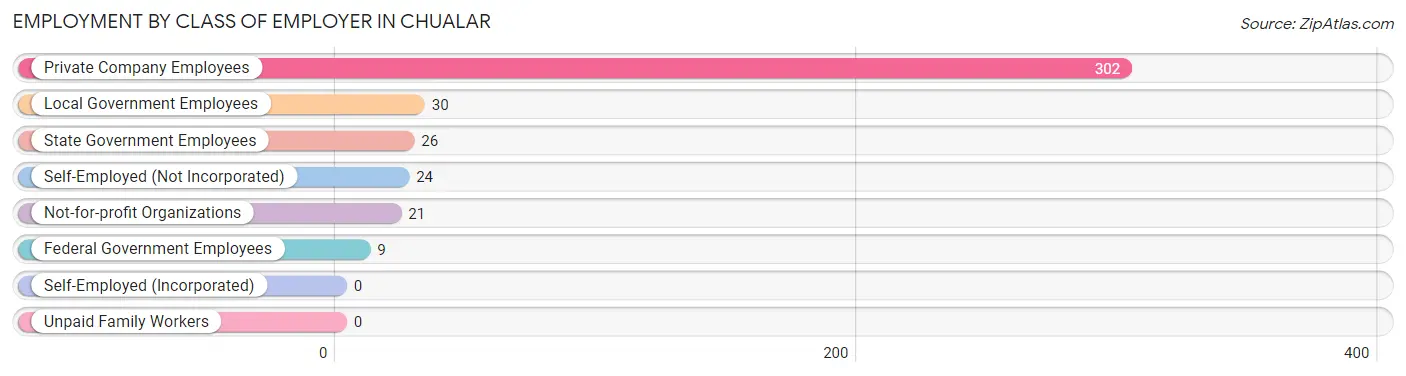
| Employer Class | # Employees | % Employees |
| Private Company Employees | 302 | 73.3% |
| Self-Employed (Incorporated) | 0 | 0.0% |
| Self-Employed (Not Incorporated) | 24 | 5.8% |
| Not-for-profit Organizations | 21 | 5.1% |
| Local Government Employees | 30 | 7.3% |
| State Government Employees | 26 | 6.3% |
| Federal Government Employees | 9 | 2.2% |
| Unpaid Family Workers | 0 | 0.0% |
| Total | 412 | 100.0% |
Employment Status by Age in Chualar
According to the labor force statistics for Chualar, out of the total population over 16 years of age (691), 60.6% or 419 individuals are in the labor force, with 1.7% or 7 of them unemployed. The age group with the highest labor force participation rate is 30 to 34 years, with 91.9% or 91 individuals in the labor force. Within the labor force, the 30 to 34 years age range has the highest percentage of unemployed individuals, with 7.7% or 7 of them being unemployed.
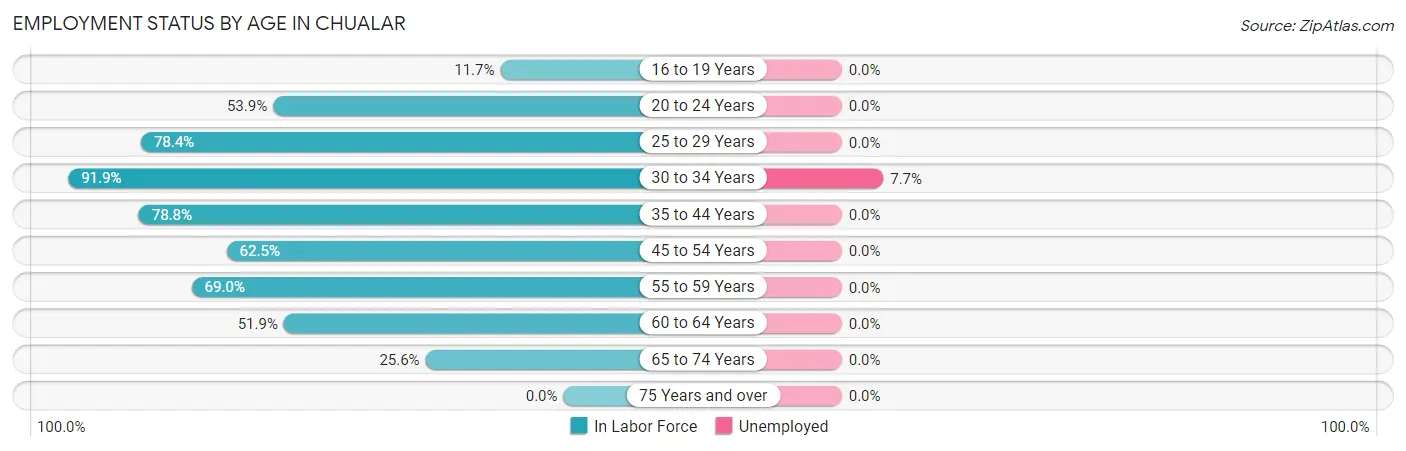
| Age Bracket | In Labor Force | Unemployed |
| 16 to 19 Years | 7 (11.7%) | 0 (0.0%) |
| 20 to 24 Years | 41 (53.9%) | 0 (0.0%) |
| 25 to 29 Years | 40 (78.4%) | 0 (0.0%) |
| 30 to 34 Years | 91 (91.9%) | 7 (7.7%) |
| 35 to 44 Years | 78 (78.8%) | 0 (0.0%) |
| 45 to 54 Years | 75 (62.5%) | 0 (0.0%) |
| 55 to 59 Years | 49 (69.0%) | 0 (0.0%) |
| 60 to 64 Years | 27 (51.9%) | 0 (0.0%) |
| 65 to 74 Years | 11 (25.6%) | 0 (0.0%) |
| 75 Years and over | 0 (0.0%) | 0 (0.0%) |
| Total | 419 (60.6%) | 7 (1.7%) |
Employment Status by Educational Attainment in Chualar
According to labor force statistics for Chualar, 73.2% of individuals (360) out of the total population between 25 and 64 years of age (492) are in the labor force, with 1.9% or 7 of them being unemployed. The group with the highest labor force participation rate are those with the educational attainment of bachelor's degree or higher, with 100.0% or 30 individuals in the labor force. Within the labor force, individuals with less than high school education have the highest percentage of unemployment, with 3.9% or 7 of them being unemployed.
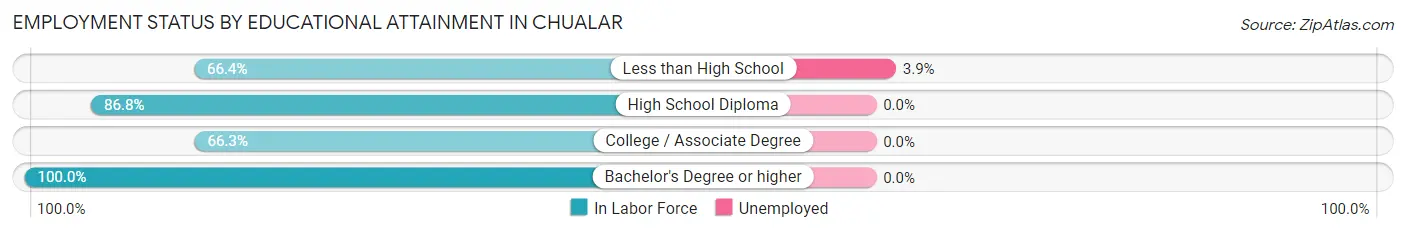
| Educational Attainment | In Labor Force | Unemployed |
| Less than High School | 178 (66.4%) | 10 (3.9%) |
| High School Diploma | 99 (86.8%) | 0 (0.0%) |
| College / Associate Degree | 53 (66.3%) | 0 (0.0%) |
| Bachelor's Degree or higher | 30 (100.0%) | 0 (0.0%) |
| Total | 360 (73.2%) | 9 (1.9%) |
Employment Occupations by Sex in Chualar
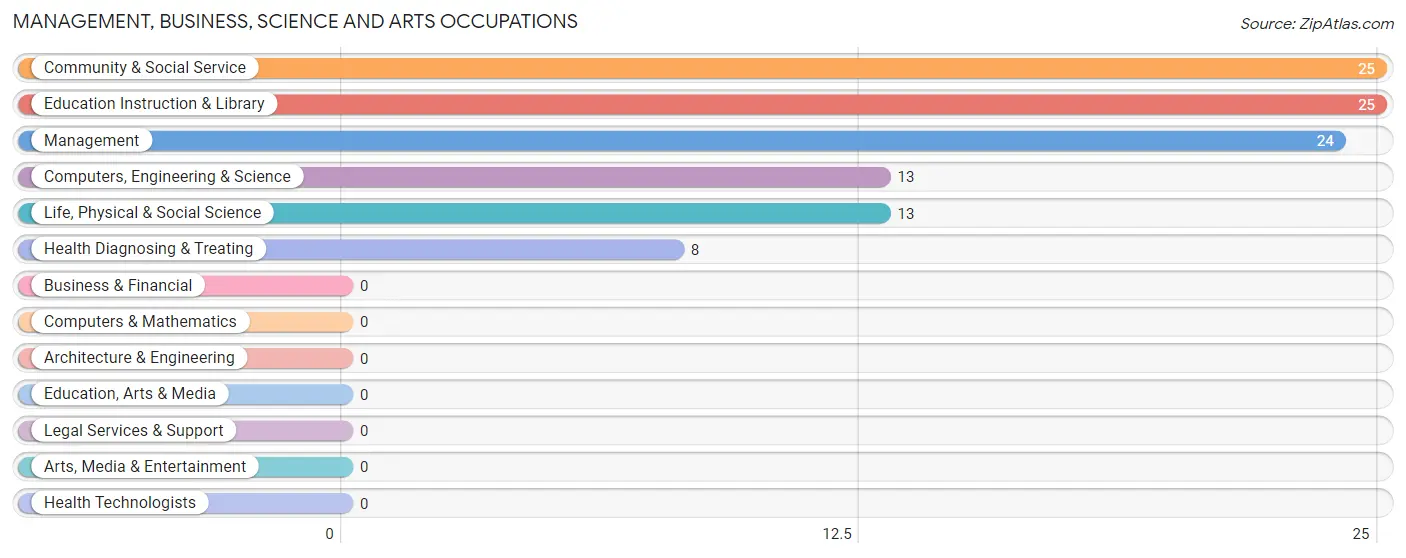
Management, Business, Science and Arts Occupations
The most common Management, Business, Science and Arts occupations in Chualar are Community & Social Service (25 | 6.1%), Education Instruction & Library (25 | 6.1%), Management (24 | 5.8%), Computers, Engineering & Science (13 | 3.2%), and Life, Physical & Social Science (13 | 3.2%).
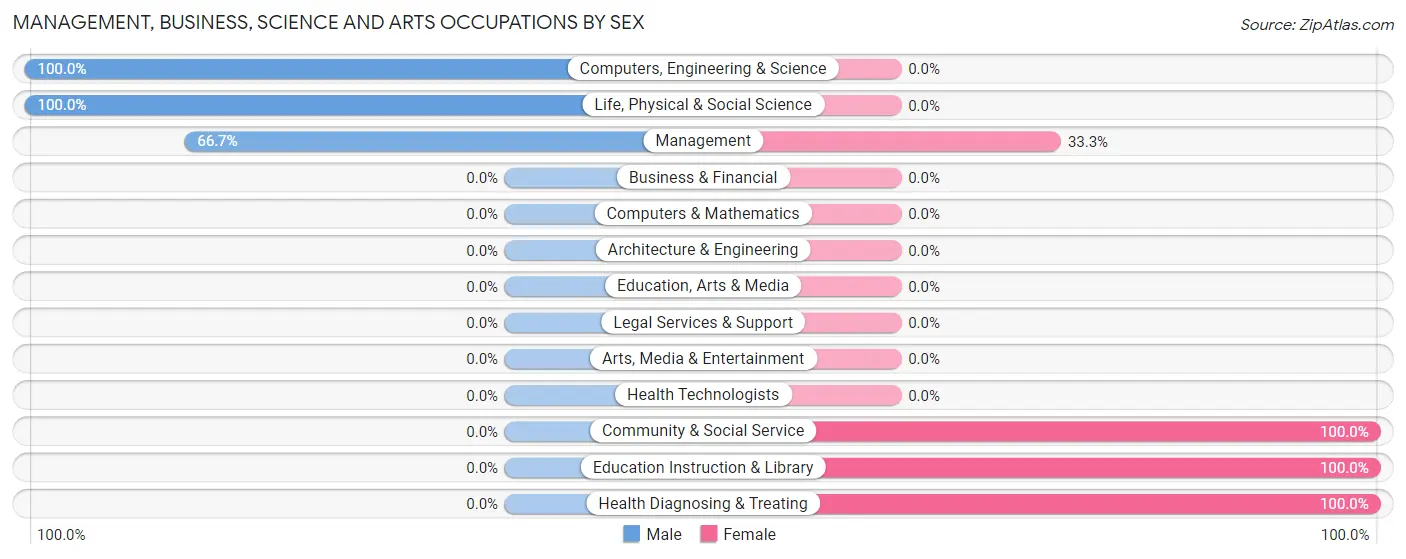
Management, Business, Science and Arts Occupations by Sex
Within the Management, Business, Science and Arts occupations in Chualar, the most male-oriented occupations are Computers, Engineering & Science (100.0%), Life, Physical & Social Science (100.0%), and Management (66.7%), while the most female-oriented occupations are Community & Social Service (100.0%), Education Instruction & Library (100.0%), and Health Diagnosing & Treating (100.0%).
| Occupation | Male | Female |
| Management | 16 (66.7%) | 8 (33.3%) |
| Business & Financial | 0 (0.0%) | 0 (0.0%) |
| Computers, Engineering & Science | 13 (100.0%) | 0 (0.0%) |
| Computers & Mathematics | 0 (0.0%) | 0 (0.0%) |
| Architecture & Engineering | 0 (0.0%) | 0 (0.0%) |
| Life, Physical & Social Science | 13 (100.0%) | 0 (0.0%) |
| Community & Social Service | 0 (0.0%) | 25 (100.0%) |
| Education, Arts & Media | 0 (0.0%) | 0 (0.0%) |
| Legal Services & Support | 0 (0.0%) | 0 (0.0%) |
| Education Instruction & Library | 0 (0.0%) | 25 (100.0%) |
| Arts, Media & Entertainment | 0 (0.0%) | 0 (0.0%) |
| Health Diagnosing & Treating | 0 (0.0%) | 8 (100.0%) |
| Health Technologists | 0 (0.0%) | 0 (0.0%) |
| Total (Category) | 29 (41.4%) | 41 (58.6%) |
| Total (Overall) | 231 (56.1%) | 181 (43.9%) |
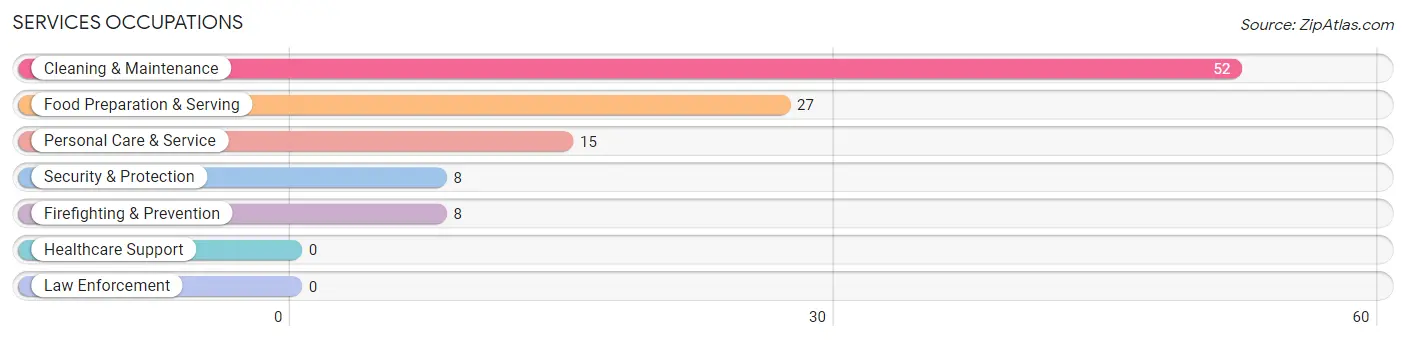
Services Occupations
The most common Services occupations in Chualar are Cleaning & Maintenance (52 | 12.6%), Food Preparation & Serving (27 | 6.6%), Personal Care & Service (15 | 3.6%), Security & Protection (8 | 1.9%), and Firefighting & Prevention (8 | 1.9%).
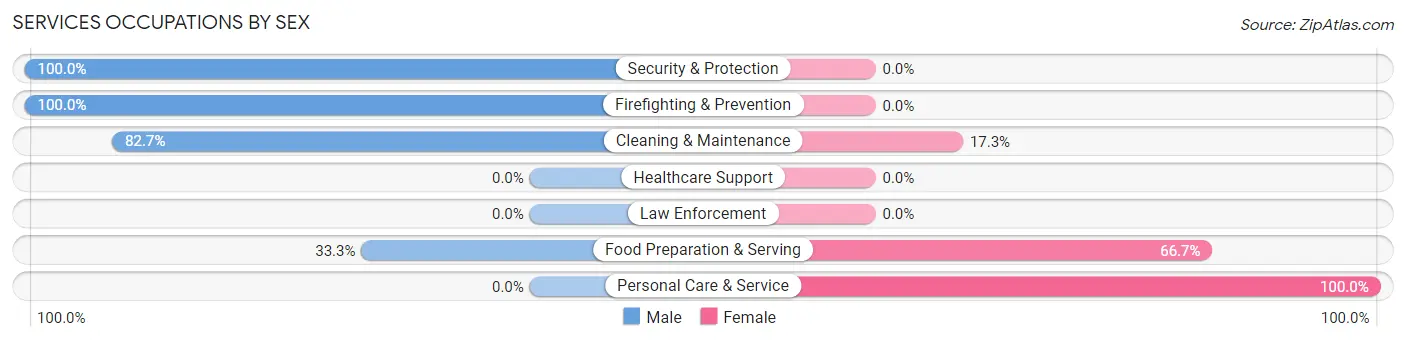
Services Occupations by Sex
Within the Services occupations in Chualar, the most male-oriented occupations are Security & Protection (100.0%), Firefighting & Prevention (100.0%), and Cleaning & Maintenance (82.7%), while the most female-oriented occupations are Personal Care & Service (100.0%), Food Preparation & Serving (66.7%), and Cleaning & Maintenance (17.3%).
| Occupation | Male | Female |
| Healthcare Support | 0 (0.0%) | 0 (0.0%) |
| Security & Protection | 8 (100.0%) | 0 (0.0%) |
| Firefighting & Prevention | 8 (100.0%) | 0 (0.0%) |
| Law Enforcement | 0 (0.0%) | 0 (0.0%) |
| Food Preparation & Serving | 9 (33.3%) | 18 (66.7%) |
| Cleaning & Maintenance | 43 (82.7%) | 9 (17.3%) |
| Personal Care & Service | 0 (0.0%) | 15 (100.0%) |
| Total (Category) | 60 (58.8%) | 42 (41.2%) |
| Total (Overall) | 231 (56.1%) | 181 (43.9%) |
Sales and Office Occupations
The most common Sales and Office occupations in Chualar are Sales & Related (41 | 10.0%), and Office & Administration (9 | 2.2%).
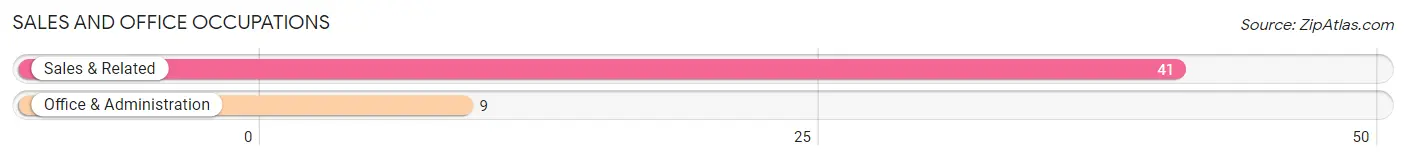
Sales and Office Occupations by Sex
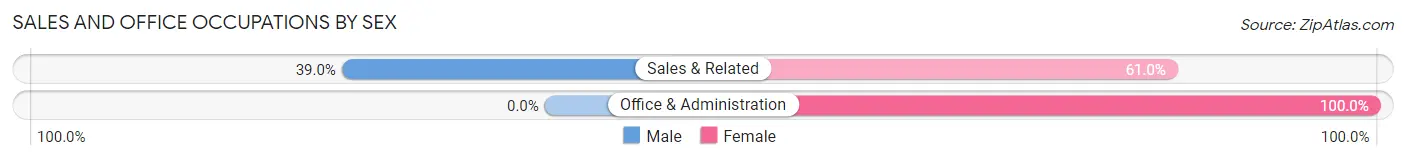
| Occupation | Male | Female |
| Sales & Related | 16 (39.0%) | 25 (61.0%) |
| Office & Administration | 0 (0.0%) | 9 (100.0%) |
| Total (Category) | 16 (32.0%) | 34 (68.0%) |
| Total (Overall) | 231 (56.1%) | 181 (43.9%) |
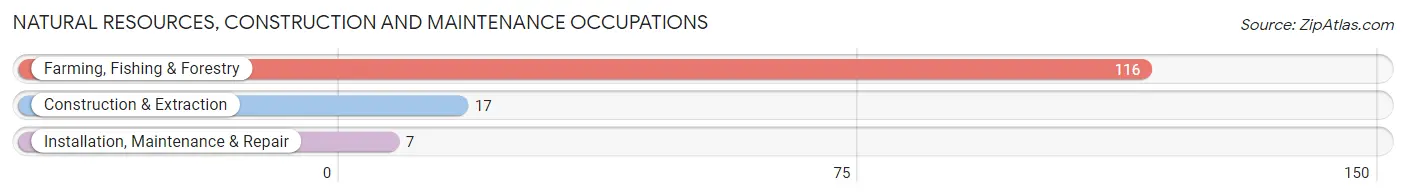
Natural Resources, Construction and Maintenance Occupations
The most common Natural Resources, Construction and Maintenance occupations in Chualar are Farming, Fishing & Forestry (116 | 28.2%), Construction & Extraction (17 | 4.1%), and Installation, Maintenance & Repair (7 | 1.7%).
Natural Resources, Construction and Maintenance Occupations by Sex
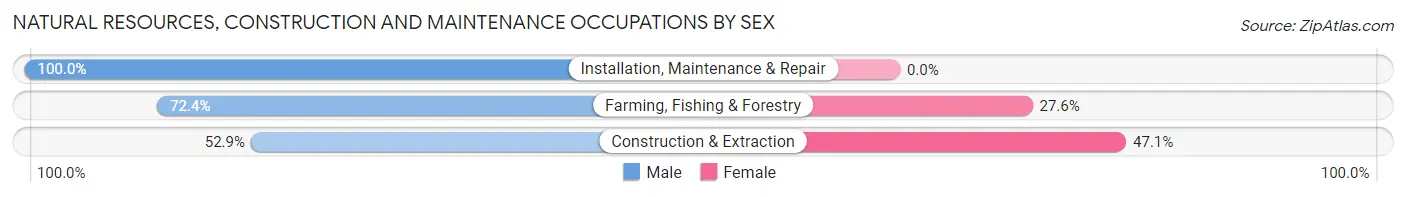
| Occupation | Male | Female |
| Farming, Fishing & Forestry | 84 (72.4%) | 32 (27.6%) |
| Construction & Extraction | 9 (52.9%) | 8 (47.1%) |
| Installation, Maintenance & Repair | 7 (100.0%) | 0 (0.0%) |
| Total (Category) | 100 (71.4%) | 40 (28.6%) |
| Total (Overall) | 231 (56.1%) | 181 (43.9%) |
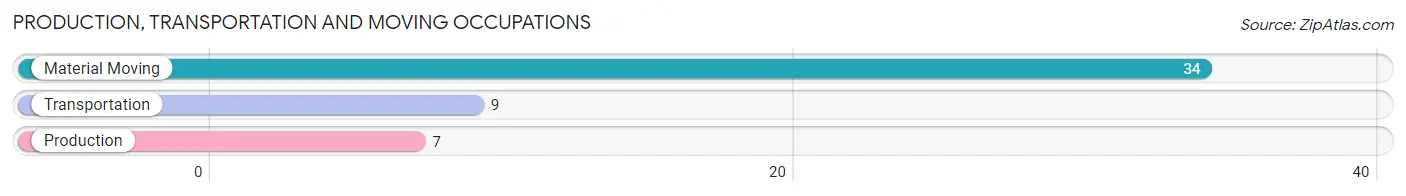
Production, Transportation and Moving Occupations
The most common Production, Transportation and Moving occupations in Chualar are Material Moving (34 | 8.3%), Transportation (9 | 2.2%), and Production (7 | 1.7%).
Production, Transportation and Moving Occupations by Sex
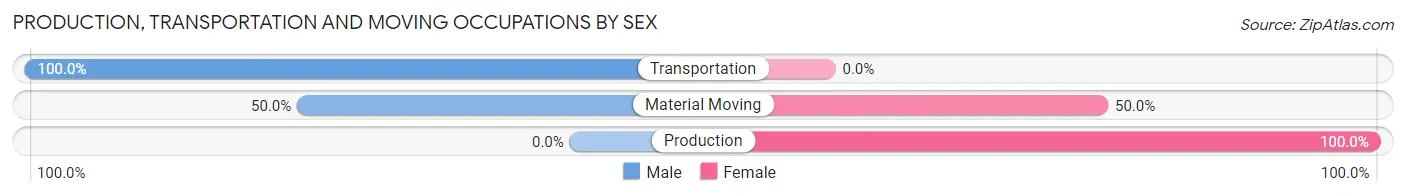
| Occupation | Male | Female |
| Production | 0 (0.0%) | 7 (100.0%) |
| Transportation | 9 (100.0%) | 0 (0.0%) |
| Material Moving | 17 (50.0%) | 17 (50.0%) |
| Total (Category) | 26 (52.0%) | 24 (48.0%) |
| Total (Overall) | 231 (56.1%) | 181 (43.9%) |
Employment Industries by Sex in Chualar
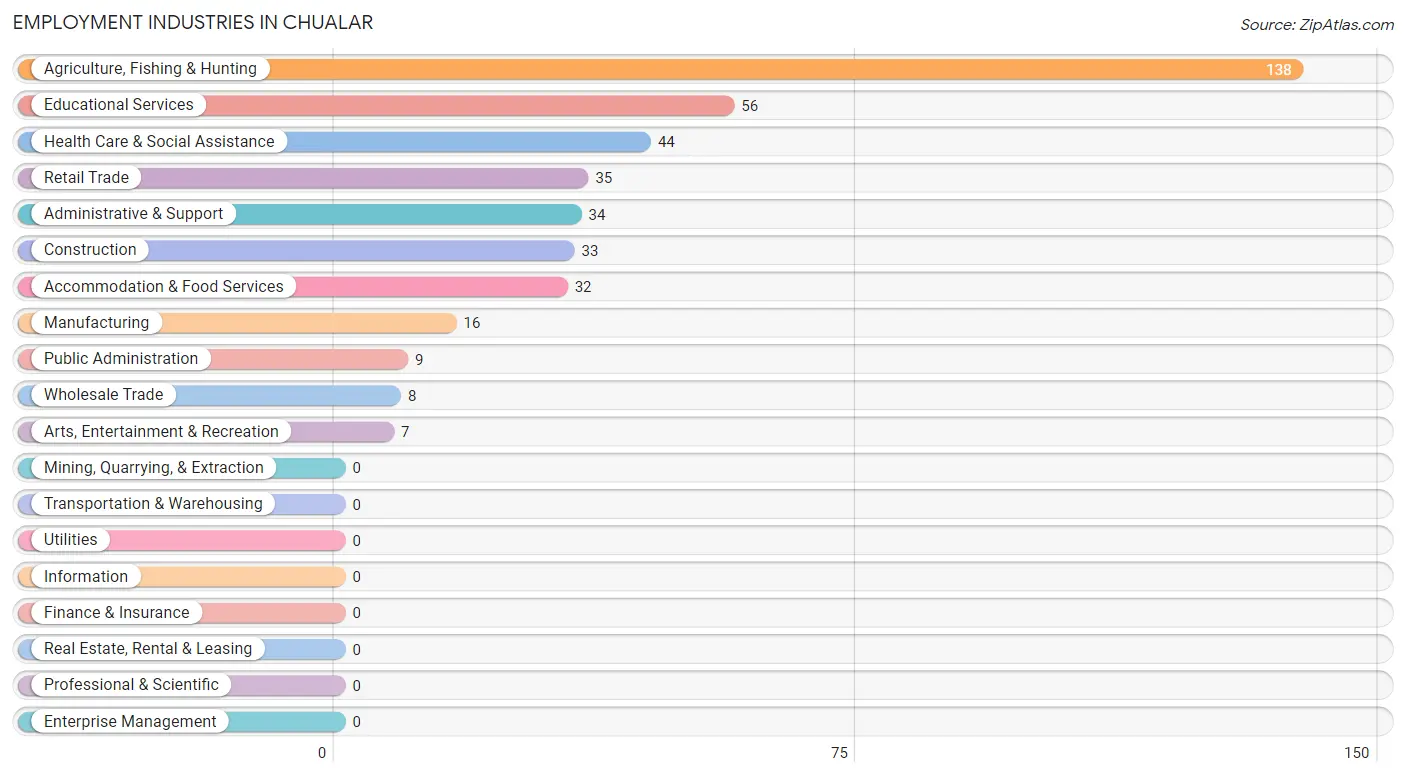
Employment Industries in Chualar
The major employment industries in Chualar include Agriculture, Fishing & Hunting (138 | 33.5%), Educational Services (56 | 13.6%), Health Care & Social Assistance (44 | 10.7%), Retail Trade (35 | 8.5%), and Administrative & Support (34 | 8.3%).
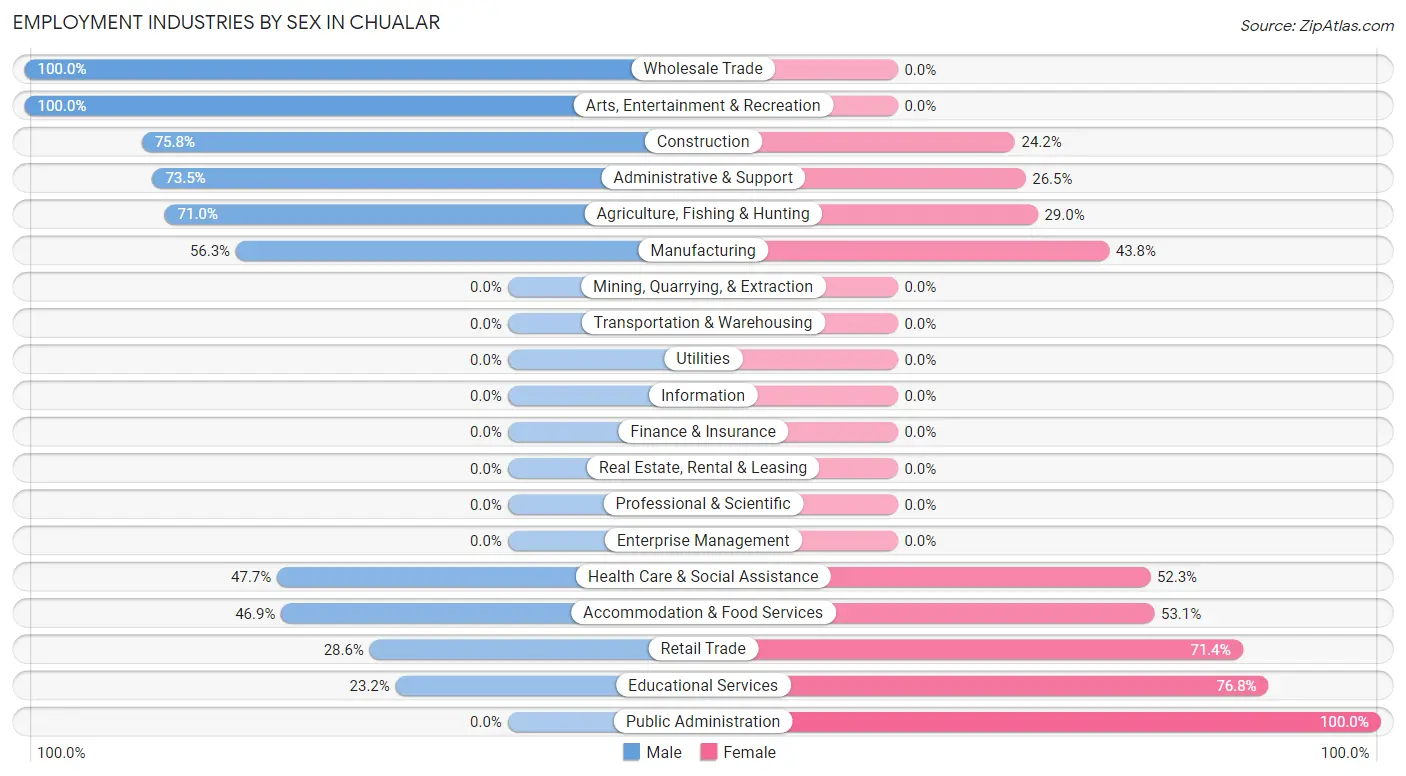
Employment Industries by Sex in Chualar
The Chualar industries that see more men than women are Wholesale Trade (100.0%), Arts, Entertainment & Recreation (100.0%), and Construction (75.8%), whereas the industries that tend to have a higher number of women are Public Administration (100.0%), Educational Services (76.8%), and Retail Trade (71.4%).
| Industry | Male | Female |
| Agriculture, Fishing & Hunting | 98 (71.0%) | 40 (29.0%) |
| Mining, Quarrying, & Extraction | 0 (0.0%) | 0 (0.0%) |
| Construction | 25 (75.8%) | 8 (24.2%) |
| Manufacturing | 9 (56.2%) | 7 (43.8%) |
| Wholesale Trade | 8 (100.0%) | 0 (0.0%) |
| Retail Trade | 10 (28.6%) | 25 (71.4%) |
| Transportation & Warehousing | 0 (0.0%) | 0 (0.0%) |
| Utilities | 0 (0.0%) | 0 (0.0%) |
| Information | 0 (0.0%) | 0 (0.0%) |
| Finance & Insurance | 0 (0.0%) | 0 (0.0%) |
| Real Estate, Rental & Leasing | 0 (0.0%) | 0 (0.0%) |
| Professional & Scientific | 0 (0.0%) | 0 (0.0%) |
| Enterprise Management | 0 (0.0%) | 0 (0.0%) |
| Administrative & Support | 25 (73.5%) | 9 (26.5%) |
| Educational Services | 13 (23.2%) | 43 (76.8%) |
| Health Care & Social Assistance | 21 (47.7%) | 23 (52.3%) |
| Arts, Entertainment & Recreation | 7 (100.0%) | 0 (0.0%) |
| Accommodation & Food Services | 15 (46.9%) | 17 (53.1%) |
| Public Administration | 0 (0.0%) | 9 (100.0%) |
| Total | 231 (56.1%) | 181 (43.9%) |
Education in Chualar
School Enrollment in Chualar
The most common levels of schooling among the 297 students in Chualar are elementary school (83 | 28.0%), high school (79 | 26.6%), and middle school (62 | 20.9%).
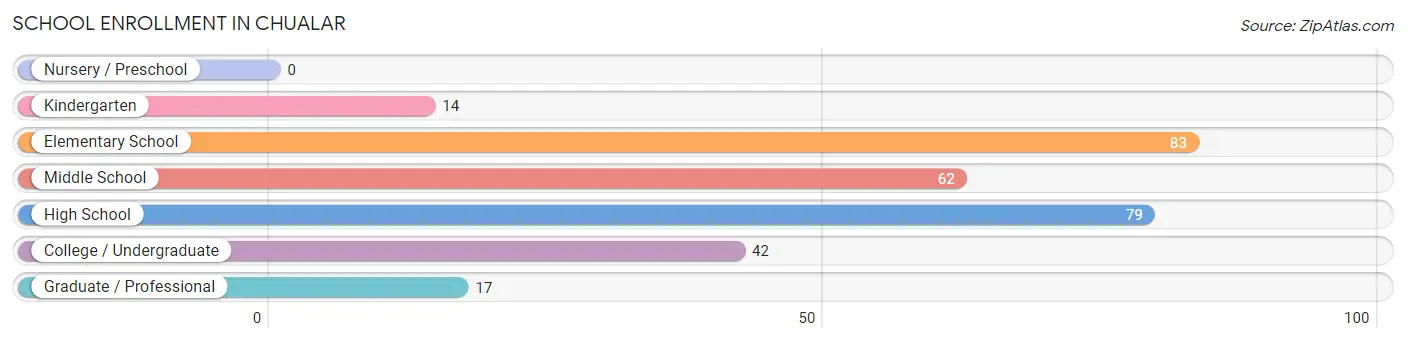
| School Level | # Students | % Students |
| Nursery / Preschool | 0 | 0.0% |
| Kindergarten | 14 | 4.7% |
| Elementary School | 83 | 28.0% |
| Middle School | 62 | 20.9% |
| High School | 79 | 26.6% |
| College / Undergraduate | 42 | 14.1% |
| Graduate / Professional | 17 | 5.7% |
| Total | 297 | 100.0% |
School Enrollment by Age by Funding Source in Chualar
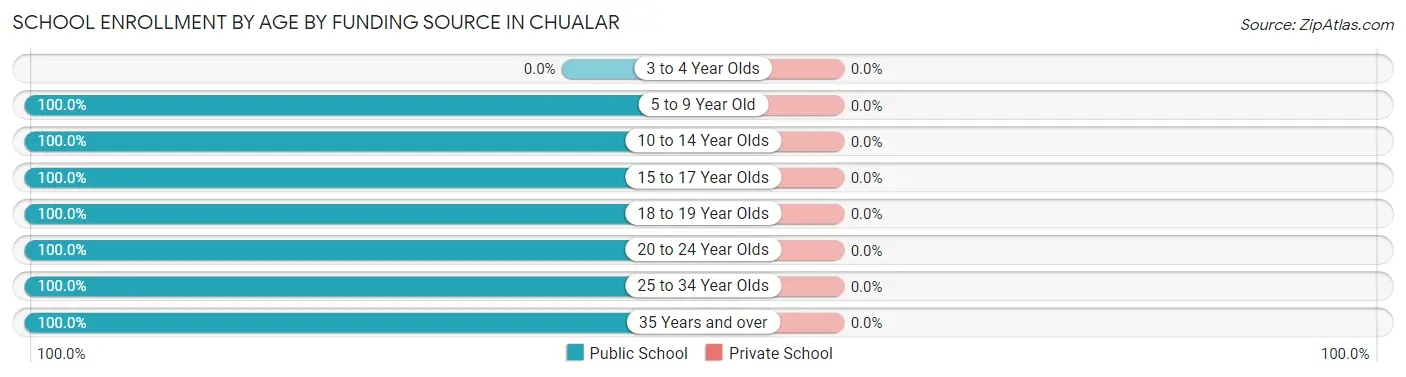
| Age Bracket | Public School | Private School |
| 3 to 4 Year Olds | 0 (0.0%) | 0 (0.0%) |
| 5 to 9 Year Old | 89 (100.0%) | 0 (0.0%) |
| 10 to 14 Year Olds | 93 (100.0%) | 0 (0.0%) |
| 15 to 17 Year Olds | 49 (100.0%) | 0 (0.0%) |
| 18 to 19 Year Olds | 23 (100.0%) | 0 (0.0%) |
| 20 to 24 Year Olds | 19 (100.0%) | 0 (0.0%) |
| 25 to 34 Year Olds | 17 (100.0%) | 0 (0.0%) |
| 35 Years and over | 7 (100.0%) | 0 (0.0%) |
| Total | 297 (100.0%) | 0 (0.0%) |
Educational Attainment by Field of Study in Chualar
Arts & humanities (17 | 56.7%), and psychology (13 | 43.3%) are the most common fields of study among 30 individuals in Chualar who have obtained a bachelor's degree or higher.
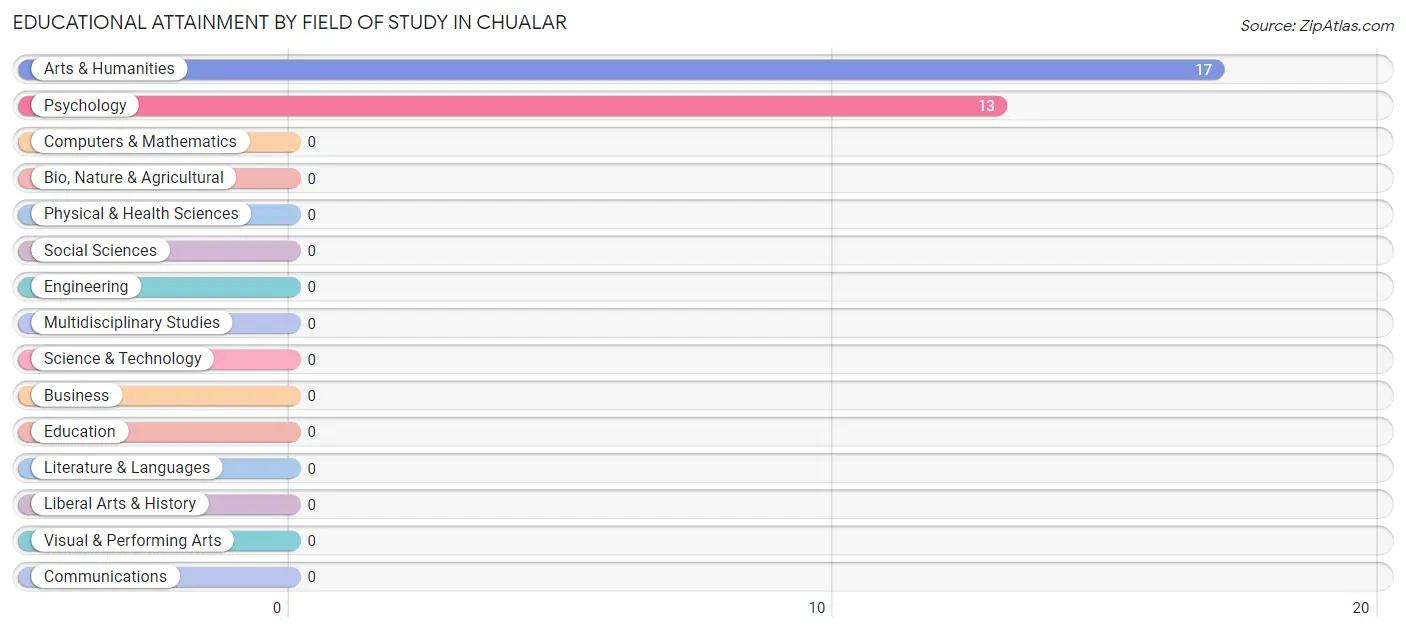
| Field of Study | # Graduates | % Graduates |
| Computers & Mathematics | 0 | 0.0% |
| Bio, Nature & Agricultural | 0 | 0.0% |
| Physical & Health Sciences | 0 | 0.0% |
| Psychology | 13 | 43.3% |
| Social Sciences | 0 | 0.0% |
| Engineering | 0 | 0.0% |
| Multidisciplinary Studies | 0 | 0.0% |
| Science & Technology | 0 | 0.0% |
| Business | 0 | 0.0% |
| Education | 0 | 0.0% |
| Literature & Languages | 0 | 0.0% |
| Liberal Arts & History | 0 | 0.0% |
| Visual & Performing Arts | 0 | 0.0% |
| Communications | 0 | 0.0% |
| Arts & Humanities | 17 | 56.7% |
| Total | 30 | 100.0% |
Transportation & Commute in Chualar
Vehicle Availability by Sex in Chualar
The most prevalent vehicle ownership categories in Chualar are males with 5 or more vehicles (98, accounting for 42.4%) and females with 5 or more vehicles (66, making up 54.1%).
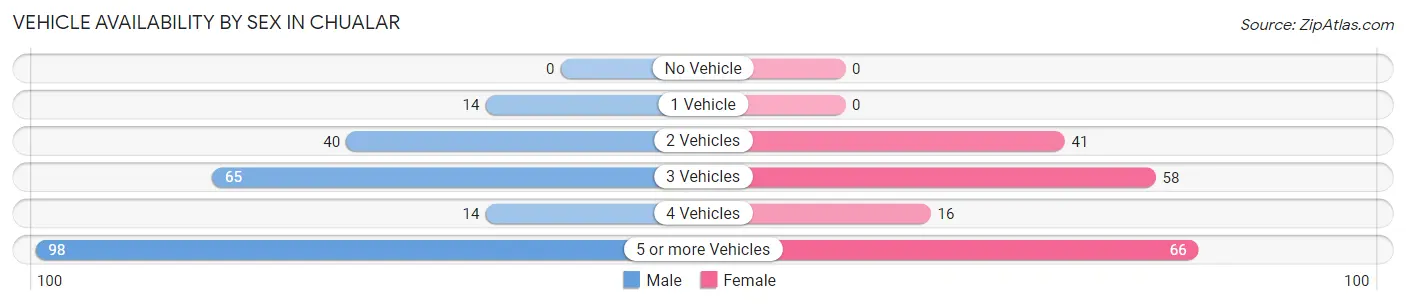
| Vehicles Available | Male | Female |
| No Vehicle | 0 (0.0%) | 0 (0.0%) |
| 1 Vehicle | 14 (6.1%) | 0 (0.0%) |
| 2 Vehicles | 40 (17.3%) | 41 (22.7%) |
| 3 Vehicles | 65 (28.1%) | 58 (32.0%) |
| 4 Vehicles | 14 (6.1%) | 16 (8.8%) |
| 5 or more Vehicles | 98 (42.4%) | 66 (36.5%) |
| Total | 231 (100.0%) | 181 (100.0%) |
Commute Time in Chualar
The most frequently occuring commute durations in Chualar are 20 to 24 minutes (144 commuters, 36.4%), 15 to 19 minutes (73 commuters, 18.4%), and 30 to 34 minutes (49 commuters, 12.4%).
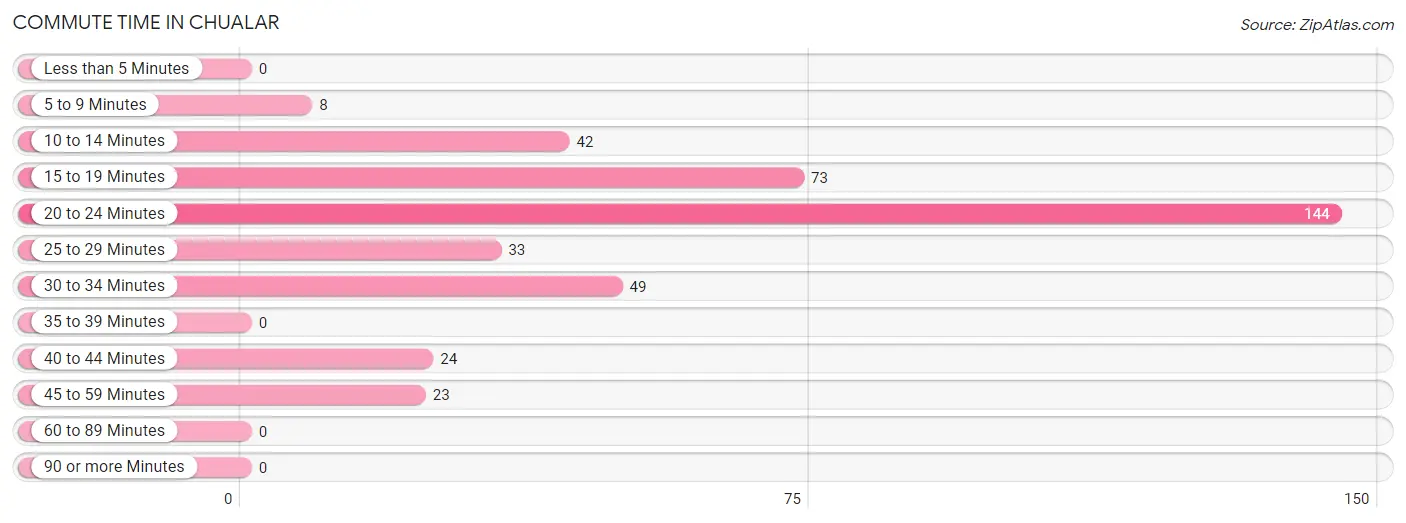
| Commute Time | # Commuters | % Commuters |
| Less than 5 Minutes | 0 | 0.0% |
| 5 to 9 Minutes | 8 | 2.0% |
| 10 to 14 Minutes | 42 | 10.6% |
| 15 to 19 Minutes | 73 | 18.4% |
| 20 to 24 Minutes | 144 | 36.4% |
| 25 to 29 Minutes | 33 | 8.3% |
| 30 to 34 Minutes | 49 | 12.4% |
| 35 to 39 Minutes | 0 | 0.0% |
| 40 to 44 Minutes | 24 | 6.1% |
| 45 to 59 Minutes | 23 | 5.8% |
| 60 to 89 Minutes | 0 | 0.0% |
| 90 or more Minutes | 0 | 0.0% |
Commute Time by Sex in Chualar
The most common commute times in Chualar are 20 to 24 minutes (93 commuters, 40.3%) for males and 20 to 24 minutes (51 commuters, 30.9%) for females.
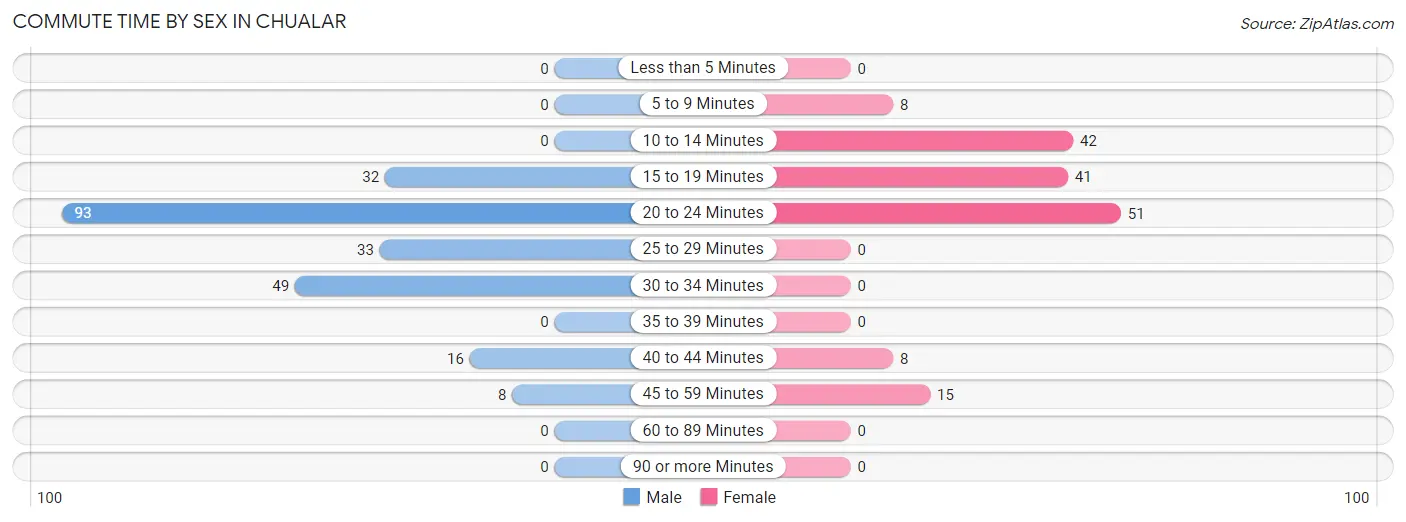
| Commute Time | Male | Female |
| Less than 5 Minutes | 0 (0.0%) | 0 (0.0%) |
| 5 to 9 Minutes | 0 (0.0%) | 8 (4.9%) |
| 10 to 14 Minutes | 0 (0.0%) | 42 (25.5%) |
| 15 to 19 Minutes | 32 (13.9%) | 41 (24.8%) |
| 20 to 24 Minutes | 93 (40.3%) | 51 (30.9%) |
| 25 to 29 Minutes | 33 (14.3%) | 0 (0.0%) |
| 30 to 34 Minutes | 49 (21.2%) | 0 (0.0%) |
| 35 to 39 Minutes | 0 (0.0%) | 0 (0.0%) |
| 40 to 44 Minutes | 16 (6.9%) | 8 (4.9%) |
| 45 to 59 Minutes | 8 (3.5%) | 15 (9.1%) |
| 60 to 89 Minutes | 0 (0.0%) | 0 (0.0%) |
| 90 or more Minutes | 0 (0.0%) | 0 (0.0%) |
Time of Departure to Work by Sex in Chualar
The most frequent times of departure to work in Chualar are 6:00 AM to 6:29 AM (75, 32.5%) for males and 7:00 AM to 7:29 AM (41, 24.8%) for females.
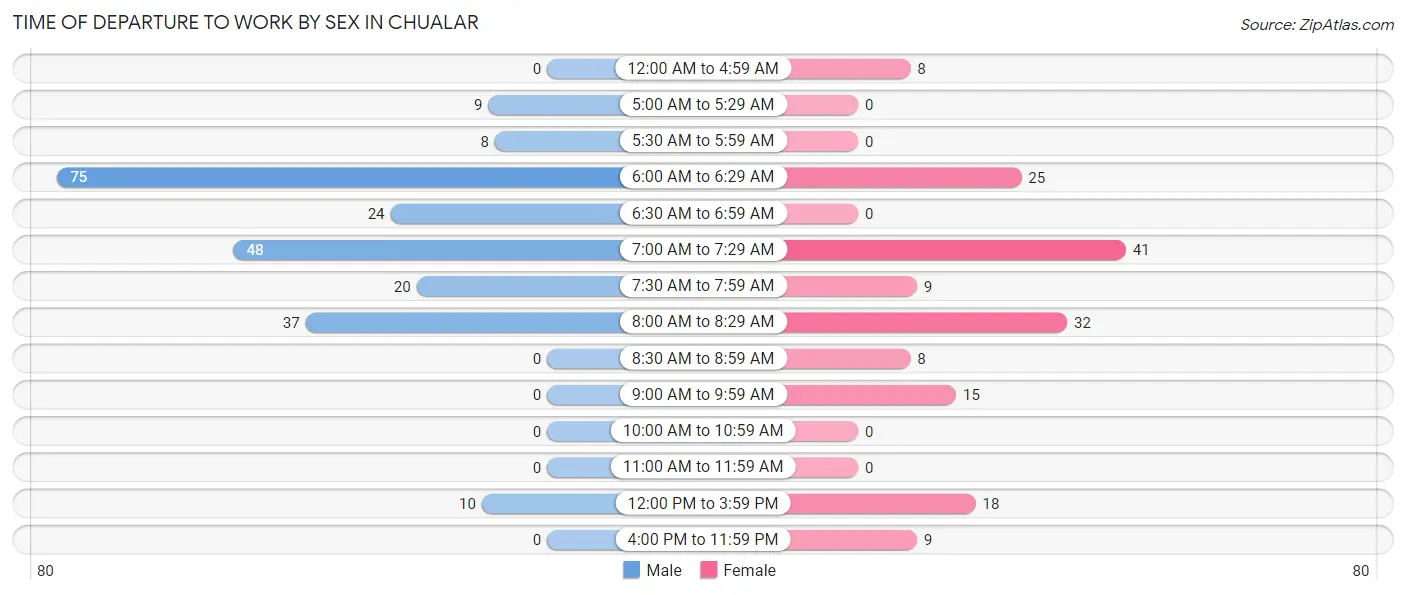
| Time of Departure | Male | Female |
| 12:00 AM to 4:59 AM | 0 (0.0%) | 8 (4.9%) |
| 5:00 AM to 5:29 AM | 9 (3.9%) | 0 (0.0%) |
| 5:30 AM to 5:59 AM | 8 (3.5%) | 0 (0.0%) |
| 6:00 AM to 6:29 AM | 75 (32.5%) | 25 (15.1%) |
| 6:30 AM to 6:59 AM | 24 (10.4%) | 0 (0.0%) |
| 7:00 AM to 7:29 AM | 48 (20.8%) | 41 (24.8%) |
| 7:30 AM to 7:59 AM | 20 (8.7%) | 9 (5.4%) |
| 8:00 AM to 8:29 AM | 37 (16.0%) | 32 (19.4%) |
| 8:30 AM to 8:59 AM | 0 (0.0%) | 8 (4.9%) |
| 9:00 AM to 9:59 AM | 0 (0.0%) | 15 (9.1%) |
| 10:00 AM to 10:59 AM | 0 (0.0%) | 0 (0.0%) |
| 11:00 AM to 11:59 AM | 0 (0.0%) | 0 (0.0%) |
| 12:00 PM to 3:59 PM | 10 (4.3%) | 18 (10.9%) |
| 4:00 PM to 11:59 PM | 0 (0.0%) | 9 (5.4%) |
| Total | 231 (100.0%) | 165 (100.0%) |
Housing Occupancy in Chualar
Occupancy by Ownership in Chualar
Of the total 207 dwellings in Chualar, owner-occupied units account for 109 (52.7%), while renter-occupied units make up 98 (47.3%).
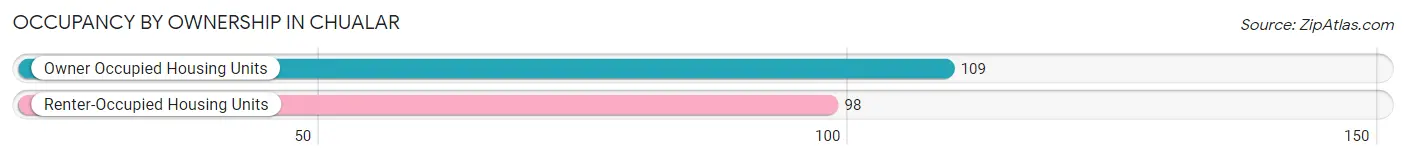
| Occupancy | # Housing Units | % Housing Units |
| Owner Occupied Housing Units | 109 | 52.7% |
| Renter-Occupied Housing Units | 98 | 47.3% |
| Total Occupied Housing Units | 207 | 100.0% |
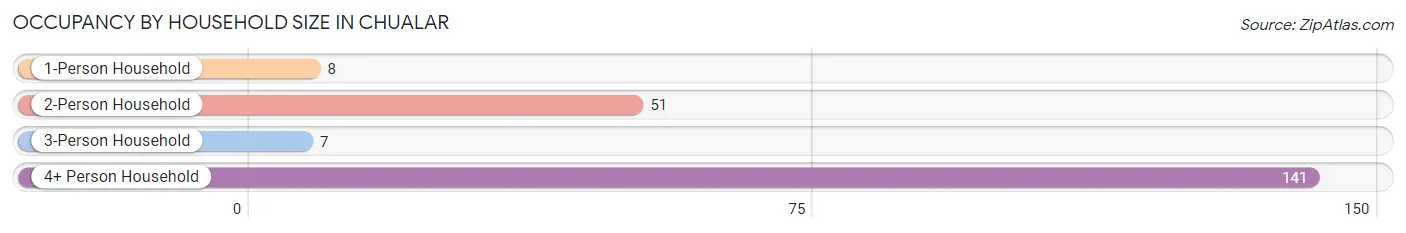
Occupancy by Household Size in Chualar
| Household Size | # Housing Units | % Housing Units |
| 1-Person Household | 8 | 3.9% |
| 2-Person Household | 51 | 24.6% |
| 3-Person Household | 7 | 3.4% |
| 4+ Person Household | 141 | 68.1% |
| Total Housing Units | 207 | 100.0% |
Occupancy by Ownership by Household Size in Chualar
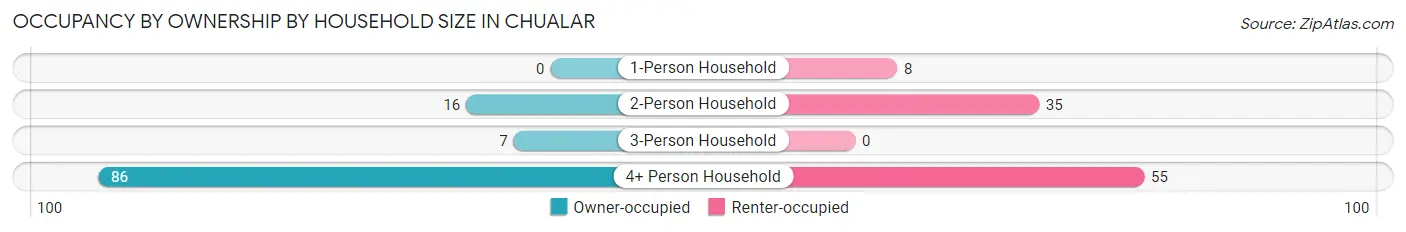
| Household Size | Owner-occupied | Renter-occupied |
| 1-Person Household | 0 (0.0%) | 8 (100.0%) |
| 2-Person Household | 16 (31.4%) | 35 (68.6%) |
| 3-Person Household | 7 (100.0%) | 0 (0.0%) |
| 4+ Person Household | 86 (61.0%) | 55 (39.0%) |
| Total Housing Units | 109 (52.7%) | 98 (47.3%) |
Occupancy by Educational Attainment in Chualar
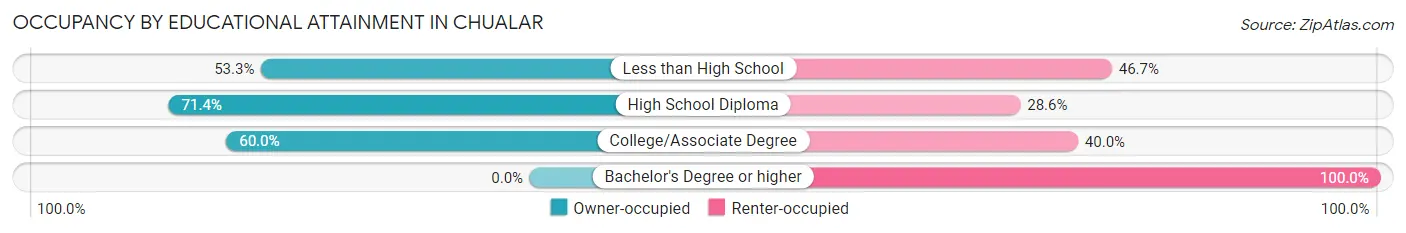
| Household Size | Owner-occupied | Renter-occupied |
| Less than High School | 65 (53.3%) | 57 (46.7%) |
| High School Diploma | 20 (71.4%) | 8 (28.6%) |
| College/Associate Degree | 24 (60.0%) | 16 (40.0%) |
| Bachelor's Degree or higher | 0 (0.0%) | 17 (100.0%) |
Occupancy by Age of Householder in Chualar
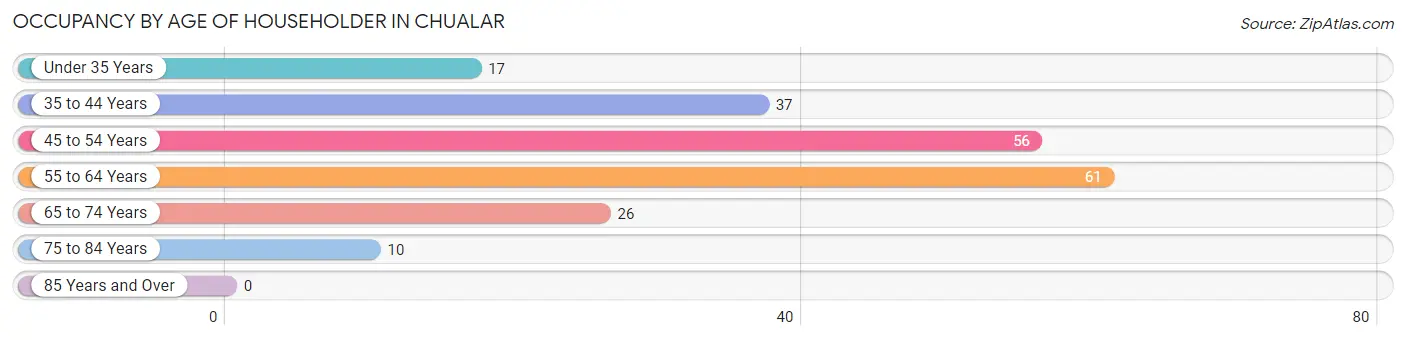
| Age Bracket | # Households | % Households |
| Under 35 Years | 17 | 8.2% |
| 35 to 44 Years | 37 | 17.9% |
| 45 to 54 Years | 56 | 27.1% |
| 55 to 64 Years | 61 | 29.5% |
| 65 to 74 Years | 26 | 12.6% |
| 75 to 84 Years | 10 | 4.8% |
| 85 Years and Over | 0 | 0.0% |
| Total | 207 | 100.0% |
Housing Finances in Chualar
Median Income by Occupancy in Chualar
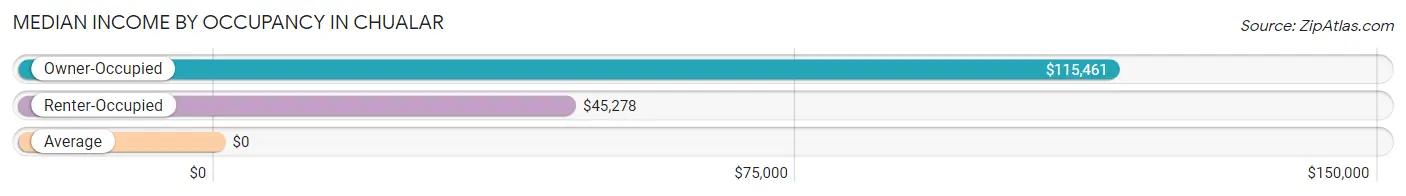
| Occupancy Type | # Households | Median Income |
| Owner-Occupied | 109 (52.7%) | $115,461 |
| Renter-Occupied | 98 (47.3%) | $45,278 |
| Average | 207 (100.0%) | $0 |
Occupancy by Householder Income Bracket in Chualar
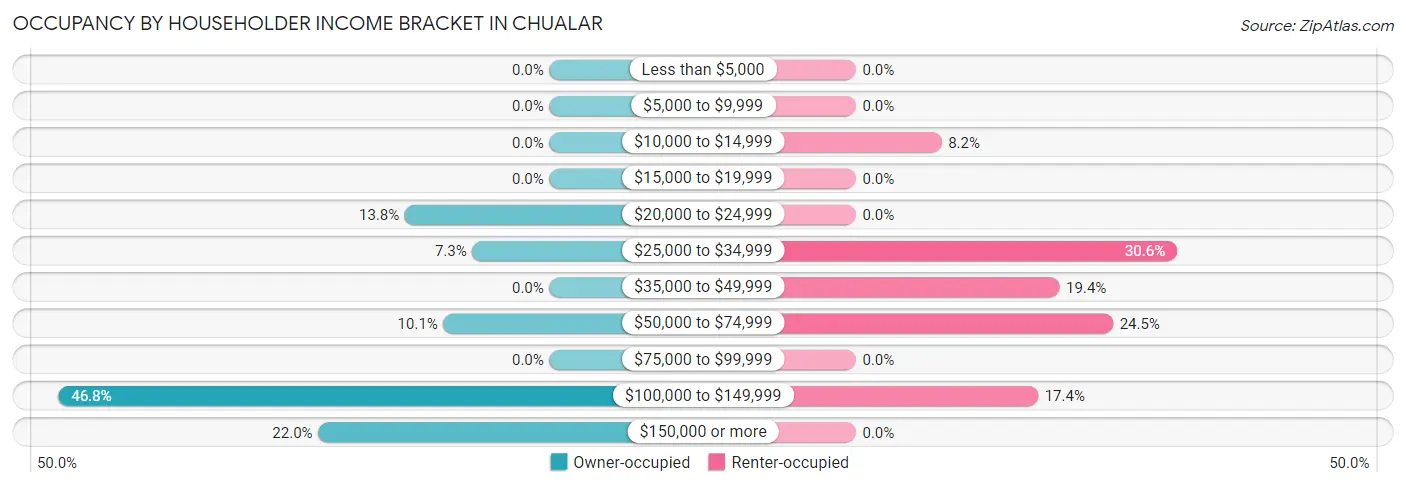
| Income Bracket | Owner-occupied | Renter-occupied |
| Less than $5,000 | 0 (0.0%) | 0 (0.0%) |
| $5,000 to $9,999 | 0 (0.0%) | 0 (0.0%) |
| $10,000 to $14,999 | 0 (0.0%) | 8 (8.2%) |
| $15,000 to $19,999 | 0 (0.0%) | 0 (0.0%) |
| $20,000 to $24,999 | 15 (13.8%) | 0 (0.0%) |
| $25,000 to $34,999 | 8 (7.3%) | 30 (30.6%) |
| $35,000 to $49,999 | 0 (0.0%) | 19 (19.4%) |
| $50,000 to $74,999 | 11 (10.1%) | 24 (24.5%) |
| $75,000 to $99,999 | 0 (0.0%) | 0 (0.0%) |
| $100,000 to $149,999 | 51 (46.8%) | 17 (17.3%) |
| $150,000 or more | 24 (22.0%) | 0 (0.0%) |
| Total | 109 (100.0%) | 98 (100.0%) |
Monthly Housing Cost Tiers in Chualar
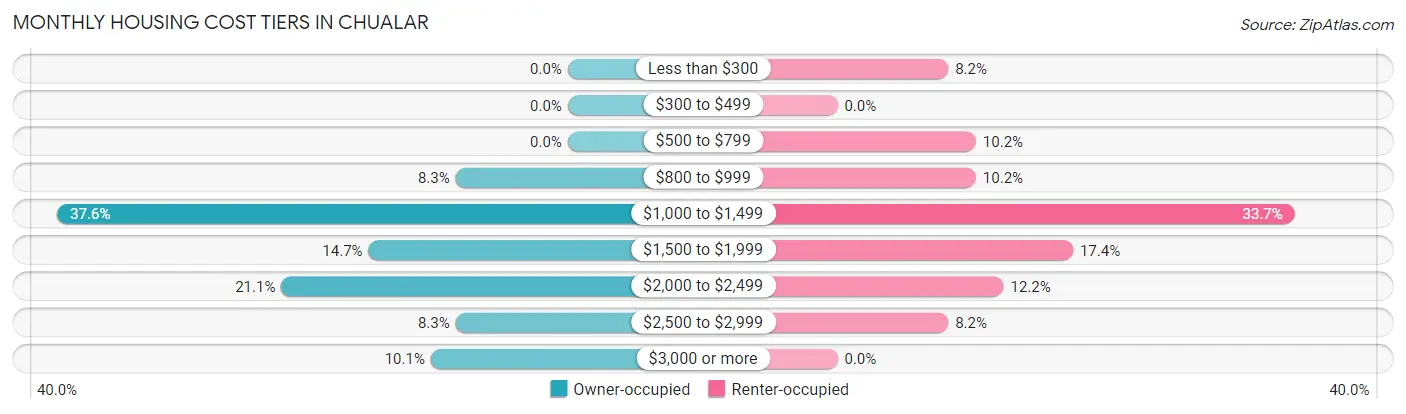
| Monthly Cost | Owner-occupied | Renter-occupied |
| Less than $300 | 0 (0.0%) | 8 (8.2%) |
| $300 to $499 | 0 (0.0%) | 0 (0.0%) |
| $500 to $799 | 0 (0.0%) | 10 (10.2%) |
| $800 to $999 | 9 (8.3%) | 10 (10.2%) |
| $1,000 to $1,499 | 41 (37.6%) | 33 (33.7%) |
| $1,500 to $1,999 | 16 (14.7%) | 17 (17.3%) |
| $2,000 to $2,499 | 23 (21.1%) | 12 (12.2%) |
| $2,500 to $2,999 | 9 (8.3%) | 8 (8.2%) |
| $3,000 or more | 11 (10.1%) | 0 (0.0%) |
| Total | 109 (100.0%) | 98 (100.0%) |
Physical Housing Characteristics in Chualar
Housing Structures in Chualar
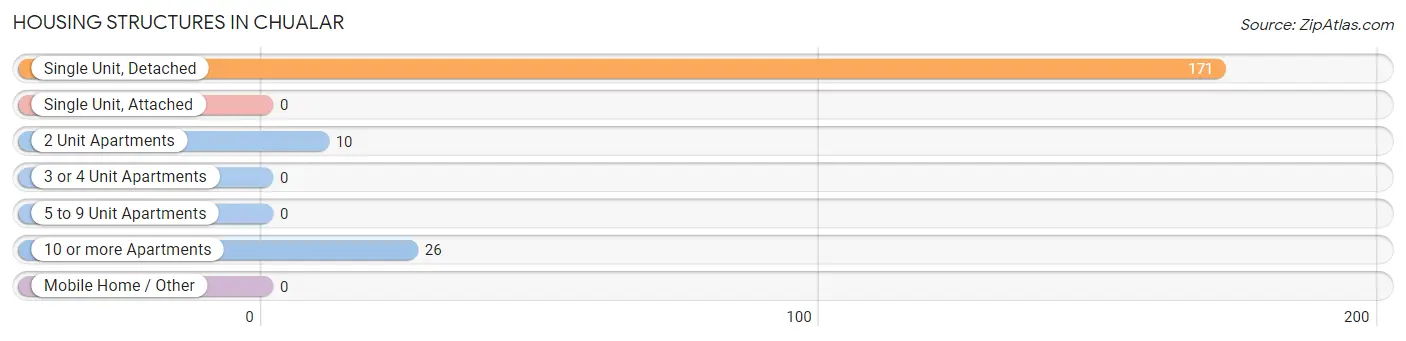
| Structure Type | # Housing Units | % Housing Units |
| Single Unit, Detached | 171 | 82.6% |
| Single Unit, Attached | 0 | 0.0% |
| 2 Unit Apartments | 10 | 4.8% |
| 3 or 4 Unit Apartments | 0 | 0.0% |
| 5 to 9 Unit Apartments | 0 | 0.0% |
| 10 or more Apartments | 26 | 12.6% |
| Mobile Home / Other | 0 | 0.0% |
| Total | 207 | 100.0% |
Housing Structures by Occupancy in Chualar
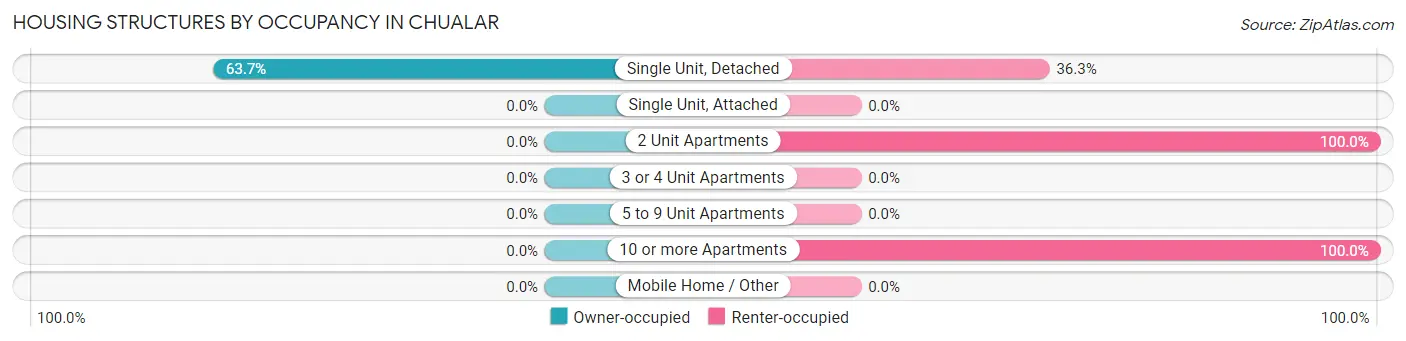
| Structure Type | Owner-occupied | Renter-occupied |
| Single Unit, Detached | 109 (63.7%) | 62 (36.3%) |
| Single Unit, Attached | 0 (0.0%) | 0 (0.0%) |
| 2 Unit Apartments | 0 (0.0%) | 10 (100.0%) |
| 3 or 4 Unit Apartments | 0 (0.0%) | 0 (0.0%) |
| 5 to 9 Unit Apartments | 0 (0.0%) | 0 (0.0%) |
| 10 or more Apartments | 0 (0.0%) | 26 (100.0%) |
| Mobile Home / Other | 0 (0.0%) | 0 (0.0%) |
| Total | 109 (52.7%) | 98 (47.3%) |
Housing Structures by Number of Rooms in Chualar
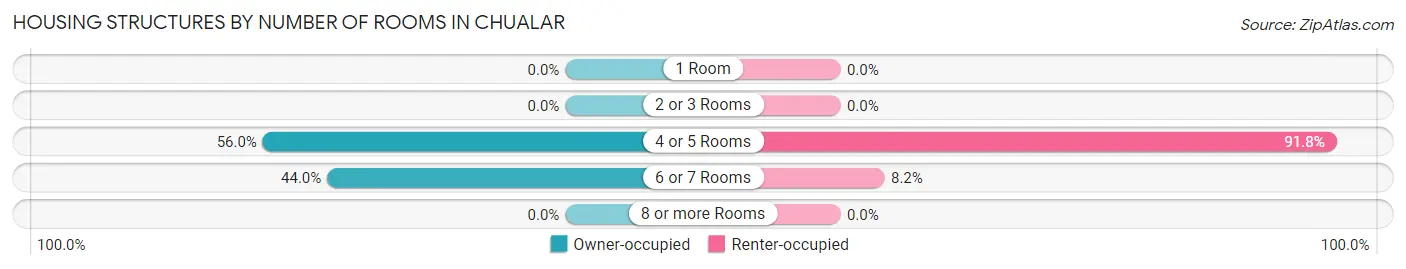
| Number of Rooms | Owner-occupied | Renter-occupied |
| 1 Room | 0 (0.0%) | 0 (0.0%) |
| 2 or 3 Rooms | 0 (0.0%) | 0 (0.0%) |
| 4 or 5 Rooms | 61 (56.0%) | 90 (91.8%) |
| 6 or 7 Rooms | 48 (44.0%) | 8 (8.2%) |
| 8 or more Rooms | 0 (0.0%) | 0 (0.0%) |
| Total | 109 (100.0%) | 98 (100.0%) |
Housing Structure by Heating Type in Chualar
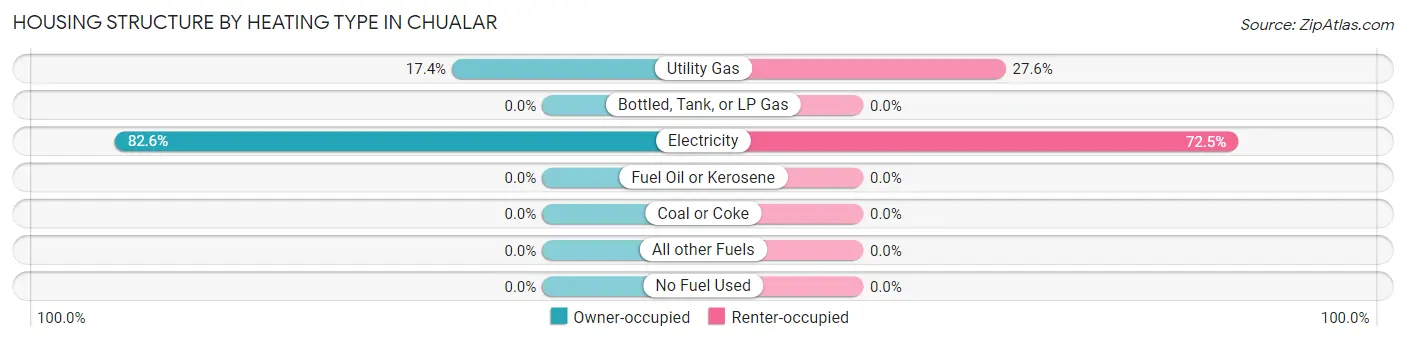
| Heating Type | Owner-occupied | Renter-occupied |
| Utility Gas | 19 (17.4%) | 27 (27.6%) |
| Bottled, Tank, or LP Gas | 0 (0.0%) | 0 (0.0%) |
| Electricity | 90 (82.6%) | 71 (72.5%) |
| Fuel Oil or Kerosene | 0 (0.0%) | 0 (0.0%) |
| Coal or Coke | 0 (0.0%) | 0 (0.0%) |
| All other Fuels | 0 (0.0%) | 0 (0.0%) |
| No Fuel Used | 0 (0.0%) | 0 (0.0%) |
| Total | 109 (100.0%) | 98 (100.0%) |
Household Vehicle Usage in Chualar
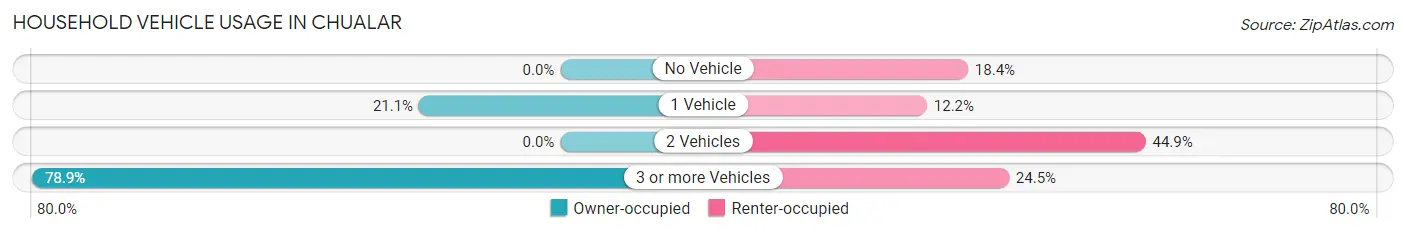
| Vehicles per Household | Owner-occupied | Renter-occupied |
| No Vehicle | 0 (0.0%) | 18 (18.4%) |
| 1 Vehicle | 23 (21.1%) | 12 (12.2%) |
| 2 Vehicles | 0 (0.0%) | 44 (44.9%) |
| 3 or more Vehicles | 86 (78.9%) | 24 (24.5%) |
| Total | 109 (100.0%) | 98 (100.0%) |
Real Estate & Mortgages in Chualar
Real Estate and Mortgage Overview in Chualar
| Characteristic | Without Mortgage | With Mortgage |
| Housing Units | 0 | 109 |
| Median Property Value | - | - |
| Median Household Income | - | - |
| Monthly Housing Costs | - | - |
| Real Estate Taxes | - | - |
Property Value by Mortgage Status in Chualar
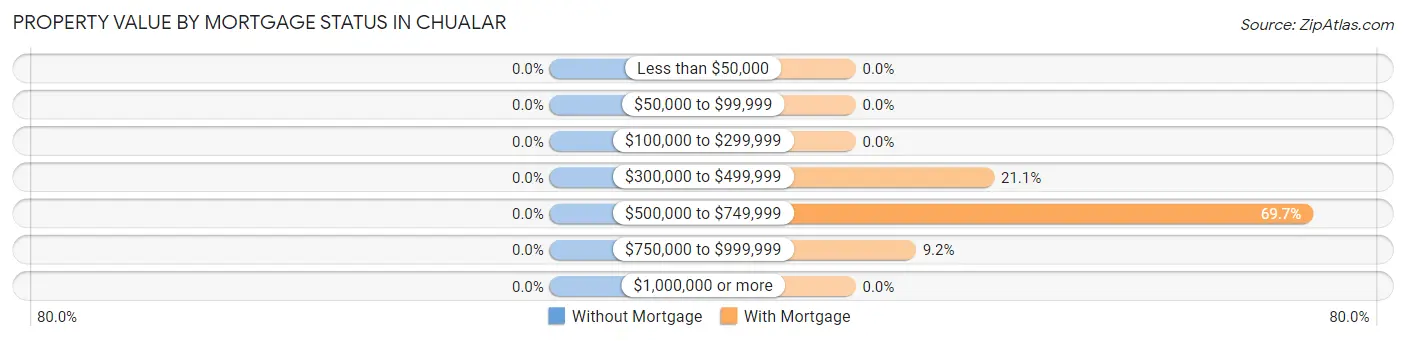
| Property Value | Without Mortgage | With Mortgage |
| Less than $50,000 | 0 (0.0%) | 0 (0.0%) |
| $50,000 to $99,999 | 0 (0.0%) | 0 (0.0%) |
| $100,000 to $299,999 | 0 (0.0%) | 0 (0.0%) |
| $300,000 to $499,999 | 0 (0.0%) | 23 (21.1%) |
| $500,000 to $749,999 | 0 (0.0%) | 76 (69.7%) |
| $750,000 to $999,999 | 0 (0.0%) | 10 (9.2%) |
| $1,000,000 or more | 0 (0.0%) | 0 (0.0%) |
| Total | 0 (0.0%) | 109 (100.0%) |
Household Income by Mortgage Status in Chualar
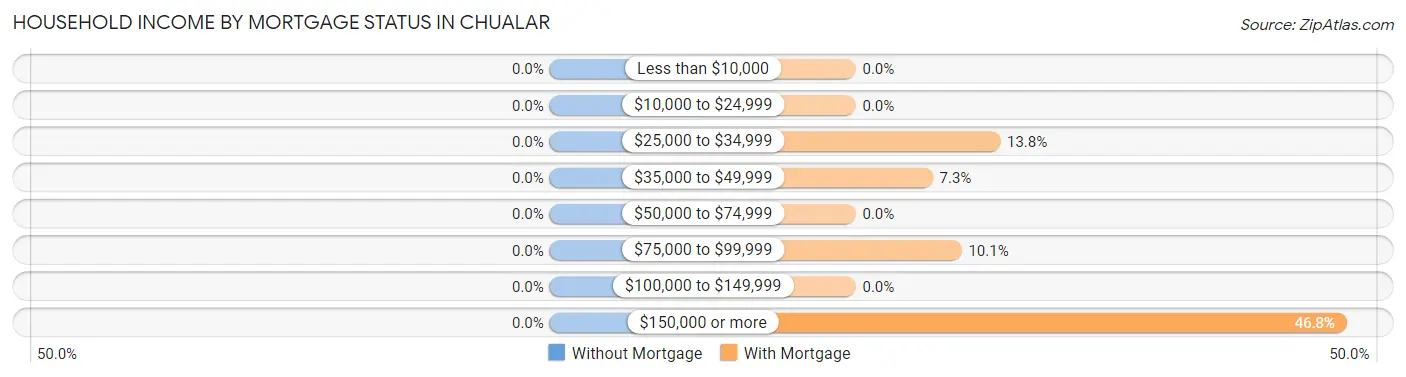
| Household Income | Without Mortgage | With Mortgage |
| Less than $10,000 | 0 (0.0%) | 0 (0.0%) |
| $10,000 to $24,999 | 0 (0.0%) | 0 (0.0%) |
| $25,000 to $34,999 | 0 (0.0%) | 15 (13.8%) |
| $35,000 to $49,999 | 0 (0.0%) | 8 (7.3%) |
| $50,000 to $74,999 | 0 (0.0%) | 0 (0.0%) |
| $75,000 to $99,999 | 0 (0.0%) | 11 (10.1%) |
| $100,000 to $149,999 | 0 (0.0%) | 0 (0.0%) |
| $150,000 or more | 0 (0.0%) | 51 (46.8%) |
| Total | 0 (0.0%) | 109 (100.0%) |
Property Value to Household Income Ratio in Chualar
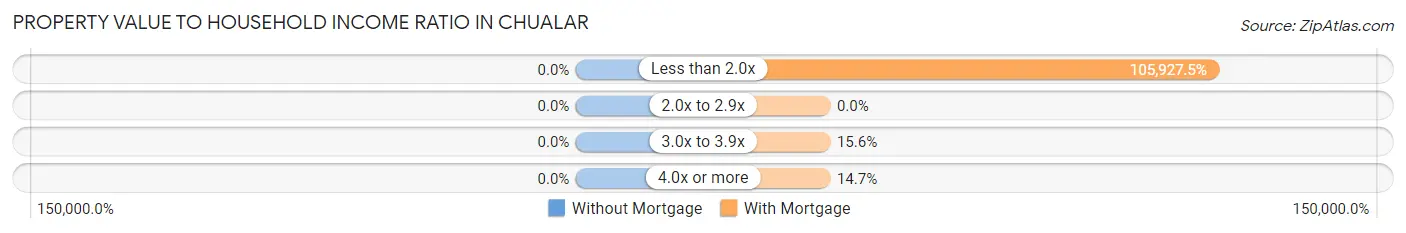
| Value-to-Income Ratio | Without Mortgage | With Mortgage |
| Less than 2.0x | 0 (0.0%) | 115,461 (105,927.5%) |
| 2.0x to 2.9x | 0 (0.0%) | 0 (0.0%) |
| 3.0x to 3.9x | 0 (0.0%) | 17 (15.6%) |
| 4.0x or more | 0 (0.0%) | 16 (14.7%) |
| Total | 0 (0.0%) | 109 (100.0%) |
Real Estate Taxes by Mortgage Status in Chualar
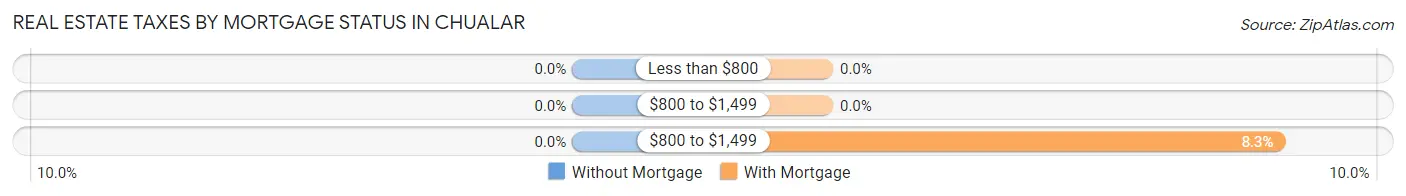
| Property Taxes | Without Mortgage | With Mortgage |
| Less than $800 | 0 (0.0%) | 0 (0.0%) |
| $800 to $1,499 | 0 (0.0%) | 0 (0.0%) |
| $800 to $1,499 | 0 (0.0%) | 9 (8.3%) |
| Total | 0 (0.0%) | 109 (100.0%) |
Health & Disability in Chualar
Health Insurance Coverage by Age in Chualar
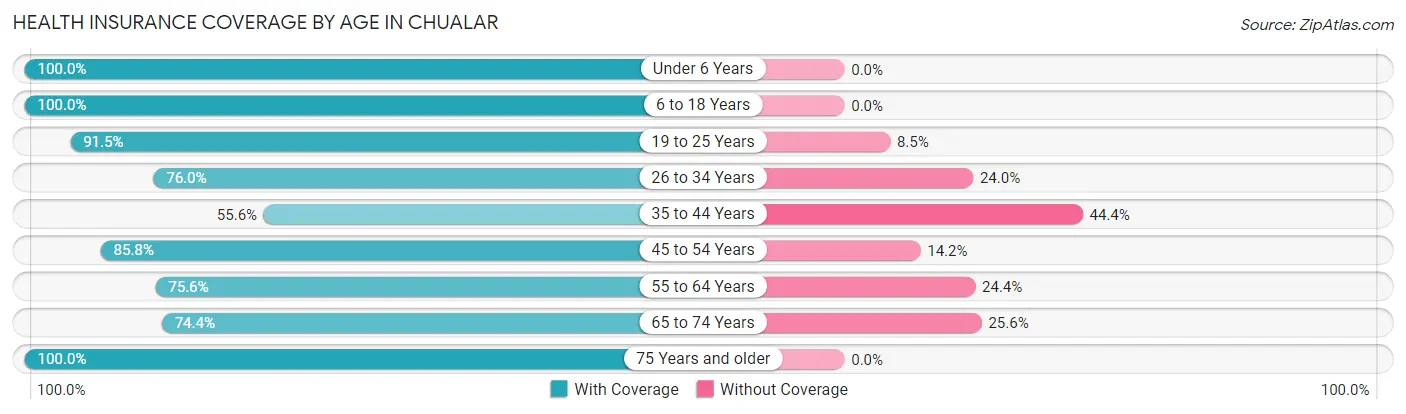
| Age Bracket | With Coverage | Without Coverage |
| Under 6 Years | 72 (100.0%) | 0 (0.0%) |
| 6 to 18 Years | 238 (100.0%) | 0 (0.0%) |
| 19 to 25 Years | 86 (91.5%) | 8 (8.5%) |
| 26 to 34 Years | 114 (76.0%) | 36 (24.0%) |
| 35 to 44 Years | 55 (55.6%) | 44 (44.4%) |
| 45 to 54 Years | 103 (85.8%) | 17 (14.2%) |
| 55 to 64 Years | 93 (75.6%) | 30 (24.4%) |
| 65 to 74 Years | 32 (74.4%) | 11 (25.6%) |
| 75 Years and older | 20 (100.0%) | 0 (0.0%) |
| Total | 813 (84.8%) | 146 (15.2%) |
Health Insurance Coverage by Citizenship Status in Chualar
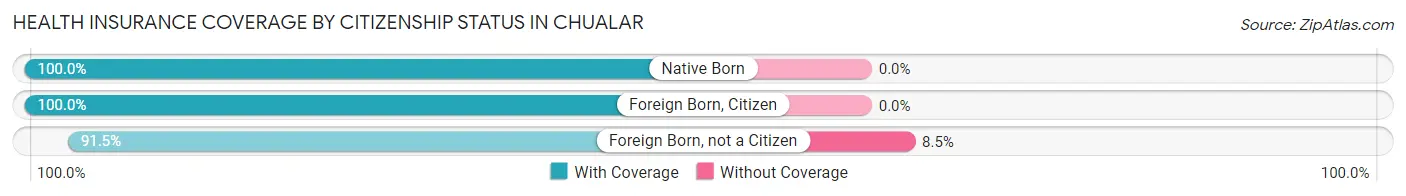
| Citizenship Status | With Coverage | Without Coverage |
| Native Born | 72 (100.0%) | 0 (0.0%) |
| Foreign Born, Citizen | 238 (100.0%) | 0 (0.0%) |
| Foreign Born, not a Citizen | 86 (91.5%) | 8 (8.5%) |
Health Insurance Coverage by Household Income in Chualar
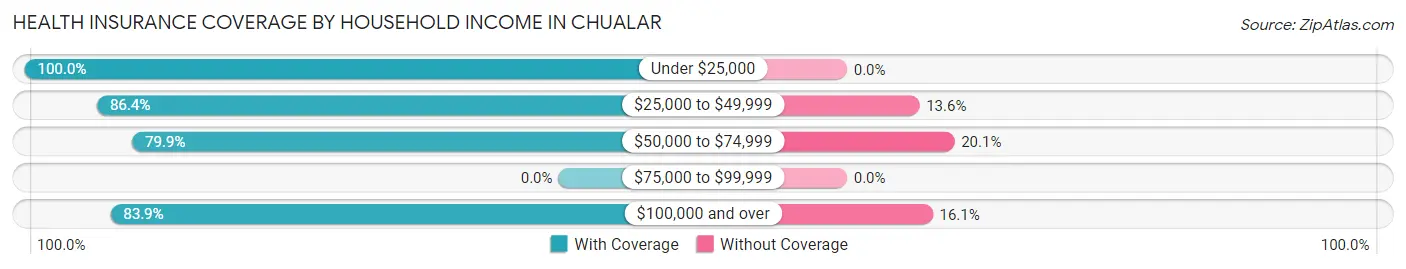
| Household Income | With Coverage | Without Coverage |
| Under $25,000 | 48 (100.0%) | 0 (0.0%) |
| $25,000 to $49,999 | 223 (86.4%) | 35 (13.6%) |
| $50,000 to $74,999 | 119 (79.9%) | 30 (20.1%) |
| $75,000 to $99,999 | 0 (0.0%) | 0 (0.0%) |
| $100,000 and over | 423 (83.9%) | 81 (16.1%) |
Public vs Private Health Insurance Coverage by Age in Chualar
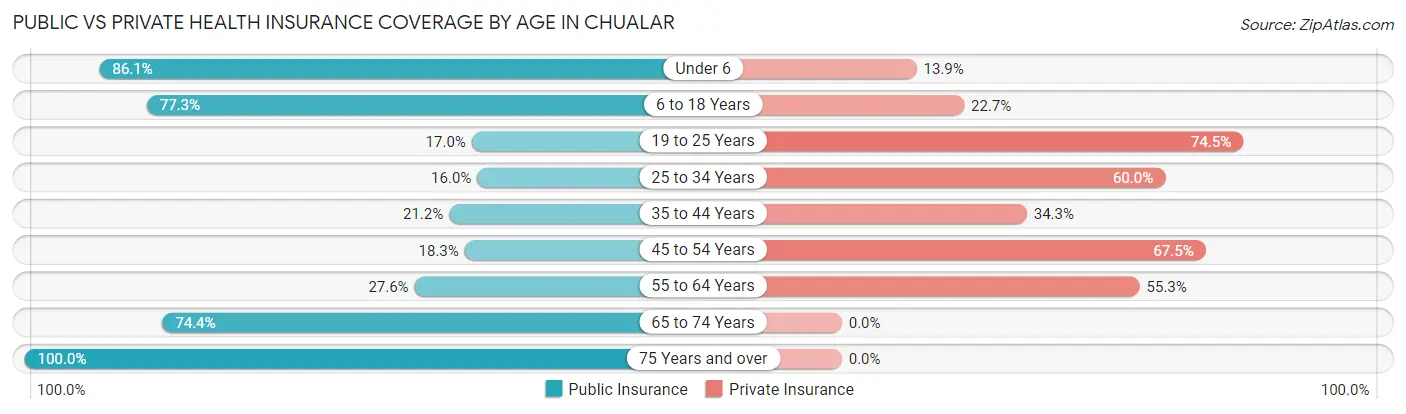
| Age Bracket | Public Insurance | Private Insurance |
| Under 6 | 62 (86.1%) | 10 (13.9%) |
| 6 to 18 Years | 184 (77.3%) | 54 (22.7%) |
| 19 to 25 Years | 16 (17.0%) | 70 (74.5%) |
| 25 to 34 Years | 24 (16.0%) | 90 (60.0%) |
| 35 to 44 Years | 21 (21.2%) | 34 (34.3%) |
| 45 to 54 Years | 22 (18.3%) | 81 (67.5%) |
| 55 to 64 Years | 34 (27.6%) | 68 (55.3%) |
| 65 to 74 Years | 32 (74.4%) | 0 (0.0%) |
| 75 Years and over | 20 (100.0%) | 0 (0.0%) |
| Total | 415 (43.3%) | 407 (42.4%) |
Disability Status by Sex by Age in Chualar
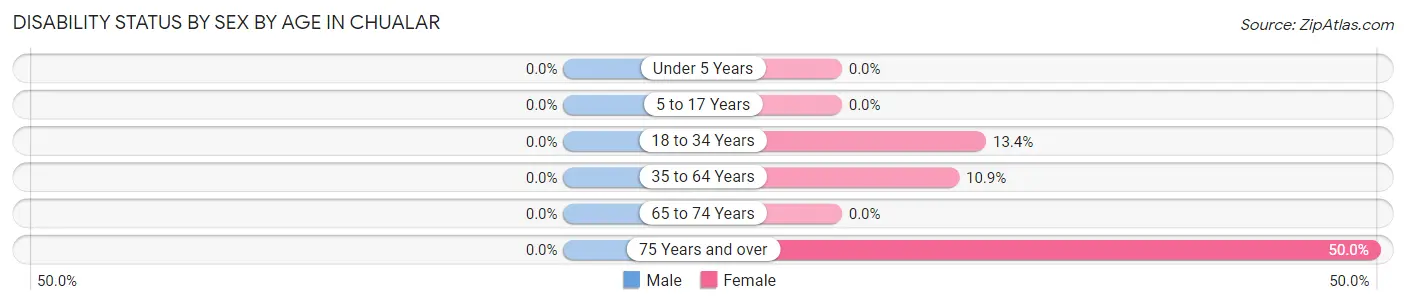
| Age Bracket | Male | Female |
| Under 5 Years | 0 (0.0%) | 0 (0.0%) |
| 5 to 17 Years | 0 (0.0%) | 0 (0.0%) |
| 18 to 34 Years | 0 (0.0%) | 17 (13.4%) |
| 35 to 64 Years | 0 (0.0%) | 16 (10.9%) |
| 65 to 74 Years | 0 (0.0%) | 0 (0.0%) |
| 75 Years and over | 0 (0.0%) | 10 (50.0%) |
Disability Class by Sex by Age in Chualar
Disability Class: Hearing Difficulty
| Age Bracket | Male | Female |
| Under 5 Years | 0 (0.0%) | 0 (0.0%) |
| 5 to 17 Years | 0 (0.0%) | 0 (0.0%) |
| 18 to 34 Years | 0 (0.0%) | 0 (0.0%) |
| 35 to 64 Years | 0 (0.0%) | 0 (0.0%) |
| 65 to 74 Years | 0 (0.0%) | 0 (0.0%) |
| 75 Years and over | 0 (0.0%) | 0 (0.0%) |
Disability Class: Vision Difficulty
| Age Bracket | Male | Female |
| Under 5 Years | 0 (0.0%) | 0 (0.0%) |
| 5 to 17 Years | 0 (0.0%) | 0 (0.0%) |
| 18 to 34 Years | 0 (0.0%) | 0 (0.0%) |
| 35 to 64 Years | 0 (0.0%) | 0 (0.0%) |
| 65 to 74 Years | 0 (0.0%) | 0 (0.0%) |
| 75 Years and over | 0 (0.0%) | 0 (0.0%) |
Disability Class: Cognitive Difficulty
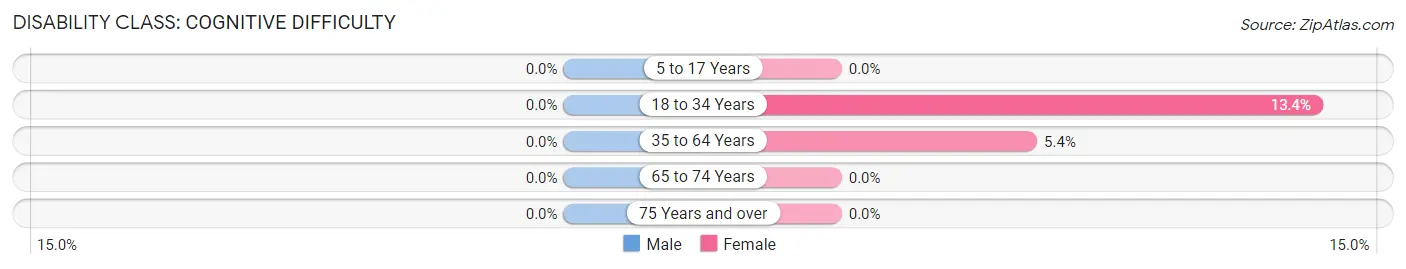
| Age Bracket | Male | Female |
| 5 to 17 Years | 0 (0.0%) | 0 (0.0%) |
| 18 to 34 Years | 0 (0.0%) | 17 (13.4%) |
| 35 to 64 Years | 0 (0.0%) | 8 (5.4%) |
| 65 to 74 Years | 0 (0.0%) | 0 (0.0%) |
| 75 Years and over | 0 (0.0%) | 0 (0.0%) |
Disability Class: Ambulatory Difficulty
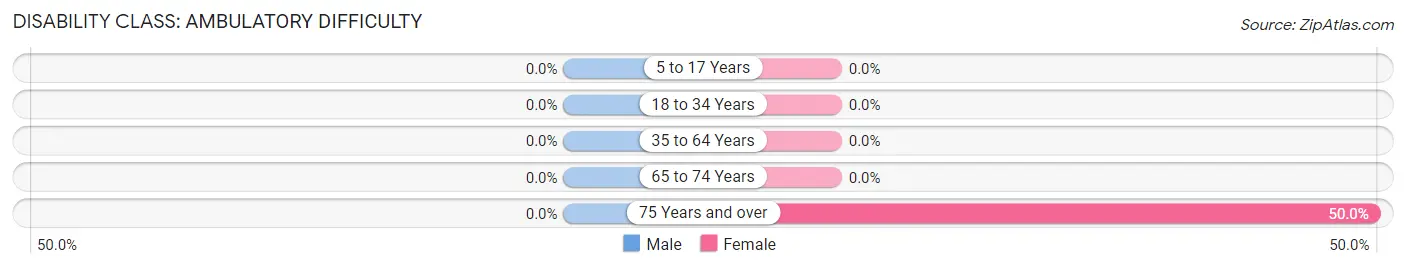
| Age Bracket | Male | Female |
| 5 to 17 Years | 0 (0.0%) | 0 (0.0%) |
| 18 to 34 Years | 0 (0.0%) | 0 (0.0%) |
| 35 to 64 Years | 0 (0.0%) | 0 (0.0%) |
| 65 to 74 Years | 0 (0.0%) | 0 (0.0%) |
| 75 Years and over | 0 (0.0%) | 10 (50.0%) |
Disability Class: Self-Care Difficulty
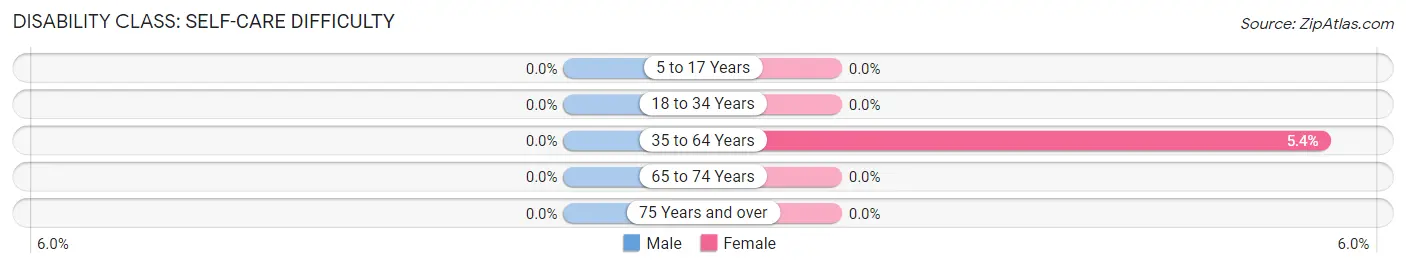
| Age Bracket | Male | Female |
| 5 to 17 Years | 0 (0.0%) | 0 (0.0%) |
| 18 to 34 Years | 0 (0.0%) | 0 (0.0%) |
| 35 to 64 Years | 0 (0.0%) | 8 (5.4%) |
| 65 to 74 Years | 0 (0.0%) | 0 (0.0%) |
| 75 Years and over | 0 (0.0%) | 0 (0.0%) |
Technology Access in Chualar
Computing Device Access in Chualar
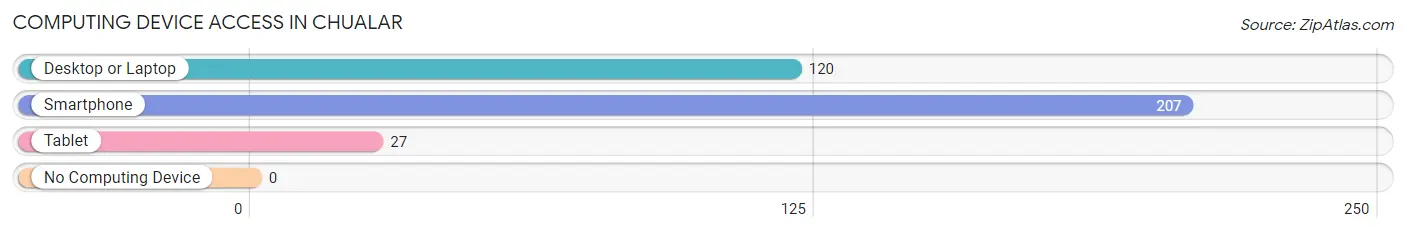
| Device Type | # Households | % Households |
| Desktop or Laptop | 120 | 58.0% |
| Smartphone | 207 | 100.0% |
| Tablet | 27 | 13.0% |
| No Computing Device | 0 | 0.0% |
| Total | 207 | 100.0% |
Internet Access in Chualar
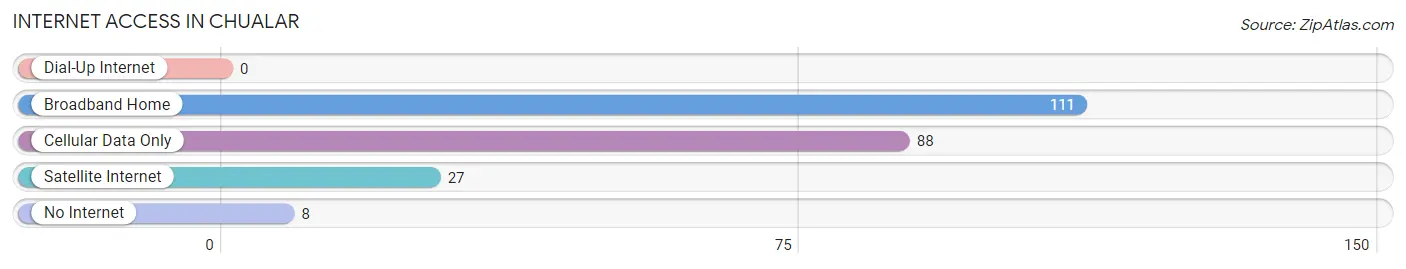
| Internet Type | # Households | % Households |
| Dial-Up Internet | 0 | 0.0% |
| Broadband Home | 111 | 53.6% |
| Cellular Data Only | 88 | 42.5% |
| Satellite Internet | 27 | 13.0% |
| No Internet | 8 | 3.9% |
| Total | 207 | 100.0% |
Chualar Summary
Chualar is a small unincorporated community located in Monterey County, California. It is situated in the Salinas Valley, approximately 8 miles east of Salinas and 8 miles west of Gonzales. The population of Chualar was estimated to be 1,845 in 2019.
History
Chualar was founded in 1868 by a group of Mexican settlers who were looking for a place to settle and farm. The name Chualar is derived from the Spanish word “chula” which means “beautiful”. The settlers chose the name because of the beautiful landscape of the area.
The first settlers of Chualar were mostly farmers and ranchers who grew crops such as wheat, barley, and oats. They also raised cattle and sheep. The town grew slowly but steadily over the years and by the early 1900s, it had become a thriving agricultural community.
In the early 1900s, Chualar was also home to a large number of Chinese immigrants who worked in the local canneries and on the farms. The Chinese immigrants were an important part of the local economy and culture.
In the 1920s, Chualar was the site of a major labor strike by the local farm workers. The strike was led by the United Farm Workers of America and lasted for several months. The strike was eventually successful and resulted in better wages and working conditions for the farm workers.
Geography
Chualar is located in the Salinas Valley, which is part of the Central Coast region of California. The valley is surrounded by the Santa Lucia Mountains to the east and the Gabilan Range to the west. The climate in the area is mild and Mediterranean, with warm summers and cool winters.
The town of Chualar is situated on the banks of the Chualar River, which is a tributary of the Salinas River. The river is a popular spot for fishing and swimming.
Economy
The economy of Chualar is largely based on agriculture. The town is home to several large farms and ranches that produce a variety of crops, including lettuce, broccoli, cauliflower, and strawberries. The local canneries also process and package these crops for sale.
In addition to agriculture, Chualar is also home to several small businesses, including restaurants, grocery stores, and auto repair shops. The town also has a few small manufacturing companies that produce items such as furniture and clothing.
Demographics
As of 2019, the population of Chualar was estimated to be 1,845. The majority of the population is of Hispanic or Latino origin, with the largest ethnic group being Mexican (87.3%). Other ethnic groups include White (7.2%), Asian (2.2%), and African American (1.3%).
The median household income in Chualar is $45,000, which is slightly lower than the national average. The median age of the population is 33.5 years, which is slightly lower than the national average. The town has a poverty rate of 22.3%, which is higher than the national average.
Conclusion
Chualar is a small unincorporated community located in Monterey County, California. It is situated in the Salinas Valley, approximately 8 miles east of Salinas and 8 miles west of Gonzales. The population of Chualar was estimated to be 1,845 in 2019. The economy of Chualar is largely based on agriculture, with the majority of the population being of Hispanic or Latino origin. The median household income in Chualar is $45,000, which is slightly lower than the national average. The town has a poverty rate of 22.3%, which is higher than the national average.
Common Questions
What is Per Capita Income in Chualar?
Per Capita income in Chualar is $18,942.
What is the Median Family Income in Chualar?
Median Family Income in Chualar is $55,000.
What is Income or Wage Gap in Chualar?
Income or Wage Gap in Chualar is 18.8%.
Women in Chualar earn 81.2 cents for every dollar earned by a man.
What is Inequality or Gini Index in Chualar?
Inequality or Gini Index in Chualar is 0.42.
What is the Total Population of Chualar?
Total Population of Chualar is 959.
What is the Total Male Population of Chualar?
Total Male Population of Chualar is 521.
What is the Total Female Population of Chualar?
Total Female Population of Chualar is 438.
What is the Ratio of Males per 100 Females in Chualar?
There are 118.95 Males per 100 Females in Chualar.
What is the Ratio of Females per 100 Males in Chualar?
There are 84.07 Females per 100 Males in Chualar.
What is the Median Population Age in Chualar?
Median Population Age in Chualar is 31.4 Years.
What is the Average Family Size in Chualar
Average Family Size in Chualar is 4.8 People.
What is the Average Household Size in Chualar
Average Household Size in Chualar is 4.6 People.
How Large is the Labor Force in Chualar?
There are 419 People in the Labor Forcein in Chualar.
What is the Percentage of People in the Labor Force in Chualar?
60.6% of People are in the Labor Force in Chualar.
What is the Unemployment Rate in Chualar?
Unemployment Rate in Chualar is 1.7%.