Chowchilla, CA Map & Demographics
Chowchilla Map
Chowchilla Overview
$20,707
PER CAPITA INCOME
$75,625
AVG FAMILY INCOME
$67,212
AVG HOUSEHOLD INCOME
57.1%
WAGE / INCOME GAP [ % ]
42.9¢/ $1
WAGE / INCOME GAP [ $ ]
0.43
INEQUALITY / GINI INDEX
18,772
TOTAL POPULATION
9,018
MALE POPULATION
9,754
FEMALE POPULATION
92.45
MALES / 100 FEMALES
108.16
FEMALES / 100 MALES
34.1
MEDIAN AGE
4.2
AVG FAMILY SIZE
3.4
AVG HOUSEHOLD SIZE
5,673
LABOR FORCE [ PEOPLE ]
37.5%
PERCENT IN LABOR FORCE
10.1%
UNEMPLOYMENT RATE
Chowchilla Zip Codes
Chowchilla Area Codes
Income in Chowchilla
Income Overview in Chowchilla
Per Capita Income in Chowchilla is $20,707, while median incomes of families and households are $75,625 and $67,212 respectively.
| Characteristic | Number | Measure |
| Per Capita Income | 18,772 | $20,707 |
| Median Family Income | 2,614 | $75,625 |
| Mean Family Income | 2,614 | $91,232 |
| Median Household Income | 3,918 | $67,212 |
| Mean Household Income | 3,918 | $81,535 |
| Income Deficit | 2,614 | $0 |
| Wage / Income Gap (%) | 18,772 | 57.11% |
| Wage / Income Gap ($) | 18,772 | 42.89¢ per $1 |
| Gini / Inequality Index | 18,772 | 0.43 |
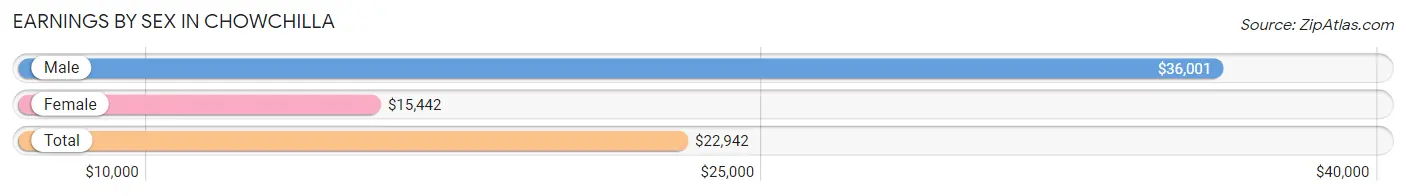
Earnings by Sex in Chowchilla
Average Earnings in Chowchilla are $22,942, $36,001 for men and $15,442 for women, a difference of 57.1%.
| Sex | Number | Average Earnings |
| Male | 4,065 (48.0%) | $36,001 |
| Female | 4,407 (52.0%) | $15,442 |
| Total | 8,472 (100.0%) | $22,942 |
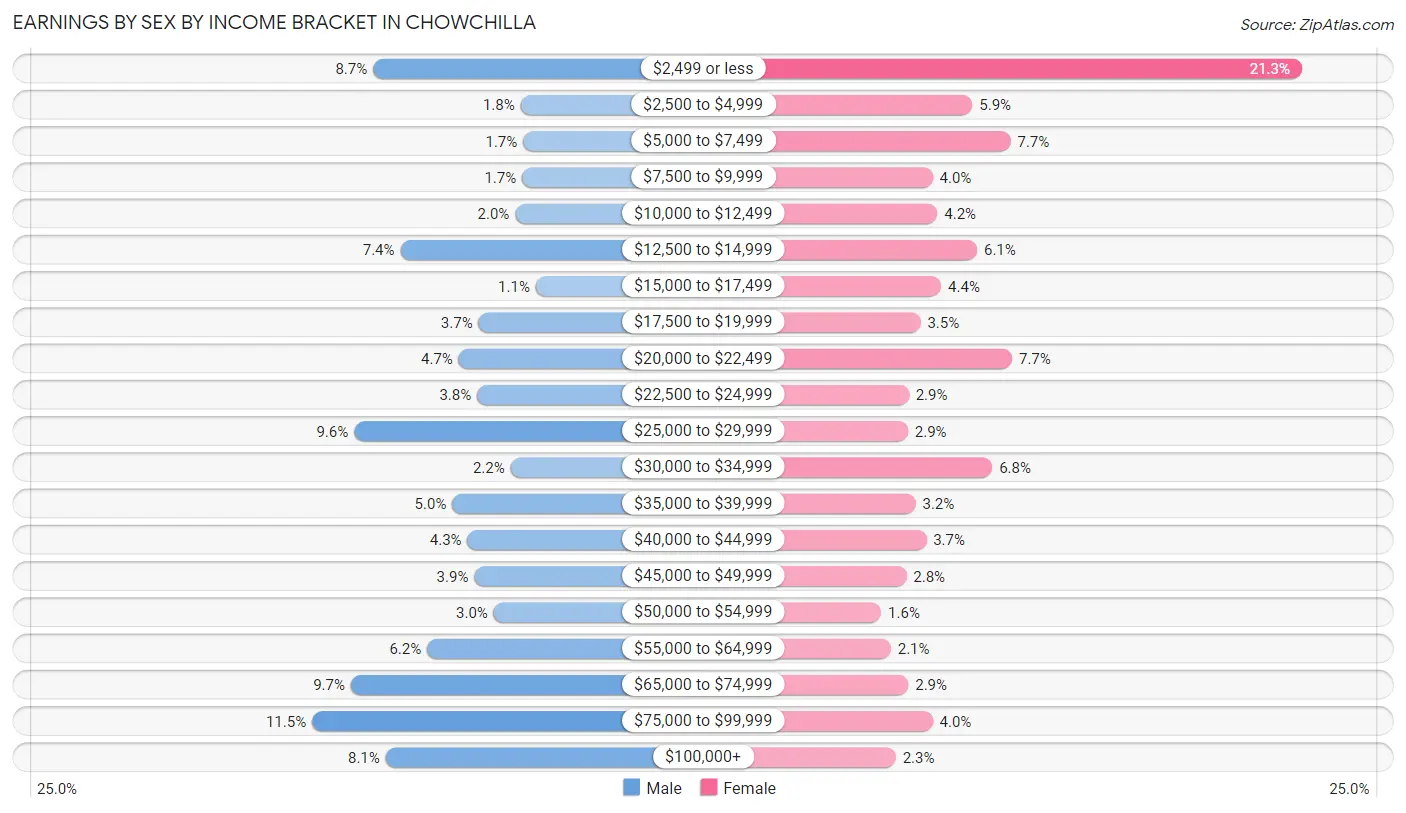
Earnings by Sex by Income Bracket in Chowchilla
The most common earnings brackets in Chowchilla are $75,000 to $99,999 for men (469 | 11.5%) and $2,499 or less for women (939 | 21.3%).
| Income | Male | Female |
| $2,499 or less | 353 (8.7%) | 939 (21.3%) |
| $2,500 to $4,999 | 72 (1.8%) | 259 (5.9%) |
| $5,000 to $7,499 | 67 (1.7%) | 338 (7.7%) |
| $7,500 to $9,999 | 69 (1.7%) | 177 (4.0%) |
| $10,000 to $12,499 | 82 (2.0%) | 187 (4.2%) |
| $12,500 to $14,999 | 301 (7.4%) | 269 (6.1%) |
| $15,000 to $17,499 | 43 (1.1%) | 195 (4.4%) |
| $17,500 to $19,999 | 152 (3.7%) | 152 (3.5%) |
| $20,000 to $22,499 | 190 (4.7%) | 341 (7.7%) |
| $22,500 to $24,999 | 155 (3.8%) | 128 (2.9%) |
| $25,000 to $29,999 | 389 (9.6%) | 126 (2.9%) |
| $30,000 to $34,999 | 91 (2.2%) | 300 (6.8%) |
| $35,000 to $39,999 | 202 (5.0%) | 142 (3.2%) |
| $40,000 to $44,999 | 173 (4.3%) | 164 (3.7%) |
| $45,000 to $49,999 | 160 (3.9%) | 123 (2.8%) |
| $50,000 to $54,999 | 123 (3.0%) | 71 (1.6%) |
| $55,000 to $64,999 | 250 (6.1%) | 91 (2.1%) |
| $65,000 to $74,999 | 395 (9.7%) | 127 (2.9%) |
| $75,000 to $99,999 | 469 (11.5%) | 177 (4.0%) |
| $100,000+ | 329 (8.1%) | 101 (2.3%) |
| Total | 4,065 (100.0%) | 4,407 (100.0%) |
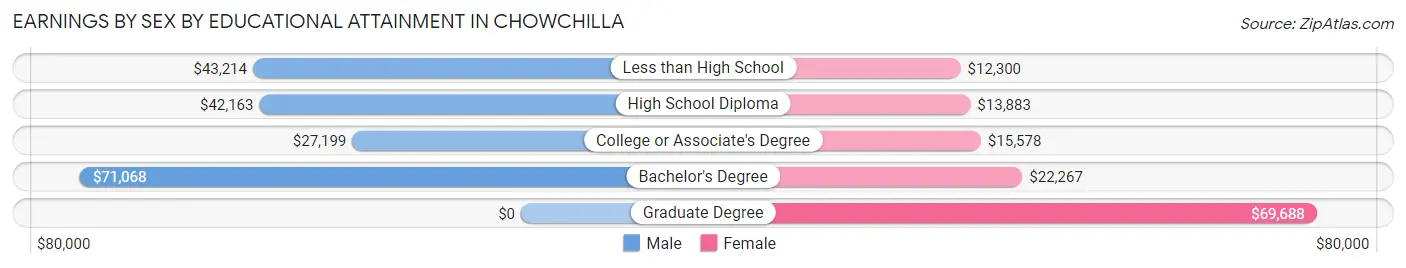
Earnings by Sex by Educational Attainment in Chowchilla
Average earnings in Chowchilla are $41,757 for men and $16,378 for women, a difference of 60.8%. Men with an educational attainment of bachelor's degree enjoy the highest average annual earnings of $71,068, while those with college or associate's degree education earn the least with $27,199. Women with an educational attainment of graduate degree earn the most with the average annual earnings of $69,688, while those with less than high school education have the smallest earnings of $12,300.
| Educational Attainment | Male Income | Female Income |
| Less than High School | $43,214 | $12,300 |
| High School Diploma | $42,163 | $13,883 |
| College or Associate's Degree | $27,199 | $15,578 |
| Bachelor's Degree | $71,068 | $22,267 |
| Graduate Degree | - | - |
| Total | $41,757 | $16,378 |
Family Income in Chowchilla
Family Income Brackets in Chowchilla
According to the Chowchilla family income data, there are 491 families falling into the $100,000 to $149,999 income range, which is the most common income bracket and makes up 18.8% of all families. Conversely, the $10,000 to $14,999 income bracket is the least frequent group with only 47 families (1.8%) belonging to this category.
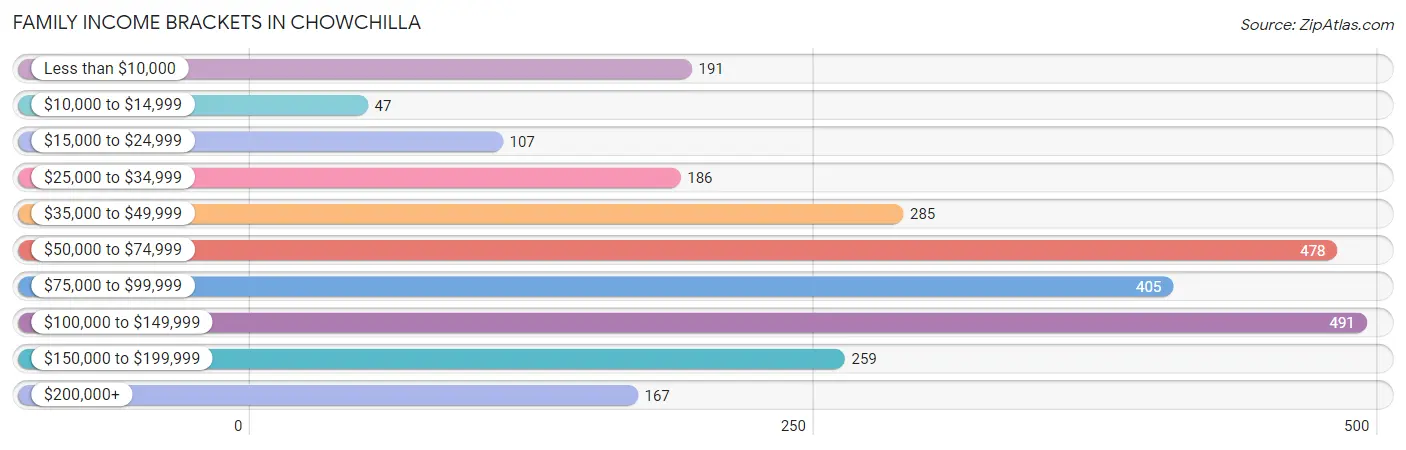
| Income Bracket | # Families | % Families |
| Less than $10,000 | 191 | 7.3% |
| $10,000 to $14,999 | 47 | 1.8% |
| $15,000 to $24,999 | 107 | 4.1% |
| $25,000 to $34,999 | 186 | 7.1% |
| $35,000 to $49,999 | 285 | 10.9% |
| $50,000 to $74,999 | 478 | 18.3% |
| $75,000 to $99,999 | 405 | 15.5% |
| $100,000 to $149,999 | 491 | 18.8% |
| $150,000 to $199,999 | 259 | 9.9% |
| $200,000+ | 167 | 6.4% |
Family Income by Famaliy Size in Chowchilla
7+ person families (227 | 8.7%) account for the highest median family income in Chowchilla with $137,837 per family, while 2-person families (615 | 23.5%) have the highest median income of $32,032 per family member.
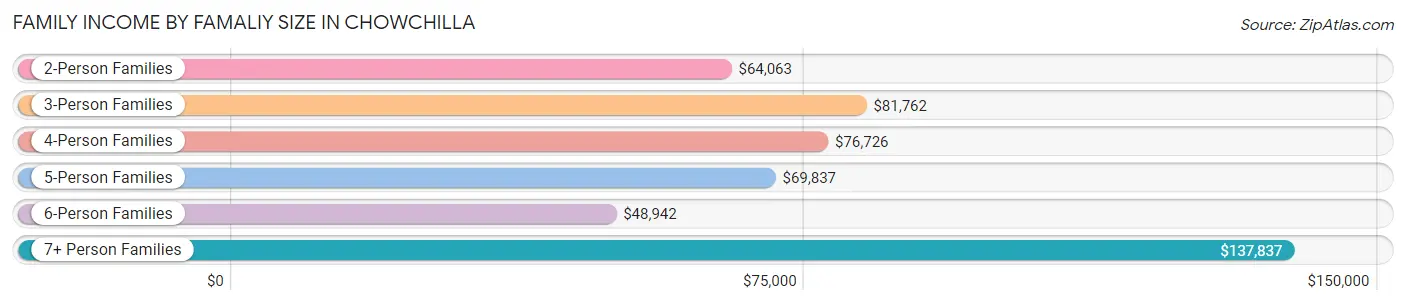
| Income Bracket | # Families | Median Income |
| 2-Person Families | 615 (23.5%) | $64,063 |
| 3-Person Families | 659 (25.2%) | $81,762 |
| 4-Person Families | 553 (21.2%) | $76,726 |
| 5-Person Families | 392 (15.0%) | $69,837 |
| 6-Person Families | 168 (6.4%) | $48,942 |
| 7+ Person Families | 227 (8.7%) | $137,837 |
| Total | 2,614 (100.0%) | $75,625 |
Family Income by Number of Earners in Chowchilla
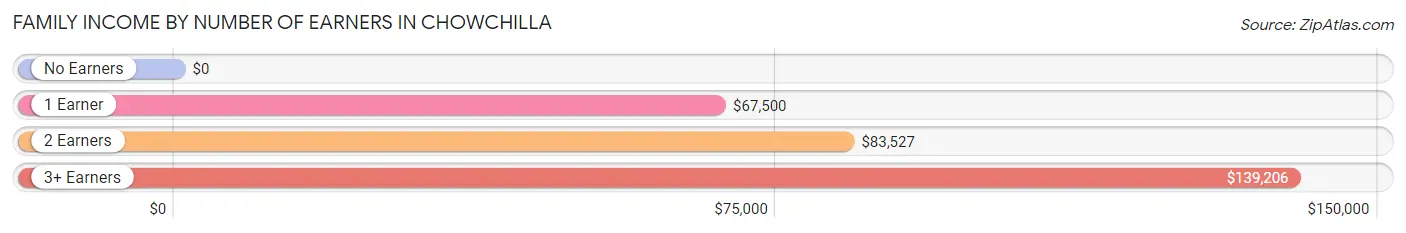
| Number of Earners | # Families | Median Income |
| No Earners | 337 (12.9%) | $0 |
| 1 Earner | 878 (33.6%) | $67,500 |
| 2 Earners | 1,035 (39.6%) | $83,527 |
| 3+ Earners | 364 (13.9%) | $139,206 |
| Total | 2,614 (100.0%) | $75,625 |
Household Income in Chowchilla
Household Income Brackets in Chowchilla
With 815 households falling in the category, the $50,000 to $74,999 income range is the most frequent in Chowchilla, accounting for 20.8% of all households. In contrast, only 176 households (4.5%) fall into the $200,000+ income bracket, making it the least populous group.
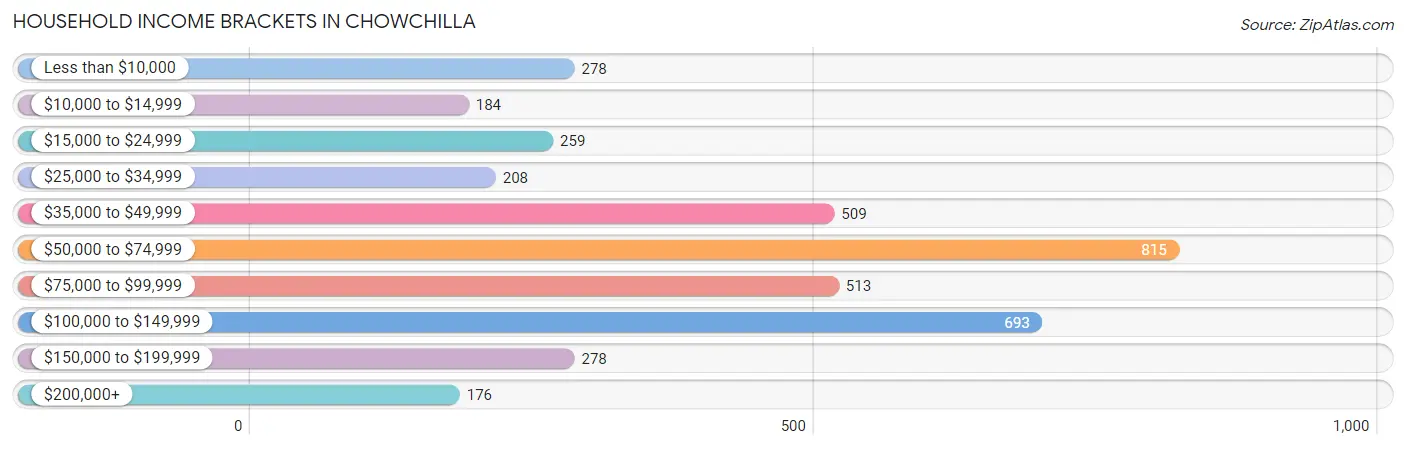
| Income Bracket | # Households | % Households |
| Less than $10,000 | 278 | 7.1% |
| $10,000 to $14,999 | 184 | 4.7% |
| $15,000 to $24,999 | 259 | 6.6% |
| $25,000 to $34,999 | 208 | 5.3% |
| $35,000 to $49,999 | 509 | 13.0% |
| $50,000 to $74,999 | 815 | 20.8% |
| $75,000 to $99,999 | 513 | 13.1% |
| $100,000 to $149,999 | 693 | 17.7% |
| $150,000 to $199,999 | 278 | 7.1% |
| $200,000+ | 176 | 4.5% |
Household Income by Householder Age in Chowchilla
The median household income in Chowchilla is $67,212, with the highest median household income of $76,731 found in the 45 to 64 years age bracket for the primary householder. A total of 1,386 households (35.4%) fall into this category. Meanwhile, the 65+ years age bracket for the primary householder has the lowest median household income of $43,889, with 912 households (23.3%) in this group.
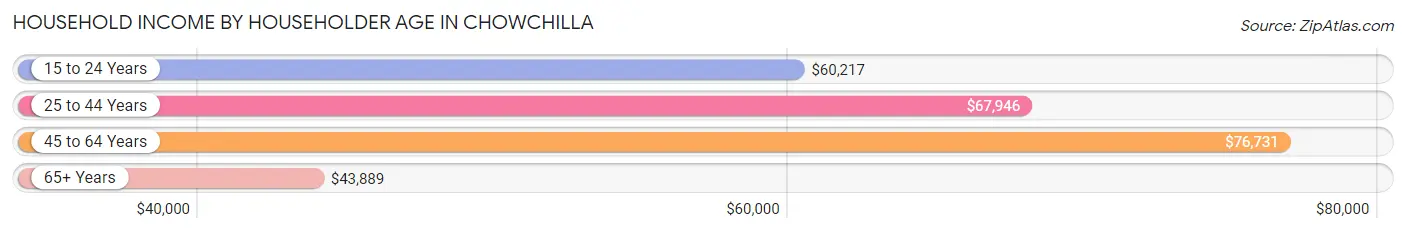
| Income Bracket | # Households | Median Income |
| 15 to 24 Years | 72 (1.8%) | $60,217 |
| 25 to 44 Years | 1,548 (39.5%) | $67,946 |
| 45 to 64 Years | 1,386 (35.4%) | $76,731 |
| 65+ Years | 912 (23.3%) | $43,889 |
| Total | 3,918 (100.0%) | $67,212 |
Poverty in Chowchilla
Income Below Poverty by Sex and Age in Chowchilla
With 17.0% poverty level for males and 16.4% for females among the residents of Chowchilla, 16 and 17 year old males and 5 year old females are the most vulnerable to poverty, with 71 males (32.0%) and 83 females (49.7%) in their respective age groups living below the poverty level.
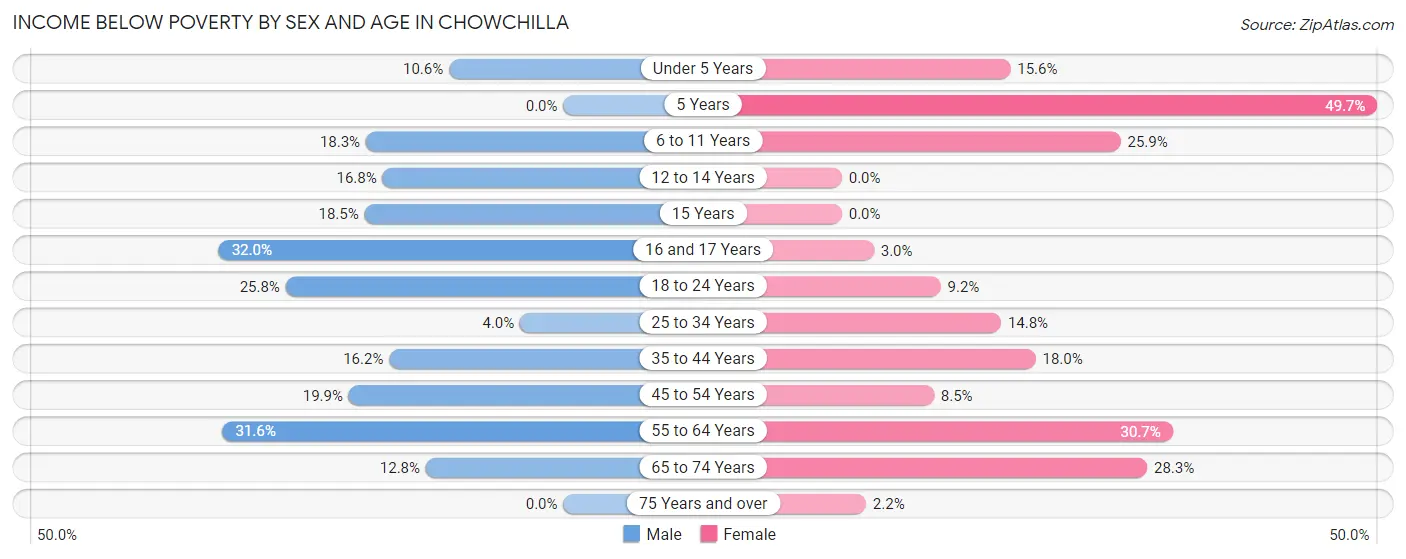
| Age Bracket | Male | Female |
| Under 5 Years | 61 (10.6%) | 91 (15.6%) |
| 5 Years | 0 (0.0%) | 83 (49.7%) |
| 6 to 11 Years | 175 (18.3%) | 142 (25.9%) |
| 12 to 14 Years | 72 (16.8%) | 0 (0.0%) |
| 15 Years | 19 (18.4%) | 0 (0.0%) |
| 16 and 17 Years | 71 (32.0%) | 10 (3.0%) |
| 18 to 24 Years | 142 (25.8%) | 62 (9.2%) |
| 25 to 34 Years | 41 (4.0%) | 176 (14.8%) |
| 35 to 44 Years | 122 (16.2%) | 130 (18.0%) |
| 45 to 54 Years | 140 (19.9%) | 49 (8.5%) |
| 55 to 64 Years | 247 (31.6%) | 183 (30.7%) |
| 65 to 74 Years | 50 (12.8%) | 119 (28.3%) |
| 75 Years and over | 0 (0.0%) | 9 (2.2%) |
| Total | 1,140 (17.0%) | 1,054 (16.4%) |
Income Above Poverty by Sex and Age in Chowchilla
According to the poverty statistics in Chowchilla, males aged 5 years and females aged 12 to 14 years are the age groups that are most secure financially, with 100.0% of males and 100.0% of females in these age groups living above the poverty line.
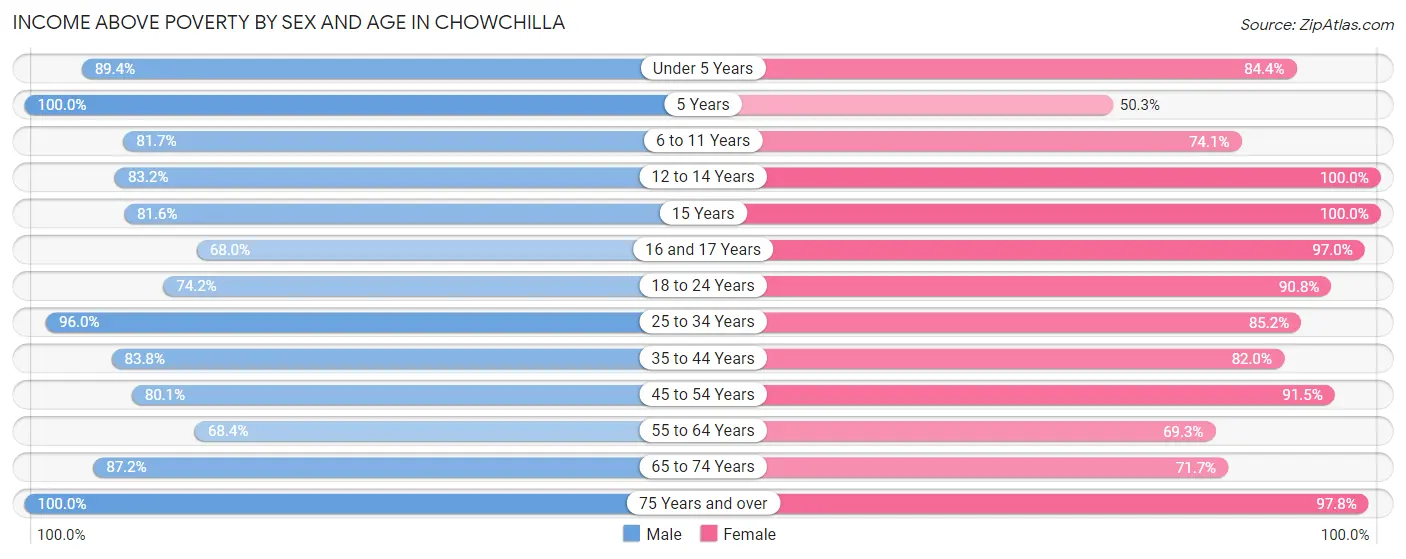
| Age Bracket | Male | Female |
| Under 5 Years | 514 (89.4%) | 491 (84.4%) |
| 5 Years | 59 (100.0%) | 84 (50.3%) |
| 6 to 11 Years | 780 (81.7%) | 407 (74.1%) |
| 12 to 14 Years | 357 (83.2%) | 109 (100.0%) |
| 15 Years | 84 (81.6%) | 88 (100.0%) |
| 16 and 17 Years | 151 (68.0%) | 327 (97.0%) |
| 18 to 24 Years | 409 (74.2%) | 614 (90.8%) |
| 25 to 34 Years | 982 (96.0%) | 1,016 (85.2%) |
| 35 to 44 Years | 633 (83.8%) | 593 (82.0%) |
| 45 to 54 Years | 563 (80.1%) | 525 (91.5%) |
| 55 to 64 Years | 534 (68.4%) | 413 (69.3%) |
| 65 to 74 Years | 342 (87.2%) | 301 (71.7%) |
| 75 Years and over | 175 (100.0%) | 392 (97.8%) |
| Total | 5,583 (83.0%) | 5,360 (83.6%) |
Income Below Poverty Among Married-Couple Families in Chowchilla
The poverty statistics for married-couple families in Chowchilla show that 6.1% or 106 of the total 1,725 families live below the poverty line. Families with 5 or more children have the highest poverty rate of 43.1%, comprising of 25 families. On the other hand, families with 3 or 4 children have the lowest poverty rate of 0.0%, which includes 0 families.
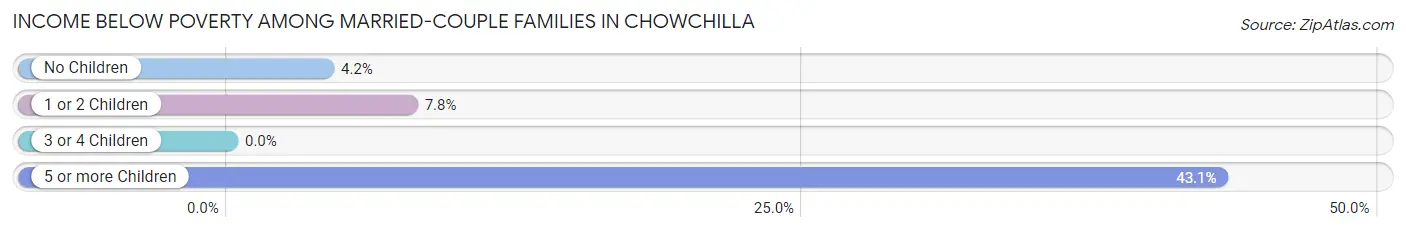
| Children | Above Poverty | Below Poverty |
| No Children | 573 (95.8%) | 25 (4.2%) |
| 1 or 2 Children | 660 (92.2%) | 56 (7.8%) |
| 3 or 4 Children | 353 (100.0%) | 0 (0.0%) |
| 5 or more Children | 33 (56.9%) | 25 (43.1%) |
| Total | 1,619 (93.9%) | 106 (6.1%) |
Income Below Poverty Among Single-Parent Households in Chowchilla
According to the poverty data in Chowchilla, 17.9% or 54 single-father households and 32.5% or 191 single-mother households are living below the poverty line. Among single-father households, those with no children have the highest poverty rate, with 54 households (29.7%) experiencing poverty. Likewise, among single-mother households, those with 3 or 4 children have the highest poverty rate, with 66 households (73.3%) falling below the poverty line.
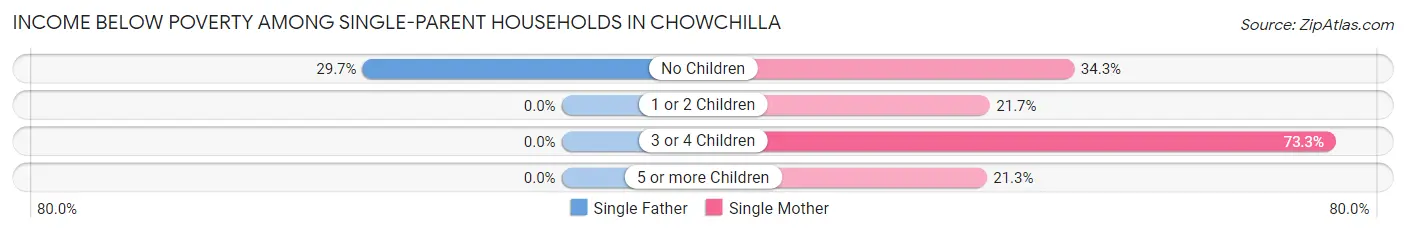
| Children | Single Father | Single Mother |
| No Children | 54 (29.7%) | 47 (34.3%) |
| 1 or 2 Children | 0 (0.0%) | 61 (21.7%) |
| 3 or 4 Children | 0 (0.0%) | 66 (73.3%) |
| 5 or more Children | 0 (0.0%) | 17 (21.2%) |
| Total | 54 (17.9%) | 191 (32.5%) |
Income Below Poverty Among Married-Couple vs Single-Parent Households in Chowchilla
The poverty data for Chowchilla shows that 106 of the married-couple family households (6.1%) and 245 of the single-parent households (27.6%) are living below the poverty level. Within the married-couple family households, those with 5 or more children have the highest poverty rate, with 25 households (43.1%) falling below the poverty line. Among the single-parent households, those with 3 or 4 children have the highest poverty rate, with 66 household (57.9%) living below poverty.
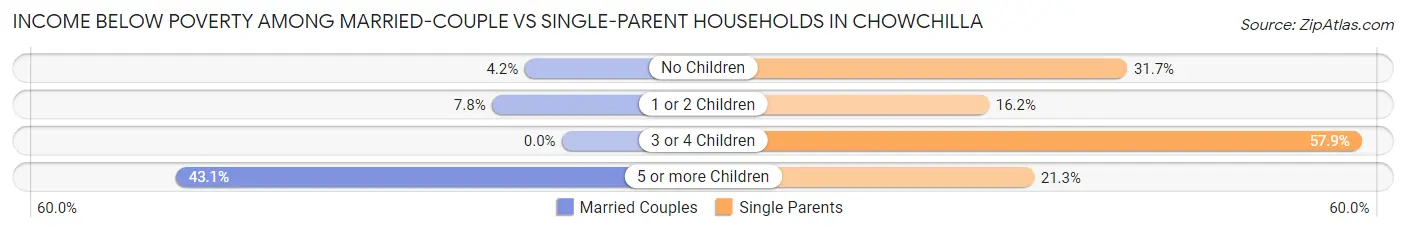
| Children | Married-Couple Families | Single-Parent Households |
| No Children | 25 (4.2%) | 101 (31.7%) |
| 1 or 2 Children | 56 (7.8%) | 61 (16.2%) |
| 3 or 4 Children | 0 (0.0%) | 66 (57.9%) |
| 5 or more Children | 25 (43.1%) | 17 (21.2%) |
| Total | 106 (6.1%) | 245 (27.6%) |
Race in Chowchilla
The most populous races in Chowchilla are White / Caucasian (9,148 | 48.7%), Hispanic or Latino (9,031 | 48.1%), and Some other Race (5,321 | 28.3%).
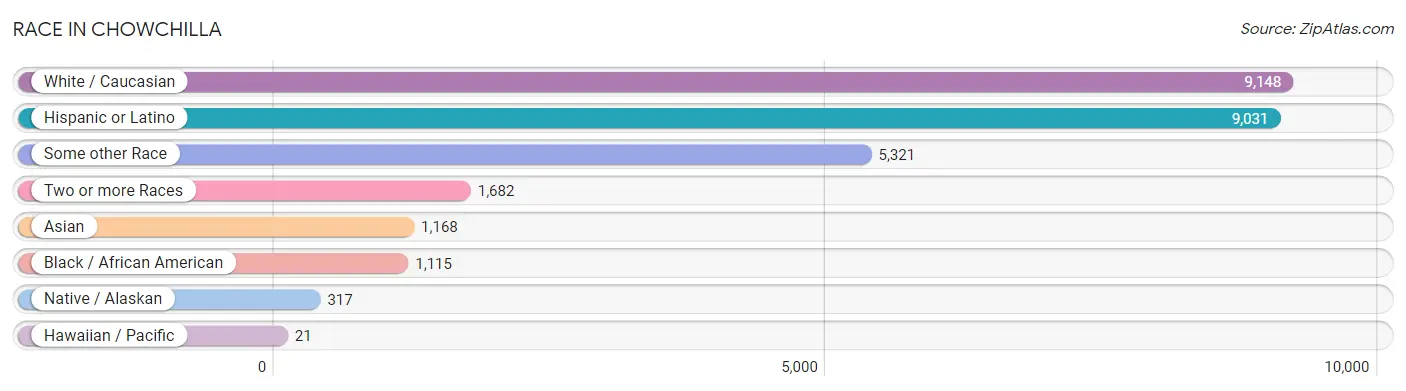
| Race | # Population | % Population |
| Asian | 1,168 | 6.2% |
| Black / African American | 1,115 | 5.9% |
| Hawaiian / Pacific | 21 | 0.1% |
| Hispanic or Latino | 9,031 | 48.1% |
| Native / Alaskan | 317 | 1.7% |
| White / Caucasian | 9,148 | 48.7% |
| Two or more Races | 1,682 | 9.0% |
| Some other Race | 5,321 | 28.3% |
| Total | 18,772 | 100.0% |
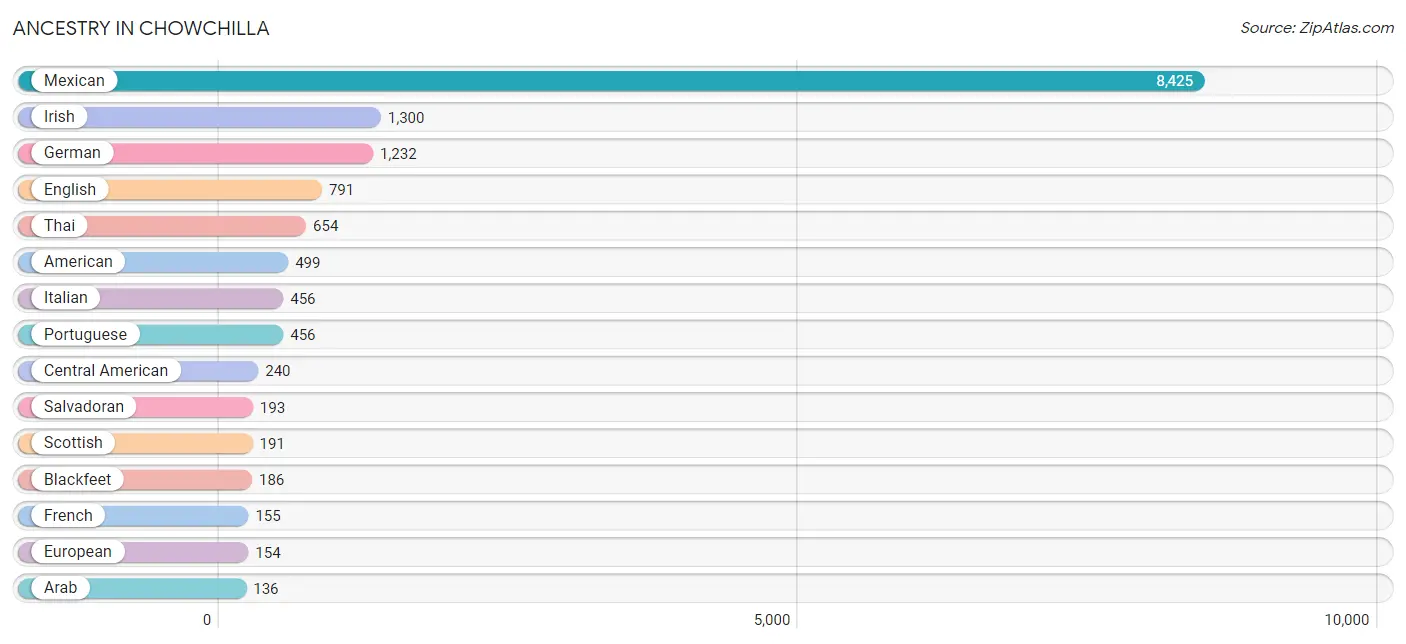
Ancestry in Chowchilla
The most populous ancestries reported in Chowchilla are Mexican (8,425 | 44.9%), Irish (1,300 | 6.9%), German (1,232 | 6.6%), English (791 | 4.2%), and Thai (654 | 3.5%), together accounting for 66.1% of all Chowchilla residents.
| Ancestry | # Population | % Population |
| African | 103 | 0.5% |
| American | 499 | 2.7% |
| Apache | 47 | 0.3% |
| Arab | 136 | 0.7% |
| Arapaho | 17 | 0.1% |
| Argentinean | 13 | 0.1% |
| Australian | 5 | 0.0% |
| Bahamian | 21 | 0.1% |
| Bangladeshi | 10 | 0.1% |
| Basque | 12 | 0.1% |
| Belgian | 5 | 0.0% |
| Belizean | 5 | 0.0% |
| Bhutanese | 24 | 0.1% |
| Blackfeet | 186 | 1.0% |
| Brazilian | 54 | 0.3% |
| Burmese | 51 | 0.3% |
| Canadian | 33 | 0.2% |
| Central American | 240 | 1.3% |
| Central American Indian | 76 | 0.4% |
| Cherokee | 103 | 0.5% |
| Cheyenne | 3 | 0.0% |
| Chippewa | 11 | 0.1% |
| Choctaw | 27 | 0.1% |
| Colombian | 28 | 0.2% |
| Costa Rican | 25 | 0.1% |
| Cuban | 42 | 0.2% |
| Czechoslovakian | 9 | 0.1% |
| Danish | 56 | 0.3% |
| Dutch | 127 | 0.7% |
| Ecuadorian | 10 | 0.1% |
| Egyptian | 6 | 0.0% |
| English | 791 | 4.2% |
| Estonian | 4 | 0.0% |
| Ethiopian | 2 | 0.0% |
| European | 154 | 0.8% |
| Finnish | 5 | 0.0% |
| French | 155 | 0.8% |
| French Canadian | 17 | 0.1% |
| German | 1,232 | 6.6% |
| Greek | 16 | 0.1% |
| Guamanian / Chamorro | 83 | 0.4% |
| Guatemalan | 14 | 0.1% |
| Honduran | 8 | 0.0% |
| Indian (Asian) | 120 | 0.6% |
| Indonesian | 22 | 0.1% |
| Inupiat | 5 | 0.0% |
| Irish | 1,300 | 6.9% |
| Italian | 456 | 2.4% |
| Jamaican | 7 | 0.0% |
| Japanese | 7 | 0.0% |
| Korean | 96 | 0.5% |
| Lebanese | 25 | 0.1% |
| Malaysian | 15 | 0.1% |
| Mexican | 8,425 | 44.9% |
| Mexican American Indian | 39 | 0.2% |
| Native Hawaiian | 51 | 0.3% |
| Navajo | 22 | 0.1% |
| Northern European | 5 | 0.0% |
| Norwegian | 75 | 0.4% |
| Paiute | 19 | 0.1% |
| Pakistani | 19 | 0.1% |
| Palestinian | 103 | 0.5% |
| Peruvian | 9 | 0.1% |
| Pima | 18 | 0.1% |
| Polish | 127 | 0.7% |
| Portuguese | 456 | 2.4% |
| Puerto Rican | 69 | 0.4% |
| Romanian | 3 | 0.0% |
| Russian | 59 | 0.3% |
| Salvadoran | 193 | 1.0% |
| Samoan | 17 | 0.1% |
| Scandinavian | 5 | 0.0% |
| Scotch-Irish | 65 | 0.4% |
| Scottish | 191 | 1.0% |
| Shoshone | 21 | 0.1% |
| Sioux | 9 | 0.1% |
| Slavic | 5 | 0.0% |
| South American | 60 | 0.3% |
| Spaniard | 12 | 0.1% |
| Spanish | 33 | 0.2% |
| Sri Lankan | 45 | 0.2% |
| Subsaharan African | 105 | 0.6% |
| Swedish | 71 | 0.4% |
| Thai | 654 | 3.5% |
| Tohono O'Odham | 5 | 0.0% |
| Tongan | 3 | 0.0% |
| Turkish | 4 | 0.0% |
| Welsh | 42 | 0.2% |
| Yaqui | 8 | 0.0% |
| Yuman | 6 | 0.0% | View All 90 Rows |
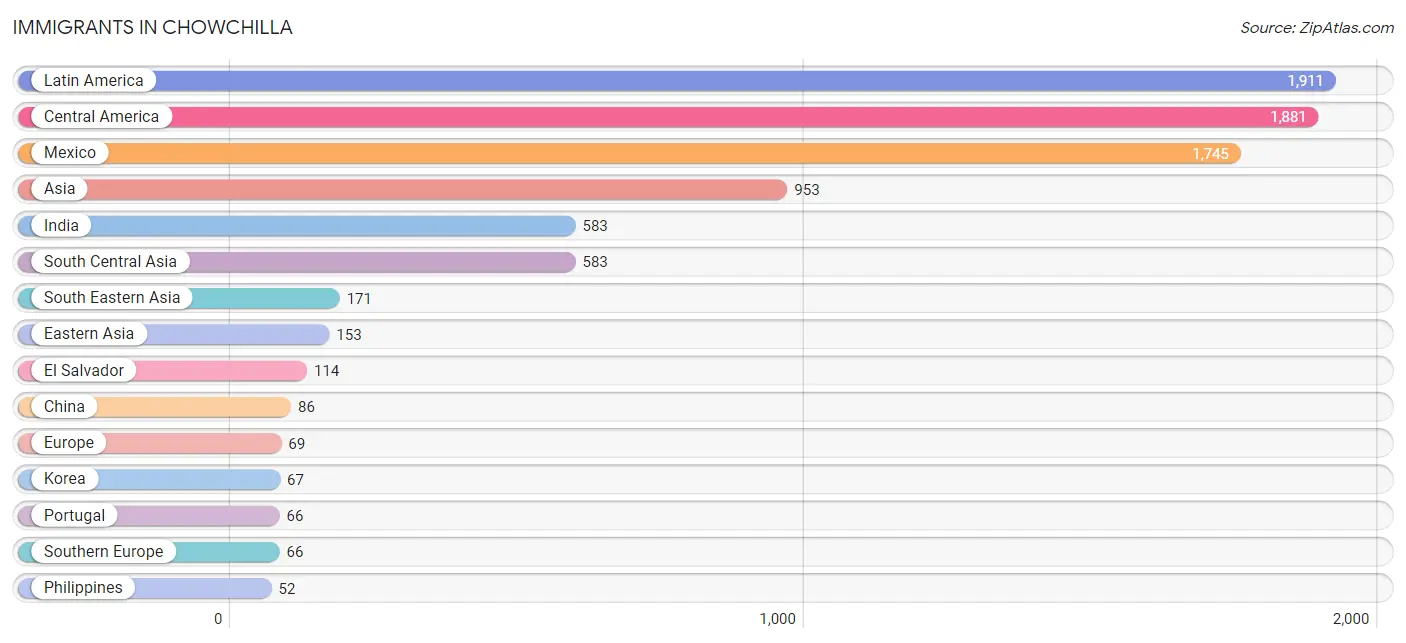
Immigrants in Chowchilla
The most numerous immigrant groups reported in Chowchilla came from Latin America (1,911 | 10.2%), Central America (1,881 | 10.0%), Mexico (1,745 | 9.3%), Asia (953 | 5.1%), and India (583 | 3.1%), together accounting for 37.7% of all Chowchilla residents.
| Immigration Origin | # Population | % Population |
| Africa | 16 | 0.1% |
| Asia | 953 | 5.1% |
| Azores | 5 | 0.0% |
| Brazil | 23 | 0.1% |
| Canada | 33 | 0.2% |
| Caribbean | 7 | 0.0% |
| Central America | 1,881 | 10.0% |
| China | 86 | 0.5% |
| Eastern Africa | 10 | 0.1% |
| Eastern Asia | 153 | 0.8% |
| Egypt | 6 | 0.0% |
| El Salvador | 114 | 0.6% |
| Eritrea | 2 | 0.0% |
| Europe | 69 | 0.4% |
| Fiji | 9 | 0.1% |
| Guatemala | 17 | 0.1% |
| Honduras | 5 | 0.0% |
| India | 583 | 3.1% |
| Indonesia | 17 | 0.1% |
| Jamaica | 7 | 0.0% |
| Korea | 67 | 0.4% |
| Laos | 10 | 0.1% |
| Latin America | 1,911 | 10.2% |
| Mexico | 1,745 | 9.3% |
| Netherlands | 3 | 0.0% |
| Northern Africa | 6 | 0.0% |
| Oceania | 9 | 0.1% |
| Philippines | 52 | 0.3% |
| Portugal | 66 | 0.4% |
| Somalia | 8 | 0.0% |
| South America | 23 | 0.1% |
| South Central Asia | 583 | 3.1% |
| South Eastern Asia | 171 | 0.9% |
| Southern Europe | 66 | 0.4% |
| Syria | 22 | 0.1% |
| Taiwan | 4 | 0.0% |
| Thailand | 31 | 0.2% |
| Vietnam | 39 | 0.2% |
| Western Asia | 22 | 0.1% |
| Western Europe | 3 | 0.0% | View All 40 Rows |
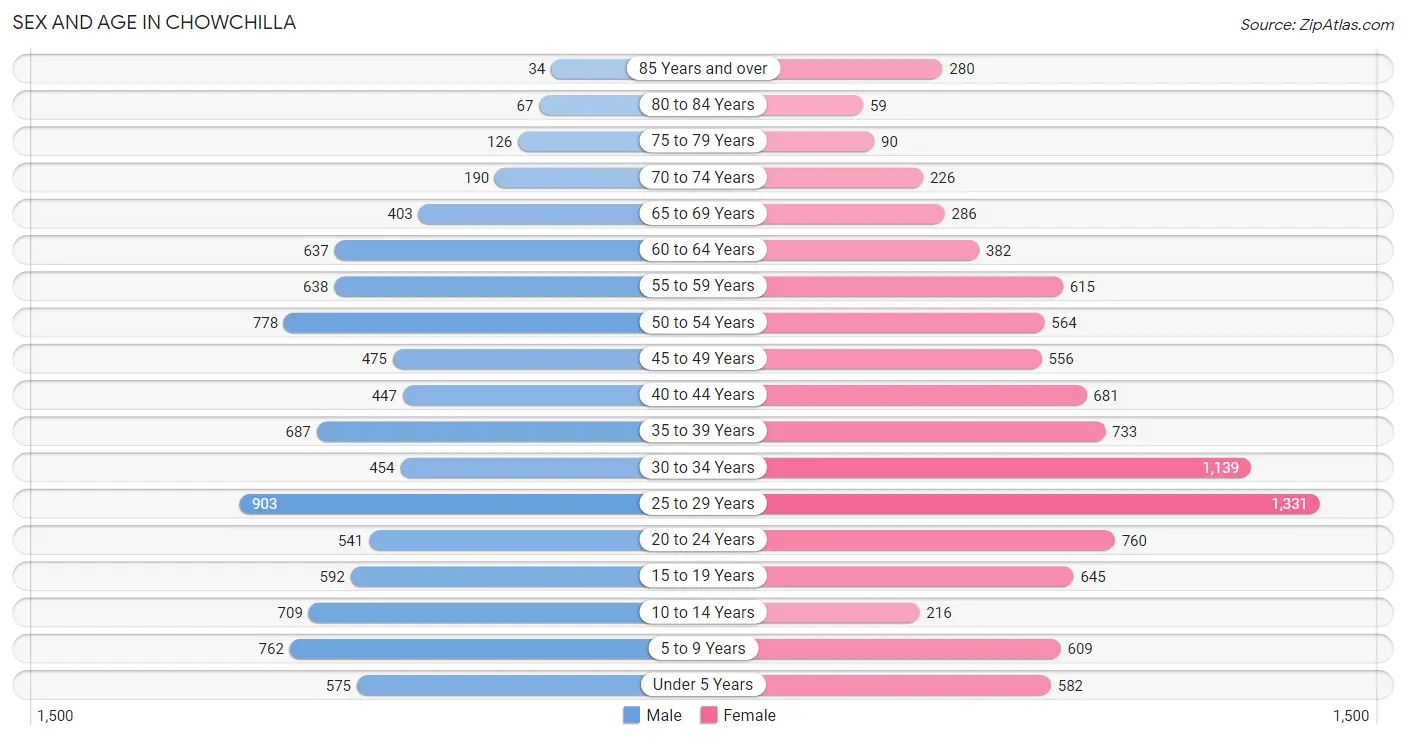
Sex and Age in Chowchilla
Sex and Age in Chowchilla
The most populous age groups in Chowchilla are 25 to 29 Years (903 | 10.0%) for men and 25 to 29 Years (1,331 | 13.7%) for women.
| Age Bracket | Male | Female |
| Under 5 Years | 575 (6.4%) | 582 (6.0%) |
| 5 to 9 Years | 762 (8.5%) | 609 (6.2%) |
| 10 to 14 Years | 709 (7.9%) | 216 (2.2%) |
| 15 to 19 Years | 592 (6.6%) | 645 (6.6%) |
| 20 to 24 Years | 541 (6.0%) | 760 (7.8%) |
| 25 to 29 Years | 903 (10.0%) | 1,331 (13.7%) |
| 30 to 34 Years | 454 (5.0%) | 1,139 (11.7%) |
| 35 to 39 Years | 687 (7.6%) | 733 (7.5%) |
| 40 to 44 Years | 447 (5.0%) | 681 (7.0%) |
| 45 to 49 Years | 475 (5.3%) | 556 (5.7%) |
| 50 to 54 Years | 778 (8.6%) | 564 (5.8%) |
| 55 to 59 Years | 638 (7.1%) | 615 (6.3%) |
| 60 to 64 Years | 637 (7.1%) | 382 (3.9%) |
| 65 to 69 Years | 403 (4.5%) | 286 (2.9%) |
| 70 to 74 Years | 190 (2.1%) | 226 (2.3%) |
| 75 to 79 Years | 126 (1.4%) | 90 (0.9%) |
| 80 to 84 Years | 67 (0.7%) | 59 (0.6%) |
| 85 Years and over | 34 (0.4%) | 280 (2.9%) |
| Total | 9,018 (100.0%) | 9,754 (100.0%) |
Families and Households in Chowchilla
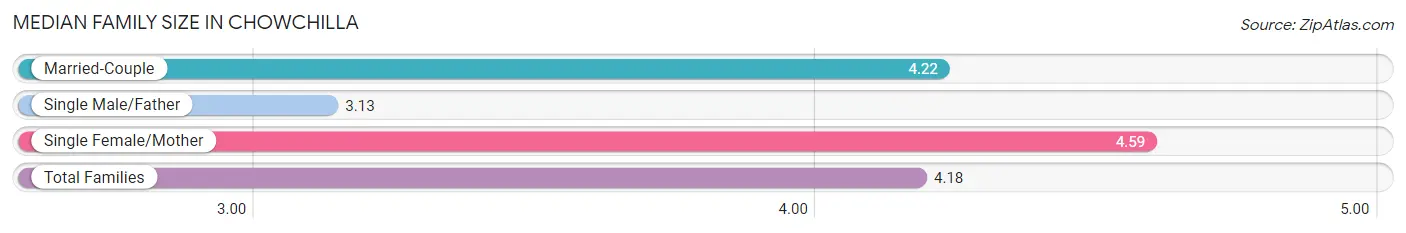
Median Family Size in Chowchilla
The median family size in Chowchilla is 4.18 persons per family, with single female/mother families (588 | 22.5%) accounting for the largest median family size of 4.59 persons per family. On the other hand, single male/father families (301 | 11.5%) represent the smallest median family size with 3.13 persons per family.
| Family Type | # Families | Family Size |
| Married-Couple | 1,725 (66.0%) | 4.22 |
| Single Male/Father | 301 (11.5%) | 3.13 |
| Single Female/Mother | 588 (22.5%) | 4.59 |
| Total Families | 2,614 (100.0%) | 4.18 |
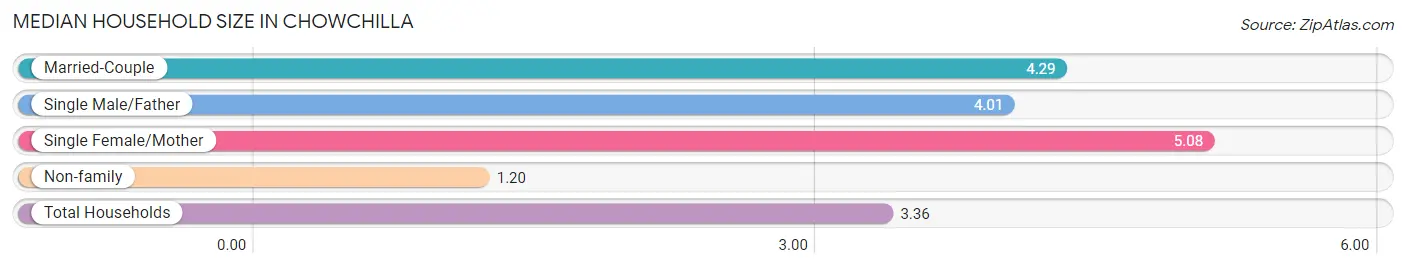
Median Household Size in Chowchilla
The median household size in Chowchilla is 3.36 persons per household, with single female/mother households (588 | 15.0%) accounting for the largest median household size of 5.08 persons per household. non-family households (1,304 | 33.3%) represent the smallest median household size with 1.20 persons per household.
| Household Type | # Households | Household Size |
| Married-Couple | 1,725 (44.0%) | 4.29 |
| Single Male/Father | 301 (7.7%) | 4.01 |
| Single Female/Mother | 588 (15.0%) | 5.08 |
| Non-family | 1,304 (33.3%) | 1.20 |
| Total Households | 3,918 (100.0%) | 3.36 |
Household Size by Marriage Status in Chowchilla
Out of a total of 3,918 households in Chowchilla, 2,614 (66.7%) are family households, while 1,304 (33.3%) are nonfamily households. The most numerous type of family households are 4-person households, comprising 742, and the most common type of nonfamily households are 1-person households, comprising 1,111.
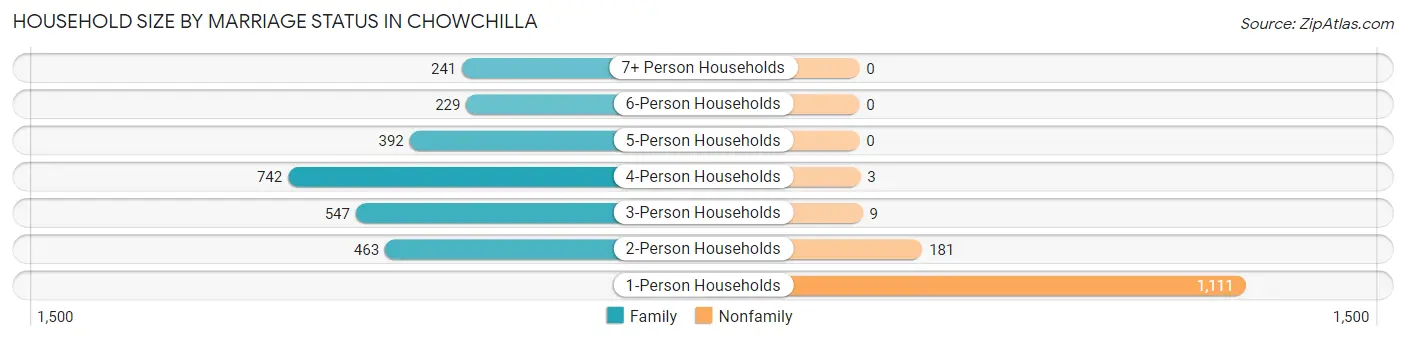
| Household Size | Family Households | Nonfamily Households |
| 1-Person Households | - | 1,111 (28.4%) |
| 2-Person Households | 463 (11.8%) | 181 (4.6%) |
| 3-Person Households | 547 (14.0%) | 9 (0.2%) |
| 4-Person Households | 742 (18.9%) | 3 (0.1%) |
| 5-Person Households | 392 (10.0%) | 0 (0.0%) |
| 6-Person Households | 229 (5.8%) | 0 (0.0%) |
| 7+ Person Households | 241 (6.1%) | 0 (0.0%) |
| Total | 2,614 (66.7%) | 1,304 (33.3%) |
Female Fertility in Chowchilla
Fertility by Age in Chowchilla
Average fertility rate in Chowchilla is 40.0 births per 1,000 women. Women in the age bracket of 20 to 34 years have the highest fertility rate with 62.0 births per 1,000 women. Women in the age bracket of 20 to 34 years acount for 82.9% of all women with births.
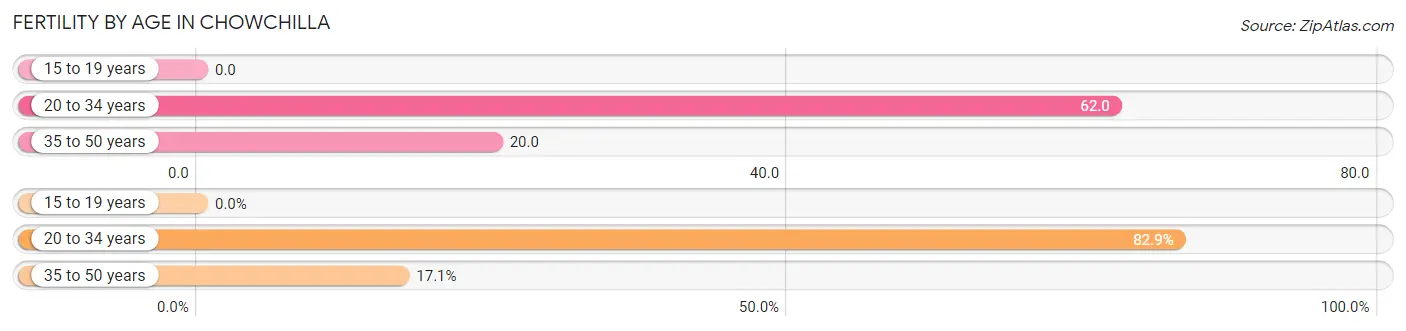
| Age Bracket | Women with Births | Births / 1,000 Women |
| 15 to 19 years | 0 (0.0%) | 0.0 |
| 20 to 34 years | 199 (82.9%) | 62.0 |
| 35 to 50 years | 41 (17.1%) | 20.0 |
| Total | 240 (100.0%) | 40.0 |
Fertility by Age by Marriage Status in Chowchilla
76.2% of women with births (240) in Chowchilla are married. The highest percentage of unmarried women with births falls into 35 to 50 years age bracket with 43.9% of them unmarried at the time of birth, while the lowest percentage of unmarried women with births belong to 20 to 34 years age bracket with 19.6% of them unmarried.
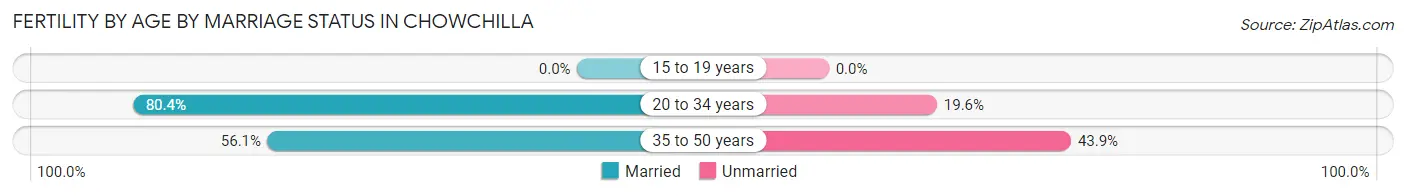
| Age Bracket | Married | Unmarried |
| 15 to 19 years | 0 (0.0%) | 0 (0.0%) |
| 20 to 34 years | 160 (80.4%) | 39 (19.6%) |
| 35 to 50 years | 23 (56.1%) | 18 (43.9%) |
| Total | 183 (76.2%) | 57 (23.7%) |
Fertility by Education in Chowchilla
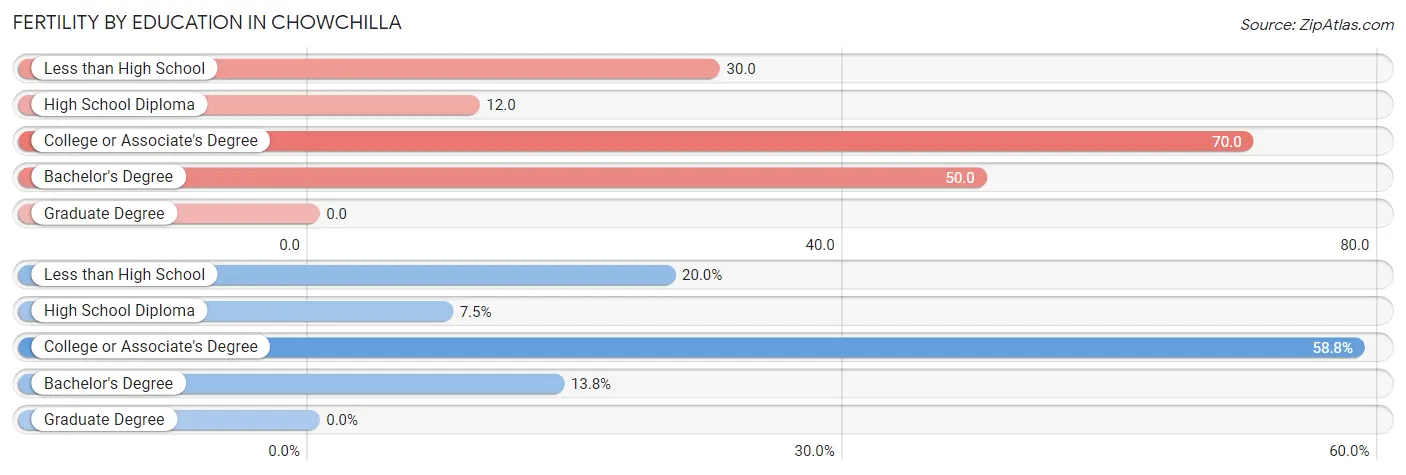
| Educational Attainment | Women with Births | Births / 1,000 Women |
| Less than High School | 48 (20.0%) | 30.0 |
| High School Diploma | 18 (7.5%) | 12.0 |
| College or Associate's Degree | 141 (58.8%) | 70.0 |
| Bachelor's Degree | 33 (13.8%) | 50.0 |
| Graduate Degree | 0 (0.0%) | 0.0 |
| Total | 240 (100.0%) | 40.0 |
Fertility by Education by Marriage Status in Chowchilla
23.7% of women with births in Chowchilla are unmarried. Women with the educational attainment of college or associate's degree are most likely to be married with 100.0% of them married at childbirth, while women with the educational attainment of high school diploma are least likely to be married with 100.0% of them unmarried at childbirth.
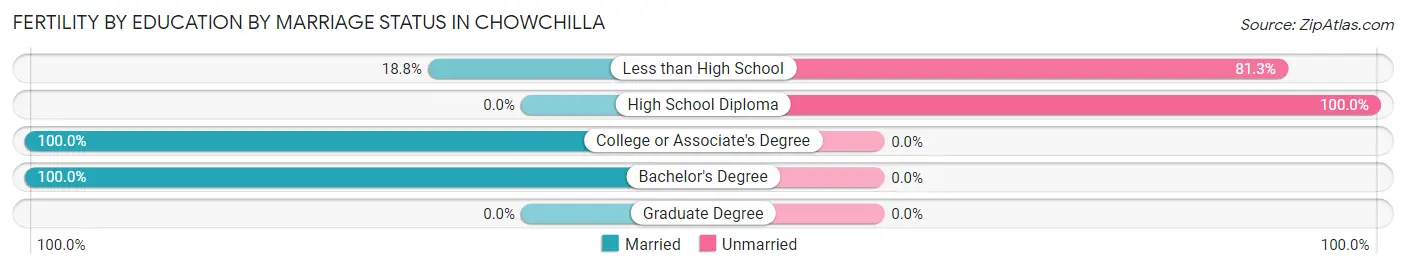
| Educational Attainment | Married | Unmarried |
| Less than High School | 9 (18.8%) | 39 (81.2%) |
| High School Diploma | 0 (0.0%) | 18 (100.0%) |
| College or Associate's Degree | 141 (100.0%) | 0 (0.0%) |
| Bachelor's Degree | 33 (100.0%) | 0 (0.0%) |
| Graduate Degree | 0 (0.0%) | 0 (0.0%) |
| Total | 183 (76.2%) | 57 (23.7%) |
Employment Characteristics in Chowchilla
Employment by Class of Employer in Chowchilla
Among the 4,925 employed individuals in Chowchilla, private company employees (3,252 | 66.0%), local government employees (534 | 10.8%), and state government employees (410 | 8.3%) make up the most common classes of employment.
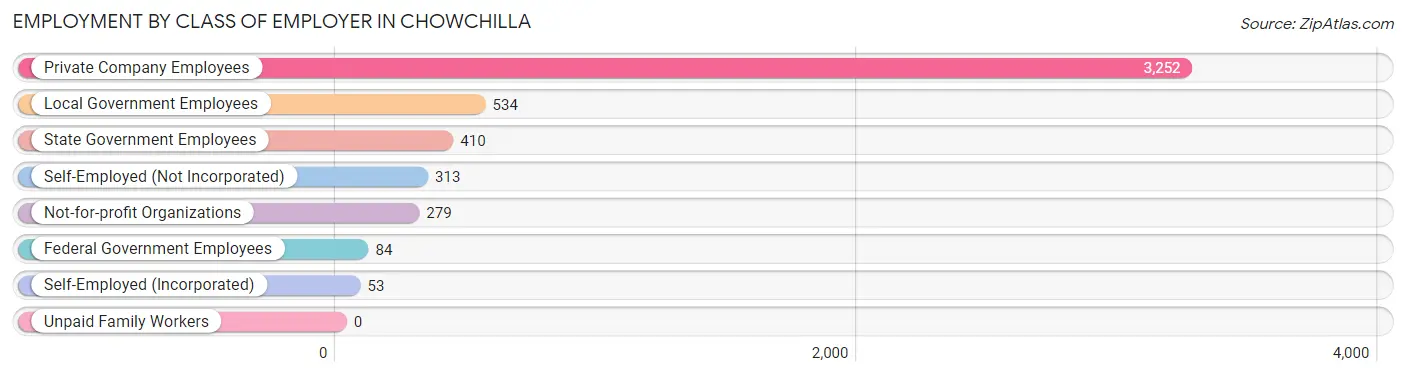
| Employer Class | # Employees | % Employees |
| Private Company Employees | 3,252 | 66.0% |
| Self-Employed (Incorporated) | 53 | 1.1% |
| Self-Employed (Not Incorporated) | 313 | 6.4% |
| Not-for-profit Organizations | 279 | 5.7% |
| Local Government Employees | 534 | 10.8% |
| State Government Employees | 410 | 8.3% |
| Federal Government Employees | 84 | 1.7% |
| Unpaid Family Workers | 0 | 0.0% |
| Total | 4,925 | 100.0% |
Employment Status by Age in Chowchilla
According to the labor force statistics for Chowchilla, out of the total population over 16 years of age (15,128), 37.5% or 5,673 individuals are in the labor force, with 10.1% or 573 of them unemployed. The age group with the highest labor force participation rate is 25 to 29 years, with 51.5% or 1,151 individuals in the labor force. Within the labor force, the 16 to 19 years age range has the highest percentage of unemployed individuals, with 52.3% or 170 of them being unemployed.
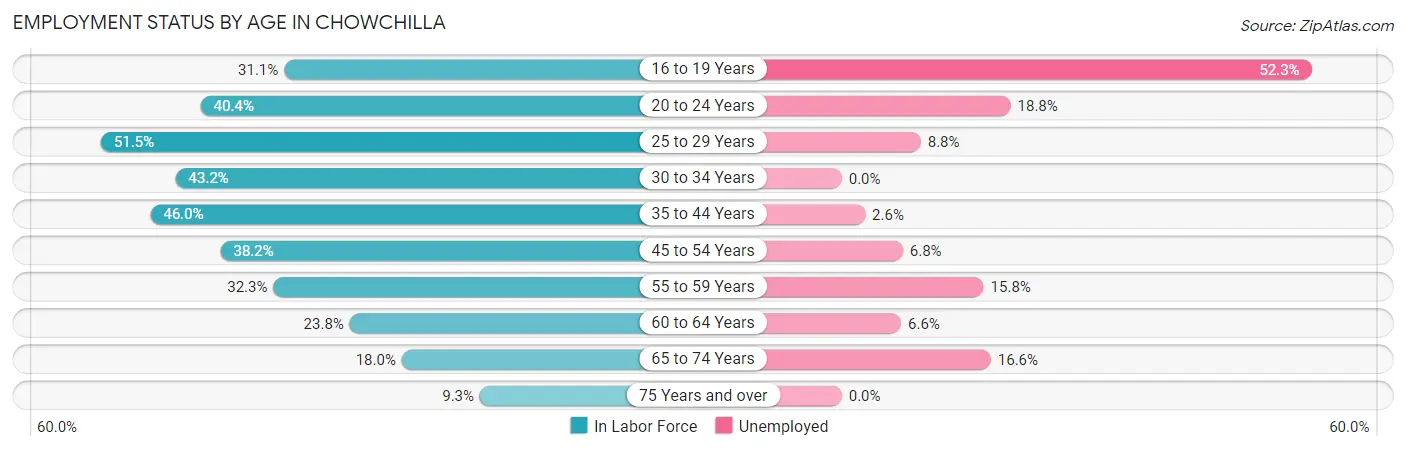
| Age Bracket | In Labor Force | Unemployed |
| 16 to 19 Years | 325 (31.1%) | 170 (52.3%) |
| 20 to 24 Years | 526 (40.4%) | 99 (18.8%) |
| 25 to 29 Years | 1,151 (51.5%) | 101 (8.8%) |
| 30 to 34 Years | 688 (43.2%) | 0 (0.0%) |
| 35 to 44 Years | 1,172 (46.0%) | 30 (2.6%) |
| 45 to 54 Years | 906 (38.2%) | 62 (6.8%) |
| 55 to 59 Years | 405 (32.3%) | 64 (15.8%) |
| 60 to 64 Years | 243 (23.8%) | 16 (6.6%) |
| 65 to 74 Years | 199 (18.0%) | 33 (16.6%) |
| 75 Years and over | 61 (9.3%) | 0 (0.0%) |
| Total | 5,673 (37.5%) | 573 (10.1%) |
Employment Status by Educational Attainment in Chowchilla
According to labor force statistics for Chowchilla, 41.4% of individuals (4,562) out of the total population between 25 and 64 years of age (11,020) are in the labor force, with 6.0% or 274 of them being unemployed. The group with the highest labor force participation rate are those with the educational attainment of bachelor's degree or higher, with 72.4% or 975 individuals in the labor force. Within the labor force, individuals with college / associate degree education have the highest percentage of unemployment, with 9.1% or 138 of them being unemployed.
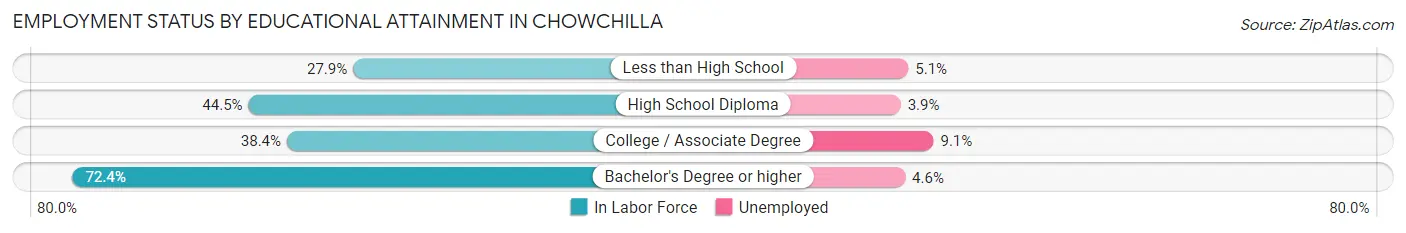
| Educational Attainment | In Labor Force | Unemployed |
| Less than High School | 797 (27.9%) | 146 (5.1%) |
| High School Diploma | 1,280 (44.5%) | 112 (3.9%) |
| College / Associate Degree | 1,513 (38.4%) | 358 (9.1%) |
| Bachelor's Degree or higher | 975 (72.4%) | 62 (4.6%) |
| Total | 4,562 (41.4%) | 661 (6.0%) |
Employment Occupations by Sex in Chowchilla
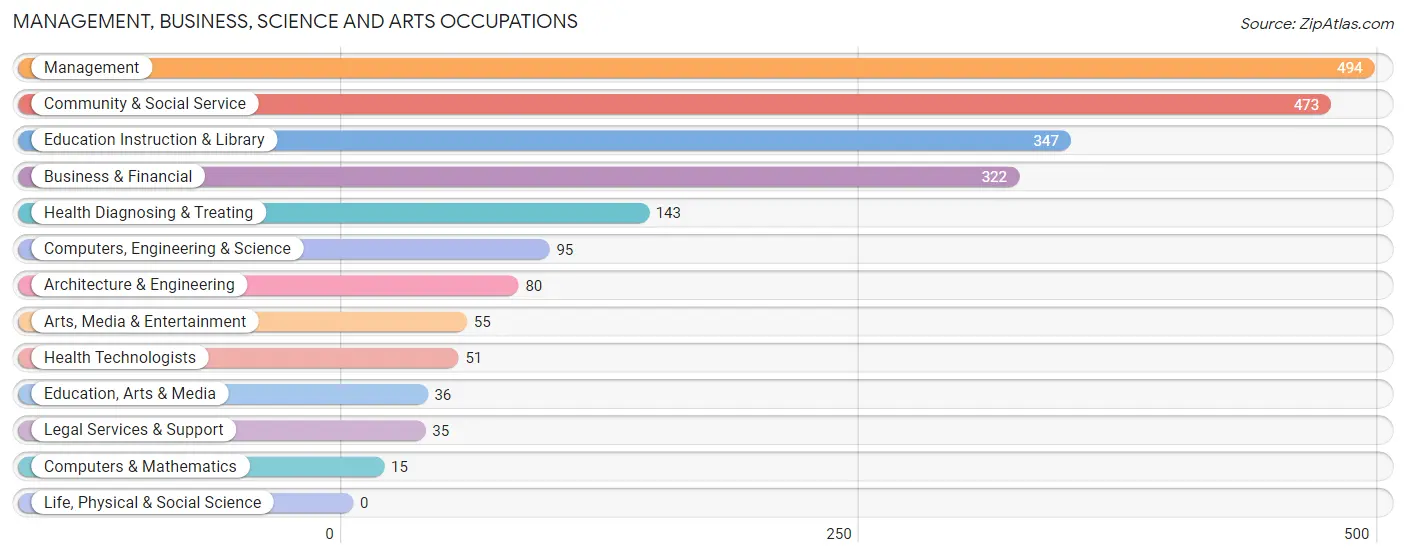
Management, Business, Science and Arts Occupations
The most common Management, Business, Science and Arts occupations in Chowchilla are Management (494 | 9.7%), Community & Social Service (473 | 9.3%), Education Instruction & Library (347 | 6.8%), Business & Financial (322 | 6.3%), and Health Diagnosing & Treating (143 | 2.8%).
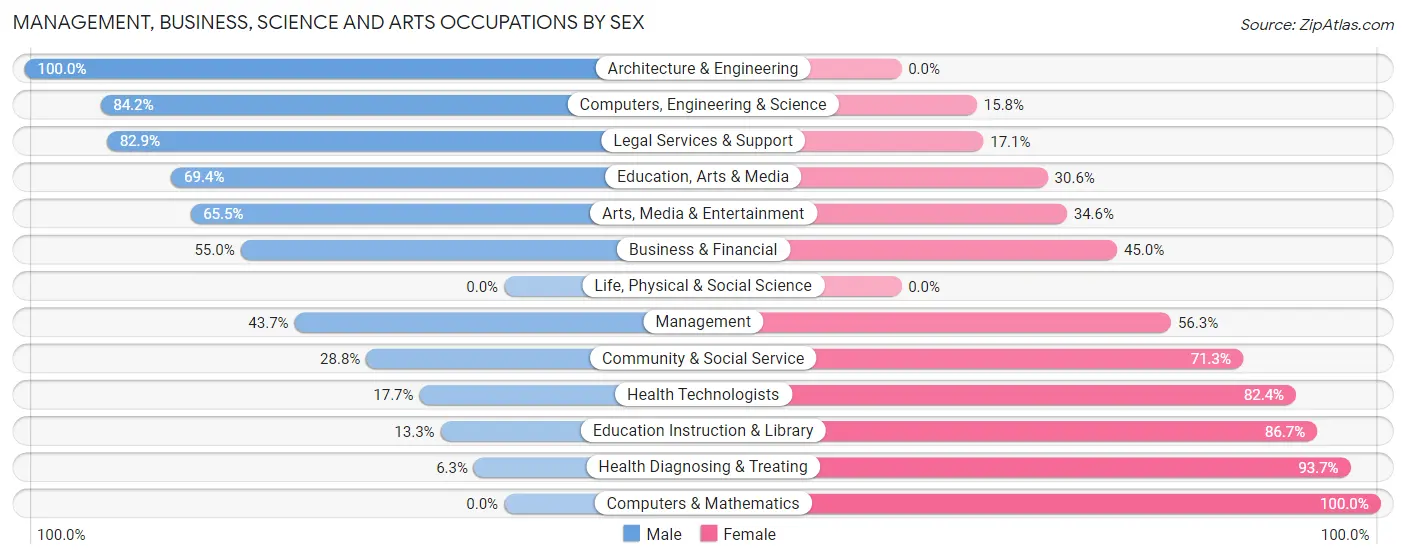
Management, Business, Science and Arts Occupations by Sex
Within the Management, Business, Science and Arts occupations in Chowchilla, the most male-oriented occupations are Architecture & Engineering (100.0%), Computers, Engineering & Science (84.2%), and Legal Services & Support (82.9%), while the most female-oriented occupations are Computers & Mathematics (100.0%), Health Diagnosing & Treating (93.7%), and Education Instruction & Library (86.7%).
| Occupation | Male | Female |
| Management | 216 (43.7%) | 278 (56.3%) |
| Business & Financial | 177 (55.0%) | 145 (45.0%) |
| Computers, Engineering & Science | 80 (84.2%) | 15 (15.8%) |
| Computers & Mathematics | 0 (0.0%) | 15 (100.0%) |
| Architecture & Engineering | 80 (100.0%) | 0 (0.0%) |
| Life, Physical & Social Science | 0 (0.0%) | 0 (0.0%) |
| Community & Social Service | 136 (28.7%) | 337 (71.3%) |
| Education, Arts & Media | 25 (69.4%) | 11 (30.6%) |
| Legal Services & Support | 29 (82.9%) | 6 (17.1%) |
| Education Instruction & Library | 46 (13.3%) | 301 (86.7%) |
| Arts, Media & Entertainment | 36 (65.4%) | 19 (34.5%) |
| Health Diagnosing & Treating | 9 (6.3%) | 134 (93.7%) |
| Health Technologists | 9 (17.6%) | 42 (82.4%) |
| Total (Category) | 618 (40.5%) | 909 (59.5%) |
| Total (Overall) | 2,760 (54.1%) | 2,340 (45.9%) |
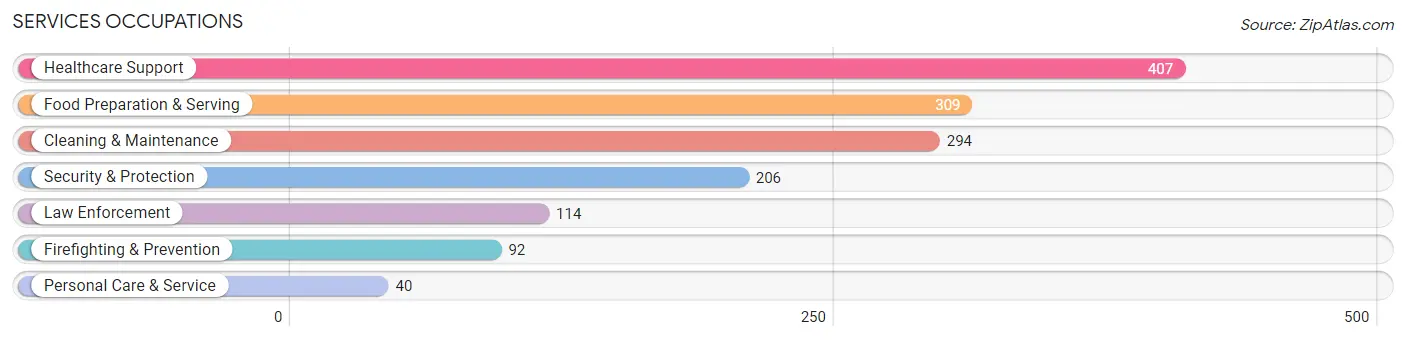
Services Occupations
The most common Services occupations in Chowchilla are Healthcare Support (407 | 8.0%), Food Preparation & Serving (309 | 6.1%), Cleaning & Maintenance (294 | 5.8%), Security & Protection (206 | 4.0%), and Law Enforcement (114 | 2.2%).
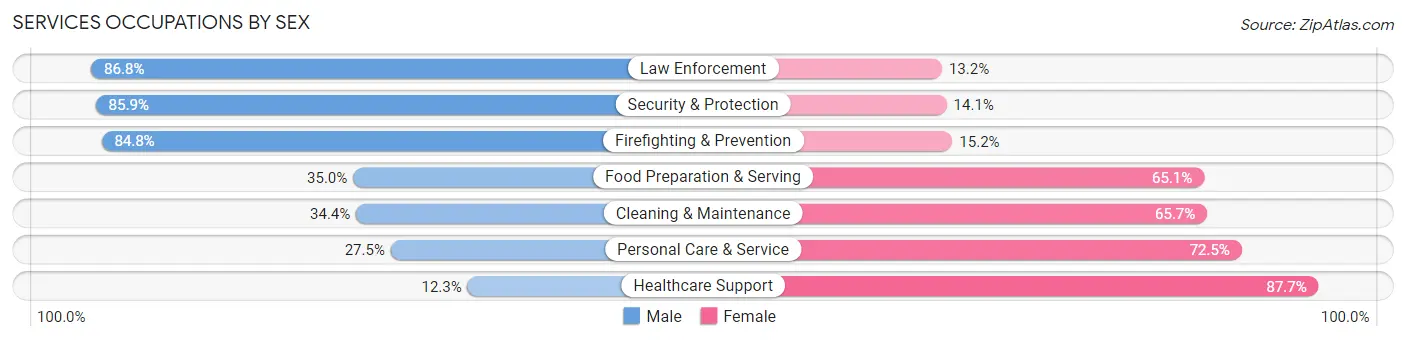
Services Occupations by Sex
Within the Services occupations in Chowchilla, the most male-oriented occupations are Law Enforcement (86.8%), Security & Protection (85.9%), and Firefighting & Prevention (84.8%), while the most female-oriented occupations are Healthcare Support (87.7%), Personal Care & Service (72.5%), and Cleaning & Maintenance (65.6%).
| Occupation | Male | Female |
| Healthcare Support | 50 (12.3%) | 357 (87.7%) |
| Security & Protection | 177 (85.9%) | 29 (14.1%) |
| Firefighting & Prevention | 78 (84.8%) | 14 (15.2%) |
| Law Enforcement | 99 (86.8%) | 15 (13.2%) |
| Food Preparation & Serving | 108 (34.9%) | 201 (65.0%) |
| Cleaning & Maintenance | 101 (34.4%) | 193 (65.6%) |
| Personal Care & Service | 11 (27.5%) | 29 (72.5%) |
| Total (Category) | 447 (35.6%) | 809 (64.4%) |
| Total (Overall) | 2,760 (54.1%) | 2,340 (45.9%) |
Sales and Office Occupations
The most common Sales and Office occupations in Chowchilla are Office & Administration (344 | 6.8%), and Sales & Related (305 | 6.0%).
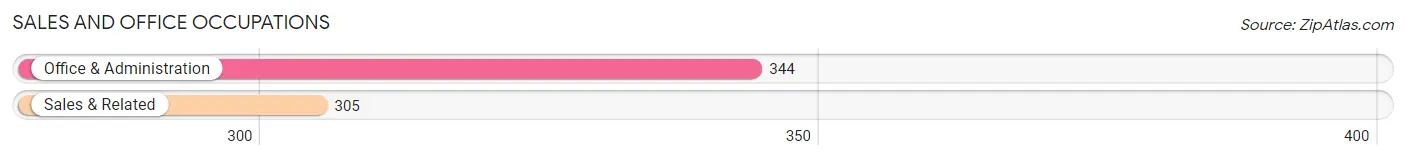
Sales and Office Occupations by Sex
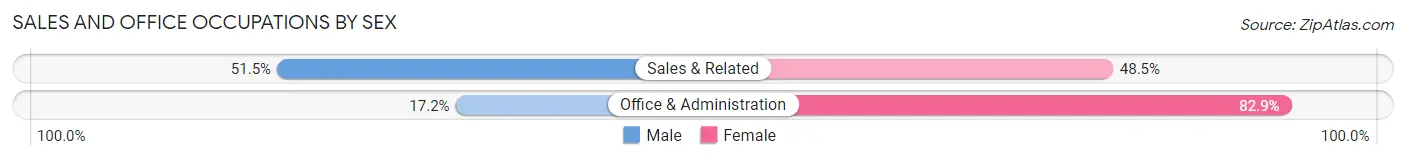
| Occupation | Male | Female |
| Sales & Related | 157 (51.5%) | 148 (48.5%) |
| Office & Administration | 59 (17.2%) | 285 (82.9%) |
| Total (Category) | 216 (33.3%) | 433 (66.7%) |
| Total (Overall) | 2,760 (54.1%) | 2,340 (45.9%) |
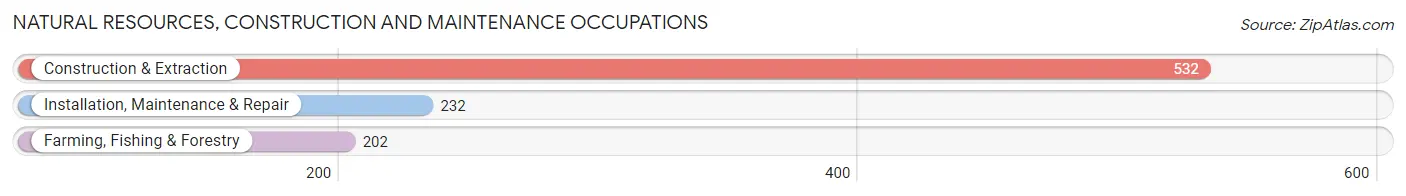
Natural Resources, Construction and Maintenance Occupations
The most common Natural Resources, Construction and Maintenance occupations in Chowchilla are Construction & Extraction (532 | 10.4%), Installation, Maintenance & Repair (232 | 4.5%), and Farming, Fishing & Forestry (202 | 4.0%).
Natural Resources, Construction and Maintenance Occupations by Sex
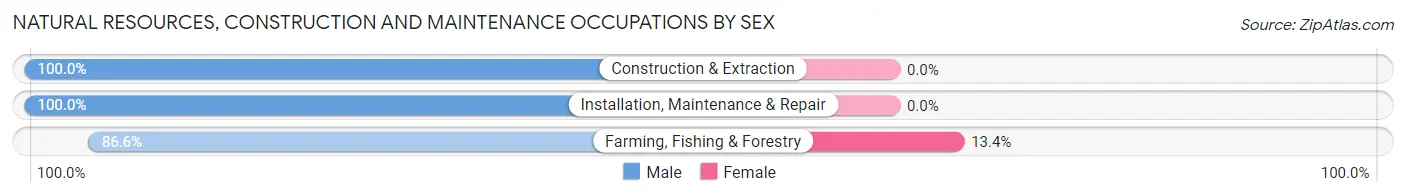
| Occupation | Male | Female |
| Farming, Fishing & Forestry | 175 (86.6%) | 27 (13.4%) |
| Construction & Extraction | 532 (100.0%) | 0 (0.0%) |
| Installation, Maintenance & Repair | 232 (100.0%) | 0 (0.0%) |
| Total (Category) | 939 (97.2%) | 27 (2.8%) |
| Total (Overall) | 2,760 (54.1%) | 2,340 (45.9%) |
Production, Transportation and Moving Occupations
The most common Production, Transportation and Moving occupations in Chowchilla are Transportation (360 | 7.1%), Production (275 | 5.4%), and Material Moving (67 | 1.3%).
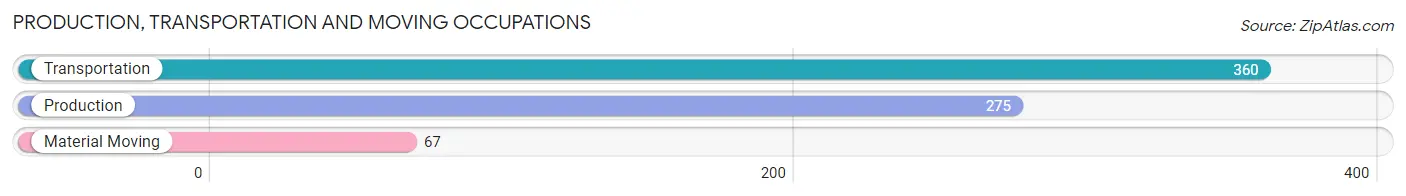
Production, Transportation and Moving Occupations by Sex
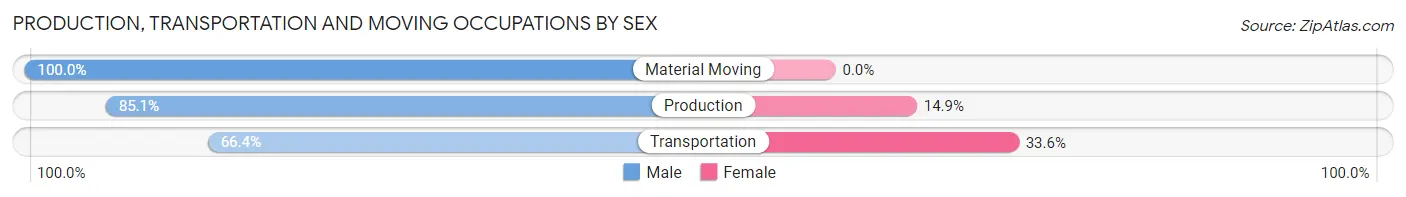
| Occupation | Male | Female |
| Production | 234 (85.1%) | 41 (14.9%) |
| Transportation | 239 (66.4%) | 121 (33.6%) |
| Material Moving | 67 (100.0%) | 0 (0.0%) |
| Total (Category) | 540 (76.9%) | 162 (23.1%) |
| Total (Overall) | 2,760 (54.1%) | 2,340 (45.9%) |
Employment Industries by Sex in Chowchilla
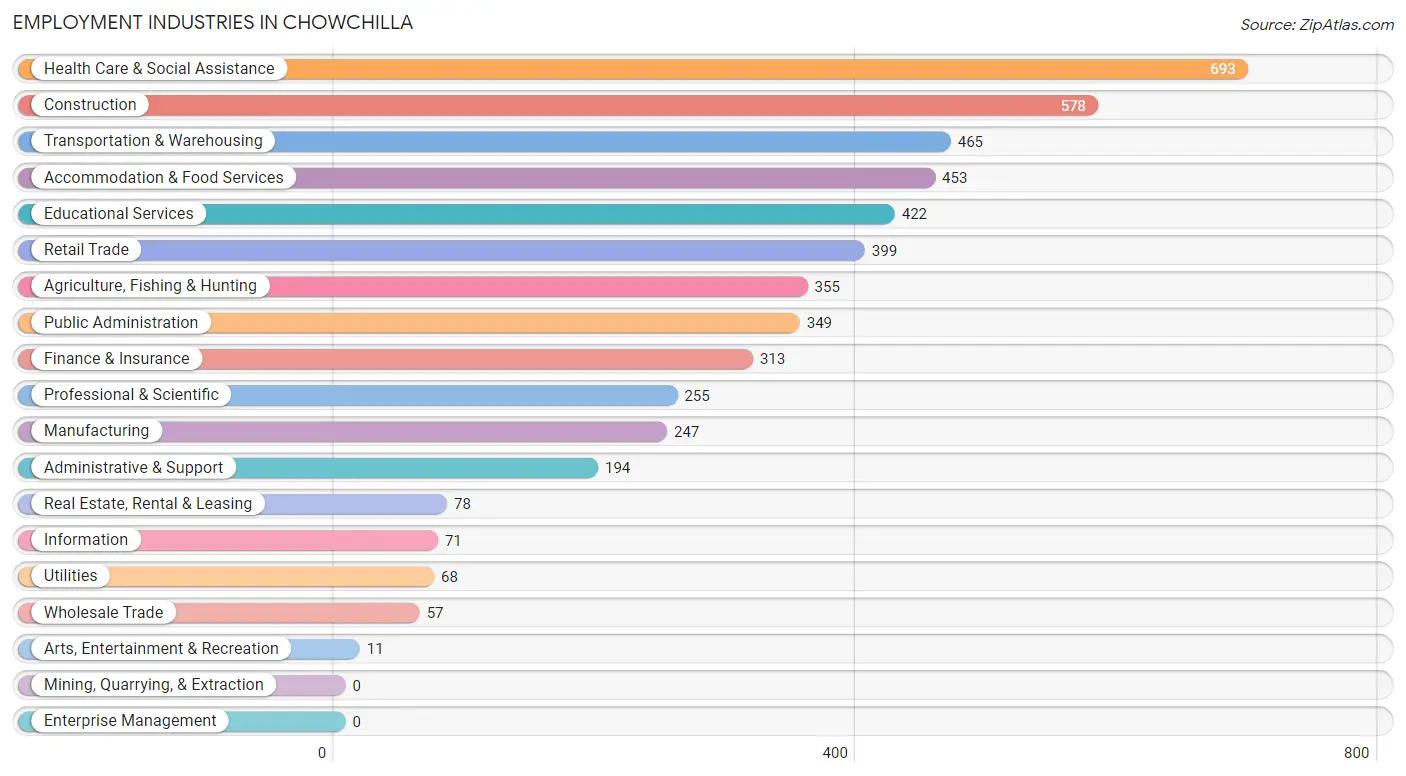
Employment Industries in Chowchilla
The major employment industries in Chowchilla include Health Care & Social Assistance (693 | 13.6%), Construction (578 | 11.3%), Transportation & Warehousing (465 | 9.1%), Accommodation & Food Services (453 | 8.9%), and Educational Services (422 | 8.3%).
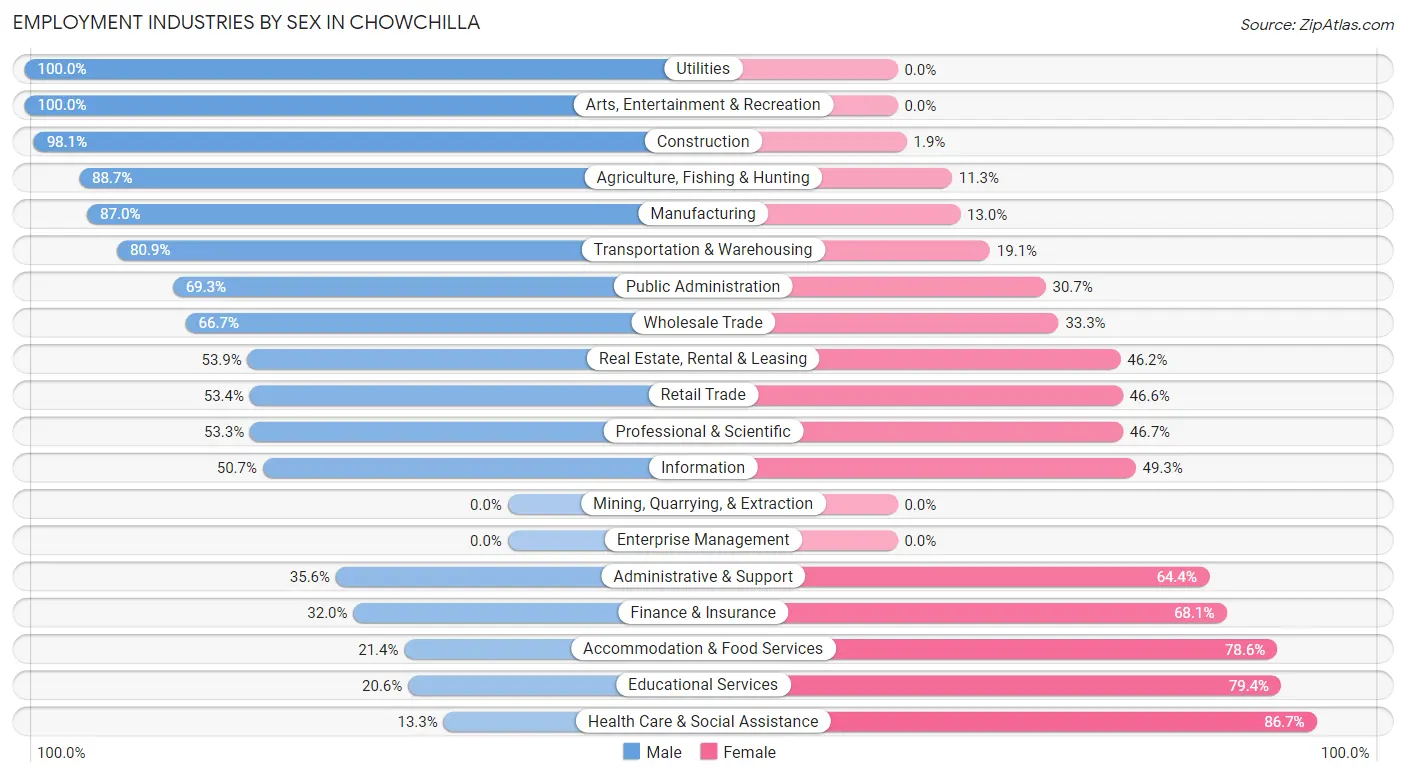
Employment Industries by Sex in Chowchilla
The Chowchilla industries that see more men than women are Utilities (100.0%), Arts, Entertainment & Recreation (100.0%), and Construction (98.1%), whereas the industries that tend to have a higher number of women are Health Care & Social Assistance (86.7%), Educational Services (79.4%), and Accommodation & Food Services (78.6%).
| Industry | Male | Female |
| Agriculture, Fishing & Hunting | 315 (88.7%) | 40 (11.3%) |
| Mining, Quarrying, & Extraction | 0 (0.0%) | 0 (0.0%) |
| Construction | 567 (98.1%) | 11 (1.9%) |
| Manufacturing | 215 (87.0%) | 32 (13.0%) |
| Wholesale Trade | 38 (66.7%) | 19 (33.3%) |
| Retail Trade | 213 (53.4%) | 186 (46.6%) |
| Transportation & Warehousing | 376 (80.9%) | 89 (19.1%) |
| Utilities | 68 (100.0%) | 0 (0.0%) |
| Information | 36 (50.7%) | 35 (49.3%) |
| Finance & Insurance | 100 (32.0%) | 213 (68.0%) |
| Real Estate, Rental & Leasing | 42 (53.8%) | 36 (46.2%) |
| Professional & Scientific | 136 (53.3%) | 119 (46.7%) |
| Enterprise Management | 0 (0.0%) | 0 (0.0%) |
| Administrative & Support | 69 (35.6%) | 125 (64.4%) |
| Educational Services | 87 (20.6%) | 335 (79.4%) |
| Health Care & Social Assistance | 92 (13.3%) | 601 (86.7%) |
| Arts, Entertainment & Recreation | 11 (100.0%) | 0 (0.0%) |
| Accommodation & Food Services | 97 (21.4%) | 356 (78.6%) |
| Public Administration | 242 (69.3%) | 107 (30.7%) |
| Total | 2,760 (54.1%) | 2,340 (45.9%) |
Education in Chowchilla
School Enrollment in Chowchilla
The most common levels of schooling among the 5,776 students in Chowchilla are high school (1,737 | 30.1%), college / undergraduate (1,558 | 27.0%), and elementary school (1,033 | 17.9%).
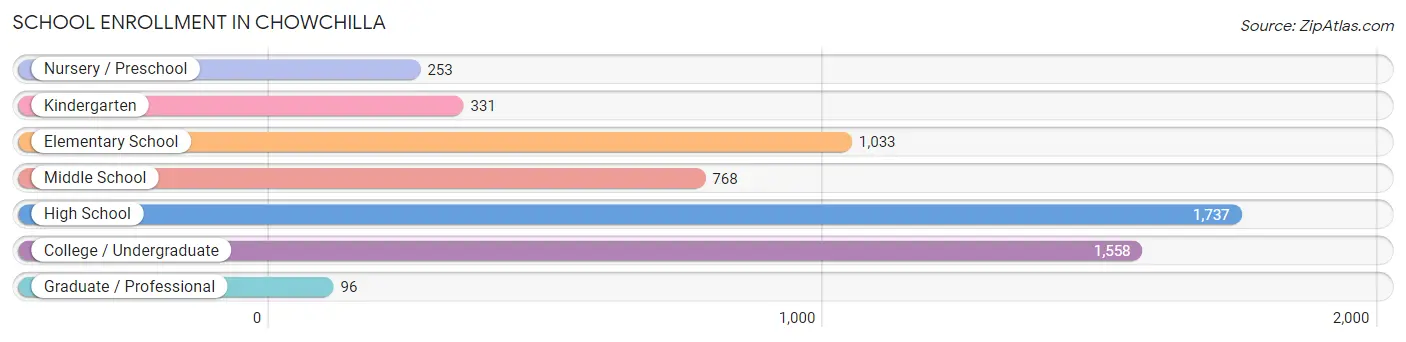
| School Level | # Students | % Students |
| Nursery / Preschool | 253 | 4.4% |
| Kindergarten | 331 | 5.7% |
| Elementary School | 1,033 | 17.9% |
| Middle School | 768 | 13.3% |
| High School | 1,737 | 30.1% |
| College / Undergraduate | 1,558 | 27.0% |
| Graduate / Professional | 96 | 1.7% |
| Total | 5,776 | 100.0% |
School Enrollment by Age by Funding Source in Chowchilla
Out of a total of 5,776 students who are enrolled in schools in Chowchilla, 1,427 (24.7%) attend a private institution, while the remaining 4,349 (75.3%) are enrolled in public schools. The age group of 35 years and over has the highest likelihood of being enrolled in private schools, with 603 (52.1% in the age bracket) enrolled. Conversely, the age group of 15 to 17 year olds has the lowest likelihood of being enrolled in a private school, with 671 (100.0% in the age bracket) attending a public institution.
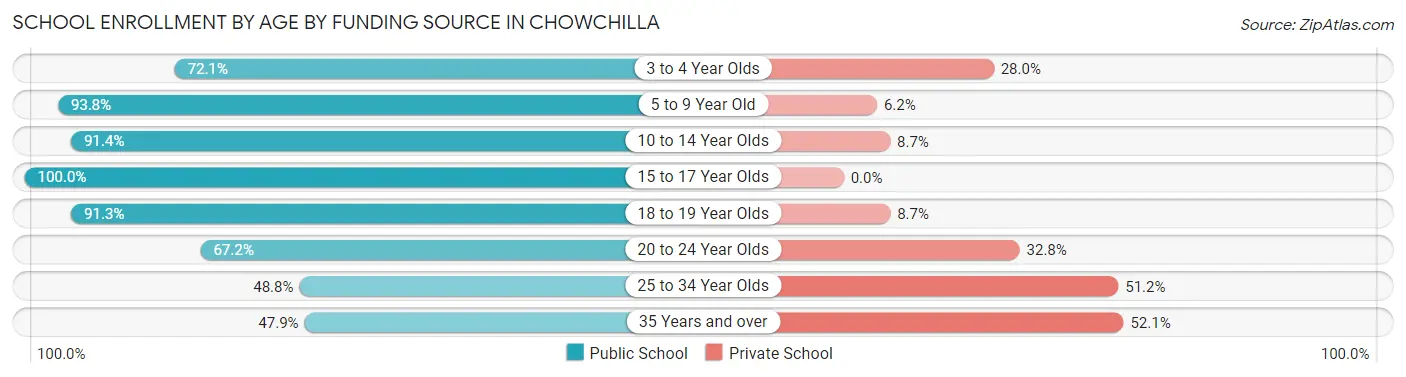
| Age Bracket | Public School | Private School |
| 3 to 4 Year Olds | 116 (72.1%) | 45 (28.0%) |
| 5 to 9 Year Old | 1,286 (93.8%) | 85 (6.2%) |
| 10 to 14 Year Olds | 845 (91.3%) | 80 (8.6%) |
| 15 to 17 Year Olds | 671 (100.0%) | 0 (0.0%) |
| 18 to 19 Year Olds | 158 (91.3%) | 15 (8.7%) |
| 20 to 24 Year Olds | 279 (67.2%) | 136 (32.8%) |
| 25 to 34 Year Olds | 441 (48.8%) | 462 (51.2%) |
| 35 Years and over | 554 (47.9%) | 603 (52.1%) |
| Total | 4,349 (75.3%) | 1,427 (24.7%) |
Educational Attainment by Field of Study in Chowchilla
Business (400 | 22.3%), social sciences (240 | 13.4%), science & technology (211 | 11.7%), arts & humanities (134 | 7.5%), and engineering (133 | 7.4%) are the most common fields of study among 1,797 individuals in Chowchilla who have obtained a bachelor's degree or higher.
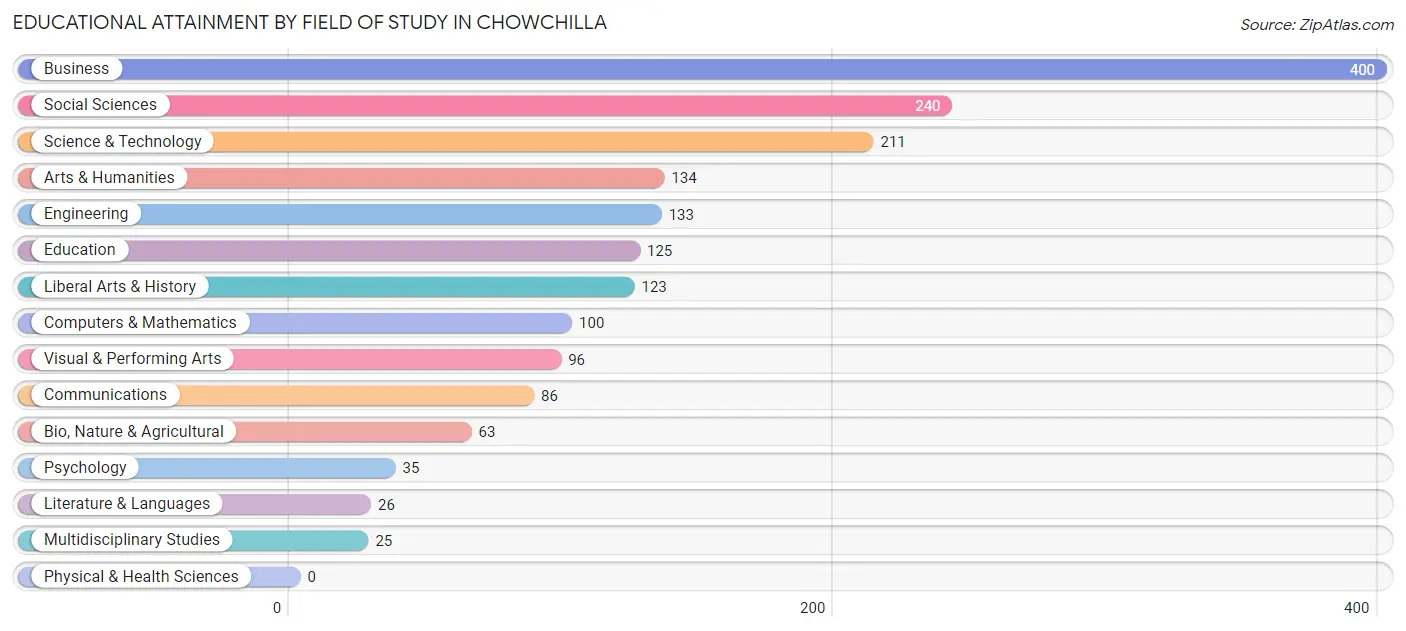
| Field of Study | # Graduates | % Graduates |
| Computers & Mathematics | 100 | 5.6% |
| Bio, Nature & Agricultural | 63 | 3.5% |
| Physical & Health Sciences | 0 | 0.0% |
| Psychology | 35 | 1.9% |
| Social Sciences | 240 | 13.4% |
| Engineering | 133 | 7.4% |
| Multidisciplinary Studies | 25 | 1.4% |
| Science & Technology | 211 | 11.7% |
| Business | 400 | 22.3% |
| Education | 125 | 7.0% |
| Literature & Languages | 26 | 1.5% |
| Liberal Arts & History | 123 | 6.8% |
| Visual & Performing Arts | 96 | 5.3% |
| Communications | 86 | 4.8% |
| Arts & Humanities | 134 | 7.5% |
| Total | 1,797 | 100.0% |
Transportation & Commute in Chowchilla
Vehicle Availability by Sex in Chowchilla
The most prevalent vehicle ownership categories in Chowchilla are males with 2 vehicles (1,098, accounting for 40.3%) and females with 2 vehicles (822, making up 49.9%).
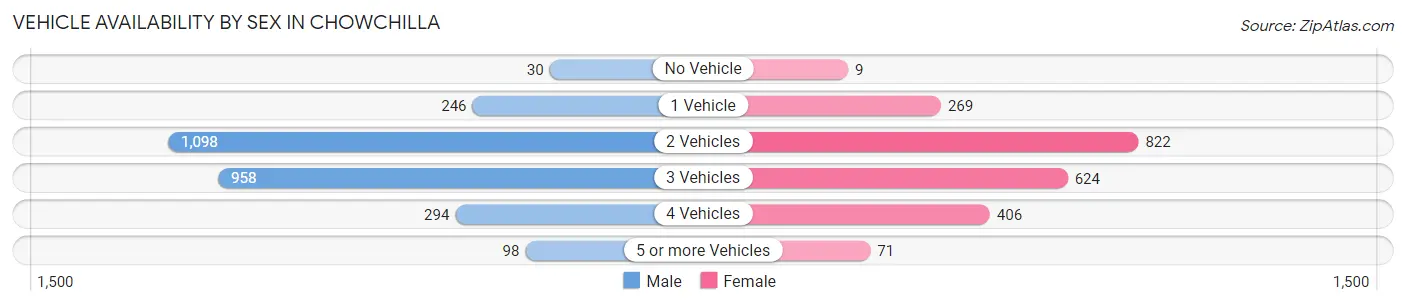
| Vehicles Available | Male | Female |
| No Vehicle | 30 (1.1%) | 9 (0.4%) |
| 1 Vehicle | 246 (9.0%) | 269 (12.2%) |
| 2 Vehicles | 1,098 (40.3%) | 822 (37.3%) |
| 3 Vehicles | 958 (35.2%) | 624 (28.3%) |
| 4 Vehicles | 294 (10.8%) | 406 (18.4%) |
| 5 or more Vehicles | 98 (3.6%) | 71 (3.2%) |
| Total | 2,724 (100.0%) | 2,201 (100.0%) |
Commute Time in Chowchilla
The most frequently occuring commute durations in Chowchilla are 5 to 9 minutes (773 commuters, 16.7%), 10 to 14 minutes (607 commuters, 13.1%), and 30 to 34 minutes (584 commuters, 12.6%).
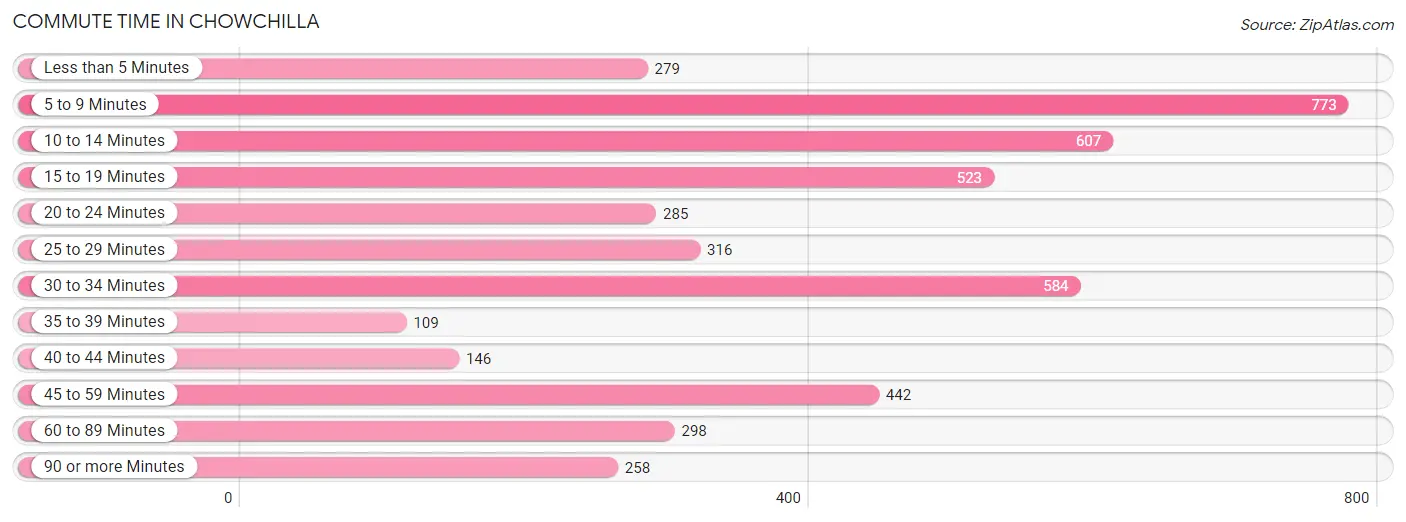
| Commute Time | # Commuters | % Commuters |
| Less than 5 Minutes | 279 | 6.0% |
| 5 to 9 Minutes | 773 | 16.7% |
| 10 to 14 Minutes | 607 | 13.1% |
| 15 to 19 Minutes | 523 | 11.3% |
| 20 to 24 Minutes | 285 | 6.2% |
| 25 to 29 Minutes | 316 | 6.8% |
| 30 to 34 Minutes | 584 | 12.6% |
| 35 to 39 Minutes | 109 | 2.4% |
| 40 to 44 Minutes | 146 | 3.2% |
| 45 to 59 Minutes | 442 | 9.6% |
| 60 to 89 Minutes | 298 | 6.5% |
| 90 or more Minutes | 258 | 5.6% |
Commute Time by Sex in Chowchilla
The most common commute times in Chowchilla are 30 to 34 minutes (436 commuters, 17.1%) for males and 10 to 14 minutes (430 commuters, 20.8%) for females.
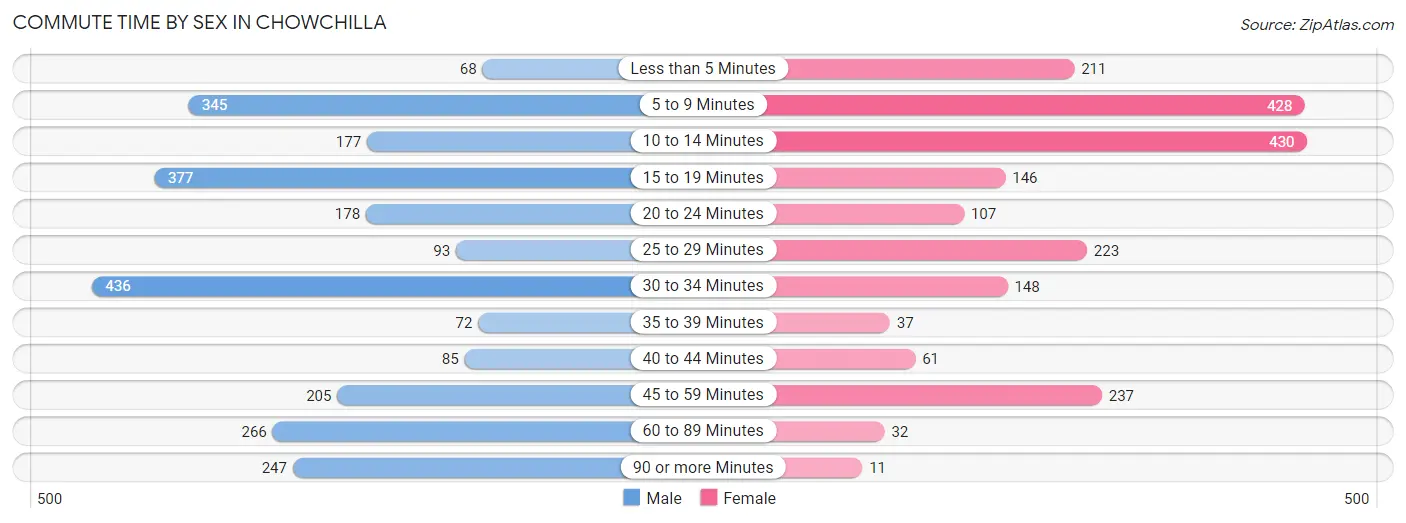
| Commute Time | Male | Female |
| Less than 5 Minutes | 68 (2.7%) | 211 (10.2%) |
| 5 to 9 Minutes | 345 (13.5%) | 428 (20.7%) |
| 10 to 14 Minutes | 177 (6.9%) | 430 (20.8%) |
| 15 to 19 Minutes | 377 (14.8%) | 146 (7.0%) |
| 20 to 24 Minutes | 178 (7.0%) | 107 (5.2%) |
| 25 to 29 Minutes | 93 (3.6%) | 223 (10.8%) |
| 30 to 34 Minutes | 436 (17.1%) | 148 (7.1%) |
| 35 to 39 Minutes | 72 (2.8%) | 37 (1.8%) |
| 40 to 44 Minutes | 85 (3.3%) | 61 (2.9%) |
| 45 to 59 Minutes | 205 (8.0%) | 237 (11.4%) |
| 60 to 89 Minutes | 266 (10.4%) | 32 (1.5%) |
| 90 or more Minutes | 247 (9.7%) | 11 (0.5%) |
Time of Departure to Work by Sex in Chowchilla
The most frequent times of departure to work in Chowchilla are 12:00 AM to 4:59 AM (598, 23.5%) for males and 7:00 AM to 7:29 AM (401, 19.4%) for females.
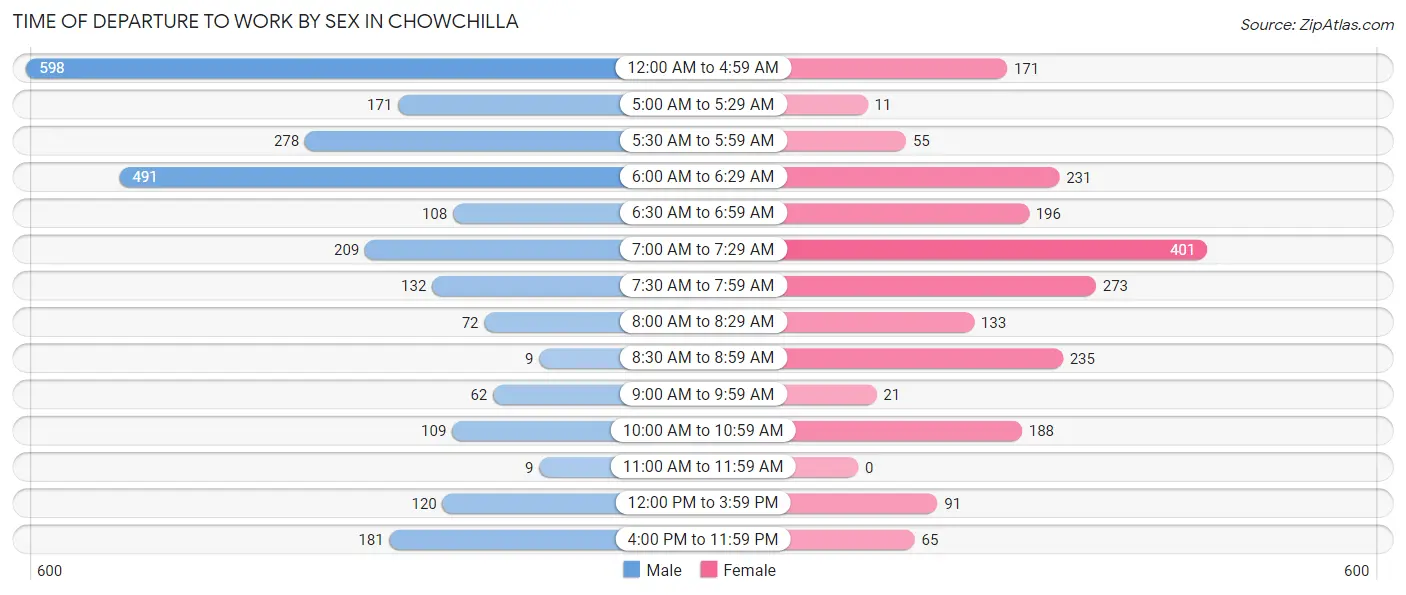
| Time of Departure | Male | Female |
| 12:00 AM to 4:59 AM | 598 (23.5%) | 171 (8.3%) |
| 5:00 AM to 5:29 AM | 171 (6.7%) | 11 (0.5%) |
| 5:30 AM to 5:59 AM | 278 (10.9%) | 55 (2.7%) |
| 6:00 AM to 6:29 AM | 491 (19.3%) | 231 (11.2%) |
| 6:30 AM to 6:59 AM | 108 (4.2%) | 196 (9.5%) |
| 7:00 AM to 7:29 AM | 209 (8.2%) | 401 (19.4%) |
| 7:30 AM to 7:59 AM | 132 (5.2%) | 273 (13.2%) |
| 8:00 AM to 8:29 AM | 72 (2.8%) | 133 (6.4%) |
| 8:30 AM to 8:59 AM | 9 (0.4%) | 235 (11.4%) |
| 9:00 AM to 9:59 AM | 62 (2.4%) | 21 (1.0%) |
| 10:00 AM to 10:59 AM | 109 (4.3%) | 188 (9.1%) |
| 11:00 AM to 11:59 AM | 9 (0.4%) | 0 (0.0%) |
| 12:00 PM to 3:59 PM | 120 (4.7%) | 91 (4.4%) |
| 4:00 PM to 11:59 PM | 181 (7.1%) | 65 (3.1%) |
| Total | 2,549 (100.0%) | 2,071 (100.0%) |
Housing Occupancy in Chowchilla
Occupancy by Ownership in Chowchilla
Of the total 3,918 dwellings in Chowchilla, owner-occupied units account for 2,350 (60.0%), while renter-occupied units make up 1,568 (40.0%).
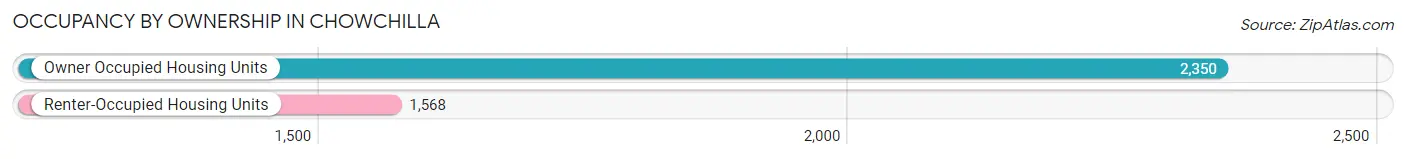
| Occupancy | # Housing Units | % Housing Units |
| Owner Occupied Housing Units | 2,350 | 60.0% |
| Renter-Occupied Housing Units | 1,568 | 40.0% |
| Total Occupied Housing Units | 3,918 | 100.0% |
Occupancy by Household Size in Chowchilla
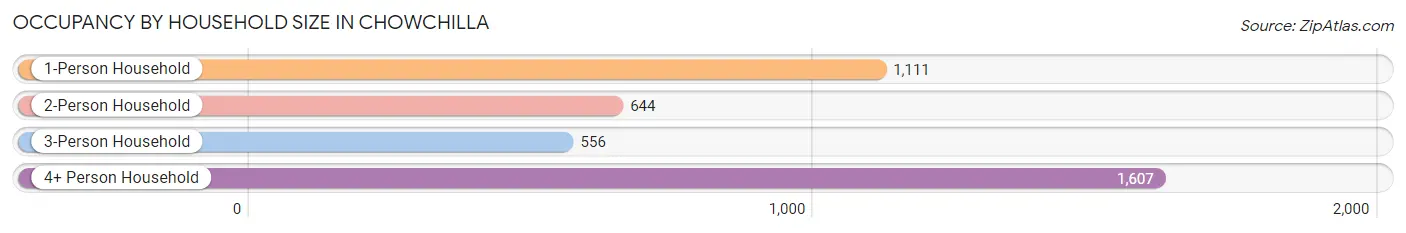
| Household Size | # Housing Units | % Housing Units |
| 1-Person Household | 1,111 | 28.4% |
| 2-Person Household | 644 | 16.4% |
| 3-Person Household | 556 | 14.2% |
| 4+ Person Household | 1,607 | 41.0% |
| Total Housing Units | 3,918 | 100.0% |
Occupancy by Ownership by Household Size in Chowchilla
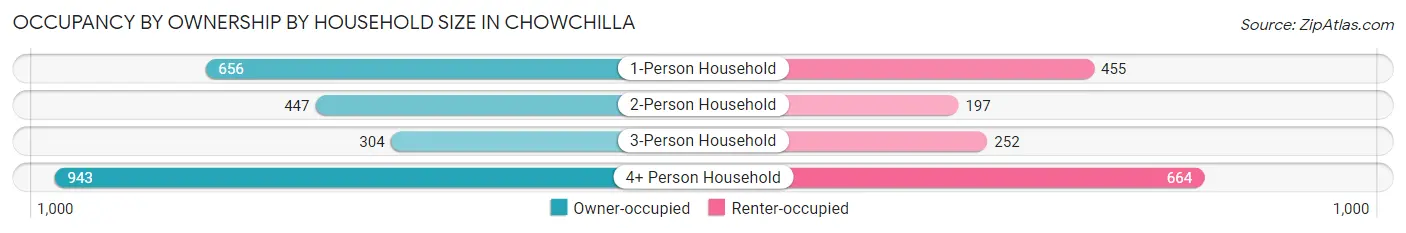
| Household Size | Owner-occupied | Renter-occupied |
| 1-Person Household | 656 (59.1%) | 455 (40.9%) |
| 2-Person Household | 447 (69.4%) | 197 (30.6%) |
| 3-Person Household | 304 (54.7%) | 252 (45.3%) |
| 4+ Person Household | 943 (58.7%) | 664 (41.3%) |
| Total Housing Units | 2,350 (60.0%) | 1,568 (40.0%) |
Occupancy by Educational Attainment in Chowchilla
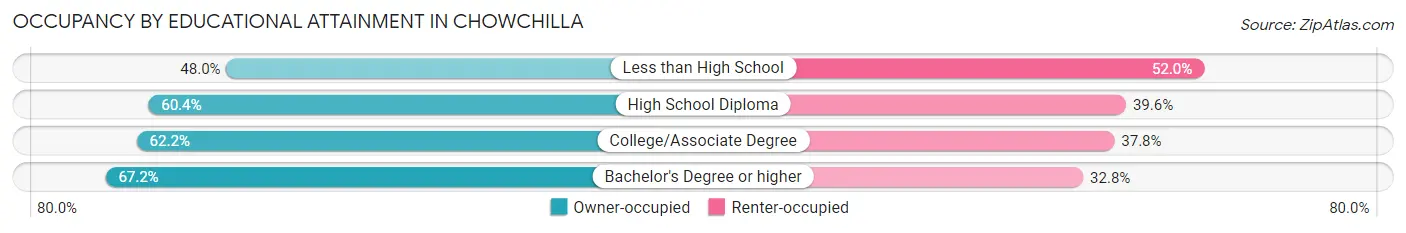
| Household Size | Owner-occupied | Renter-occupied |
| Less than High School | 393 (48.0%) | 426 (52.0%) |
| High School Diploma | 570 (60.4%) | 374 (39.6%) |
| College/Associate Degree | 761 (62.2%) | 462 (37.8%) |
| Bachelor's Degree or higher | 626 (67.2%) | 306 (32.8%) |
Occupancy by Age of Householder in Chowchilla
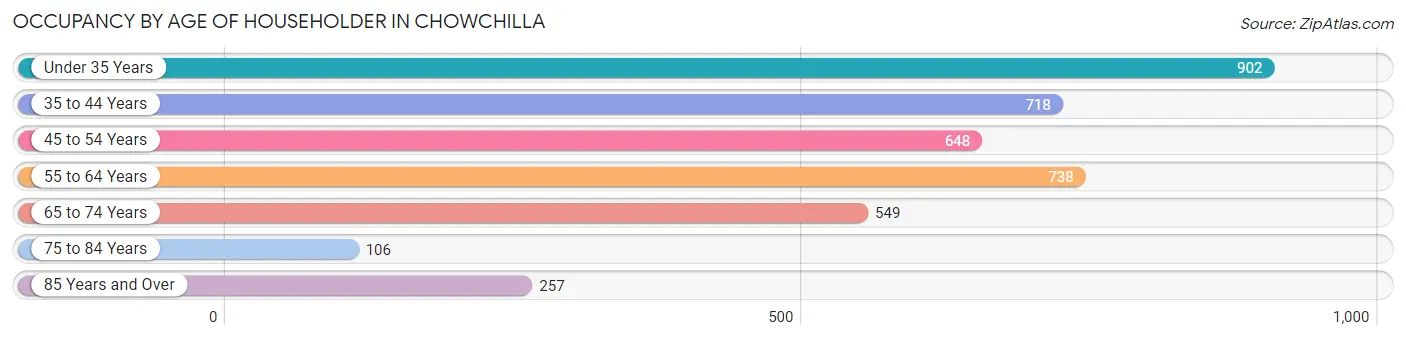
| Age Bracket | # Households | % Households |
| Under 35 Years | 902 | 23.0% |
| 35 to 44 Years | 718 | 18.3% |
| 45 to 54 Years | 648 | 16.5% |
| 55 to 64 Years | 738 | 18.8% |
| 65 to 74 Years | 549 | 14.0% |
| 75 to 84 Years | 106 | 2.7% |
| 85 Years and Over | 257 | 6.6% |
| Total | 3,918 | 100.0% |
Housing Finances in Chowchilla
Median Income by Occupancy in Chowchilla
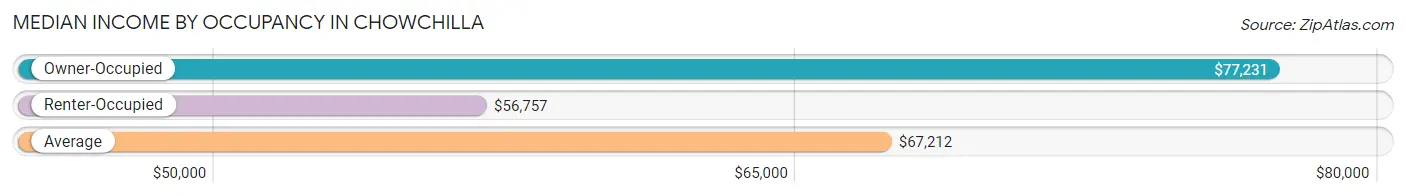
| Occupancy Type | # Households | Median Income |
| Owner-Occupied | 2,350 (60.0%) | $77,231 |
| Renter-Occupied | 1,568 (40.0%) | $56,757 |
| Average | 3,918 (100.0%) | $67,212 |
Occupancy by Householder Income Bracket in Chowchilla
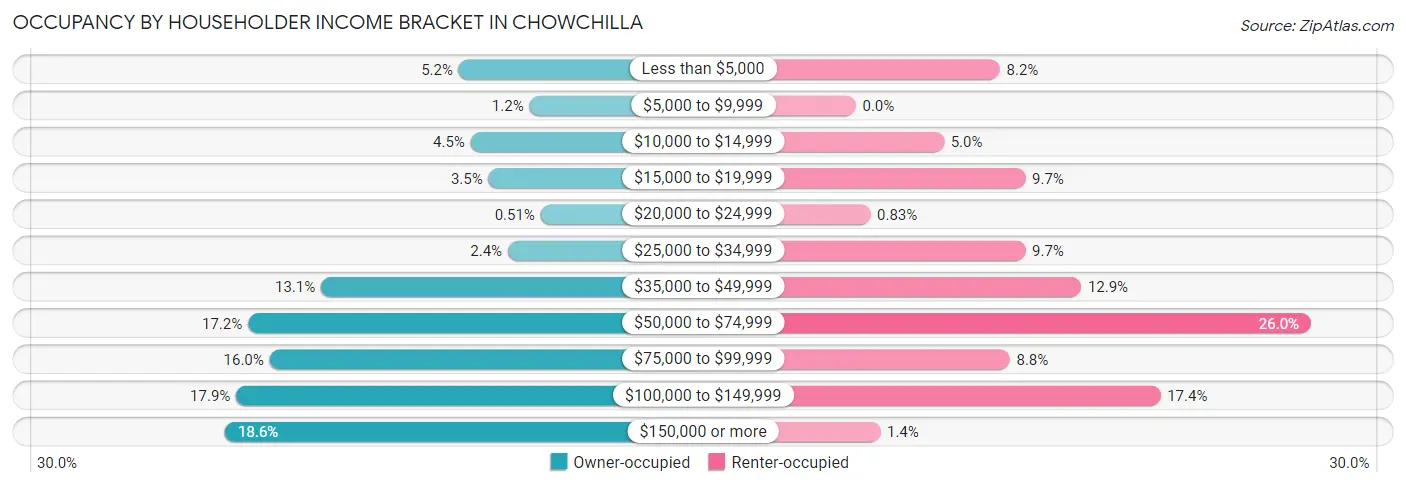
| Income Bracket | Owner-occupied | Renter-occupied |
| Less than $5,000 | 122 (5.2%) | 129 (8.2%) |
| $5,000 to $9,999 | 27 (1.1%) | 0 (0.0%) |
| $10,000 to $14,999 | 106 (4.5%) | 79 (5.0%) |
| $15,000 to $19,999 | 82 (3.5%) | 152 (9.7%) |
| $20,000 to $24,999 | 12 (0.5%) | 13 (0.8%) |
| $25,000 to $34,999 | 56 (2.4%) | 152 (9.7%) |
| $35,000 to $49,999 | 307 (13.1%) | 202 (12.9%) |
| $50,000 to $74,999 | 405 (17.2%) | 408 (26.0%) |
| $75,000 to $99,999 | 376 (16.0%) | 138 (8.8%) |
| $100,000 to $149,999 | 421 (17.9%) | 273 (17.4%) |
| $150,000 or more | 436 (18.5%) | 22 (1.4%) |
| Total | 2,350 (100.0%) | 1,568 (100.0%) |
Monthly Housing Cost Tiers in Chowchilla
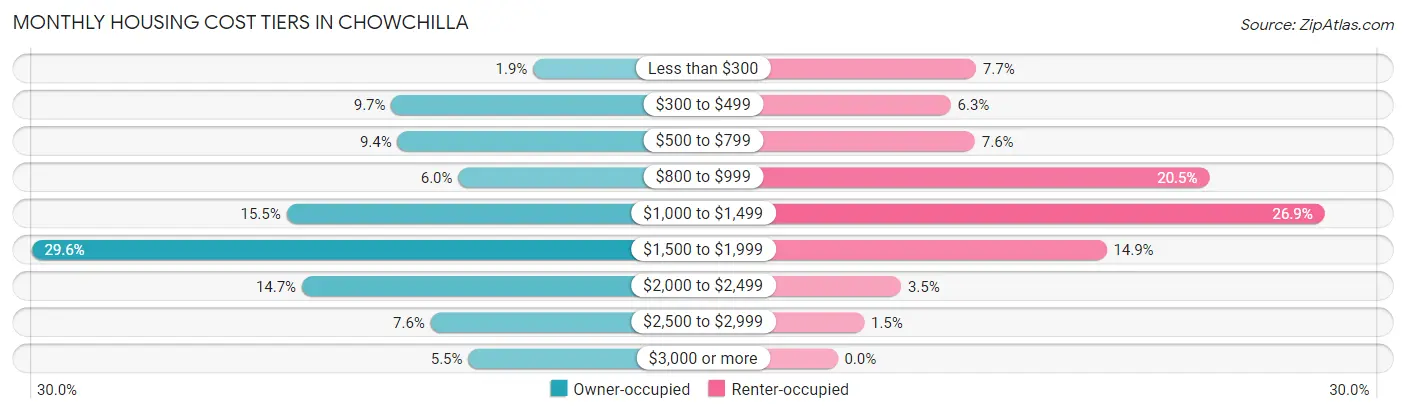
| Monthly Cost | Owner-occupied | Renter-occupied |
| Less than $300 | 45 (1.9%) | 120 (7.6%) |
| $300 to $499 | 229 (9.7%) | 98 (6.2%) |
| $500 to $799 | 221 (9.4%) | 119 (7.6%) |
| $800 to $999 | 142 (6.0%) | 322 (20.5%) |
| $1,000 to $1,499 | 365 (15.5%) | 422 (26.9%) |
| $1,500 to $1,999 | 696 (29.6%) | 233 (14.9%) |
| $2,000 to $2,499 | 345 (14.7%) | 55 (3.5%) |
| $2,500 to $2,999 | 178 (7.6%) | 23 (1.5%) |
| $3,000 or more | 129 (5.5%) | 0 (0.0%) |
| Total | 2,350 (100.0%) | 1,568 (100.0%) |
Physical Housing Characteristics in Chowchilla
Housing Structures in Chowchilla
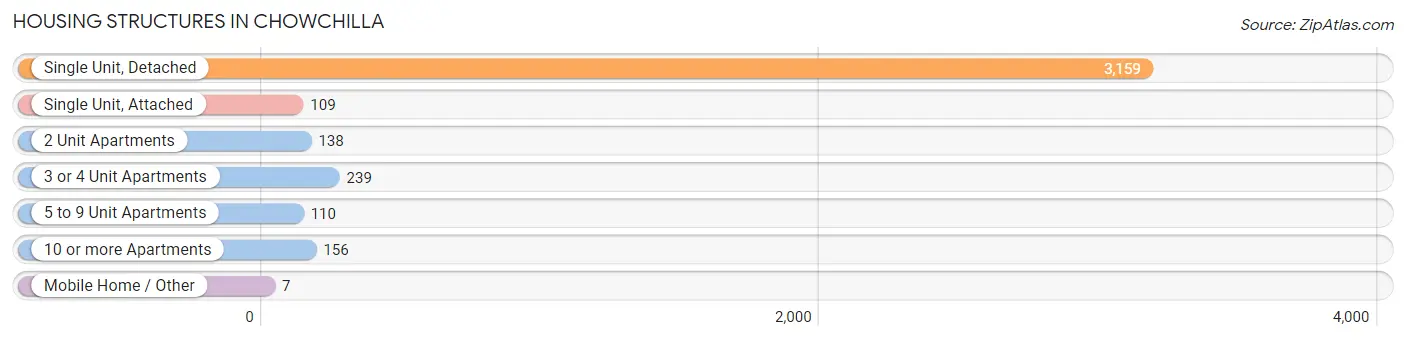
| Structure Type | # Housing Units | % Housing Units |
| Single Unit, Detached | 3,159 | 80.6% |
| Single Unit, Attached | 109 | 2.8% |
| 2 Unit Apartments | 138 | 3.5% |
| 3 or 4 Unit Apartments | 239 | 6.1% |
| 5 to 9 Unit Apartments | 110 | 2.8% |
| 10 or more Apartments | 156 | 4.0% |
| Mobile Home / Other | 7 | 0.2% |
| Total | 3,918 | 100.0% |
Housing Structures by Occupancy in Chowchilla
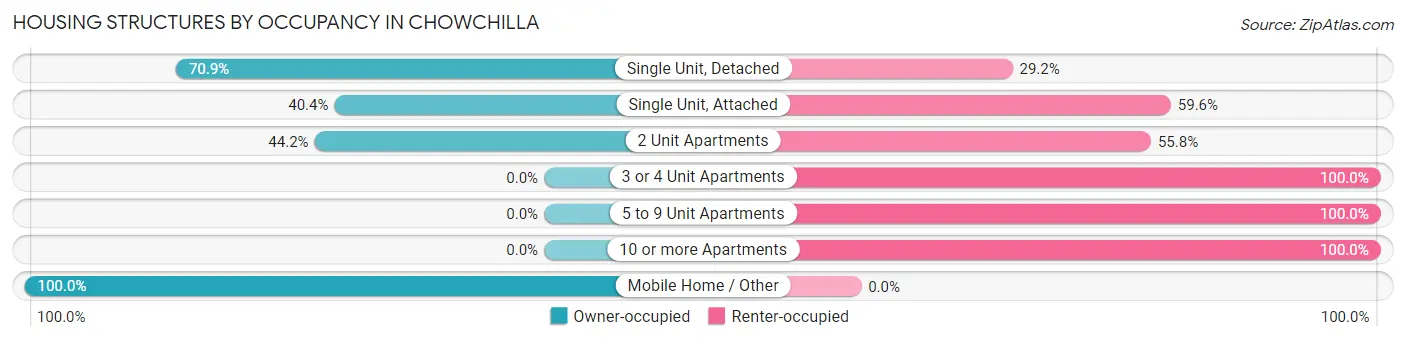
| Structure Type | Owner-occupied | Renter-occupied |
| Single Unit, Detached | 2,238 (70.9%) | 921 (29.1%) |
| Single Unit, Attached | 44 (40.4%) | 65 (59.6%) |
| 2 Unit Apartments | 61 (44.2%) | 77 (55.8%) |
| 3 or 4 Unit Apartments | 0 (0.0%) | 239 (100.0%) |
| 5 to 9 Unit Apartments | 0 (0.0%) | 110 (100.0%) |
| 10 or more Apartments | 0 (0.0%) | 156 (100.0%) |
| Mobile Home / Other | 7 (100.0%) | 0 (0.0%) |
| Total | 2,350 (60.0%) | 1,568 (40.0%) |
Housing Structures by Number of Rooms in Chowchilla
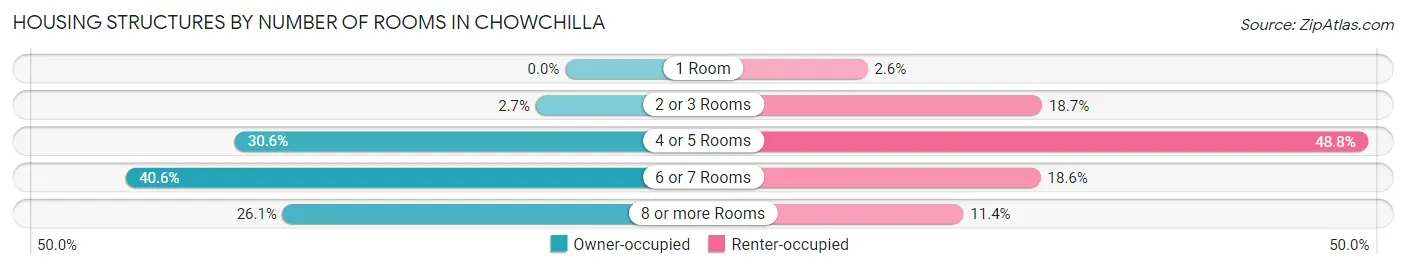
| Number of Rooms | Owner-occupied | Renter-occupied |
| 1 Room | 0 (0.0%) | 40 (2.5%) |
| 2 or 3 Rooms | 64 (2.7%) | 293 (18.7%) |
| 4 or 5 Rooms | 718 (30.5%) | 765 (48.8%) |
| 6 or 7 Rooms | 954 (40.6%) | 291 (18.6%) |
| 8 or more Rooms | 614 (26.1%) | 179 (11.4%) |
| Total | 2,350 (100.0%) | 1,568 (100.0%) |
Housing Structure by Heating Type in Chowchilla
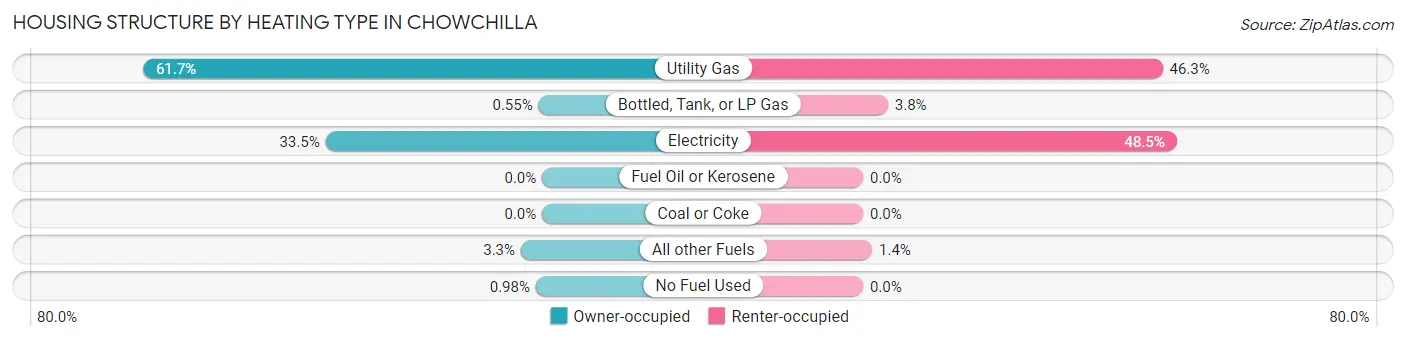
| Heating Type | Owner-occupied | Renter-occupied |
| Utility Gas | 1,450 (61.7%) | 726 (46.3%) |
| Bottled, Tank, or LP Gas | 13 (0.5%) | 60 (3.8%) |
| Electricity | 787 (33.5%) | 760 (48.5%) |
| Fuel Oil or Kerosene | 0 (0.0%) | 0 (0.0%) |
| Coal or Coke | 0 (0.0%) | 0 (0.0%) |
| All other Fuels | 77 (3.3%) | 22 (1.4%) |
| No Fuel Used | 23 (1.0%) | 0 (0.0%) |
| Total | 2,350 (100.0%) | 1,568 (100.0%) |
Household Vehicle Usage in Chowchilla
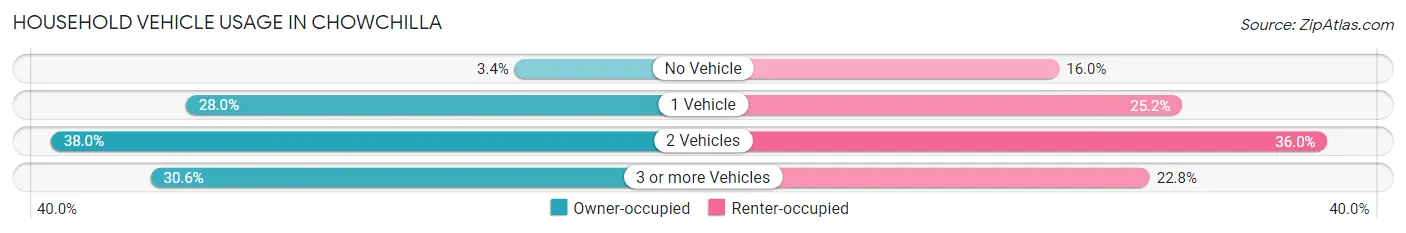
| Vehicles per Household | Owner-occupied | Renter-occupied |
| No Vehicle | 80 (3.4%) | 251 (16.0%) |
| 1 Vehicle | 657 (28.0%) | 395 (25.2%) |
| 2 Vehicles | 894 (38.0%) | 565 (36.0%) |
| 3 or more Vehicles | 719 (30.6%) | 357 (22.8%) |
| Total | 2,350 (100.0%) | 1,568 (100.0%) |
Real Estate & Mortgages in Chowchilla
Real Estate and Mortgage Overview in Chowchilla
| Characteristic | Without Mortgage | With Mortgage |
| Housing Units | 709 | 1,641 |
| Median Property Value | $277,800 | $307,500 |
| Median Household Income | $43,438 | $376 |
| Monthly Housing Costs | $625 | $74 |
| Real Estate Taxes | $3,054 | $67 |
Property Value by Mortgage Status in Chowchilla
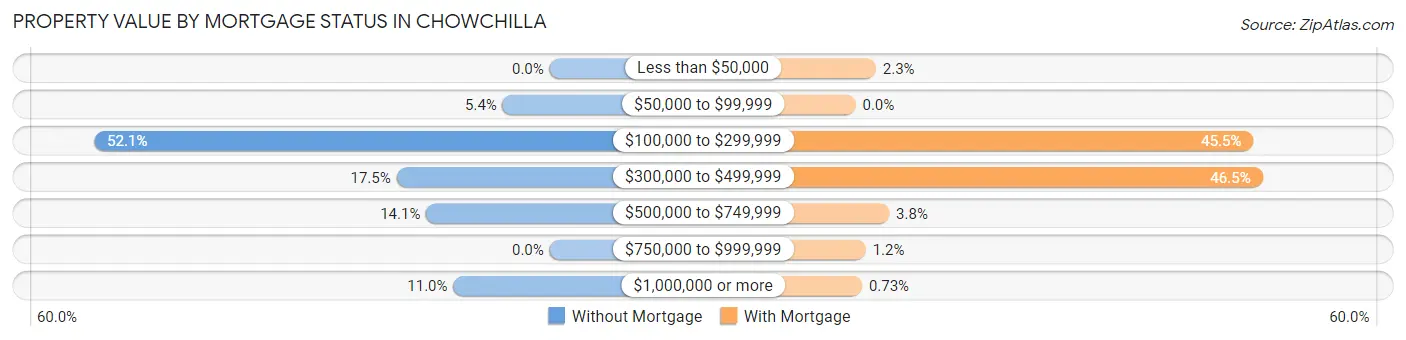
| Property Value | Without Mortgage | With Mortgage |
| Less than $50,000 | 0 (0.0%) | 38 (2.3%) |
| $50,000 to $99,999 | 38 (5.4%) | 0 (0.0%) |
| $100,000 to $299,999 | 369 (52.0%) | 746 (45.5%) |
| $300,000 to $499,999 | 124 (17.5%) | 763 (46.5%) |
| $500,000 to $749,999 | 100 (14.1%) | 63 (3.8%) |
| $750,000 to $999,999 | 0 (0.0%) | 19 (1.2%) |
| $1,000,000 or more | 78 (11.0%) | 12 (0.7%) |
| Total | 709 (100.0%) | 1,641 (100.0%) |
Household Income by Mortgage Status in Chowchilla
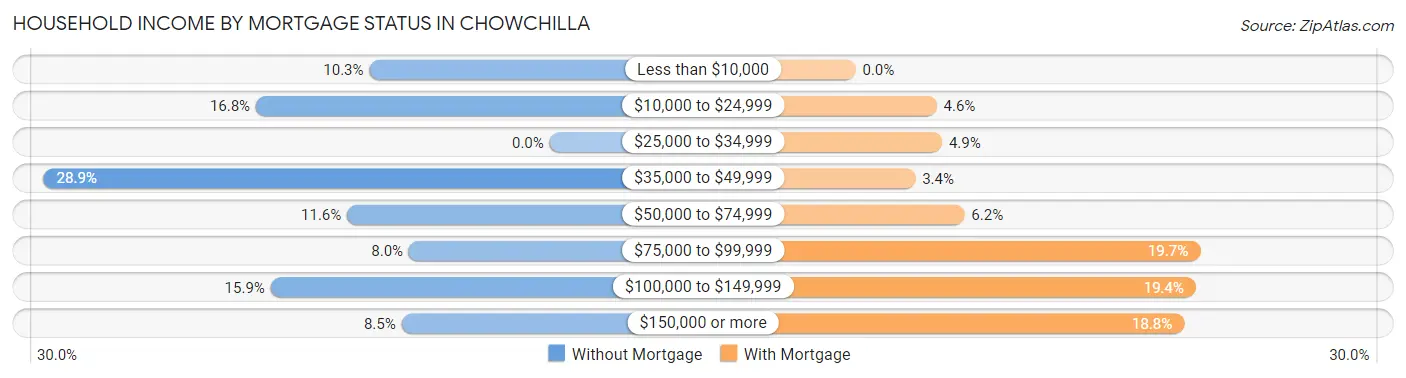
| Household Income | Without Mortgage | With Mortgage |
| Less than $10,000 | 73 (10.3%) | 0 (0.0%) |
| $10,000 to $24,999 | 119 (16.8%) | 76 (4.6%) |
| $25,000 to $34,999 | 0 (0.0%) | 81 (4.9%) |
| $35,000 to $49,999 | 205 (28.9%) | 56 (3.4%) |
| $50,000 to $74,999 | 82 (11.6%) | 102 (6.2%) |
| $75,000 to $99,999 | 57 (8.0%) | 323 (19.7%) |
| $100,000 to $149,999 | 113 (15.9%) | 319 (19.4%) |
| $150,000 or more | 60 (8.5%) | 308 (18.8%) |
| Total | 709 (100.0%) | 1,641 (100.0%) |
Property Value to Household Income Ratio in Chowchilla
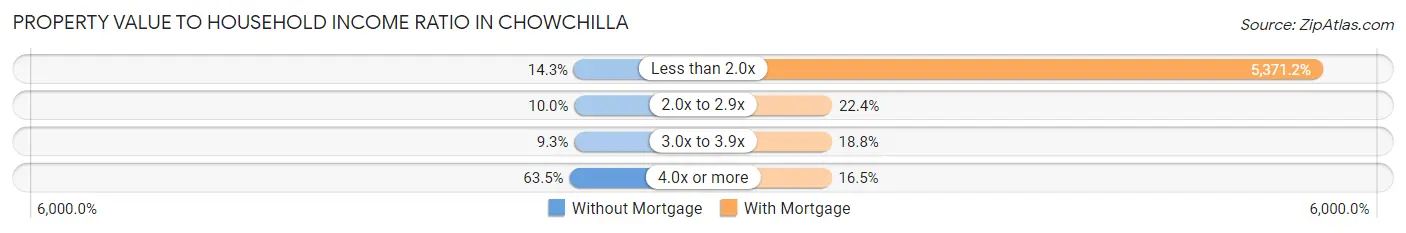
| Value-to-Income Ratio | Without Mortgage | With Mortgage |
| Less than 2.0x | 101 (14.2%) | 88,142 (5,371.2%) |
| 2.0x to 2.9x | 71 (10.0%) | 368 (22.4%) |
| 3.0x to 3.9x | 66 (9.3%) | 308 (18.8%) |
| 4.0x or more | 450 (63.5%) | 270 (16.5%) |
| Total | 709 (100.0%) | 1,641 (100.0%) |
Real Estate Taxes by Mortgage Status in Chowchilla
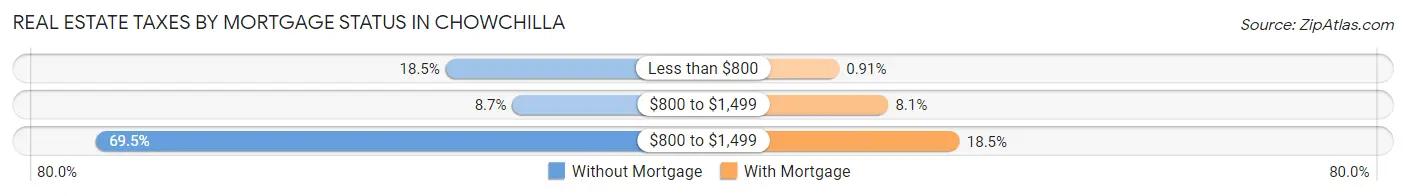
| Property Taxes | Without Mortgage | With Mortgage |
| Less than $800 | 131 (18.5%) | 15 (0.9%) |
| $800 to $1,499 | 62 (8.7%) | 133 (8.1%) |
| $800 to $1,499 | 493 (69.5%) | 304 (18.5%) |
| Total | 709 (100.0%) | 1,641 (100.0%) |
Health & Disability in Chowchilla
Health Insurance Coverage by Age in Chowchilla
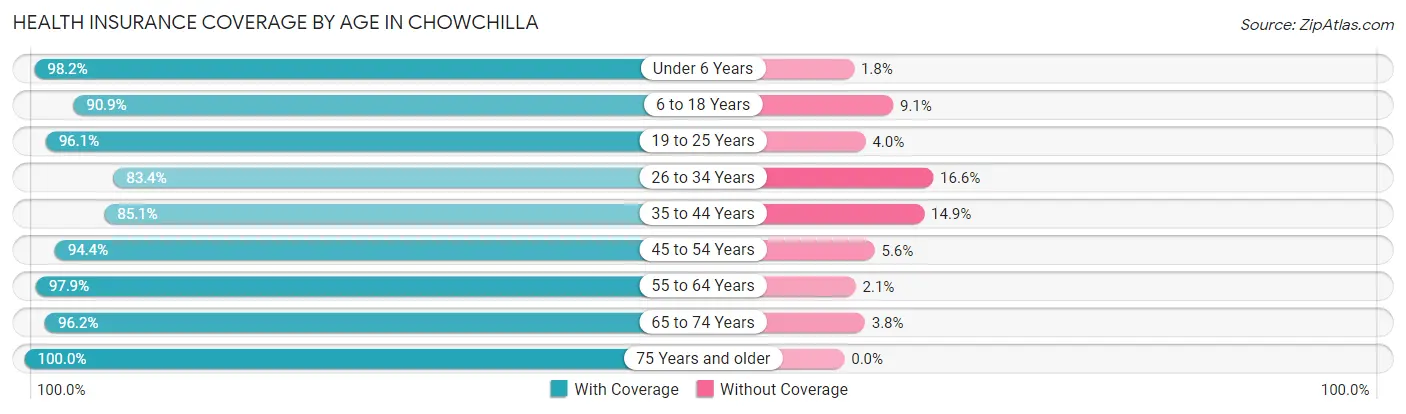
| Age Bracket | With Coverage | Without Coverage |
| Under 6 Years | 1,358 (98.2%) | 25 (1.8%) |
| 6 to 18 Years | 2,729 (90.9%) | 273 (9.1%) |
| 19 to 25 Years | 1,385 (96.1%) | 57 (4.0%) |
| 26 to 34 Years | 1,517 (83.4%) | 301 (16.6%) |
| 35 to 44 Years | 1,258 (85.1%) | 220 (14.9%) |
| 45 to 54 Years | 1,205 (94.4%) | 72 (5.6%) |
| 55 to 64 Years | 1,348 (97.9%) | 29 (2.1%) |
| 65 to 74 Years | 781 (96.2%) | 31 (3.8%) |
| 75 Years and older | 576 (100.0%) | 0 (0.0%) |
| Total | 12,157 (92.3%) | 1,008 (7.7%) |
Health Insurance Coverage by Citizenship Status in Chowchilla
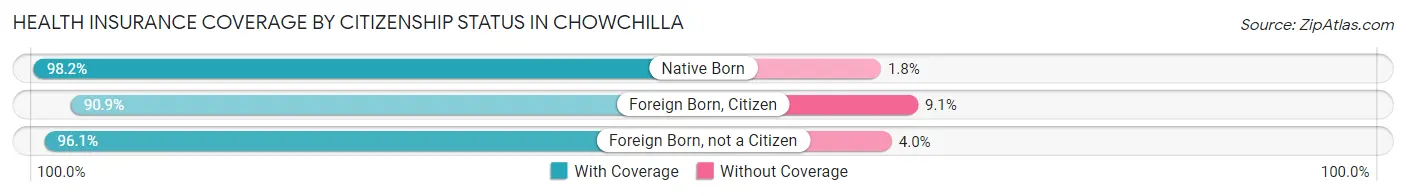
| Citizenship Status | With Coverage | Without Coverage |
| Native Born | 1,358 (98.2%) | 25 (1.8%) |
| Foreign Born, Citizen | 2,729 (90.9%) | 273 (9.1%) |
| Foreign Born, not a Citizen | 1,385 (96.1%) | 57 (4.0%) |
Health Insurance Coverage by Household Income in Chowchilla
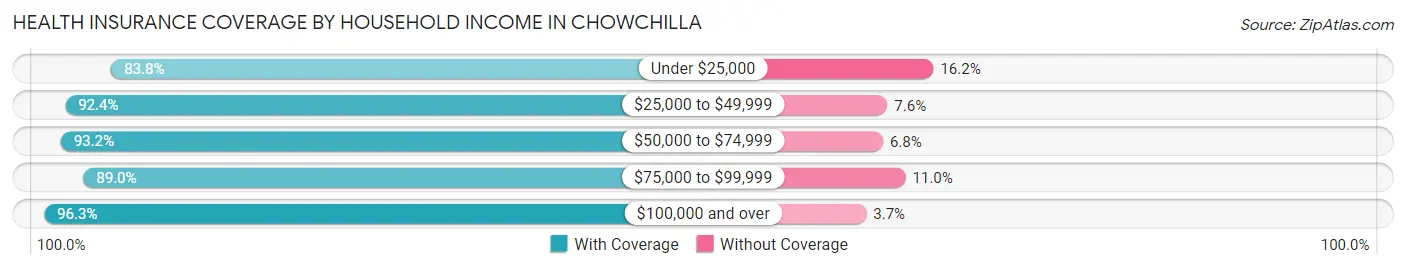
| Household Income | With Coverage | Without Coverage |
| Under $25,000 | 1,424 (83.8%) | 276 (16.2%) |
| $25,000 to $49,999 | 2,209 (92.4%) | 182 (7.6%) |
| $50,000 to $74,999 | 2,145 (93.2%) | 156 (6.8%) |
| $75,000 to $99,999 | 1,768 (89.0%) | 219 (11.0%) |
| $100,000 and over | 4,601 (96.3%) | 175 (3.7%) |
Public vs Private Health Insurance Coverage by Age in Chowchilla
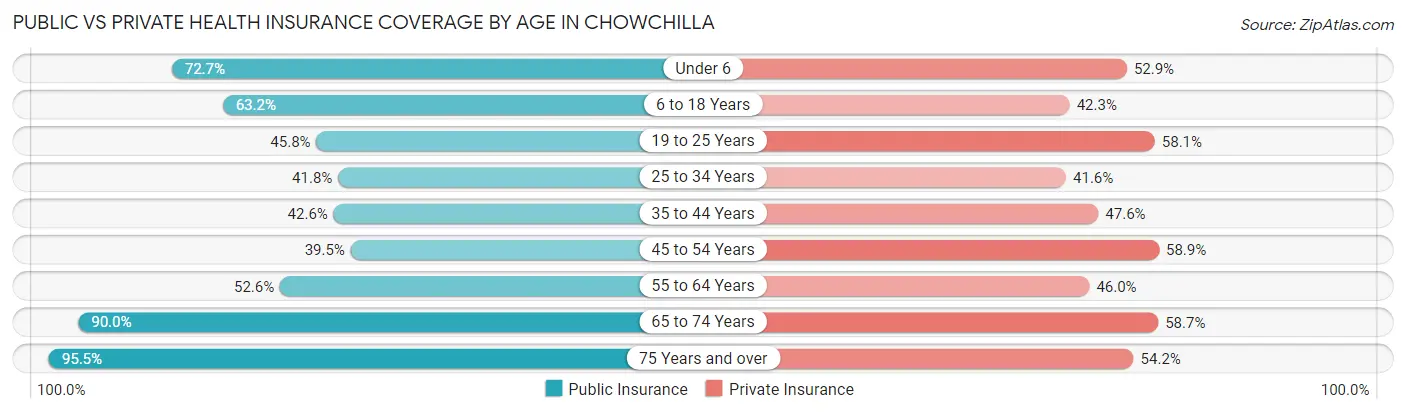
| Age Bracket | Public Insurance | Private Insurance |
| Under 6 | 1,005 (72.7%) | 732 (52.9%) |
| 6 to 18 Years | 1,898 (63.2%) | 1,270 (42.3%) |
| 19 to 25 Years | 661 (45.8%) | 838 (58.1%) |
| 25 to 34 Years | 760 (41.8%) | 757 (41.6%) |
| 35 to 44 Years | 630 (42.6%) | 704 (47.6%) |
| 45 to 54 Years | 504 (39.5%) | 752 (58.9%) |
| 55 to 64 Years | 724 (52.6%) | 633 (46.0%) |
| 65 to 74 Years | 731 (90.0%) | 477 (58.7%) |
| 75 Years and over | 550 (95.5%) | 312 (54.2%) |
| Total | 7,463 (56.7%) | 6,475 (49.2%) |
Disability Status by Sex by Age in Chowchilla
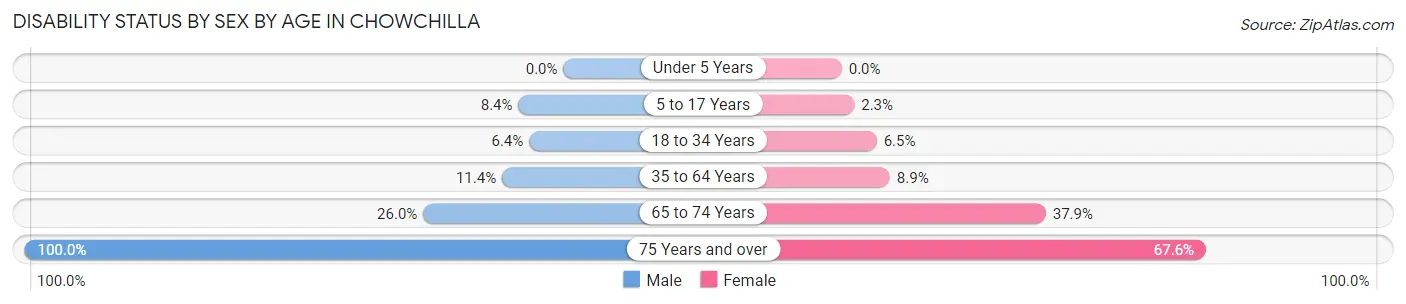
| Age Bracket | Male | Female |
| Under 5 Years | 0 (0.0%) | 0 (0.0%) |
| 5 to 17 Years | 150 (8.4%) | 29 (2.3%) |
| 18 to 34 Years | 100 (6.4%) | 121 (6.5%) |
| 35 to 64 Years | 255 (11.4%) | 169 (8.9%) |
| 65 to 74 Years | 102 (26.0%) | 159 (37.9%) |
| 75 Years and over | 175 (100.0%) | 271 (67.6%) |
Disability Class by Sex by Age in Chowchilla
Disability Class: Hearing Difficulty
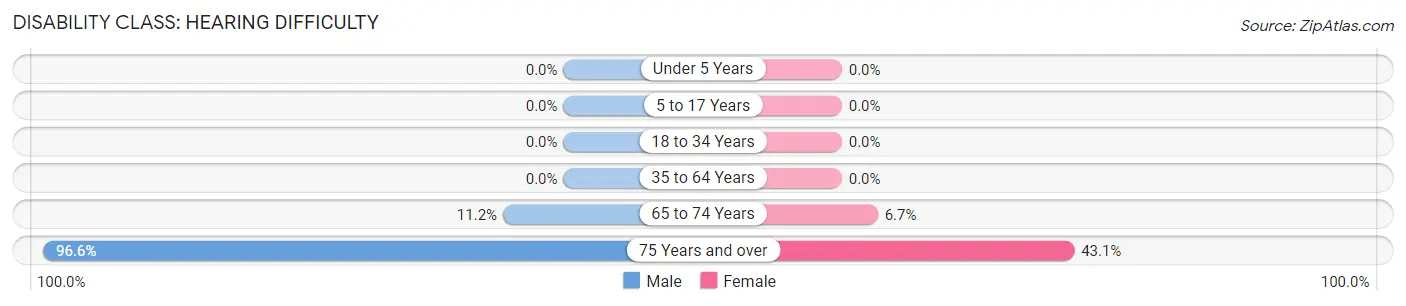
| Age Bracket | Male | Female |
| Under 5 Years | 0 (0.0%) | 0 (0.0%) |
| 5 to 17 Years | 0 (0.0%) | 0 (0.0%) |
| 18 to 34 Years | 0 (0.0%) | 0 (0.0%) |
| 35 to 64 Years | 0 (0.0%) | 0 (0.0%) |
| 65 to 74 Years | 44 (11.2%) | 28 (6.7%) |
| 75 Years and over | 169 (96.6%) | 173 (43.1%) |
Disability Class: Vision Difficulty
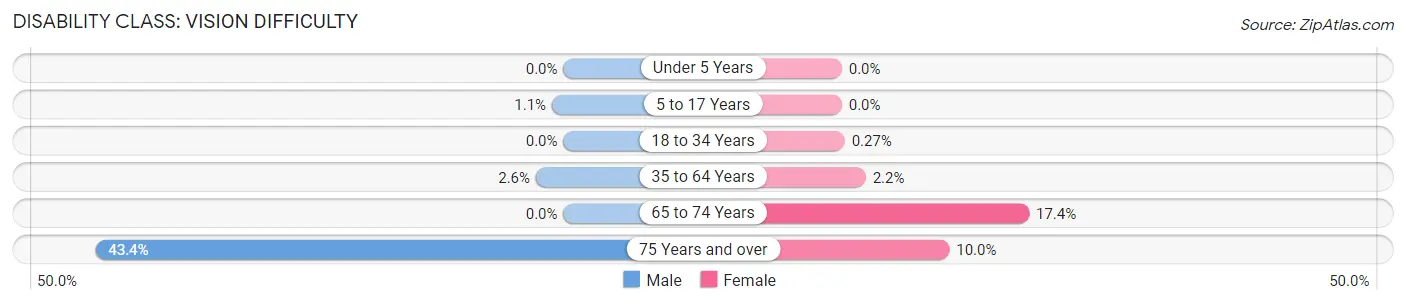
| Age Bracket | Male | Female |
| Under 5 Years | 0 (0.0%) | 0 (0.0%) |
| 5 to 17 Years | 19 (1.1%) | 0 (0.0%) |
| 18 to 34 Years | 0 (0.0%) | 5 (0.3%) |
| 35 to 64 Years | 57 (2.5%) | 42 (2.2%) |
| 65 to 74 Years | 0 (0.0%) | 73 (17.4%) |
| 75 Years and over | 76 (43.4%) | 40 (10.0%) |
Disability Class: Cognitive Difficulty
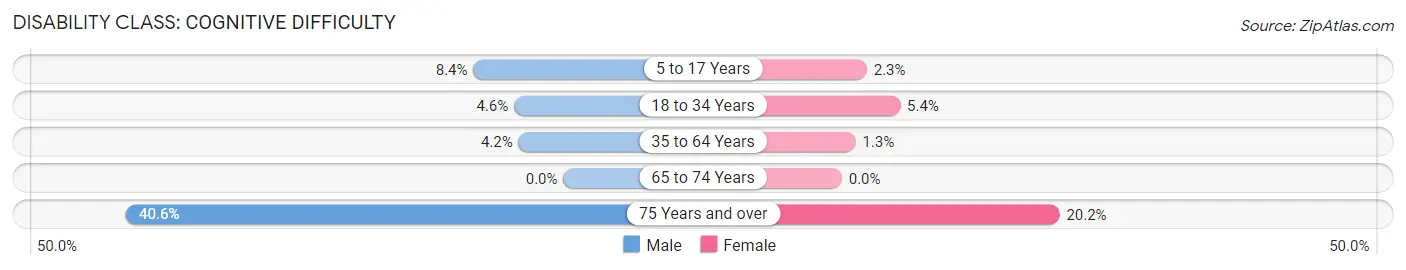
| Age Bracket | Male | Female |
| 5 to 17 Years | 150 (8.4%) | 29 (2.3%) |
| 18 to 34 Years | 72 (4.6%) | 101 (5.4%) |
| 35 to 64 Years | 93 (4.2%) | 24 (1.3%) |
| 65 to 74 Years | 0 (0.0%) | 0 (0.0%) |
| 75 Years and over | 71 (40.6%) | 81 (20.2%) |
Disability Class: Ambulatory Difficulty
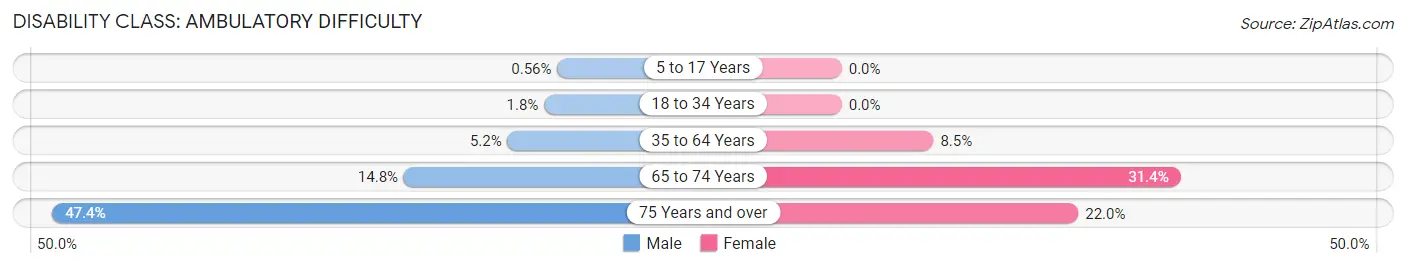
| Age Bracket | Male | Female |
| 5 to 17 Years | 10 (0.6%) | 0 (0.0%) |
| 18 to 34 Years | 28 (1.8%) | 0 (0.0%) |
| 35 to 64 Years | 116 (5.2%) | 161 (8.5%) |
| 65 to 74 Years | 58 (14.8%) | 132 (31.4%) |
| 75 Years and over | 83 (47.4%) | 88 (22.0%) |
Disability Class: Self-Care Difficulty
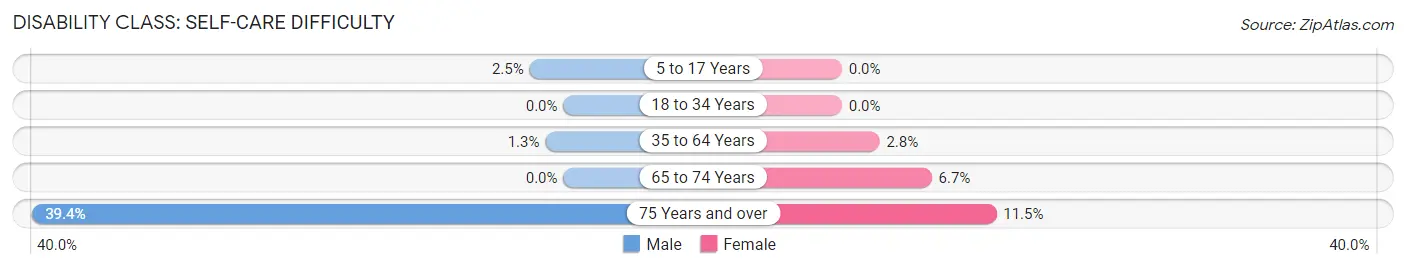
| Age Bracket | Male | Female |
| 5 to 17 Years | 45 (2.5%) | 0 (0.0%) |
| 18 to 34 Years | 0 (0.0%) | 0 (0.0%) |
| 35 to 64 Years | 30 (1.3%) | 53 (2.8%) |
| 65 to 74 Years | 0 (0.0%) | 28 (6.7%) |
| 75 Years and over | 69 (39.4%) | 46 (11.5%) |
Technology Access in Chowchilla
Computing Device Access in Chowchilla
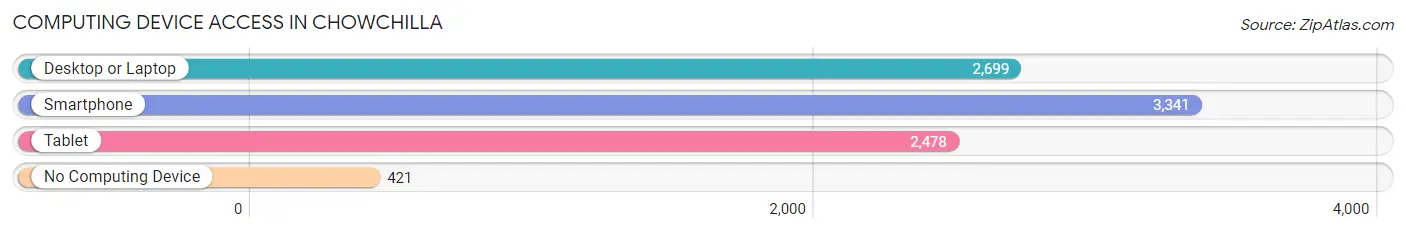
| Device Type | # Households | % Households |
| Desktop or Laptop | 2,699 | 68.9% |
| Smartphone | 3,341 | 85.3% |
| Tablet | 2,478 | 63.2% |
| No Computing Device | 421 | 10.7% |
| Total | 3,918 | 100.0% |
Internet Access in Chowchilla
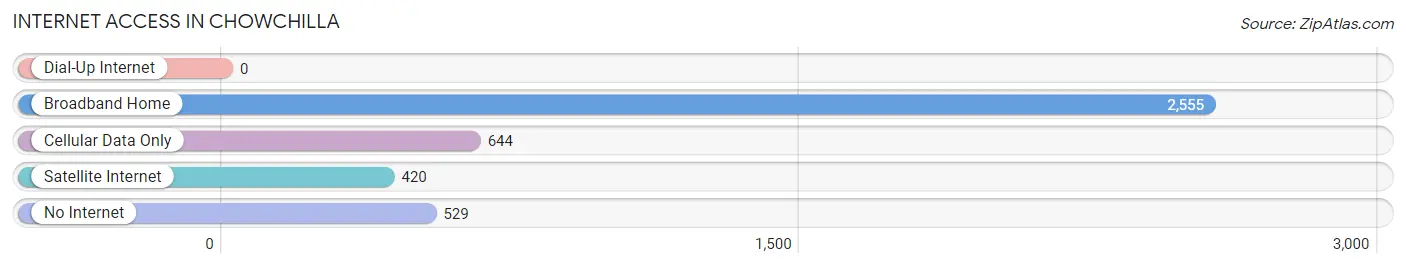
| Internet Type | # Households | % Households |
| Dial-Up Internet | 0 | 0.0% |
| Broadband Home | 2,555 | 65.2% |
| Cellular Data Only | 644 | 16.4% |
| Satellite Internet | 420 | 10.7% |
| No Internet | 529 | 13.5% |
| Total | 3,918 | 100.0% |
Chowchilla Summary
Chowchilla is a city located in Madera County, California, United States. It is situated in the San Joaquin Valley, near the foothills of the Sierra Nevada Mountains. The city is located about 45 miles northwest of Fresno, and is part of the Fresno-Madera metropolitan area. As of the 2010 census, the population of Chowchilla was 18,720.
History
Chowchilla was founded in 1912 by the Southern Pacific Railroad. The city was named after the nearby Native American tribe, the Chowchilla, who lived in the area for centuries. The city was incorporated in 1945.
Geography
Chowchilla is located at an elevation of about 220 feet (67 m) above sea level. It is situated in the San Joaquin Valley, near the foothills of the Sierra Nevada Mountains. The city is located about 45 miles northwest of Fresno, and is part of the Fresno-Madera metropolitan area.
The city covers an area of about 5.5 square miles (14.2 km2), and is bordered by the cities of Madera and Merced to the north, and the city of Fresno to the south. The city is located along State Route 99, which runs north-south through the city.
Economy
Chowchilla’s economy is largely based on agriculture. The city is home to a number of large farms, including the largest almond farm in the world. The city is also home to a number of food processing plants, including a large plant owned by Foster Farms.
The city is also home to a number of manufacturing companies, including a large plant owned by the company, Bimbo Bakeries USA. The city is also home to a number of retail stores, including a Walmart Supercenter.
Demographics
As of the 2010 census, the population of Chowchilla was 18,720. The racial makeup of the city was 68.2% White, 0.7% African American, 1.2% Native American, 0.7% Asian, 0.1% Pacific Islander, 25.7% from other races, and 3.4% from two or more races. Hispanic or Latino of any race were 44.2% of the population.
The median household income in the city was $41,945, and the median family income was $48,945. The per capita income for the city was $17,845. About 17.2% of the population was below the poverty line.
Conclusion
Chowchilla is a city located in Madera County, California, United States. It is situated in the San Joaquin Valley, near the foothills of the Sierra Nevada Mountains. The city is located about 45 miles northwest of Fresno, and is part of the Fresno-Madera metropolitan area. As of the 2010 census, the population of Chowchilla was 18,720. The city’s economy is largely based on agriculture, and it is home to a number of large farms, food processing plants, and manufacturing companies. The racial makeup of the city was 68.2% White, 0.7% African American, 1.2% Native American, 0.7% Asian, 0.1% Pacific Islander, 25.7% from other races, and 3.4% from two or more races. Hispanic or Latino of any race were 44.2% of the population. The median household income in the city was $41,945, and the median family income was $48,945. The per capita income for the city was $17,845. About 17.2% of the population was below the poverty line.
Common Questions
What is Per Capita Income in Chowchilla?
Per Capita income in Chowchilla is $20,707.
What is the Median Family Income in Chowchilla?
Median Family Income in Chowchilla is $75,625.
What is the Median Household income in Chowchilla?
Median Household Income in Chowchilla is $67,212.
What is Income or Wage Gap in Chowchilla?
Income or Wage Gap in Chowchilla is 57.1%.
Women in Chowchilla earn 42.9 cents for every dollar earned by a man.
What is Inequality or Gini Index in Chowchilla?
Inequality or Gini Index in Chowchilla is 0.43.
What is the Total Population of Chowchilla?
Total Population of Chowchilla is 18,772.
What is the Total Male Population of Chowchilla?
Total Male Population of Chowchilla is 9,018.
What is the Total Female Population of Chowchilla?
Total Female Population of Chowchilla is 9,754.
What is the Ratio of Males per 100 Females in Chowchilla?
There are 92.45 Males per 100 Females in Chowchilla.
What is the Ratio of Females per 100 Males in Chowchilla?
There are 108.16 Females per 100 Males in Chowchilla.
What is the Median Population Age in Chowchilla?
Median Population Age in Chowchilla is 34.1 Years.
What is the Average Family Size in Chowchilla
Average Family Size in Chowchilla is 4.2 People.
What is the Average Household Size in Chowchilla
Average Household Size in Chowchilla is 3.4 People.
How Large is the Labor Force in Chowchilla?
There are 5,673 People in the Labor Forcein in Chowchilla.
What is the Percentage of People in the Labor Force in Chowchilla?
37.5% of People are in the Labor Force in Chowchilla.
What is the Unemployment Rate in Chowchilla?
Unemployment Rate in Chowchilla is 10.1%.