Catheys Valley, CA Map & Demographics
Catheys Valley Map
Catheys Valley Overview
$35,264
PER CAPITA INCOME
$77,028
AVG FAMILY INCOME
$63,750
AVG HOUSEHOLD INCOME
24.1%
WAGE / INCOME GAP [ % ]
75.9¢/ $1
WAGE / INCOME GAP [ $ ]
0.45
INEQUALITY / GINI INDEX
723
TOTAL POPULATION
330
MALE POPULATION
393
FEMALE POPULATION
83.97
MALES / 100 FEMALES
119.09
FEMALES / 100 MALES
60.7
MEDIAN AGE
2.3
AVG FAMILY SIZE
2.0
AVG HOUSEHOLD SIZE
232
LABOR FORCE [ PEOPLE ]
35.9%
PERCENT IN LABOR FORCE
4.3%
UNEMPLOYMENT RATE
Catheys Valley Zip Codes
Catheys Valley Area Codes
Income in Catheys Valley
Income Overview in Catheys Valley
Per Capita Income in Catheys Valley is $35,264, while median incomes of families and households are $77,028 and $63,750 respectively.
| Characteristic | Number | Measure |
| Per Capita Income | 723 | $35,264 |
| Median Family Income | 241 | $77,028 |
| Mean Family Income | 241 | $104,938 |
| Median Household Income | 366 | $63,750 |
| Mean Household Income | 366 | $77,873 |
| Income Deficit | 241 | $0 |
| Wage / Income Gap (%) | 723 | 24.08% |
| Wage / Income Gap ($) | 723 | 75.92¢ per $1 |
| Gini / Inequality Index | 723 | 0.45 |
Earnings by Sex in Catheys Valley
Average Earnings in Catheys Valley are $31,302, $29,375 for men and $38,692 for women, a difference of 24.1%.
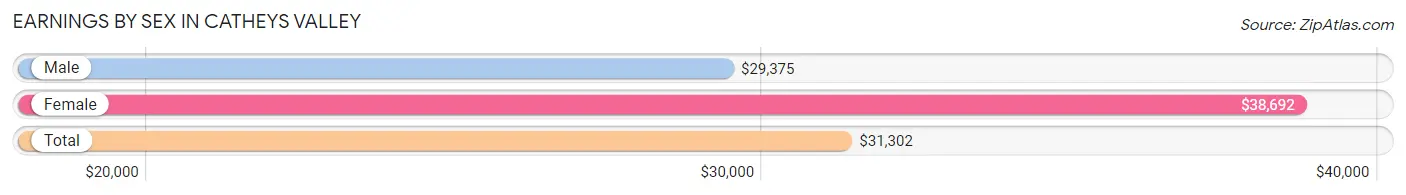
| Sex | Number | Average Earnings |
| Male | 136 (52.1%) | $29,375 |
| Female | 125 (47.9%) | $38,692 |
| Total | 261 (100.0%) | $31,302 |
Earnings by Sex by Income Bracket in Catheys Valley
The most common earnings brackets in Catheys Valley are $25,000 to $29,999 for men (32 | 23.5%) and $35,000 to $39,999 for women (43 | 34.4%).
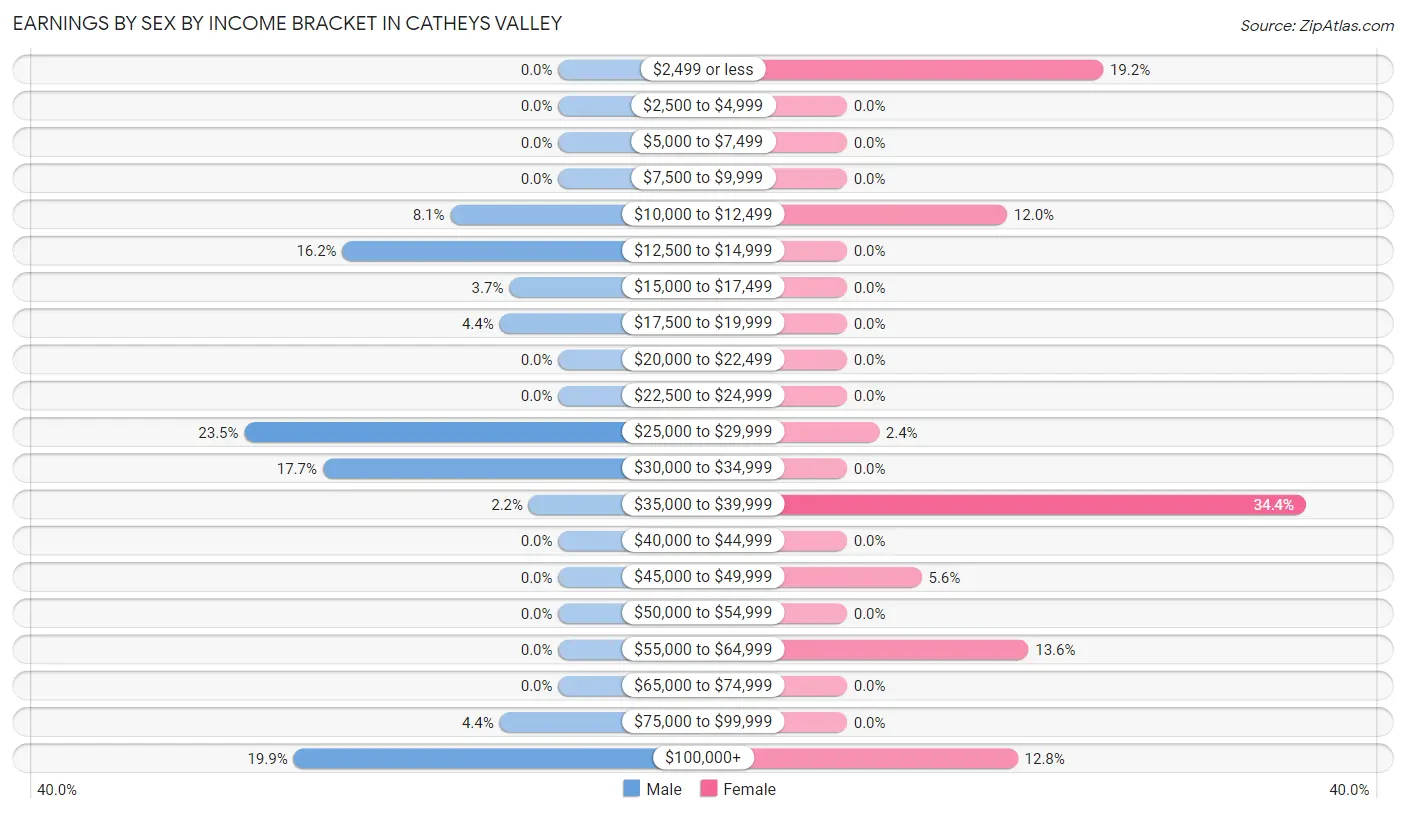
| Income | Male | Female |
| $2,499 or less | 0 (0.0%) | 24 (19.2%) |
| $2,500 to $4,999 | 0 (0.0%) | 0 (0.0%) |
| $5,000 to $7,499 | 0 (0.0%) | 0 (0.0%) |
| $7,500 to $9,999 | 0 (0.0%) | 0 (0.0%) |
| $10,000 to $12,499 | 11 (8.1%) | 15 (12.0%) |
| $12,500 to $14,999 | 22 (16.2%) | 0 (0.0%) |
| $15,000 to $17,499 | 5 (3.7%) | 0 (0.0%) |
| $17,500 to $19,999 | 6 (4.4%) | 0 (0.0%) |
| $20,000 to $22,499 | 0 (0.0%) | 0 (0.0%) |
| $22,500 to $24,999 | 0 (0.0%) | 0 (0.0%) |
| $25,000 to $29,999 | 32 (23.5%) | 3 (2.4%) |
| $30,000 to $34,999 | 24 (17.6%) | 0 (0.0%) |
| $35,000 to $39,999 | 3 (2.2%) | 43 (34.4%) |
| $40,000 to $44,999 | 0 (0.0%) | 0 (0.0%) |
| $45,000 to $49,999 | 0 (0.0%) | 7 (5.6%) |
| $50,000 to $54,999 | 0 (0.0%) | 0 (0.0%) |
| $55,000 to $64,999 | 0 (0.0%) | 17 (13.6%) |
| $65,000 to $74,999 | 0 (0.0%) | 0 (0.0%) |
| $75,000 to $99,999 | 6 (4.4%) | 0 (0.0%) |
| $100,000+ | 27 (19.9%) | 16 (12.8%) |
| Total | 136 (100.0%) | 125 (100.0%) |
Earnings by Sex by Educational Attainment in Catheys Valley
Average earnings in Catheys Valley are $29,570 for men and $38,983 for women, a difference of 24.1%. Men with an educational attainment of college or associate's degree enjoy the highest average annual earnings of $14,034, while those with college or associate's degree education earn the least with $14,034. Women with an educational attainment of bachelor's degree earn the most with the average annual earnings of $39,244, while those with bachelor's degree education have the smallest earnings of $39,244.
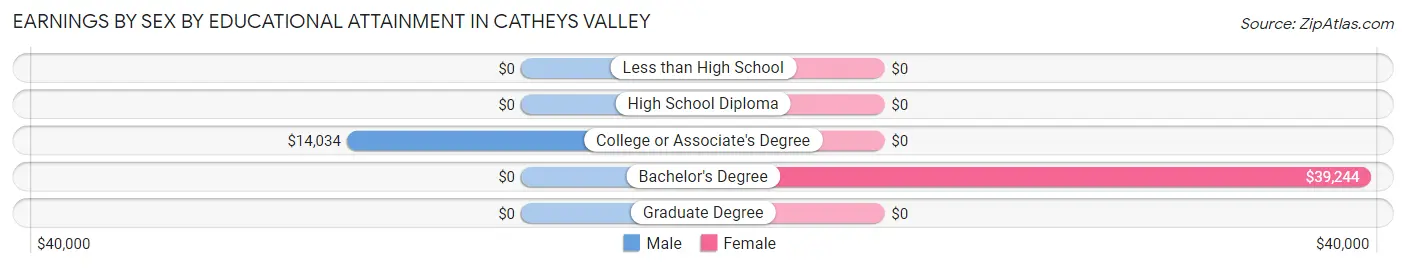
| Educational Attainment | Male Income | Female Income |
| Less than High School | - | - |
| High School Diploma | - | - |
| College or Associate's Degree | $14,034 | $0 |
| Bachelor's Degree | - | - |
| Graduate Degree | - | - |
| Total | $29,570 | $38,983 |
Family Income in Catheys Valley
Family Income Brackets in Catheys Valley
According to the Catheys Valley family income data, there are 53 families falling into the $150,000 to $199,999 income range, which is the most common income bracket and makes up 22.0% of all families.
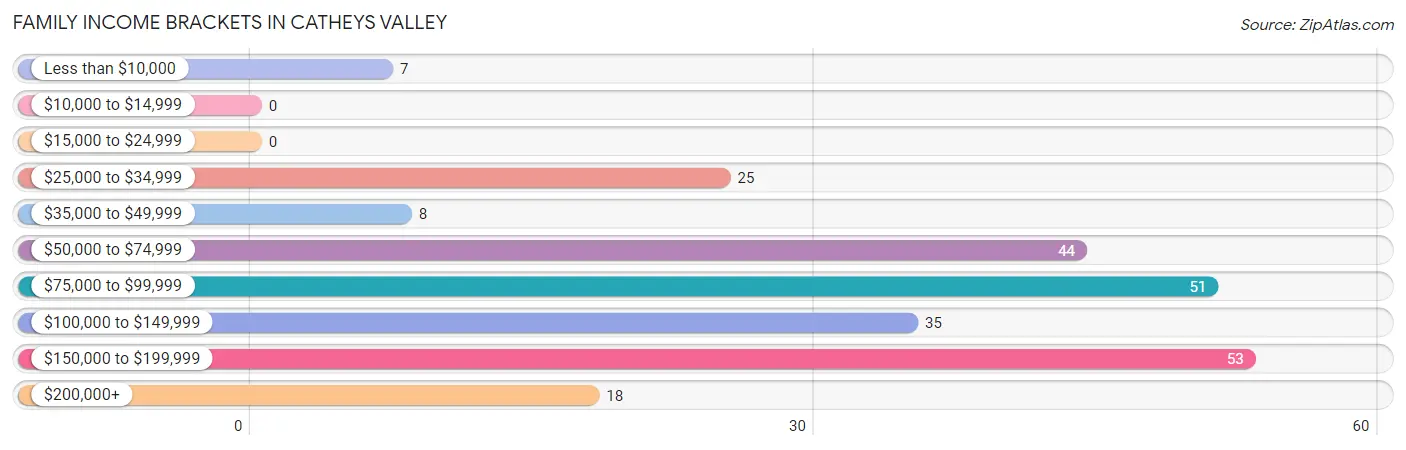
| Income Bracket | # Families | % Families |
| Less than $10,000 | 7 | 2.9% |
| $10,000 to $14,999 | 0 | 0.0% |
| $15,000 to $24,999 | 0 | 0.0% |
| $25,000 to $34,999 | 25 | 10.4% |
| $35,000 to $49,999 | 8 | 3.3% |
| $50,000 to $74,999 | 44 | 18.3% |
| $75,000 to $99,999 | 51 | 21.2% |
| $100,000 to $149,999 | 35 | 14.5% |
| $150,000 to $199,999 | 53 | 22.0% |
| $200,000+ | 18 | 7.5% |
Family Income by Famaliy Size in Catheys Valley
3-person families (65 | 27.0%) account for the highest median family income in Catheys Valley with $158,110 per family, while 3-person families (65 | 27.0%) have the highest median income of $52,703 per family member.
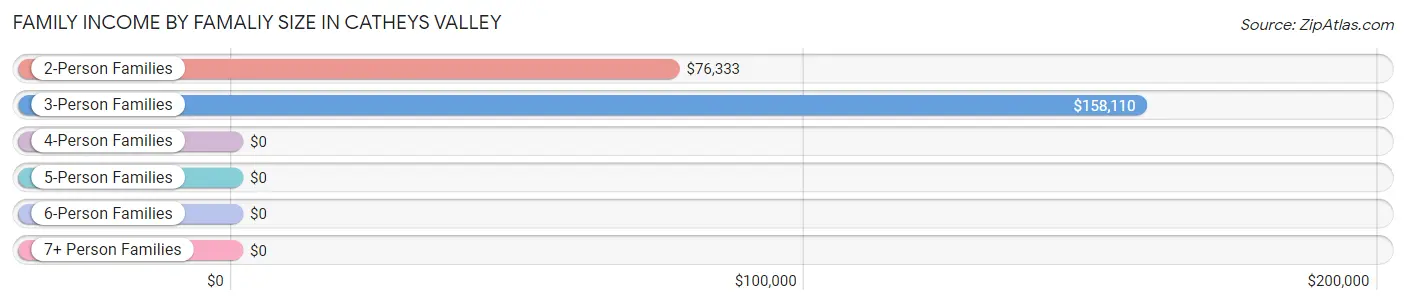
| Income Bracket | # Families | Median Income |
| 2-Person Families | 136 (56.4%) | $76,333 |
| 3-Person Families | 65 (27.0%) | $158,110 |
| 4-Person Families | 40 (16.6%) | $0 |
| 5-Person Families | 0 (0.0%) | $0 |
| 6-Person Families | 0 (0.0%) | $0 |
| 7+ Person Families | 0 (0.0%) | $0 |
| Total | 241 (100.0%) | $77,028 |
Family Income by Number of Earners in Catheys Valley
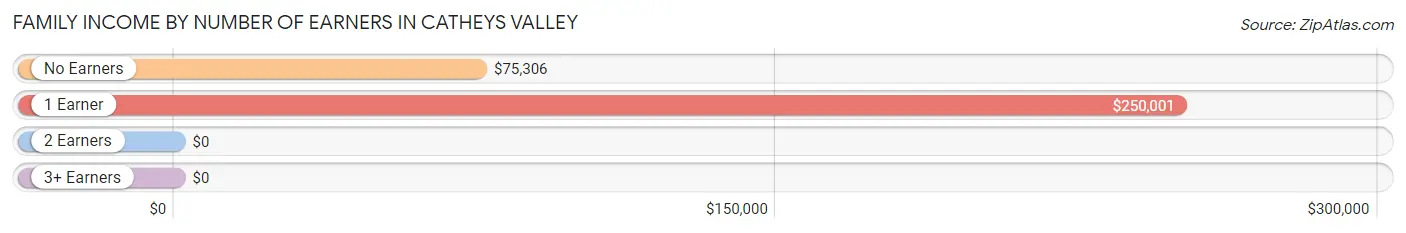
| Number of Earners | # Families | Median Income |
| No Earners | 99 (41.1%) | $75,306 |
| 1 Earner | 23 (9.5%) | $250,001 |
| 2 Earners | 76 (31.5%) | $0 |
| 3+ Earners | 43 (17.8%) | $0 |
| Total | 241 (100.0%) | $77,028 |
Household Income in Catheys Valley
Household Income Brackets in Catheys Valley
With 72 households falling in the category, the $10,000 to $14,999 income range is the most frequent in Catheys Valley, accounting for 19.7% of all households.
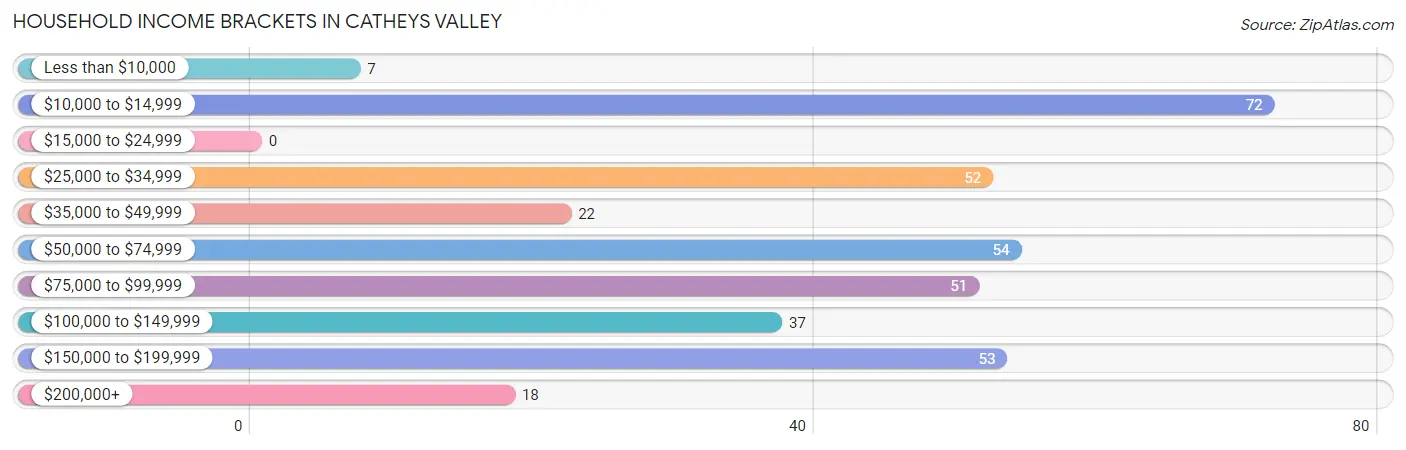
| Income Bracket | # Households | % Households |
| Less than $10,000 | 7 | 1.9% |
| $10,000 to $14,999 | 72 | 19.7% |
| $15,000 to $24,999 | 0 | 0.0% |
| $25,000 to $34,999 | 52 | 14.2% |
| $35,000 to $49,999 | 22 | 6.0% |
| $50,000 to $74,999 | 54 | 14.8% |
| $75,000 to $99,999 | 51 | 13.9% |
| $100,000 to $149,999 | 37 | 10.1% |
| $150,000 to $199,999 | 53 | 14.5% |
| $200,000+ | 18 | 4.9% |
Household Income by Householder Age in Catheys Valley
The median household income in Catheys Valley is $63,750, with the highest median household income of $75,167 found in the 65+ years age bracket for the primary householder. A total of 146 households (39.9%) fall into this category.
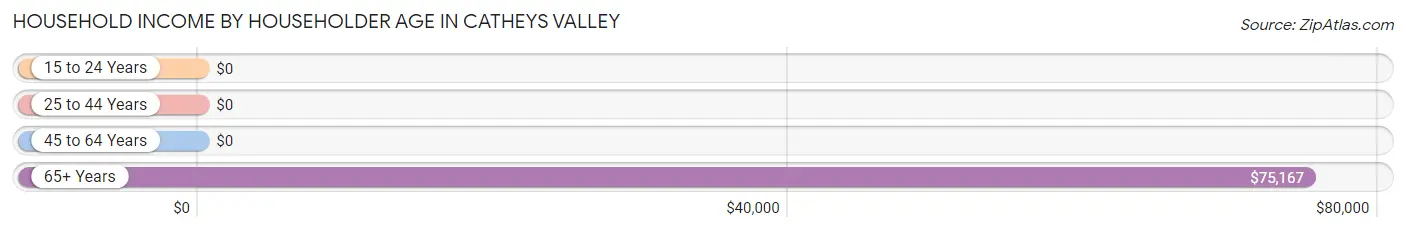
| Income Bracket | # Households | Median Income |
| 15 to 24 Years | 0 (0.0%) | $0 |
| 25 to 44 Years | 53 (14.5%) | $0 |
| 45 to 64 Years | 167 (45.6%) | $0 |
| 65+ Years | 146 (39.9%) | $75,167 |
| Total | 366 (100.0%) | $63,750 |
Poverty in Catheys Valley
Income Below Poverty by Sex and Age in Catheys Valley
With 20.3% poverty level for males and 14.2% for females among the residents of Catheys Valley, 55 to 64 year old males and 55 to 64 year old females are the most vulnerable to poverty, with 67 males (40.6%) and 44 females (40.0%) in their respective age groups living below the poverty level.
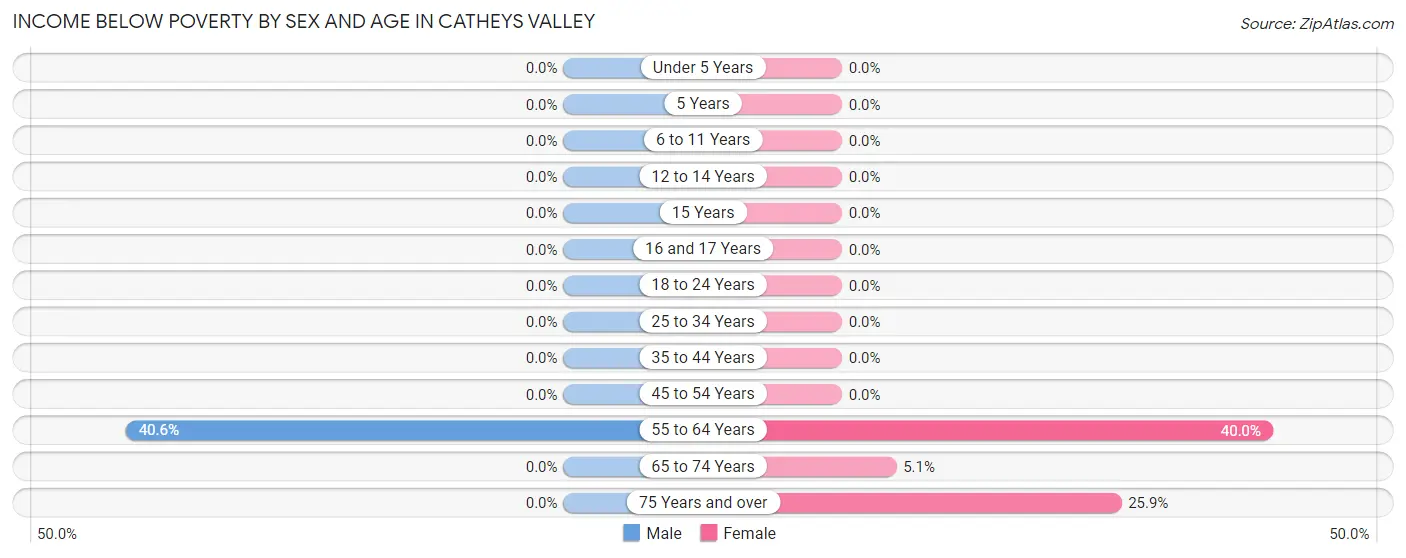
| Age Bracket | Male | Female |
| Under 5 Years | 0 (0.0%) | 0 (0.0%) |
| 5 Years | 0 (0.0%) | 0 (0.0%) |
| 6 to 11 Years | 0 (0.0%) | 0 (0.0%) |
| 12 to 14 Years | 0 (0.0%) | 0 (0.0%) |
| 15 Years | 0 (0.0%) | 0 (0.0%) |
| 16 and 17 Years | 0 (0.0%) | 0 (0.0%) |
| 18 to 24 Years | 0 (0.0%) | 0 (0.0%) |
| 25 to 34 Years | 0 (0.0%) | 0 (0.0%) |
| 35 to 44 Years | 0 (0.0%) | 0 (0.0%) |
| 45 to 54 Years | 0 (0.0%) | 0 (0.0%) |
| 55 to 64 Years | 67 (40.6%) | 44 (40.0%) |
| 65 to 74 Years | 0 (0.0%) | 5 (5.1%) |
| 75 Years and over | 0 (0.0%) | 7 (25.9%) |
| Total | 67 (20.3%) | 56 (14.2%) |
Income Above Poverty by Sex and Age in Catheys Valley
According to the poverty statistics in Catheys Valley, males aged 6 to 11 years and females aged under 5 years are the age groups that are most secure financially, with 100.0% of males and 100.0% of females in these age groups living above the poverty line.
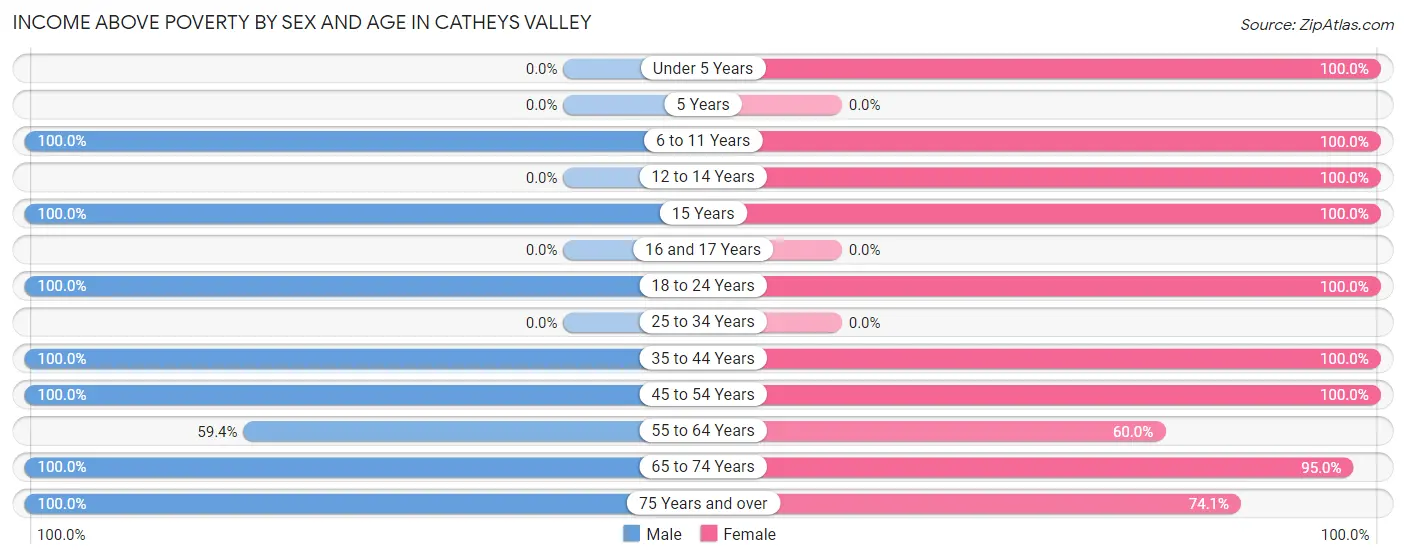
| Age Bracket | Male | Female |
| Under 5 Years | 0 (0.0%) | 34 (100.0%) |
| 5 Years | 0 (0.0%) | 0 (0.0%) |
| 6 to 11 Years | 14 (100.0%) | 7 (100.0%) |
| 12 to 14 Years | 0 (0.0%) | 5 (100.0%) |
| 15 Years | 4 (100.0%) | 12 (100.0%) |
| 16 and 17 Years | 0 (0.0%) | 0 (0.0%) |
| 18 to 24 Years | 5 (100.0%) | 10 (100.0%) |
| 25 to 34 Years | 0 (0.0%) | 0 (0.0%) |
| 35 to 44 Years | 9 (100.0%) | 60 (100.0%) |
| 45 to 54 Years | 27 (100.0%) | 29 (100.0%) |
| 55 to 64 Years | 98 (59.4%) | 66 (60.0%) |
| 65 to 74 Years | 19 (100.0%) | 94 (95.0%) |
| 75 Years and over | 87 (100.0%) | 20 (74.1%) |
| Total | 263 (79.7%) | 337 (85.8%) |
Income Below Poverty Among Married-Couple Families in Catheys Valley
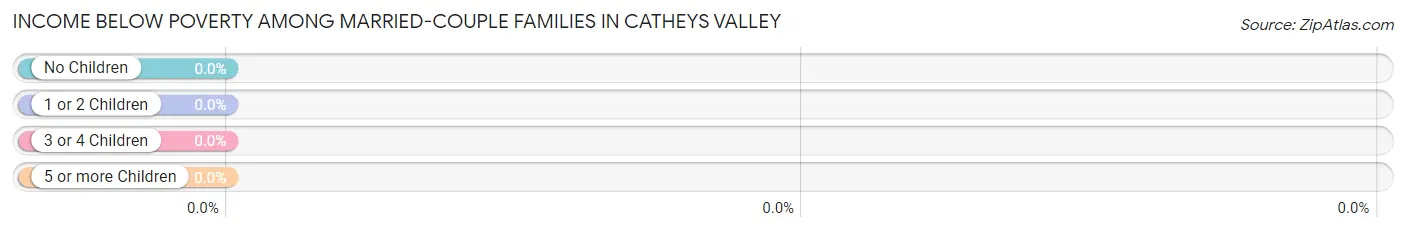
| Children | Above Poverty | Below Poverty |
| No Children | 188 (100.0%) | 0 (0.0%) |
| 1 or 2 Children | 46 (100.0%) | 0 (0.0%) |
| 3 or 4 Children | 0 (0.0%) | 0 (0.0%) |
| 5 or more Children | 0 (0.0%) | 0 (0.0%) |
| Total | 234 (100.0%) | 0 (0.0%) |
Income Below Poverty Among Single-Parent Households in Catheys Valley
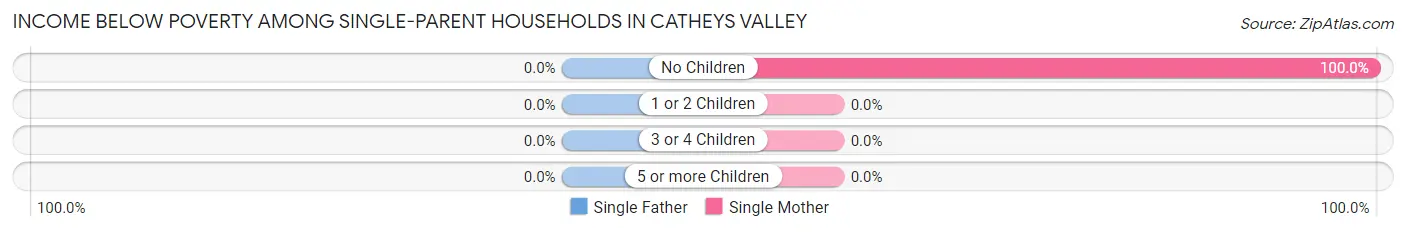
| Children | Single Father | Single Mother |
| No Children | 0 (0.0%) | 7 (100.0%) |
| 1 or 2 Children | 0 (0.0%) | 0 (0.0%) |
| 3 or 4 Children | 0 (0.0%) | 0 (0.0%) |
| 5 or more Children | 0 (0.0%) | 0 (0.0%) |
| Total | 0 (0.0%) | 7 (100.0%) |
Income Below Poverty Among Married-Couple vs Single-Parent Households in Catheys Valley
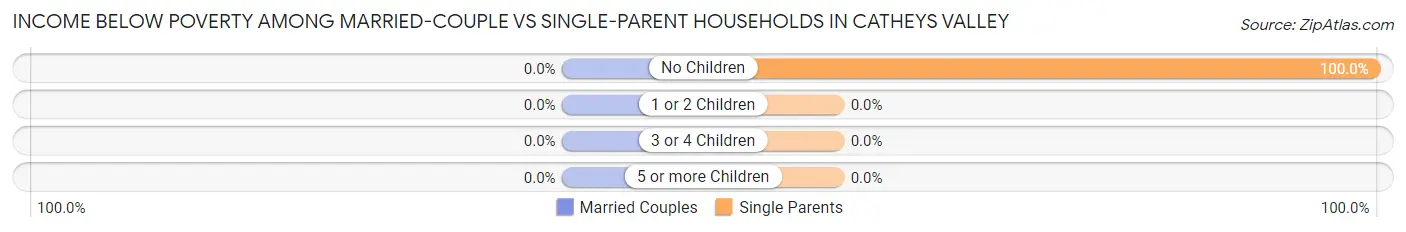
| Children | Married-Couple Families | Single-Parent Households |
| No Children | 0 (0.0%) | 7 (100.0%) |
| 1 or 2 Children | 0 (0.0%) | 0 (0.0%) |
| 3 or 4 Children | 0 (0.0%) | 0 (0.0%) |
| 5 or more Children | 0 (0.0%) | 0 (0.0%) |
| Total | 0 (0.0%) | 7 (100.0%) |
Race in Catheys Valley
The most populous races in Catheys Valley are White / Caucasian (622 | 86.0%), Hispanic or Latino (148 | 20.5%), and Some other Race (94 | 13.0%).
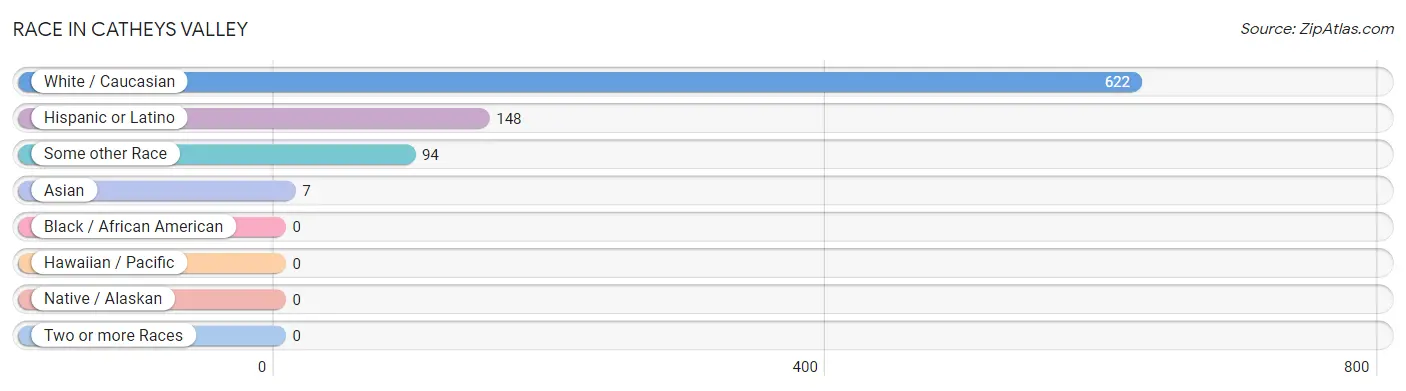
| Race | # Population | % Population |
| Asian | 7 | 1.0% |
| Black / African American | 0 | 0.0% |
| Hawaiian / Pacific | 0 | 0.0% |
| Hispanic or Latino | 148 | 20.5% |
| Native / Alaskan | 0 | 0.0% |
| White / Caucasian | 622 | 86.0% |
| Two or more Races | 0 | 0.0% |
| Some other Race | 94 | 13.0% |
| Total | 723 | 100.0% |
Ancestry in Catheys Valley
The most populous ancestries reported in Catheys Valley are Mexican (101 | 14.0%), Portuguese (72 | 10.0%), German (71 | 9.8%), English (64 | 8.8%), and Colombian (45 | 6.2%), together accounting for 48.8% of all Catheys Valley residents.
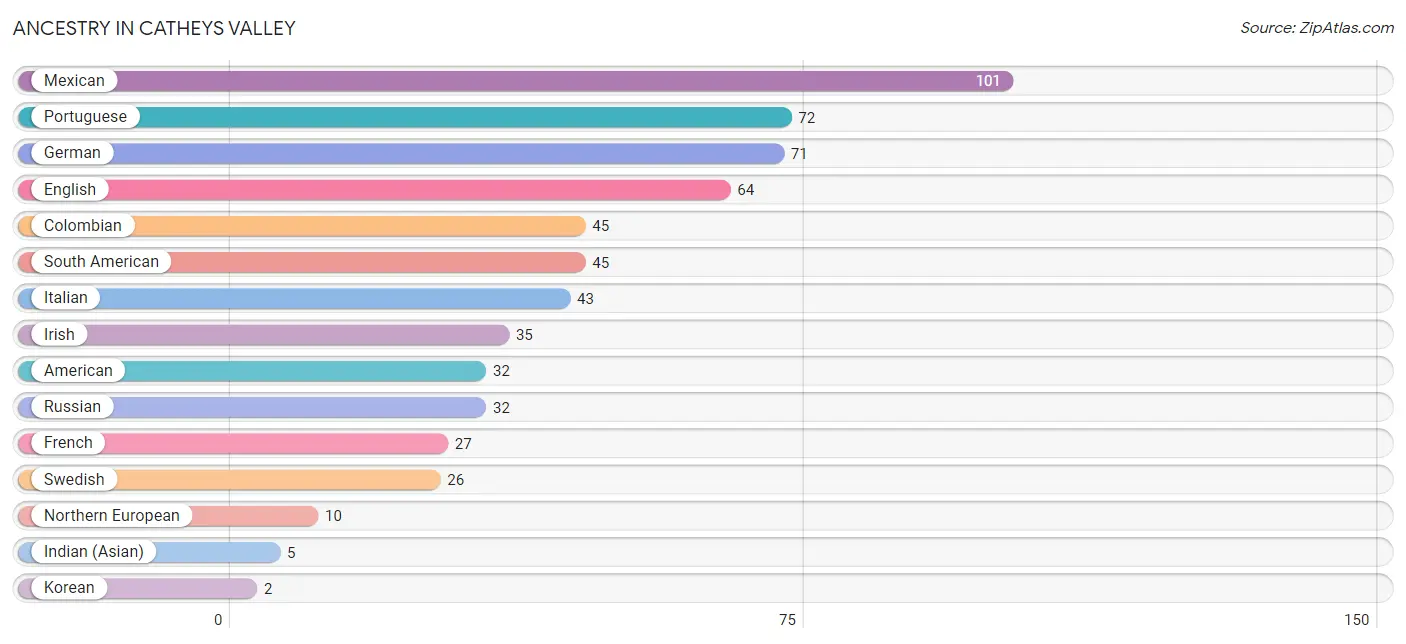
| Ancestry | # Population | % Population |
| American | 32 | 4.4% |
| Colombian | 45 | 6.2% |
| English | 64 | 8.8% |
| French | 27 | 3.7% |
| German | 71 | 9.8% |
| Indian (Asian) | 5 | 0.7% |
| Irish | 35 | 4.8% |
| Italian | 43 | 5.9% |
| Korean | 2 | 0.3% |
| Mexican | 101 | 14.0% |
| Northern European | 10 | 1.4% |
| Portuguese | 72 | 10.0% |
| Russian | 32 | 4.4% |
| South American | 45 | 6.2% |
| Swedish | 26 | 3.6% | View All 15 Rows |
Immigrants in Catheys Valley
The most numerous immigrant groups reported in Catheys Valley came from Latin America (68 | 9.4%), Peru (45 | 6.2%), South America (45 | 6.2%), Central America (23 | 3.2%), and Mexico (23 | 3.2%), together accounting for 28.2% of all Catheys Valley residents.
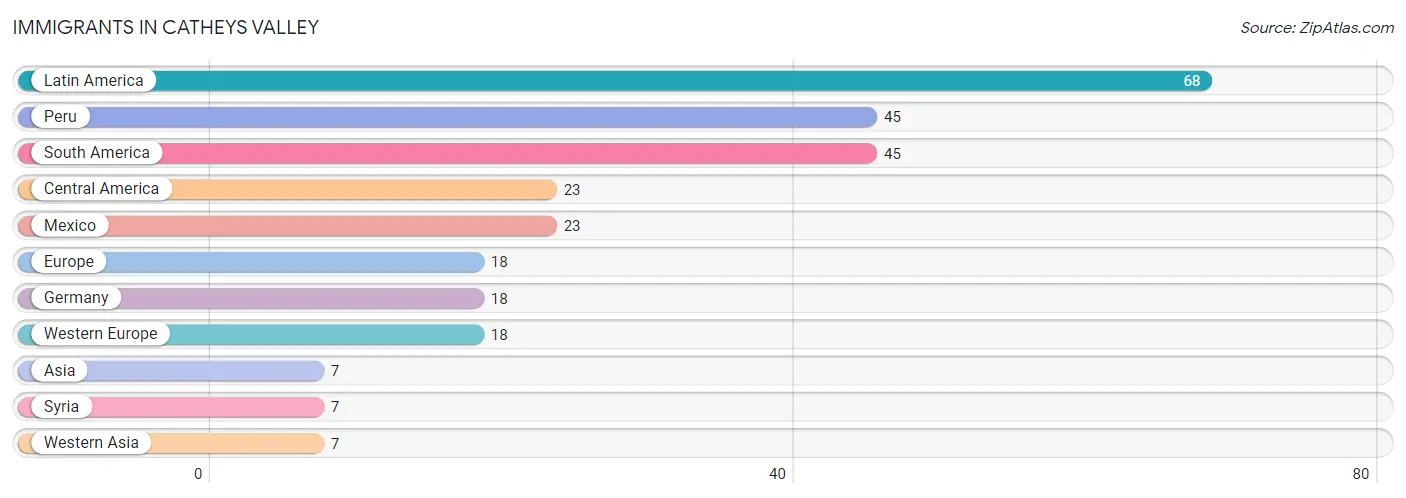
| Immigration Origin | # Population | % Population |
| Asia | 7 | 1.0% |
| Central America | 23 | 3.2% |
| Europe | 18 | 2.5% |
| Germany | 18 | 2.5% |
| Latin America | 68 | 9.4% |
| Mexico | 23 | 3.2% |
| Peru | 45 | 6.2% |
| South America | 45 | 6.2% |
| Syria | 7 | 1.0% |
| Western Asia | 7 | 1.0% |
| Western Europe | 18 | 2.5% | View All 11 Rows |
Sex and Age in Catheys Valley
Sex and Age in Catheys Valley
The most populous age groups in Catheys Valley are 60 to 64 Years (123 | 37.3%) for men and 60 to 64 Years (94 | 23.9%) for women.
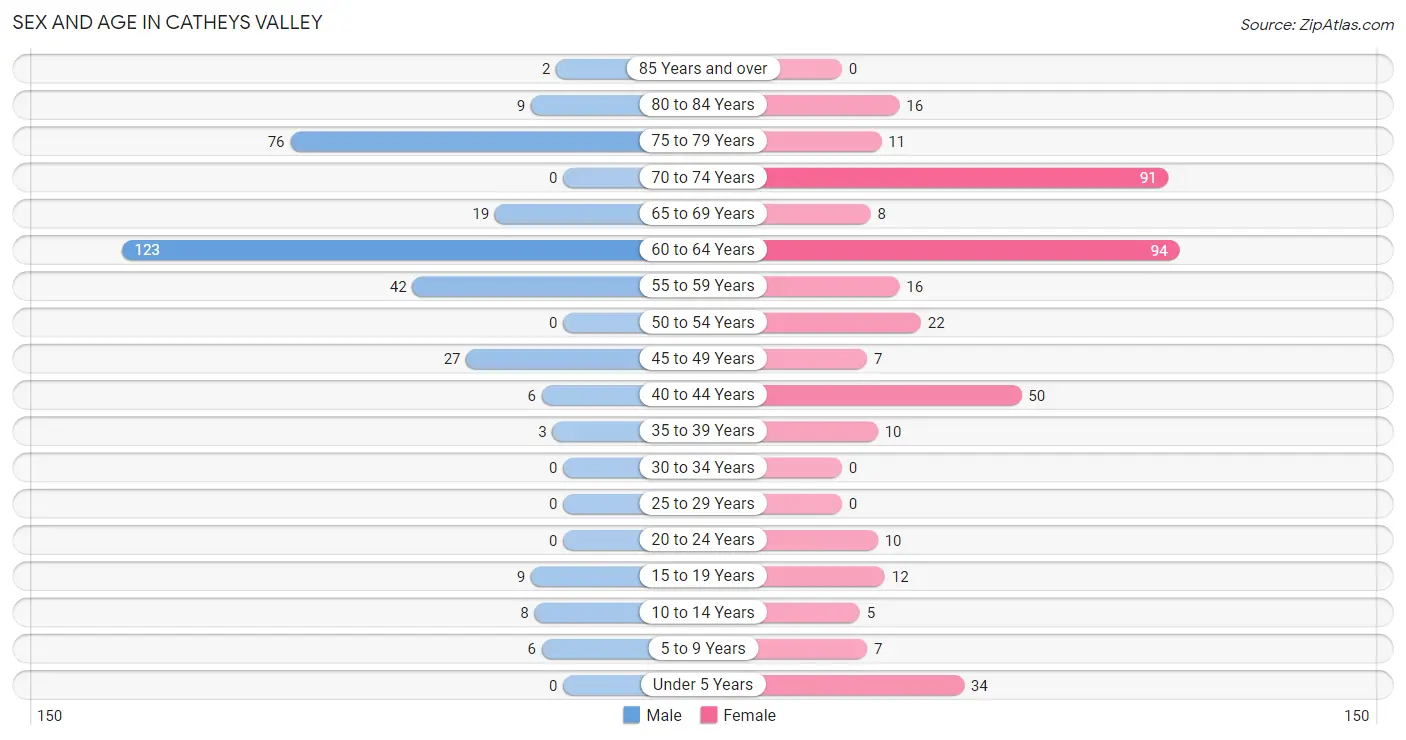
| Age Bracket | Male | Female |
| Under 5 Years | 0 (0.0%) | 34 (8.6%) |
| 5 to 9 Years | 6 (1.8%) | 7 (1.8%) |
| 10 to 14 Years | 8 (2.4%) | 5 (1.3%) |
| 15 to 19 Years | 9 (2.7%) | 12 (3.0%) |
| 20 to 24 Years | 0 (0.0%) | 10 (2.5%) |
| 25 to 29 Years | 0 (0.0%) | 0 (0.0%) |
| 30 to 34 Years | 0 (0.0%) | 0 (0.0%) |
| 35 to 39 Years | 3 (0.9%) | 10 (2.5%) |
| 40 to 44 Years | 6 (1.8%) | 50 (12.7%) |
| 45 to 49 Years | 27 (8.2%) | 7 (1.8%) |
| 50 to 54 Years | 0 (0.0%) | 22 (5.6%) |
| 55 to 59 Years | 42 (12.7%) | 16 (4.1%) |
| 60 to 64 Years | 123 (37.3%) | 94 (23.9%) |
| 65 to 69 Years | 19 (5.8%) | 8 (2.0%) |
| 70 to 74 Years | 0 (0.0%) | 91 (23.2%) |
| 75 to 79 Years | 76 (23.0%) | 11 (2.8%) |
| 80 to 84 Years | 9 (2.7%) | 16 (4.1%) |
| 85 Years and over | 2 (0.6%) | 0 (0.0%) |
| Total | 330 (100.0%) | 393 (100.0%) |
Families and Households in Catheys Valley
Median Family Size in Catheys Valley
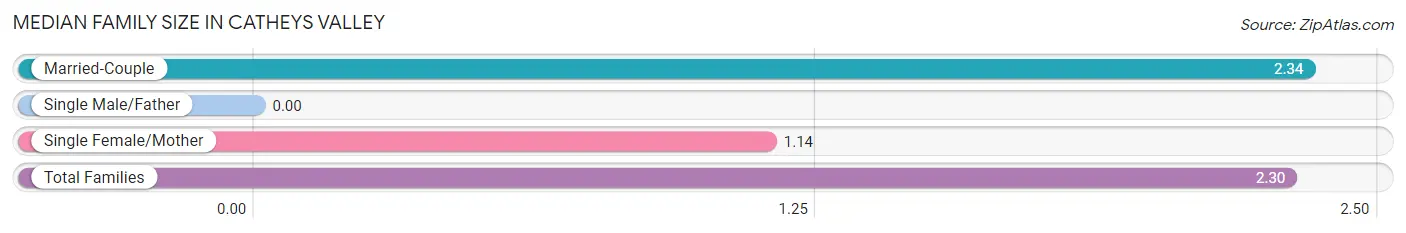
| Family Type | # Families | Family Size |
| Married-Couple | 234 (97.1%) | 2.34 |
| Single Male/Father | 0 (0.0%) | - |
| Single Female/Mother | 7 (2.9%) | 1.14 |
| Total Families | 241 (100.0%) | 2.30 |
Median Household Size in Catheys Valley
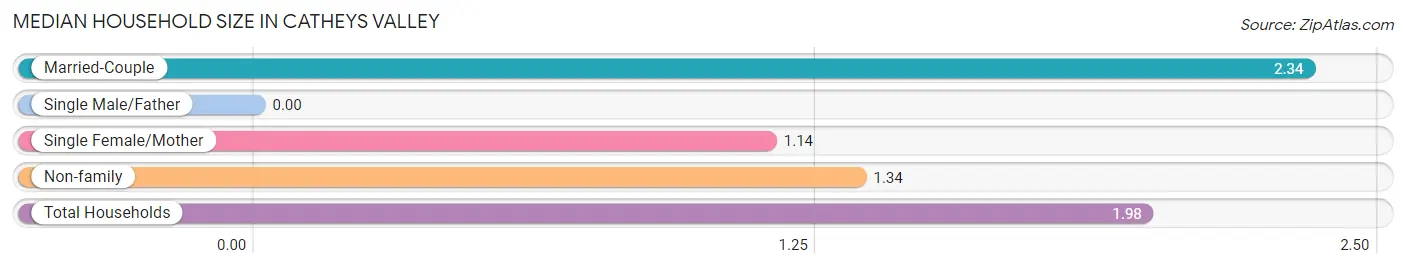
| Household Type | # Households | Household Size |
| Married-Couple | 234 (63.9%) | 2.34 |
| Single Male/Father | 0 (0.0%) | - |
| Single Female/Mother | 7 (1.9%) | 1.14 |
| Non-family | 125 (34.2%) | 1.34 |
| Total Households | 366 (100.0%) | 1.98 |
Household Size by Marriage Status in Catheys Valley
Out of a total of 366 households in Catheys Valley, 241 (65.8%) are family households, while 125 (34.2%) are nonfamily households. The most numerous type of family households are 2-person households, comprising 136, and the most common type of nonfamily households are 2-person households, comprising 67.
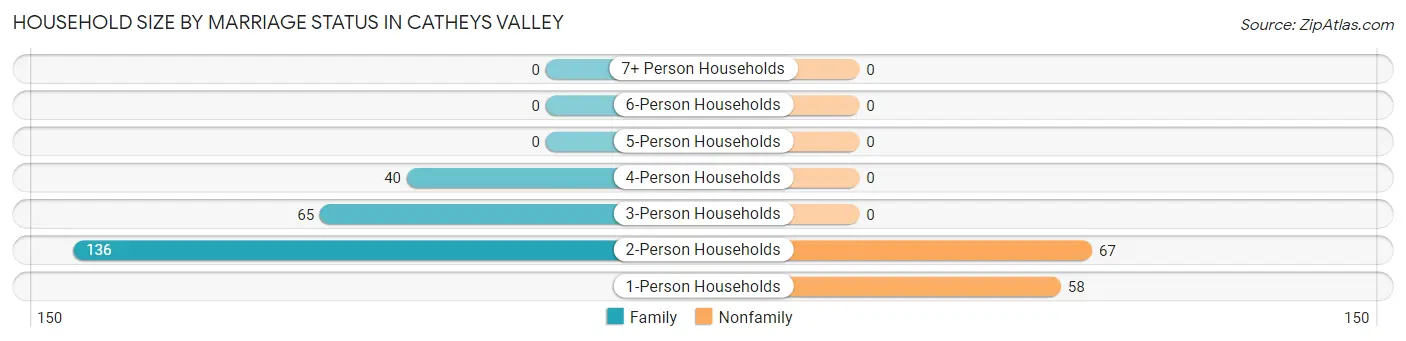
| Household Size | Family Households | Nonfamily Households |
| 1-Person Households | - | 58 (15.9%) |
| 2-Person Households | 136 (37.2%) | 67 (18.3%) |
| 3-Person Households | 65 (17.8%) | 0 (0.0%) |
| 4-Person Households | 40 (10.9%) | 0 (0.0%) |
| 5-Person Households | 0 (0.0%) | 0 (0.0%) |
| 6-Person Households | 0 (0.0%) | 0 (0.0%) |
| 7+ Person Households | 0 (0.0%) | 0 (0.0%) |
| Total | 241 (65.8%) | 125 (34.2%) |
Female Fertility in Catheys Valley
Fertility by Age in Catheys Valley
| Age Bracket | Women with Births | Births / 1,000 Women |
| 15 to 19 years | 0 (0.0%) | 0.0 |
| 20 to 34 years | 0 (0.0%) | 0.0 |
| 35 to 50 years | 0 (0.0%) | 0.0 |
| Total | 0 (0.0%) | 0.0 |
Fertility by Age by Marriage Status in Catheys Valley
| Age Bracket | Married | Unmarried |
| 15 to 19 years | 0 (0.0%) | 0 (0.0%) |
| 20 to 34 years | 0 (0.0%) | 0 (0.0%) |
| 35 to 50 years | 0 (0.0%) | 0 (0.0%) |
| Total | 0 (0.0%) | 0 (0.0%) |
Fertility by Education in Catheys Valley
| Educational Attainment | Women with Births | Births / 1,000 Women |
| Less than High School | 0 (0.0%) | 0.0 |
| High School Diploma | 0 (0.0%) | 0.0 |
| College or Associate's Degree | 0 (0.0%) | 0.0 |
| Bachelor's Degree | 0 (0.0%) | 0.0 |
| Graduate Degree | 0 (0.0%) | 0.0 |
| Total | 0 (0.0%) | 0.0 |
Fertility by Education by Marriage Status in Catheys Valley
| Educational Attainment | Married | Unmarried |
| Less than High School | 0 (0.0%) | 0 (0.0%) |
| High School Diploma | 0 (0.0%) | 0 (0.0%) |
| College or Associate's Degree | 0 (0.0%) | 0 (0.0%) |
| Bachelor's Degree | 0 (0.0%) | 0 (0.0%) |
| Graduate Degree | 0 (0.0%) | 0 (0.0%) |
| Total | 0 (0.0%) | 0 (0.0%) |
Employment Characteristics in Catheys Valley
Employment by Class of Employer in Catheys Valley
Among the 222 employed individuals in Catheys Valley, self-employed (not incorporated) (48 | 21.6%), local government employees (45 | 20.3%), and private company employees (43 | 19.4%) make up the most common classes of employment.
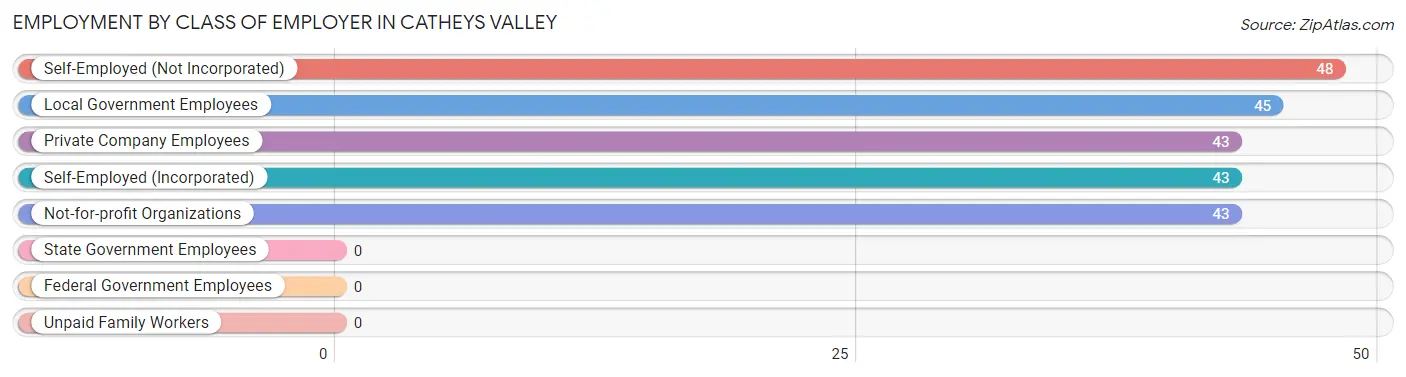
| Employer Class | # Employees | % Employees |
| Private Company Employees | 43 | 19.4% |
| Self-Employed (Incorporated) | 43 | 19.4% |
| Self-Employed (Not Incorporated) | 48 | 21.6% |
| Not-for-profit Organizations | 43 | 19.4% |
| Local Government Employees | 45 | 20.3% |
| State Government Employees | 0 | 0.0% |
| Federal Government Employees | 0 | 0.0% |
| Unpaid Family Workers | 0 | 0.0% |
| Total | 222 | 100.0% |
Employment Status by Age in Catheys Valley
According to the labor force statistics for Catheys Valley, out of the total population over 16 years of age (647), 35.9% or 232 individuals are in the labor force, with 4.3% or 10 of them unemployed. The age group with the highest labor force participation rate is 16 to 19 years, with 100.0% or 5 individuals in the labor force. Within the labor force, the 20 to 24 years age range has the highest percentage of unemployed individuals, with 100.0% or 10 of them being unemployed.
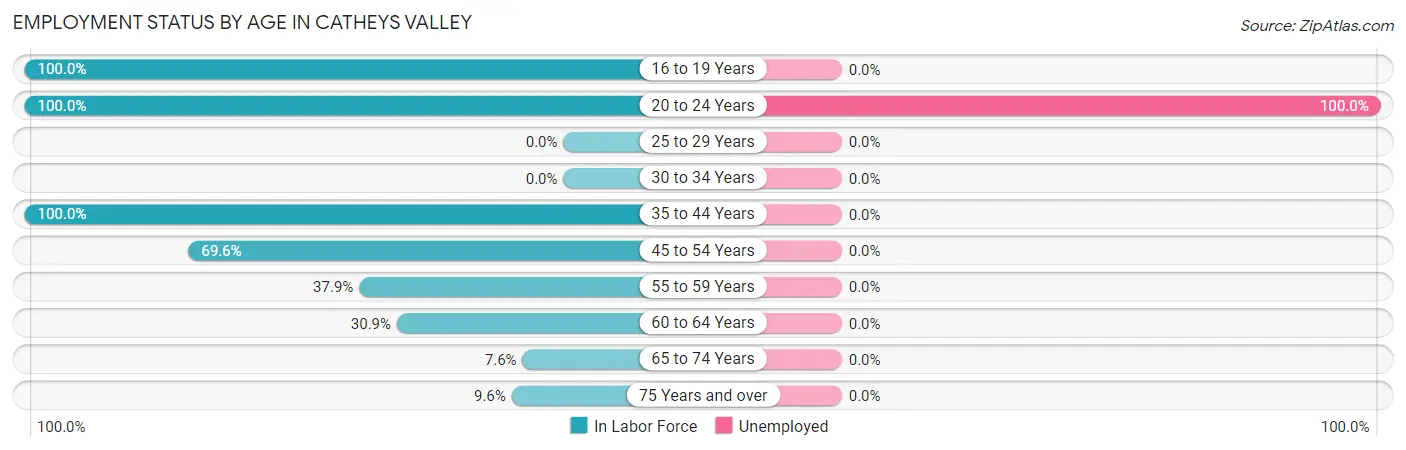
| Age Bracket | In Labor Force | Unemployed |
| 16 to 19 Years | 5 (100.0%) | 0 (0.0%) |
| 20 to 24 Years | 10 (100.0%) | 10 (100.0%) |
| 25 to 29 Years | 0 (0.0%) | 0 (0.0%) |
| 30 to 34 Years | 0 (0.0%) | 0 (0.0%) |
| 35 to 44 Years | 69 (100.0%) | 0 (0.0%) |
| 45 to 54 Years | 39 (69.6%) | 0 (0.0%) |
| 55 to 59 Years | 22 (37.9%) | 0 (0.0%) |
| 60 to 64 Years | 67 (30.9%) | 0 (0.0%) |
| 65 to 74 Years | 9 (7.6%) | 0 (0.0%) |
| 75 Years and over | 11 (9.6%) | 0 (0.0%) |
| Total | 232 (35.9%) | 10 (4.3%) |
Employment Status by Educational Attainment in Catheys Valley
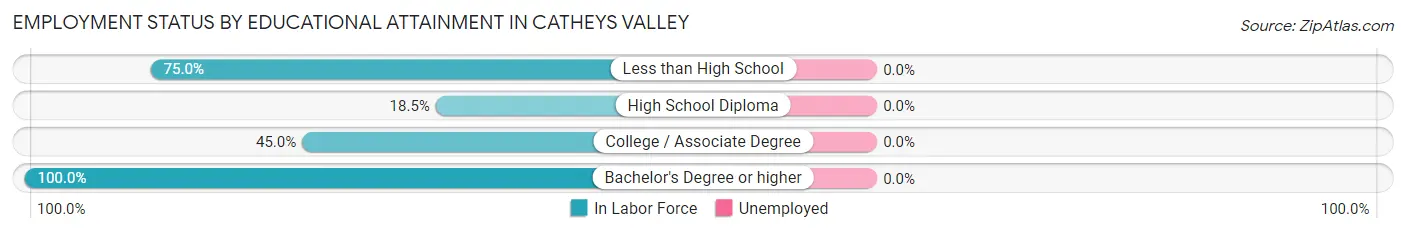
| Educational Attainment | In Labor Force | Unemployed |
| Less than High School | 3 (75.0%) | 0 (0.0%) |
| High School Diploma | 32 (18.5%) | 0 (0.0%) |
| College / Associate Degree | 50 (45.0%) | 0 (0.0%) |
| Bachelor's Degree or higher | 112 (100.0%) | 0 (0.0%) |
| Total | 197 (49.3%) | 0 (0.0%) |
Employment Occupations by Sex in Catheys Valley
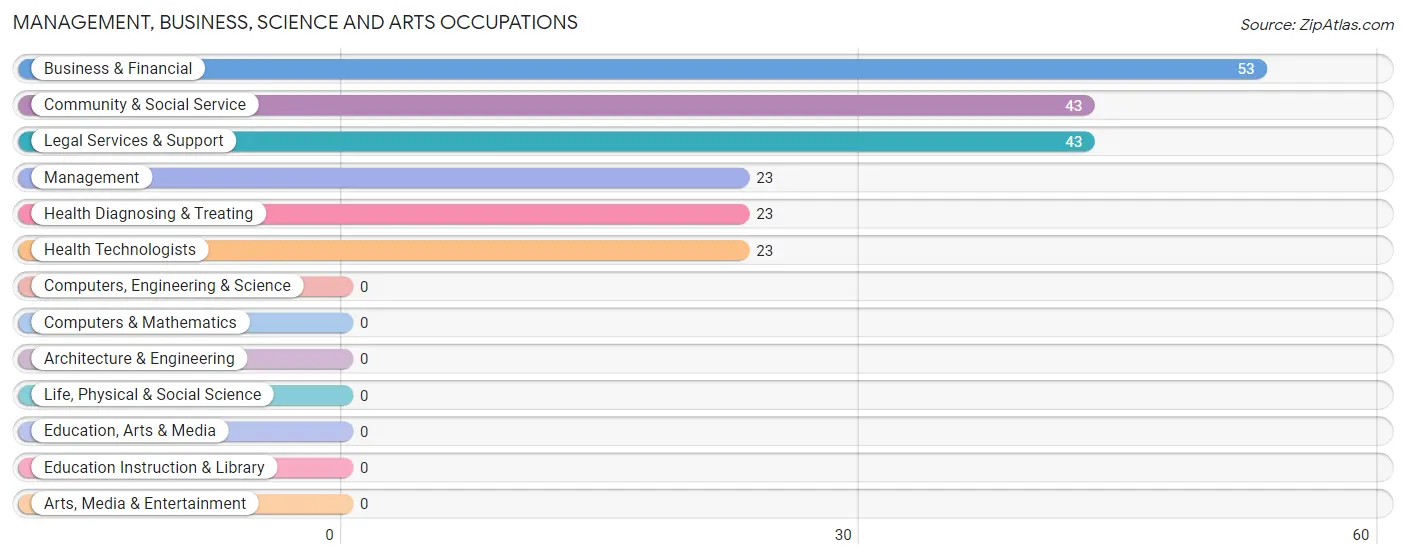
Management, Business, Science and Arts Occupations
The most common Management, Business, Science and Arts occupations in Catheys Valley are Business & Financial (53 | 23.9%), Community & Social Service (43 | 19.4%), Legal Services & Support (43 | 19.4%), Management (23 | 10.4%), and Health Diagnosing & Treating (23 | 10.4%).
Management, Business, Science and Arts Occupations by Sex
Within the Management, Business, Science and Arts occupations in Catheys Valley, the most male-oriented occupations are Management (100.0%), and Business & Financial (67.9%), while the most female-oriented occupations are Community & Social Service (100.0%), Legal Services & Support (100.0%), and Health Diagnosing & Treating (100.0%).
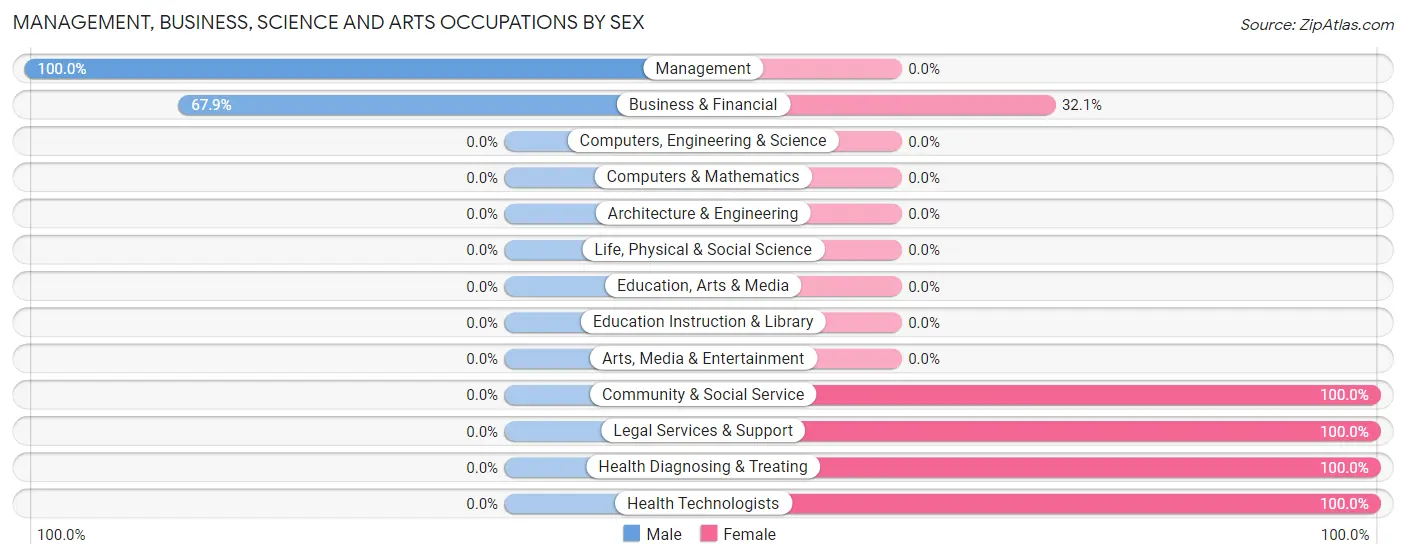
| Occupation | Male | Female |
| Management | 23 (100.0%) | 0 (0.0%) |
| Business & Financial | 36 (67.9%) | 17 (32.1%) |
| Computers, Engineering & Science | 0 (0.0%) | 0 (0.0%) |
| Computers & Mathematics | 0 (0.0%) | 0 (0.0%) |
| Architecture & Engineering | 0 (0.0%) | 0 (0.0%) |
| Life, Physical & Social Science | 0 (0.0%) | 0 (0.0%) |
| Community & Social Service | 0 (0.0%) | 43 (100.0%) |
| Education, Arts & Media | 0 (0.0%) | 0 (0.0%) |
| Legal Services & Support | 0 (0.0%) | 43 (100.0%) |
| Education Instruction & Library | 0 (0.0%) | 0 (0.0%) |
| Arts, Media & Entertainment | 0 (0.0%) | 0 (0.0%) |
| Health Diagnosing & Treating | 0 (0.0%) | 23 (100.0%) |
| Health Technologists | 0 (0.0%) | 23 (100.0%) |
| Total (Category) | 59 (41.5%) | 83 (58.5%) |
| Total (Overall) | 136 (61.3%) | 86 (38.7%) |
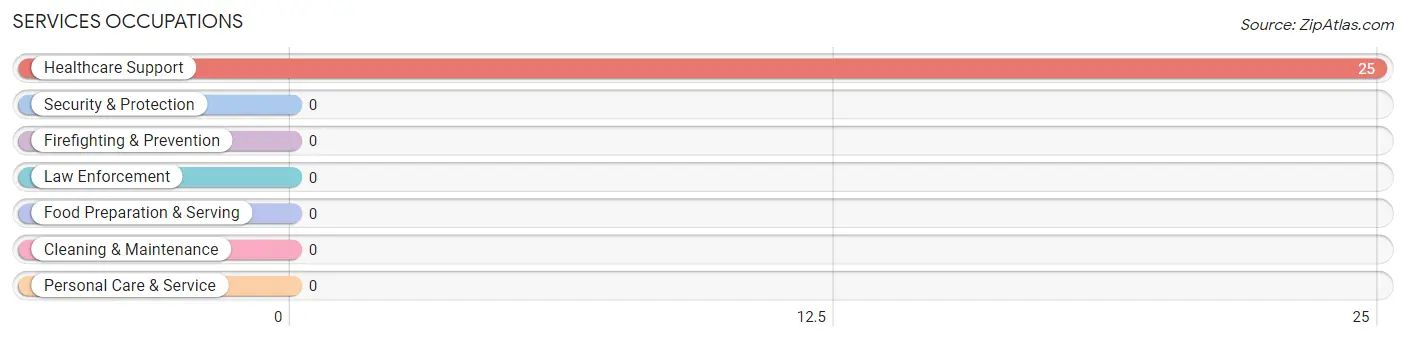
Services Occupations
The most common Services occupations in Catheys Valley are , and Healthcare Support (25 | 11.3%).
Services Occupations by Sex
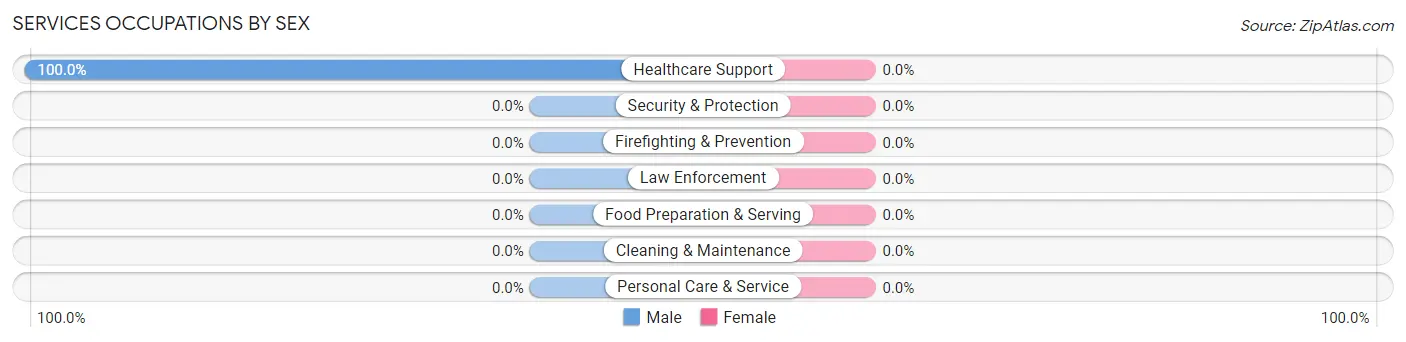
| Occupation | Male | Female |
| Healthcare Support | 25 (100.0%) | 0 (0.0%) |
| Security & Protection | 0 (0.0%) | 0 (0.0%) |
| Firefighting & Prevention | 0 (0.0%) | 0 (0.0%) |
| Law Enforcement | 0 (0.0%) | 0 (0.0%) |
| Food Preparation & Serving | 0 (0.0%) | 0 (0.0%) |
| Cleaning & Maintenance | 0 (0.0%) | 0 (0.0%) |
| Personal Care & Service | 0 (0.0%) | 0 (0.0%) |
| Total (Category) | 25 (100.0%) | 0 (0.0%) |
| Total (Overall) | 136 (61.3%) | 86 (38.7%) |
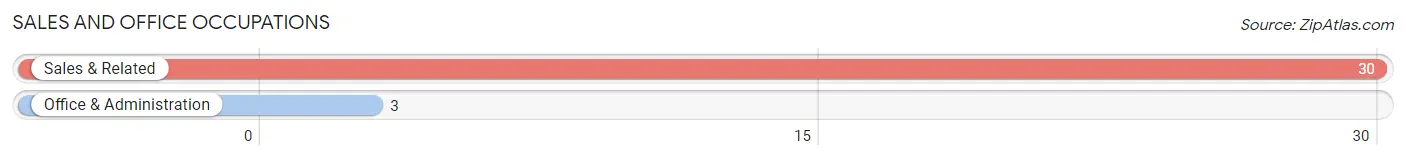
Sales and Office Occupations
The most common Sales and Office occupations in Catheys Valley are Sales & Related (30 | 13.5%), and Office & Administration (3 | 1.3%).
Sales and Office Occupations by Sex
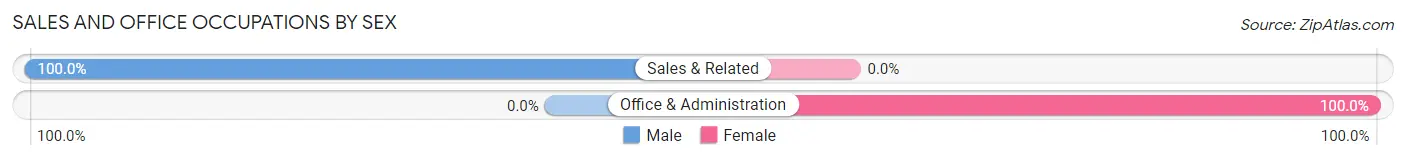
| Occupation | Male | Female |
| Sales & Related | 30 (100.0%) | 0 (0.0%) |
| Office & Administration | 0 (0.0%) | 3 (100.0%) |
| Total (Category) | 30 (90.9%) | 3 (9.1%) |
| Total (Overall) | 136 (61.3%) | 86 (38.7%) |
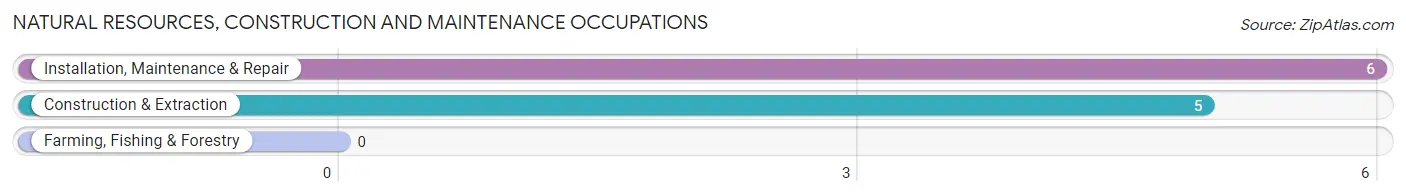
Natural Resources, Construction and Maintenance Occupations
The most common Natural Resources, Construction and Maintenance occupations in Catheys Valley are Installation, Maintenance & Repair (6 | 2.7%), and Construction & Extraction (5 | 2.2%).
Natural Resources, Construction and Maintenance Occupations by Sex
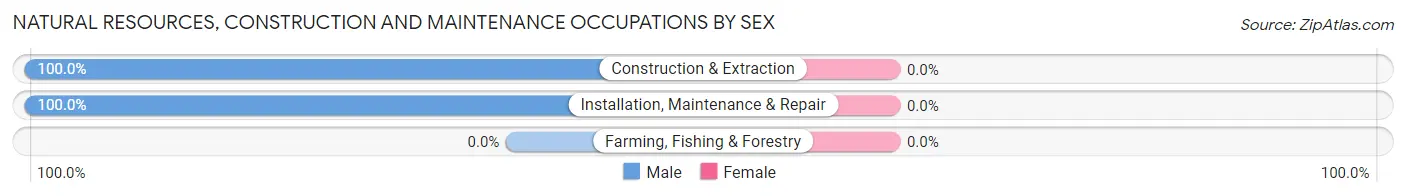
| Occupation | Male | Female |
| Farming, Fishing & Forestry | 0 (0.0%) | 0 (0.0%) |
| Construction & Extraction | 5 (100.0%) | 0 (0.0%) |
| Installation, Maintenance & Repair | 6 (100.0%) | 0 (0.0%) |
| Total (Category) | 11 (100.0%) | 0 (0.0%) |
| Total (Overall) | 136 (61.3%) | 86 (38.7%) |
Production, Transportation and Moving Occupations
The most common Production, Transportation and Moving occupations in Catheys Valley are , and Material Moving (11 | 5.0%).
Production, Transportation and Moving Occupations by Sex
| Occupation | Male | Female |
| Production | 0 (0.0%) | 0 (0.0%) |
| Transportation | 0 (0.0%) | 0 (0.0%) |
| Material Moving | 11 (100.0%) | 0 (0.0%) |
| Total (Category) | 11 (100.0%) | 0 (0.0%) |
| Total (Overall) | 136 (61.3%) | 86 (38.7%) |
Employment Industries by Sex in Catheys Valley
Employment Industries in Catheys Valley
The major employment industries in Catheys Valley include Health Care & Social Assistance (92 | 41.4%), Arts, Entertainment & Recreation (32 | 14.4%), Retail Trade (30 | 13.5%), Public Administration (23 | 10.4%), and Professional & Scientific (18 | 8.1%).
Employment Industries by Sex in Catheys Valley
The Catheys Valley industries that see more men than women are Construction (100.0%), Manufacturing (100.0%), and Retail Trade (100.0%), whereas the industries that tend to have a higher number of women are Real Estate, Rental & Leasing (100.0%), Professional & Scientific (100.0%), and Health Care & Social Assistance (66.3%).
| Industry | Male | Female |
| Agriculture, Fishing & Hunting | 0 (0.0%) | 0 (0.0%) |
| Mining, Quarrying, & Extraction | 0 (0.0%) | 0 (0.0%) |
| Construction | 9 (100.0%) | 0 (0.0%) |
| Manufacturing | 11 (100.0%) | 0 (0.0%) |
| Wholesale Trade | 0 (0.0%) | 0 (0.0%) |
| Retail Trade | 30 (100.0%) | 0 (0.0%) |
| Transportation & Warehousing | 0 (0.0%) | 0 (0.0%) |
| Utilities | 0 (0.0%) | 0 (0.0%) |
| Information | 0 (0.0%) | 0 (0.0%) |
| Finance & Insurance | 0 (0.0%) | 0 (0.0%) |
| Real Estate, Rental & Leasing | 0 (0.0%) | 7 (100.0%) |
| Professional & Scientific | 0 (0.0%) | 18 (100.0%) |
| Enterprise Management | 0 (0.0%) | 0 (0.0%) |
| Administrative & Support | 0 (0.0%) | 0 (0.0%) |
| Educational Services | 0 (0.0%) | 0 (0.0%) |
| Health Care & Social Assistance | 31 (33.7%) | 61 (66.3%) |
| Arts, Entertainment & Recreation | 32 (100.0%) | 0 (0.0%) |
| Accommodation & Food Services | 0 (0.0%) | 0 (0.0%) |
| Public Administration | 23 (100.0%) | 0 (0.0%) |
| Total | 136 (61.3%) | 86 (38.7%) |
Education in Catheys Valley
School Enrollment in Catheys Valley
The most common levels of schooling among the 55 students in Catheys Valley are kindergarten (20 | 36.4%), middle school (17 | 30.9%), and high school (12 | 21.8%).
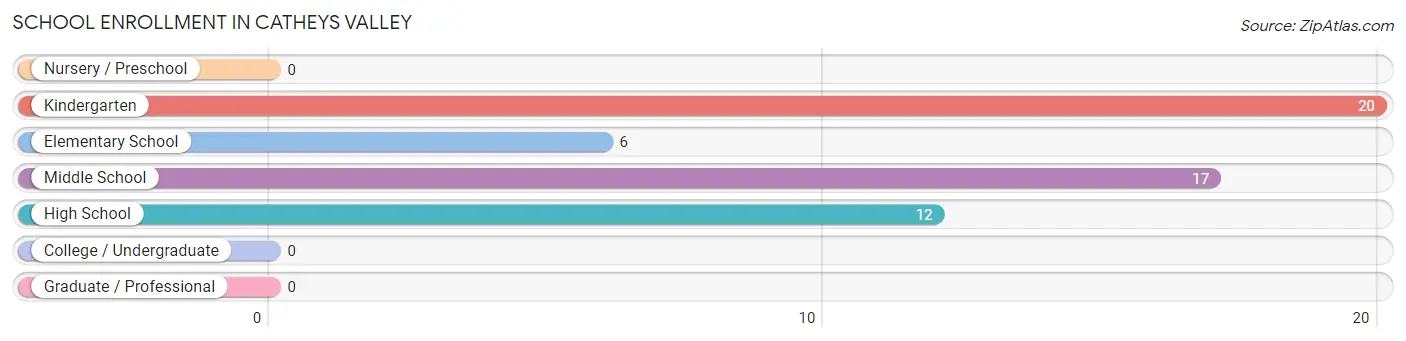
| School Level | # Students | % Students |
| Nursery / Preschool | 0 | 0.0% |
| Kindergarten | 20 | 36.4% |
| Elementary School | 6 | 10.9% |
| Middle School | 17 | 30.9% |
| High School | 12 | 21.8% |
| College / Undergraduate | 0 | 0.0% |
| Graduate / Professional | 0 | 0.0% |
| Total | 55 | 100.0% |
School Enrollment by Age by Funding Source in Catheys Valley
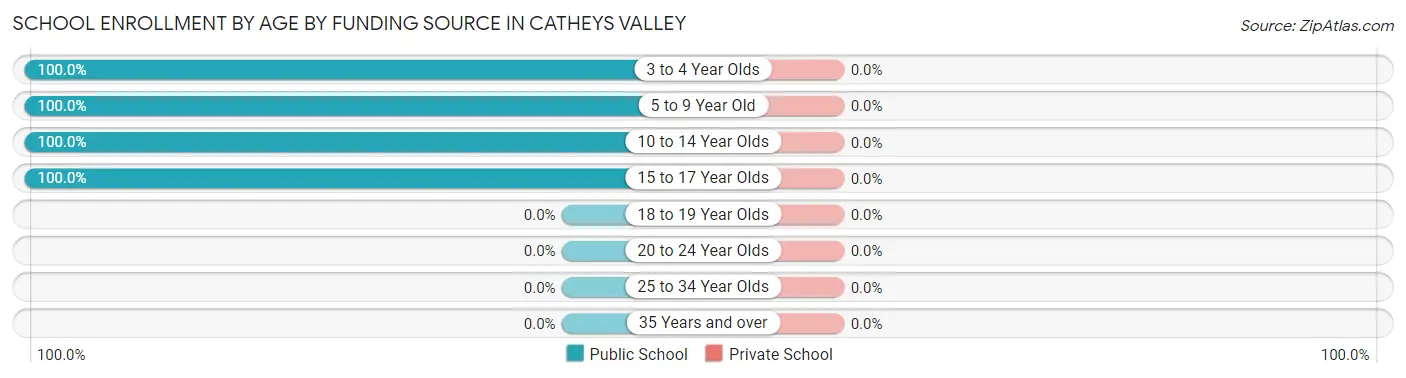
| Age Bracket | Public School | Private School |
| 3 to 4 Year Olds | 13 (100.0%) | 0 (0.0%) |
| 5 to 9 Year Old | 13 (100.0%) | 0 (0.0%) |
| 10 to 14 Year Olds | 13 (100.0%) | 0 (0.0%) |
| 15 to 17 Year Olds | 16 (100.0%) | 0 (0.0%) |
| 18 to 19 Year Olds | 0 (0.0%) | 0 (0.0%) |
| 20 to 24 Year Olds | 0 (0.0%) | 0 (0.0%) |
| 25 to 34 Year Olds | 0 (0.0%) | 0 (0.0%) |
| 35 Years and over | 0 (0.0%) | 0 (0.0%) |
| Total | 55 (100.0%) | 0 (0.0%) |
Educational Attainment by Field of Study in Catheys Valley
Arts & humanities (47 | 31.3%), psychology (43 | 28.7%), bio, nature & agricultural (32 | 21.3%), education (11 | 7.3%), and social sciences (10 | 6.7%) are the most common fields of study among 150 individuals in Catheys Valley who have obtained a bachelor's degree or higher.
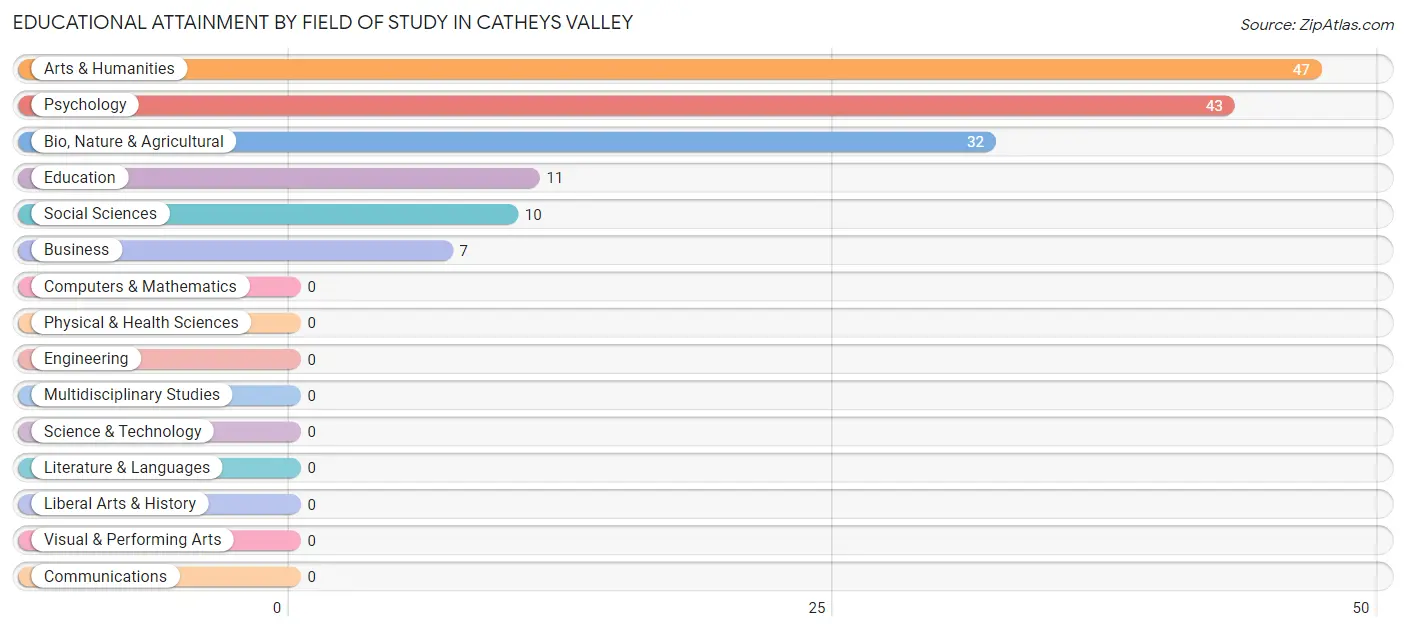
| Field of Study | # Graduates | % Graduates |
| Computers & Mathematics | 0 | 0.0% |
| Bio, Nature & Agricultural | 32 | 21.3% |
| Physical & Health Sciences | 0 | 0.0% |
| Psychology | 43 | 28.7% |
| Social Sciences | 10 | 6.7% |
| Engineering | 0 | 0.0% |
| Multidisciplinary Studies | 0 | 0.0% |
| Science & Technology | 0 | 0.0% |
| Business | 7 | 4.7% |
| Education | 11 | 7.3% |
| Literature & Languages | 0 | 0.0% |
| Liberal Arts & History | 0 | 0.0% |
| Visual & Performing Arts | 0 | 0.0% |
| Communications | 0 | 0.0% |
| Arts & Humanities | 47 | 31.3% |
| Total | 150 | 100.0% |
Transportation & Commute in Catheys Valley
Vehicle Availability by Sex in Catheys Valley
The most prevalent vehicle ownership categories in Catheys Valley are males with 4 vehicles (115, accounting for 84.6%) and females with 4 vehicles (48, making up 133.7%).
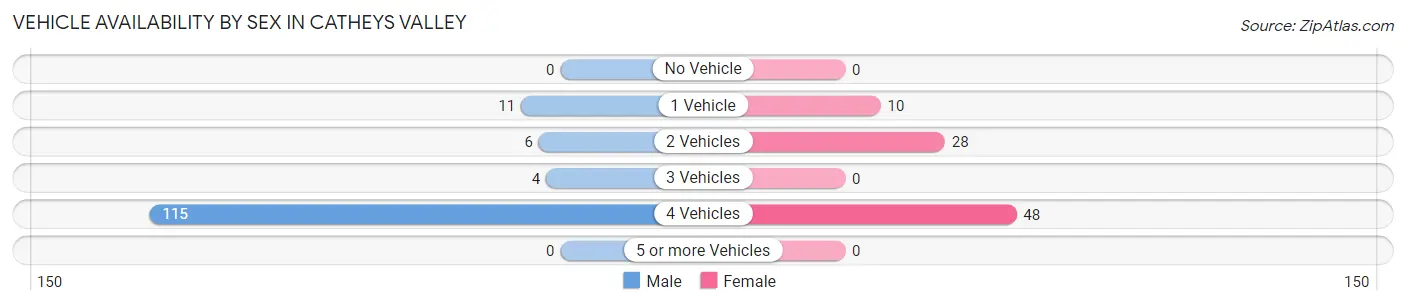
| Vehicles Available | Male | Female |
| No Vehicle | 0 (0.0%) | 0 (0.0%) |
| 1 Vehicle | 11 (8.1%) | 10 (11.6%) |
| 2 Vehicles | 6 (4.4%) | 28 (32.6%) |
| 3 Vehicles | 4 (2.9%) | 0 (0.0%) |
| 4 Vehicles | 115 (84.6%) | 48 (55.8%) |
| 5 or more Vehicles | 0 (0.0%) | 0 (0.0%) |
| Total | 136 (100.0%) | 86 (100.0%) |
Commute Time in Catheys Valley
The most frequently occuring commute durations in Catheys Valley are 15 to 19 minutes (80 commuters, 45.2%), 20 to 24 minutes (44 commuters, 24.9%), and 30 to 34 minutes (22 commuters, 12.4%).
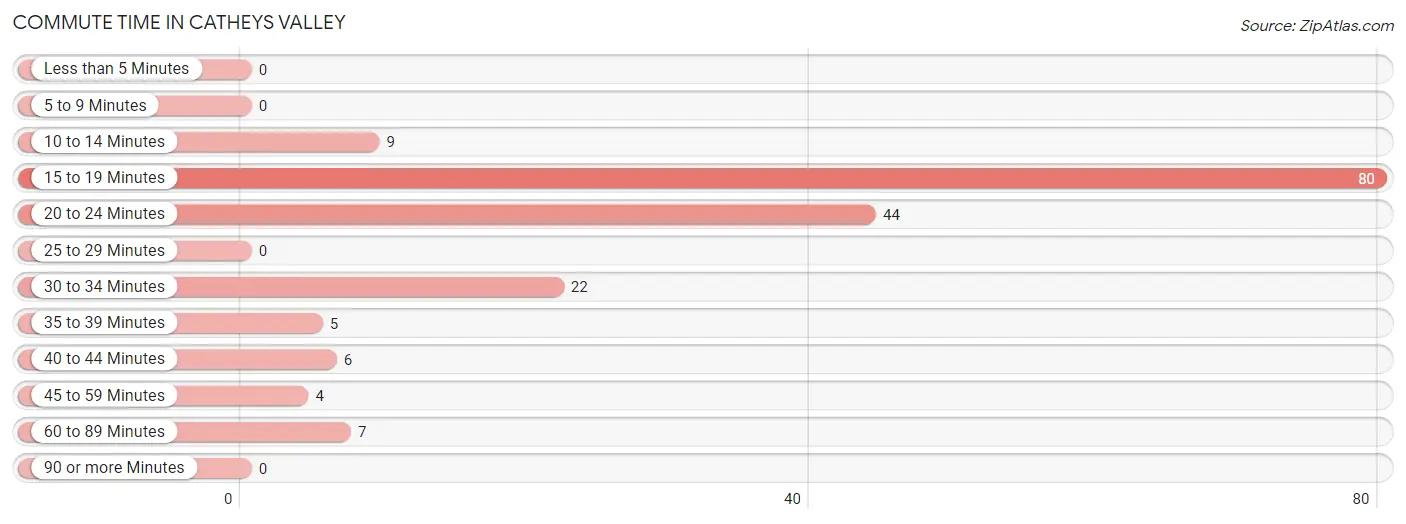
| Commute Time | # Commuters | % Commuters |
| Less than 5 Minutes | 0 | 0.0% |
| 5 to 9 Minutes | 0 | 0.0% |
| 10 to 14 Minutes | 9 | 5.1% |
| 15 to 19 Minutes | 80 | 45.2% |
| 20 to 24 Minutes | 44 | 24.9% |
| 25 to 29 Minutes | 0 | 0.0% |
| 30 to 34 Minutes | 22 | 12.4% |
| 35 to 39 Minutes | 5 | 2.8% |
| 40 to 44 Minutes | 6 | 3.4% |
| 45 to 59 Minutes | 4 | 2.3% |
| 60 to 89 Minutes | 7 | 4.0% |
| 90 or more Minutes | 0 | 0.0% |
Commute Time by Sex in Catheys Valley
The most common commute times in Catheys Valley are 20 to 24 minutes (37 commuters, 36.6%) for males and 15 to 19 minutes (54 commuters, 71.1%) for females.
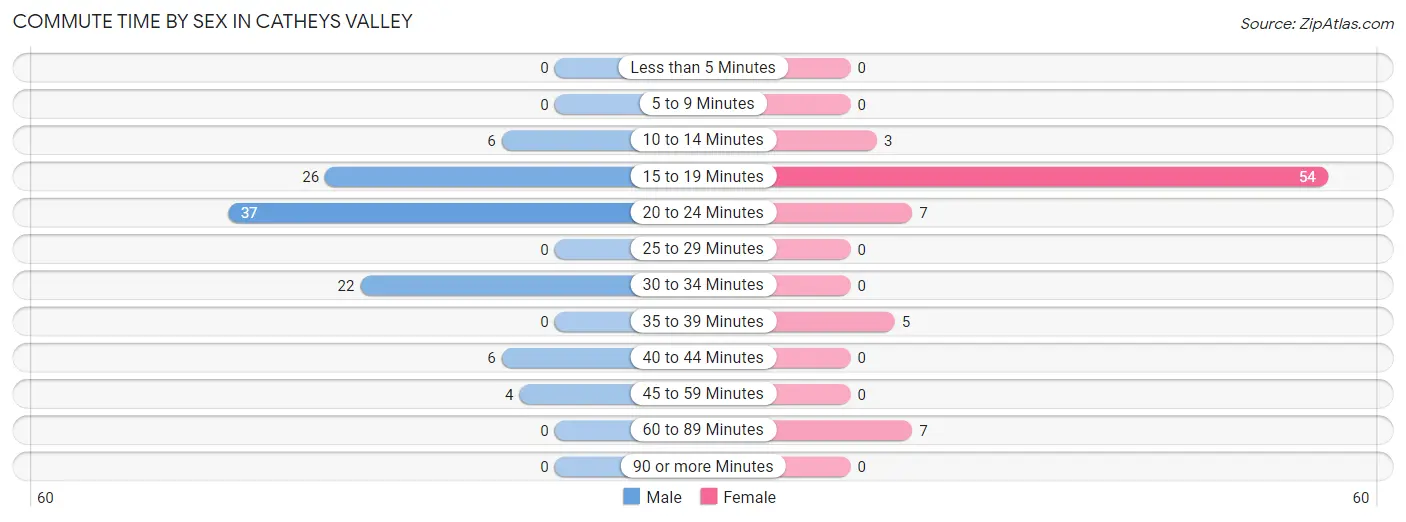
| Commute Time | Male | Female |
| Less than 5 Minutes | 0 (0.0%) | 0 (0.0%) |
| 5 to 9 Minutes | 0 (0.0%) | 0 (0.0%) |
| 10 to 14 Minutes | 6 (5.9%) | 3 (4.0%) |
| 15 to 19 Minutes | 26 (25.7%) | 54 (71.1%) |
| 20 to 24 Minutes | 37 (36.6%) | 7 (9.2%) |
| 25 to 29 Minutes | 0 (0.0%) | 0 (0.0%) |
| 30 to 34 Minutes | 22 (21.8%) | 0 (0.0%) |
| 35 to 39 Minutes | 0 (0.0%) | 5 (6.6%) |
| 40 to 44 Minutes | 6 (5.9%) | 0 (0.0%) |
| 45 to 59 Minutes | 4 (4.0%) | 0 (0.0%) |
| 60 to 89 Minutes | 0 (0.0%) | 7 (9.2%) |
| 90 or more Minutes | 0 (0.0%) | 0 (0.0%) |
Time of Departure to Work by Sex in Catheys Valley
The most frequent times of departure to work in Catheys Valley are 6:00 AM to 6:29 AM (43, 42.6%) for males and 8:00 AM to 8:29 AM (54, 71.1%) for females.
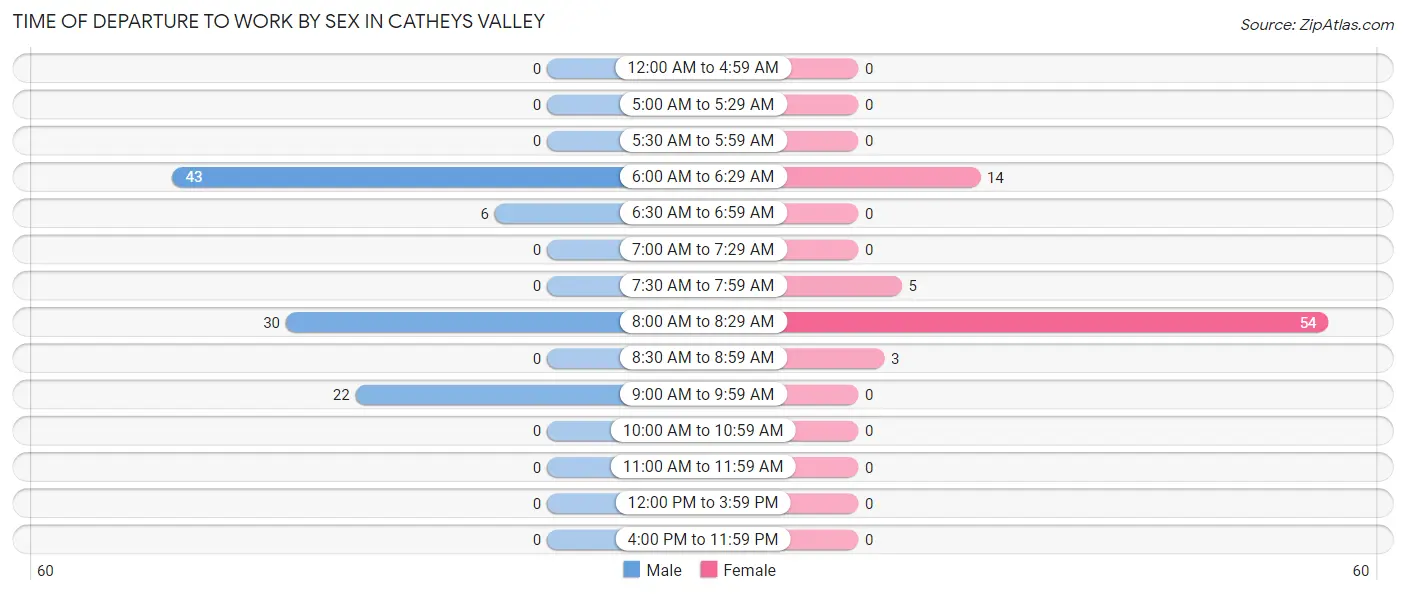
| Time of Departure | Male | Female |
| 12:00 AM to 4:59 AM | 0 (0.0%) | 0 (0.0%) |
| 5:00 AM to 5:29 AM | 0 (0.0%) | 0 (0.0%) |
| 5:30 AM to 5:59 AM | 0 (0.0%) | 0 (0.0%) |
| 6:00 AM to 6:29 AM | 43 (42.6%) | 14 (18.4%) |
| 6:30 AM to 6:59 AM | 6 (5.9%) | 0 (0.0%) |
| 7:00 AM to 7:29 AM | 0 (0.0%) | 0 (0.0%) |
| 7:30 AM to 7:59 AM | 0 (0.0%) | 5 (6.6%) |
| 8:00 AM to 8:29 AM | 30 (29.7%) | 54 (71.1%) |
| 8:30 AM to 8:59 AM | 0 (0.0%) | 3 (4.0%) |
| 9:00 AM to 9:59 AM | 22 (21.8%) | 0 (0.0%) |
| 10:00 AM to 10:59 AM | 0 (0.0%) | 0 (0.0%) |
| 11:00 AM to 11:59 AM | 0 (0.0%) | 0 (0.0%) |
| 12:00 PM to 3:59 PM | 0 (0.0%) | 0 (0.0%) |
| 4:00 PM to 11:59 PM | 0 (0.0%) | 0 (0.0%) |
| Total | 101 (100.0%) | 76 (100.0%) |
Housing Occupancy in Catheys Valley
Occupancy by Ownership in Catheys Valley
Of the total 366 dwellings in Catheys Valley, owner-occupied units account for 352 (96.2%), while renter-occupied units make up 14 (3.8%).
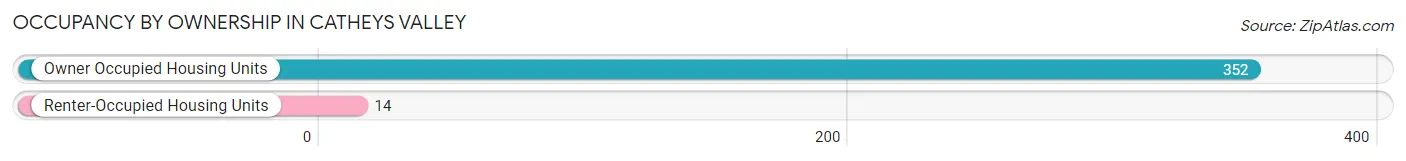
| Occupancy | # Housing Units | % Housing Units |
| Owner Occupied Housing Units | 352 | 96.2% |
| Renter-Occupied Housing Units | 14 | 3.8% |
| Total Occupied Housing Units | 366 | 100.0% |
Occupancy by Household Size in Catheys Valley
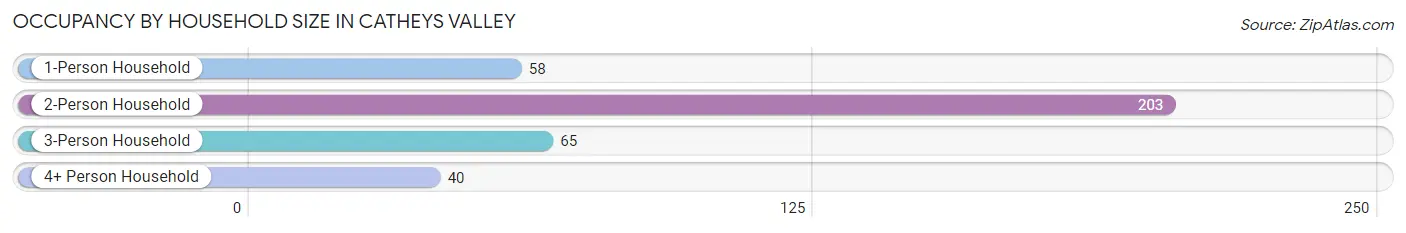
| Household Size | # Housing Units | % Housing Units |
| 1-Person Household | 58 | 15.9% |
| 2-Person Household | 203 | 55.5% |
| 3-Person Household | 65 | 17.8% |
| 4+ Person Household | 40 | 10.9% |
| Total Housing Units | 366 | 100.0% |
Occupancy by Ownership by Household Size in Catheys Valley
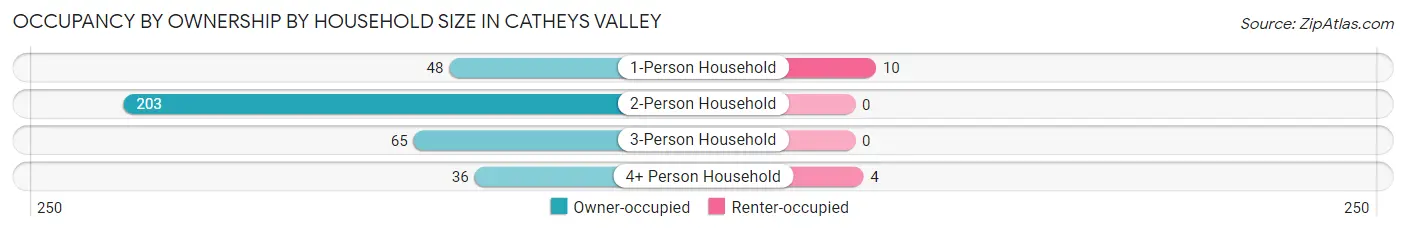
| Household Size | Owner-occupied | Renter-occupied |
| 1-Person Household | 48 (82.8%) | 10 (17.2%) |
| 2-Person Household | 203 (100.0%) | 0 (0.0%) |
| 3-Person Household | 65 (100.0%) | 0 (0.0%) |
| 4+ Person Household | 36 (90.0%) | 4 (10.0%) |
| Total Housing Units | 352 (96.2%) | 14 (3.8%) |
Occupancy by Educational Attainment in Catheys Valley
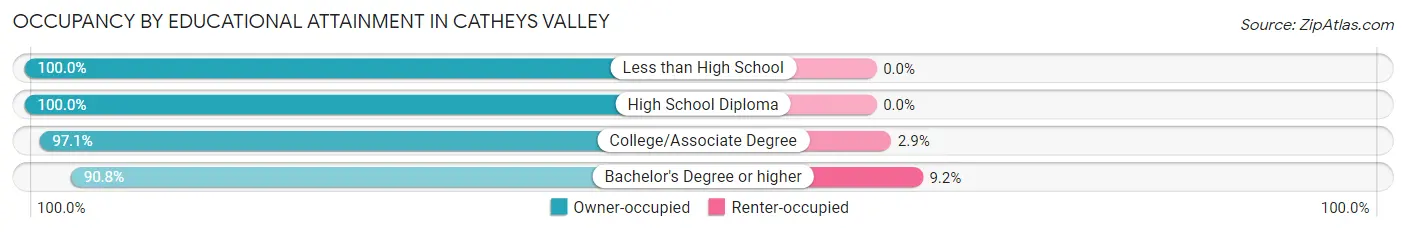
| Household Size | Owner-occupied | Renter-occupied |
| Less than High School | 7 (100.0%) | 0 (0.0%) |
| High School Diploma | 113 (100.0%) | 0 (0.0%) |
| College/Associate Degree | 133 (97.1%) | 4 (2.9%) |
| Bachelor's Degree or higher | 99 (90.8%) | 10 (9.2%) |
Occupancy by Age of Householder in Catheys Valley
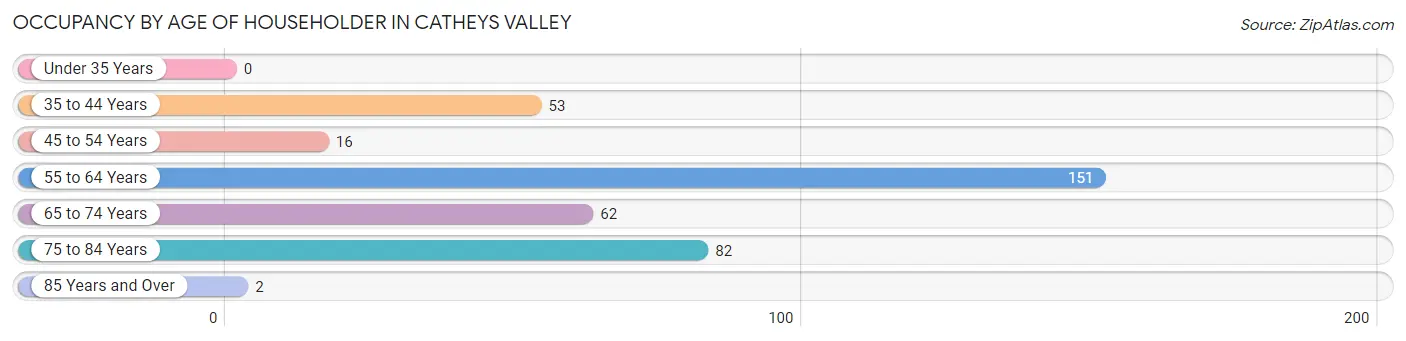
| Age Bracket | # Households | % Households |
| Under 35 Years | 0 | 0.0% |
| 35 to 44 Years | 53 | 14.5% |
| 45 to 54 Years | 16 | 4.4% |
| 55 to 64 Years | 151 | 41.3% |
| 65 to 74 Years | 62 | 16.9% |
| 75 to 84 Years | 82 | 22.4% |
| 85 Years and Over | 2 | 0.5% |
| Total | 366 | 100.0% |
Housing Finances in Catheys Valley
Median Income by Occupancy in Catheys Valley
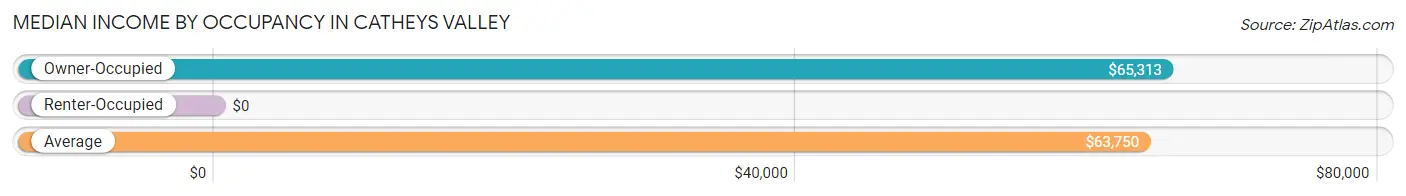
| Occupancy Type | # Households | Median Income |
| Owner-Occupied | 352 (96.2%) | $65,313 |
| Renter-Occupied | 14 (3.8%) | $0 |
| Average | 366 (100.0%) | $63,750 |
Occupancy by Householder Income Bracket in Catheys Valley
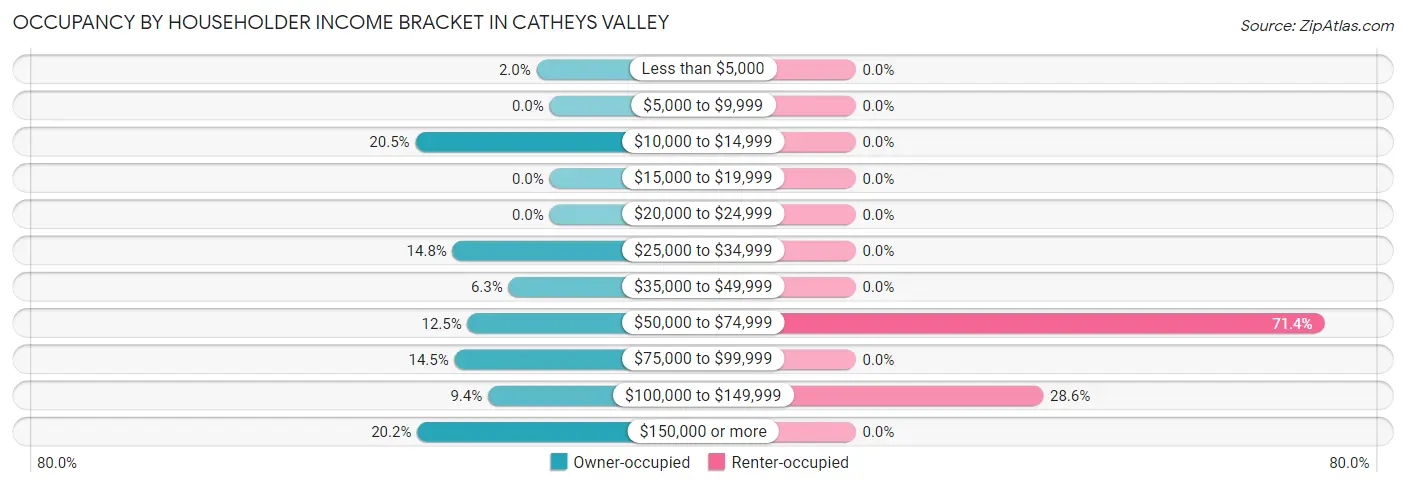
| Income Bracket | Owner-occupied | Renter-occupied |
| Less than $5,000 | 7 (2.0%) | 0 (0.0%) |
| $5,000 to $9,999 | 0 (0.0%) | 0 (0.0%) |
| $10,000 to $14,999 | 72 (20.4%) | 0 (0.0%) |
| $15,000 to $19,999 | 0 (0.0%) | 0 (0.0%) |
| $20,000 to $24,999 | 0 (0.0%) | 0 (0.0%) |
| $25,000 to $34,999 | 52 (14.8%) | 0 (0.0%) |
| $35,000 to $49,999 | 22 (6.2%) | 0 (0.0%) |
| $50,000 to $74,999 | 44 (12.5%) | 10 (71.4%) |
| $75,000 to $99,999 | 51 (14.5%) | 0 (0.0%) |
| $100,000 to $149,999 | 33 (9.4%) | 4 (28.6%) |
| $150,000 or more | 71 (20.2%) | 0 (0.0%) |
| Total | 352 (100.0%) | 14 (100.0%) |
Monthly Housing Cost Tiers in Catheys Valley
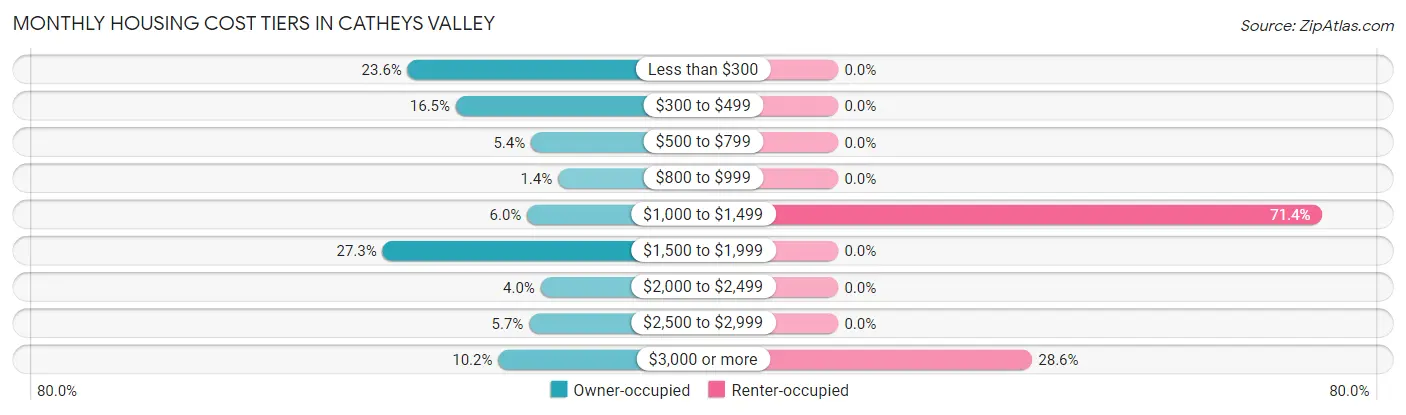
| Monthly Cost | Owner-occupied | Renter-occupied |
| Less than $300 | 83 (23.6%) | 0 (0.0%) |
| $300 to $499 | 58 (16.5%) | 0 (0.0%) |
| $500 to $799 | 19 (5.4%) | 0 (0.0%) |
| $800 to $999 | 5 (1.4%) | 0 (0.0%) |
| $1,000 to $1,499 | 21 (6.0%) | 10 (71.4%) |
| $1,500 to $1,999 | 96 (27.3%) | 0 (0.0%) |
| $2,000 to $2,499 | 14 (4.0%) | 0 (0.0%) |
| $2,500 to $2,999 | 20 (5.7%) | 0 (0.0%) |
| $3,000 or more | 36 (10.2%) | 4 (28.6%) |
| Total | 352 (100.0%) | 14 (100.0%) |
Physical Housing Characteristics in Catheys Valley
Housing Structures in Catheys Valley
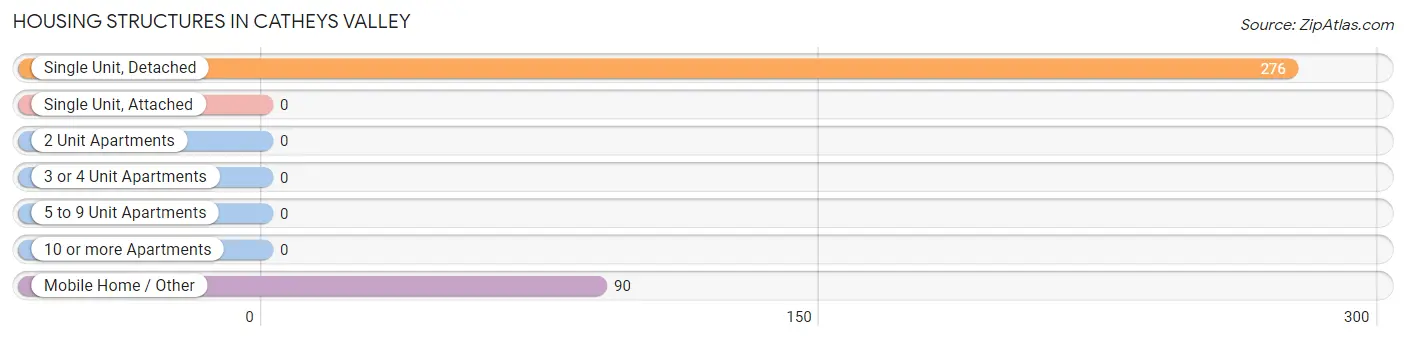
| Structure Type | # Housing Units | % Housing Units |
| Single Unit, Detached | 276 | 75.4% |
| Single Unit, Attached | 0 | 0.0% |
| 2 Unit Apartments | 0 | 0.0% |
| 3 or 4 Unit Apartments | 0 | 0.0% |
| 5 to 9 Unit Apartments | 0 | 0.0% |
| 10 or more Apartments | 0 | 0.0% |
| Mobile Home / Other | 90 | 24.6% |
| Total | 366 | 100.0% |
Housing Structures by Occupancy in Catheys Valley
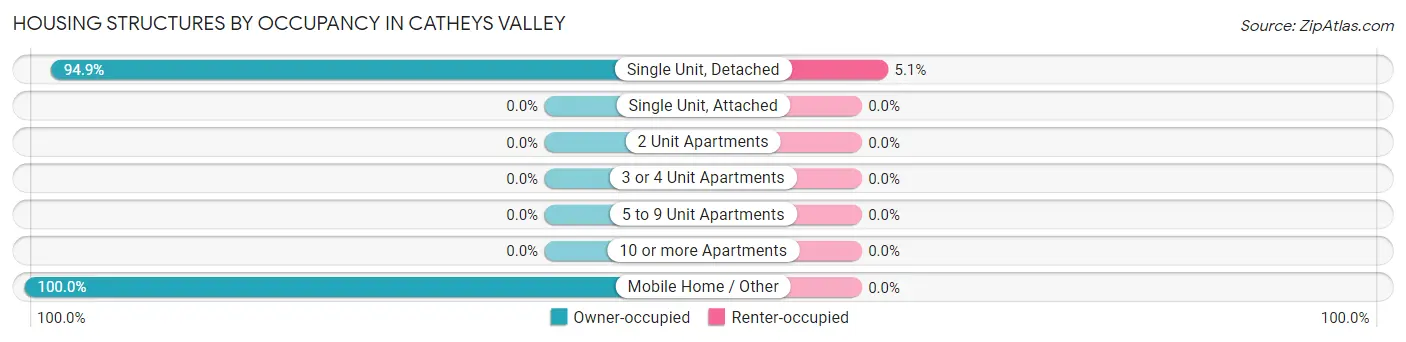
| Structure Type | Owner-occupied | Renter-occupied |
| Single Unit, Detached | 262 (94.9%) | 14 (5.1%) |
| Single Unit, Attached | 0 (0.0%) | 0 (0.0%) |
| 2 Unit Apartments | 0 (0.0%) | 0 (0.0%) |
| 3 or 4 Unit Apartments | 0 (0.0%) | 0 (0.0%) |
| 5 to 9 Unit Apartments | 0 (0.0%) | 0 (0.0%) |
| 10 or more Apartments | 0 (0.0%) | 0 (0.0%) |
| Mobile Home / Other | 90 (100.0%) | 0 (0.0%) |
| Total | 352 (96.2%) | 14 (3.8%) |
Housing Structures by Number of Rooms in Catheys Valley
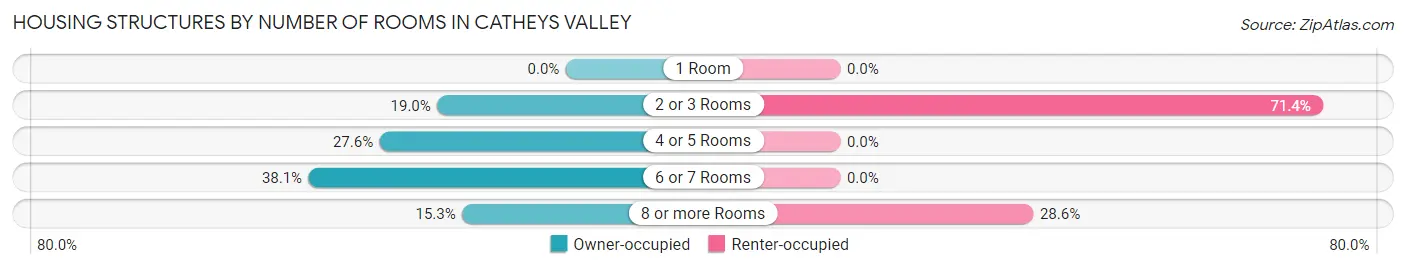
| Number of Rooms | Owner-occupied | Renter-occupied |
| 1 Room | 0 (0.0%) | 0 (0.0%) |
| 2 or 3 Rooms | 67 (19.0%) | 10 (71.4%) |
| 4 or 5 Rooms | 97 (27.6%) | 0 (0.0%) |
| 6 or 7 Rooms | 134 (38.1%) | 0 (0.0%) |
| 8 or more Rooms | 54 (15.3%) | 4 (28.6%) |
| Total | 352 (100.0%) | 14 (100.0%) |
Housing Structure by Heating Type in Catheys Valley
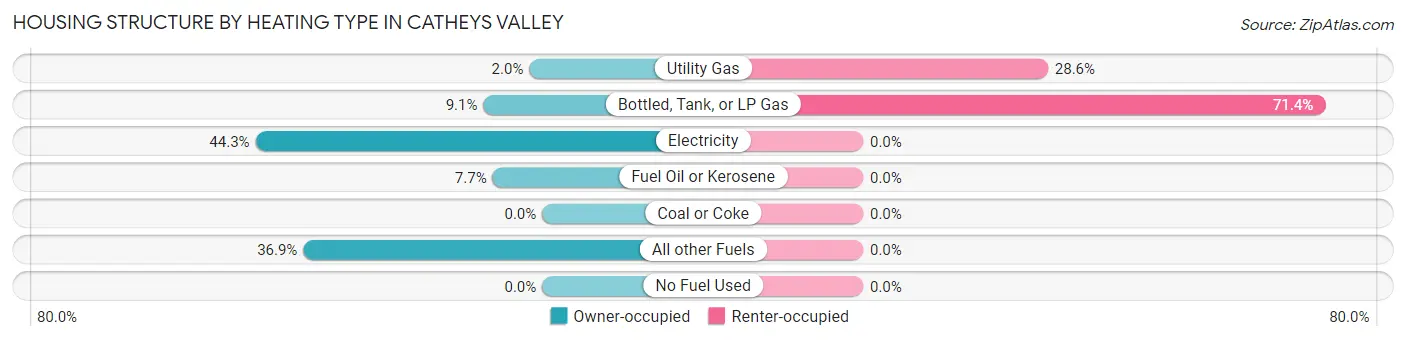
| Heating Type | Owner-occupied | Renter-occupied |
| Utility Gas | 7 (2.0%) | 4 (28.6%) |
| Bottled, Tank, or LP Gas | 32 (9.1%) | 10 (71.4%) |
| Electricity | 156 (44.3%) | 0 (0.0%) |
| Fuel Oil or Kerosene | 27 (7.7%) | 0 (0.0%) |
| Coal or Coke | 0 (0.0%) | 0 (0.0%) |
| All other Fuels | 130 (36.9%) | 0 (0.0%) |
| No Fuel Used | 0 (0.0%) | 0 (0.0%) |
| Total | 352 (100.0%) | 14 (100.0%) |
Household Vehicle Usage in Catheys Valley
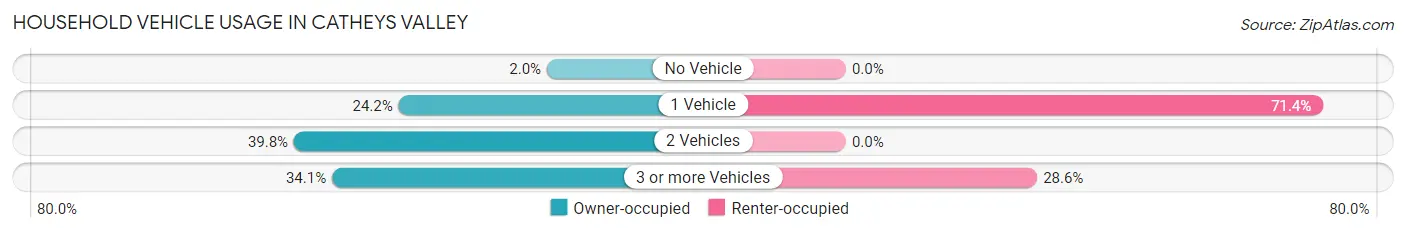
| Vehicles per Household | Owner-occupied | Renter-occupied |
| No Vehicle | 7 (2.0%) | 0 (0.0%) |
| 1 Vehicle | 85 (24.1%) | 10 (71.4%) |
| 2 Vehicles | 140 (39.8%) | 0 (0.0%) |
| 3 or more Vehicles | 120 (34.1%) | 4 (28.6%) |
| Total | 352 (100.0%) | 14 (100.0%) |
Real Estate & Mortgages in Catheys Valley
Real Estate and Mortgage Overview in Catheys Valley
| Characteristic | Without Mortgage | With Mortgage |
| Housing Units | 210 | 142 |
| Median Property Value | - | - |
| Median Household Income | - | - |
| Monthly Housing Costs | $341 | $36 |
| Real Estate Taxes | - | - |
Property Value by Mortgage Status in Catheys Valley
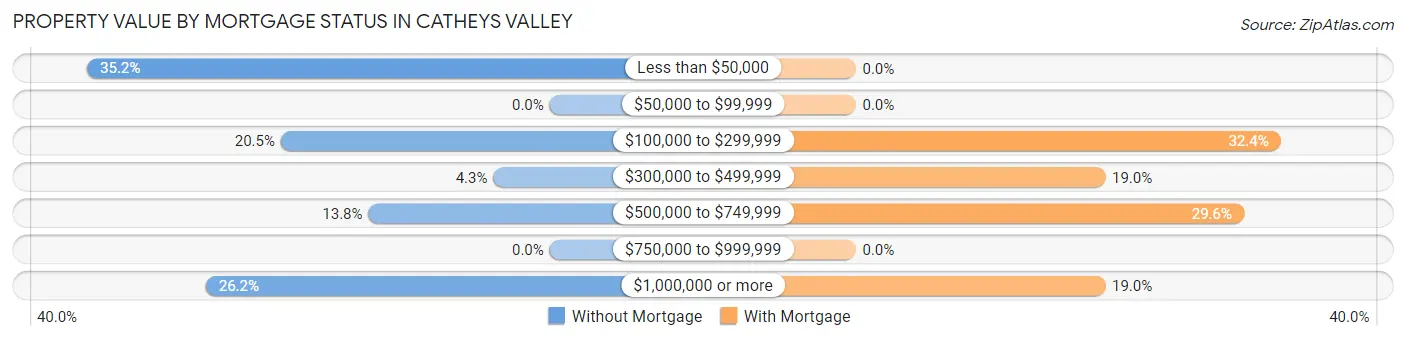
| Property Value | Without Mortgage | With Mortgage |
| Less than $50,000 | 74 (35.2%) | 0 (0.0%) |
| $50,000 to $99,999 | 0 (0.0%) | 0 (0.0%) |
| $100,000 to $299,999 | 43 (20.5%) | 46 (32.4%) |
| $300,000 to $499,999 | 9 (4.3%) | 27 (19.0%) |
| $500,000 to $749,999 | 29 (13.8%) | 42 (29.6%) |
| $750,000 to $999,999 | 0 (0.0%) | 0 (0.0%) |
| $1,000,000 or more | 55 (26.2%) | 27 (19.0%) |
| Total | 210 (100.0%) | 142 (100.0%) |
Household Income by Mortgage Status in Catheys Valley
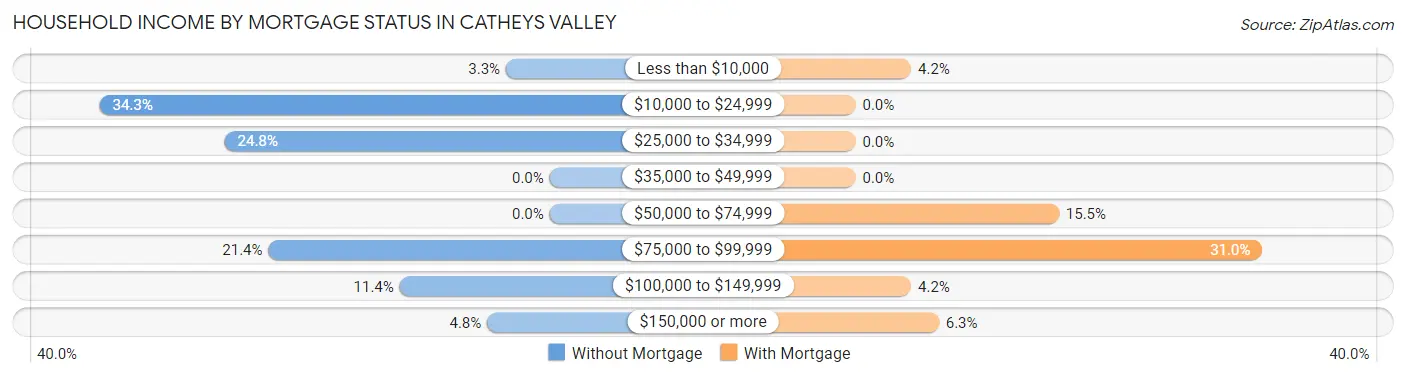
| Household Income | Without Mortgage | With Mortgage |
| Less than $10,000 | 7 (3.3%) | 6 (4.2%) |
| $10,000 to $24,999 | 72 (34.3%) | 0 (0.0%) |
| $25,000 to $34,999 | 52 (24.8%) | 0 (0.0%) |
| $35,000 to $49,999 | 0 (0.0%) | 0 (0.0%) |
| $50,000 to $74,999 | 0 (0.0%) | 22 (15.5%) |
| $75,000 to $99,999 | 45 (21.4%) | 44 (31.0%) |
| $100,000 to $149,999 | 24 (11.4%) | 6 (4.2%) |
| $150,000 or more | 10 (4.8%) | 9 (6.3%) |
| Total | 210 (100.0%) | 142 (100.0%) |
Property Value to Household Income Ratio in Catheys Valley
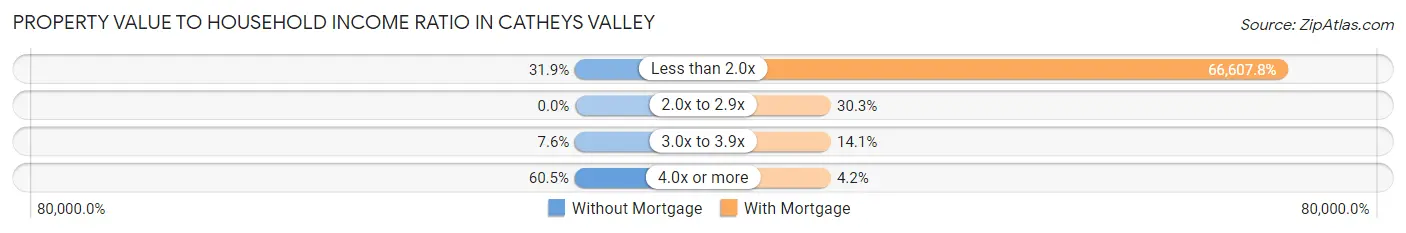
| Value-to-Income Ratio | Without Mortgage | With Mortgage |
| Less than 2.0x | 67 (31.9%) | 94,583 (66,607.7%) |
| 2.0x to 2.9x | 0 (0.0%) | 43 (30.3%) |
| 3.0x to 3.9x | 16 (7.6%) | 20 (14.1%) |
| 4.0x or more | 127 (60.5%) | 6 (4.2%) |
| Total | 210 (100.0%) | 142 (100.0%) |
Real Estate Taxes by Mortgage Status in Catheys Valley
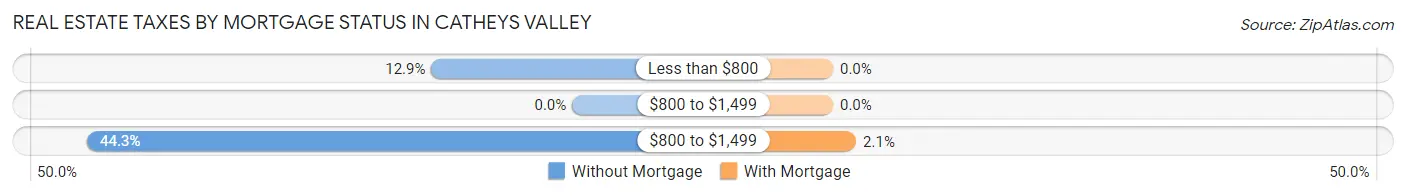
| Property Taxes | Without Mortgage | With Mortgage |
| Less than $800 | 27 (12.9%) | 0 (0.0%) |
| $800 to $1,499 | 0 (0.0%) | 0 (0.0%) |
| $800 to $1,499 | 93 (44.3%) | 3 (2.1%) |
| Total | 210 (100.0%) | 142 (100.0%) |
Health & Disability in Catheys Valley
Health Insurance Coverage by Age in Catheys Valley
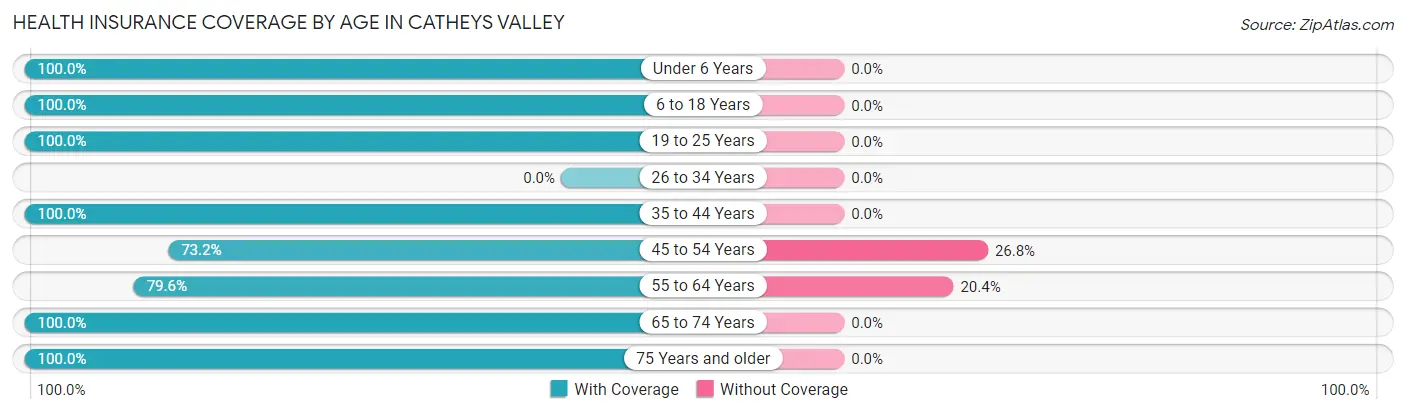
| Age Bracket | With Coverage | Without Coverage |
| Under 6 Years | 34 (100.0%) | 0 (0.0%) |
| 6 to 18 Years | 42 (100.0%) | 0 (0.0%) |
| 19 to 25 Years | 15 (100.0%) | 0 (0.0%) |
| 26 to 34 Years | 0 (0.0%) | 0 (0.0%) |
| 35 to 44 Years | 69 (100.0%) | 0 (0.0%) |
| 45 to 54 Years | 41 (73.2%) | 15 (26.8%) |
| 55 to 64 Years | 219 (79.6%) | 56 (20.4%) |
| 65 to 74 Years | 118 (100.0%) | 0 (0.0%) |
| 75 Years and older | 114 (100.0%) | 0 (0.0%) |
| Total | 652 (90.2%) | 71 (9.8%) |
Health Insurance Coverage by Citizenship Status in Catheys Valley
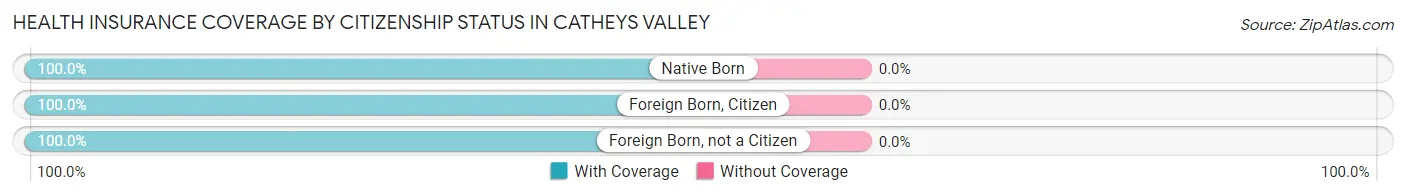
| Citizenship Status | With Coverage | Without Coverage |
| Native Born | 34 (100.0%) | 0 (0.0%) |
| Foreign Born, Citizen | 42 (100.0%) | 0 (0.0%) |
| Foreign Born, not a Citizen | 15 (100.0%) | 0 (0.0%) |
Health Insurance Coverage by Household Income in Catheys Valley
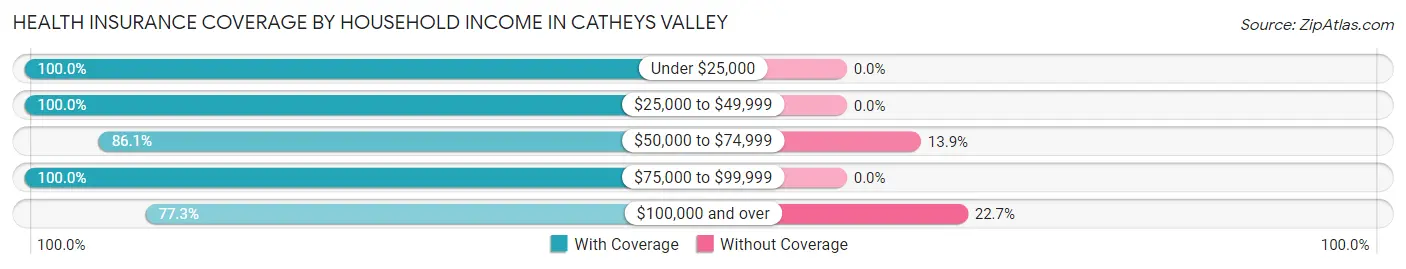
| Household Income | With Coverage | Without Coverage |
| Under $25,000 | 123 (100.0%) | 0 (0.0%) |
| $25,000 to $49,999 | 125 (100.0%) | 0 (0.0%) |
| $50,000 to $74,999 | 93 (86.1%) | 15 (13.9%) |
| $75,000 to $99,999 | 120 (100.0%) | 0 (0.0%) |
| $100,000 and over | 191 (77.3%) | 56 (22.7%) |
Public vs Private Health Insurance Coverage by Age in Catheys Valley
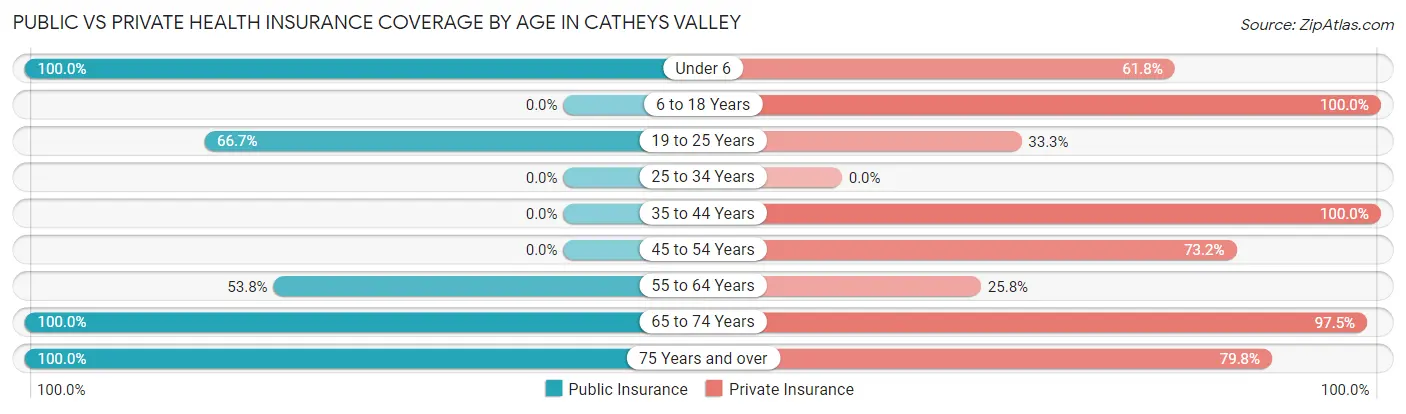
| Age Bracket | Public Insurance | Private Insurance |
| Under 6 | 34 (100.0%) | 21 (61.8%) |
| 6 to 18 Years | 0 (0.0%) | 42 (100.0%) |
| 19 to 25 Years | 10 (66.7%) | 5 (33.3%) |
| 25 to 34 Years | 0 (0.0%) | 0 (0.0%) |
| 35 to 44 Years | 0 (0.0%) | 69 (100.0%) |
| 45 to 54 Years | 0 (0.0%) | 41 (73.2%) |
| 55 to 64 Years | 148 (53.8%) | 71 (25.8%) |
| 65 to 74 Years | 118 (100.0%) | 115 (97.5%) |
| 75 Years and over | 114 (100.0%) | 91 (79.8%) |
| Total | 424 (58.6%) | 455 (62.9%) |
Disability Status by Sex by Age in Catheys Valley
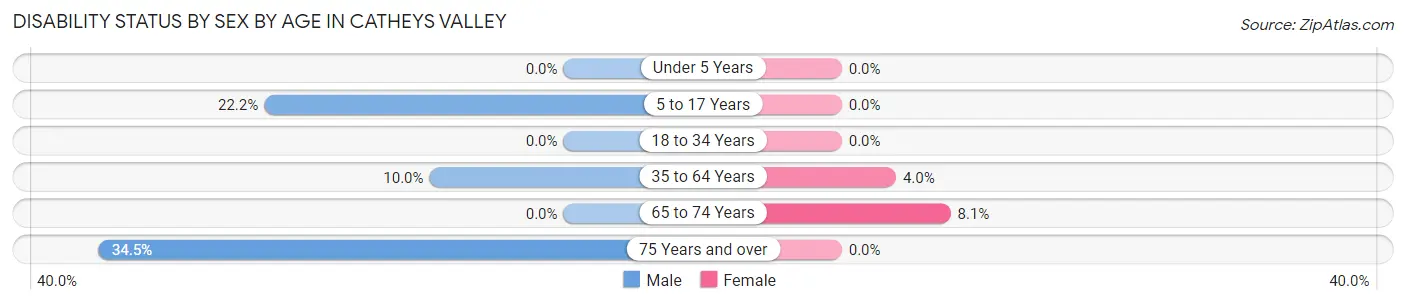
| Age Bracket | Male | Female |
| Under 5 Years | 0 (0.0%) | 0 (0.0%) |
| 5 to 17 Years | 4 (22.2%) | 0 (0.0%) |
| 18 to 34 Years | 0 (0.0%) | 0 (0.0%) |
| 35 to 64 Years | 20 (10.0%) | 8 (4.0%) |
| 65 to 74 Years | 0 (0.0%) | 8 (8.1%) |
| 75 Years and over | 30 (34.5%) | 0 (0.0%) |
Disability Class by Sex by Age in Catheys Valley
Disability Class: Hearing Difficulty
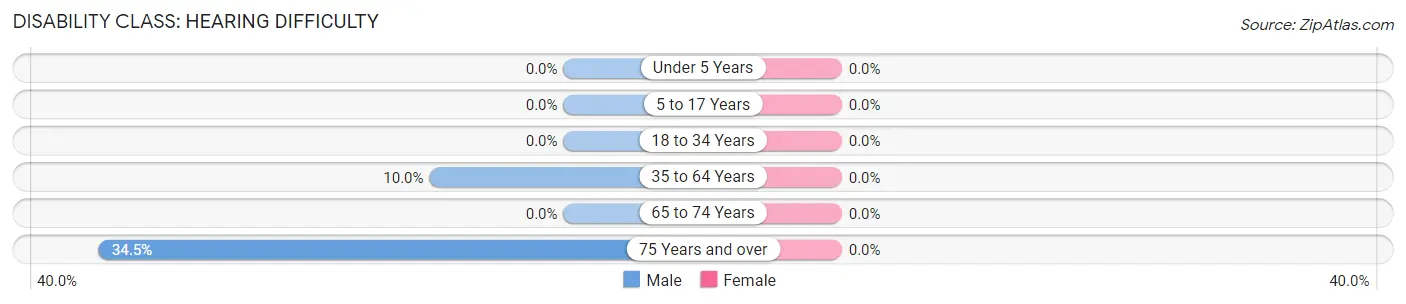
| Age Bracket | Male | Female |
| Under 5 Years | 0 (0.0%) | 0 (0.0%) |
| 5 to 17 Years | 0 (0.0%) | 0 (0.0%) |
| 18 to 34 Years | 0 (0.0%) | 0 (0.0%) |
| 35 to 64 Years | 20 (10.0%) | 0 (0.0%) |
| 65 to 74 Years | 0 (0.0%) | 0 (0.0%) |
| 75 Years and over | 30 (34.5%) | 0 (0.0%) |
Disability Class: Vision Difficulty
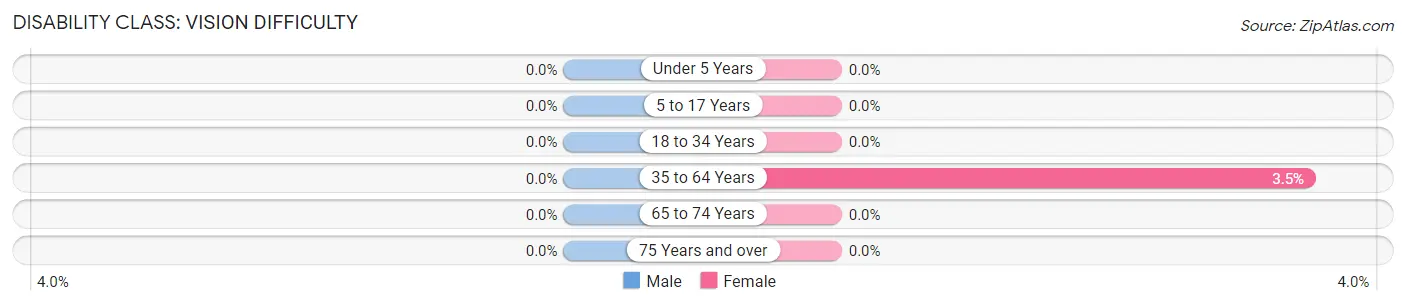
| Age Bracket | Male | Female |
| Under 5 Years | 0 (0.0%) | 0 (0.0%) |
| 5 to 17 Years | 0 (0.0%) | 0 (0.0%) |
| 18 to 34 Years | 0 (0.0%) | 0 (0.0%) |
| 35 to 64 Years | 0 (0.0%) | 7 (3.5%) |
| 65 to 74 Years | 0 (0.0%) | 0 (0.0%) |
| 75 Years and over | 0 (0.0%) | 0 (0.0%) |
Disability Class: Cognitive Difficulty
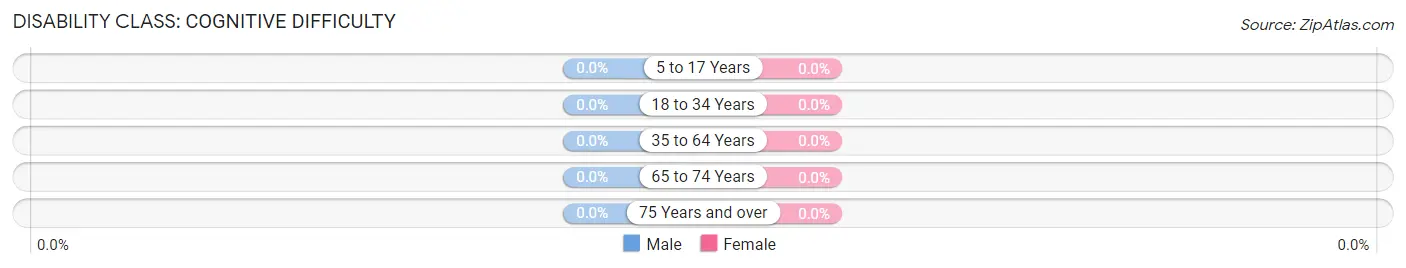
| Age Bracket | Male | Female |
| 5 to 17 Years | 0 (0.0%) | 0 (0.0%) |
| 18 to 34 Years | 0 (0.0%) | 0 (0.0%) |
| 35 to 64 Years | 0 (0.0%) | 0 (0.0%) |
| 65 to 74 Years | 0 (0.0%) | 0 (0.0%) |
| 75 Years and over | 0 (0.0%) | 0 (0.0%) |
Disability Class: Ambulatory Difficulty
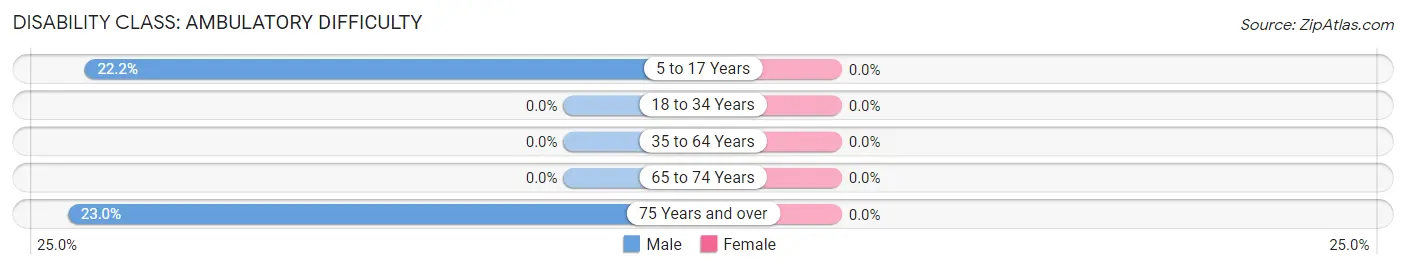
| Age Bracket | Male | Female |
| 5 to 17 Years | 4 (22.2%) | 0 (0.0%) |
| 18 to 34 Years | 0 (0.0%) | 0 (0.0%) |
| 35 to 64 Years | 0 (0.0%) | 0 (0.0%) |
| 65 to 74 Years | 0 (0.0%) | 0 (0.0%) |
| 75 Years and over | 20 (23.0%) | 0 (0.0%) |
Disability Class: Self-Care Difficulty
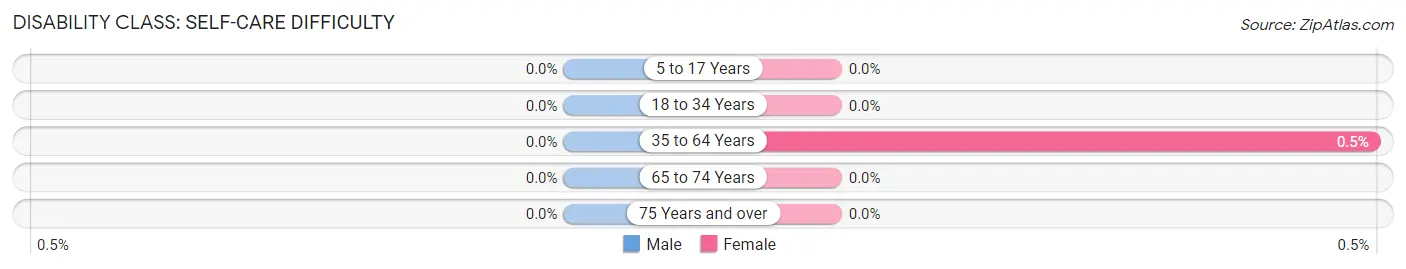
| Age Bracket | Male | Female |
| 5 to 17 Years | 0 (0.0%) | 0 (0.0%) |
| 18 to 34 Years | 0 (0.0%) | 0 (0.0%) |
| 35 to 64 Years | 0 (0.0%) | 1 (0.5%) |
| 65 to 74 Years | 0 (0.0%) | 0 (0.0%) |
| 75 Years and over | 0 (0.0%) | 0 (0.0%) |
Technology Access in Catheys Valley
Computing Device Access in Catheys Valley
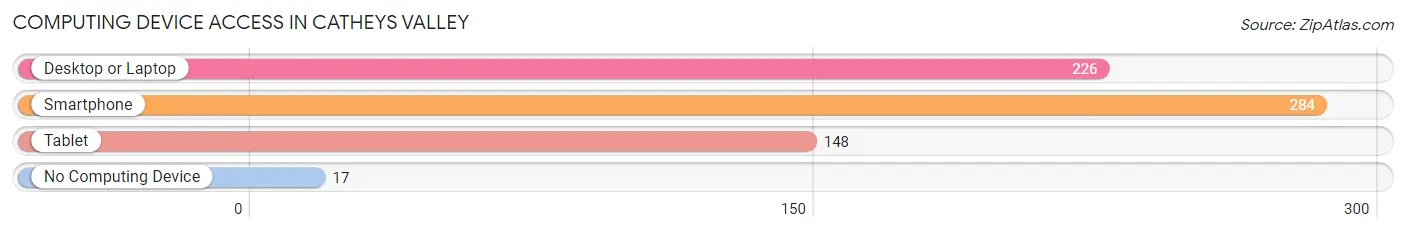
| Device Type | # Households | % Households |
| Desktop or Laptop | 226 | 61.8% |
| Smartphone | 284 | 77.6% |
| Tablet | 148 | 40.4% |
| No Computing Device | 17 | 4.6% |
| Total | 366 | 100.0% |
Internet Access in Catheys Valley
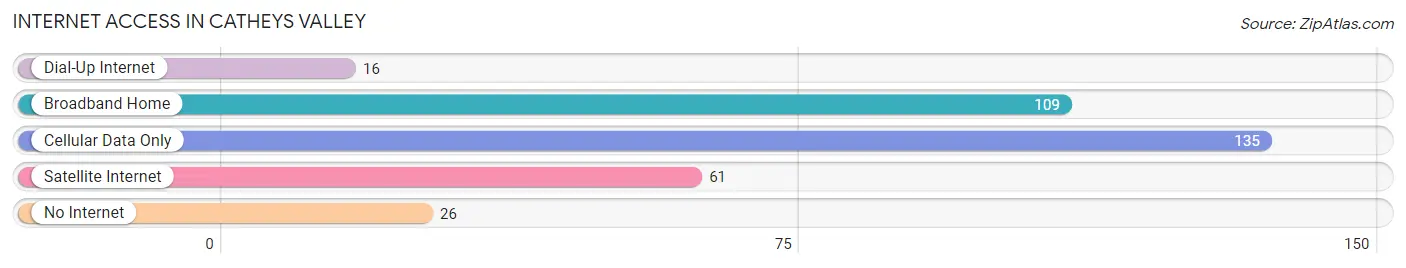
| Internet Type | # Households | % Households |
| Dial-Up Internet | 16 | 4.4% |
| Broadband Home | 109 | 29.8% |
| Cellular Data Only | 135 | 36.9% |
| Satellite Internet | 61 | 16.7% |
| No Internet | 26 | 7.1% |
| Total | 366 | 100.0% |
Catheys Valley Summary
Catheys Valley is a small unincorporated community located in Mariposa County, California. It is situated in the foothills of the Sierra Nevada Mountains, approximately 25 miles east of the city of Merced. The population of Catheys Valley was estimated to be 1,845 in 2019.
History
Catheys Valley was first settled in the late 1850s by a group of miners who were searching for gold. The town was named after the Cathey family, who were among the first settlers. The Cathey family owned a large ranch in the area, and the town was built around it.
The town grew slowly over the years, and by the early 1900s, it had become a popular destination for tourists. The town was known for its beautiful scenery and its proximity to Yosemite National Park.
In the 1950s, Catheys Valley began to experience a population boom as people moved to the area to take advantage of the booming agricultural industry. The town was also home to a number of small businesses, including a general store, a gas station, and a post office.
Geography
Catheys Valley is located in the foothills of the Sierra Nevada Mountains, approximately 25 miles east of the city of Merced. The town is situated at an elevation of 1,845 feet above sea level.
The town is surrounded by rolling hills and is home to a variety of wildlife, including deer, coyotes, and mountain lions. The nearby Merced River provides a source of water for the town.
Economy
Catheys Valley is primarily an agricultural community, with the majority of the population employed in the farming and ranching industries. The town is home to a number of small businesses, including a general store, a gas station, and a post office.
The town is also home to a number of wineries, which produce a variety of wines from the local grapes. The town is also home to a number of small manufacturing businesses, which produce a variety of products, including furniture, clothing, and jewelry.
Demographics
As of 2019, the population of Catheys Valley was estimated to be 1,845. The town is predominantly white, with the majority of the population being of European descent. The town also has a small Hispanic population, as well as a small Native American population.
The median household income in Catheys Valley is $50,000, and the median home value is $250,000. The town has a low unemployment rate, and the majority of the population is employed in the agricultural and manufacturing industries.
Conclusion
Catheys Valley is a small unincorporated community located in Mariposa County, California. It is situated in the foothills of the Sierra Nevada Mountains, approximately 25 miles east of the city of Merced. The population of Catheys Valley was estimated to be 1,845 in 2019. The town is primarily an agricultural community, with the majority of the population employed in the farming and ranching industries. The town is also home to a number of small businesses, including a general store, a gas station, and a post office. The town is predominantly white, with the majority of the population being of European descent. The median household income in Catheys Valley is $50,000, and the median home value is $250,000.
Common Questions
What is Per Capita Income in Catheys Valley?
Per Capita income in Catheys Valley is $35,264.
What is the Median Family Income in Catheys Valley?
Median Family Income in Catheys Valley is $77,028.
What is the Median Household income in Catheys Valley?
Median Household Income in Catheys Valley is $63,750.
What is Income or Wage Gap in Catheys Valley?
Income or Wage Gap in Catheys Valley is 24.1%.
Women in Catheys Valley earn 75.9 cents for every dollar earned by a man.
What is Inequality or Gini Index in Catheys Valley?
Inequality or Gini Index in Catheys Valley is 0.45.
What is the Total Population of Catheys Valley?
Total Population of Catheys Valley is 723.
What is the Total Male Population of Catheys Valley?
Total Male Population of Catheys Valley is 330.
What is the Total Female Population of Catheys Valley?
Total Female Population of Catheys Valley is 393.
What is the Ratio of Males per 100 Females in Catheys Valley?
There are 83.97 Males per 100 Females in Catheys Valley.
What is the Ratio of Females per 100 Males in Catheys Valley?
There are 119.09 Females per 100 Males in Catheys Valley.
What is the Median Population Age in Catheys Valley?
Median Population Age in Catheys Valley is 60.7 Years.
What is the Average Family Size in Catheys Valley
Average Family Size in Catheys Valley is 2.3 People.
What is the Average Household Size in Catheys Valley
Average Household Size in Catheys Valley is 2.0 People.
How Large is the Labor Force in Catheys Valley?
There are 232 People in the Labor Forcein in Catheys Valley.
What is the Percentage of People in the Labor Force in Catheys Valley?
35.9% of People are in the Labor Force in Catheys Valley.
What is the Unemployment Rate in Catheys Valley?
Unemployment Rate in Catheys Valley is 4.3%.