Castroville, CA Map & Demographics
Castroville Map
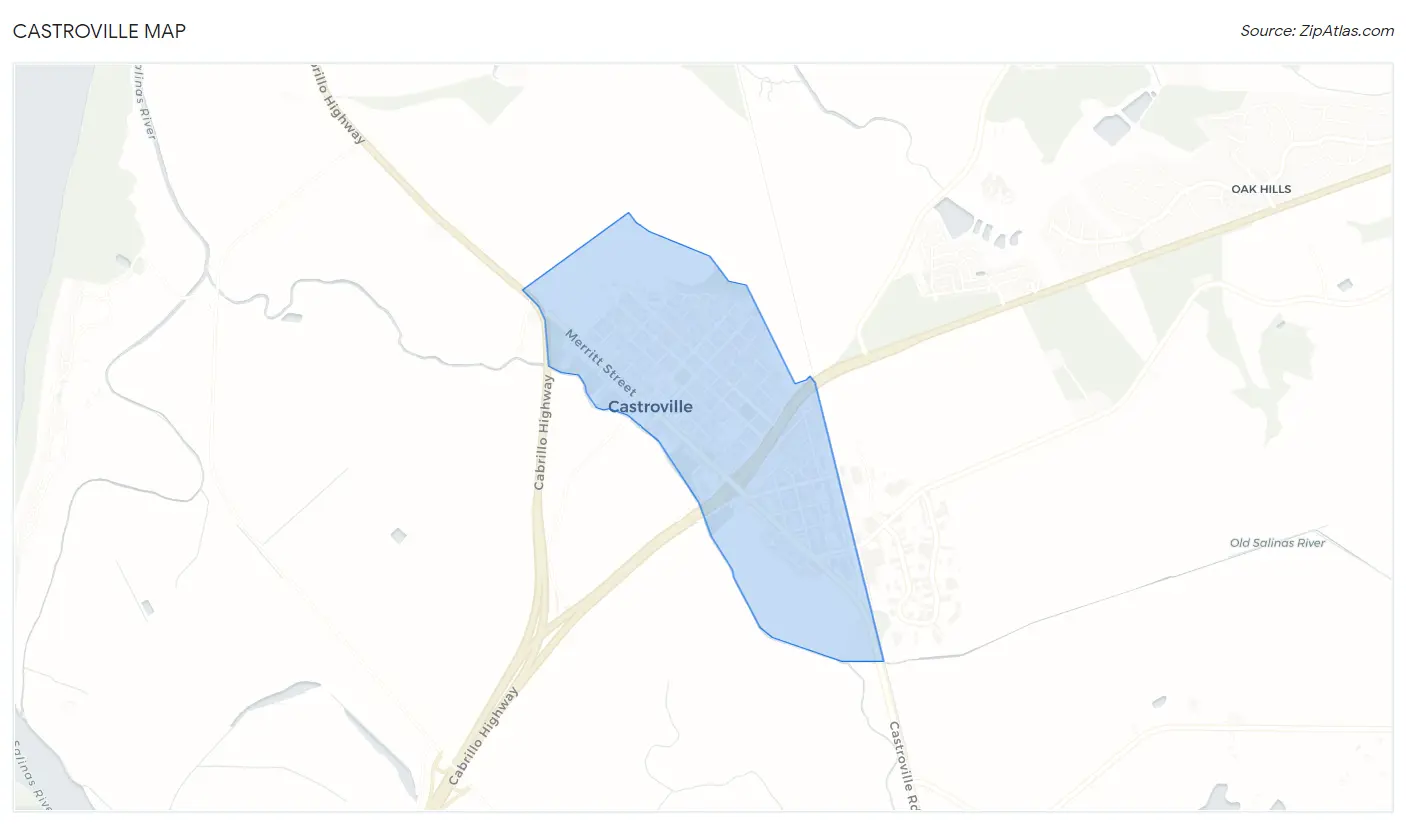
Castroville Overview
$18,689
PER CAPITA INCOME
$73,750
AVG FAMILY INCOME
$74,592
AVG HOUSEHOLD INCOME
16.5%
WAGE / INCOME GAP [ % ]
83.5¢/ $1
WAGE / INCOME GAP [ $ ]
$15,365
FAMILY INCOME DEFICIT
0.33
INEQUALITY / GINI INDEX
6,620
TOTAL POPULATION
3,405
MALE POPULATION
3,215
FEMALE POPULATION
105.91
MALES / 100 FEMALES
94.42
FEMALES / 100 MALES
30.0
MEDIAN AGE
4.5
AVG FAMILY SIZE
4.5
AVG HOUSEHOLD SIZE
2,771
LABOR FORCE [ PEOPLE ]
61.9%
PERCENT IN LABOR FORCE
2.6%
UNEMPLOYMENT RATE
Castroville Zip Codes
Castroville Area Codes
Income in Castroville
Income Overview in Castroville
Per Capita Income in Castroville is $18,689, while median incomes of families and households are $73,750 and $74,592 respectively.
| Characteristic | Number | Measure |
| Per Capita Income | 6,620 | $18,689 |
| Median Family Income | 1,316 | $73,750 |
| Mean Family Income | 1,316 | $80,559 |
| Median Household Income | 1,474 | $74,592 |
| Mean Household Income | 1,474 | $82,973 |
| Income Deficit | 1,316 | $15,365 |
| Wage / Income Gap (%) | 6,620 | 16.50% |
| Wage / Income Gap ($) | 6,620 | 83.50¢ per $1 |
| Gini / Inequality Index | 6,620 | 0.33 |
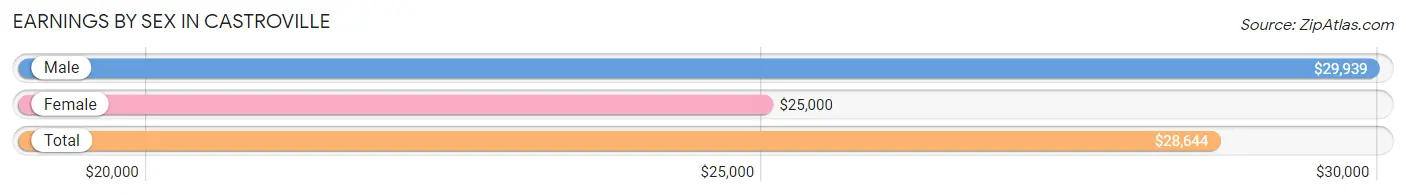
Earnings by Sex in Castroville
Average Earnings in Castroville are $28,644, $29,939 for men and $25,000 for women, a difference of 16.5%.
| Sex | Number | Average Earnings |
| Male | 1,620 (56.6%) | $29,939 |
| Female | 1,242 (43.4%) | $25,000 |
| Total | 2,862 (100.0%) | $28,644 |
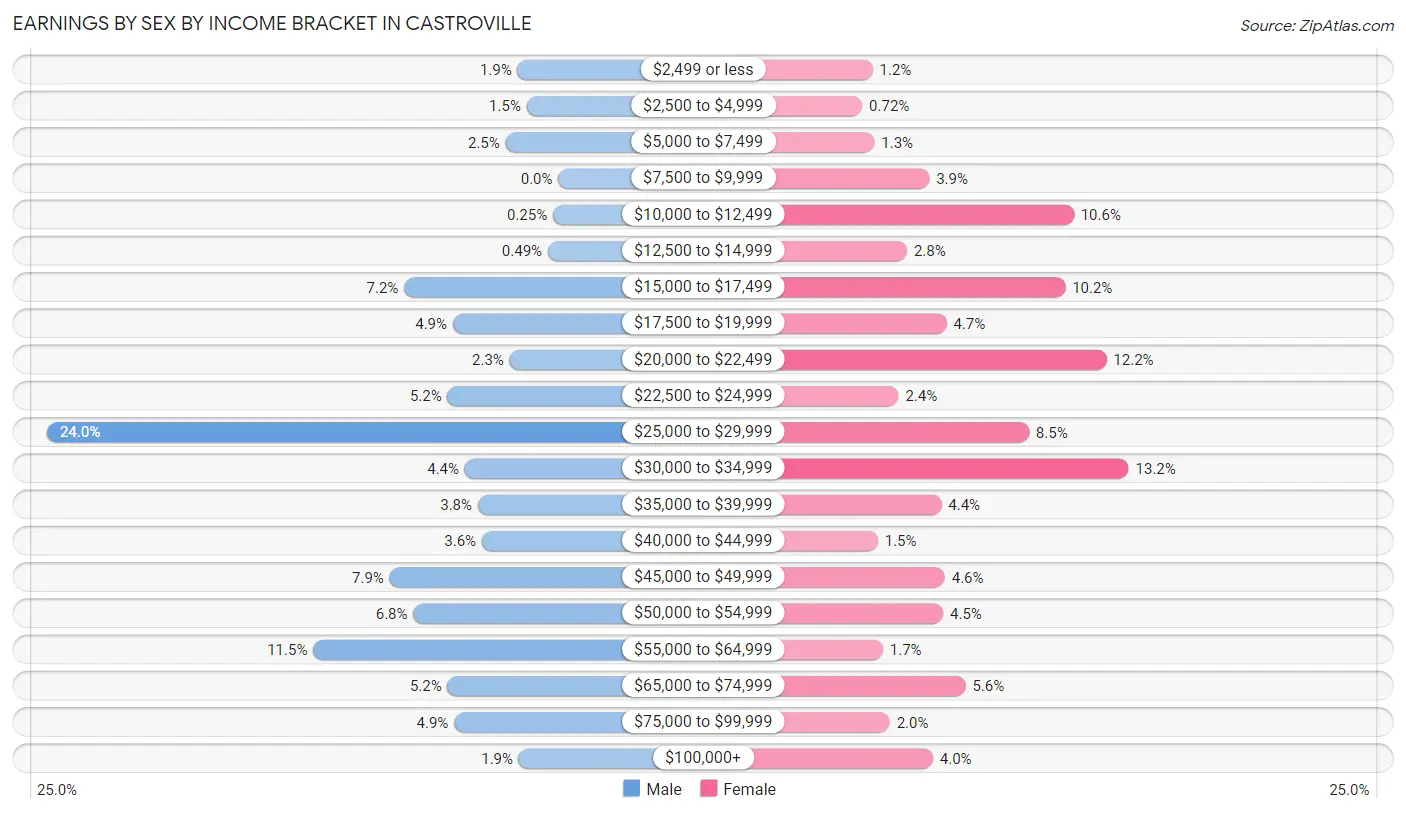
Earnings by Sex by Income Bracket in Castroville
The most common earnings brackets in Castroville are $25,000 to $29,999 for men (388 | 23.9%) and $30,000 to $34,999 for women (164 | 13.2%).
| Income | Male | Female |
| $2,499 or less | 31 (1.9%) | 15 (1.2%) |
| $2,500 to $4,999 | 24 (1.5%) | 9 (0.7%) |
| $5,000 to $7,499 | 40 (2.5%) | 16 (1.3%) |
| $7,500 to $9,999 | 0 (0.0%) | 48 (3.9%) |
| $10,000 to $12,499 | 4 (0.3%) | 132 (10.6%) |
| $12,500 to $14,999 | 8 (0.5%) | 35 (2.8%) |
| $15,000 to $17,499 | 117 (7.2%) | 127 (10.2%) |
| $17,500 to $19,999 | 80 (4.9%) | 58 (4.7%) |
| $20,000 to $22,499 | 37 (2.3%) | 151 (12.2%) |
| $22,500 to $24,999 | 84 (5.2%) | 30 (2.4%) |
| $25,000 to $29,999 | 388 (23.9%) | 106 (8.5%) |
| $30,000 to $34,999 | 71 (4.4%) | 164 (13.2%) |
| $35,000 to $39,999 | 61 (3.8%) | 55 (4.4%) |
| $40,000 to $44,999 | 58 (3.6%) | 18 (1.5%) |
| $45,000 to $49,999 | 128 (7.9%) | 57 (4.6%) |
| $50,000 to $54,999 | 110 (6.8%) | 56 (4.5%) |
| $55,000 to $64,999 | 186 (11.5%) | 21 (1.7%) |
| $65,000 to $74,999 | 84 (5.2%) | 69 (5.6%) |
| $75,000 to $99,999 | 79 (4.9%) | 25 (2.0%) |
| $100,000+ | 30 (1.8%) | 50 (4.0%) |
| Total | 1,620 (100.0%) | 1,242 (100.0%) |
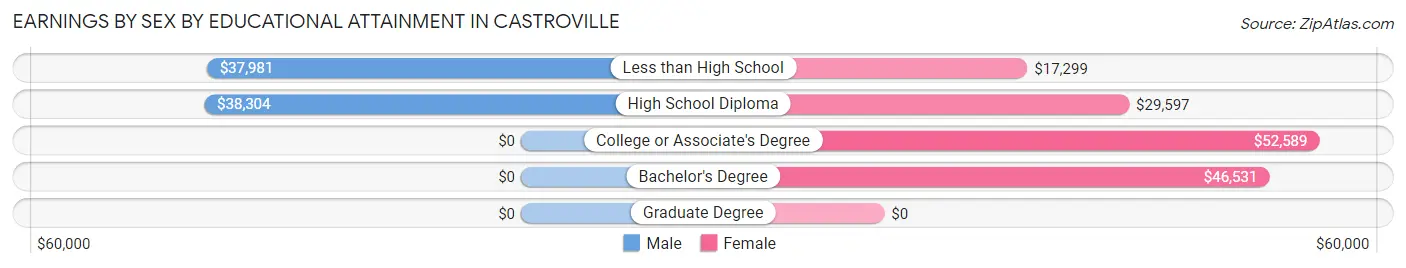
Earnings by Sex by Educational Attainment in Castroville
Average earnings in Castroville are $36,125 for men and $27,407 for women, a difference of 24.1%. Men with an educational attainment of high school diploma enjoy the highest average annual earnings of $38,304, while those with less than high school education earn the least with $37,981. Women with an educational attainment of college or associate's degree earn the most with the average annual earnings of $52,589, while those with less than high school education have the smallest earnings of $17,299.
| Educational Attainment | Male Income | Female Income |
| Less than High School | $37,981 | $17,299 |
| High School Diploma | $38,304 | $29,597 |
| College or Associate's Degree | - | - |
| Bachelor's Degree | - | - |
| Graduate Degree | - | - |
| Total | $36,125 | $27,407 |
Family Income in Castroville
Family Income Brackets in Castroville
According to the Castroville family income data, there are 303 families falling into the $50,000 to $74,999 income range, which is the most common income bracket and makes up 23.0% of all families. Conversely, the $200,000+ income bracket is the least frequent group with only 17 families (1.3%) belonging to this category.
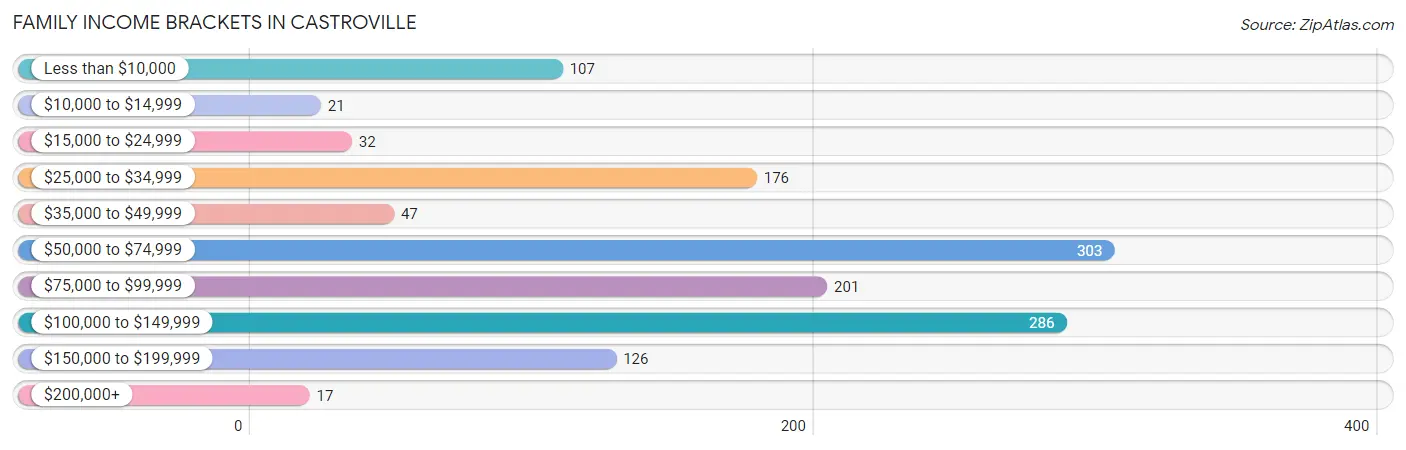
| Income Bracket | # Families | % Families |
| Less than $10,000 | 107 | 8.1% |
| $10,000 to $14,999 | 21 | 1.6% |
| $15,000 to $24,999 | 32 | 2.4% |
| $25,000 to $34,999 | 176 | 13.4% |
| $35,000 to $49,999 | 47 | 3.6% |
| $50,000 to $74,999 | 303 | 23.0% |
| $75,000 to $99,999 | 201 | 15.3% |
| $100,000 to $149,999 | 286 | 21.7% |
| $150,000 to $199,999 | 126 | 9.6% |
| $200,000+ | 17 | 1.3% |
Family Income by Famaliy Size in Castroville
7+ person families (196 | 14.9%) account for the highest median family income in Castroville with $127,941 per family, while 2-person families (182 | 13.8%) have the highest median income of $33,958 per family member.
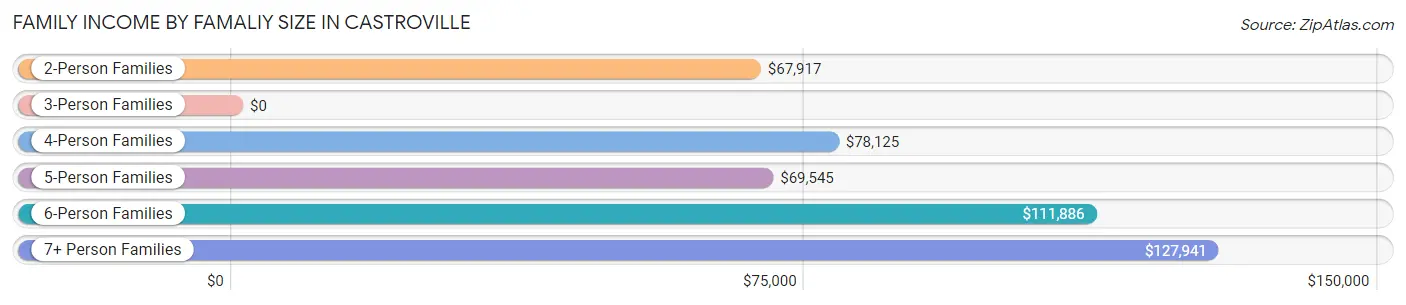
| Income Bracket | # Families | Median Income |
| 2-Person Families | 182 (13.8%) | $67,917 |
| 3-Person Families | 183 (13.9%) | $0 |
| 4-Person Families | 470 (35.7%) | $78,125 |
| 5-Person Families | 190 (14.4%) | $69,545 |
| 6-Person Families | 95 (7.2%) | $111,886 |
| 7+ Person Families | 196 (14.9%) | $127,941 |
| Total | 1,316 (100.0%) | $73,750 |
Family Income by Number of Earners in Castroville
The median family income in Castroville is $73,750, with families comprising 3+ earners (329) having the highest median family income of $117,109, while families with no earners (116) have the lowest median family income of $2,499, accounting for 25.0% and 8.8% of families, respectively.
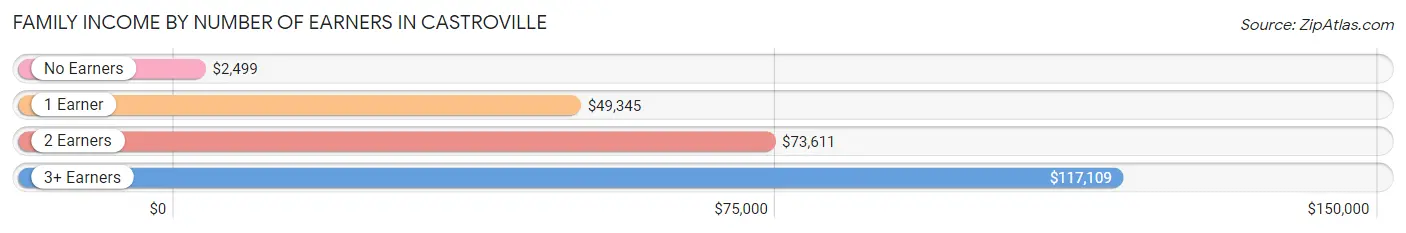
| Number of Earners | # Families | Median Income |
| No Earners | 116 (8.8%) | $2,499 |
| 1 Earner | 407 (30.9%) | $49,345 |
| 2 Earners | 464 (35.3%) | $73,611 |
| 3+ Earners | 329 (25.0%) | $117,109 |
| Total | 1,316 (100.0%) | $73,750 |
Household Income in Castroville
Household Income Brackets in Castroville
With 379 households falling in the category, the $50,000 to $74,999 income range is the most frequent in Castroville, accounting for 25.7% of all households. In contrast, only 21 households (1.4%) fall into the $10,000 to $14,999 income bracket, making it the least populous group.
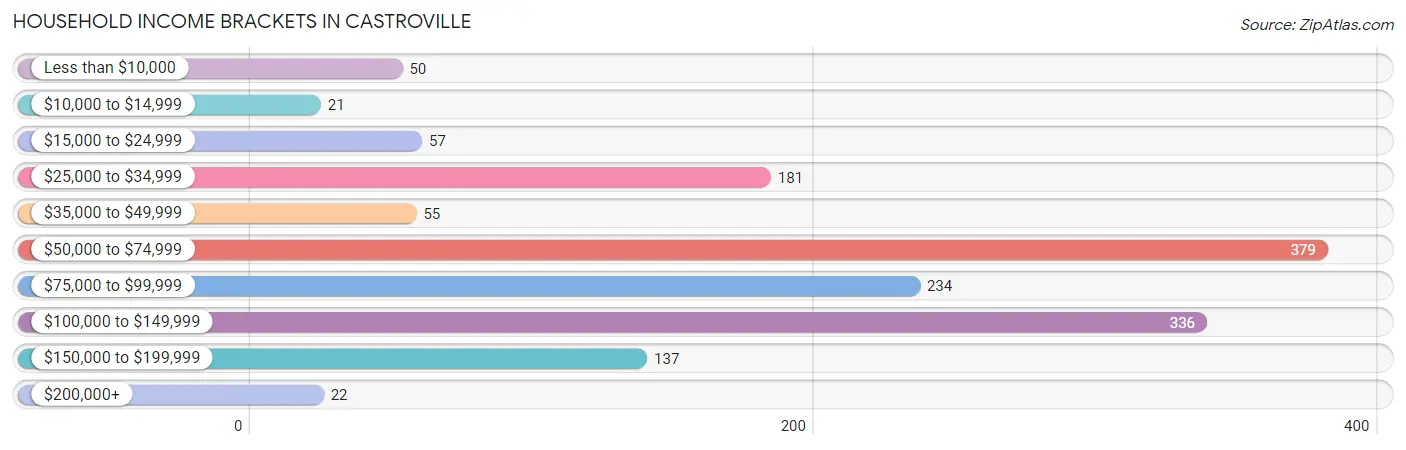
| Income Bracket | # Households | % Households |
| Less than $10,000 | 50 | 3.4% |
| $10,000 to $14,999 | 21 | 1.4% |
| $15,000 to $24,999 | 57 | 3.9% |
| $25,000 to $34,999 | 181 | 12.3% |
| $35,000 to $49,999 | 55 | 3.7% |
| $50,000 to $74,999 | 379 | 25.7% |
| $75,000 to $99,999 | 234 | 15.9% |
| $100,000 to $149,999 | 336 | 22.8% |
| $150,000 to $199,999 | 137 | 9.3% |
| $200,000+ | 22 | 1.5% |
Household Income by Householder Age in Castroville
The median household income in Castroville is $74,592, with the highest median household income of $104,844 found in the 45 to 64 years age bracket for the primary householder. A total of 491 households (33.3%) fall into this category. Meanwhile, the 15 to 24 years age bracket for the primary householder has the lowest median household income of $0, with 66 households (4.5%) in this group.
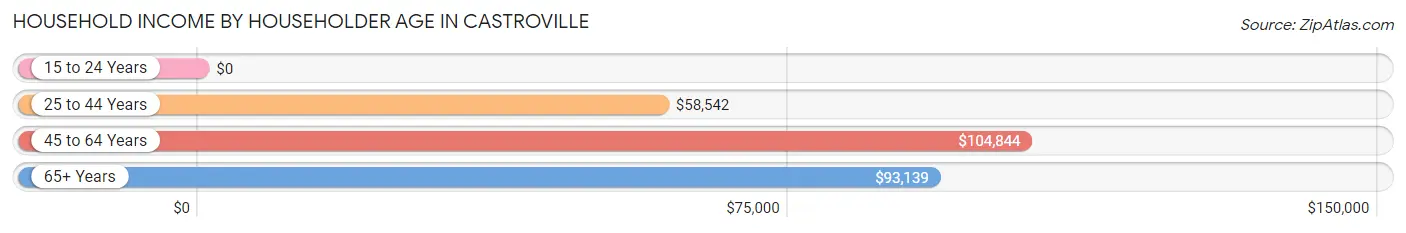
| Income Bracket | # Households | Median Income |
| 15 to 24 Years | 66 (4.5%) | $0 |
| 25 to 44 Years | 550 (37.3%) | $58,542 |
| 45 to 64 Years | 491 (33.3%) | $104,844 |
| 65+ Years | 367 (24.9%) | $93,139 |
| Total | 1,474 (100.0%) | $74,592 |
Poverty in Castroville
Income Below Poverty by Sex and Age in Castroville
With 16.1% poverty level for males and 17.9% for females among the residents of Castroville, 18 to 24 year old males and 55 to 64 year old females are the most vulnerable to poverty, with 95 males (43.8%) and 97 females (48.7%) in their respective age groups living below the poverty level.
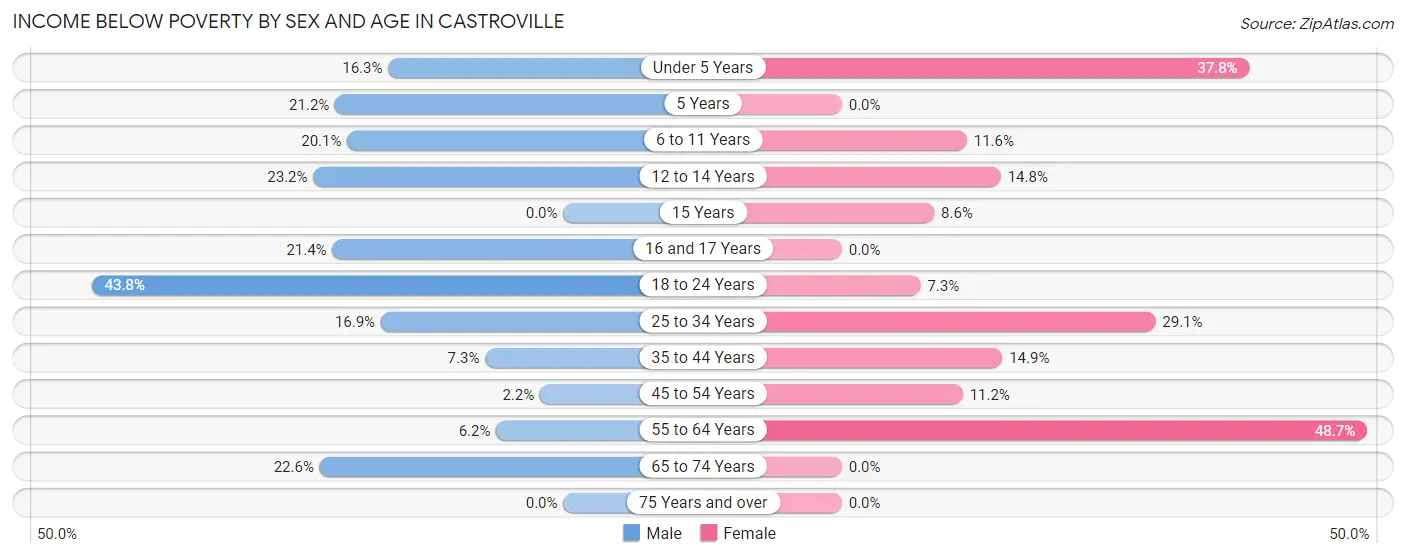
| Age Bracket | Male | Female |
| Under 5 Years | 26 (16.3%) | 115 (37.8%) |
| 5 Years | 36 (21.2%) | 0 (0.0%) |
| 6 to 11 Years | 80 (20.1%) | 50 (11.6%) |
| 12 to 14 Years | 71 (23.2%) | 9 (14.7%) |
| 15 Years | 0 (0.0%) | 9 (8.6%) |
| 16 and 17 Years | 18 (21.4%) | 0 (0.0%) |
| 18 to 24 Years | 95 (43.8%) | 20 (7.3%) |
| 25 to 34 Years | 96 (16.9%) | 195 (29.1%) |
| 35 to 44 Years | 40 (7.2%) | 46 (14.9%) |
| 45 to 54 Years | 7 (2.2%) | 34 (11.2%) |
| 55 to 64 Years | 15 (6.2%) | 97 (48.7%) |
| 65 to 74 Years | 64 (22.6%) | 0 (0.0%) |
| 75 Years and over | 0 (0.0%) | 0 (0.0%) |
| Total | 548 (16.1%) | 575 (17.9%) |
Income Above Poverty by Sex and Age in Castroville
According to the poverty statistics in Castroville, males aged 15 years and females aged 5 years are the age groups that are most secure financially, with 100.0% of males and 100.0% of females in these age groups living above the poverty line.
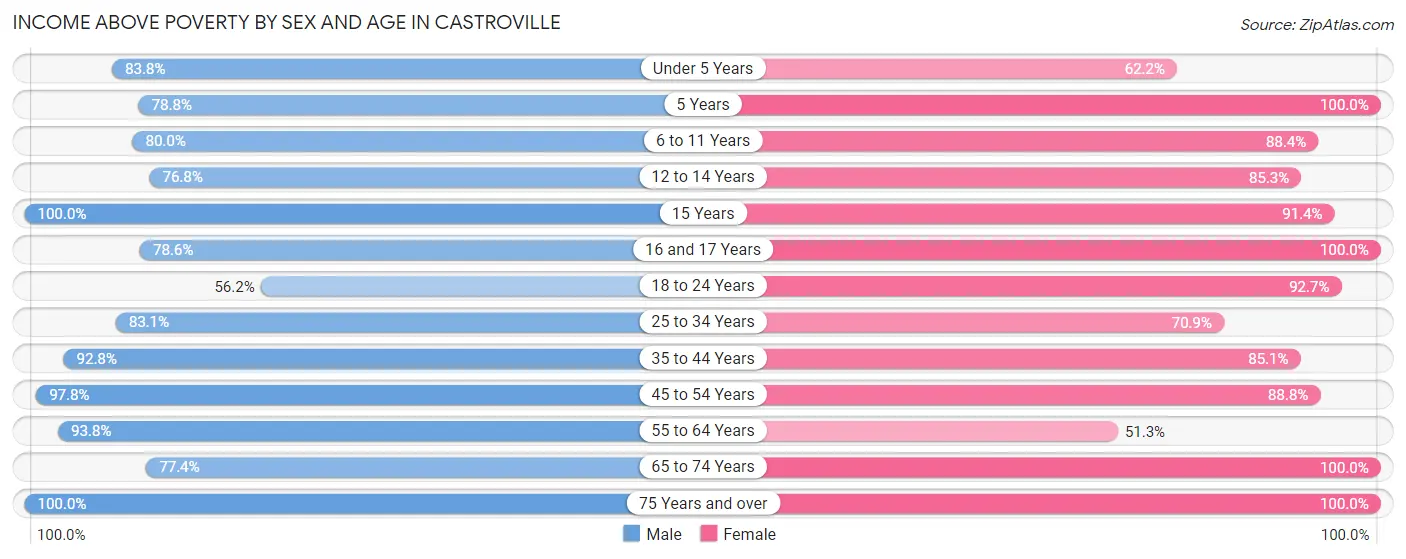
| Age Bracket | Male | Female |
| Under 5 Years | 134 (83.8%) | 189 (62.2%) |
| 5 Years | 134 (78.8%) | 196 (100.0%) |
| 6 to 11 Years | 319 (79.9%) | 381 (88.4%) |
| 12 to 14 Years | 235 (76.8%) | 52 (85.3%) |
| 15 Years | 11 (100.0%) | 96 (91.4%) |
| 16 and 17 Years | 66 (78.6%) | 43 (100.0%) |
| 18 to 24 Years | 122 (56.2%) | 254 (92.7%) |
| 25 to 34 Years | 471 (83.1%) | 475 (70.9%) |
| 35 to 44 Years | 512 (92.7%) | 263 (85.1%) |
| 45 to 54 Years | 317 (97.8%) | 269 (88.8%) |
| 55 to 64 Years | 226 (93.8%) | 102 (51.3%) |
| 65 to 74 Years | 219 (77.4%) | 294 (100.0%) |
| 75 Years and over | 91 (100.0%) | 26 (100.0%) |
| Total | 2,857 (83.9%) | 2,640 (82.1%) |
Income Below Poverty Among Married-Couple Families in Castroville
The poverty statistics for married-couple families in Castroville show that 9.2% or 78 of the total 851 families live below the poverty line. Families with 5 or more children have the highest poverty rate of 100.0%, comprising of 8 families. On the other hand, families with 1 or 2 children have the lowest poverty rate of 0.0%, which includes 0 families.
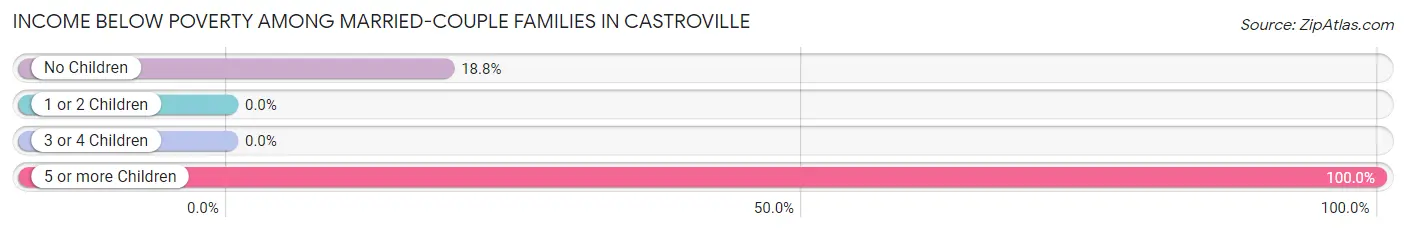
| Children | Above Poverty | Below Poverty |
| No Children | 302 (81.2%) | 70 (18.8%) |
| 1 or 2 Children | 362 (100.0%) | 0 (0.0%) |
| 3 or 4 Children | 109 (100.0%) | 0 (0.0%) |
| 5 or more Children | 0 (0.0%) | 8 (100.0%) |
| Total | 773 (90.8%) | 78 (9.2%) |
Income Below Poverty Among Single-Parent Households in Castroville
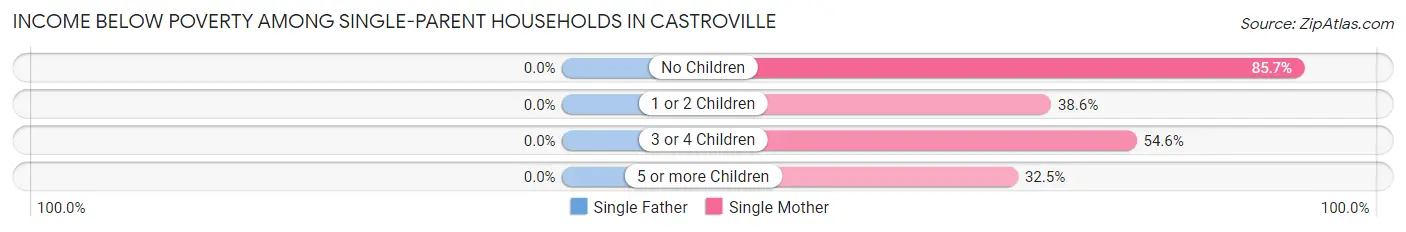
| Children | Single Father | Single Mother |
| No Children | 0 (0.0%) | 18 (85.7%) |
| 1 or 2 Children | 0 (0.0%) | 73 (38.6%) |
| 3 or 4 Children | 0 (0.0%) | 36 (54.5%) |
| 5 or more Children | 0 (0.0%) | 25 (32.5%) |
| Total | 0 (0.0%) | 152 (43.1%) |
Income Below Poverty Among Married-Couple vs Single-Parent Households in Castroville
The poverty data for Castroville shows that 78 of the married-couple family households (9.2%) and 152 of the single-parent households (32.7%) are living below the poverty level. Within the married-couple family households, those with 5 or more children have the highest poverty rate, with 8 households (100.0%) falling below the poverty line. Among the single-parent households, those with 3 or 4 children have the highest poverty rate, with 36 household (40.0%) living below poverty.
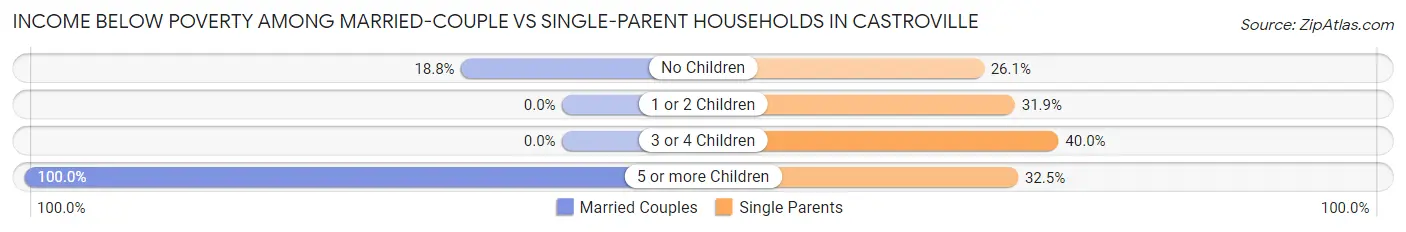
| Children | Married-Couple Families | Single-Parent Households |
| No Children | 70 (18.8%) | 18 (26.1%) |
| 1 or 2 Children | 0 (0.0%) | 73 (31.9%) |
| 3 or 4 Children | 0 (0.0%) | 36 (40.0%) |
| 5 or more Children | 8 (100.0%) | 25 (32.5%) |
| Total | 78 (9.2%) | 152 (32.7%) |
Race in Castroville
The most populous races in Castroville are Hispanic or Latino (5,697 | 86.1%), Some other Race (4,194 | 63.3%), and White / Caucasian (1,343 | 20.3%).
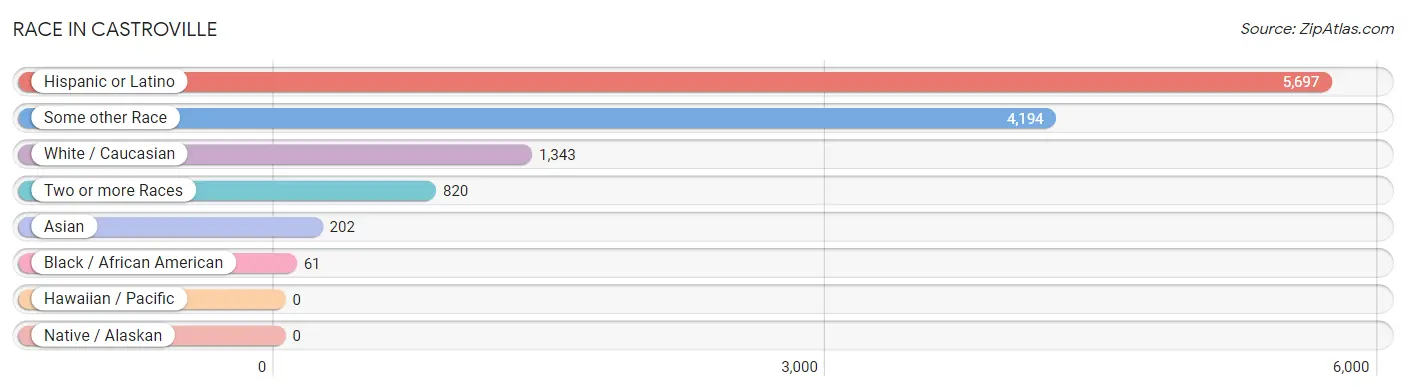
| Race | # Population | % Population |
| Asian | 202 | 3.0% |
| Black / African American | 61 | 0.9% |
| Hawaiian / Pacific | 0 | 0.0% |
| Hispanic or Latino | 5,697 | 86.1% |
| Native / Alaskan | 0 | 0.0% |
| White / Caucasian | 1,343 | 20.3% |
| Two or more Races | 820 | 12.4% |
| Some other Race | 4,194 | 63.3% |
| Total | 6,620 | 100.0% |
Ancestry in Castroville
The most populous ancestries reported in Castroville are Mexican (5,393 | 81.5%), Mexican American Indian (320 | 4.8%), English (153 | 2.3%), Irish (132 | 2.0%), and Indian (Asian) (129 | 1.9%), together accounting for 92.5% of all Castroville residents.
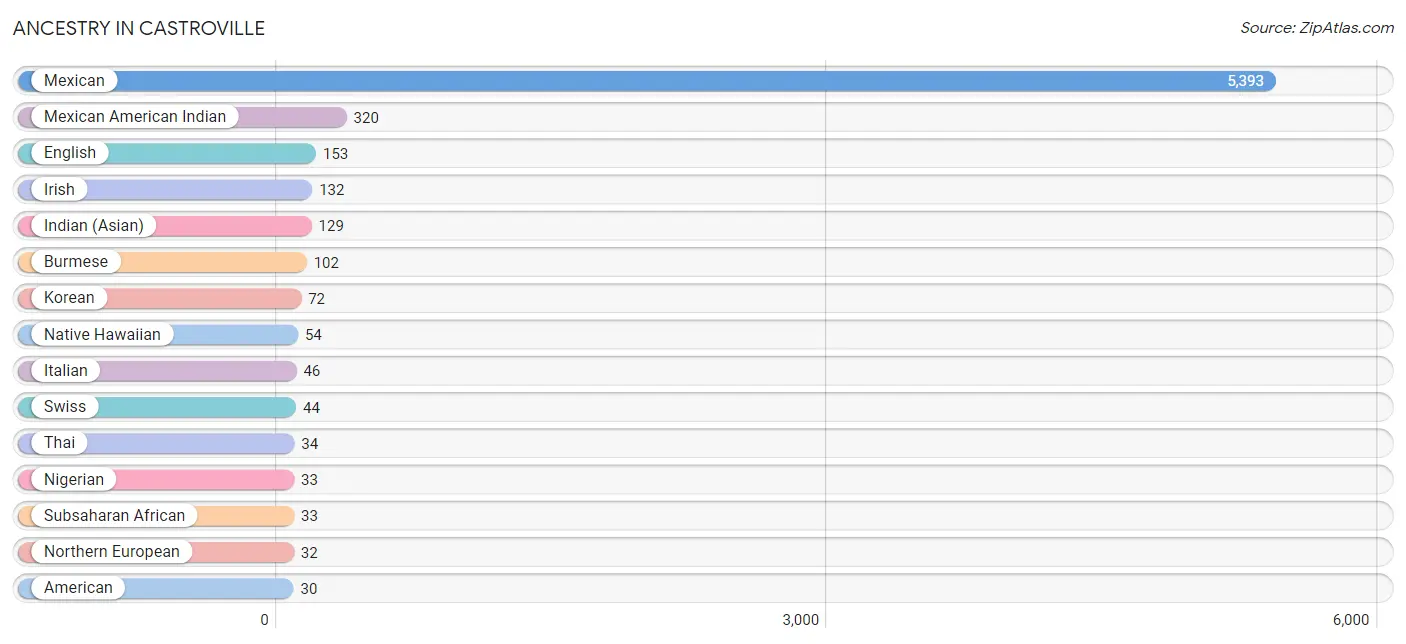
| Ancestry | # Population | % Population |
| American | 30 | 0.4% |
| Bhutanese | 27 | 0.4% |
| Burmese | 102 | 1.5% |
| Cherokee | 20 | 0.3% |
| Eastern European | 2 | 0.0% |
| English | 153 | 2.3% |
| European | 8 | 0.1% |
| German | 7 | 0.1% |
| Greek | 8 | 0.1% |
| Indian (Asian) | 129 | 1.9% |
| Irish | 132 | 2.0% |
| Italian | 46 | 0.7% |
| Korean | 72 | 1.1% |
| Mexican | 5,393 | 81.5% |
| Mexican American Indian | 320 | 4.8% |
| Native Hawaiian | 54 | 0.8% |
| Nigerian | 33 | 0.5% |
| Northern European | 32 | 0.5% |
| Scottish | 3 | 0.1% |
| Subsaharan African | 33 | 0.5% |
| Swiss | 44 | 0.7% |
| Thai | 34 | 0.5% | View All 22 Rows |
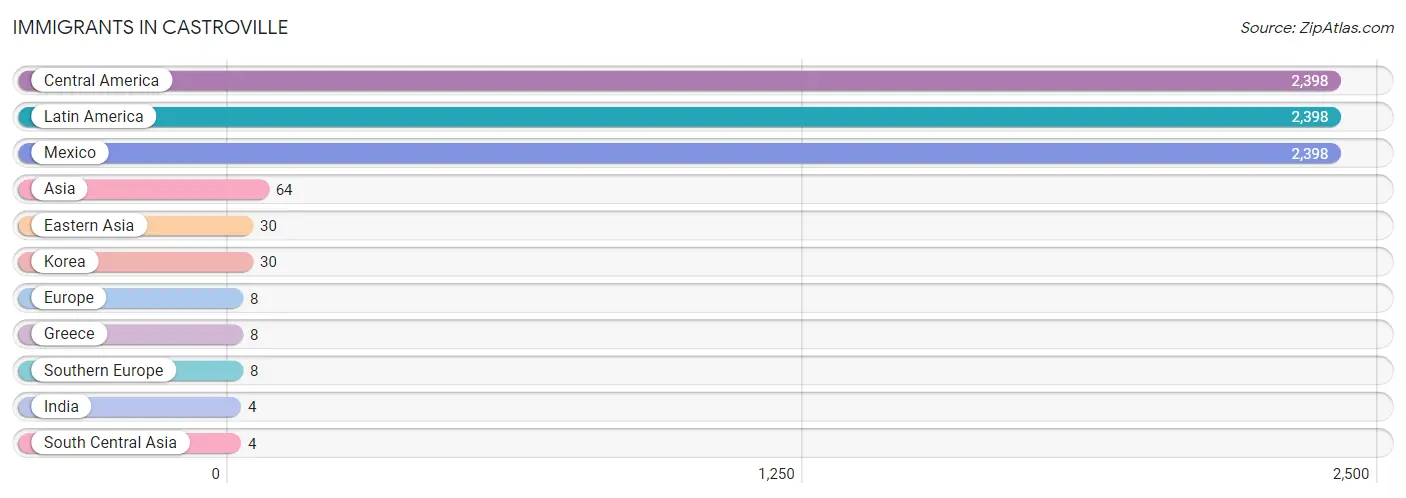
Immigrants in Castroville
The most numerous immigrant groups reported in Castroville came from Central America (2,398 | 36.2%), Latin America (2,398 | 36.2%), Mexico (2,398 | 36.2%), Asia (64 | 1.0%), and Eastern Asia (30 | 0.4%), together accounting for 110.1% of all Castroville residents.
| Immigration Origin | # Population | % Population |
| Asia | 64 | 1.0% |
| Central America | 2,398 | 36.2% |
| Eastern Asia | 30 | 0.4% |
| Europe | 8 | 0.1% |
| Greece | 8 | 0.1% |
| India | 4 | 0.1% |
| Korea | 30 | 0.4% |
| Latin America | 2,398 | 36.2% |
| Mexico | 2,398 | 36.2% |
| South Central Asia | 4 | 0.1% |
| Southern Europe | 8 | 0.1% | View All 11 Rows |
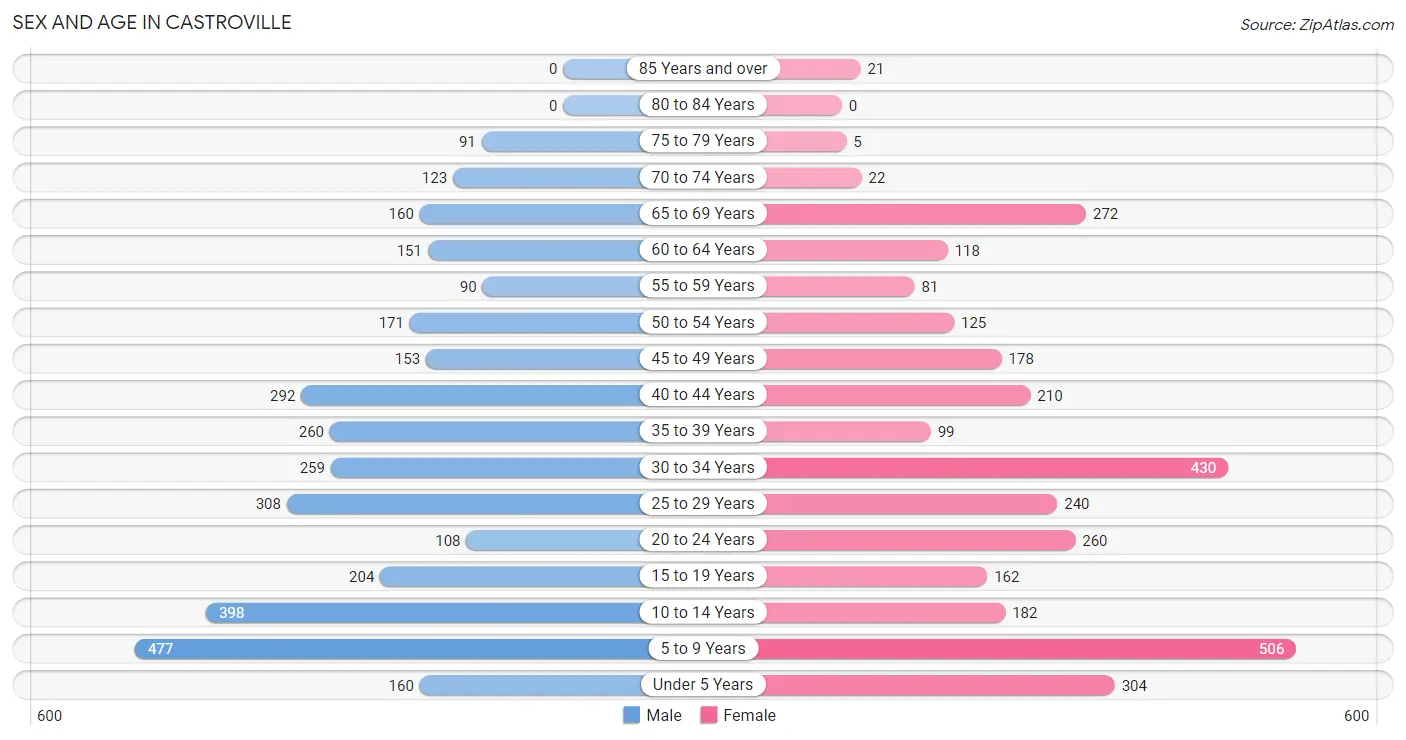
Sex and Age in Castroville
Sex and Age in Castroville
The most populous age groups in Castroville are 5 to 9 Years (477 | 14.0%) for men and 5 to 9 Years (506 | 15.7%) for women.
| Age Bracket | Male | Female |
| Under 5 Years | 160 (4.7%) | 304 (9.5%) |
| 5 to 9 Years | 477 (14.0%) | 506 (15.7%) |
| 10 to 14 Years | 398 (11.7%) | 182 (5.7%) |
| 15 to 19 Years | 204 (6.0%) | 162 (5.0%) |
| 20 to 24 Years | 108 (3.2%) | 260 (8.1%) |
| 25 to 29 Years | 308 (9.0%) | 240 (7.5%) |
| 30 to 34 Years | 259 (7.6%) | 430 (13.4%) |
| 35 to 39 Years | 260 (7.6%) | 99 (3.1%) |
| 40 to 44 Years | 292 (8.6%) | 210 (6.5%) |
| 45 to 49 Years | 153 (4.5%) | 178 (5.5%) |
| 50 to 54 Years | 171 (5.0%) | 125 (3.9%) |
| 55 to 59 Years | 90 (2.6%) | 81 (2.5%) |
| 60 to 64 Years | 151 (4.4%) | 118 (3.7%) |
| 65 to 69 Years | 160 (4.7%) | 272 (8.5%) |
| 70 to 74 Years | 123 (3.6%) | 22 (0.7%) |
| 75 to 79 Years | 91 (2.7%) | 5 (0.2%) |
| 80 to 84 Years | 0 (0.0%) | 0 (0.0%) |
| 85 Years and over | 0 (0.0%) | 21 (0.6%) |
| Total | 3,405 (100.0%) | 3,215 (100.0%) |
Families and Households in Castroville
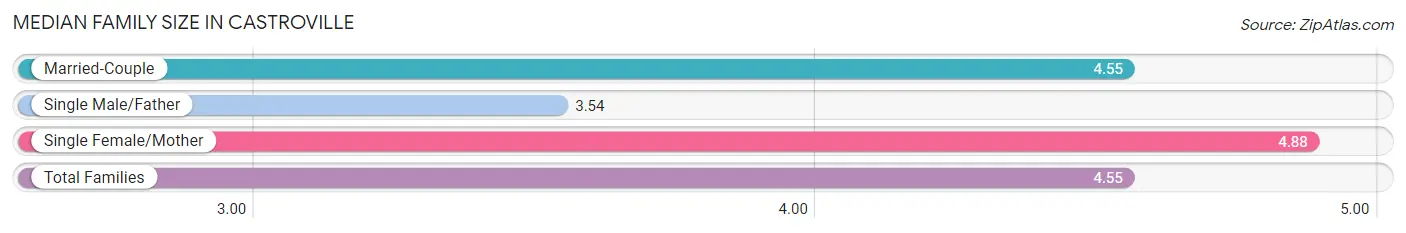
Median Family Size in Castroville
The median family size in Castroville is 4.55 persons per family, with single female/mother families (353 | 26.8%) accounting for the largest median family size of 4.88 persons per family. On the other hand, single male/father families (112 | 8.5%) represent the smallest median family size with 3.54 persons per family.
| Family Type | # Families | Family Size |
| Married-Couple | 851 (64.7%) | 4.55 |
| Single Male/Father | 112 (8.5%) | 3.54 |
| Single Female/Mother | 353 (26.8%) | 4.88 |
| Total Families | 1,316 (100.0%) | 4.55 |
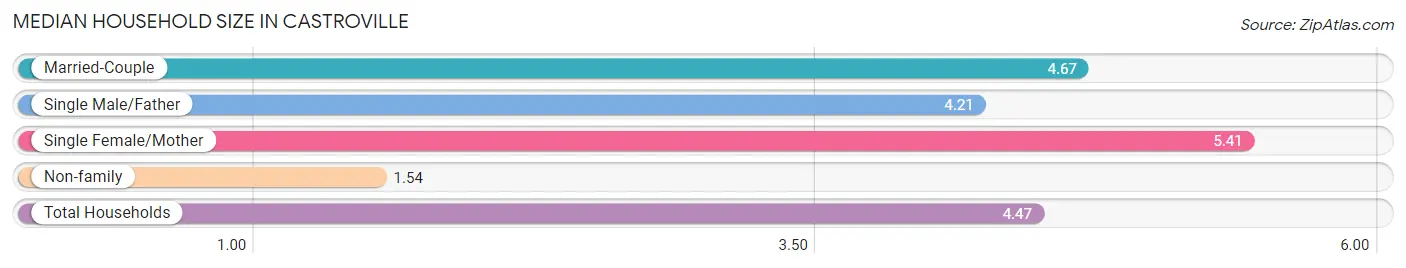
Median Household Size in Castroville
The median household size in Castroville is 4.47 persons per household, with single female/mother households (353 | 23.9%) accounting for the largest median household size of 5.41 persons per household. non-family households (158 | 10.7%) represent the smallest median household size with 1.54 persons per household.
| Household Type | # Households | Household Size |
| Married-Couple | 851 (57.7%) | 4.67 |
| Single Male/Father | 112 (7.6%) | 4.21 |
| Single Female/Mother | 353 (23.9%) | 5.41 |
| Non-family | 158 (10.7%) | 1.54 |
| Total Households | 1,474 (100.0%) | 4.47 |
Household Size by Marriage Status in Castroville
Out of a total of 1,474 households in Castroville, 1,316 (89.3%) are family households, while 158 (10.7%) are nonfamily households. The most numerous type of family households are 4-person households, comprising 393, and the most common type of nonfamily households are 1-person households, comprising 81.
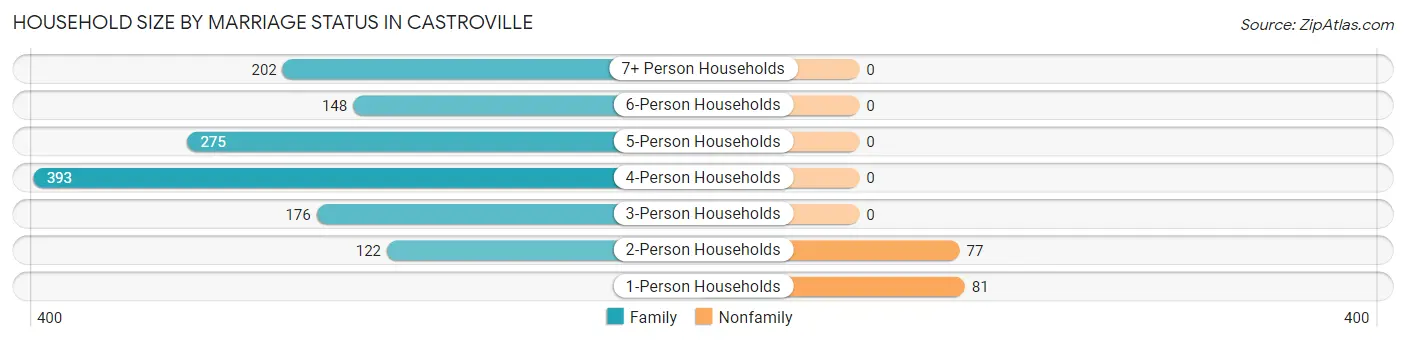
| Household Size | Family Households | Nonfamily Households |
| 1-Person Households | - | 81 (5.5%) |
| 2-Person Households | 122 (8.3%) | 77 (5.2%) |
| 3-Person Households | 176 (11.9%) | 0 (0.0%) |
| 4-Person Households | 393 (26.7%) | 0 (0.0%) |
| 5-Person Households | 275 (18.7%) | 0 (0.0%) |
| 6-Person Households | 148 (10.0%) | 0 (0.0%) |
| 7+ Person Households | 202 (13.7%) | 0 (0.0%) |
| Total | 1,316 (89.3%) | 158 (10.7%) |
Female Fertility in Castroville
Fertility by Age in Castroville
Average fertility rate in Castroville is 26.0 births per 1,000 women. Women in the age bracket of 20 to 34 years have the highest fertility rate with 37.0 births per 1,000 women. Women in the age bracket of 20 to 34 years acount for 82.9% of all women with births.
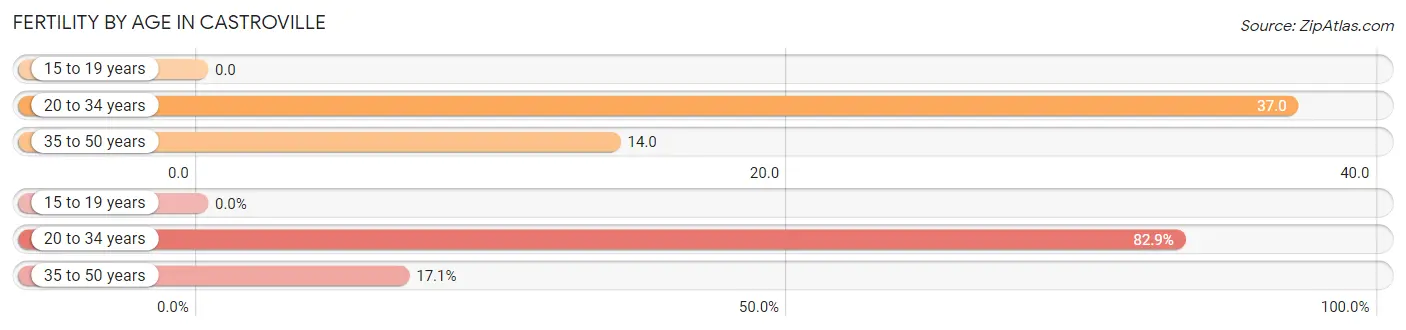
| Age Bracket | Women with Births | Births / 1,000 Women |
| 15 to 19 years | 0 (0.0%) | 0.0 |
| 20 to 34 years | 34 (82.9%) | 37.0 |
| 35 to 50 years | 7 (17.1%) | 14.0 |
| Total | 41 (100.0%) | 26.0 |
Fertility by Age by Marriage Status in Castroville
41.5% of women with births (41) in Castroville are married. The highest percentage of unmarried women with births falls into 20 to 34 years age bracket with 70.6% of them unmarried at the time of birth, while the lowest percentage of unmarried women with births belong to 35 to 50 years age bracket with 0.0% of them unmarried.
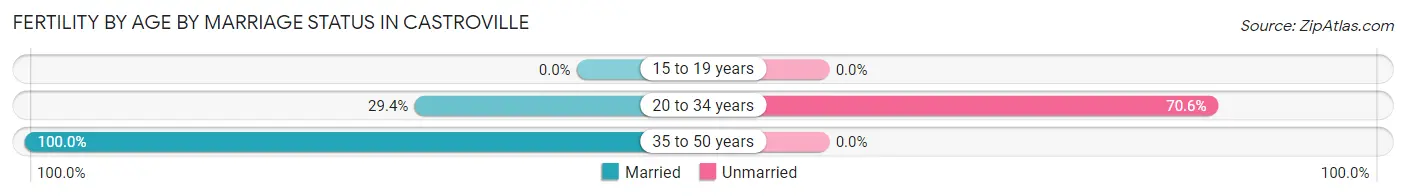
| Age Bracket | Married | Unmarried |
| 15 to 19 years | 0 (0.0%) | 0 (0.0%) |
| 20 to 34 years | 10 (29.4%) | 24 (70.6%) |
| 35 to 50 years | 7 (100.0%) | 0 (0.0%) |
| Total | 17 (41.5%) | 24 (58.5%) |
Fertility by Education in Castroville
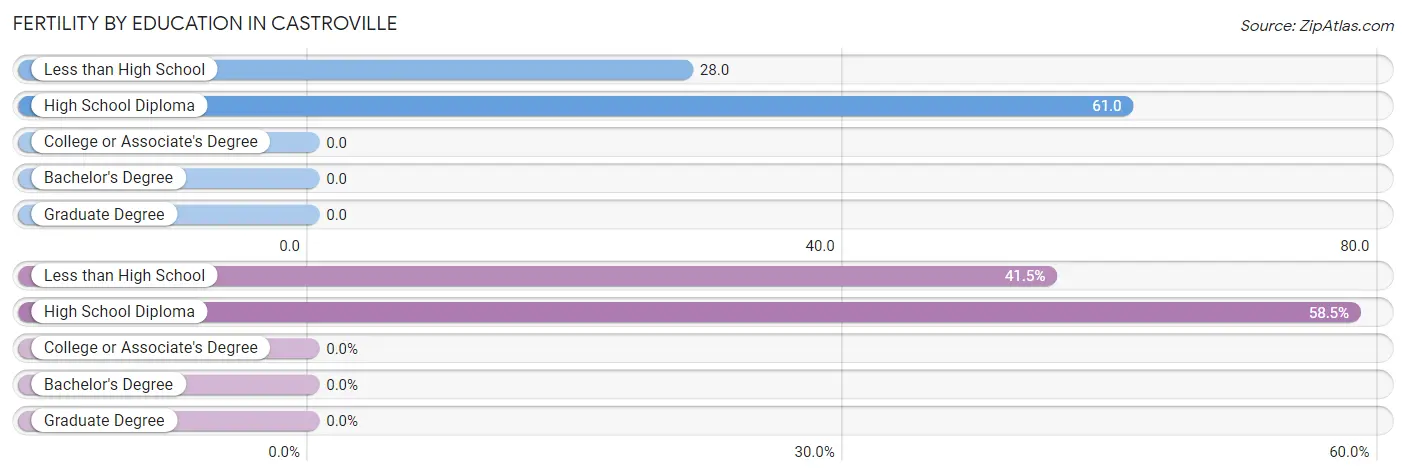
| Educational Attainment | Women with Births | Births / 1,000 Women |
| Less than High School | 17 (41.5%) | 28.0 |
| High School Diploma | 24 (58.5%) | 61.0 |
| College or Associate's Degree | 0 (0.0%) | 0.0 |
| Bachelor's Degree | 0 (0.0%) | 0.0 |
| Graduate Degree | 0 (0.0%) | 0.0 |
| Total | 41 (100.0%) | 26.0 |
Fertility by Education by Marriage Status in Castroville
58.5% of women with births in Castroville are unmarried. Women with the educational attainment of less than high school are most likely to be married with 100.0% of them married at childbirth, while women with the educational attainment of high school diploma are least likely to be married with 100.0% of them unmarried at childbirth.
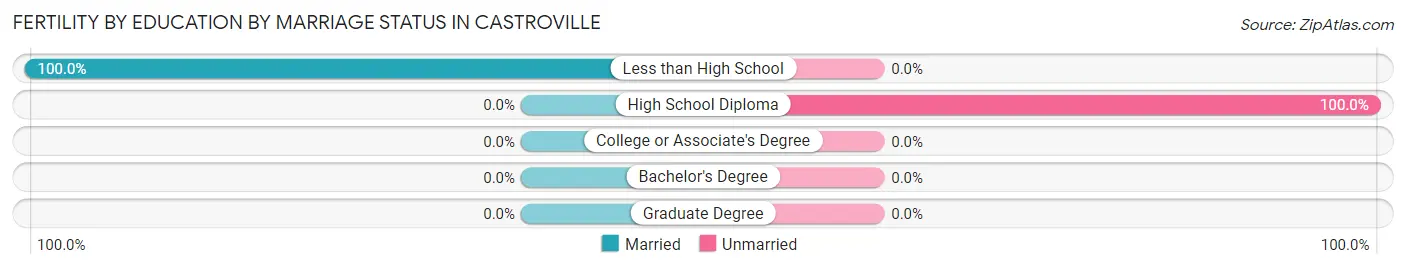
| Educational Attainment | Married | Unmarried |
| Less than High School | 17 (100.0%) | 0 (0.0%) |
| High School Diploma | 0 (0.0%) | 24 (100.0%) |
| College or Associate's Degree | 0 (0.0%) | 0 (0.0%) |
| Bachelor's Degree | 0 (0.0%) | 0 (0.0%) |
| Graduate Degree | 0 (0.0%) | 0 (0.0%) |
| Total | 17 (41.5%) | 24 (58.5%) |
Employment Characteristics in Castroville
Employment by Class of Employer in Castroville
Among the 2,622 employed individuals in Castroville, private company employees (2,056 | 78.4%), local government employees (197 | 7.5%), and not-for-profit organizations (125 | 4.8%) make up the most common classes of employment.

| Employer Class | # Employees | % Employees |
| Private Company Employees | 2,056 | 78.4% |
| Self-Employed (Incorporated) | 61 | 2.3% |
| Self-Employed (Not Incorporated) | 104 | 4.0% |
| Not-for-profit Organizations | 125 | 4.8% |
| Local Government Employees | 197 | 7.5% |
| State Government Employees | 56 | 2.1% |
| Federal Government Employees | 23 | 0.9% |
| Unpaid Family Workers | 0 | 0.0% |
| Total | 2,622 | 100.0% |
Employment Status by Age in Castroville
According to the labor force statistics for Castroville, out of the total population over 16 years of age (4,477), 61.9% or 2,771 individuals are in the labor force, with 2.6% or 72 of them unemployed. The age group with the highest labor force participation rate is 20 to 24 years, with 88.6% or 326 individuals in the labor force. Within the labor force, the 30 to 34 years age range has the highest percentage of unemployed individuals, with 6.9% or 31 of them being unemployed.
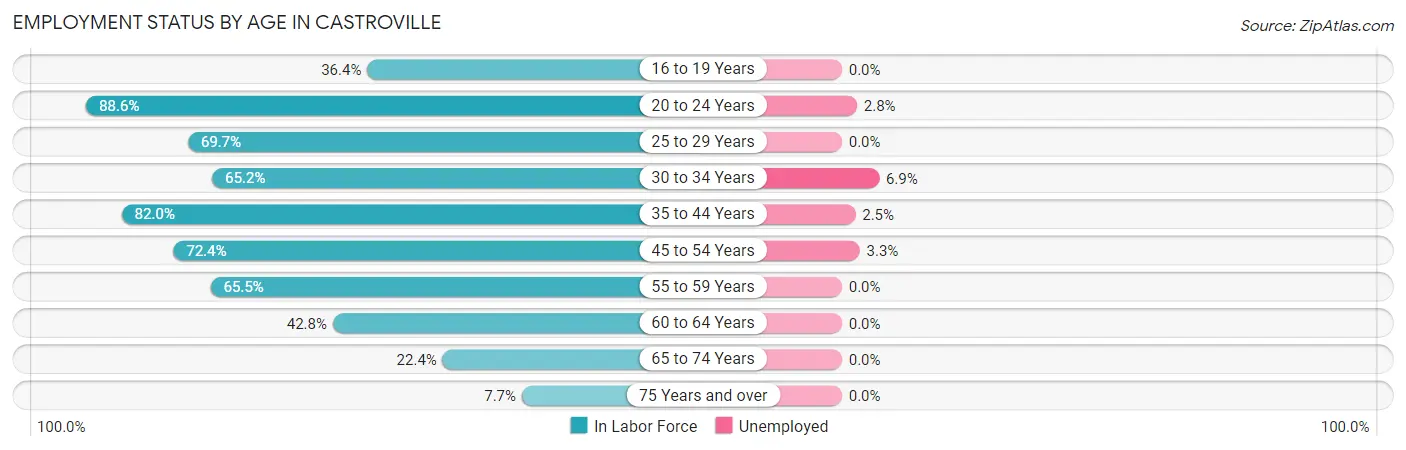
| Age Bracket | In Labor Force | Unemployed |
| 16 to 19 Years | 91 (36.4%) | 0 (0.0%) |
| 20 to 24 Years | 326 (88.6%) | 9 (2.8%) |
| 25 to 29 Years | 382 (69.7%) | 0 (0.0%) |
| 30 to 34 Years | 449 (65.2%) | 31 (6.9%) |
| 35 to 44 Years | 706 (82.0%) | 18 (2.5%) |
| 45 to 54 Years | 454 (72.4%) | 15 (3.3%) |
| 55 to 59 Years | 112 (65.5%) | 0 (0.0%) |
| 60 to 64 Years | 115 (42.8%) | 0 (0.0%) |
| 65 to 74 Years | 129 (22.4%) | 0 (0.0%) |
| 75 Years and over | 9 (7.7%) | 0 (0.0%) |
| Total | 2,771 (61.9%) | 72 (2.6%) |
Employment Status by Educational Attainment in Castroville
According to labor force statistics for Castroville, 70.1% of individuals (2,219) out of the total population between 25 and 64 years of age (3,165) are in the labor force, with 2.9% or 64 of them being unemployed. The group with the highest labor force participation rate are those with the educational attainment of bachelor's degree or higher, with 95.6% or 151 individuals in the labor force. Within the labor force, individuals with bachelor's degree or higher education have the highest percentage of unemployment, with 15.9% or 24 of them being unemployed.
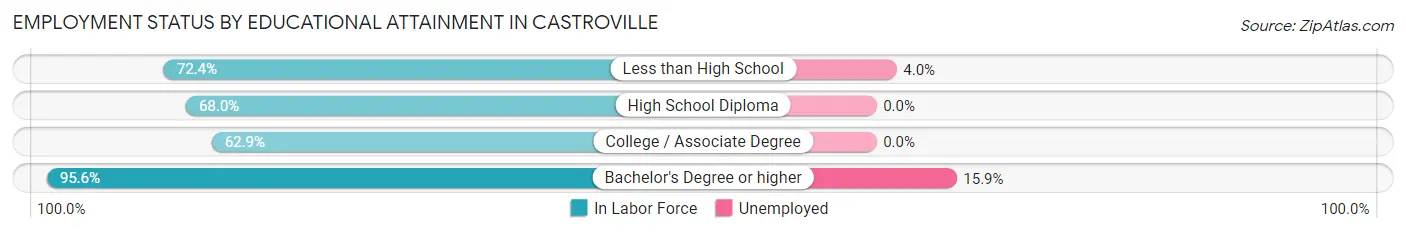
| Educational Attainment | In Labor Force | Unemployed |
| Less than High School | 998 (72.4%) | 55 (4.0%) |
| High School Diploma | 585 (68.0%) | 0 (0.0%) |
| College / Associate Degree | 484 (62.9%) | 0 (0.0%) |
| Bachelor's Degree or higher | 151 (95.6%) | 25 (15.9%) |
| Total | 2,219 (70.1%) | 92 (2.9%) |
Employment Occupations by Sex in Castroville
Management, Business, Science and Arts Occupations
The most common Management, Business, Science and Arts occupations in Castroville are Community & Social Service (108 | 4.0%), Management (58 | 2.1%), Education Instruction & Library (57 | 2.1%), Education, Arts & Media (29 | 1.1%), and Business & Financial (27 | 1.0%).
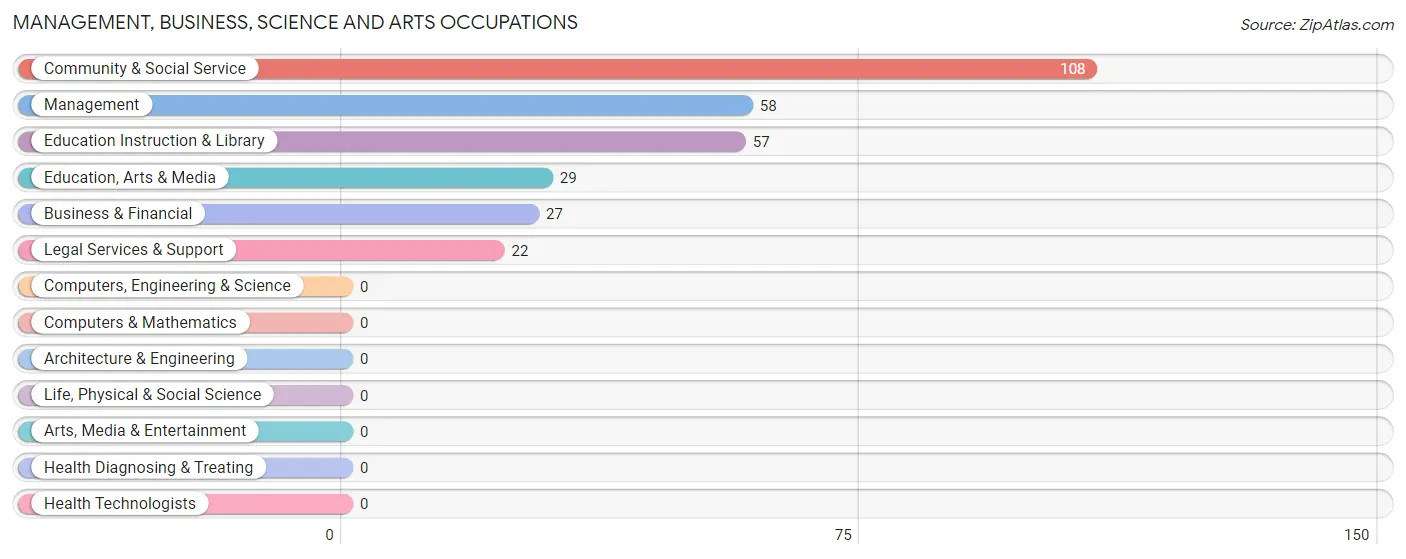
Management, Business, Science and Arts Occupations by Sex
Within the Management, Business, Science and Arts occupations in Castroville, the most male-oriented occupations are Legal Services & Support (100.0%), Business & Financial (22.2%), and Community & Social Service (22.2%), while the most female-oriented occupations are Management (100.0%), Education, Arts & Media (100.0%), and Education Instruction & Library (96.5%).
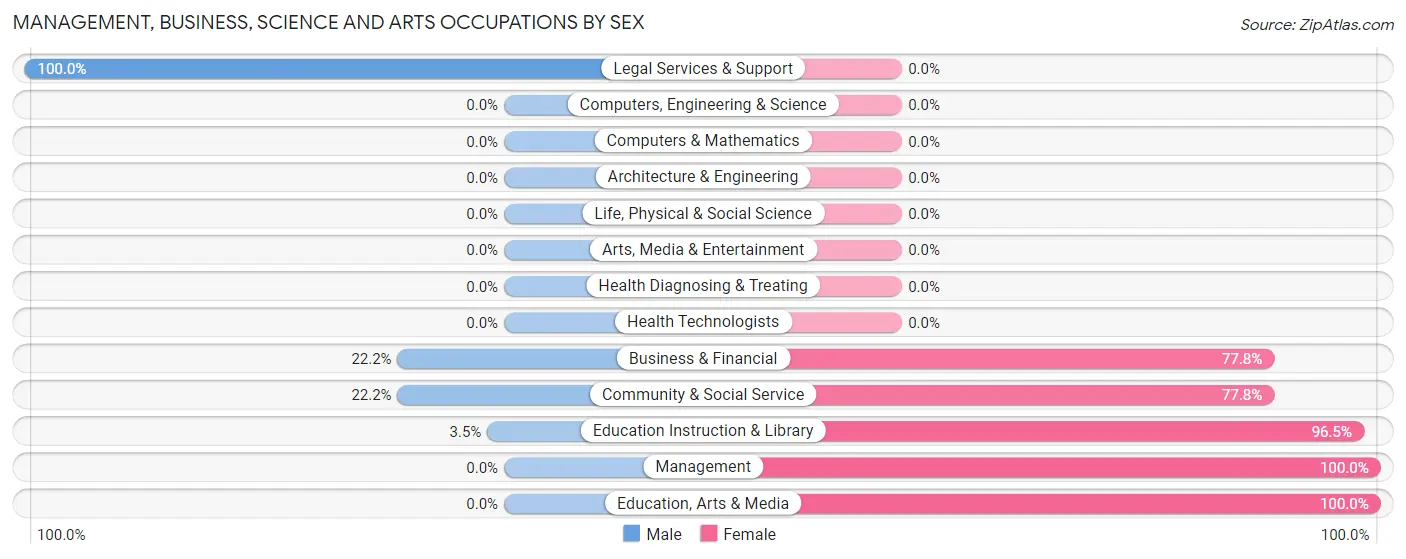
| Occupation | Male | Female |
| Management | 0 (0.0%) | 58 (100.0%) |
| Business & Financial | 6 (22.2%) | 21 (77.8%) |
| Computers, Engineering & Science | 0 (0.0%) | 0 (0.0%) |
| Computers & Mathematics | 0 (0.0%) | 0 (0.0%) |
| Architecture & Engineering | 0 (0.0%) | 0 (0.0%) |
| Life, Physical & Social Science | 0 (0.0%) | 0 (0.0%) |
| Community & Social Service | 24 (22.2%) | 84 (77.8%) |
| Education, Arts & Media | 0 (0.0%) | 29 (100.0%) |
| Legal Services & Support | 22 (100.0%) | 0 (0.0%) |
| Education Instruction & Library | 2 (3.5%) | 55 (96.5%) |
| Arts, Media & Entertainment | 0 (0.0%) | 0 (0.0%) |
| Health Diagnosing & Treating | 0 (0.0%) | 0 (0.0%) |
| Health Technologists | 0 (0.0%) | 0 (0.0%) |
| Total (Category) | 30 (15.5%) | 163 (84.5%) |
| Total (Overall) | 1,538 (57.0%) | 1,162 (43.0%) |
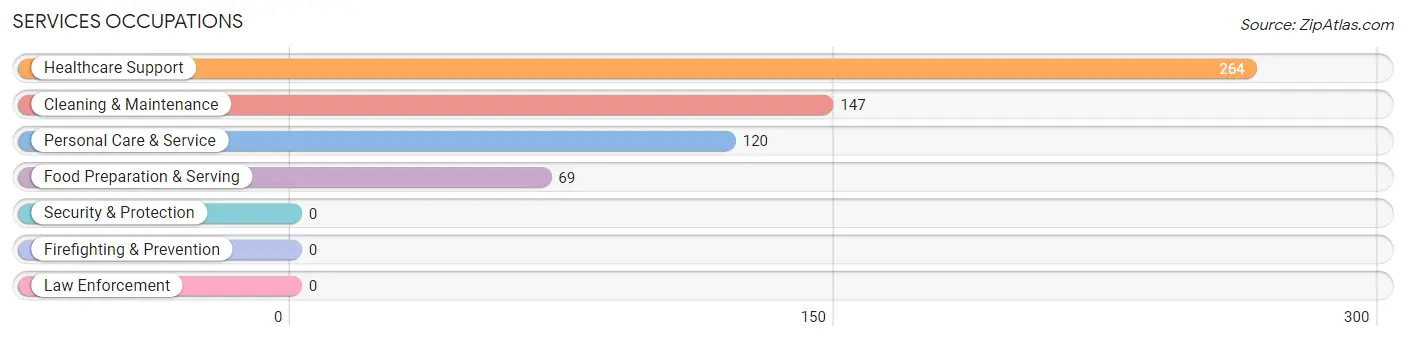
Services Occupations
The most common Services occupations in Castroville are Healthcare Support (264 | 9.8%), Cleaning & Maintenance (147 | 5.4%), Personal Care & Service (120 | 4.4%), and Food Preparation & Serving (69 | 2.6%).
Services Occupations by Sex
Within the Services occupations in Castroville, the most male-oriented occupations are Food Preparation & Serving (100.0%), Cleaning & Maintenance (54.4%), and Personal Care & Service (5.0%), while the most female-oriented occupations are Healthcare Support (98.9%), Personal Care & Service (95.0%), and Cleaning & Maintenance (45.6%).
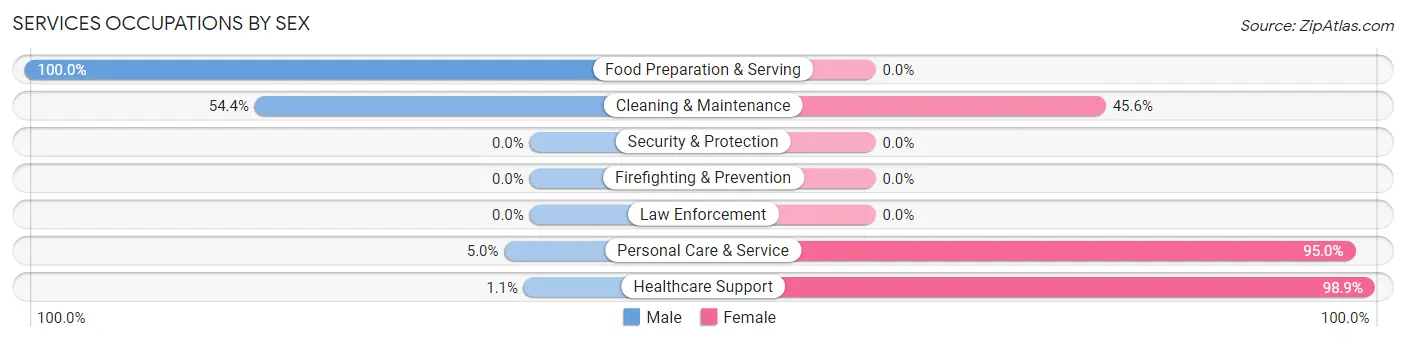
| Occupation | Male | Female |
| Healthcare Support | 3 (1.1%) | 261 (98.9%) |
| Security & Protection | 0 (0.0%) | 0 (0.0%) |
| Firefighting & Prevention | 0 (0.0%) | 0 (0.0%) |
| Law Enforcement | 0 (0.0%) | 0 (0.0%) |
| Food Preparation & Serving | 69 (100.0%) | 0 (0.0%) |
| Cleaning & Maintenance | 80 (54.4%) | 67 (45.6%) |
| Personal Care & Service | 6 (5.0%) | 114 (95.0%) |
| Total (Category) | 158 (26.3%) | 442 (73.7%) |
| Total (Overall) | 1,538 (57.0%) | 1,162 (43.0%) |
Sales and Office Occupations
The most common Sales and Office occupations in Castroville are Office & Administration (271 | 10.0%), and Sales & Related (140 | 5.2%).

Sales and Office Occupations by Sex

| Occupation | Male | Female |
| Sales & Related | 30 (21.4%) | 110 (78.6%) |
| Office & Administration | 116 (42.8%) | 155 (57.2%) |
| Total (Category) | 146 (35.5%) | 265 (64.5%) |
| Total (Overall) | 1,538 (57.0%) | 1,162 (43.0%) |
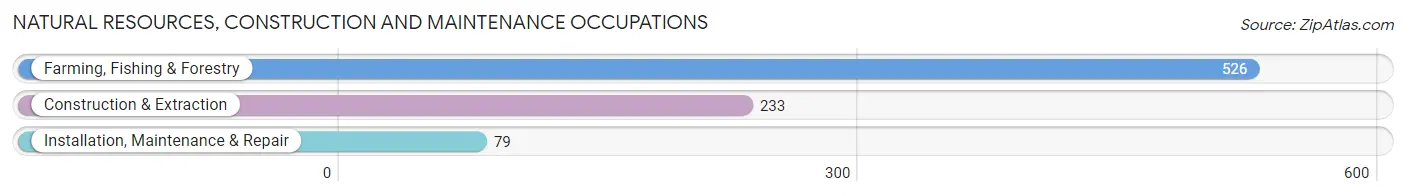
Natural Resources, Construction and Maintenance Occupations
The most common Natural Resources, Construction and Maintenance occupations in Castroville are Farming, Fishing & Forestry (526 | 19.5%), Construction & Extraction (233 | 8.6%), and Installation, Maintenance & Repair (79 | 2.9%).
Natural Resources, Construction and Maintenance Occupations by Sex

| Occupation | Male | Female |
| Farming, Fishing & Forestry | 306 (58.2%) | 220 (41.8%) |
| Construction & Extraction | 233 (100.0%) | 0 (0.0%) |
| Installation, Maintenance & Repair | 79 (100.0%) | 0 (0.0%) |
| Total (Category) | 618 (73.8%) | 220 (26.3%) |
| Total (Overall) | 1,538 (57.0%) | 1,162 (43.0%) |
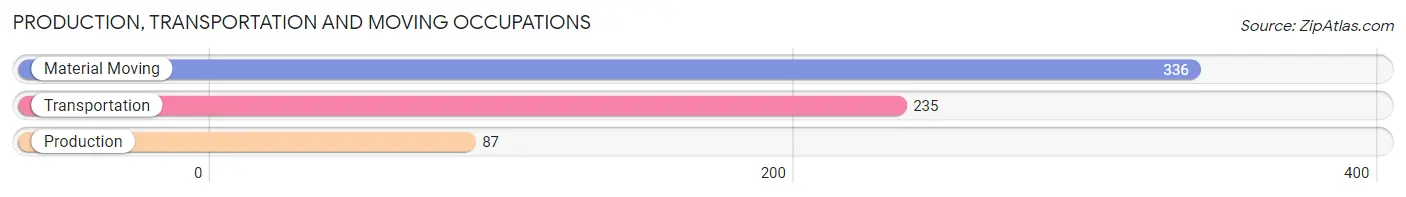
Production, Transportation and Moving Occupations
The most common Production, Transportation and Moving occupations in Castroville are Material Moving (336 | 12.4%), Transportation (235 | 8.7%), and Production (87 | 3.2%).
Production, Transportation and Moving Occupations by Sex

| Occupation | Male | Female |
| Production | 46 (52.9%) | 41 (47.1%) |
| Transportation | 235 (100.0%) | 0 (0.0%) |
| Material Moving | 305 (90.8%) | 31 (9.2%) |
| Total (Category) | 586 (89.1%) | 72 (10.9%) |
| Total (Overall) | 1,538 (57.0%) | 1,162 (43.0%) |
Employment Industries by Sex in Castroville
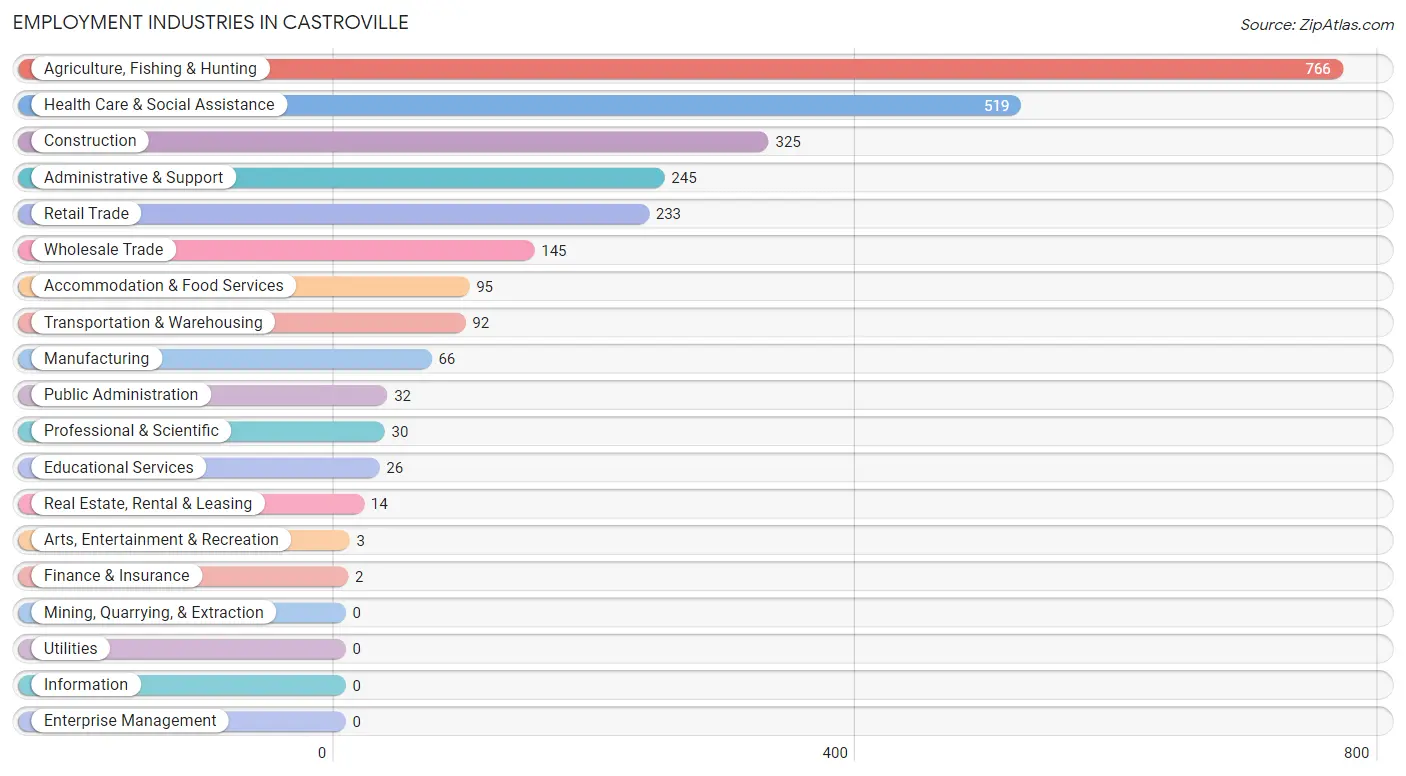
Employment Industries in Castroville
The major employment industries in Castroville include Agriculture, Fishing & Hunting (766 | 28.4%), Health Care & Social Assistance (519 | 19.2%), Construction (325 | 12.0%), Administrative & Support (245 | 9.1%), and Retail Trade (233 | 8.6%).
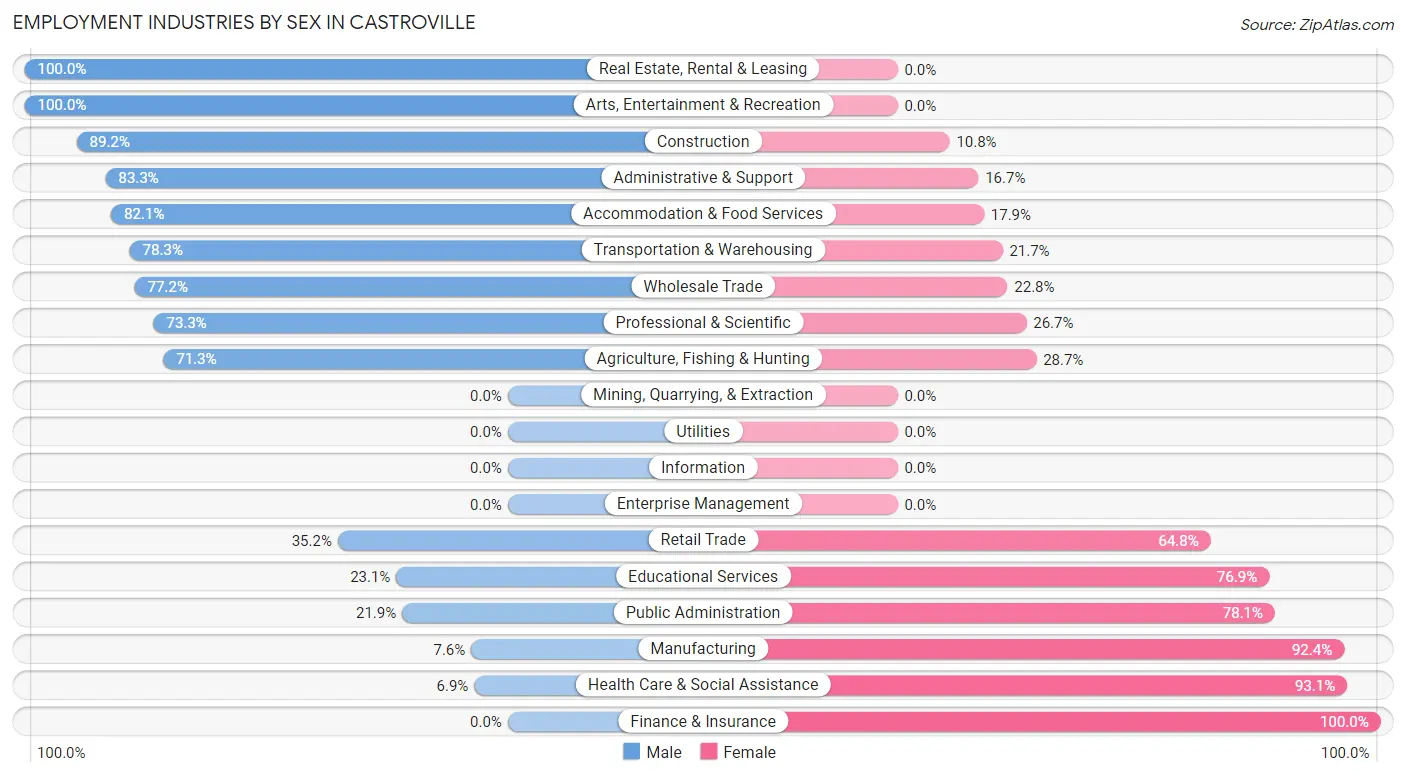
Employment Industries by Sex in Castroville
The Castroville industries that see more men than women are Real Estate, Rental & Leasing (100.0%), Arts, Entertainment & Recreation (100.0%), and Construction (89.2%), whereas the industries that tend to have a higher number of women are Finance & Insurance (100.0%), Health Care & Social Assistance (93.1%), and Manufacturing (92.4%).
| Industry | Male | Female |
| Agriculture, Fishing & Hunting | 546 (71.3%) | 220 (28.7%) |
| Mining, Quarrying, & Extraction | 0 (0.0%) | 0 (0.0%) |
| Construction | 290 (89.2%) | 35 (10.8%) |
| Manufacturing | 5 (7.6%) | 61 (92.4%) |
| Wholesale Trade | 112 (77.2%) | 33 (22.8%) |
| Retail Trade | 82 (35.2%) | 151 (64.8%) |
| Transportation & Warehousing | 72 (78.3%) | 20 (21.7%) |
| Utilities | 0 (0.0%) | 0 (0.0%) |
| Information | 0 (0.0%) | 0 (0.0%) |
| Finance & Insurance | 0 (0.0%) | 2 (100.0%) |
| Real Estate, Rental & Leasing | 14 (100.0%) | 0 (0.0%) |
| Professional & Scientific | 22 (73.3%) | 8 (26.7%) |
| Enterprise Management | 0 (0.0%) | 0 (0.0%) |
| Administrative & Support | 204 (83.3%) | 41 (16.7%) |
| Educational Services | 6 (23.1%) | 20 (76.9%) |
| Health Care & Social Assistance | 36 (6.9%) | 483 (93.1%) |
| Arts, Entertainment & Recreation | 3 (100.0%) | 0 (0.0%) |
| Accommodation & Food Services | 78 (82.1%) | 17 (17.9%) |
| Public Administration | 7 (21.9%) | 25 (78.1%) |
| Total | 1,538 (57.0%) | 1,162 (43.0%) |
Education in Castroville
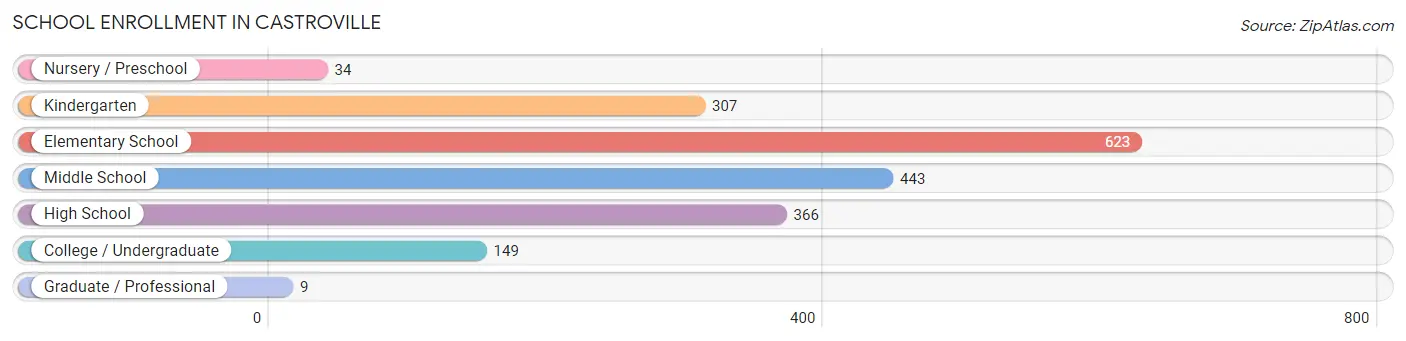
School Enrollment in Castroville
The most common levels of schooling among the 1,931 students in Castroville are elementary school (623 | 32.3%), middle school (443 | 22.9%), and high school (366 | 19.0%).
| School Level | # Students | % Students |
| Nursery / Preschool | 34 | 1.8% |
| Kindergarten | 307 | 15.9% |
| Elementary School | 623 | 32.3% |
| Middle School | 443 | 22.9% |
| High School | 366 | 19.0% |
| College / Undergraduate | 149 | 7.7% |
| Graduate / Professional | 9 | 0.5% |
| Total | 1,931 | 100.0% |
School Enrollment by Age by Funding Source in Castroville
Out of a total of 1,931 students who are enrolled in schools in Castroville, 8 (0.4%) attend a private institution, while the remaining 1,923 (99.6%) are enrolled in public schools. The age group of 25 to 34 year olds has the highest likelihood of being enrolled in private schools, with 2 (8.3% in the age bracket) enrolled. Conversely, the age group of 3 to 4 year olds has the lowest likelihood of being enrolled in a private school, with 28 (100.0% in the age bracket) attending a public institution.
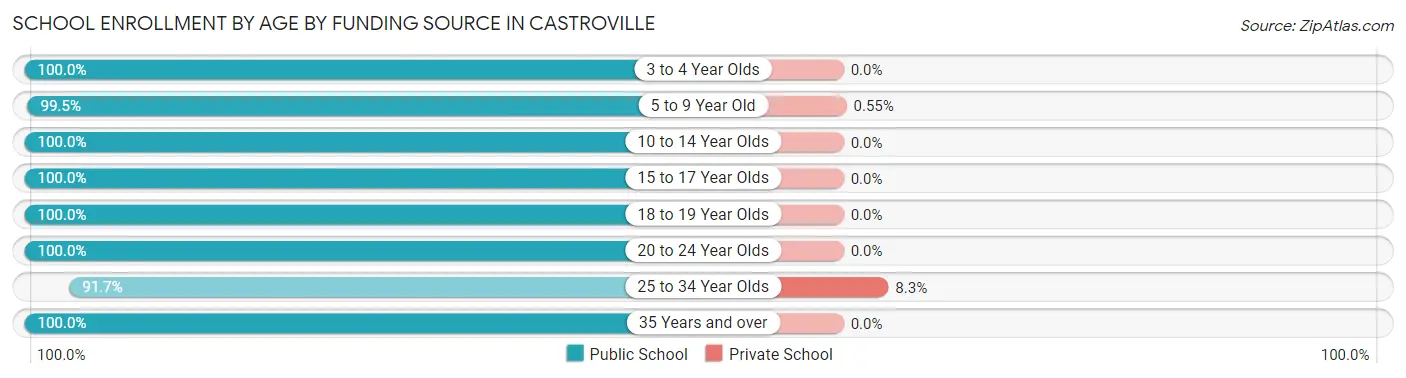
| Age Bracket | Public School | Private School |
| 3 to 4 Year Olds | 28 (100.0%) | 0 (0.0%) |
| 5 to 9 Year Old | 904 (99.5%) | 5 (0.5%) |
| 10 to 14 Year Olds | 557 (100.0%) | 0 (0.0%) |
| 15 to 17 Year Olds | 232 (100.0%) | 0 (0.0%) |
| 18 to 19 Year Olds | 59 (100.0%) | 0 (0.0%) |
| 20 to 24 Year Olds | 104 (100.0%) | 0 (0.0%) |
| 25 to 34 Year Olds | 22 (91.7%) | 2 (8.3%) |
| 35 Years and over | 18 (100.0%) | 0 (0.0%) |
| Total | 1,923 (99.6%) | 8 (0.4%) |
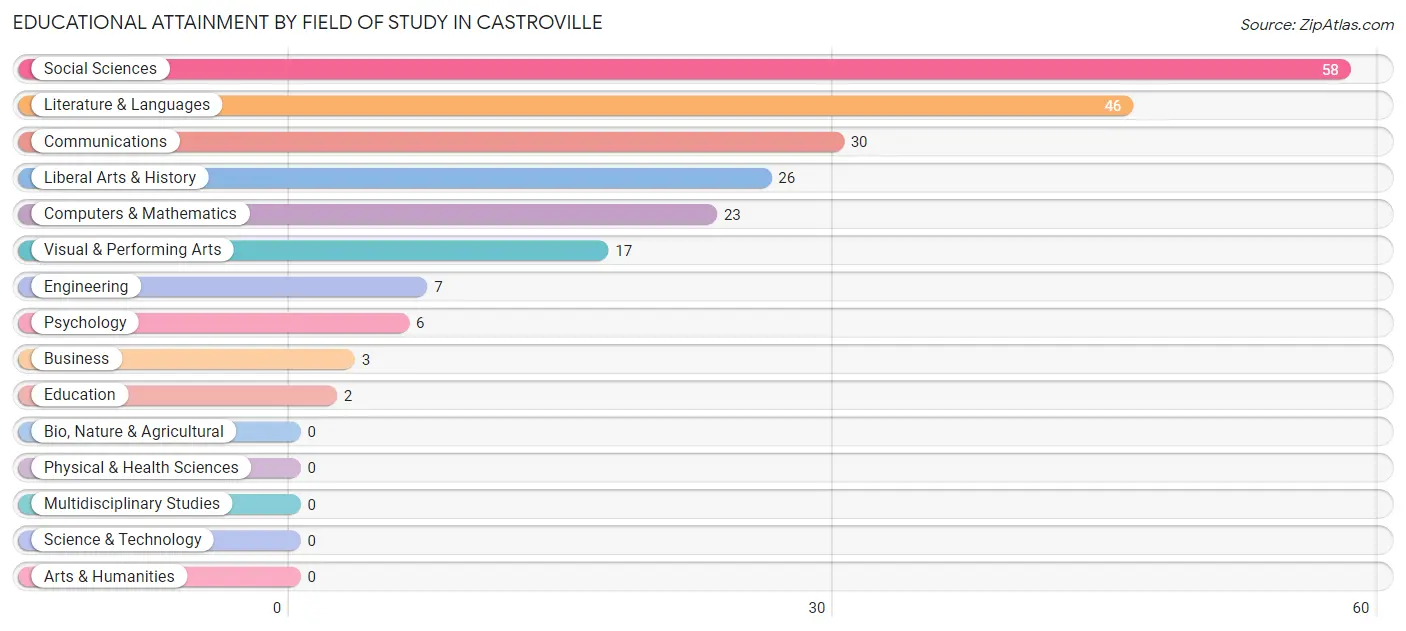
Educational Attainment by Field of Study in Castroville
Social sciences (58 | 26.6%), literature & languages (46 | 21.1%), communications (30 | 13.8%), liberal arts & history (26 | 11.9%), and computers & mathematics (23 | 10.5%) are the most common fields of study among 218 individuals in Castroville who have obtained a bachelor's degree or higher.
| Field of Study | # Graduates | % Graduates |
| Computers & Mathematics | 23 | 10.5% |
| Bio, Nature & Agricultural | 0 | 0.0% |
| Physical & Health Sciences | 0 | 0.0% |
| Psychology | 6 | 2.8% |
| Social Sciences | 58 | 26.6% |
| Engineering | 7 | 3.2% |
| Multidisciplinary Studies | 0 | 0.0% |
| Science & Technology | 0 | 0.0% |
| Business | 3 | 1.4% |
| Education | 2 | 0.9% |
| Literature & Languages | 46 | 21.1% |
| Liberal Arts & History | 26 | 11.9% |
| Visual & Performing Arts | 17 | 7.8% |
| Communications | 30 | 13.8% |
| Arts & Humanities | 0 | 0.0% |
| Total | 218 | 100.0% |
Transportation & Commute in Castroville
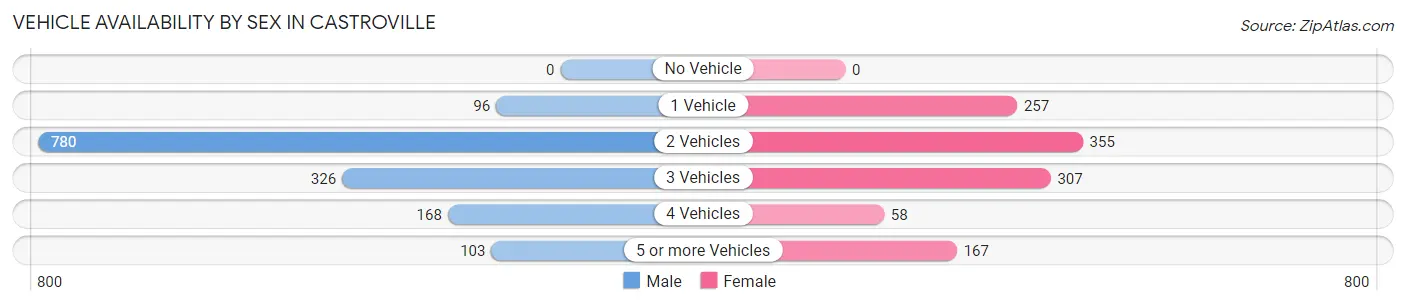
Vehicle Availability by Sex in Castroville
The most prevalent vehicle ownership categories in Castroville are males with 2 vehicles (780, accounting for 52.9%) and females with 2 vehicles (355, making up 68.2%).
| Vehicles Available | Male | Female |
| No Vehicle | 0 (0.0%) | 0 (0.0%) |
| 1 Vehicle | 96 (6.5%) | 257 (22.5%) |
| 2 Vehicles | 780 (52.9%) | 355 (31.0%) |
| 3 Vehicles | 326 (22.1%) | 307 (26.8%) |
| 4 Vehicles | 168 (11.4%) | 58 (5.1%) |
| 5 or more Vehicles | 103 (7.0%) | 167 (14.6%) |
| Total | 1,473 (100.0%) | 1,144 (100.0%) |
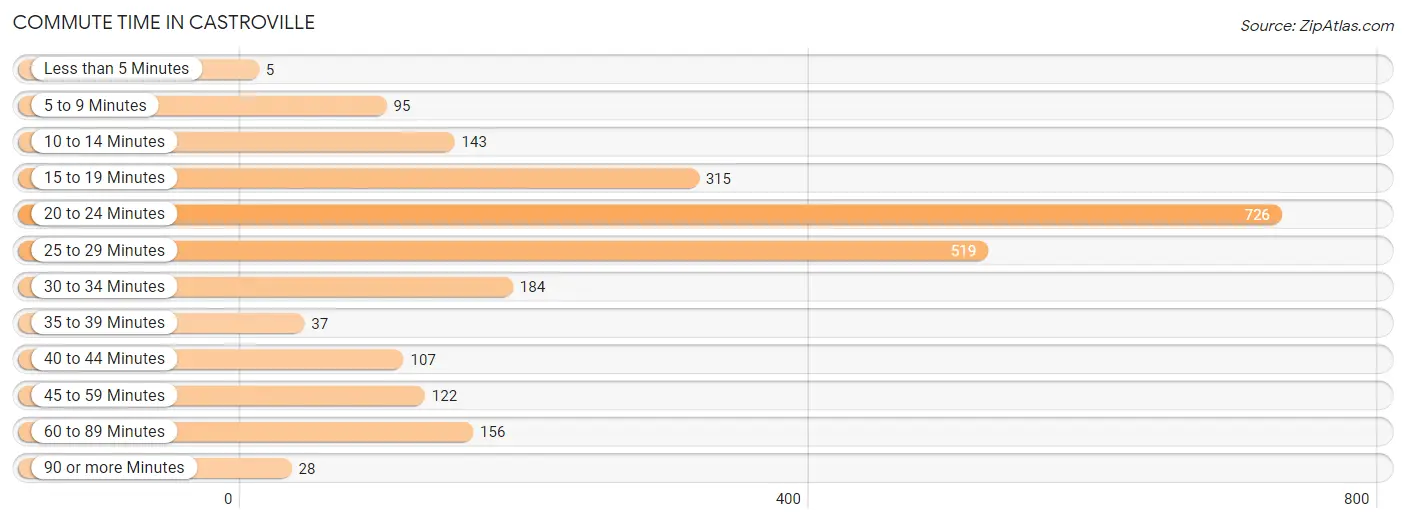
Commute Time in Castroville
The most frequently occuring commute durations in Castroville are 20 to 24 minutes (726 commuters, 29.8%), 25 to 29 minutes (519 commuters, 21.3%), and 15 to 19 minutes (315 commuters, 12.9%).
| Commute Time | # Commuters | % Commuters |
| Less than 5 Minutes | 5 | 0.2% |
| 5 to 9 Minutes | 95 | 3.9% |
| 10 to 14 Minutes | 143 | 5.9% |
| 15 to 19 Minutes | 315 | 12.9% |
| 20 to 24 Minutes | 726 | 29.8% |
| 25 to 29 Minutes | 519 | 21.3% |
| 30 to 34 Minutes | 184 | 7.5% |
| 35 to 39 Minutes | 37 | 1.5% |
| 40 to 44 Minutes | 107 | 4.4% |
| 45 to 59 Minutes | 122 | 5.0% |
| 60 to 89 Minutes | 156 | 6.4% |
| 90 or more Minutes | 28 | 1.1% |
Commute Time by Sex in Castroville
The most common commute times in Castroville are 20 to 24 minutes (381 commuters, 26.2%) for males and 20 to 24 minutes (345 commuters, 35.1%) for females.
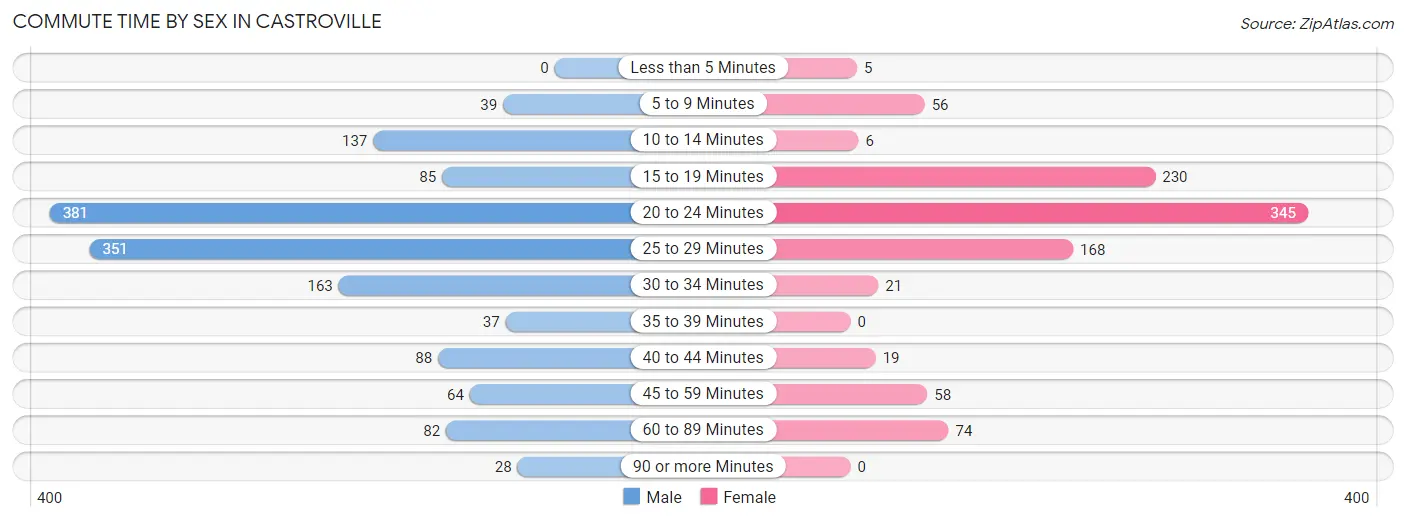
| Commute Time | Male | Female |
| Less than 5 Minutes | 0 (0.0%) | 5 (0.5%) |
| 5 to 9 Minutes | 39 (2.7%) | 56 (5.7%) |
| 10 to 14 Minutes | 137 (9.4%) | 6 (0.6%) |
| 15 to 19 Minutes | 85 (5.8%) | 230 (23.4%) |
| 20 to 24 Minutes | 381 (26.2%) | 345 (35.1%) |
| 25 to 29 Minutes | 351 (24.1%) | 168 (17.1%) |
| 30 to 34 Minutes | 163 (11.2%) | 21 (2.1%) |
| 35 to 39 Minutes | 37 (2.5%) | 0 (0.0%) |
| 40 to 44 Minutes | 88 (6.0%) | 19 (1.9%) |
| 45 to 59 Minutes | 64 (4.4%) | 58 (5.9%) |
| 60 to 89 Minutes | 82 (5.6%) | 74 (7.5%) |
| 90 or more Minutes | 28 (1.9%) | 0 (0.0%) |
Time of Departure to Work by Sex in Castroville
The most frequent times of departure to work in Castroville are 6:00 AM to 6:29 AM (294, 20.2%) for males and 7:30 AM to 7:59 AM (178, 18.1%) for females.
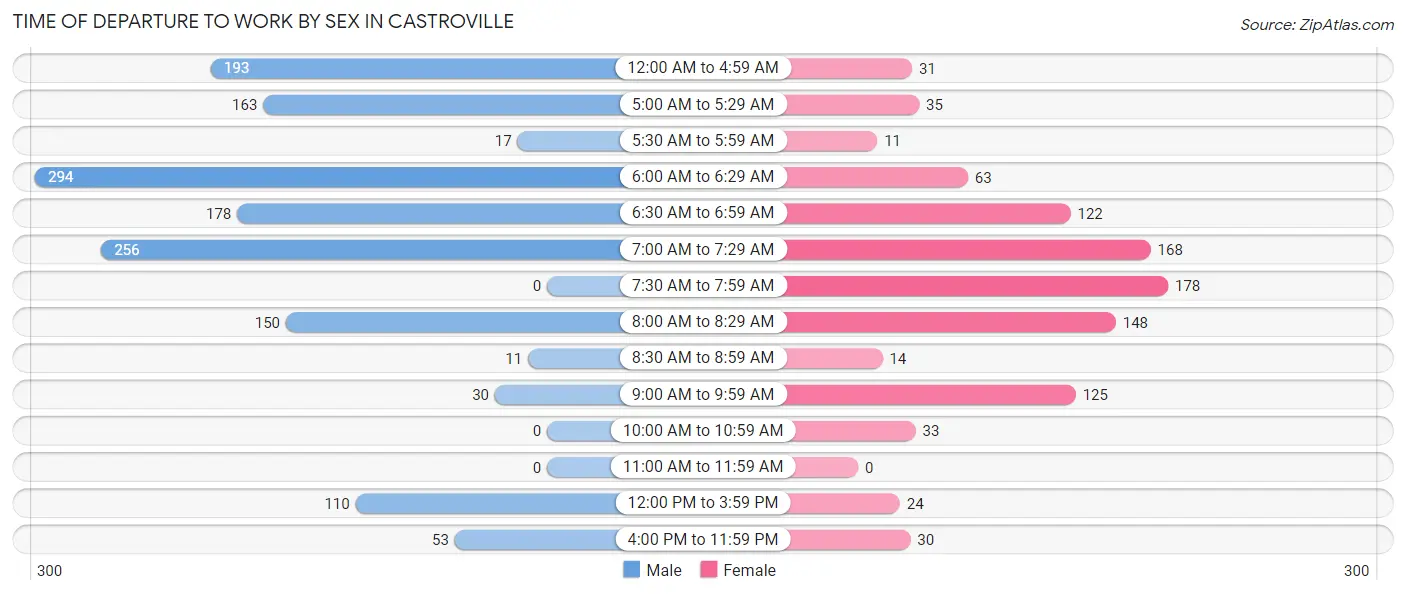
| Time of Departure | Male | Female |
| 12:00 AM to 4:59 AM | 193 (13.3%) | 31 (3.2%) |
| 5:00 AM to 5:29 AM | 163 (11.2%) | 35 (3.6%) |
| 5:30 AM to 5:59 AM | 17 (1.2%) | 11 (1.1%) |
| 6:00 AM to 6:29 AM | 294 (20.2%) | 63 (6.4%) |
| 6:30 AM to 6:59 AM | 178 (12.2%) | 122 (12.4%) |
| 7:00 AM to 7:29 AM | 256 (17.6%) | 168 (17.1%) |
| 7:30 AM to 7:59 AM | 0 (0.0%) | 178 (18.1%) |
| 8:00 AM to 8:29 AM | 150 (10.3%) | 148 (15.1%) |
| 8:30 AM to 8:59 AM | 11 (0.8%) | 14 (1.4%) |
| 9:00 AM to 9:59 AM | 30 (2.1%) | 125 (12.7%) |
| 10:00 AM to 10:59 AM | 0 (0.0%) | 33 (3.4%) |
| 11:00 AM to 11:59 AM | 0 (0.0%) | 0 (0.0%) |
| 12:00 PM to 3:59 PM | 110 (7.6%) | 24 (2.4%) |
| 4:00 PM to 11:59 PM | 53 (3.6%) | 30 (3.0%) |
| Total | 1,455 (100.0%) | 982 (100.0%) |
Housing Occupancy in Castroville
Occupancy by Ownership in Castroville
Of the total 1,474 dwellings in Castroville, owner-occupied units account for 618 (41.9%), while renter-occupied units make up 856 (58.1%).
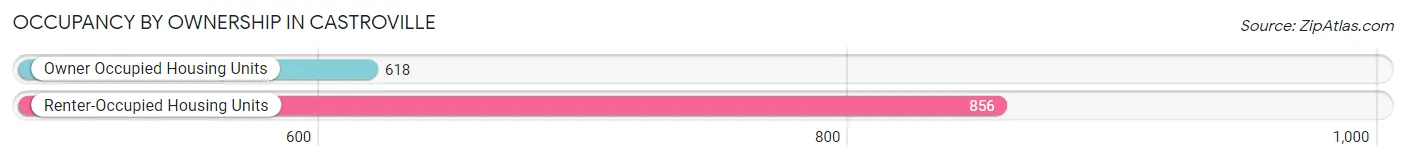
| Occupancy | # Housing Units | % Housing Units |
| Owner Occupied Housing Units | 618 | 41.9% |
| Renter-Occupied Housing Units | 856 | 58.1% |
| Total Occupied Housing Units | 1,474 | 100.0% |
Occupancy by Household Size in Castroville
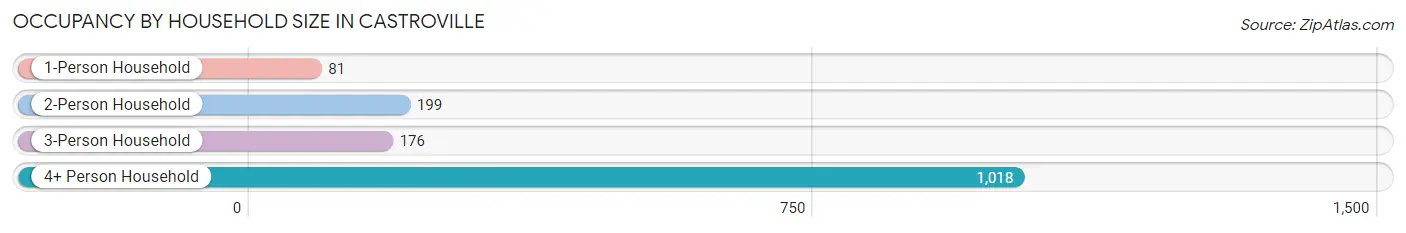
| Household Size | # Housing Units | % Housing Units |
| 1-Person Household | 81 | 5.5% |
| 2-Person Household | 199 | 13.5% |
| 3-Person Household | 176 | 11.9% |
| 4+ Person Household | 1,018 | 69.1% |
| Total Housing Units | 1,474 | 100.0% |
Occupancy by Ownership by Household Size in Castroville
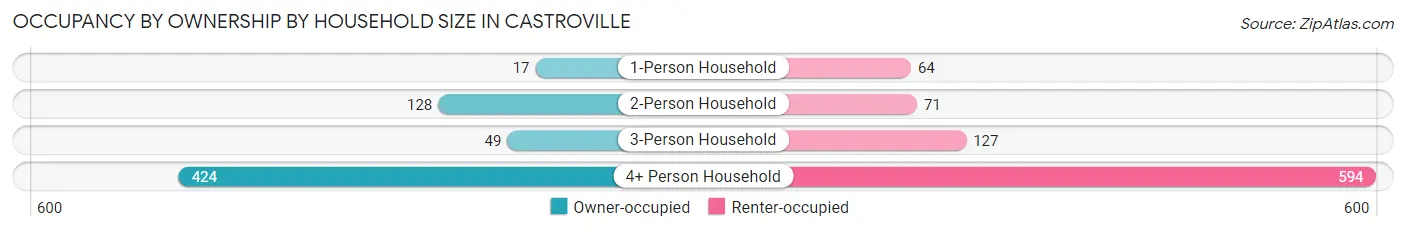
| Household Size | Owner-occupied | Renter-occupied |
| 1-Person Household | 17 (21.0%) | 64 (79.0%) |
| 2-Person Household | 128 (64.3%) | 71 (35.7%) |
| 3-Person Household | 49 (27.8%) | 127 (72.2%) |
| 4+ Person Household | 424 (41.6%) | 594 (58.4%) |
| Total Housing Units | 618 (41.9%) | 856 (58.1%) |
Occupancy by Educational Attainment in Castroville
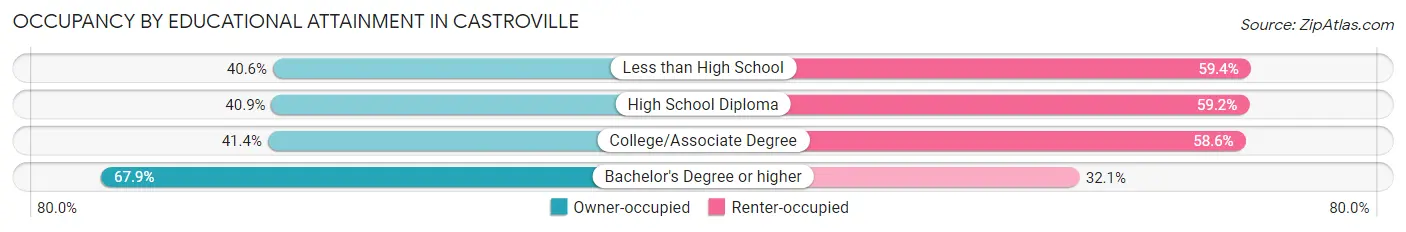
| Household Size | Owner-occupied | Renter-occupied |
| Less than High School | 247 (40.6%) | 361 (59.4%) |
| High School Diploma | 183 (40.8%) | 265 (59.2%) |
| College/Associate Degree | 150 (41.4%) | 212 (58.6%) |
| Bachelor's Degree or higher | 38 (67.9%) | 18 (32.1%) |
Occupancy by Age of Householder in Castroville
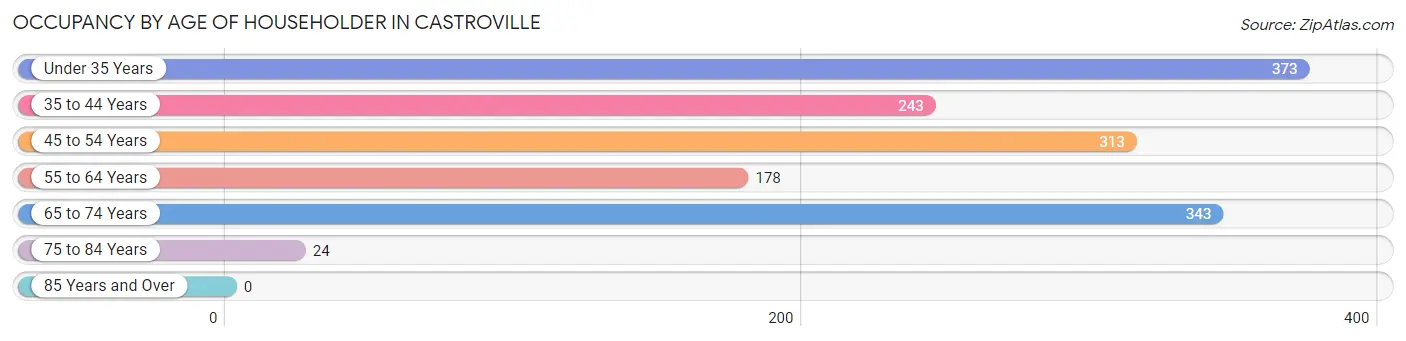
| Age Bracket | # Households | % Households |
| Under 35 Years | 373 | 25.3% |
| 35 to 44 Years | 243 | 16.5% |
| 45 to 54 Years | 313 | 21.2% |
| 55 to 64 Years | 178 | 12.1% |
| 65 to 74 Years | 343 | 23.3% |
| 75 to 84 Years | 24 | 1.6% |
| 85 Years and Over | 0 | 0.0% |
| Total | 1,474 | 100.0% |
Housing Finances in Castroville
Median Income by Occupancy in Castroville
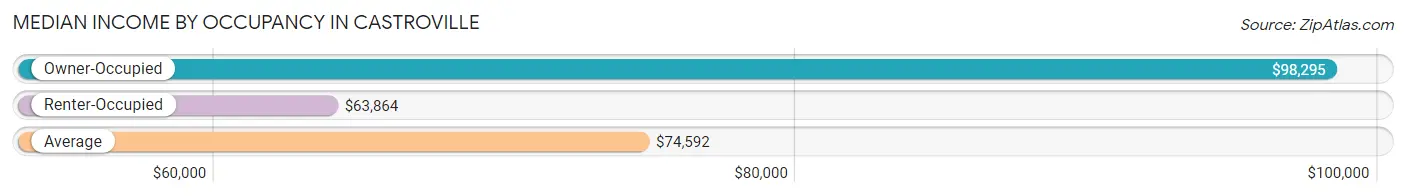
| Occupancy Type | # Households | Median Income |
| Owner-Occupied | 618 (41.9%) | $98,295 |
| Renter-Occupied | 856 (58.1%) | $63,864 |
| Average | 1,474 (100.0%) | $74,592 |
Occupancy by Householder Income Bracket in Castroville
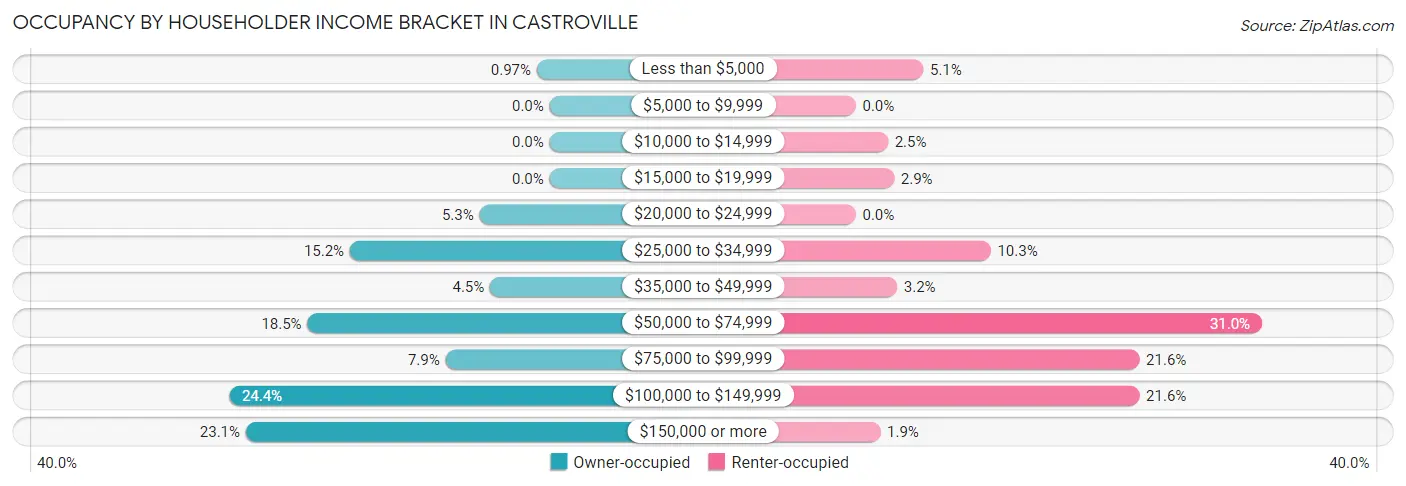
| Income Bracket | Owner-occupied | Renter-occupied |
| Less than $5,000 | 6 (1.0%) | 44 (5.1%) |
| $5,000 to $9,999 | 0 (0.0%) | 0 (0.0%) |
| $10,000 to $14,999 | 0 (0.0%) | 21 (2.5%) |
| $15,000 to $19,999 | 0 (0.0%) | 25 (2.9%) |
| $20,000 to $24,999 | 33 (5.3%) | 0 (0.0%) |
| $25,000 to $34,999 | 94 (15.2%) | 88 (10.3%) |
| $35,000 to $49,999 | 28 (4.5%) | 27 (3.2%) |
| $50,000 to $74,999 | 114 (18.4%) | 265 (31.0%) |
| $75,000 to $99,999 | 49 (7.9%) | 185 (21.6%) |
| $100,000 to $149,999 | 151 (24.4%) | 185 (21.6%) |
| $150,000 or more | 143 (23.1%) | 16 (1.9%) |
| Total | 618 (100.0%) | 856 (100.0%) |
Monthly Housing Cost Tiers in Castroville
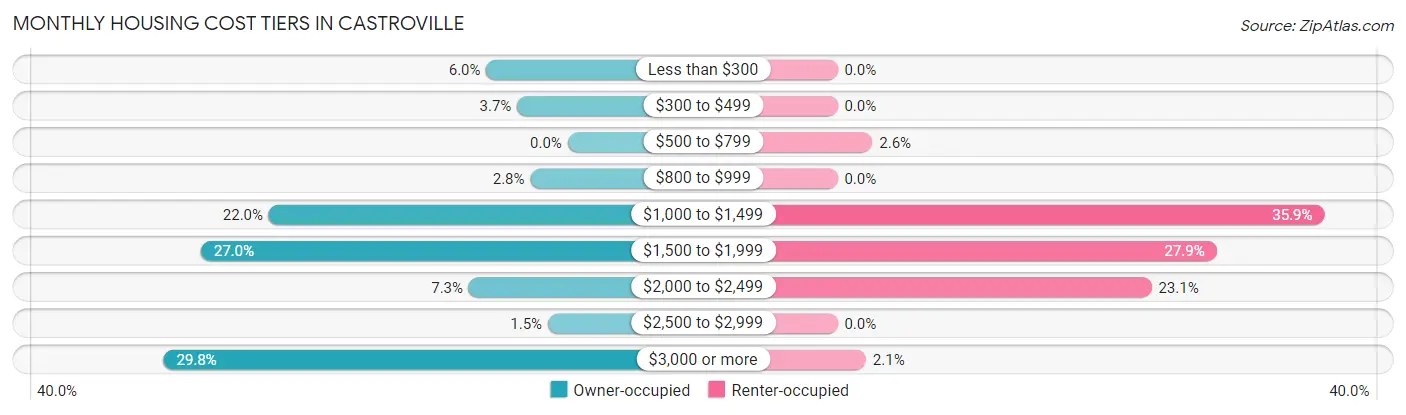
| Monthly Cost | Owner-occupied | Renter-occupied |
| Less than $300 | 37 (6.0%) | 0 (0.0%) |
| $300 to $499 | 23 (3.7%) | 0 (0.0%) |
| $500 to $799 | 0 (0.0%) | 22 (2.6%) |
| $800 to $999 | 17 (2.8%) | 0 (0.0%) |
| $1,000 to $1,499 | 136 (22.0%) | 307 (35.9%) |
| $1,500 to $1,999 | 167 (27.0%) | 239 (27.9%) |
| $2,000 to $2,499 | 45 (7.3%) | 198 (23.1%) |
| $2,500 to $2,999 | 9 (1.5%) | 0 (0.0%) |
| $3,000 or more | 184 (29.8%) | 18 (2.1%) |
| Total | 618 (100.0%) | 856 (100.0%) |
Physical Housing Characteristics in Castroville
Housing Structures in Castroville
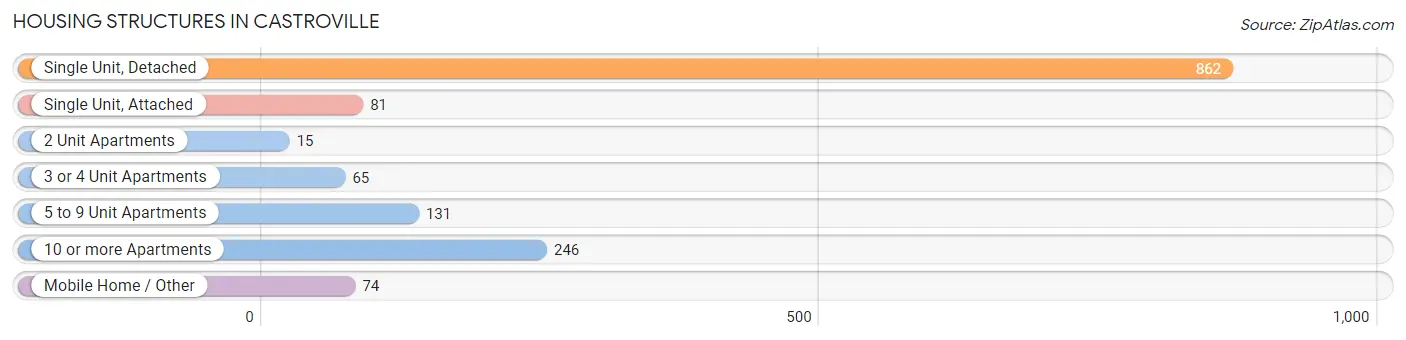
| Structure Type | # Housing Units | % Housing Units |
| Single Unit, Detached | 862 | 58.5% |
| Single Unit, Attached | 81 | 5.5% |
| 2 Unit Apartments | 15 | 1.0% |
| 3 or 4 Unit Apartments | 65 | 4.4% |
| 5 to 9 Unit Apartments | 131 | 8.9% |
| 10 or more Apartments | 246 | 16.7% |
| Mobile Home / Other | 74 | 5.0% |
| Total | 1,474 | 100.0% |
Housing Structures by Occupancy in Castroville
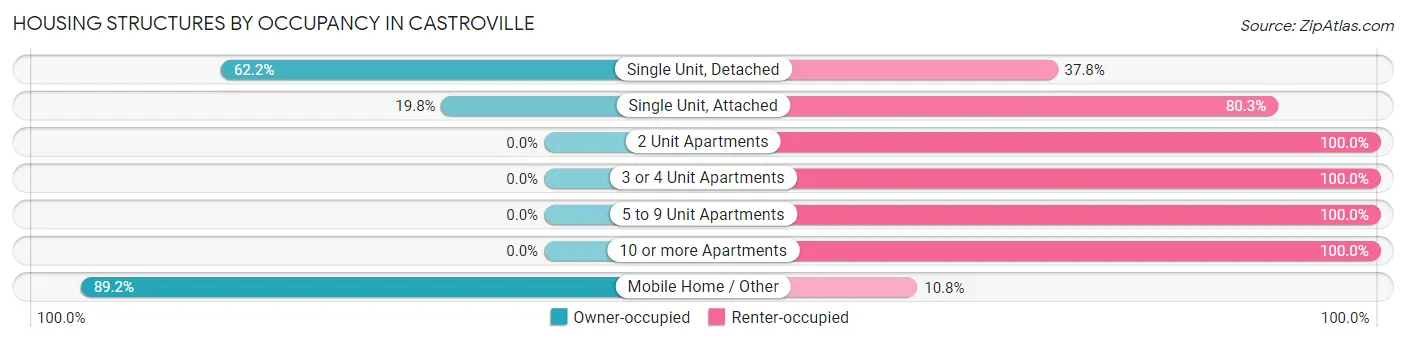
| Structure Type | Owner-occupied | Renter-occupied |
| Single Unit, Detached | 536 (62.2%) | 326 (37.8%) |
| Single Unit, Attached | 16 (19.8%) | 65 (80.2%) |
| 2 Unit Apartments | 0 (0.0%) | 15 (100.0%) |
| 3 or 4 Unit Apartments | 0 (0.0%) | 65 (100.0%) |
| 5 to 9 Unit Apartments | 0 (0.0%) | 131 (100.0%) |
| 10 or more Apartments | 0 (0.0%) | 246 (100.0%) |
| Mobile Home / Other | 66 (89.2%) | 8 (10.8%) |
| Total | 618 (41.9%) | 856 (58.1%) |
Housing Structures by Number of Rooms in Castroville
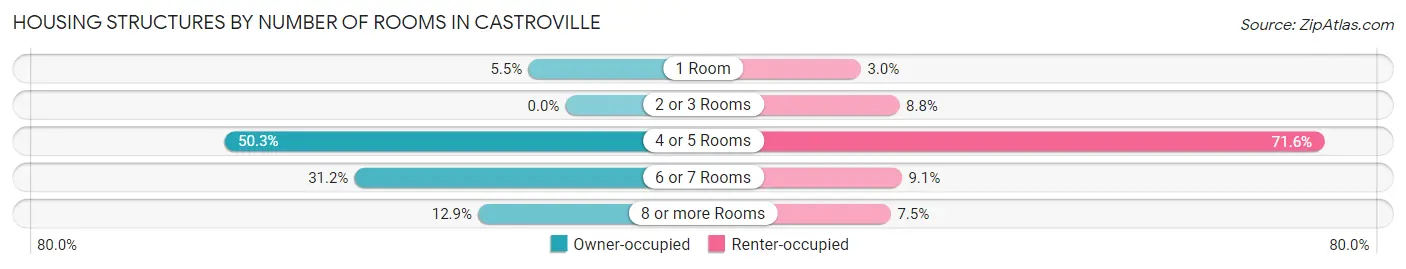
| Number of Rooms | Owner-occupied | Renter-occupied |
| 1 Room | 34 (5.5%) | 26 (3.0%) |
| 2 or 3 Rooms | 0 (0.0%) | 75 (8.8%) |
| 4 or 5 Rooms | 311 (50.3%) | 613 (71.6%) |
| 6 or 7 Rooms | 193 (31.2%) | 78 (9.1%) |
| 8 or more Rooms | 80 (12.9%) | 64 (7.5%) |
| Total | 618 (100.0%) | 856 (100.0%) |
Housing Structure by Heating Type in Castroville
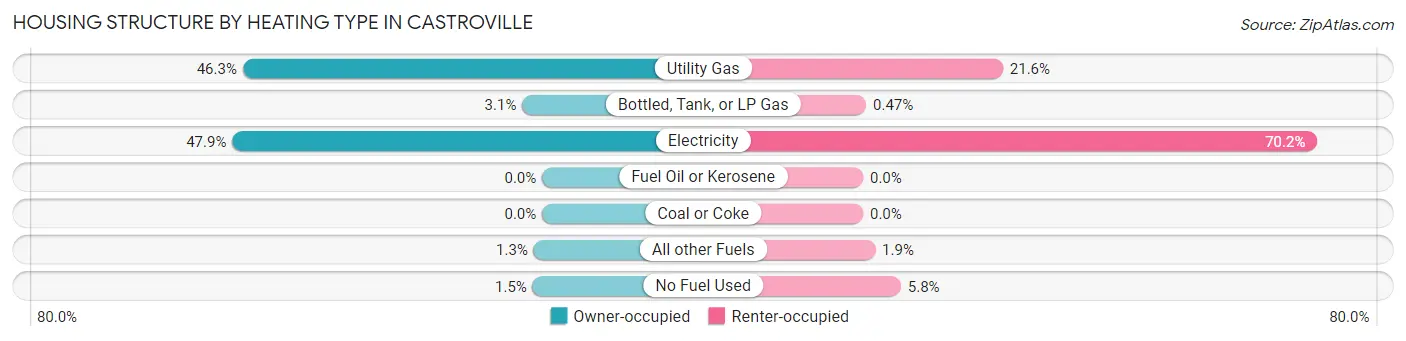
| Heating Type | Owner-occupied | Renter-occupied |
| Utility Gas | 286 (46.3%) | 185 (21.6%) |
| Bottled, Tank, or LP Gas | 19 (3.1%) | 4 (0.5%) |
| Electricity | 296 (47.9%) | 601 (70.2%) |
| Fuel Oil or Kerosene | 0 (0.0%) | 0 (0.0%) |
| Coal or Coke | 0 (0.0%) | 0 (0.0%) |
| All other Fuels | 8 (1.3%) | 16 (1.9%) |
| No Fuel Used | 9 (1.5%) | 50 (5.8%) |
| Total | 618 (100.0%) | 856 (100.0%) |
Household Vehicle Usage in Castroville
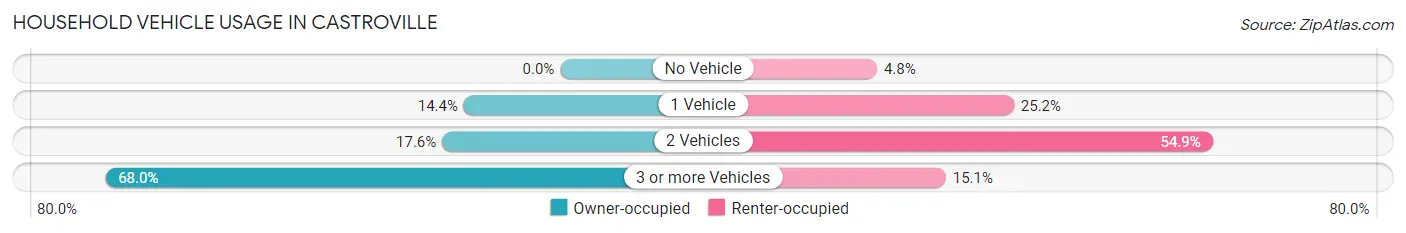
| Vehicles per Household | Owner-occupied | Renter-occupied |
| No Vehicle | 0 (0.0%) | 41 (4.8%) |
| 1 Vehicle | 89 (14.4%) | 216 (25.2%) |
| 2 Vehicles | 109 (17.6%) | 470 (54.9%) |
| 3 or more Vehicles | 420 (68.0%) | 129 (15.1%) |
| Total | 618 (100.0%) | 856 (100.0%) |
Real Estate & Mortgages in Castroville
Real Estate and Mortgage Overview in Castroville
| Characteristic | Without Mortgage | With Mortgage |
| Housing Units | 89 | 529 |
| Median Property Value | $671,600 | $651,700 |
| Median Household Income | $117,250 | $133 |
| Monthly Housing Costs | - | - |
| Real Estate Taxes | $1,328 | $12 |
Property Value by Mortgage Status in Castroville
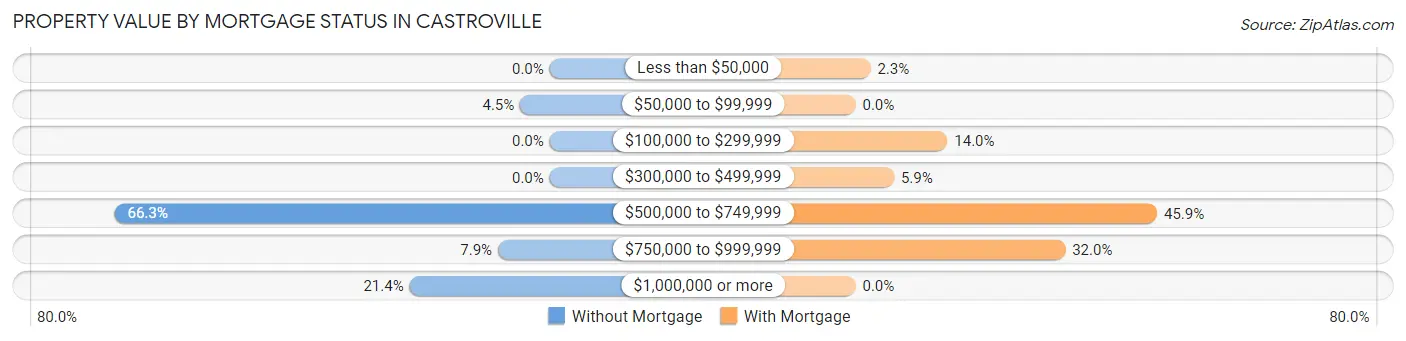
| Property Value | Without Mortgage | With Mortgage |
| Less than $50,000 | 0 (0.0%) | 12 (2.3%) |
| $50,000 to $99,999 | 4 (4.5%) | 0 (0.0%) |
| $100,000 to $299,999 | 0 (0.0%) | 74 (14.0%) |
| $300,000 to $499,999 | 0 (0.0%) | 31 (5.9%) |
| $500,000 to $749,999 | 59 (66.3%) | 243 (45.9%) |
| $750,000 to $999,999 | 7 (7.9%) | 169 (32.0%) |
| $1,000,000 or more | 19 (21.3%) | 0 (0.0%) |
| Total | 89 (100.0%) | 529 (100.0%) |
Household Income by Mortgage Status in Castroville
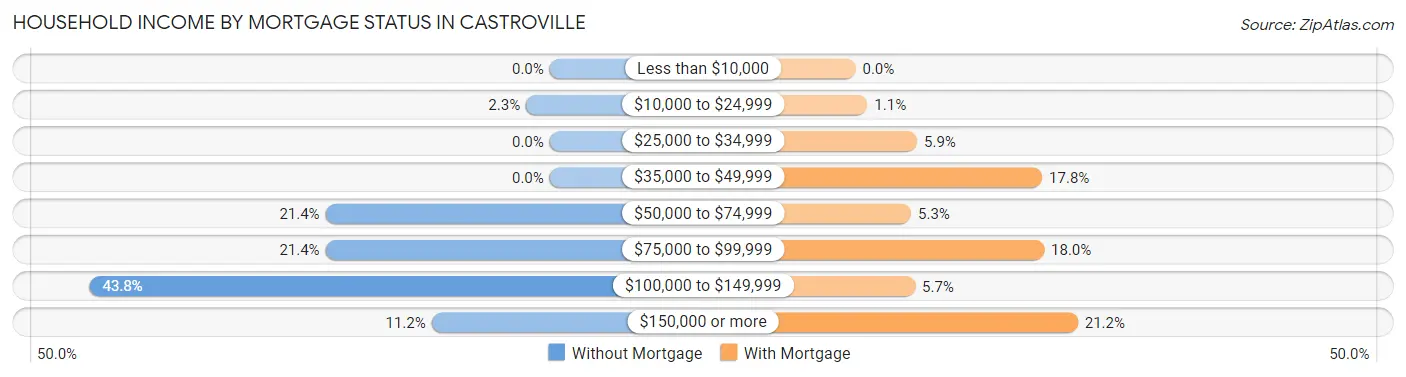
| Household Income | Without Mortgage | With Mortgage |
| Less than $10,000 | 0 (0.0%) | 0 (0.0%) |
| $10,000 to $24,999 | 2 (2.2%) | 6 (1.1%) |
| $25,000 to $34,999 | 0 (0.0%) | 31 (5.9%) |
| $35,000 to $49,999 | 0 (0.0%) | 94 (17.8%) |
| $50,000 to $74,999 | 19 (21.3%) | 28 (5.3%) |
| $75,000 to $99,999 | 19 (21.3%) | 95 (18.0%) |
| $100,000 to $149,999 | 39 (43.8%) | 30 (5.7%) |
| $150,000 or more | 10 (11.2%) | 112 (21.2%) |
| Total | 89 (100.0%) | 529 (100.0%) |
Property Value to Household Income Ratio in Castroville
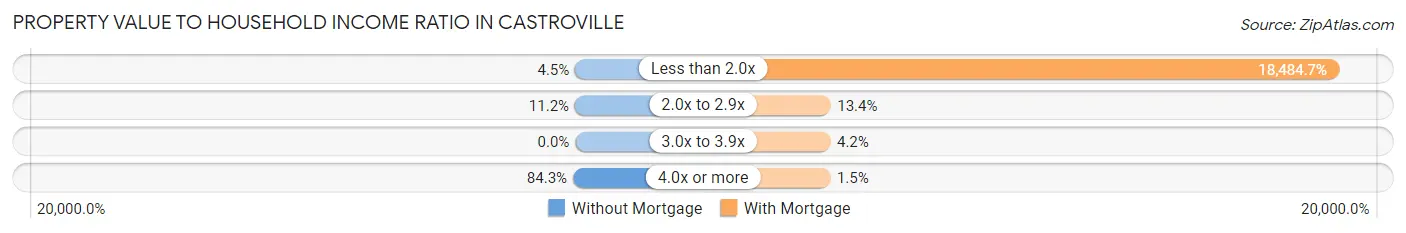
| Value-to-Income Ratio | Without Mortgage | With Mortgage |
| Less than 2.0x | 4 (4.5%) | 97,784 (18,484.7%) |
| 2.0x to 2.9x | 10 (11.2%) | 71 (13.4%) |
| 3.0x to 3.9x | 0 (0.0%) | 22 (4.2%) |
| 4.0x or more | 75 (84.3%) | 8 (1.5%) |
| Total | 89 (100.0%) | 529 (100.0%) |
Real Estate Taxes by Mortgage Status in Castroville

| Property Taxes | Without Mortgage | With Mortgage |
| Less than $800 | 0 (0.0%) | 6 (1.1%) |
| $800 to $1,499 | 45 (50.6%) | 59 (11.2%) |
| $800 to $1,499 | 14 (15.7%) | 117 (22.1%) |
| Total | 89 (100.0%) | 529 (100.0%) |
Health & Disability in Castroville
Health Insurance Coverage by Age in Castroville
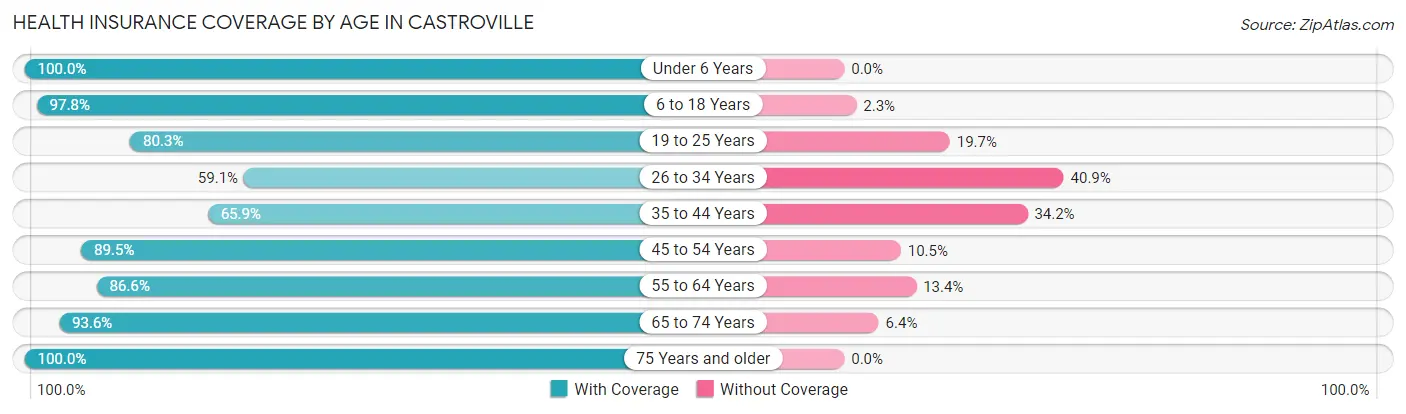
| Age Bracket | With Coverage | Without Coverage |
| Under 6 Years | 830 (100.0%) | 0 (0.0%) |
| 6 to 18 Years | 1,475 (97.8%) | 34 (2.2%) |
| 19 to 25 Years | 441 (80.3%) | 108 (19.7%) |
| 26 to 34 Years | 656 (59.1%) | 454 (40.9%) |
| 35 to 44 Years | 567 (65.8%) | 294 (34.2%) |
| 45 to 54 Years | 561 (89.5%) | 66 (10.5%) |
| 55 to 64 Years | 381 (86.6%) | 59 (13.4%) |
| 65 to 74 Years | 540 (93.6%) | 37 (6.4%) |
| 75 Years and older | 117 (100.0%) | 0 (0.0%) |
| Total | 5,568 (84.1%) | 1,052 (15.9%) |
Health Insurance Coverage by Citizenship Status in Castroville

| Citizenship Status | With Coverage | Without Coverage |
| Native Born | 830 (100.0%) | 0 (0.0%) |
| Foreign Born, Citizen | 1,475 (97.8%) | 34 (2.2%) |
| Foreign Born, not a Citizen | 441 (80.3%) | 108 (19.7%) |
Health Insurance Coverage by Household Income in Castroville
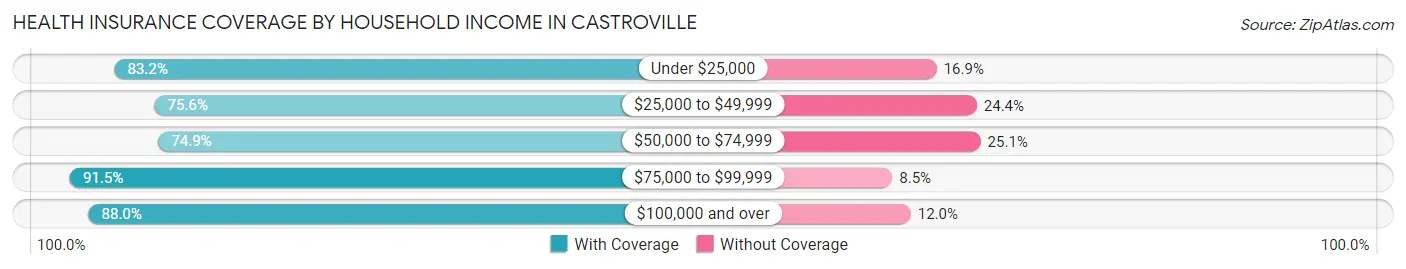
| Household Income | With Coverage | Without Coverage |
| Under $25,000 | 464 (83.2%) | 94 (16.9%) |
| $25,000 to $49,999 | 689 (75.6%) | 222 (24.4%) |
| $50,000 to $74,999 | 947 (74.9%) | 317 (25.1%) |
| $75,000 to $99,999 | 1,169 (91.5%) | 109 (8.5%) |
| $100,000 and over | 2,273 (88.0%) | 310 (12.0%) |
Public vs Private Health Insurance Coverage by Age in Castroville
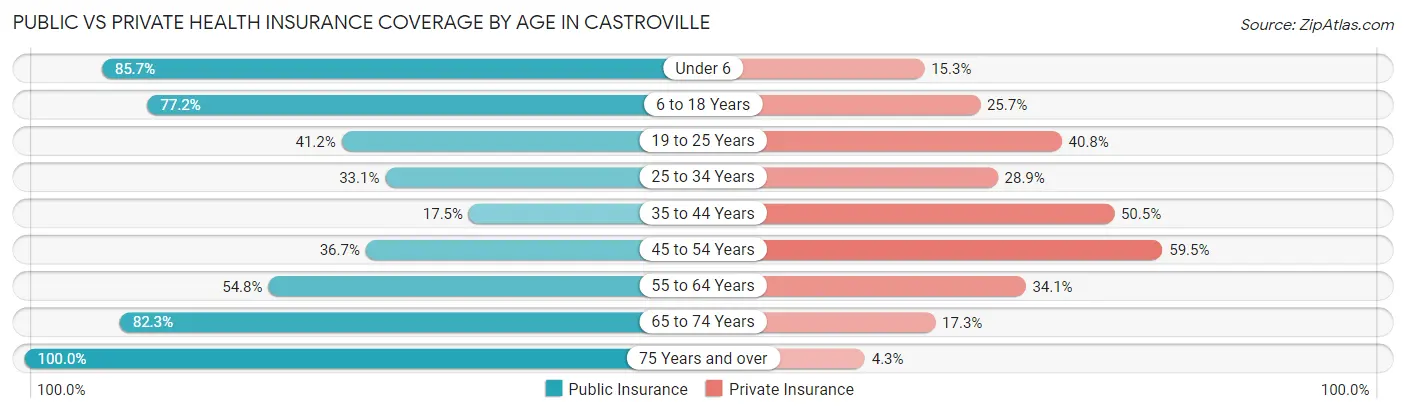
| Age Bracket | Public Insurance | Private Insurance |
| Under 6 | 711 (85.7%) | 127 (15.3%) |
| 6 to 18 Years | 1,165 (77.2%) | 387 (25.7%) |
| 19 to 25 Years | 226 (41.2%) | 224 (40.8%) |
| 25 to 34 Years | 367 (33.1%) | 321 (28.9%) |
| 35 to 44 Years | 151 (17.5%) | 435 (50.5%) |
| 45 to 54 Years | 230 (36.7%) | 373 (59.5%) |
| 55 to 64 Years | 241 (54.8%) | 150 (34.1%) |
| 65 to 74 Years | 475 (82.3%) | 100 (17.3%) |
| 75 Years and over | 117 (100.0%) | 5 (4.3%) |
| Total | 3,683 (55.6%) | 2,122 (32.1%) |
Disability Status by Sex by Age in Castroville
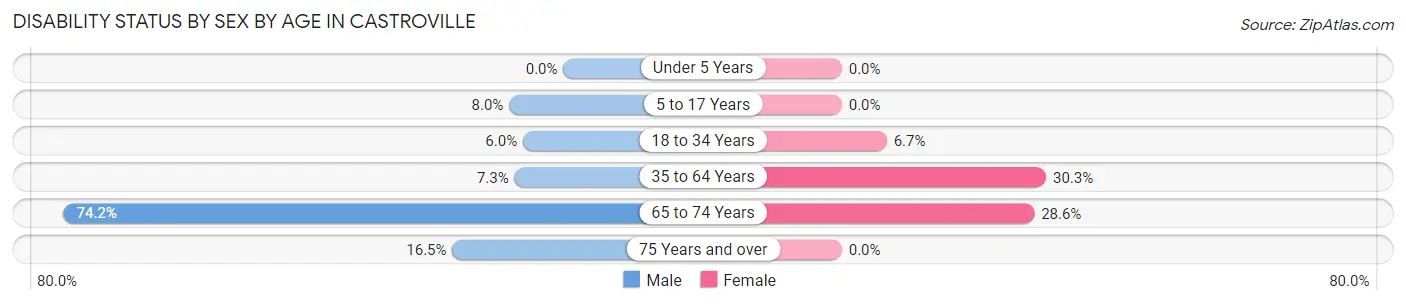
| Age Bracket | Male | Female |
| Under 5 Years | 0 (0.0%) | 0 (0.0%) |
| 5 to 17 Years | 78 (8.0%) | 0 (0.0%) |
| 18 to 34 Years | 47 (6.0%) | 63 (6.7%) |
| 35 to 64 Years | 81 (7.2%) | 246 (30.3%) |
| 65 to 74 Years | 210 (74.2%) | 84 (28.6%) |
| 75 Years and over | 15 (16.5%) | 0 (0.0%) |
Disability Class by Sex by Age in Castroville
Disability Class: Hearing Difficulty
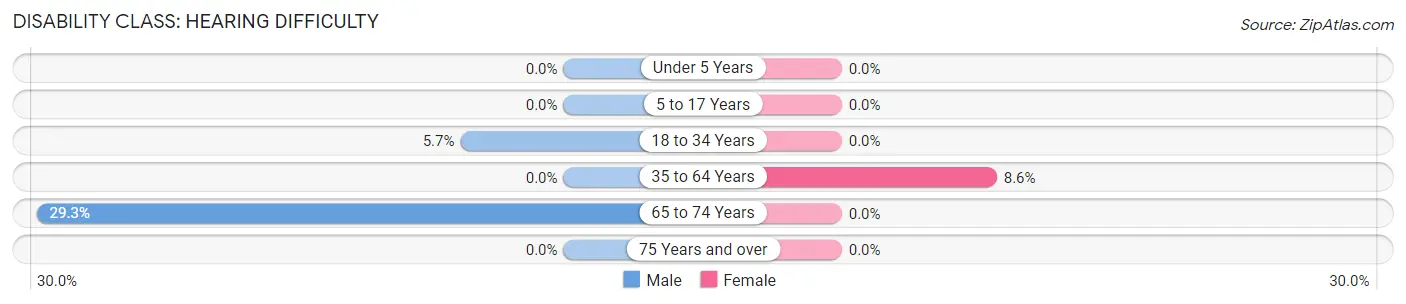
| Age Bracket | Male | Female |
| Under 5 Years | 0 (0.0%) | 0 (0.0%) |
| 5 to 17 Years | 0 (0.0%) | 0 (0.0%) |
| 18 to 34 Years | 45 (5.7%) | 0 (0.0%) |
| 35 to 64 Years | 0 (0.0%) | 70 (8.6%) |
| 65 to 74 Years | 83 (29.3%) | 0 (0.0%) |
| 75 Years and over | 0 (0.0%) | 0 (0.0%) |
Disability Class: Vision Difficulty
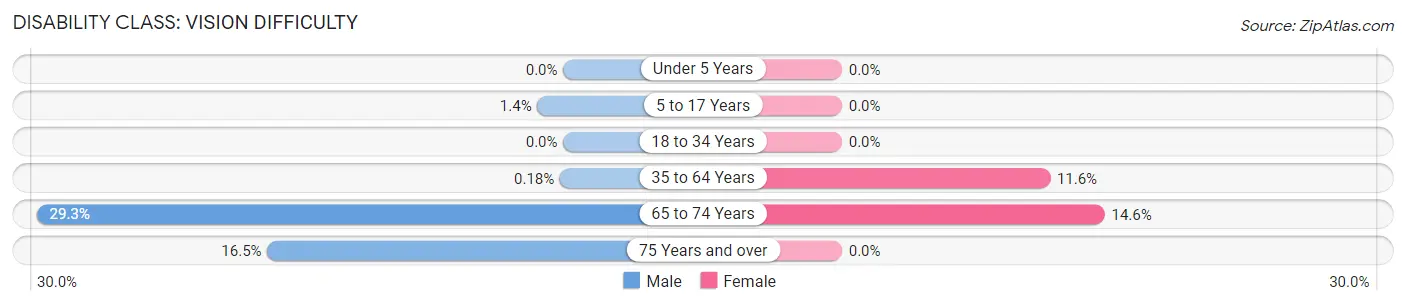
| Age Bracket | Male | Female |
| Under 5 Years | 0 (0.0%) | 0 (0.0%) |
| 5 to 17 Years | 14 (1.4%) | 0 (0.0%) |
| 18 to 34 Years | 0 (0.0%) | 0 (0.0%) |
| 35 to 64 Years | 2 (0.2%) | 94 (11.6%) |
| 65 to 74 Years | 83 (29.3%) | 43 (14.6%) |
| 75 Years and over | 15 (16.5%) | 0 (0.0%) |
Disability Class: Cognitive Difficulty
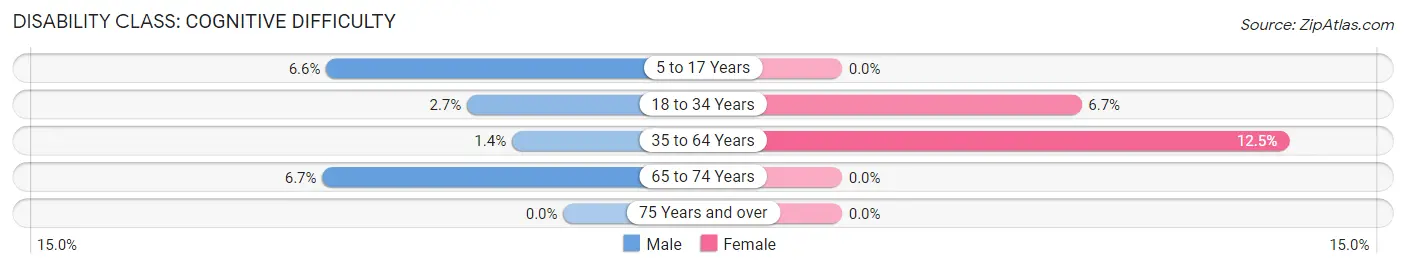
| Age Bracket | Male | Female |
| 5 to 17 Years | 64 (6.6%) | 0 (0.0%) |
| 18 to 34 Years | 21 (2.7%) | 63 (6.7%) |
| 35 to 64 Years | 16 (1.4%) | 101 (12.4%) |
| 65 to 74 Years | 19 (6.7%) | 0 (0.0%) |
| 75 Years and over | 0 (0.0%) | 0 (0.0%) |
Disability Class: Ambulatory Difficulty
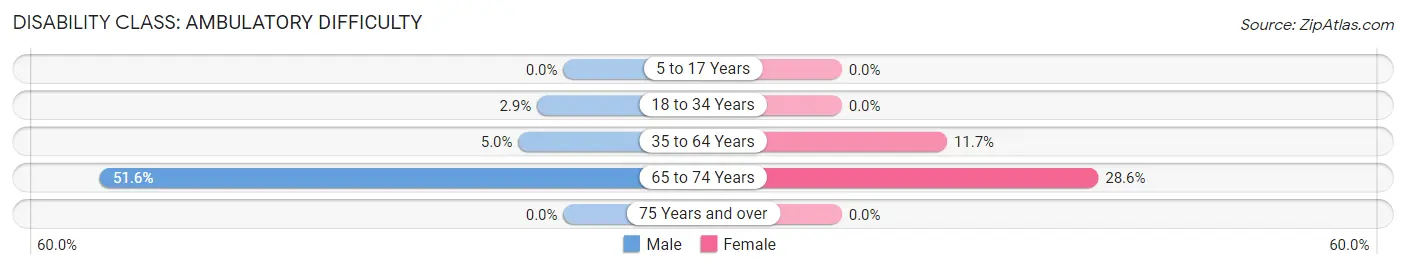
| Age Bracket | Male | Female |
| 5 to 17 Years | 0 (0.0%) | 0 (0.0%) |
| 18 to 34 Years | 23 (2.9%) | 0 (0.0%) |
| 35 to 64 Years | 56 (5.0%) | 95 (11.7%) |
| 65 to 74 Years | 146 (51.6%) | 84 (28.6%) |
| 75 Years and over | 0 (0.0%) | 0 (0.0%) |
Disability Class: Self-Care Difficulty

| Age Bracket | Male | Female |
| 5 to 17 Years | 0 (0.0%) | 0 (0.0%) |
| 18 to 34 Years | 0 (0.0%) | 0 (0.0%) |
| 35 to 64 Years | 35 (3.1%) | 0 (0.0%) |
| 65 to 74 Years | 0 (0.0%) | 41 (14.0%) |
| 75 Years and over | 0 (0.0%) | 0 (0.0%) |
Technology Access in Castroville
Computing Device Access in Castroville
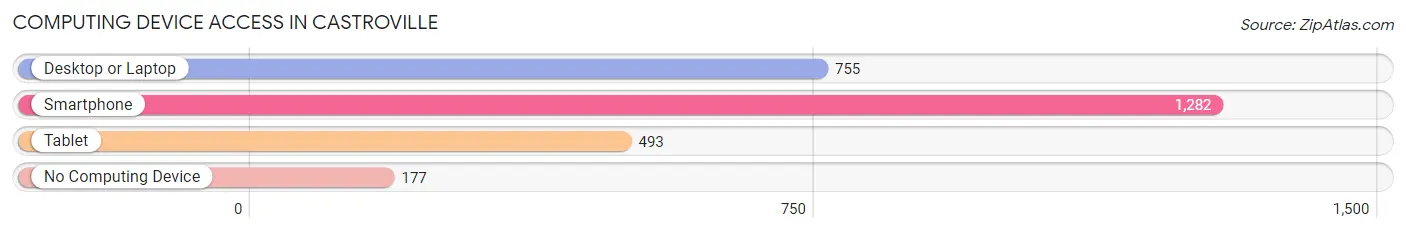
| Device Type | # Households | % Households |
| Desktop or Laptop | 755 | 51.2% |
| Smartphone | 1,282 | 87.0% |
| Tablet | 493 | 33.5% |
| No Computing Device | 177 | 12.0% |
| Total | 1,474 | 100.0% |
Internet Access in Castroville
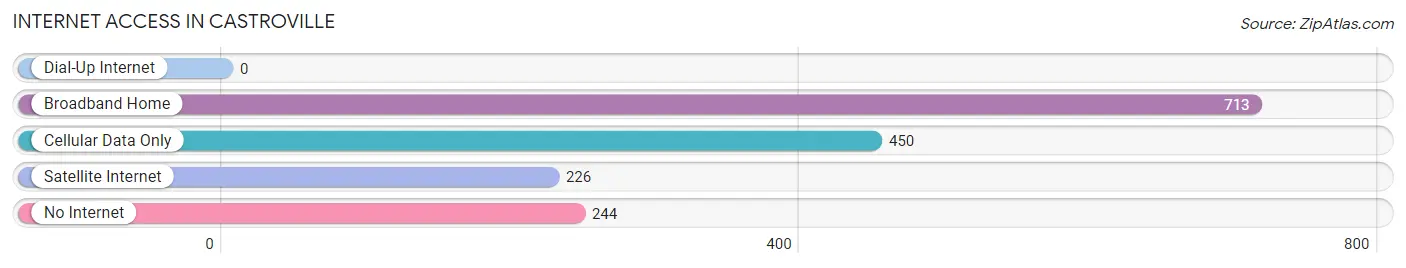
| Internet Type | # Households | % Households |
| Dial-Up Internet | 0 | 0.0% |
| Broadband Home | 713 | 48.4% |
| Cellular Data Only | 450 | 30.5% |
| Satellite Internet | 226 | 15.3% |
| No Internet | 244 | 16.6% |
| Total | 1,474 | 100.0% |
Castroville Summary
Castroville, California is a small unincorporated community located in Monterey County, California. It is situated in the Salinas Valley, approximately 10 miles northwest of Salinas, the county seat. The population of Castroville was estimated to be 5,817 in 2019.
History
Castroville was founded in 1863 by Juan Bautista Castro, a Mexican land grantee. Castro had received a land grant from the Mexican government in 1844, and he used it to establish a settlement in the Salinas Valley. The settlement was named after him, and it quickly became a thriving agricultural community.
The town was incorporated in 1868, and it was the first town in Monterey County to be incorporated. In the late 19th century, Castroville was a popular destination for tourists, who came to enjoy the mild climate and the scenic beauty of the area.
Geography
Castroville is located in the Salinas Valley, which is a large agricultural valley in central California. The valley is bounded by the Santa Lucia Mountains to the east and the Gabilan Range to the west. The Salinas River runs through the valley, and it is the main source of water for the area.
The climate in Castroville is mild and Mediterranean, with warm summers and cool winters. The average annual temperature is around 60°F, and the average annual precipitation is around 15 inches.
Economy
The economy of Castroville is largely based on agriculture. The town is home to a number of farms and ranches, and it is a major producer of lettuce, broccoli, cauliflower, and other vegetables. The town is also home to a number of wineries and vineyards, and it is a popular destination for wine tasting.
In addition to agriculture, Castroville is home to a number of small businesses, including restaurants, shops, and other services. The town is also home to a number of light industrial businesses, including a cannery and a packing plant.
Demographics
As of 2019, the population of Castroville was estimated to be 5,817. The racial makeup of the town was 75.3% White, 0.7% African American, 0.7% Native American, 0.7% Asian, 0.2% Pacific Islander, and 21.6% from other races. The median household income was $50,945, and the median family income was $60,945.
Conclusion
Castroville, California is a small unincorporated community located in Monterey County, California. It was founded in 1863 by Juan Bautista Castro, and it quickly became a thriving agricultural community. The town is situated in the Salinas Valley, and it is known for its mild climate and scenic beauty. The economy of Castroville is largely based on agriculture, and it is home to a number of small businesses. The population of Castroville was estimated to be 5,817 in 2019, and the racial makeup of the town was 75.3% White, 0.7% African American, 0.7% Native American, 0.7% Asian, 0.2% Pacific Islander, and 21.6% from other races.
Common Questions
What is Per Capita Income in Castroville?
Per Capita income in Castroville is $18,689.
What is the Median Family Income in Castroville?
Median Family Income in Castroville is $73,750.
What is the Median Household income in Castroville?
Median Household Income in Castroville is $74,592.
What is Income or Wage Gap in Castroville?
Income or Wage Gap in Castroville is 16.5%.
Women in Castroville earn 83.5 cents for every dollar earned by a man.
What is Family Income Deficit in Castroville?
Family Income Deficit in Castroville is $15,365.
Families that are below poverty line in Castroville earn $15,365 less on average than the poverty threshold level.
What is Inequality or Gini Index in Castroville?
Inequality or Gini Index in Castroville is 0.33.
What is the Total Population of Castroville?
Total Population of Castroville is 6,620.
What is the Total Male Population of Castroville?
Total Male Population of Castroville is 3,405.
What is the Total Female Population of Castroville?
Total Female Population of Castroville is 3,215.
What is the Ratio of Males per 100 Females in Castroville?
There are 105.91 Males per 100 Females in Castroville.
What is the Ratio of Females per 100 Males in Castroville?
There are 94.42 Females per 100 Males in Castroville.
What is the Median Population Age in Castroville?
Median Population Age in Castroville is 30.0 Years.
What is the Average Family Size in Castroville
Average Family Size in Castroville is 4.5 People.
What is the Average Household Size in Castroville
Average Household Size in Castroville is 4.5 People.
How Large is the Labor Force in Castroville?
There are 2,771 People in the Labor Forcein in Castroville.
What is the Percentage of People in the Labor Force in Castroville?
61.9% of People are in the Labor Force in Castroville.
What is the Unemployment Rate in Castroville?
Unemployment Rate in Castroville is 2.6%.