Caruthers, CA Map & Demographics
Caruthers Map
Caruthers Overview
$21,928
PER CAPITA INCOME
$64,056
AVG FAMILY INCOME
$63,528
AVG HOUSEHOLD INCOME
38.3%
WAGE / INCOME GAP [ % ]
61.7¢/ $1
WAGE / INCOME GAP [ $ ]
0.34
INEQUALITY / GINI INDEX
1,950
TOTAL POPULATION
992
MALE POPULATION
958
FEMALE POPULATION
103.55
MALES / 100 FEMALES
96.57
FEMALES / 100 MALES
31.0
MEDIAN AGE
3.7
AVG FAMILY SIZE
3.6
AVG HOUSEHOLD SIZE
808
LABOR FORCE [ PEOPLE ]
57.6%
PERCENT IN LABOR FORCE
12.5%
UNEMPLOYMENT RATE
Caruthers Zip Codes
Caruthers Area Codes
Income in Caruthers
Income Overview in Caruthers
Per Capita Income in Caruthers is $21,928, while median incomes of families and households are $64,056 and $63,528 respectively.
| Characteristic | Number | Measure |
| Per Capita Income | 1,950 | $21,928 |
| Median Family Income | 500 | $64,056 |
| Mean Family Income | 500 | $76,688 |
| Median Household Income | 537 | $63,528 |
| Mean Household Income | 537 | $78,167 |
| Income Deficit | 500 | $0 |
| Wage / Income Gap (%) | 1,950 | 38.30% |
| Wage / Income Gap ($) | 1,950 | 61.70¢ per $1 |
| Gini / Inequality Index | 1,950 | 0.34 |
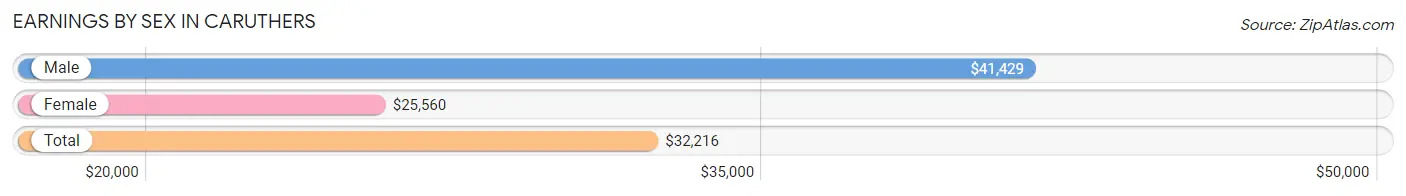
Earnings by Sex in Caruthers
Average Earnings in Caruthers are $32,216, $41,429 for men and $25,560 for women, a difference of 38.3%.
| Sex | Number | Average Earnings |
| Male | 474 (56.0%) | $41,429 |
| Female | 373 (44.0%) | $25,560 |
| Total | 847 (100.0%) | $32,216 |
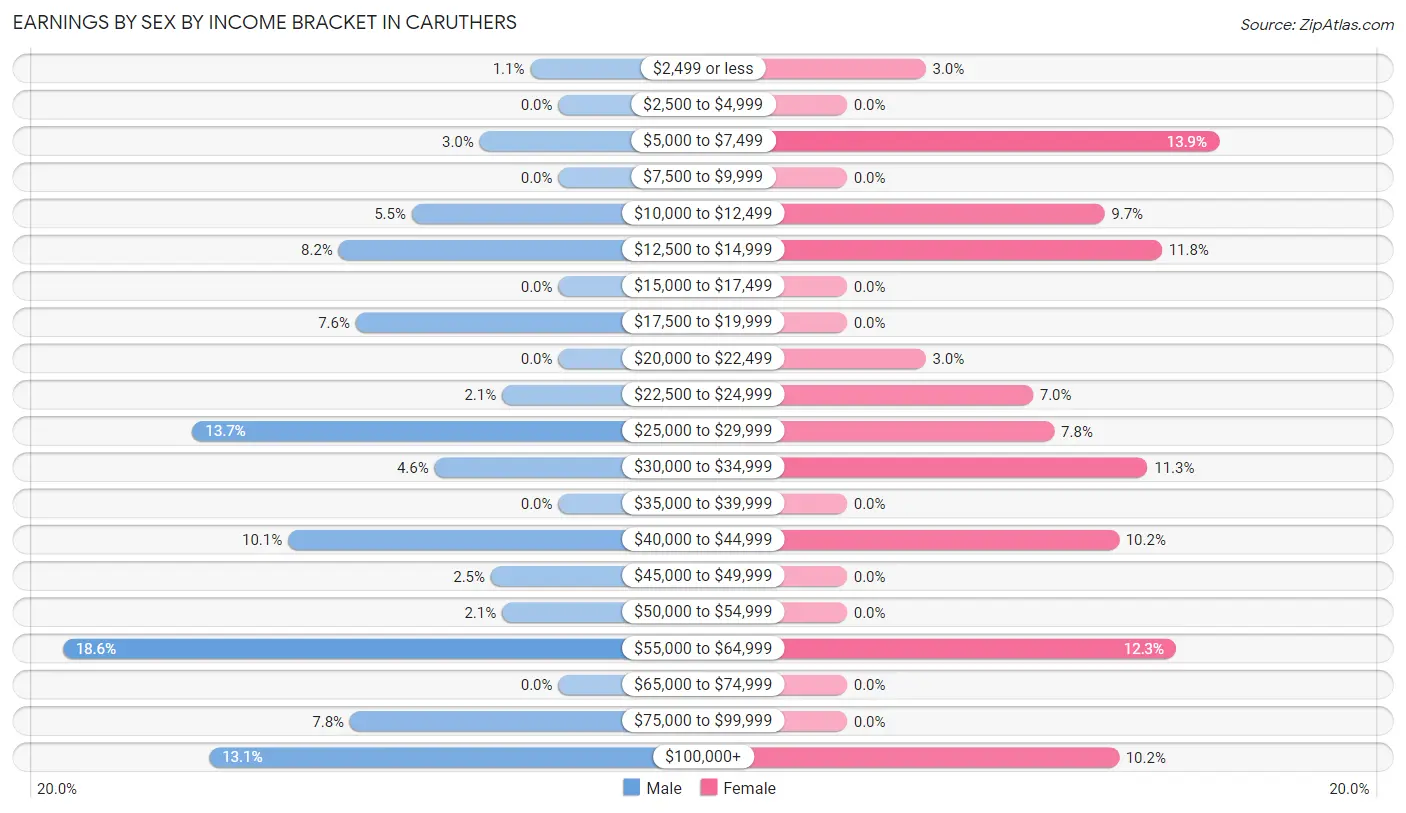
Earnings by Sex by Income Bracket in Caruthers
The most common earnings brackets in Caruthers are $55,000 to $64,999 for men (88 | 18.6%) and $5,000 to $7,499 for women (52 | 13.9%).
| Income | Male | Female |
| $2,499 or less | 5 (1.1%) | 11 (2.9%) |
| $2,500 to $4,999 | 0 (0.0%) | 0 (0.0%) |
| $5,000 to $7,499 | 14 (2.9%) | 52 (13.9%) |
| $7,500 to $9,999 | 0 (0.0%) | 0 (0.0%) |
| $10,000 to $12,499 | 26 (5.5%) | 36 (9.7%) |
| $12,500 to $14,999 | 39 (8.2%) | 44 (11.8%) |
| $15,000 to $17,499 | 0 (0.0%) | 0 (0.0%) |
| $17,500 to $19,999 | 36 (7.6%) | 0 (0.0%) |
| $20,000 to $22,499 | 0 (0.0%) | 11 (2.9%) |
| $22,500 to $24,999 | 10 (2.1%) | 26 (7.0%) |
| $25,000 to $29,999 | 65 (13.7%) | 29 (7.8%) |
| $30,000 to $34,999 | 22 (4.6%) | 42 (11.3%) |
| $35,000 to $39,999 | 0 (0.0%) | 0 (0.0%) |
| $40,000 to $44,999 | 48 (10.1%) | 38 (10.2%) |
| $45,000 to $49,999 | 12 (2.5%) | 0 (0.0%) |
| $50,000 to $54,999 | 10 (2.1%) | 0 (0.0%) |
| $55,000 to $64,999 | 88 (18.6%) | 46 (12.3%) |
| $65,000 to $74,999 | 0 (0.0%) | 0 (0.0%) |
| $75,000 to $99,999 | 37 (7.8%) | 0 (0.0%) |
| $100,000+ | 62 (13.1%) | 38 (10.2%) |
| Total | 474 (100.0%) | 373 (100.0%) |
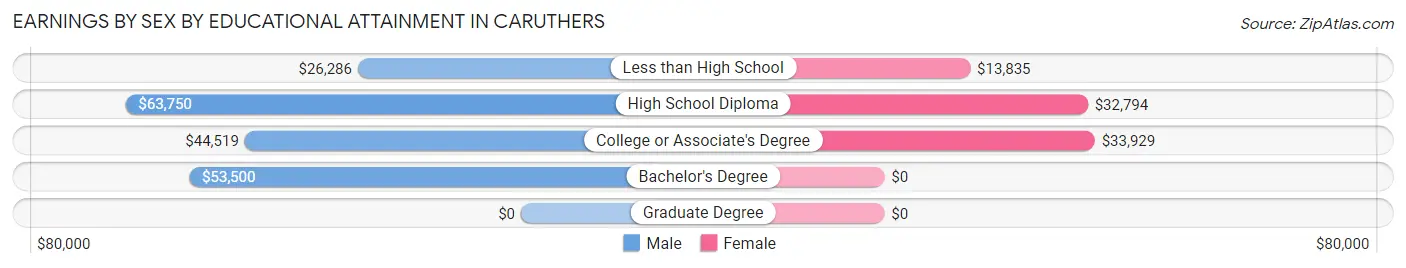
Earnings by Sex by Educational Attainment in Caruthers
Average earnings in Caruthers are $41,393 for men and $27,328 for women, a difference of 34.0%. Men with an educational attainment of high school diploma enjoy the highest average annual earnings of $63,750, while those with less than high school education earn the least with $26,286. Women with an educational attainment of college or associate's degree earn the most with the average annual earnings of $33,929, while those with less than high school education have the smallest earnings of $13,835.
| Educational Attainment | Male Income | Female Income |
| Less than High School | $26,286 | $13,835 |
| High School Diploma | $63,750 | $32,794 |
| College or Associate's Degree | $44,519 | $33,929 |
| Bachelor's Degree | $53,500 | $0 |
| Graduate Degree | - | - |
| Total | $41,393 | $27,328 |
Family Income in Caruthers
Family Income Brackets in Caruthers
According to the Caruthers family income data, there are 160 families falling into the $50,000 to $74,999 income range, which is the most common income bracket and makes up 32.0% of all families.
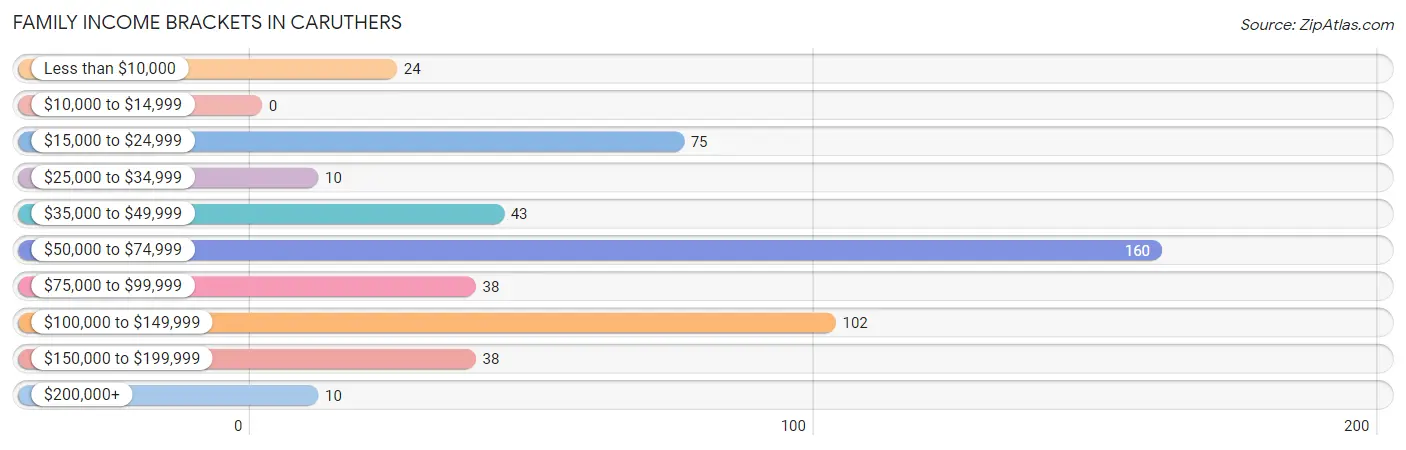
| Income Bracket | # Families | % Families |
| Less than $10,000 | 24 | 4.8% |
| $10,000 to $14,999 | 0 | 0.0% |
| $15,000 to $24,999 | 75 | 15.0% |
| $25,000 to $34,999 | 10 | 2.0% |
| $35,000 to $49,999 | 43 | 8.6% |
| $50,000 to $74,999 | 160 | 32.0% |
| $75,000 to $99,999 | 38 | 7.6% |
| $100,000 to $149,999 | 102 | 20.4% |
| $150,000 to $199,999 | 38 | 7.6% |
| $200,000+ | 10 | 2.0% |
Family Income by Famaliy Size in Caruthers
6-person families (74 | 14.8%) account for the highest median family income in Caruthers with $107,692 per family, while 2-person families (172 | 34.4%) have the highest median income of $26,928 per family member.
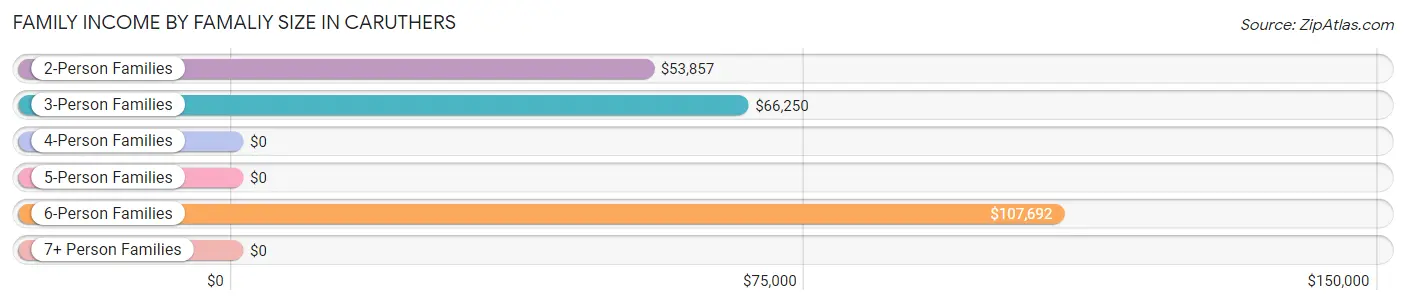
| Income Bracket | # Families | Median Income |
| 2-Person Families | 172 (34.4%) | $53,857 |
| 3-Person Families | 67 (13.4%) | $66,250 |
| 4-Person Families | 93 (18.6%) | $0 |
| 5-Person Families | 94 (18.8%) | $0 |
| 6-Person Families | 74 (14.8%) | $107,692 |
| 7+ Person Families | 0 (0.0%) | $0 |
| Total | 500 (100.0%) | $64,056 |
Family Income by Number of Earners in Caruthers
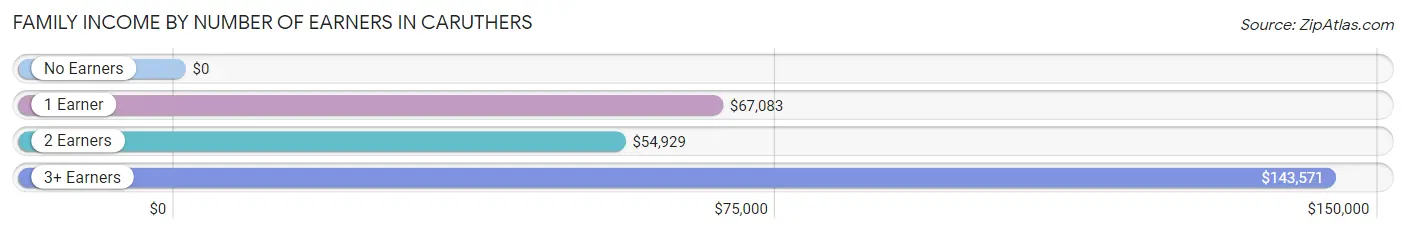
| Number of Earners | # Families | Median Income |
| No Earners | 51 (10.2%) | $0 |
| 1 Earner | 215 (43.0%) | $67,083 |
| 2 Earners | 198 (39.6%) | $54,929 |
| 3+ Earners | 36 (7.2%) | $143,571 |
| Total | 500 (100.0%) | $64,056 |
Household Income in Caruthers
Household Income Brackets in Caruthers
With 199 households falling in the category, the $50,000 to $74,999 income range is the most frequent in Caruthers, accounting for 37.1% of all households.
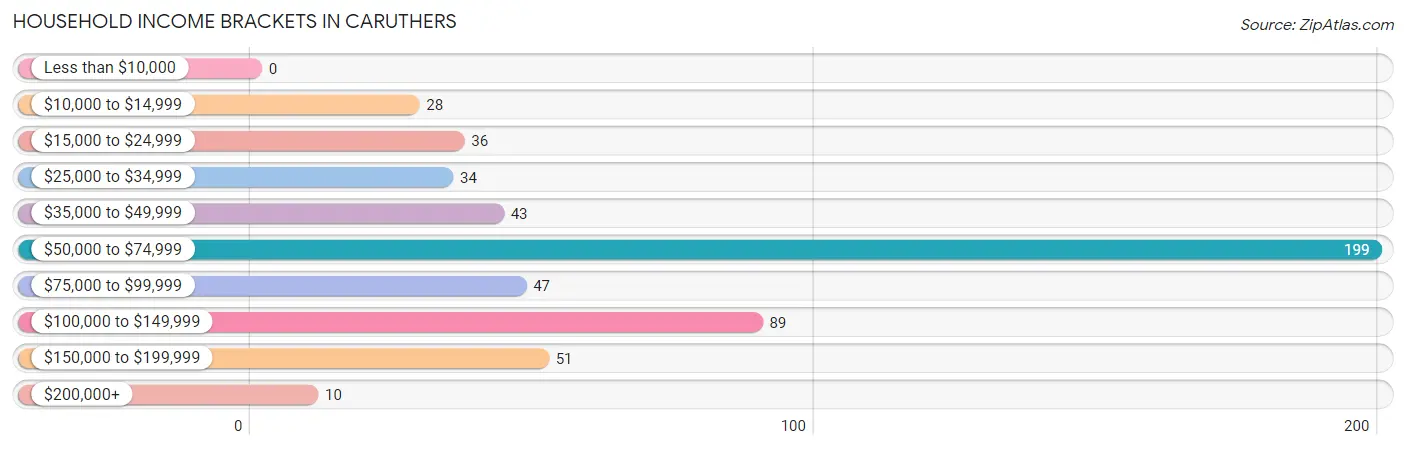
| Income Bracket | # Households | % Households |
| Less than $10,000 | 0 | 0.0% |
| $10,000 to $14,999 | 28 | 5.2% |
| $15,000 to $24,999 | 36 | 6.7% |
| $25,000 to $34,999 | 34 | 6.3% |
| $35,000 to $49,999 | 43 | 8.0% |
| $50,000 to $74,999 | 199 | 37.1% |
| $75,000 to $99,999 | 47 | 8.8% |
| $100,000 to $149,999 | 89 | 16.6% |
| $150,000 to $199,999 | 51 | 9.5% |
| $200,000+ | 10 | 1.9% |
Household Income by Householder Age in Caruthers
The median household income in Caruthers is $63,528, with the highest median household income of $65,250 found in the 65+ years age bracket for the primary householder. A total of 57 households (10.6%) fall into this category. Meanwhile, the 15 to 24 years age bracket for the primary householder has the lowest median household income of $0, with 33 households (6.1%) in this group.
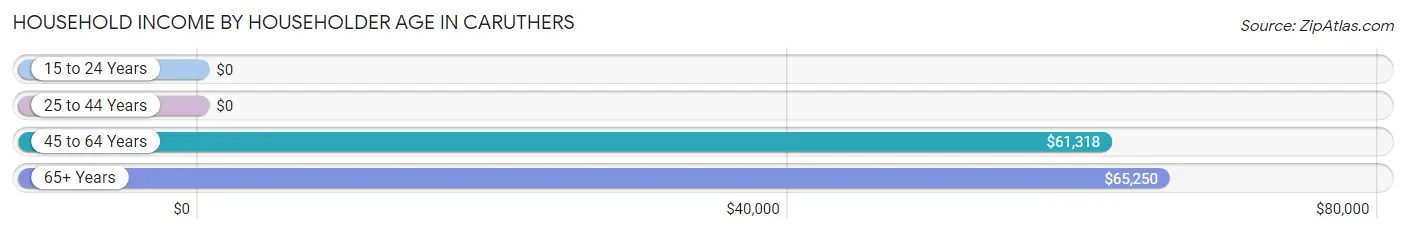
| Income Bracket | # Households | Median Income |
| 15 to 24 Years | 33 (6.1%) | $0 |
| 25 to 44 Years | 151 (28.1%) | $0 |
| 45 to 64 Years | 296 (55.1%) | $61,318 |
| 65+ Years | 57 (10.6%) | $65,250 |
| Total | 537 (100.0%) | $63,528 |
Poverty in Caruthers
Income Below Poverty by Sex and Age in Caruthers
With 25.6% poverty level for males and 16.1% for females among the residents of Caruthers, 16 and 17 year old males and under 5 year old females are the most vulnerable to poverty, with 35 males (100.0%) and 28 females (54.9%) in their respective age groups living below the poverty level.
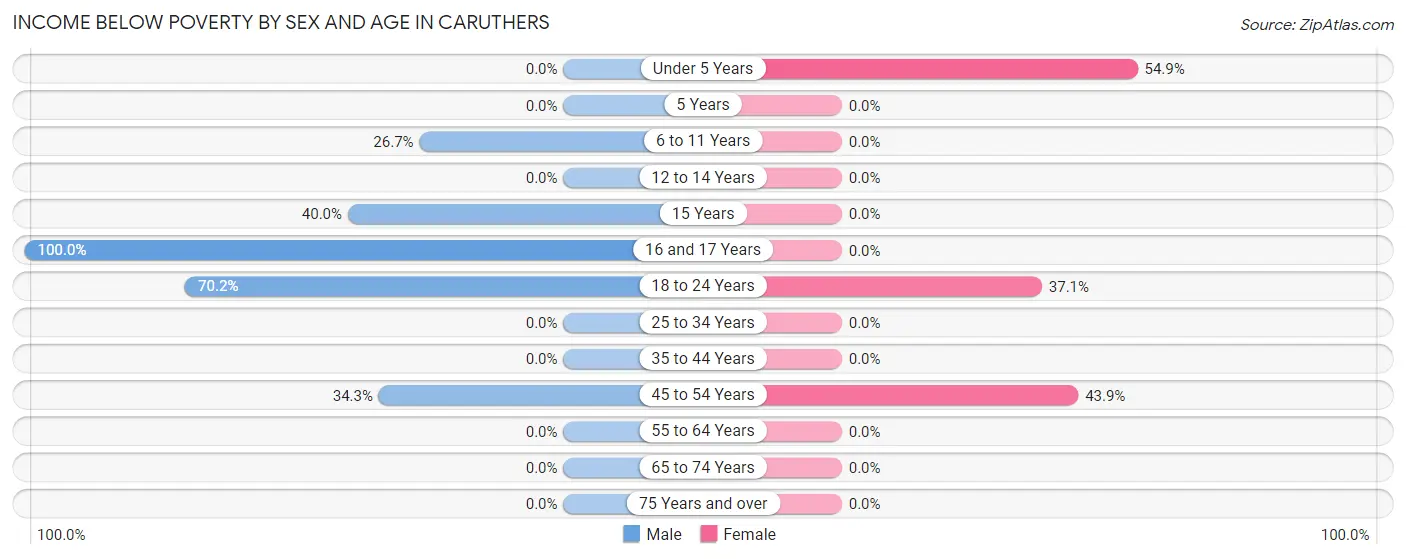
| Age Bracket | Male | Female |
| Under 5 Years | 0 (0.0%) | 28 (54.9%) |
| 5 Years | 0 (0.0%) | 0 (0.0%) |
| 6 to 11 Years | 35 (26.7%) | 0 (0.0%) |
| 12 to 14 Years | 0 (0.0%) | 0 (0.0%) |
| 15 Years | 36 (40.0%) | 0 (0.0%) |
| 16 and 17 Years | 35 (100.0%) | 0 (0.0%) |
| 18 to 24 Years | 73 (70.2%) | 65 (37.1%) |
| 25 to 34 Years | 0 (0.0%) | 0 (0.0%) |
| 35 to 44 Years | 0 (0.0%) | 0 (0.0%) |
| 45 to 54 Years | 75 (34.3%) | 61 (43.9%) |
| 55 to 64 Years | 0 (0.0%) | 0 (0.0%) |
| 65 to 74 Years | 0 (0.0%) | 0 (0.0%) |
| 75 Years and over | 0 (0.0%) | 0 (0.0%) |
| Total | 254 (25.6%) | 154 (16.1%) |
Income Above Poverty by Sex and Age in Caruthers
According to the poverty statistics in Caruthers, males aged under 5 years and females aged 6 to 11 years are the age groups that are most secure financially, with 100.0% of males and 100.0% of females in these age groups living above the poverty line.
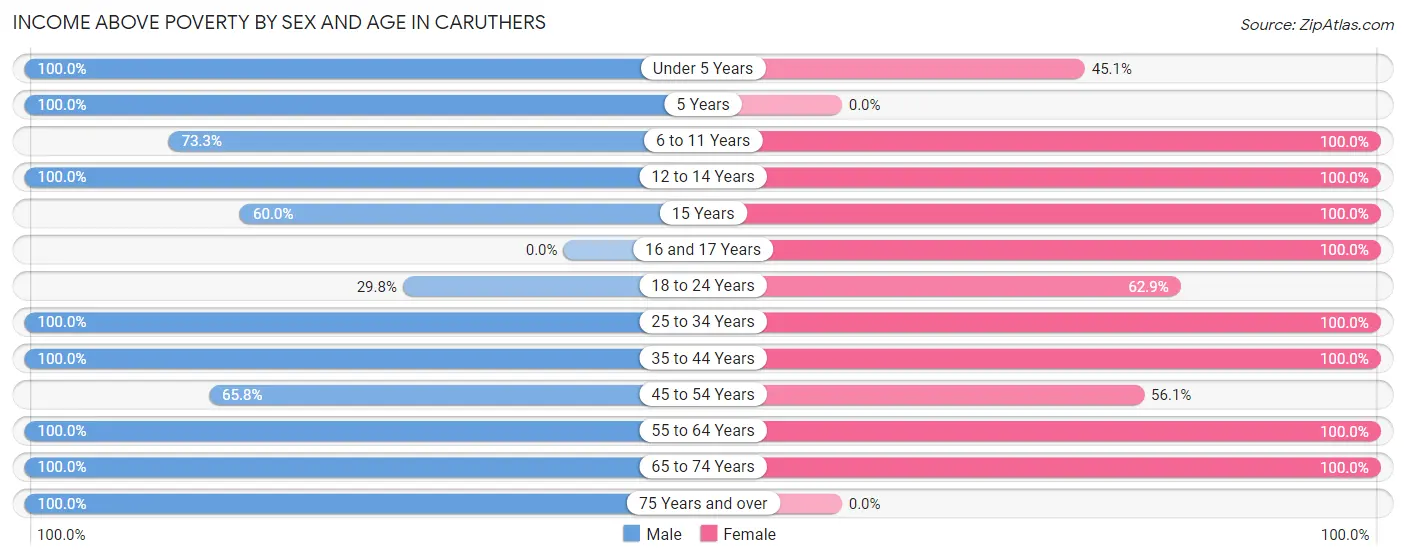
| Age Bracket | Male | Female |
| Under 5 Years | 29 (100.0%) | 23 (45.1%) |
| 5 Years | 44 (100.0%) | 0 (0.0%) |
| 6 to 11 Years | 96 (73.3%) | 85 (100.0%) |
| 12 to 14 Years | 33 (100.0%) | 15 (100.0%) |
| 15 Years | 54 (60.0%) | 70 (100.0%) |
| 16 and 17 Years | 0 (0.0%) | 22 (100.0%) |
| 18 to 24 Years | 31 (29.8%) | 110 (62.9%) |
| 25 to 34 Years | 92 (100.0%) | 134 (100.0%) |
| 35 to 44 Years | 75 (100.0%) | 152 (100.0%) |
| 45 to 54 Years | 144 (65.7%) | 78 (56.1%) |
| 55 to 64 Years | 71 (100.0%) | 58 (100.0%) |
| 65 to 74 Years | 54 (100.0%) | 57 (100.0%) |
| 75 Years and over | 15 (100.0%) | 0 (0.0%) |
| Total | 738 (74.4%) | 804 (83.9%) |
Income Below Poverty Among Married-Couple Families in Caruthers
The poverty statistics for married-couple families in Caruthers show that 9.3% or 36 of the total 388 families live below the poverty line. Families with 1 or 2 children have the highest poverty rate of 24.3%, comprising of 36 families. On the other hand, families with no children have the lowest poverty rate of 0.0%, which includes 0 families.
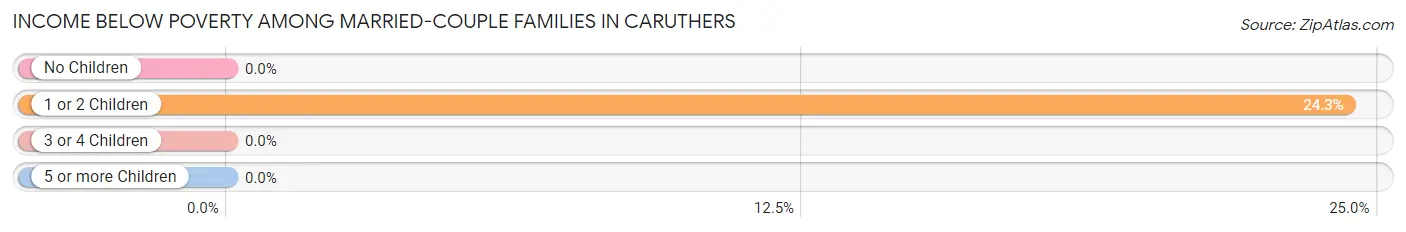
| Children | Above Poverty | Below Poverty |
| No Children | 180 (100.0%) | 0 (0.0%) |
| 1 or 2 Children | 112 (75.7%) | 36 (24.3%) |
| 3 or 4 Children | 60 (100.0%) | 0 (0.0%) |
| 5 or more Children | 0 (0.0%) | 0 (0.0%) |
| Total | 352 (90.7%) | 36 (9.3%) |
Income Below Poverty Among Single-Parent Households in Caruthers
According to the poverty data in Caruthers, 100.0% or 39 single-father households and 32.9% or 24 single-mother households are living below the poverty line. Among single-father households, those with 1 or 2 children have the highest poverty rate, with 39 households (100.0%) experiencing poverty. Likewise, among single-mother households, those with 1 or 2 children have the highest poverty rate, with 24 households (44.4%) falling below the poverty line.
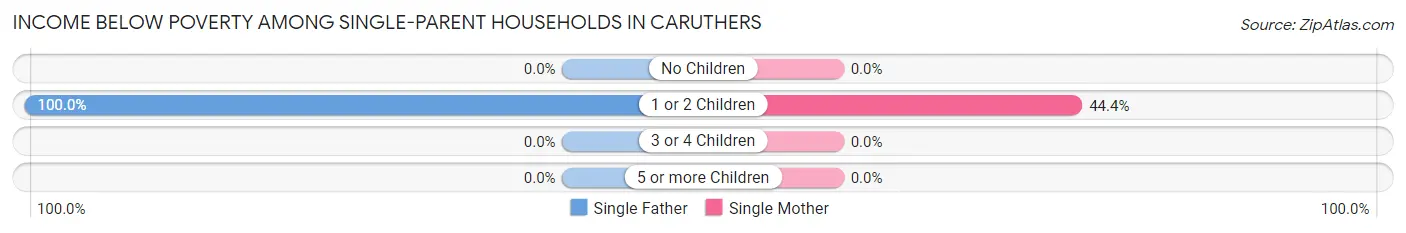
| Children | Single Father | Single Mother |
| No Children | 0 (0.0%) | 0 (0.0%) |
| 1 or 2 Children | 39 (100.0%) | 24 (44.4%) |
| 3 or 4 Children | 0 (0.0%) | 0 (0.0%) |
| 5 or more Children | 0 (0.0%) | 0 (0.0%) |
| Total | 39 (100.0%) | 24 (32.9%) |
Income Below Poverty Among Married-Couple vs Single-Parent Households in Caruthers
The poverty data for Caruthers shows that 36 of the married-couple family households (9.3%) and 63 of the single-parent households (56.2%) are living below the poverty level. Within the married-couple family households, those with 1 or 2 children have the highest poverty rate, with 36 households (24.3%) falling below the poverty line. Among the single-parent households, those with 1 or 2 children have the highest poverty rate, with 63 household (67.7%) living below poverty.
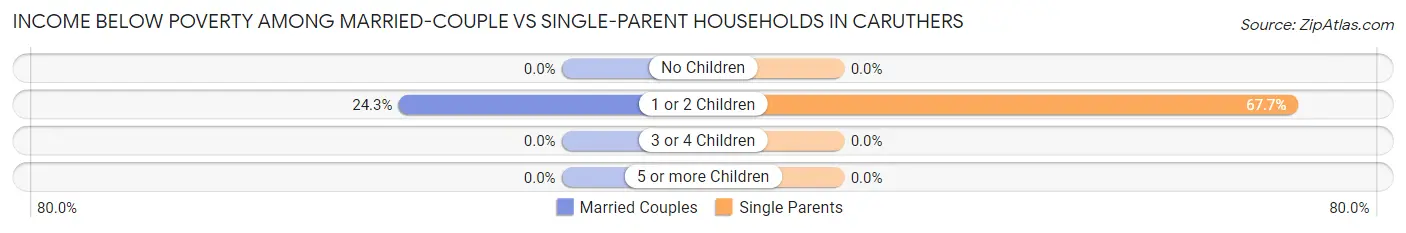
| Children | Married-Couple Families | Single-Parent Households |
| No Children | 0 (0.0%) | 0 (0.0%) |
| 1 or 2 Children | 36 (24.3%) | 63 (67.7%) |
| 3 or 4 Children | 0 (0.0%) | 0 (0.0%) |
| 5 or more Children | 0 (0.0%) | 0 (0.0%) |
| Total | 36 (9.3%) | 63 (56.2%) |
Race in Caruthers
The most populous races in Caruthers are Hispanic or Latino (1,373 | 70.4%), White / Caucasian (1,155 | 59.2%), and Some other Race (693 | 35.5%).
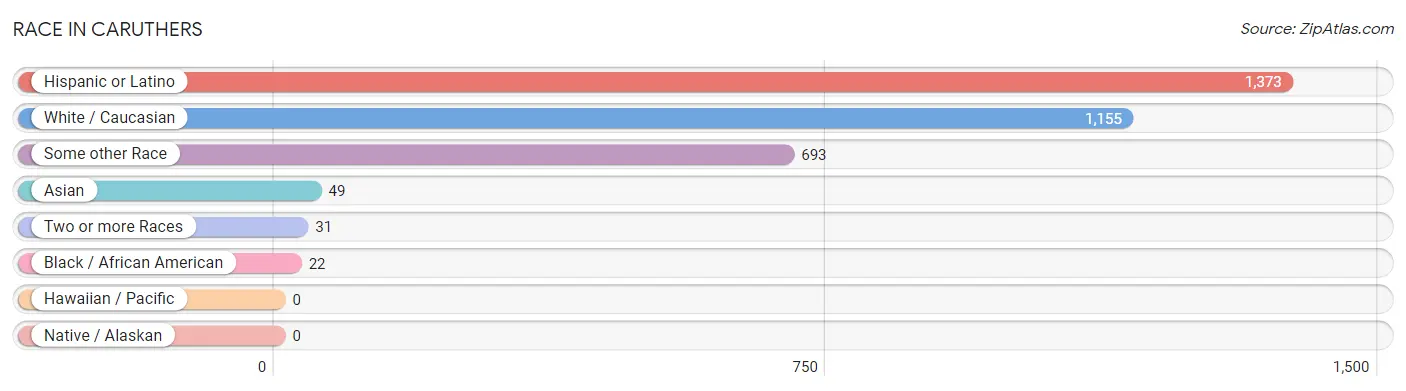
| Race | # Population | % Population |
| Asian | 49 | 2.5% |
| Black / African American | 22 | 1.1% |
| Hawaiian / Pacific | 0 | 0.0% |
| Hispanic or Latino | 1,373 | 70.4% |
| Native / Alaskan | 0 | 0.0% |
| White / Caucasian | 1,155 | 59.2% |
| Two or more Races | 31 | 1.6% |
| Some other Race | 693 | 35.5% |
| Total | 1,950 | 100.0% |
Ancestry in Caruthers
The most populous ancestries reported in Caruthers are Mexican (1,373 | 70.4%), German (103 | 5.3%), Armenian (52 | 2.7%), Irish (46 | 2.4%), and English (41 | 2.1%), together accounting for 82.8% of all Caruthers residents.
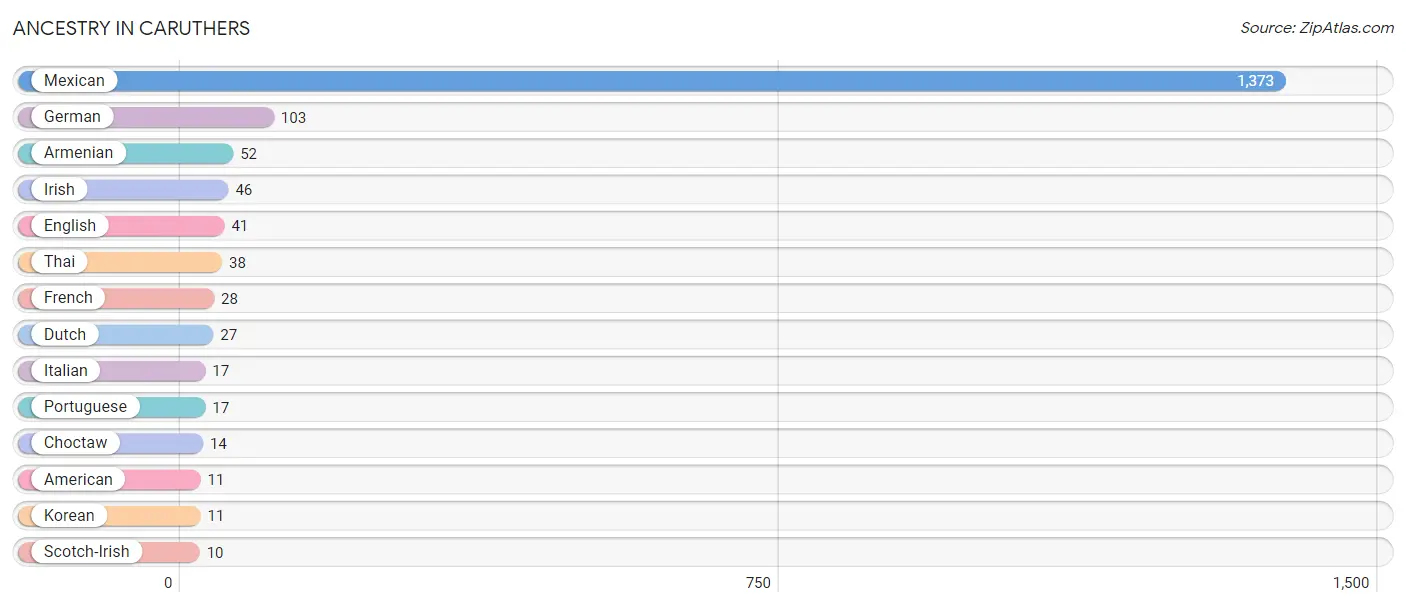
| Ancestry | # Population | % Population |
| American | 11 | 0.6% |
| Armenian | 52 | 2.7% |
| Choctaw | 14 | 0.7% |
| Dutch | 27 | 1.4% |
| English | 41 | 2.1% |
| French | 28 | 1.4% |
| German | 103 | 5.3% |
| Irish | 46 | 2.4% |
| Italian | 17 | 0.9% |
| Korean | 11 | 0.6% |
| Mexican | 1,373 | 70.4% |
| Portuguese | 17 | 0.9% |
| Scotch-Irish | 10 | 0.5% |
| Thai | 38 | 1.9% | View All 14 Rows |
Immigrants in Caruthers
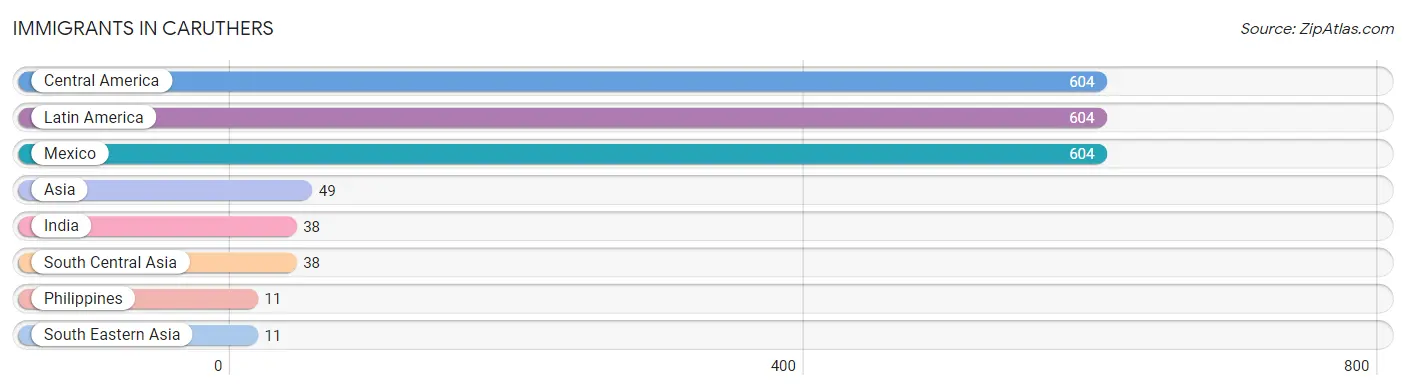
The most numerous immigrant groups reported in Caruthers came from Central America (604 | 31.0%), Latin America (604 | 31.0%), Mexico (604 | 31.0%), Asia (49 | 2.5%), and India (38 | 1.9%), together accounting for 97.4% of all Caruthers residents.
| Immigration Origin | # Population | % Population |
| Asia | 49 | 2.5% |
| Central America | 604 | 31.0% |
| India | 38 | 1.9% |
| Latin America | 604 | 31.0% |
| Mexico | 604 | 31.0% |
| Philippines | 11 | 0.6% |
| South Central Asia | 38 | 1.9% |
| South Eastern Asia | 11 | 0.6% | View All 8 Rows |
Sex and Age in Caruthers
Sex and Age in Caruthers
The most populous age groups in Caruthers are 15 to 19 Years (169 | 17.0%) for men and 15 to 19 Years (155 | 16.2%) for women.
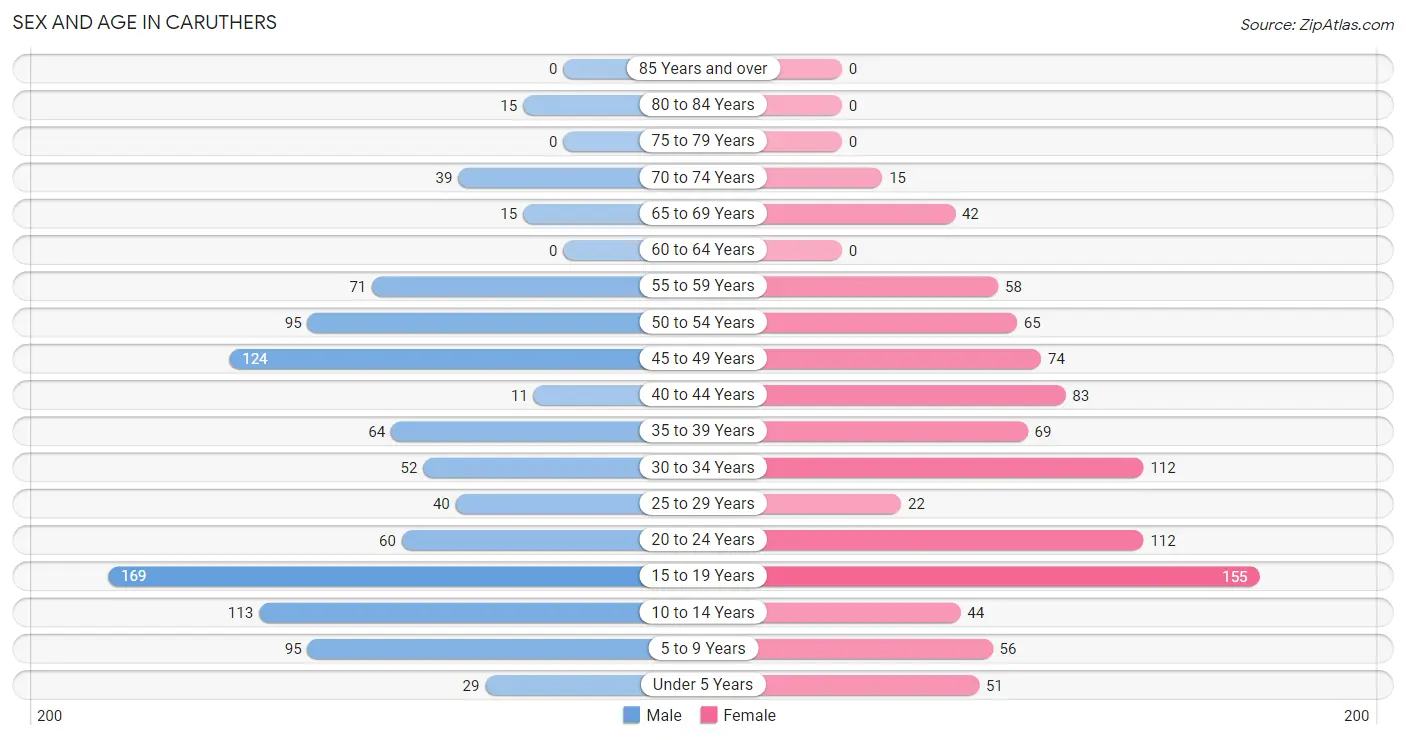
| Age Bracket | Male | Female |
| Under 5 Years | 29 (2.9%) | 51 (5.3%) |
| 5 to 9 Years | 95 (9.6%) | 56 (5.9%) |
| 10 to 14 Years | 113 (11.4%) | 44 (4.6%) |
| 15 to 19 Years | 169 (17.0%) | 155 (16.2%) |
| 20 to 24 Years | 60 (6.0%) | 112 (11.7%) |
| 25 to 29 Years | 40 (4.0%) | 22 (2.3%) |
| 30 to 34 Years | 52 (5.2%) | 112 (11.7%) |
| 35 to 39 Years | 64 (6.5%) | 69 (7.2%) |
| 40 to 44 Years | 11 (1.1%) | 83 (8.7%) |
| 45 to 49 Years | 124 (12.5%) | 74 (7.7%) |
| 50 to 54 Years | 95 (9.6%) | 65 (6.8%) |
| 55 to 59 Years | 71 (7.2%) | 58 (6.0%) |
| 60 to 64 Years | 0 (0.0%) | 0 (0.0%) |
| 65 to 69 Years | 15 (1.5%) | 42 (4.4%) |
| 70 to 74 Years | 39 (3.9%) | 15 (1.6%) |
| 75 to 79 Years | 0 (0.0%) | 0 (0.0%) |
| 80 to 84 Years | 15 (1.5%) | 0 (0.0%) |
| 85 Years and over | 0 (0.0%) | 0 (0.0%) |
| Total | 992 (100.0%) | 958 (100.0%) |
Families and Households in Caruthers
Median Family Size in Caruthers
The median family size in Caruthers is 3.67 persons per family, with single male/father families (39 | 7.8%) accounting for the largest median family size of 3.87 persons per family. On the other hand, single female/mother families (73 | 14.6%) represent the smallest median family size with 3.18 persons per family.
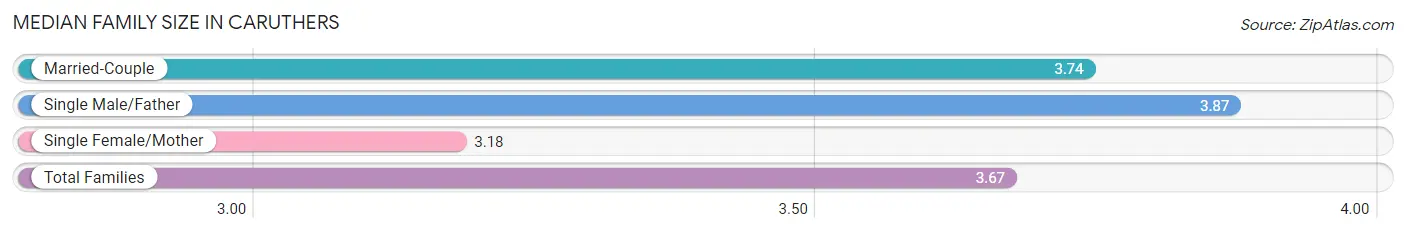
| Family Type | # Families | Family Size |
| Married-Couple | 388 (77.6%) | 3.74 |
| Single Male/Father | 39 (7.8%) | 3.87 |
| Single Female/Mother | 73 (14.6%) | 3.18 |
| Total Families | 500 (100.0%) | 3.67 |
Median Household Size in Caruthers
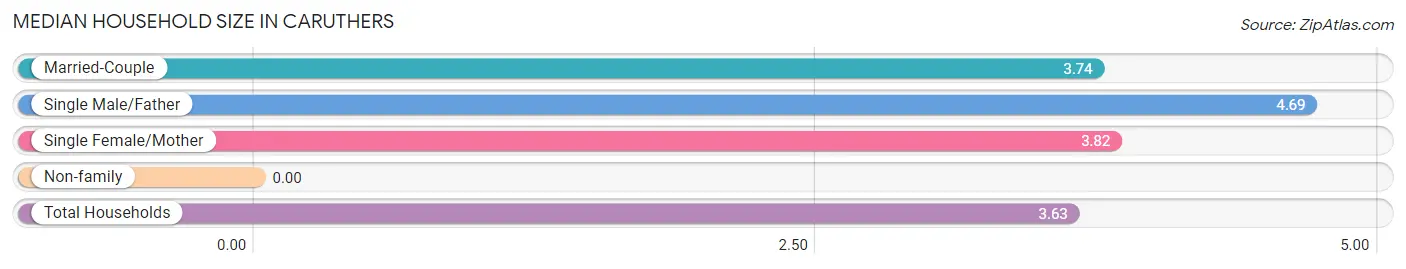
| Household Type | # Households | Household Size |
| Married-Couple | 388 (72.3%) | 3.74 |
| Single Male/Father | 39 (7.3%) | 4.69 |
| Single Female/Mother | 73 (13.6%) | 3.82 |
| Non-family | 37 (6.9%) | - |
| Total Households | 537 (100.0%) | 3.63 |
Household Size by Marriage Status in Caruthers
Out of a total of 537 households in Caruthers, 500 (93.1%) are family households, while 37 (6.9%) are nonfamily households. The most numerous type of family households are 2-person households, comprising 148, and the most common type of nonfamily households are 1-person households, comprising 37.
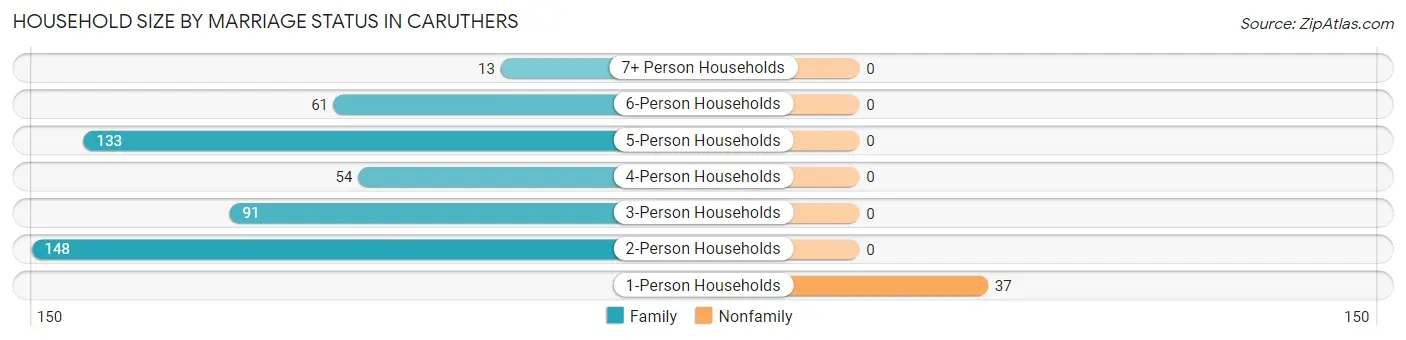
| Household Size | Family Households | Nonfamily Households |
| 1-Person Households | - | 37 (6.9%) |
| 2-Person Households | 148 (27.6%) | 0 (0.0%) |
| 3-Person Households | 91 (17.0%) | 0 (0.0%) |
| 4-Person Households | 54 (10.1%) | 0 (0.0%) |
| 5-Person Households | 133 (24.8%) | 0 (0.0%) |
| 6-Person Households | 61 (11.4%) | 0 (0.0%) |
| 7+ Person Households | 13 (2.4%) | 0 (0.0%) |
| Total | 500 (93.1%) | 37 (6.9%) |
Female Fertility in Caruthers
Fertility by Age in Caruthers
Average fertility rate in Caruthers is 45.0 births per 1,000 women. Women in the age bracket of 20 to 34 years have the highest fertility rate with 114.0 births per 1,000 women. Women in the age bracket of 20 to 34 years acount for 100.0% of all women with births.
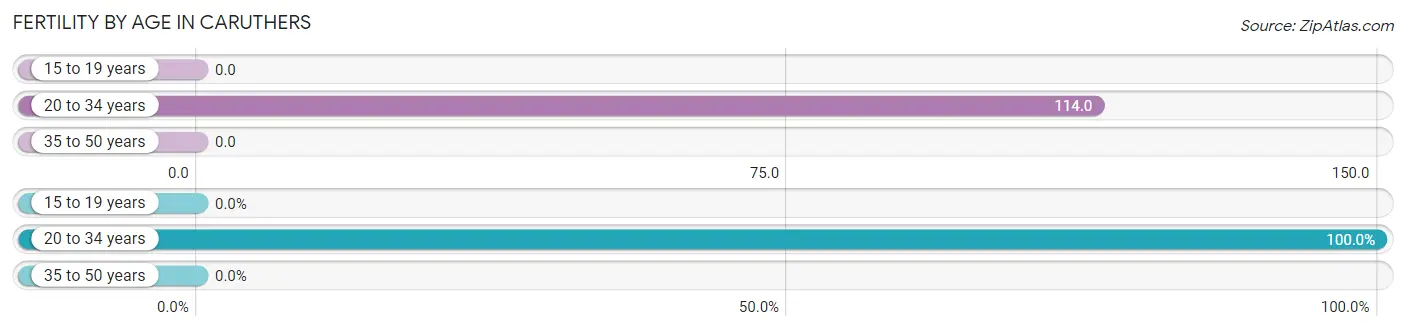
| Age Bracket | Women with Births | Births / 1,000 Women |
| 15 to 19 years | 0 (0.0%) | 0.0 |
| 20 to 34 years | 28 (100.0%) | 114.0 |
| 35 to 50 years | 0 (0.0%) | 0.0 |
| Total | 28 (100.0%) | 45.0 |
Fertility by Age by Marriage Status in Caruthers
39.3% of women with births (28) in Caruthers are married. The highest percentage of unmarried women with births falls into 20 to 34 years age bracket with 60.7% of them unmarried at the time of birth, while the lowest percentage of unmarried women with births belong to 20 to 34 years age bracket with 60.7% of them unmarried.
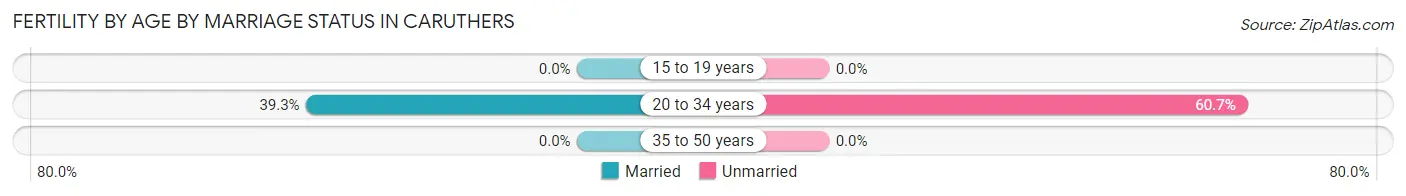
| Age Bracket | Married | Unmarried |
| 15 to 19 years | 0 (0.0%) | 0 (0.0%) |
| 20 to 34 years | 11 (39.3%) | 17 (60.7%) |
| 35 to 50 years | 0 (0.0%) | 0 (0.0%) |
| Total | 11 (39.3%) | 17 (60.7%) |
Fertility by Education in Caruthers
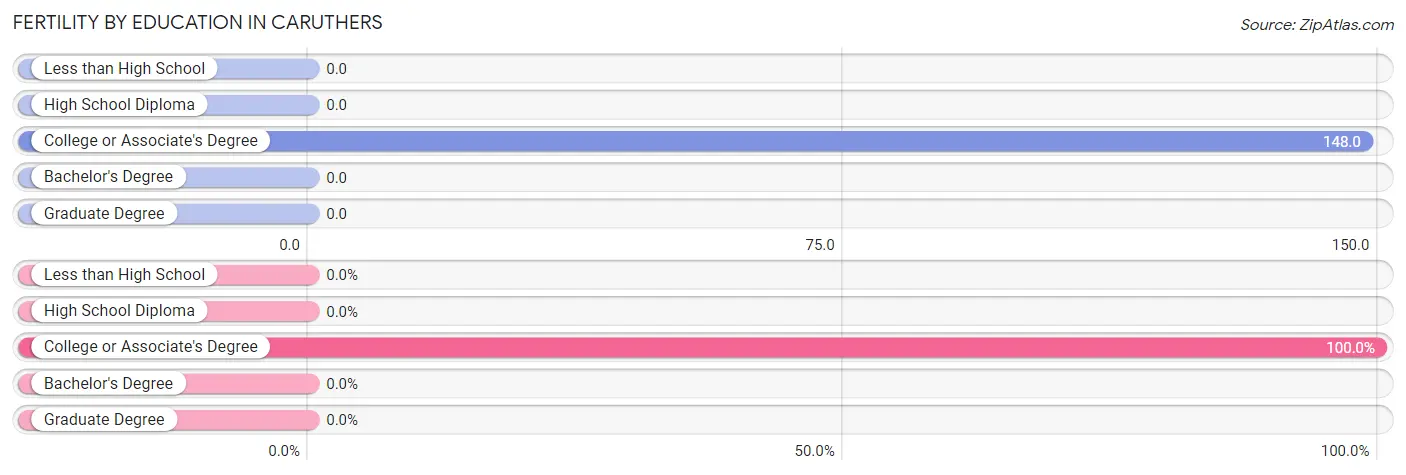
| Educational Attainment | Women with Births | Births / 1,000 Women |
| Less than High School | 0 (0.0%) | 0.0 |
| High School Diploma | 0 (0.0%) | 0.0 |
| College or Associate's Degree | 28 (100.0%) | 148.0 |
| Bachelor's Degree | 0 (0.0%) | 0.0 |
| Graduate Degree | 0 (0.0%) | 0.0 |
| Total | 28 (100.0%) | 45.0 |
Fertility by Education by Marriage Status in Caruthers
60.7% of women with births in Caruthers are unmarried. Women with the educational attainment of college or associate's degree are most likely to be married with 39.3% of them married at childbirth, while women with the educational attainment of college or associate's degree are least likely to be married with 60.7% of them unmarried at childbirth.
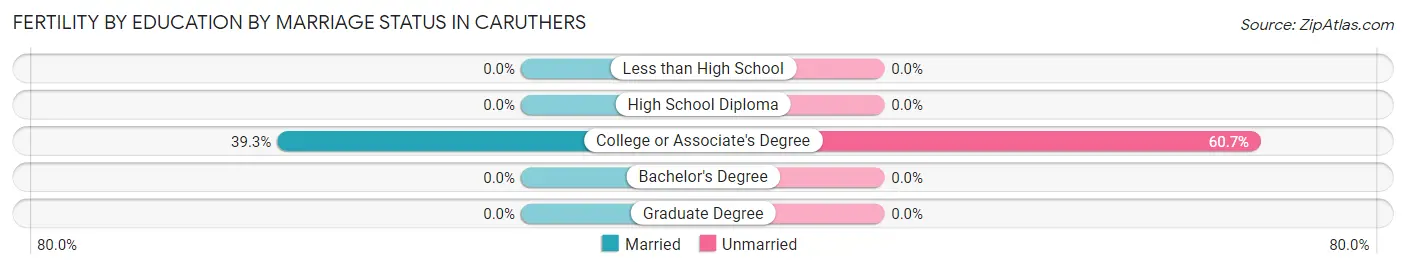
| Educational Attainment | Married | Unmarried |
| Less than High School | 0 (0.0%) | 0 (0.0%) |
| High School Diploma | 0 (0.0%) | 0 (0.0%) |
| College or Associate's Degree | 11 (39.3%) | 17 (60.7%) |
| Bachelor's Degree | 0 (0.0%) | 0 (0.0%) |
| Graduate Degree | 0 (0.0%) | 0 (0.0%) |
| Total | 11 (39.3%) | 17 (60.7%) |
Employment Characteristics in Caruthers
Employment by Class of Employer in Caruthers
Among the 696 employed individuals in Caruthers, private company employees (409 | 58.8%), self-employed (not incorporated) (104 | 14.9%), and federal government employees (58 | 8.3%) make up the most common classes of employment.
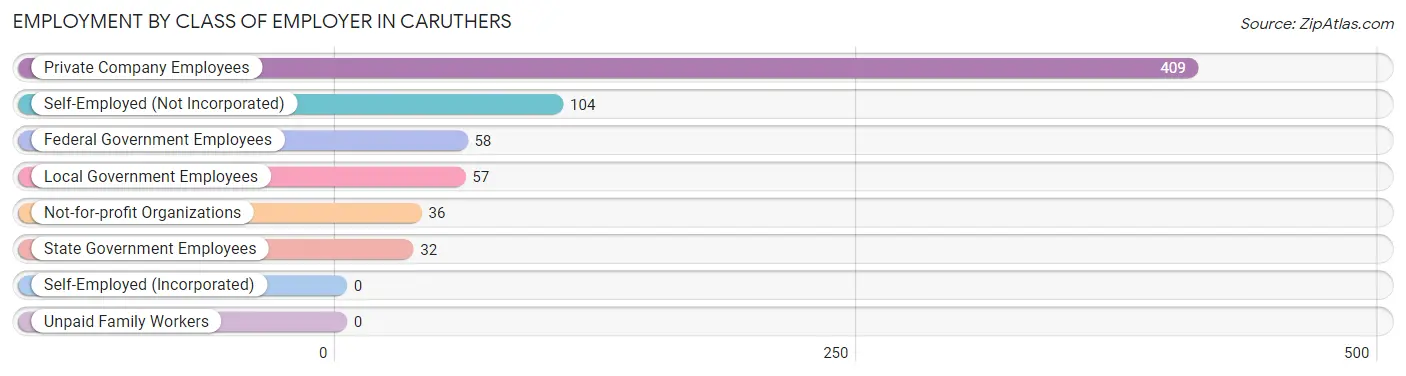
| Employer Class | # Employees | % Employees |
| Private Company Employees | 409 | 58.8% |
| Self-Employed (Incorporated) | 0 | 0.0% |
| Self-Employed (Not Incorporated) | 104 | 14.9% |
| Not-for-profit Organizations | 36 | 5.2% |
| Local Government Employees | 57 | 8.2% |
| State Government Employees | 32 | 4.6% |
| Federal Government Employees | 58 | 8.3% |
| Unpaid Family Workers | 0 | 0.0% |
| Total | 696 | 100.0% |
Employment Status by Age in Caruthers
According to the labor force statistics for Caruthers, out of the total population over 16 years of age (1,402), 57.6% or 808 individuals are in the labor force, with 12.5% or 101 of them unemployed. The age group with the highest labor force participation rate is 30 to 34 years, with 83.5% or 137 individuals in the labor force. Within the labor force, the 16 to 19 years age range has the highest percentage of unemployed individuals, with 78.9% or 30 of them being unemployed.
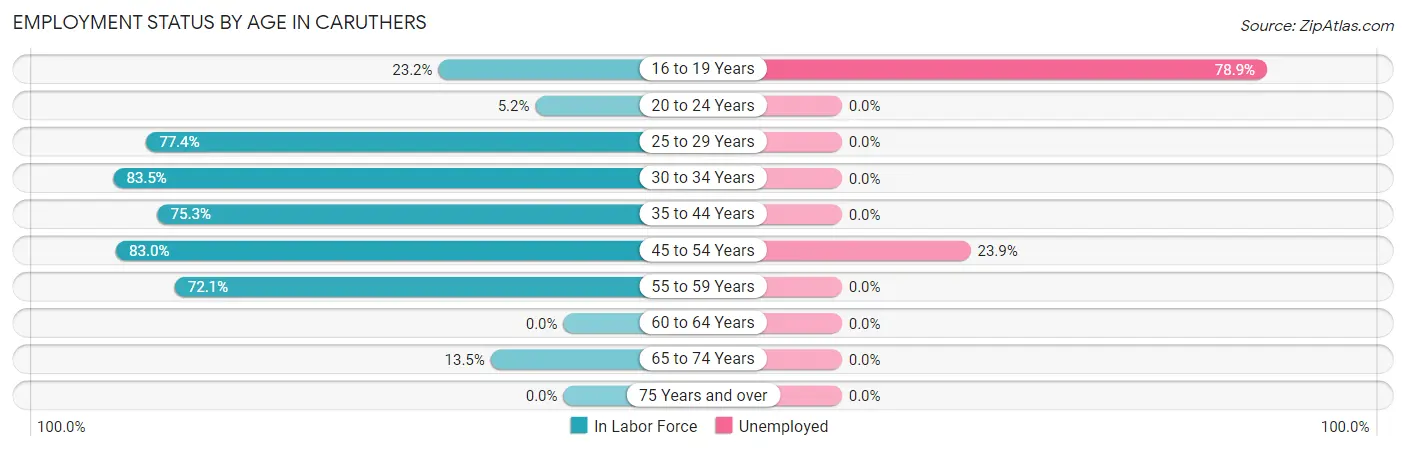
| Age Bracket | In Labor Force | Unemployed |
| 16 to 19 Years | 38 (23.2%) | 30 (78.9%) |
| 20 to 24 Years | 9 (5.2%) | 0 (0.0%) |
| 25 to 29 Years | 48 (77.4%) | 0 (0.0%) |
| 30 to 34 Years | 137 (83.5%) | 0 (0.0%) |
| 35 to 44 Years | 171 (75.3%) | 0 (0.0%) |
| 45 to 54 Years | 297 (83.0%) | 71 (23.9%) |
| 55 to 59 Years | 93 (72.1%) | 0 (0.0%) |
| 60 to 64 Years | 0 (0.0%) | 0 (0.0%) |
| 65 to 74 Years | 15 (13.5%) | 0 (0.0%) |
| 75 Years and over | 0 (0.0%) | 0 (0.0%) |
| Total | 808 (57.6%) | 101 (12.5%) |
Employment Status by Educational Attainment in Caruthers
According to labor force statistics for Caruthers, 79.4% of individuals (746) out of the total population between 25 and 64 years of age (940) are in the labor force, with 9.5% or 71 of them being unemployed. The group with the highest labor force participation rate are those with the educational attainment of college / associate degree, with 86.0% or 221 individuals in the labor force. Within the labor force, individuals with less than high school education have the highest percentage of unemployment, with 25.3% or 71 of them being unemployed.
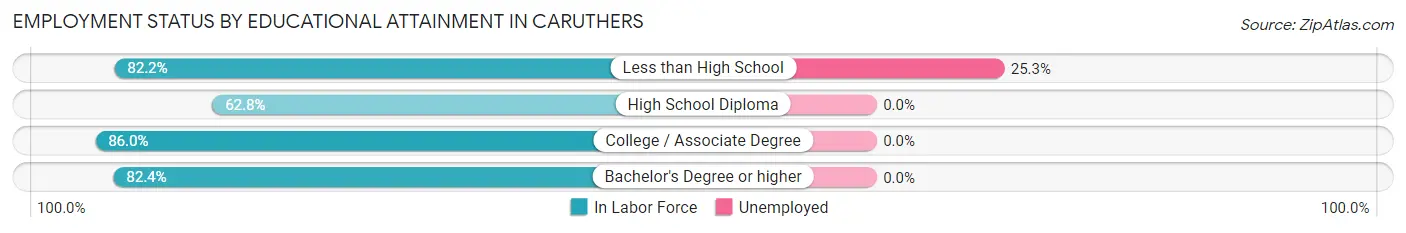
| Educational Attainment | In Labor Force | Unemployed |
| Less than High School | 281 (82.2%) | 87 (25.3%) |
| High School Diploma | 118 (62.8%) | 0 (0.0%) |
| College / Associate Degree | 221 (86.0%) | 0 (0.0%) |
| Bachelor's Degree or higher | 126 (82.4%) | 0 (0.0%) |
| Total | 746 (79.4%) | 89 (9.5%) |
Employment Occupations by Sex in Caruthers
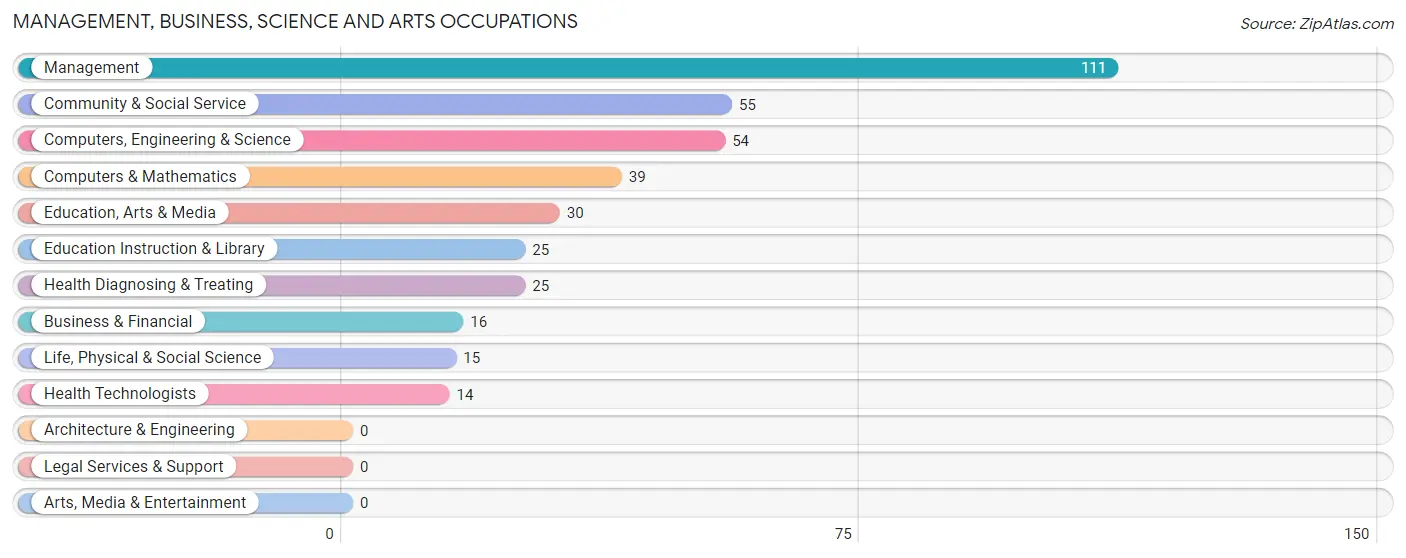
Management, Business, Science and Arts Occupations
The most common Management, Business, Science and Arts occupations in Caruthers are Management (111 | 15.7%), Community & Social Service (55 | 7.8%), Computers, Engineering & Science (54 | 7.6%), Computers & Mathematics (39 | 5.5%), and Education, Arts & Media (30 | 4.2%).
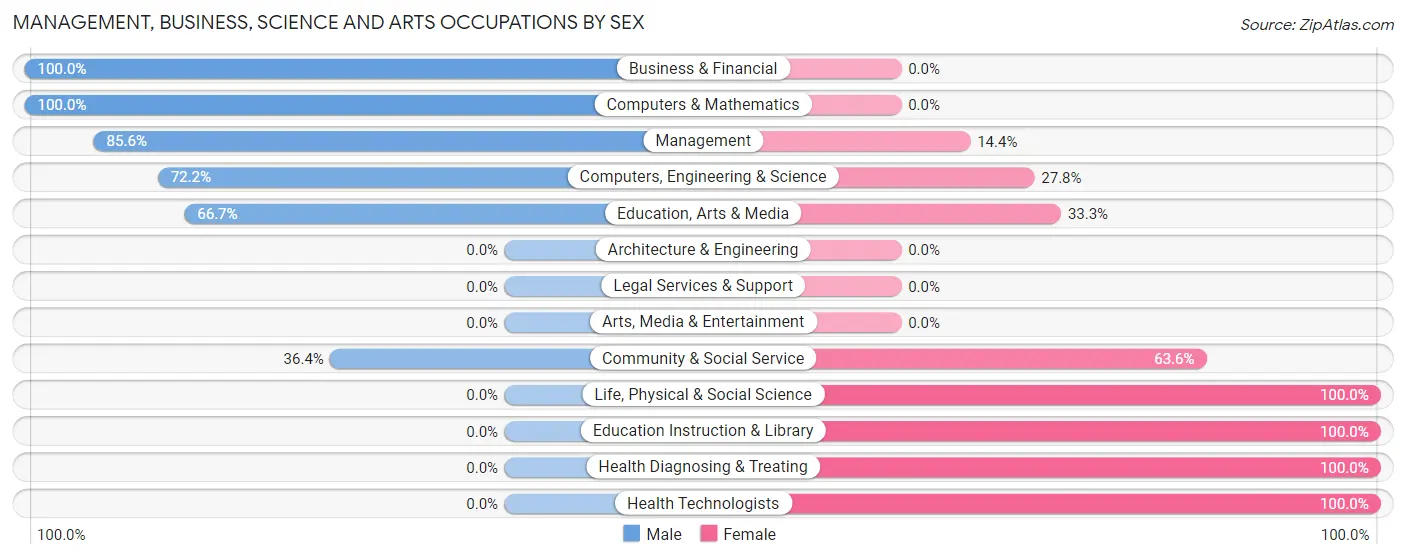
Management, Business, Science and Arts Occupations by Sex
Within the Management, Business, Science and Arts occupations in Caruthers, the most male-oriented occupations are Business & Financial (100.0%), Computers & Mathematics (100.0%), and Management (85.6%), while the most female-oriented occupations are Life, Physical & Social Science (100.0%), Education Instruction & Library (100.0%), and Health Diagnosing & Treating (100.0%).
| Occupation | Male | Female |
| Management | 95 (85.6%) | 16 (14.4%) |
| Business & Financial | 16 (100.0%) | 0 (0.0%) |
| Computers, Engineering & Science | 39 (72.2%) | 15 (27.8%) |
| Computers & Mathematics | 39 (100.0%) | 0 (0.0%) |
| Architecture & Engineering | 0 (0.0%) | 0 (0.0%) |
| Life, Physical & Social Science | 0 (0.0%) | 15 (100.0%) |
| Community & Social Service | 20 (36.4%) | 35 (63.6%) |
| Education, Arts & Media | 20 (66.7%) | 10 (33.3%) |
| Legal Services & Support | 0 (0.0%) | 0 (0.0%) |
| Education Instruction & Library | 0 (0.0%) | 25 (100.0%) |
| Arts, Media & Entertainment | 0 (0.0%) | 0 (0.0%) |
| Health Diagnosing & Treating | 0 (0.0%) | 25 (100.0%) |
| Health Technologists | 0 (0.0%) | 14 (100.0%) |
| Total (Category) | 170 (65.1%) | 91 (34.9%) |
| Total (Overall) | 403 (57.0%) | 304 (43.0%) |
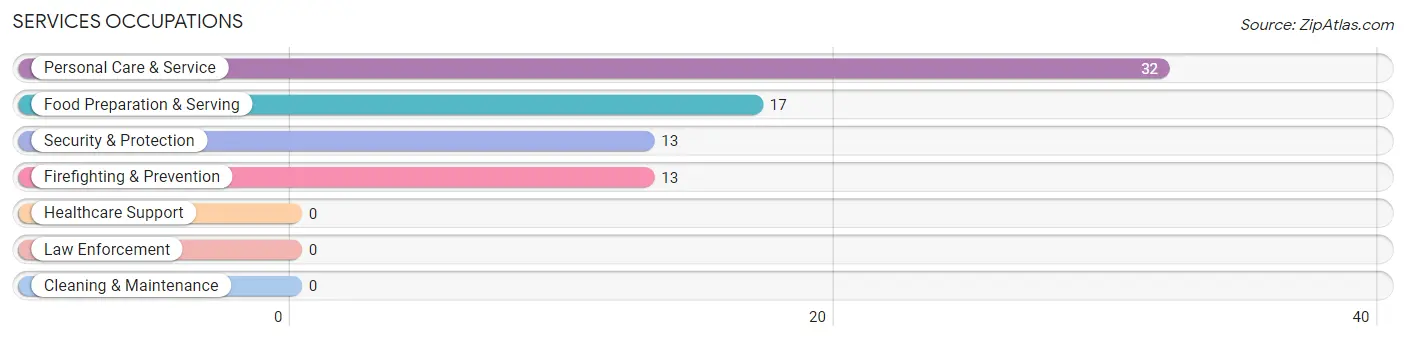
Services Occupations
The most common Services occupations in Caruthers are Personal Care & Service (32 | 4.5%), Food Preparation & Serving (17 | 2.4%), Security & Protection (13 | 1.8%), and Firefighting & Prevention (13 | 1.8%).
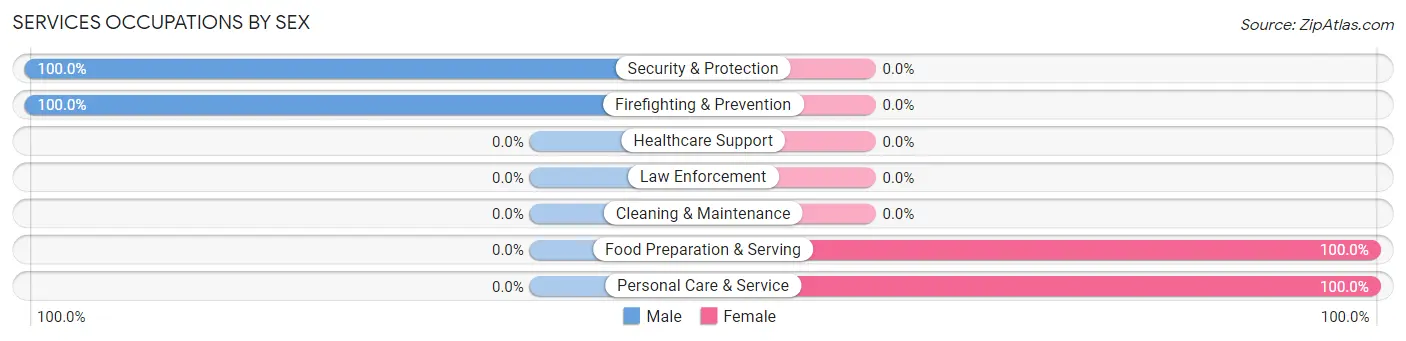
Services Occupations by Sex
Within the Services occupations in Caruthers, the most male-oriented occupations are Security & Protection (100.0%), and Firefighting & Prevention (100.0%), while the most female-oriented occupations are Food Preparation & Serving (100.0%), and Personal Care & Service (100.0%).
| Occupation | Male | Female |
| Healthcare Support | 0 (0.0%) | 0 (0.0%) |
| Security & Protection | 13 (100.0%) | 0 (0.0%) |
| Firefighting & Prevention | 13 (100.0%) | 0 (0.0%) |
| Law Enforcement | 0 (0.0%) | 0 (0.0%) |
| Food Preparation & Serving | 0 (0.0%) | 17 (100.0%) |
| Cleaning & Maintenance | 0 (0.0%) | 0 (0.0%) |
| Personal Care & Service | 0 (0.0%) | 32 (100.0%) |
| Total (Category) | 13 (21.0%) | 49 (79.0%) |
| Total (Overall) | 403 (57.0%) | 304 (43.0%) |
Sales and Office Occupations
The most common Sales and Office occupations in Caruthers are Office & Administration (102 | 14.4%), and Sales & Related (11 | 1.6%).
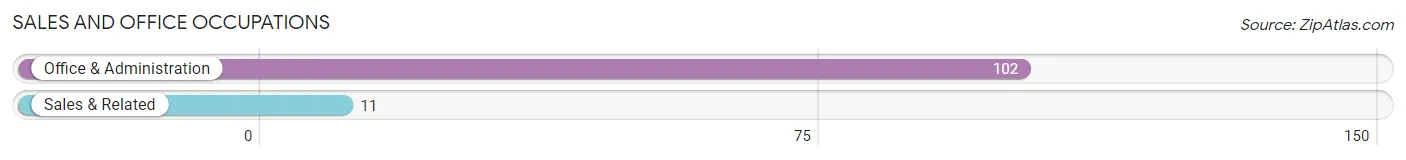
Sales and Office Occupations by Sex
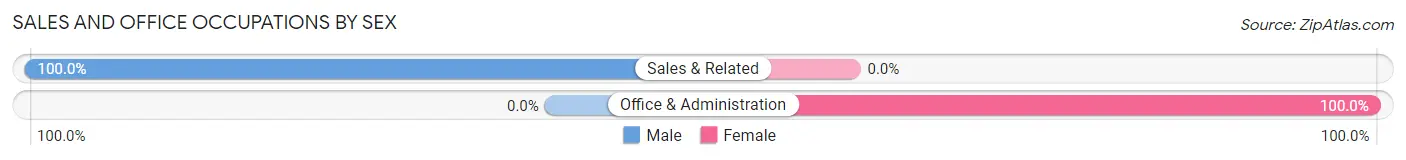
| Occupation | Male | Female |
| Sales & Related | 11 (100.0%) | 0 (0.0%) |
| Office & Administration | 0 (0.0%) | 102 (100.0%) |
| Total (Category) | 11 (9.7%) | 102 (90.3%) |
| Total (Overall) | 403 (57.0%) | 304 (43.0%) |
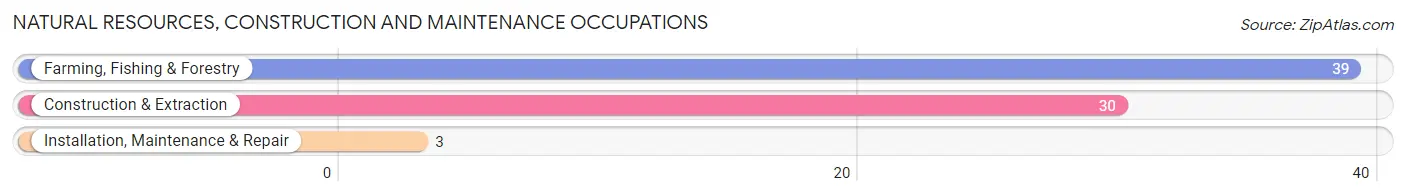
Natural Resources, Construction and Maintenance Occupations
The most common Natural Resources, Construction and Maintenance occupations in Caruthers are Farming, Fishing & Forestry (39 | 5.5%), Construction & Extraction (30 | 4.2%), and Installation, Maintenance & Repair (3 | 0.4%).
Natural Resources, Construction and Maintenance Occupations by Sex
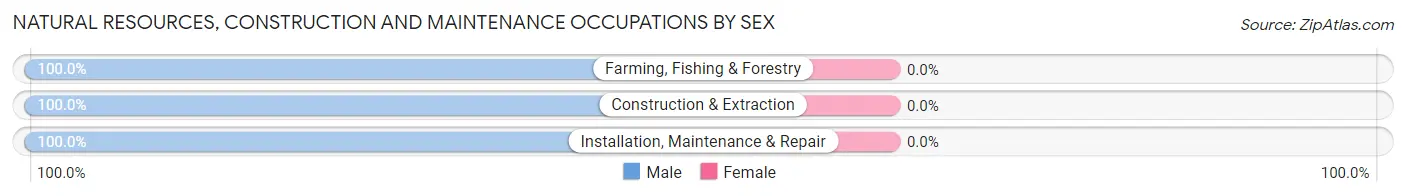
| Occupation | Male | Female |
| Farming, Fishing & Forestry | 39 (100.0%) | 0 (0.0%) |
| Construction & Extraction | 30 (100.0%) | 0 (0.0%) |
| Installation, Maintenance & Repair | 3 (100.0%) | 0 (0.0%) |
| Total (Category) | 72 (100.0%) | 0 (0.0%) |
| Total (Overall) | 403 (57.0%) | 304 (43.0%) |
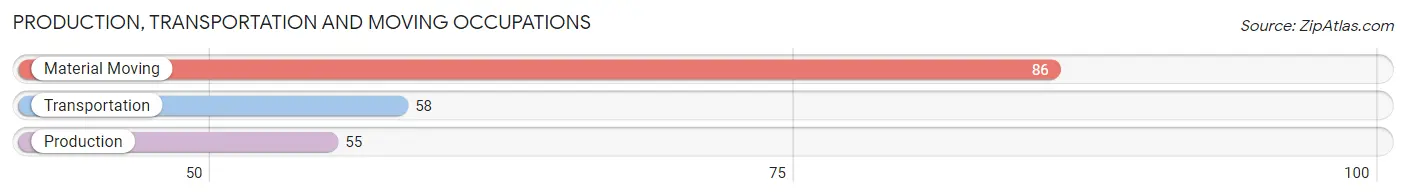
Production, Transportation and Moving Occupations
The most common Production, Transportation and Moving occupations in Caruthers are Material Moving (86 | 12.2%), Transportation (58 | 8.2%), and Production (55 | 7.8%).
Production, Transportation and Moving Occupations by Sex
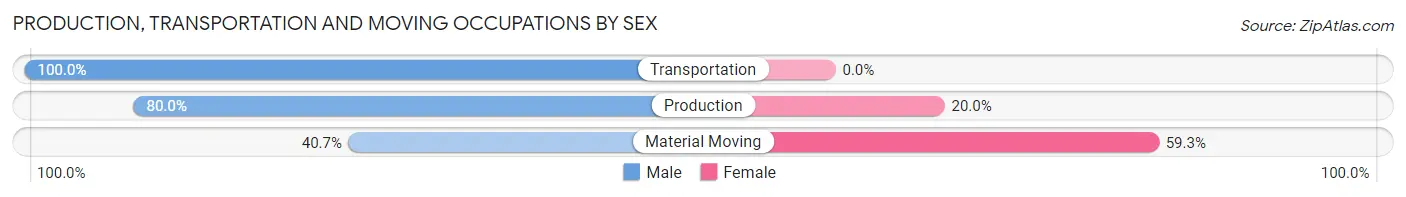
| Occupation | Male | Female |
| Production | 44 (80.0%) | 11 (20.0%) |
| Transportation | 58 (100.0%) | 0 (0.0%) |
| Material Moving | 35 (40.7%) | 51 (59.3%) |
| Total (Category) | 137 (68.8%) | 62 (31.2%) |
| Total (Overall) | 403 (57.0%) | 304 (43.0%) |
Employment Industries by Sex in Caruthers
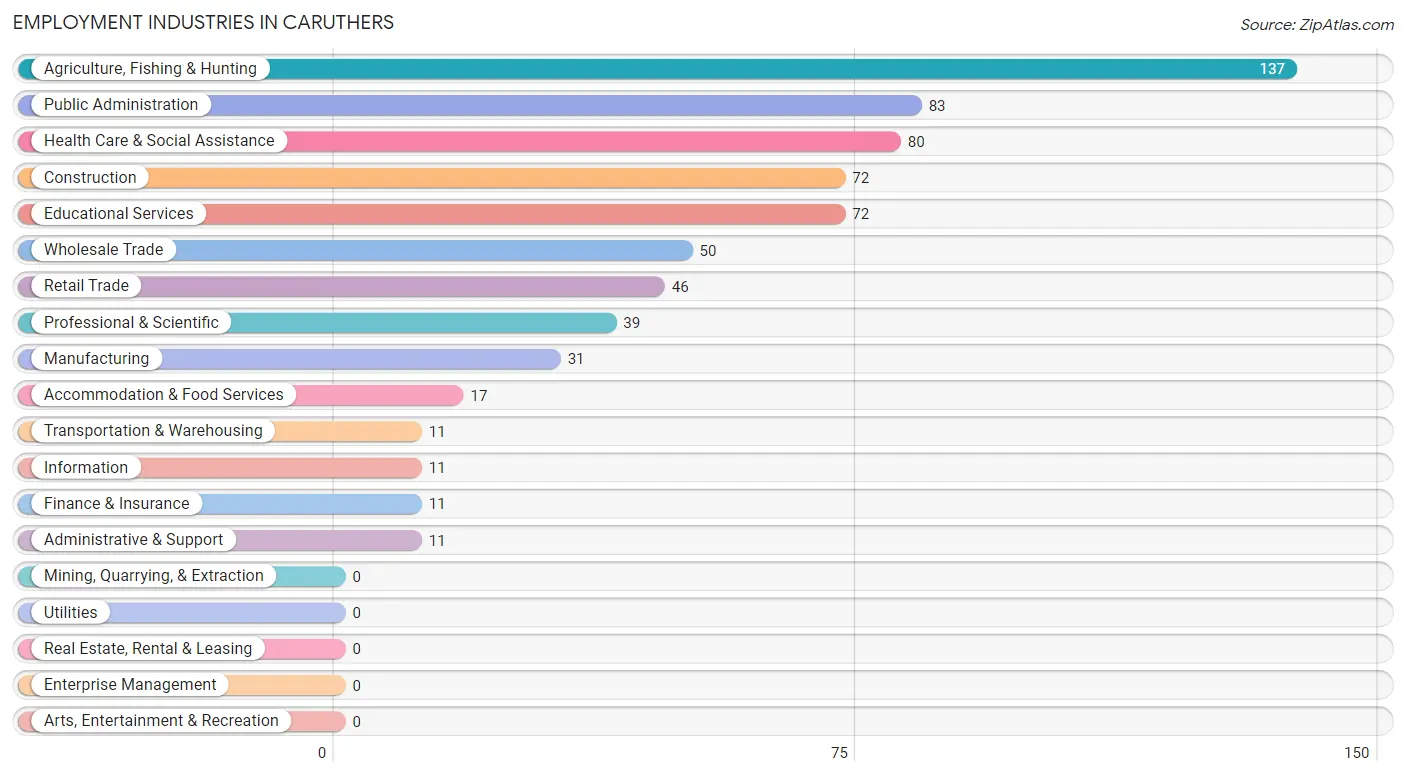
Employment Industries in Caruthers
The major employment industries in Caruthers include Agriculture, Fishing & Hunting (137 | 19.4%), Public Administration (83 | 11.7%), Health Care & Social Assistance (80 | 11.3%), Construction (72 | 10.2%), and Educational Services (72 | 10.2%).
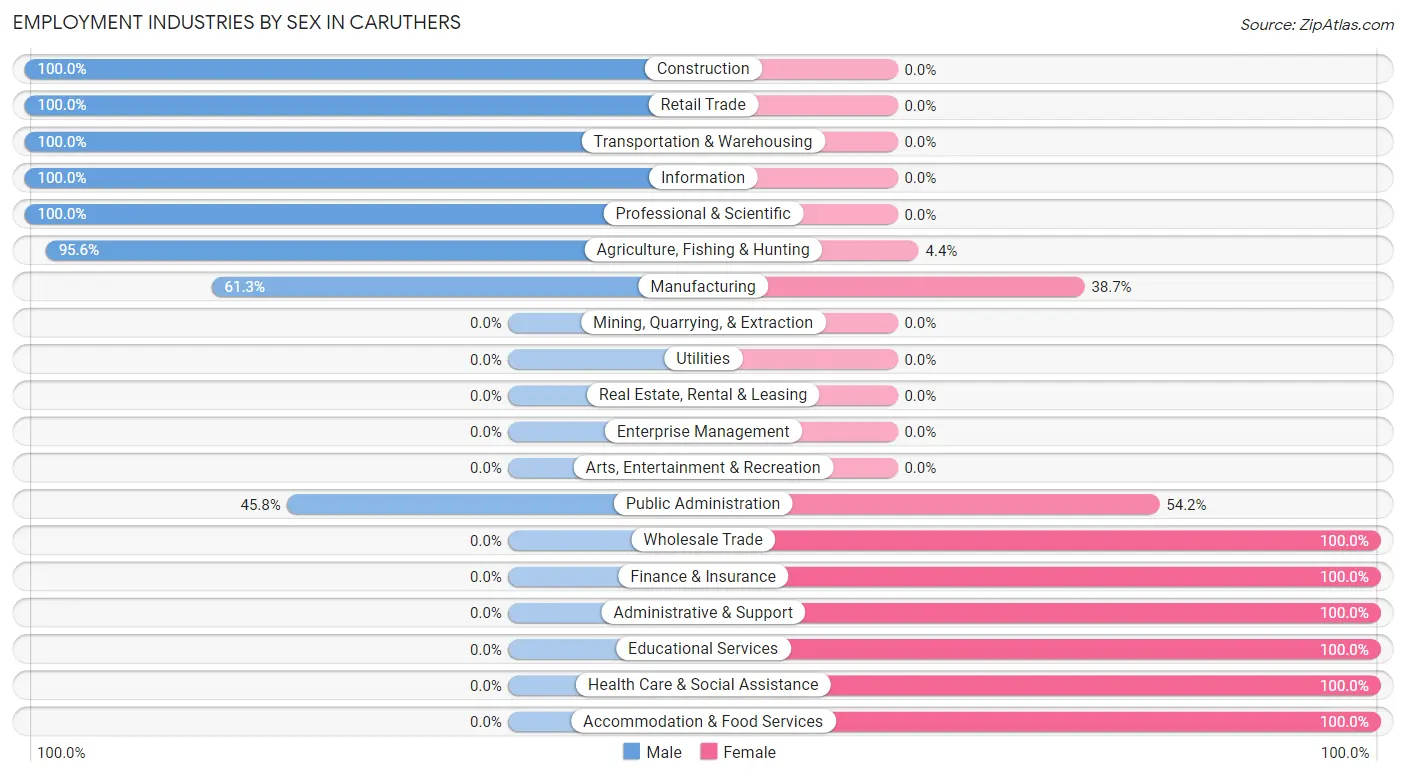
Employment Industries by Sex in Caruthers
The Caruthers industries that see more men than women are Construction (100.0%), Retail Trade (100.0%), and Transportation & Warehousing (100.0%), whereas the industries that tend to have a higher number of women are Wholesale Trade (100.0%), Finance & Insurance (100.0%), and Administrative & Support (100.0%).
| Industry | Male | Female |
| Agriculture, Fishing & Hunting | 131 (95.6%) | 6 (4.4%) |
| Mining, Quarrying, & Extraction | 0 (0.0%) | 0 (0.0%) |
| Construction | 72 (100.0%) | 0 (0.0%) |
| Manufacturing | 19 (61.3%) | 12 (38.7%) |
| Wholesale Trade | 0 (0.0%) | 50 (100.0%) |
| Retail Trade | 46 (100.0%) | 0 (0.0%) |
| Transportation & Warehousing | 11 (100.0%) | 0 (0.0%) |
| Utilities | 0 (0.0%) | 0 (0.0%) |
| Information | 11 (100.0%) | 0 (0.0%) |
| Finance & Insurance | 0 (0.0%) | 11 (100.0%) |
| Real Estate, Rental & Leasing | 0 (0.0%) | 0 (0.0%) |
| Professional & Scientific | 39 (100.0%) | 0 (0.0%) |
| Enterprise Management | 0 (0.0%) | 0 (0.0%) |
| Administrative & Support | 0 (0.0%) | 11 (100.0%) |
| Educational Services | 0 (0.0%) | 72 (100.0%) |
| Health Care & Social Assistance | 0 (0.0%) | 80 (100.0%) |
| Arts, Entertainment & Recreation | 0 (0.0%) | 0 (0.0%) |
| Accommodation & Food Services | 0 (0.0%) | 17 (100.0%) |
| Public Administration | 38 (45.8%) | 45 (54.2%) |
| Total | 403 (57.0%) | 304 (43.0%) |
Education in Caruthers
School Enrollment in Caruthers
The most common levels of schooling among the 751 students in Caruthers are high school (272 | 36.2%), middle school (154 | 20.5%), and college / undergraduate (131 | 17.4%).
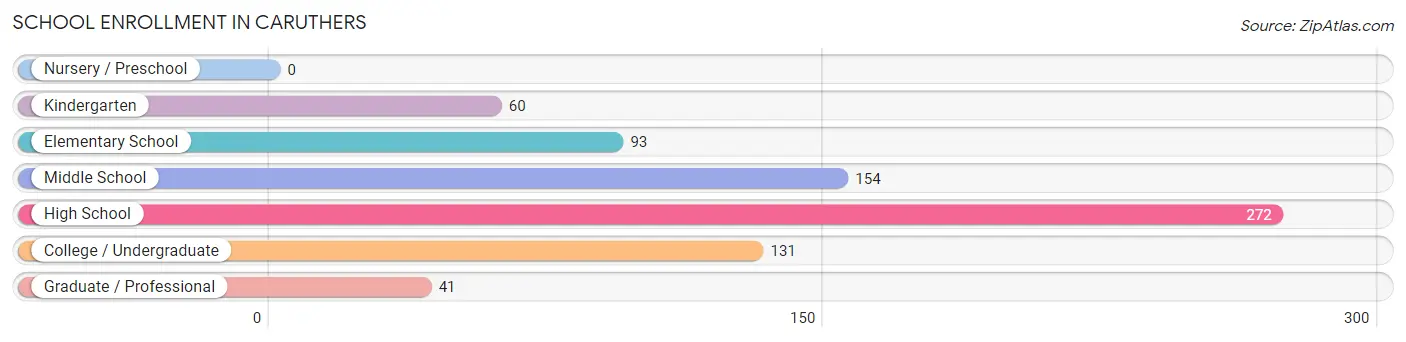
| School Level | # Students | % Students |
| Nursery / Preschool | 0 | 0.0% |
| Kindergarten | 60 | 8.0% |
| Elementary School | 93 | 12.4% |
| Middle School | 154 | 20.5% |
| High School | 272 | 36.2% |
| College / Undergraduate | 131 | 17.4% |
| Graduate / Professional | 41 | 5.5% |
| Total | 751 | 100.0% |
School Enrollment by Age by Funding Source in Caruthers
Out of a total of 751 students who are enrolled in schools in Caruthers, 10 (1.3%) attend a private institution, while the remaining 741 (98.7%) are enrolled in public schools. The age group of 20 to 24 year olds has the highest likelihood of being enrolled in private schools, with 10 (7.5% in the age bracket) enrolled. Conversely, the age group of 5 to 9 year old has the lowest likelihood of being enrolled in a private school, with 139 (100.0% in the age bracket) attending a public institution.
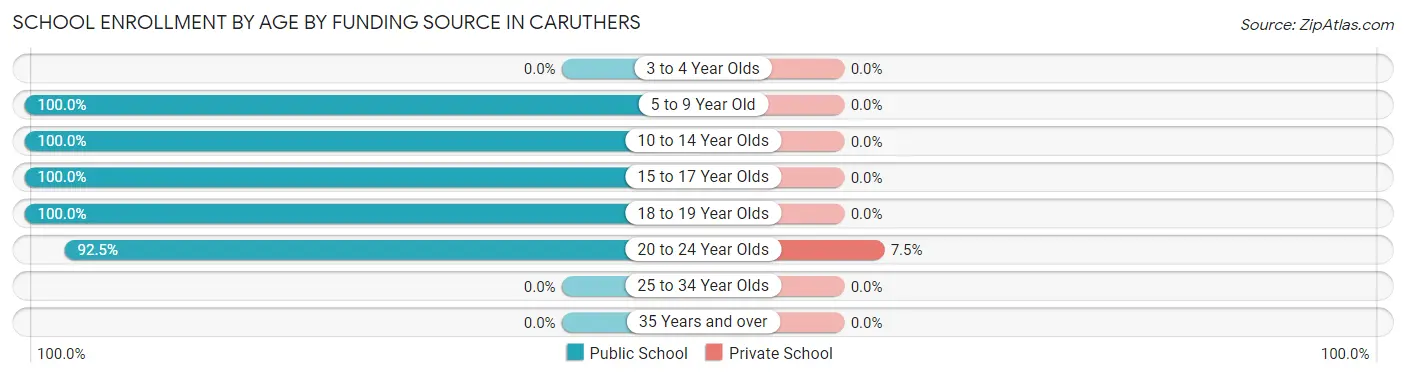
| Age Bracket | Public School | Private School |
| 3 to 4 Year Olds | 0 (0.0%) | 0 (0.0%) |
| 5 to 9 Year Old | 139 (100.0%) | 0 (0.0%) |
| 10 to 14 Year Olds | 157 (100.0%) | 0 (0.0%) |
| 15 to 17 Year Olds | 217 (100.0%) | 0 (0.0%) |
| 18 to 19 Year Olds | 104 (100.0%) | 0 (0.0%) |
| 20 to 24 Year Olds | 124 (92.5%) | 10 (7.5%) |
| 25 to 34 Year Olds | 0 (0.0%) | 0 (0.0%) |
| 35 Years and over | 0 (0.0%) | 0 (0.0%) |
| Total | 741 (98.7%) | 10 (1.3%) |
Educational Attainment by Field of Study in Caruthers
Arts & humanities (58 | 31.5%), psychology (42 | 22.8%), business (36 | 19.6%), bio, nature & agricultural (22 | 12.0%), and social sciences (16 | 8.7%) are the most common fields of study among 184 individuals in Caruthers who have obtained a bachelor's degree or higher.
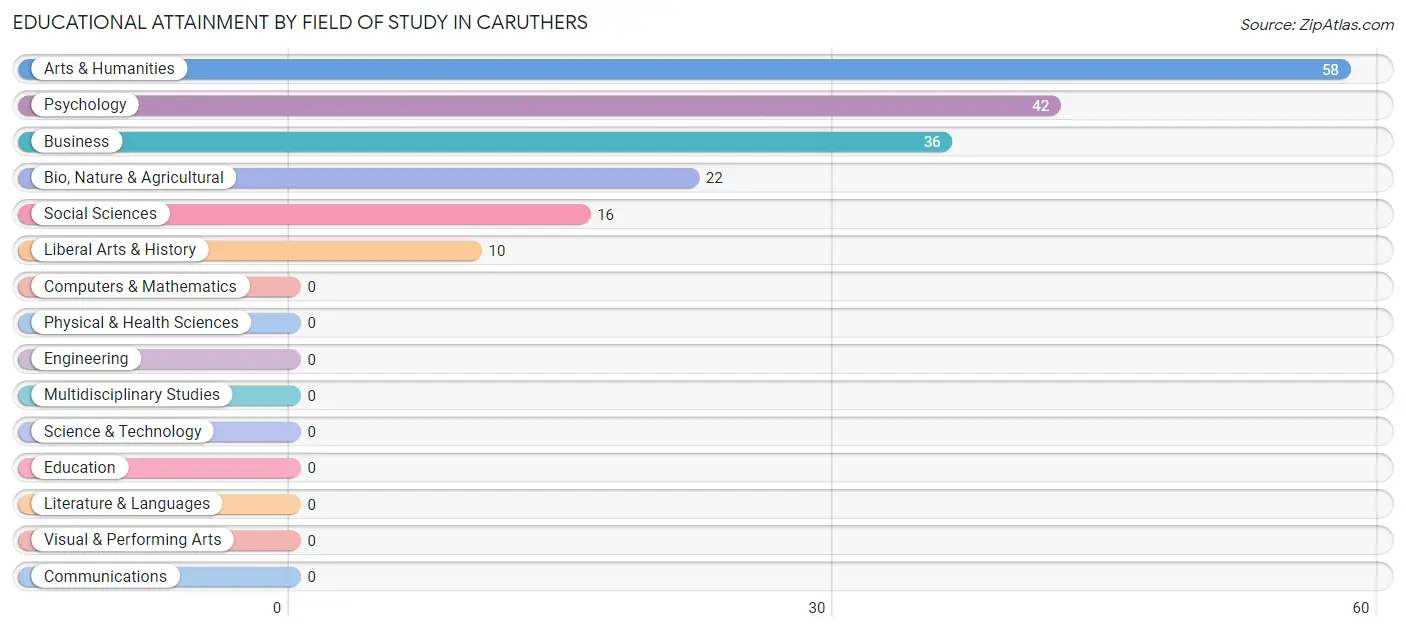
| Field of Study | # Graduates | % Graduates |
| Computers & Mathematics | 0 | 0.0% |
| Bio, Nature & Agricultural | 22 | 12.0% |
| Physical & Health Sciences | 0 | 0.0% |
| Psychology | 42 | 22.8% |
| Social Sciences | 16 | 8.7% |
| Engineering | 0 | 0.0% |
| Multidisciplinary Studies | 0 | 0.0% |
| Science & Technology | 0 | 0.0% |
| Business | 36 | 19.6% |
| Education | 0 | 0.0% |
| Literature & Languages | 0 | 0.0% |
| Liberal Arts & History | 10 | 5.4% |
| Visual & Performing Arts | 0 | 0.0% |
| Communications | 0 | 0.0% |
| Arts & Humanities | 58 | 31.5% |
| Total | 184 | 100.0% |
Transportation & Commute in Caruthers
Vehicle Availability by Sex in Caruthers
The most prevalent vehicle ownership categories in Caruthers are males with 2 vehicles (202, accounting for 50.1%) and females with 2 vehicles (164, making up 68.9%).
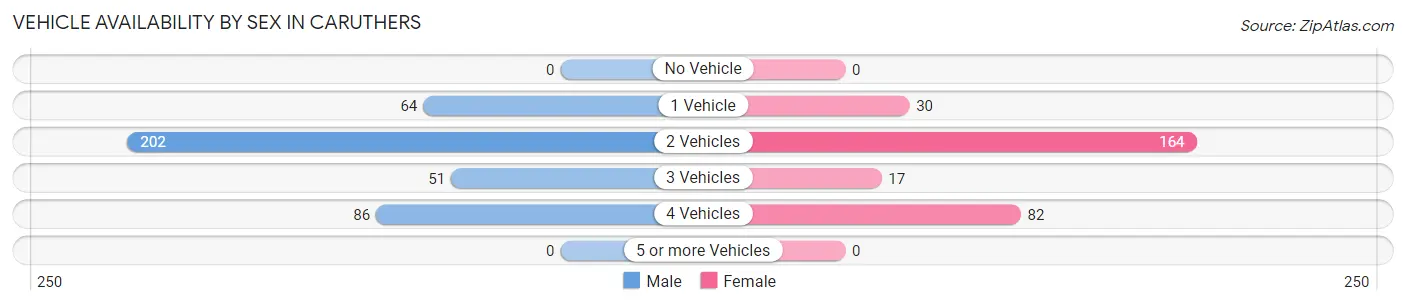
| Vehicles Available | Male | Female |
| No Vehicle | 0 (0.0%) | 0 (0.0%) |
| 1 Vehicle | 64 (15.9%) | 30 (10.2%) |
| 2 Vehicles | 202 (50.1%) | 164 (56.0%) |
| 3 Vehicles | 51 (12.7%) | 17 (5.8%) |
| 4 Vehicles | 86 (21.3%) | 82 (28.0%) |
| 5 or more Vehicles | 0 (0.0%) | 0 (0.0%) |
| Total | 403 (100.0%) | 293 (100.0%) |
Commute Time in Caruthers
The most frequently occuring commute durations in Caruthers are 20 to 24 minutes (197 commuters, 31.3%), 30 to 34 minutes (137 commuters, 21.7%), and 35 to 39 minutes (72 commuters, 11.4%).
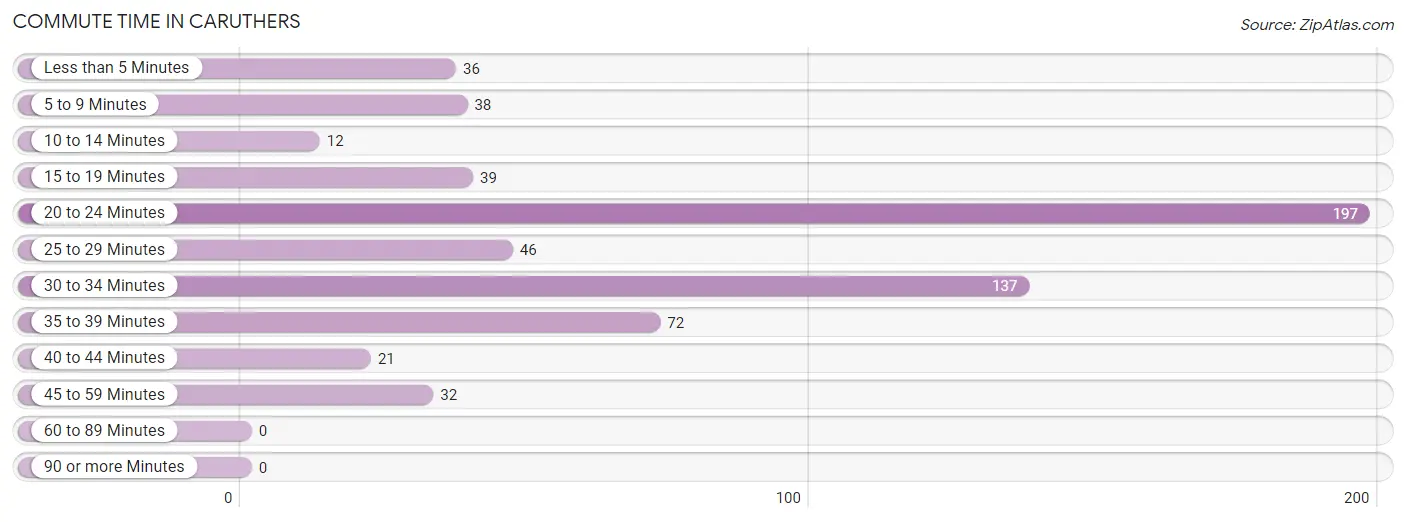
| Commute Time | # Commuters | % Commuters |
| Less than 5 Minutes | 36 | 5.7% |
| 5 to 9 Minutes | 38 | 6.0% |
| 10 to 14 Minutes | 12 | 1.9% |
| 15 to 19 Minutes | 39 | 6.2% |
| 20 to 24 Minutes | 197 | 31.3% |
| 25 to 29 Minutes | 46 | 7.3% |
| 30 to 34 Minutes | 137 | 21.7% |
| 35 to 39 Minutes | 72 | 11.4% |
| 40 to 44 Minutes | 21 | 3.3% |
| 45 to 59 Minutes | 32 | 5.1% |
| 60 to 89 Minutes | 0 | 0.0% |
| 90 or more Minutes | 0 | 0.0% |
Commute Time by Sex in Caruthers
The most common commute times in Caruthers are 20 to 24 minutes (143 commuters, 36.8%) for males and 30 to 34 minutes (85 commuters, 35.3%) for females.
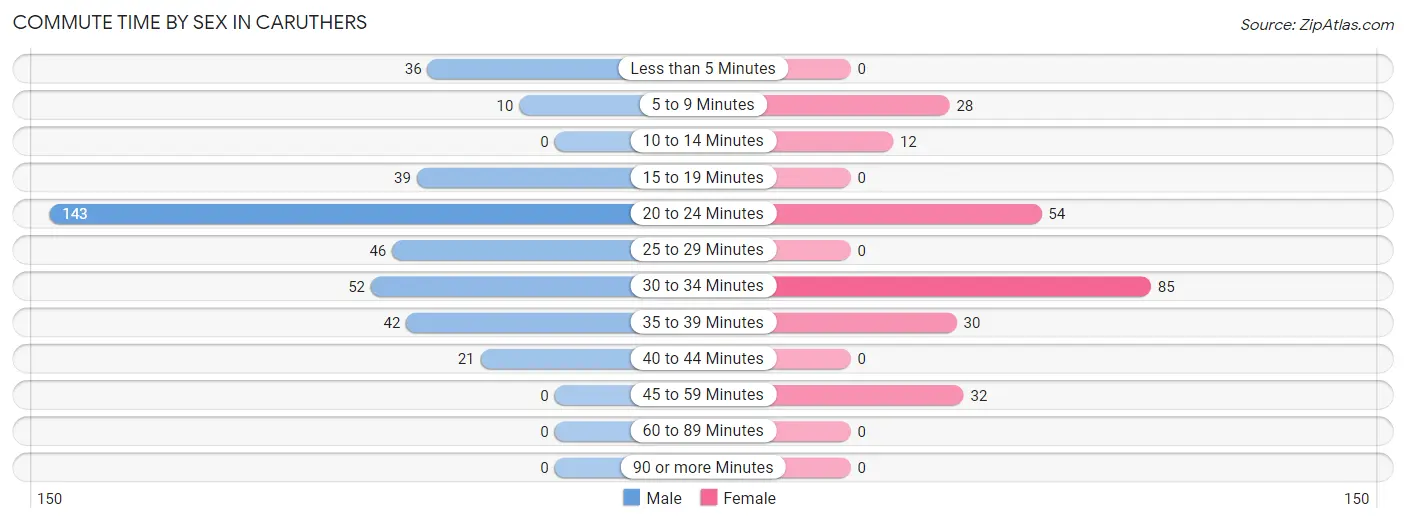
| Commute Time | Male | Female |
| Less than 5 Minutes | 36 (9.2%) | 0 (0.0%) |
| 5 to 9 Minutes | 10 (2.6%) | 28 (11.6%) |
| 10 to 14 Minutes | 0 (0.0%) | 12 (5.0%) |
| 15 to 19 Minutes | 39 (10.0%) | 0 (0.0%) |
| 20 to 24 Minutes | 143 (36.8%) | 54 (22.4%) |
| 25 to 29 Minutes | 46 (11.8%) | 0 (0.0%) |
| 30 to 34 Minutes | 52 (13.4%) | 85 (35.3%) |
| 35 to 39 Minutes | 42 (10.8%) | 30 (12.4%) |
| 40 to 44 Minutes | 21 (5.4%) | 0 (0.0%) |
| 45 to 59 Minutes | 0 (0.0%) | 32 (13.3%) |
| 60 to 89 Minutes | 0 (0.0%) | 0 (0.0%) |
| 90 or more Minutes | 0 (0.0%) | 0 (0.0%) |
Time of Departure to Work by Sex in Caruthers
The most frequent times of departure to work in Caruthers are 5:00 AM to 5:29 AM (212, 54.5%) for males and 7:00 AM to 7:29 AM (107, 44.4%) for females.
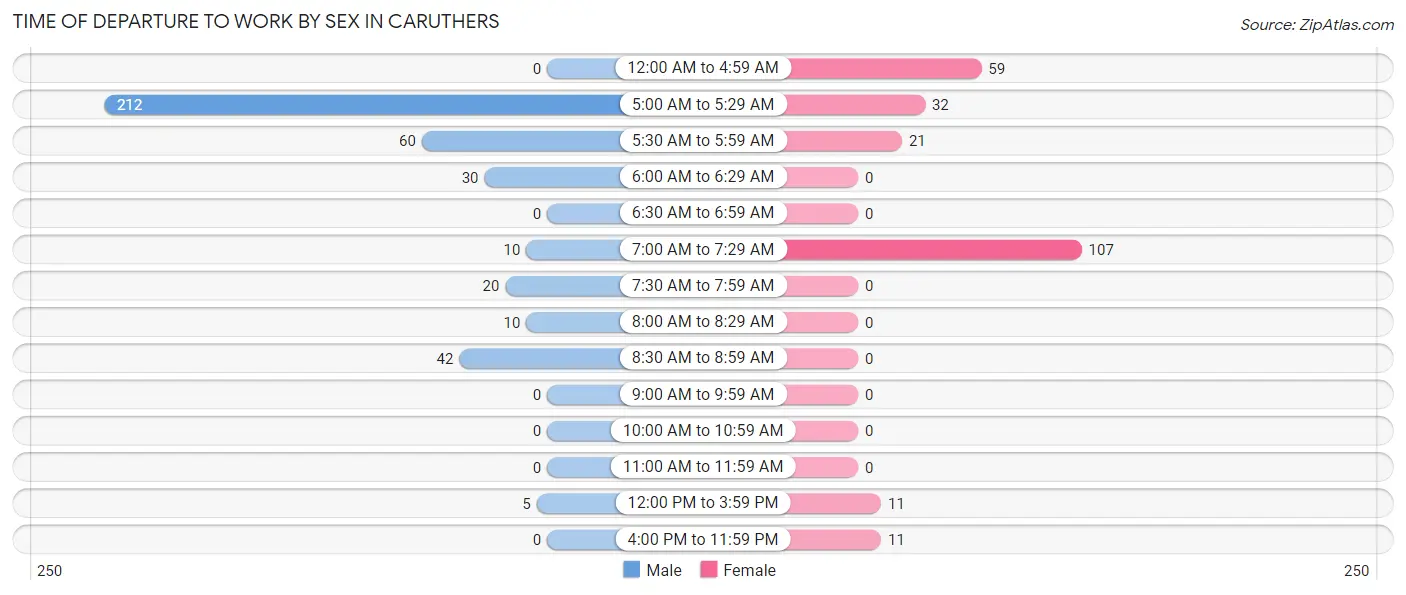
| Time of Departure | Male | Female |
| 12:00 AM to 4:59 AM | 0 (0.0%) | 59 (24.5%) |
| 5:00 AM to 5:29 AM | 212 (54.5%) | 32 (13.3%) |
| 5:30 AM to 5:59 AM | 60 (15.4%) | 21 (8.7%) |
| 6:00 AM to 6:29 AM | 30 (7.7%) | 0 (0.0%) |
| 6:30 AM to 6:59 AM | 0 (0.0%) | 0 (0.0%) |
| 7:00 AM to 7:29 AM | 10 (2.6%) | 107 (44.4%) |
| 7:30 AM to 7:59 AM | 20 (5.1%) | 0 (0.0%) |
| 8:00 AM to 8:29 AM | 10 (2.6%) | 0 (0.0%) |
| 8:30 AM to 8:59 AM | 42 (10.8%) | 0 (0.0%) |
| 9:00 AM to 9:59 AM | 0 (0.0%) | 0 (0.0%) |
| 10:00 AM to 10:59 AM | 0 (0.0%) | 0 (0.0%) |
| 11:00 AM to 11:59 AM | 0 (0.0%) | 0 (0.0%) |
| 12:00 PM to 3:59 PM | 5 (1.3%) | 11 (4.6%) |
| 4:00 PM to 11:59 PM | 0 (0.0%) | 11 (4.6%) |
| Total | 389 (100.0%) | 241 (100.0%) |
Housing Occupancy in Caruthers
Occupancy by Ownership in Caruthers
Of the total 537 dwellings in Caruthers, owner-occupied units account for 389 (72.4%), while renter-occupied units make up 148 (27.6%).
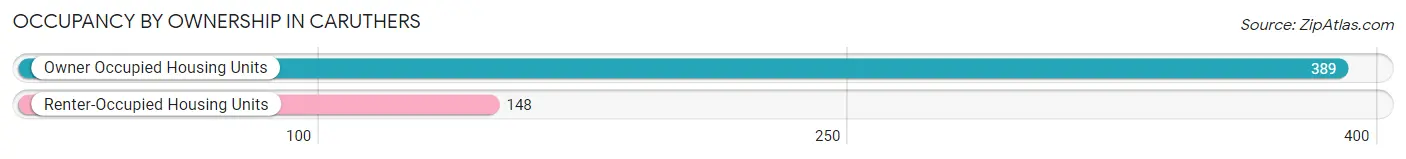
| Occupancy | # Housing Units | % Housing Units |
| Owner Occupied Housing Units | 389 | 72.4% |
| Renter-Occupied Housing Units | 148 | 27.6% |
| Total Occupied Housing Units | 537 | 100.0% |
Occupancy by Household Size in Caruthers
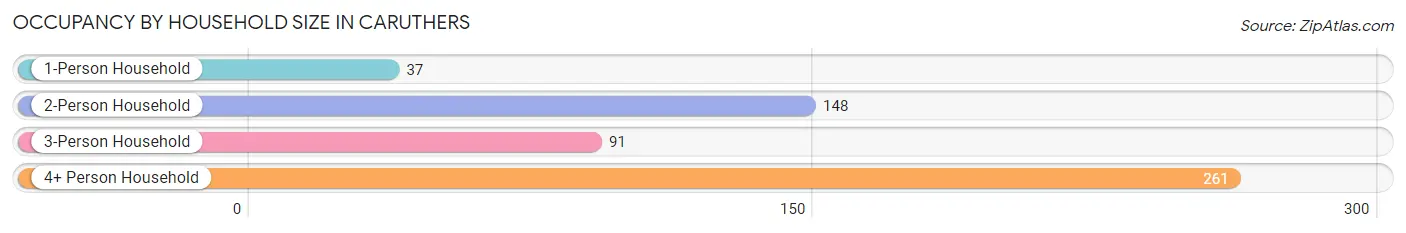
| Household Size | # Housing Units | % Housing Units |
| 1-Person Household | 37 | 6.9% |
| 2-Person Household | 148 | 27.6% |
| 3-Person Household | 91 | 17.0% |
| 4+ Person Household | 261 | 48.6% |
| Total Housing Units | 537 | 100.0% |
Occupancy by Ownership by Household Size in Caruthers
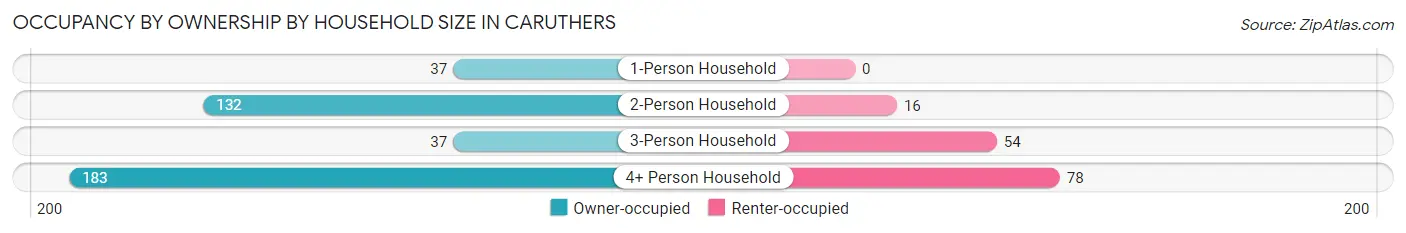
| Household Size | Owner-occupied | Renter-occupied |
| 1-Person Household | 37 (100.0%) | 0 (0.0%) |
| 2-Person Household | 132 (89.2%) | 16 (10.8%) |
| 3-Person Household | 37 (40.7%) | 54 (59.3%) |
| 4+ Person Household | 183 (70.1%) | 78 (29.9%) |
| Total Housing Units | 389 (72.4%) | 148 (27.6%) |
Occupancy by Educational Attainment in Caruthers
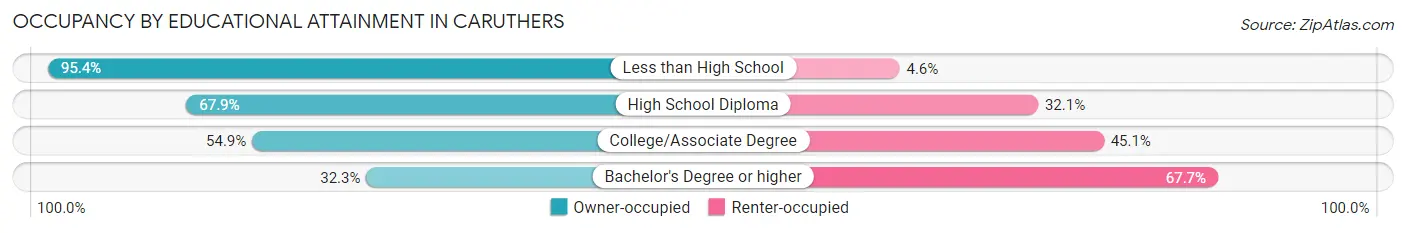
| Household Size | Owner-occupied | Renter-occupied |
| Less than High School | 206 (95.4%) | 10 (4.6%) |
| High School Diploma | 72 (67.9%) | 34 (32.1%) |
| College/Associate Degree | 101 (54.9%) | 83 (45.1%) |
| Bachelor's Degree or higher | 10 (32.3%) | 21 (67.7%) |
Occupancy by Age of Householder in Caruthers
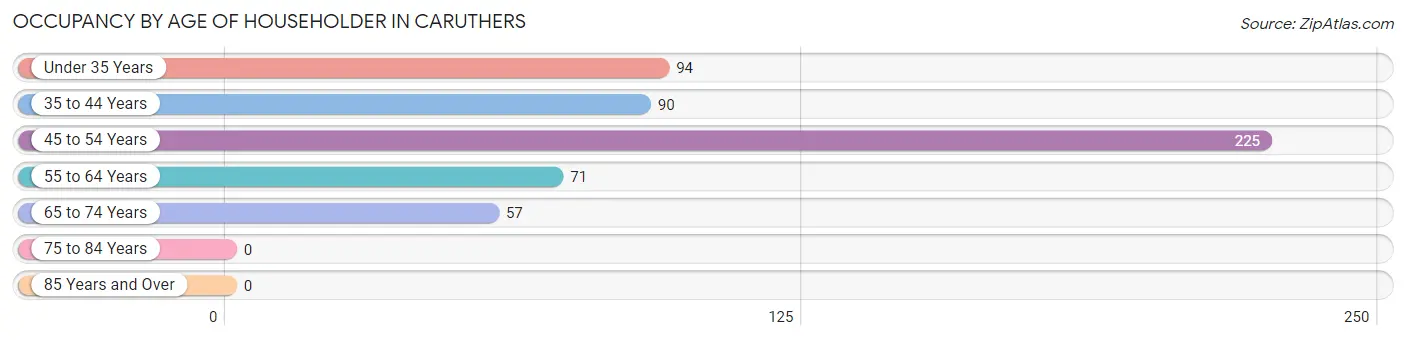
| Age Bracket | # Households | % Households |
| Under 35 Years | 94 | 17.5% |
| 35 to 44 Years | 90 | 16.8% |
| 45 to 54 Years | 225 | 41.9% |
| 55 to 64 Years | 71 | 13.2% |
| 65 to 74 Years | 57 | 10.6% |
| 75 to 84 Years | 0 | 0.0% |
| 85 Years and Over | 0 | 0.0% |
| Total | 537 | 100.0% |
Housing Finances in Caruthers
Median Income by Occupancy in Caruthers
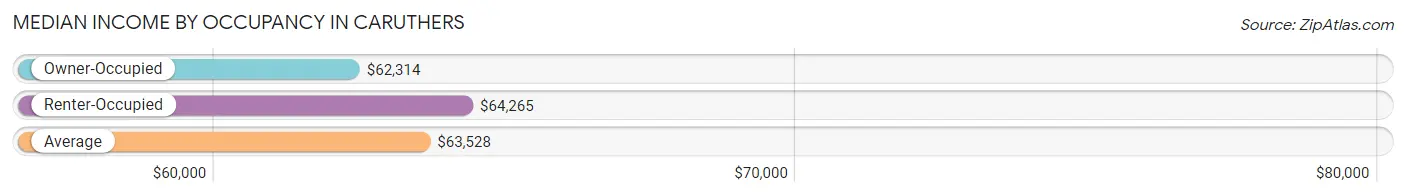
| Occupancy Type | # Households | Median Income |
| Owner-Occupied | 389 (72.4%) | $62,314 |
| Renter-Occupied | 148 (27.6%) | $64,265 |
| Average | 537 (100.0%) | $63,528 |
Occupancy by Householder Income Bracket in Caruthers
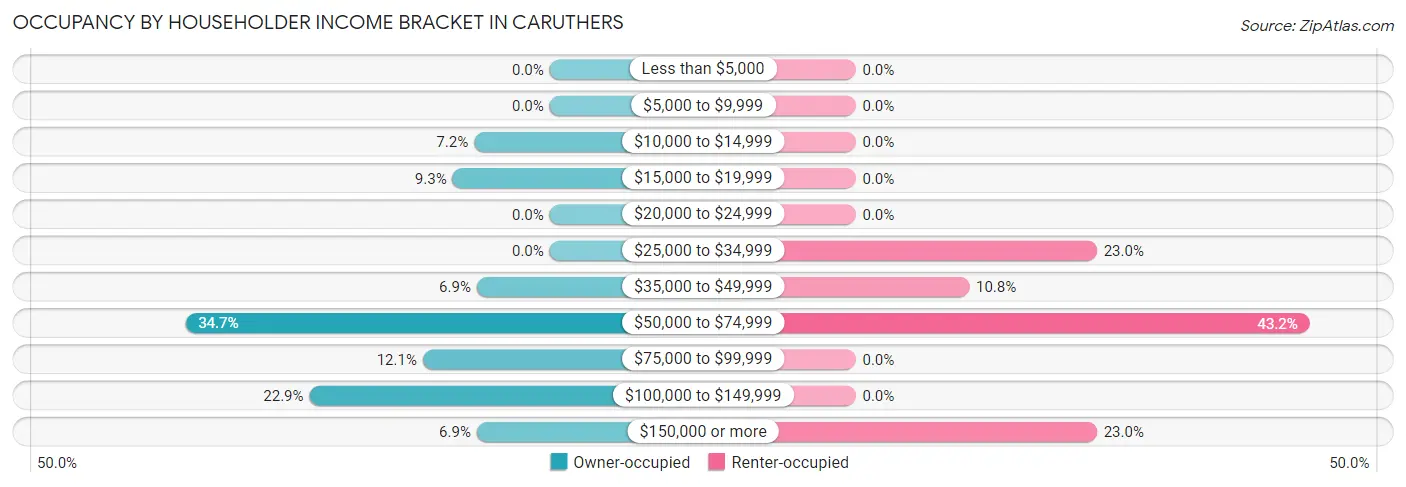
| Income Bracket | Owner-occupied | Renter-occupied |
| Less than $5,000 | 0 (0.0%) | 0 (0.0%) |
| $5,000 to $9,999 | 0 (0.0%) | 0 (0.0%) |
| $10,000 to $14,999 | 28 (7.2%) | 0 (0.0%) |
| $15,000 to $19,999 | 36 (9.2%) | 0 (0.0%) |
| $20,000 to $24,999 | 0 (0.0%) | 0 (0.0%) |
| $25,000 to $34,999 | 0 (0.0%) | 34 (23.0%) |
| $35,000 to $49,999 | 27 (6.9%) | 16 (10.8%) |
| $50,000 to $74,999 | 135 (34.7%) | 64 (43.2%) |
| $75,000 to $99,999 | 47 (12.1%) | 0 (0.0%) |
| $100,000 to $149,999 | 89 (22.9%) | 0 (0.0%) |
| $150,000 or more | 27 (6.9%) | 34 (23.0%) |
| Total | 389 (100.0%) | 148 (100.0%) |
Monthly Housing Cost Tiers in Caruthers
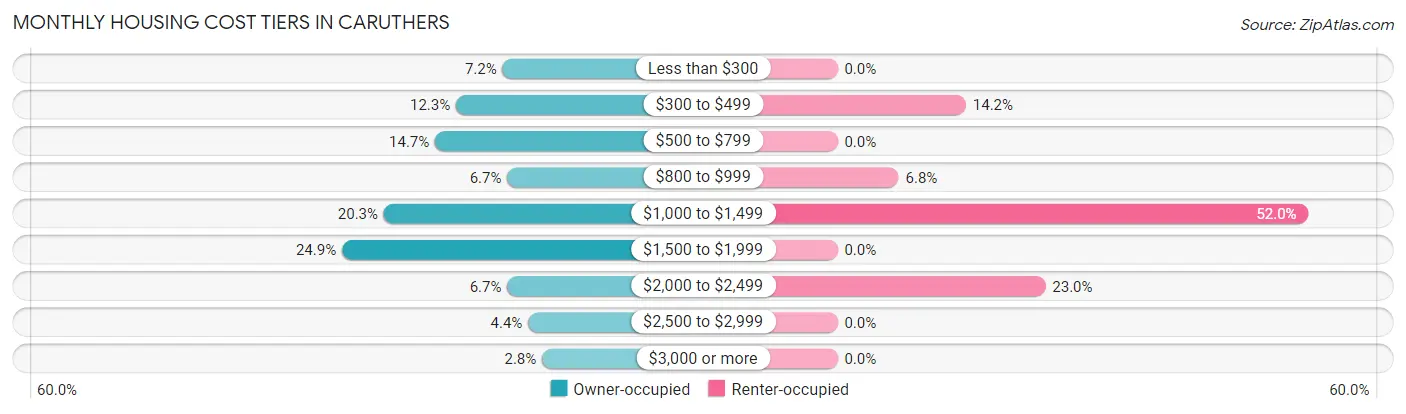
| Monthly Cost | Owner-occupied | Renter-occupied |
| Less than $300 | 28 (7.2%) | 0 (0.0%) |
| $300 to $499 | 48 (12.3%) | 21 (14.2%) |
| $500 to $799 | 57 (14.6%) | 0 (0.0%) |
| $800 to $999 | 26 (6.7%) | 10 (6.8%) |
| $1,000 to $1,499 | 79 (20.3%) | 77 (52.0%) |
| $1,500 to $1,999 | 97 (24.9%) | 0 (0.0%) |
| $2,000 to $2,499 | 26 (6.7%) | 34 (23.0%) |
| $2,500 to $2,999 | 17 (4.4%) | 0 (0.0%) |
| $3,000 or more | 11 (2.8%) | 0 (0.0%) |
| Total | 389 (100.0%) | 148 (100.0%) |
Physical Housing Characteristics in Caruthers
Housing Structures in Caruthers
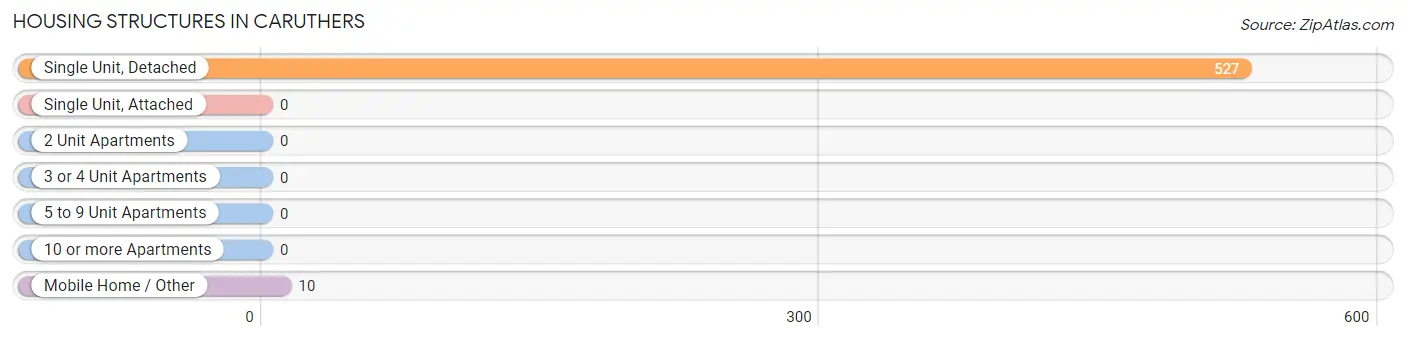
| Structure Type | # Housing Units | % Housing Units |
| Single Unit, Detached | 527 | 98.1% |
| Single Unit, Attached | 0 | 0.0% |
| 2 Unit Apartments | 0 | 0.0% |
| 3 or 4 Unit Apartments | 0 | 0.0% |
| 5 to 9 Unit Apartments | 0 | 0.0% |
| 10 or more Apartments | 0 | 0.0% |
| Mobile Home / Other | 10 | 1.9% |
| Total | 537 | 100.0% |
Housing Structures by Occupancy in Caruthers
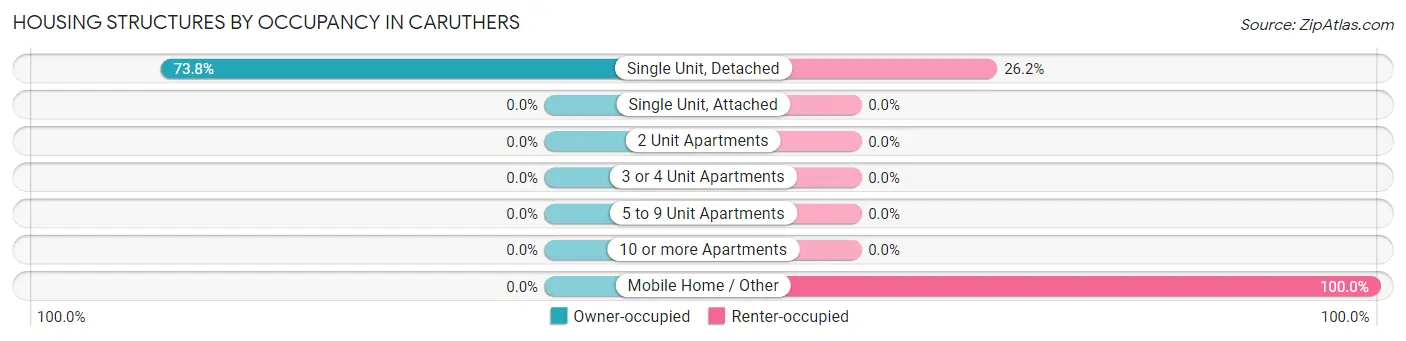
| Structure Type | Owner-occupied | Renter-occupied |
| Single Unit, Detached | 389 (73.8%) | 138 (26.2%) |
| Single Unit, Attached | 0 (0.0%) | 0 (0.0%) |
| 2 Unit Apartments | 0 (0.0%) | 0 (0.0%) |
| 3 or 4 Unit Apartments | 0 (0.0%) | 0 (0.0%) |
| 5 to 9 Unit Apartments | 0 (0.0%) | 0 (0.0%) |
| 10 or more Apartments | 0 (0.0%) | 0 (0.0%) |
| Mobile Home / Other | 0 (0.0%) | 10 (100.0%) |
| Total | 389 (72.4%) | 148 (27.6%) |
Housing Structures by Number of Rooms in Caruthers
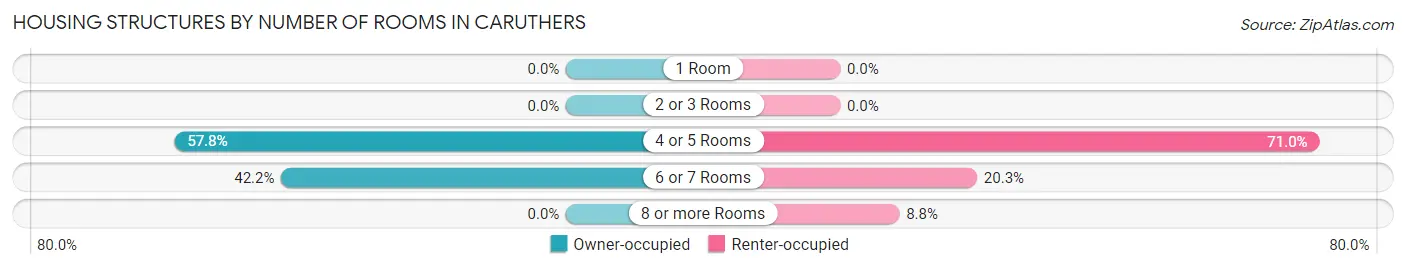
| Number of Rooms | Owner-occupied | Renter-occupied |
| 1 Room | 0 (0.0%) | 0 (0.0%) |
| 2 or 3 Rooms | 0 (0.0%) | 0 (0.0%) |
| 4 or 5 Rooms | 225 (57.8%) | 105 (71.0%) |
| 6 or 7 Rooms | 164 (42.2%) | 30 (20.3%) |
| 8 or more Rooms | 0 (0.0%) | 13 (8.8%) |
| Total | 389 (100.0%) | 148 (100.0%) |
Housing Structure by Heating Type in Caruthers
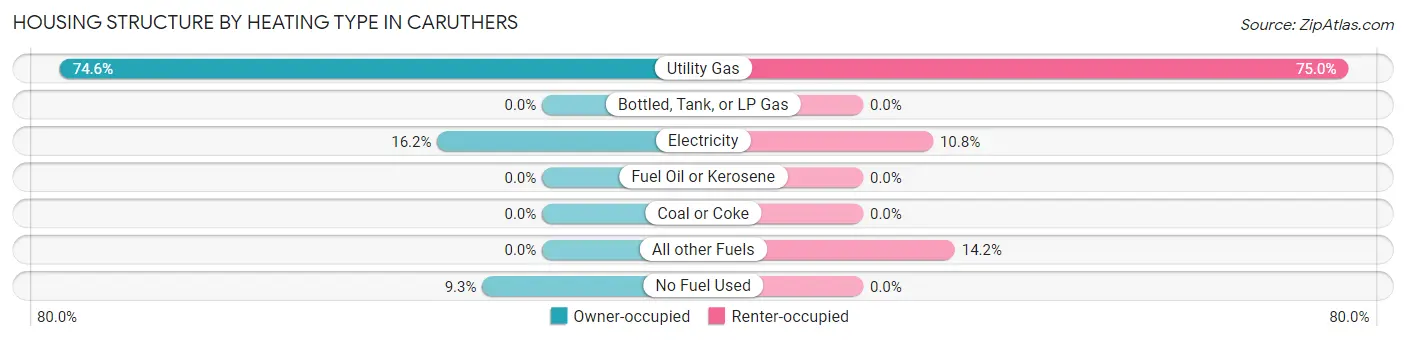
| Heating Type | Owner-occupied | Renter-occupied |
| Utility Gas | 290 (74.6%) | 111 (75.0%) |
| Bottled, Tank, or LP Gas | 0 (0.0%) | 0 (0.0%) |
| Electricity | 63 (16.2%) | 16 (10.8%) |
| Fuel Oil or Kerosene | 0 (0.0%) | 0 (0.0%) |
| Coal or Coke | 0 (0.0%) | 0 (0.0%) |
| All other Fuels | 0 (0.0%) | 21 (14.2%) |
| No Fuel Used | 36 (9.2%) | 0 (0.0%) |
| Total | 389 (100.0%) | 148 (100.0%) |
Household Vehicle Usage in Caruthers
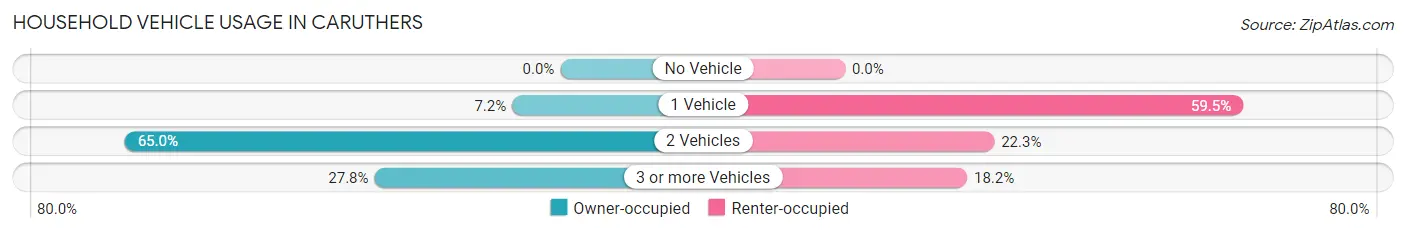
| Vehicles per Household | Owner-occupied | Renter-occupied |
| No Vehicle | 0 (0.0%) | 0 (0.0%) |
| 1 Vehicle | 28 (7.2%) | 88 (59.5%) |
| 2 Vehicles | 253 (65.0%) | 33 (22.3%) |
| 3 or more Vehicles | 108 (27.8%) | 27 (18.2%) |
| Total | 389 (100.0%) | 148 (100.0%) |
Real Estate & Mortgages in Caruthers
Real Estate and Mortgage Overview in Caruthers
| Characteristic | Without Mortgage | With Mortgage |
| Housing Units | 133 | 256 |
| Median Property Value | - | - |
| Median Household Income | $60,821 | $27 |
| Monthly Housing Costs | $480 | $11 |
| Real Estate Taxes | $1,117 | $0 |
Property Value by Mortgage Status in Caruthers
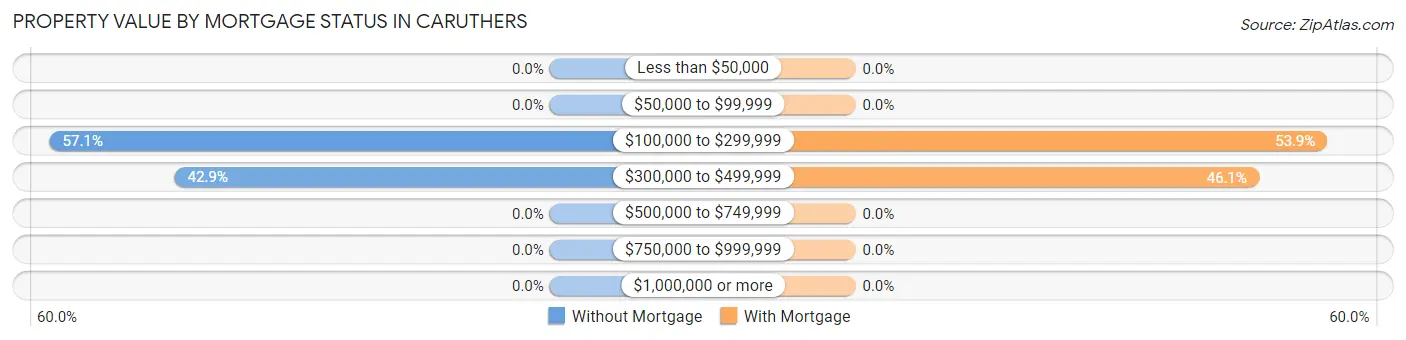
| Property Value | Without Mortgage | With Mortgage |
| Less than $50,000 | 0 (0.0%) | 0 (0.0%) |
| $50,000 to $99,999 | 0 (0.0%) | 0 (0.0%) |
| $100,000 to $299,999 | 76 (57.1%) | 138 (53.9%) |
| $300,000 to $499,999 | 57 (42.9%) | 118 (46.1%) |
| $500,000 to $749,999 | 0 (0.0%) | 0 (0.0%) |
| $750,000 to $999,999 | 0 (0.0%) | 0 (0.0%) |
| $1,000,000 or more | 0 (0.0%) | 0 (0.0%) |
| Total | 133 (100.0%) | 256 (100.0%) |
Household Income by Mortgage Status in Caruthers
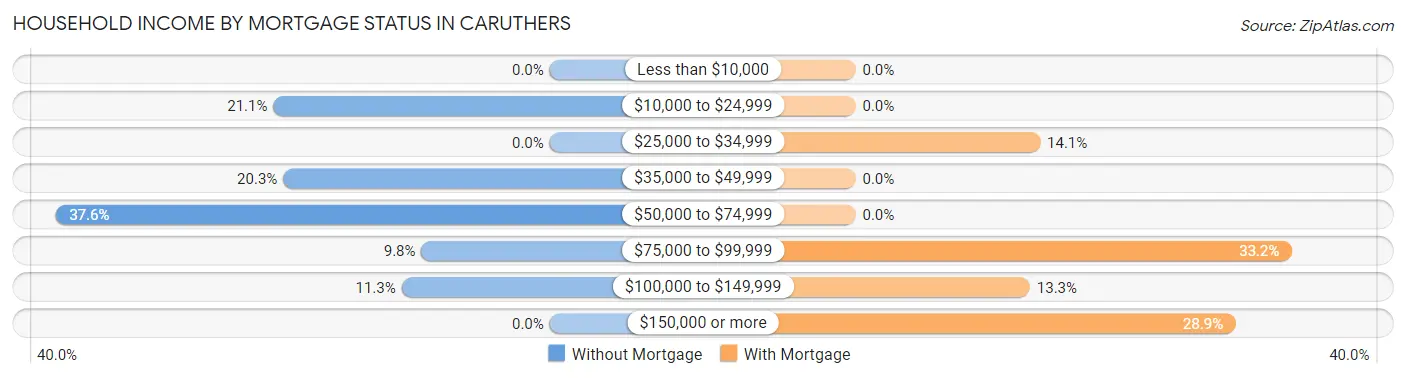
| Household Income | Without Mortgage | With Mortgage |
| Less than $10,000 | 0 (0.0%) | 0 (0.0%) |
| $10,000 to $24,999 | 28 (21.0%) | 0 (0.0%) |
| $25,000 to $34,999 | 0 (0.0%) | 36 (14.1%) |
| $35,000 to $49,999 | 27 (20.3%) | 0 (0.0%) |
| $50,000 to $74,999 | 50 (37.6%) | 0 (0.0%) |
| $75,000 to $99,999 | 13 (9.8%) | 85 (33.2%) |
| $100,000 to $149,999 | 15 (11.3%) | 34 (13.3%) |
| $150,000 or more | 0 (0.0%) | 74 (28.9%) |
| Total | 133 (100.0%) | 256 (100.0%) |
Property Value to Household Income Ratio in Caruthers
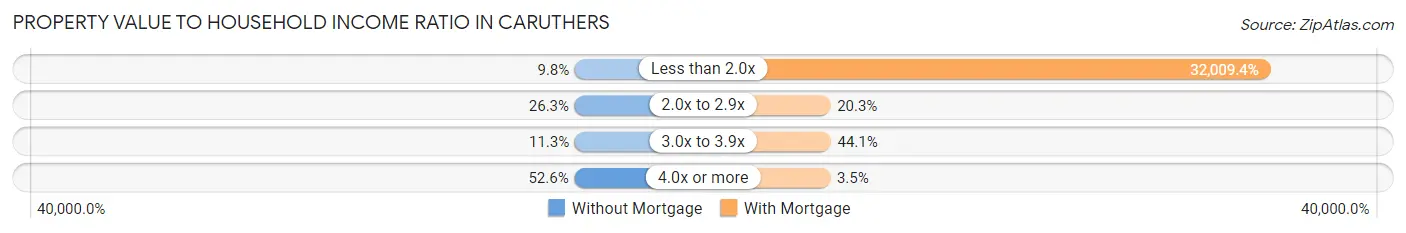
| Value-to-Income Ratio | Without Mortgage | With Mortgage |
| Less than 2.0x | 13 (9.8%) | 81,944 (32,009.4%) |
| 2.0x to 2.9x | 35 (26.3%) | 52 (20.3%) |
| 3.0x to 3.9x | 15 (11.3%) | 113 (44.1%) |
| 4.0x or more | 70 (52.6%) | 9 (3.5%) |
| Total | 133 (100.0%) | 256 (100.0%) |
Real Estate Taxes by Mortgage Status in Caruthers
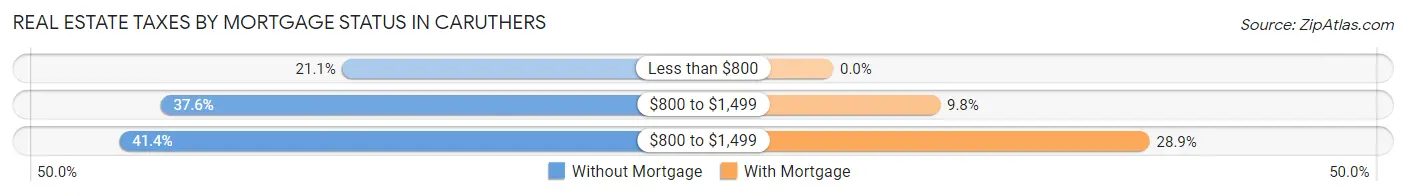
| Property Taxes | Without Mortgage | With Mortgage |
| Less than $800 | 28 (21.0%) | 0 (0.0%) |
| $800 to $1,499 | 50 (37.6%) | 25 (9.8%) |
| $800 to $1,499 | 55 (41.3%) | 74 (28.9%) |
| Total | 133 (100.0%) | 256 (100.0%) |
Health & Disability in Caruthers
Health Insurance Coverage by Age in Caruthers
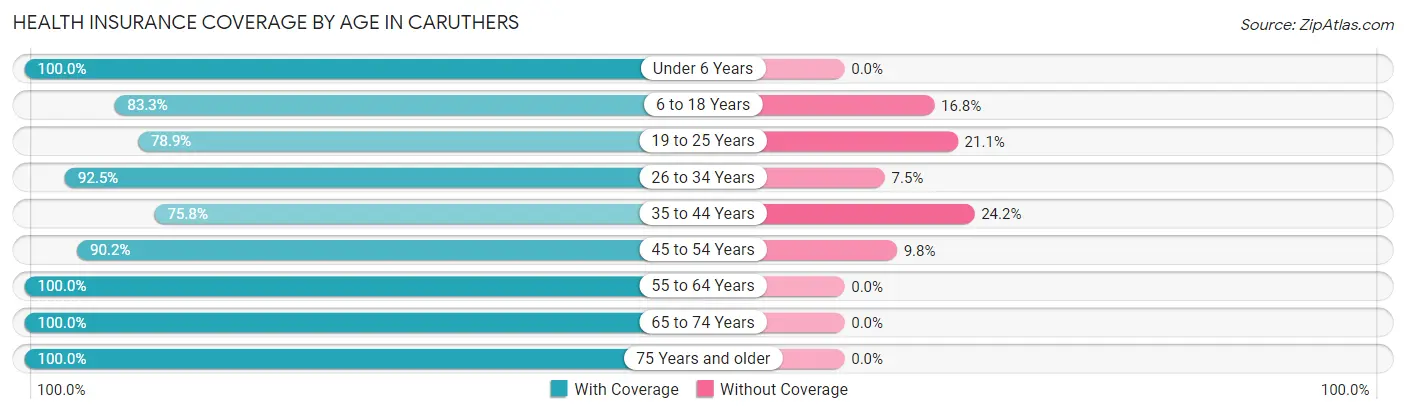
| Age Bracket | With Coverage | Without Coverage |
| Under 6 Years | 124 (100.0%) | 0 (0.0%) |
| 6 to 18 Years | 487 (83.3%) | 98 (16.8%) |
| 19 to 25 Years | 138 (78.9%) | 37 (21.1%) |
| 26 to 34 Years | 209 (92.5%) | 17 (7.5%) |
| 35 to 44 Years | 172 (75.8%) | 55 (24.2%) |
| 45 to 54 Years | 323 (90.2%) | 35 (9.8%) |
| 55 to 64 Years | 129 (100.0%) | 0 (0.0%) |
| 65 to 74 Years | 111 (100.0%) | 0 (0.0%) |
| 75 Years and older | 15 (100.0%) | 0 (0.0%) |
| Total | 1,708 (87.6%) | 242 (12.4%) |
Health Insurance Coverage by Citizenship Status in Caruthers
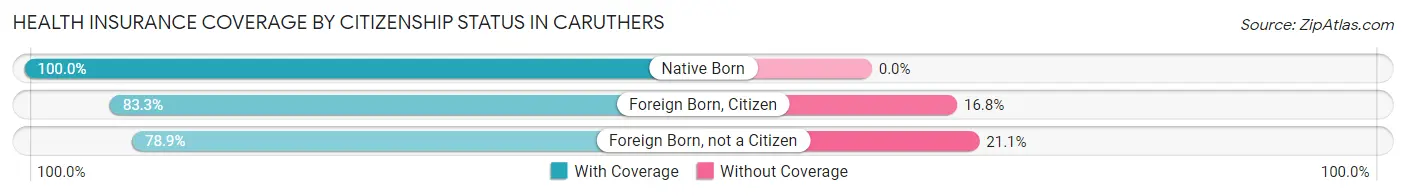
| Citizenship Status | With Coverage | Without Coverage |
| Native Born | 124 (100.0%) | 0 (0.0%) |
| Foreign Born, Citizen | 487 (83.3%) | 98 (16.8%) |
| Foreign Born, not a Citizen | 138 (78.9%) | 37 (21.1%) |
Health Insurance Coverage by Household Income in Caruthers
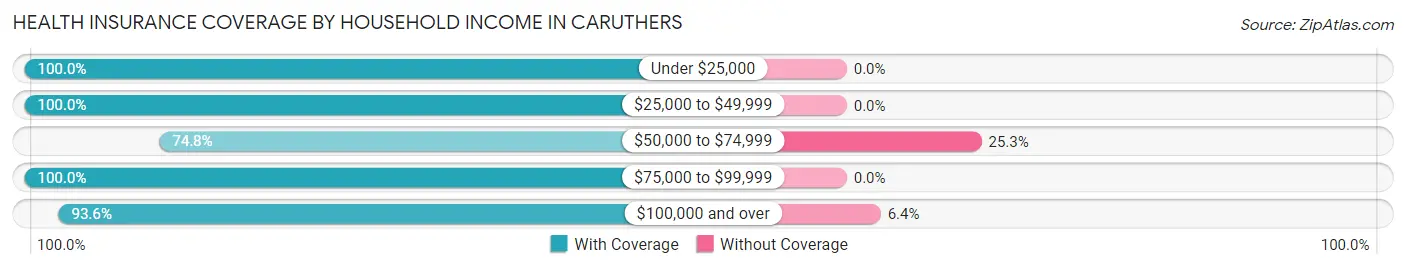
| Household Income | With Coverage | Without Coverage |
| Under $25,000 | 205 (100.0%) | 0 (0.0%) |
| $25,000 to $49,999 | 198 (100.0%) | 0 (0.0%) |
| $50,000 to $74,999 | 589 (74.8%) | 199 (25.3%) |
| $75,000 to $99,999 | 83 (100.0%) | 0 (0.0%) |
| $100,000 and over | 633 (93.6%) | 43 (6.4%) |
Public vs Private Health Insurance Coverage by Age in Caruthers
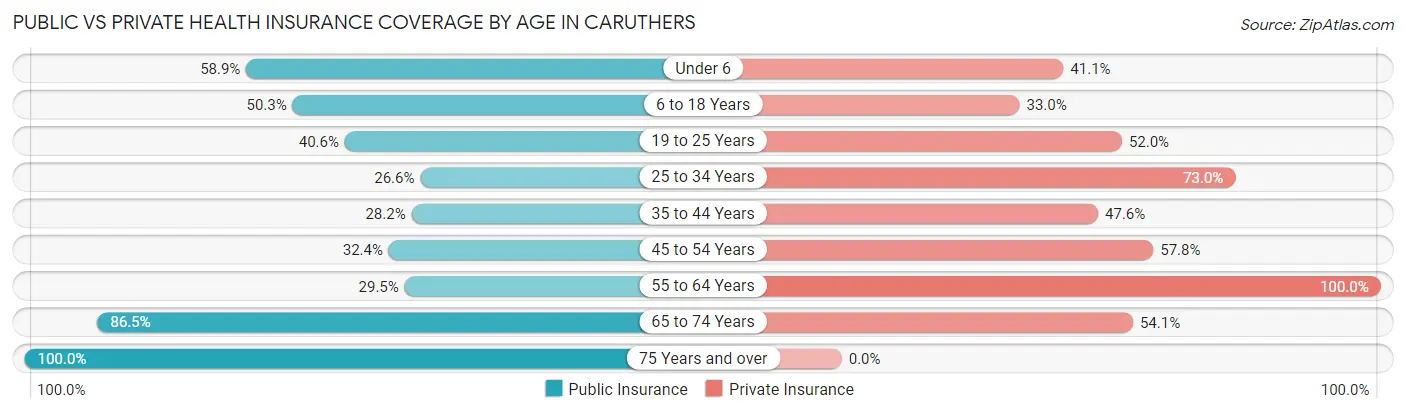
| Age Bracket | Public Insurance | Private Insurance |
| Under 6 | 73 (58.9%) | 51 (41.1%) |
| 6 to 18 Years | 294 (50.3%) | 193 (33.0%) |
| 19 to 25 Years | 71 (40.6%) | 91 (52.0%) |
| 25 to 34 Years | 60 (26.6%) | 165 (73.0%) |
| 35 to 44 Years | 64 (28.2%) | 108 (47.6%) |
| 45 to 54 Years | 116 (32.4%) | 207 (57.8%) |
| 55 to 64 Years | 38 (29.5%) | 129 (100.0%) |
| 65 to 74 Years | 96 (86.5%) | 60 (54.0%) |
| 75 Years and over | 15 (100.0%) | 0 (0.0%) |
| Total | 827 (42.4%) | 1,004 (51.5%) |
Disability Status by Sex by Age in Caruthers
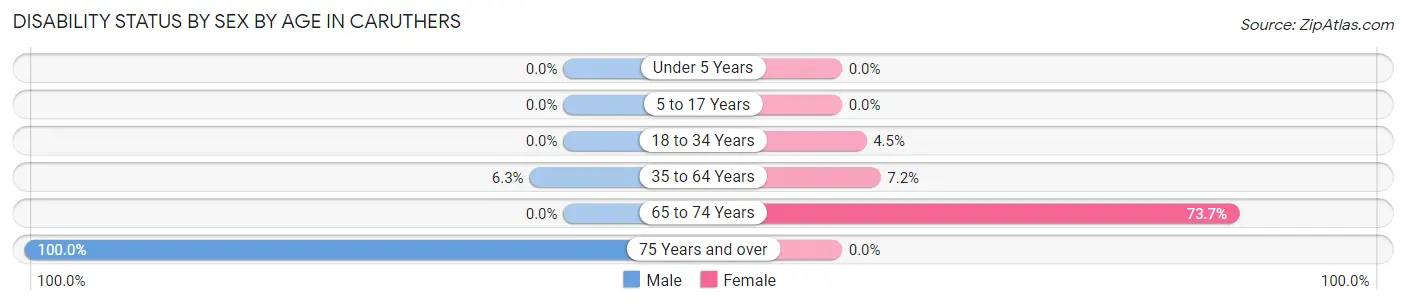
| Age Bracket | Male | Female |
| Under 5 Years | 0 (0.0%) | 0 (0.0%) |
| 5 to 17 Years | 0 (0.0%) | 0 (0.0%) |
| 18 to 34 Years | 0 (0.0%) | 14 (4.5%) |
| 35 to 64 Years | 23 (6.3%) | 25 (7.2%) |
| 65 to 74 Years | 0 (0.0%) | 42 (73.7%) |
| 75 Years and over | 15 (100.0%) | 0 (0.0%) |
Disability Class by Sex by Age in Caruthers
Disability Class: Hearing Difficulty
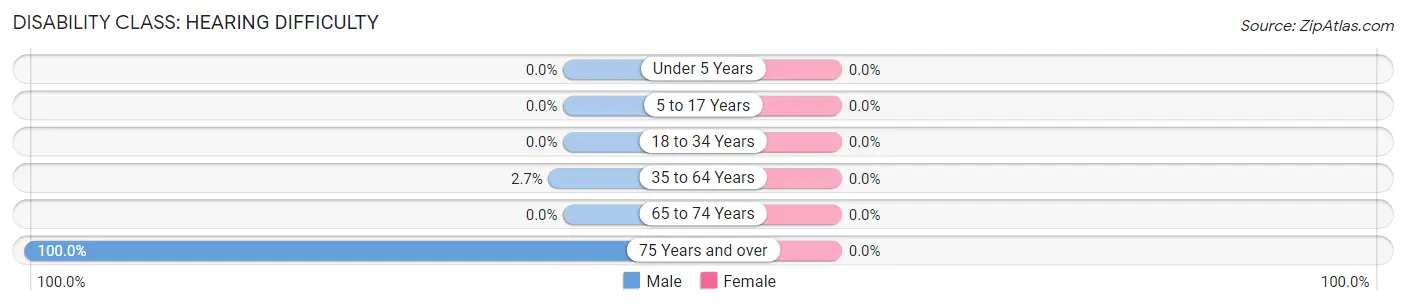
| Age Bracket | Male | Female |
| Under 5 Years | 0 (0.0%) | 0 (0.0%) |
| 5 to 17 Years | 0 (0.0%) | 0 (0.0%) |
| 18 to 34 Years | 0 (0.0%) | 0 (0.0%) |
| 35 to 64 Years | 10 (2.7%) | 0 (0.0%) |
| 65 to 74 Years | 0 (0.0%) | 0 (0.0%) |
| 75 Years and over | 15 (100.0%) | 0 (0.0%) |
Disability Class: Vision Difficulty
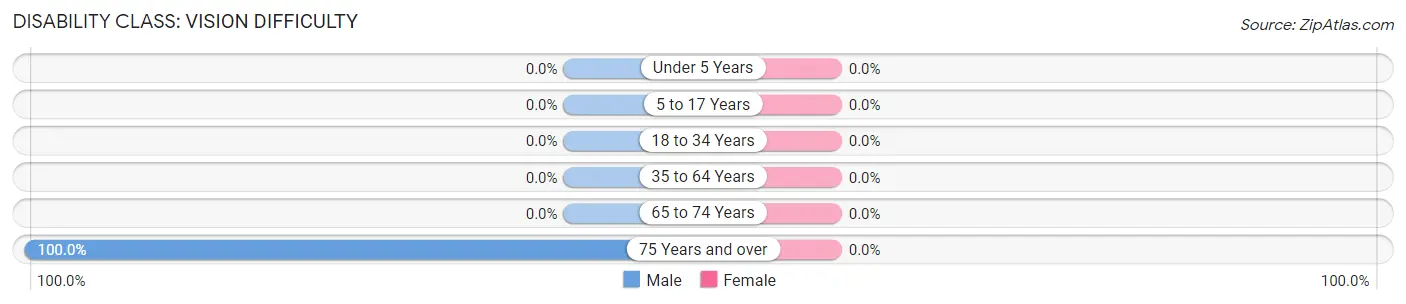
| Age Bracket | Male | Female |
| Under 5 Years | 0 (0.0%) | 0 (0.0%) |
| 5 to 17 Years | 0 (0.0%) | 0 (0.0%) |
| 18 to 34 Years | 0 (0.0%) | 0 (0.0%) |
| 35 to 64 Years | 0 (0.0%) | 0 (0.0%) |
| 65 to 74 Years | 0 (0.0%) | 0 (0.0%) |
| 75 Years and over | 15 (100.0%) | 0 (0.0%) |
Disability Class: Cognitive Difficulty
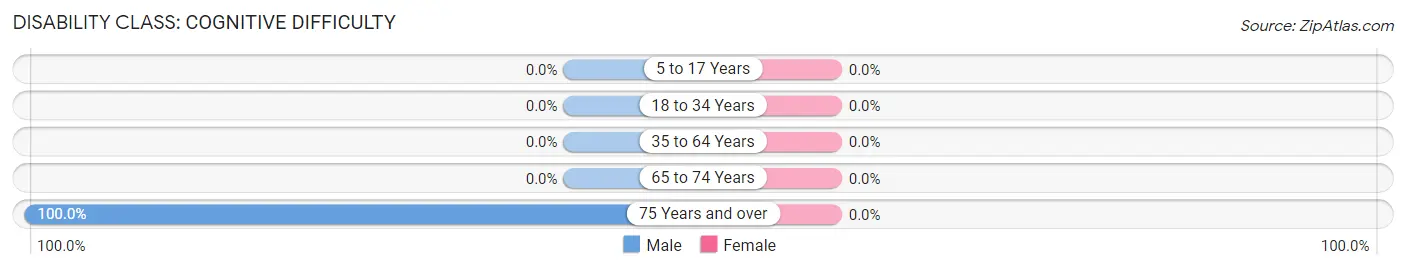
| Age Bracket | Male | Female |
| 5 to 17 Years | 0 (0.0%) | 0 (0.0%) |
| 18 to 34 Years | 0 (0.0%) | 0 (0.0%) |
| 35 to 64 Years | 0 (0.0%) | 0 (0.0%) |
| 65 to 74 Years | 0 (0.0%) | 0 (0.0%) |
| 75 Years and over | 15 (100.0%) | 0 (0.0%) |
Disability Class: Ambulatory Difficulty
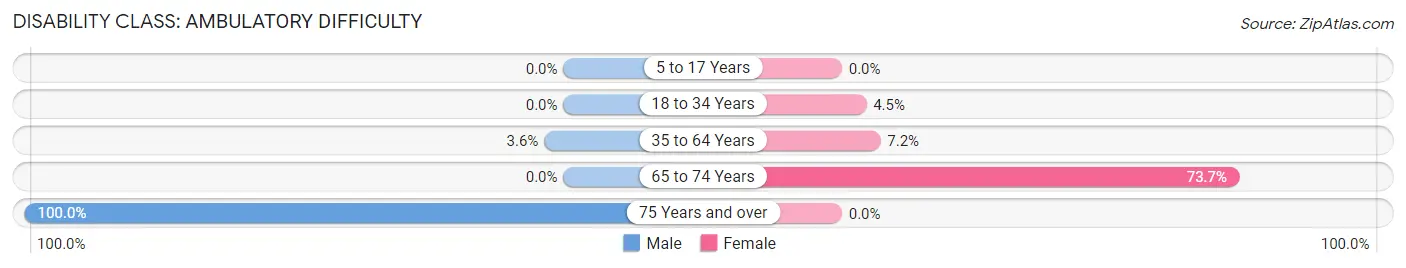
| Age Bracket | Male | Female |
| 5 to 17 Years | 0 (0.0%) | 0 (0.0%) |
| 18 to 34 Years | 0 (0.0%) | 14 (4.5%) |
| 35 to 64 Years | 13 (3.6%) | 25 (7.2%) |
| 65 to 74 Years | 0 (0.0%) | 42 (73.7%) |
| 75 Years and over | 15 (100.0%) | 0 (0.0%) |
Disability Class: Self-Care Difficulty
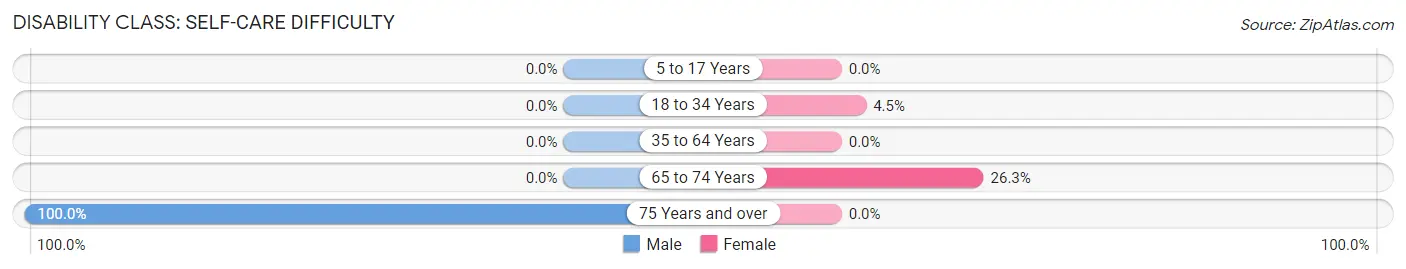
| Age Bracket | Male | Female |
| 5 to 17 Years | 0 (0.0%) | 0 (0.0%) |
| 18 to 34 Years | 0 (0.0%) | 14 (4.5%) |
| 35 to 64 Years | 0 (0.0%) | 0 (0.0%) |
| 65 to 74 Years | 0 (0.0%) | 15 (26.3%) |
| 75 Years and over | 15 (100.0%) | 0 (0.0%) |
Technology Access in Caruthers
Computing Device Access in Caruthers
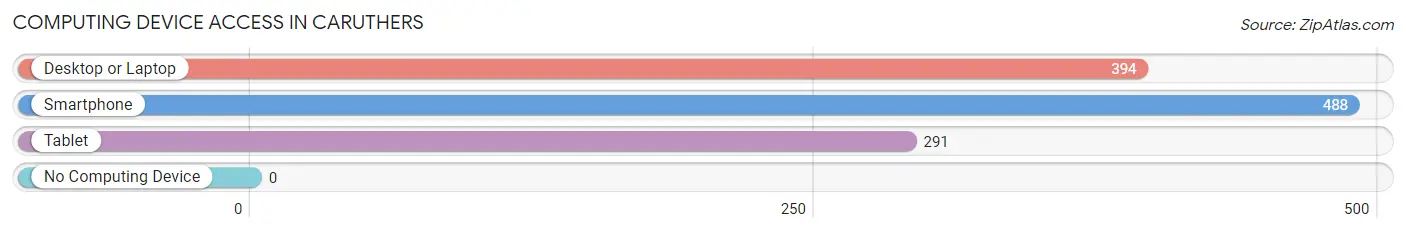
| Device Type | # Households | % Households |
| Desktop or Laptop | 394 | 73.4% |
| Smartphone | 488 | 90.9% |
| Tablet | 291 | 54.2% |
| No Computing Device | 0 | 0.0% |
| Total | 537 | 100.0% |
Internet Access in Caruthers
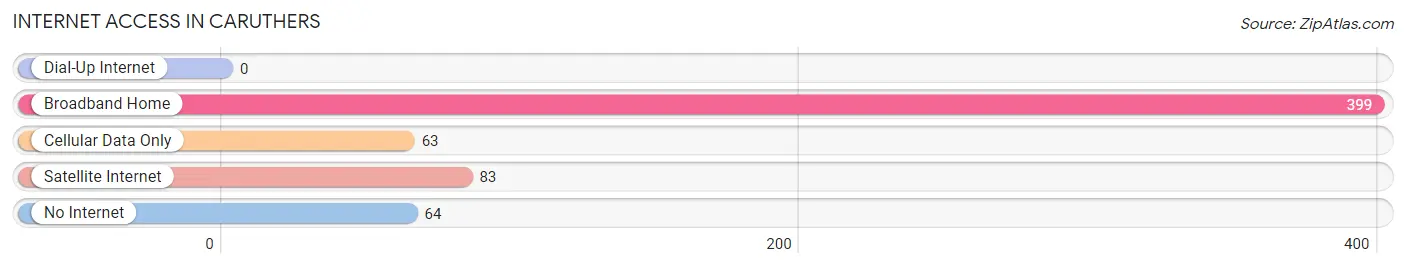
| Internet Type | # Households | % Households |
| Dial-Up Internet | 0 | 0.0% |
| Broadband Home | 399 | 74.3% |
| Cellular Data Only | 63 | 11.7% |
| Satellite Internet | 83 | 15.5% |
| No Internet | 64 | 11.9% |
| Total | 537 | 100.0% |
Caruthers Summary
Caruthers is a small unincorporated community located in Fresno County, California. It is situated in the San Joaquin Valley, approximately 8 miles south of Fresno. The population of Caruthers was estimated to be 2,845 in 2019.
History
Caruthers was founded in 1891 by William Caruthers, a rancher from Missouri. He purchased land in the area and began to develop it for agricultural purposes. The town was named after him. In the early 1900s, Caruthers was a thriving agricultural community, with a population of over 1,000 people. The town had a post office, a school, a hotel, and several stores.
In the 1920s, the town began to decline as the agricultural industry shifted away from the area. By the 1950s, the population had dropped to just over 500 people. In the 1960s, the town began to experience a resurgence as the agricultural industry returned to the area. The population grew to over 1,000 people by the 1970s.
Geography
Caruthers is located in the San Joaquin Valley, approximately 8 miles south of Fresno. The town is situated at an elevation of approximately 200 feet above sea level. The climate in Caruthers is hot and dry, with temperatures ranging from the mid-90s in the summer to the mid-50s in the winter.
The town is surrounded by agricultural land, with a variety of crops grown in the area. The main crops grown in Caruthers are almonds, grapes, and cotton.
Economy
The economy of Caruthers is largely based on agriculture. The town is home to several large farms and ranches, which produce a variety of crops, including almonds, grapes, and cotton. The town also has several small businesses, including restaurants, gas stations, and convenience stores.
Demographics
The population of Caruthers was estimated to be 2,845 in 2019. The town is predominantly Hispanic, with over 90% of the population identifying as Hispanic or Latino. The median household income in Caruthers is $45,000, and the median home value is $250,000.
Conclusion
Caruthers is a small unincorporated community located in Fresno County, California. It was founded in 1891 by William Caruthers and has a population of 2,845. The economy of Caruthers is largely based on agriculture, with a variety of crops grown in the area. The town is predominantly Hispanic, with over 90% of the population identifying as Hispanic or Latino. Caruthers is a thriving agricultural community with a rich history and a bright future.
Common Questions
What is Per Capita Income in Caruthers?
Per Capita income in Caruthers is $21,928.
What is the Median Family Income in Caruthers?
Median Family Income in Caruthers is $64,056.
What is the Median Household income in Caruthers?
Median Household Income in Caruthers is $63,528.
What is Income or Wage Gap in Caruthers?
Income or Wage Gap in Caruthers is 38.3%.
Women in Caruthers earn 61.7 cents for every dollar earned by a man.
What is Inequality or Gini Index in Caruthers?
Inequality or Gini Index in Caruthers is 0.34.
What is the Total Population of Caruthers?
Total Population of Caruthers is 1,950.
What is the Total Male Population of Caruthers?
Total Male Population of Caruthers is 992.
What is the Total Female Population of Caruthers?
Total Female Population of Caruthers is 958.
What is the Ratio of Males per 100 Females in Caruthers?
There are 103.55 Males per 100 Females in Caruthers.
What is the Ratio of Females per 100 Males in Caruthers?
There are 96.57 Females per 100 Males in Caruthers.
What is the Median Population Age in Caruthers?
Median Population Age in Caruthers is 31.0 Years.
What is the Average Family Size in Caruthers
Average Family Size in Caruthers is 3.7 People.
What is the Average Household Size in Caruthers
Average Household Size in Caruthers is 3.6 People.
How Large is the Labor Force in Caruthers?
There are 808 People in the Labor Forcein in Caruthers.
What is the Percentage of People in the Labor Force in Caruthers?
57.6% of People are in the Labor Force in Caruthers.
What is the Unemployment Rate in Caruthers?
Unemployment Rate in Caruthers is 12.5%.