Capitola, CA Map & Demographics
Capitola Map
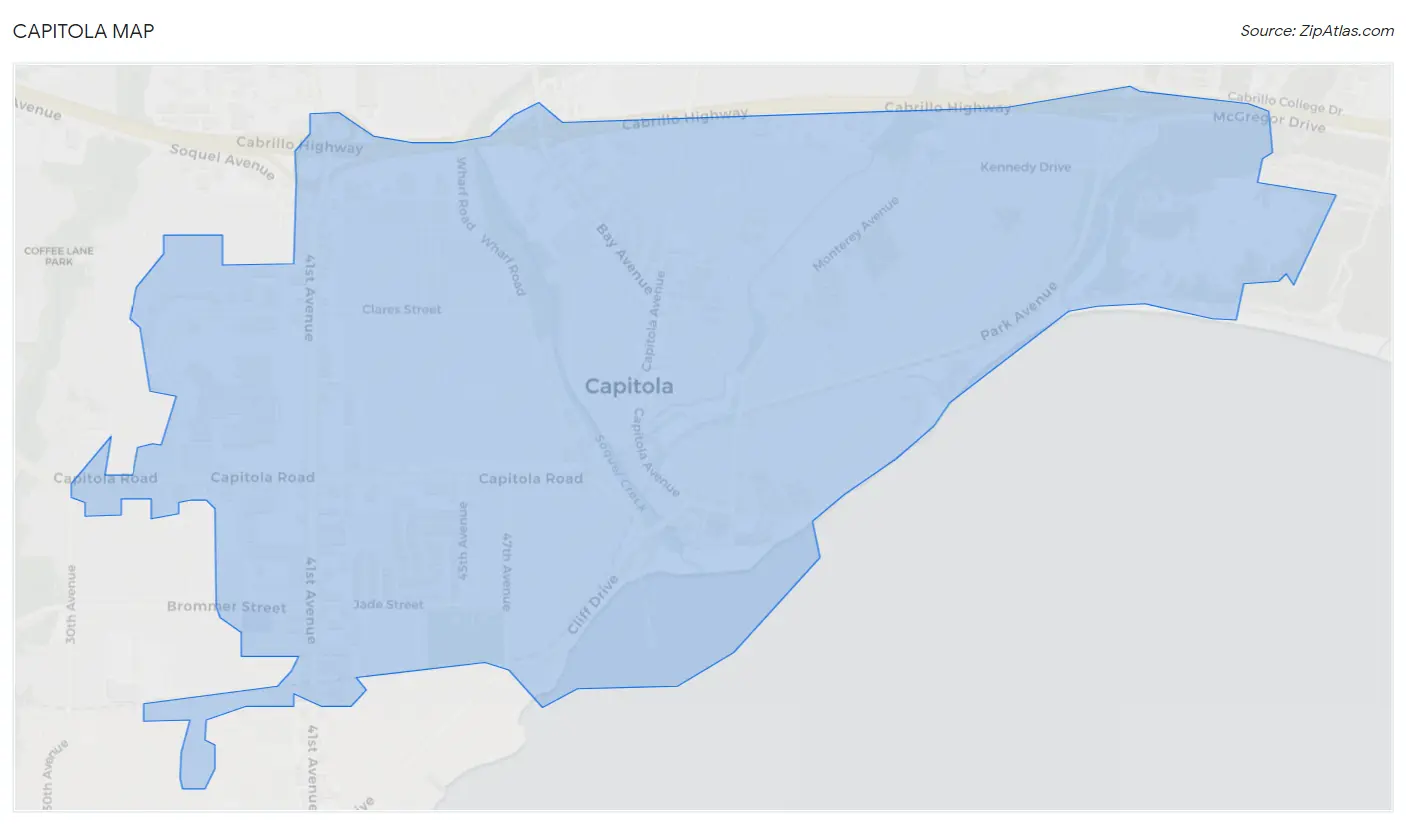
Capitola Overview
$62,768
PER CAPITA INCOME
$109,226
AVG FAMILY INCOME
$91,850
AVG HOUSEHOLD INCOME
13.1%
WAGE / INCOME GAP [ % ]
86.9¢/ $1
WAGE / INCOME GAP [ $ ]
0.49
INEQUALITY / GINI INDEX
9,921
TOTAL POPULATION
4,917
MALE POPULATION
5,004
FEMALE POPULATION
98.26
MALES / 100 FEMALES
101.77
FEMALES / 100 MALES
48.9
MEDIAN AGE
2.7
AVG FAMILY SIZE
2.1
AVG HOUSEHOLD SIZE
5,354
LABOR FORCE [ PEOPLE ]
61.5%
PERCENT IN LABOR FORCE
2.0%
UNEMPLOYMENT RATE
Capitola Zip Codes
Capitola Area Codes
Income in Capitola
Income Overview in Capitola
Per Capita Income in Capitola is $62,768, while median incomes of families and households are $109,226 and $91,850 respectively.
| Characteristic | Number | Measure |
| Per Capita Income | 9,921 | $62,768 |
| Median Family Income | 2,316 | $109,226 |
| Mean Family Income | 2,316 | $168,570 |
| Median Household Income | 4,588 | $91,850 |
| Mean Household Income | 4,588 | $136,076 |
| Income Deficit | 2,316 | $0 |
| Wage / Income Gap (%) | 9,921 | 13.12% |
| Wage / Income Gap ($) | 9,921 | 86.88¢ per $1 |
| Gini / Inequality Index | 9,921 | 0.49 |
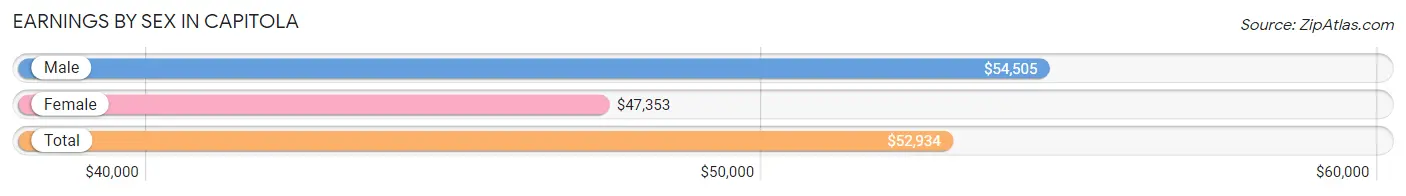
Earnings by Sex in Capitola
Average Earnings in Capitola are $52,934, $54,505 for men and $47,353 for women, a difference of 13.1%.
| Sex | Number | Average Earnings |
| Male | 2,758 (50.2%) | $54,505 |
| Female | 2,738 (49.8%) | $47,353 |
| Total | 5,496 (100.0%) | $52,934 |
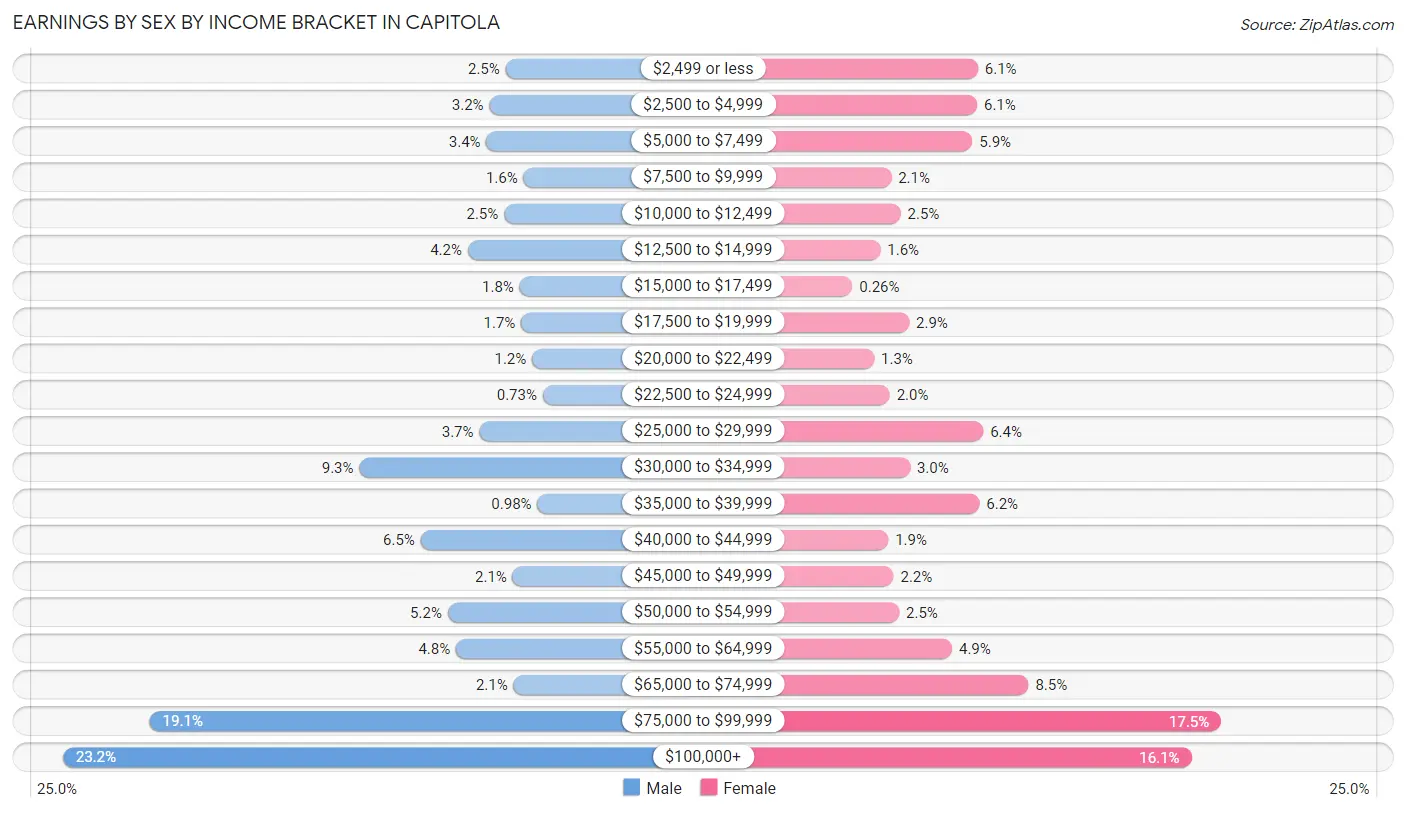
Earnings by Sex by Income Bracket in Capitola
The most common earnings brackets in Capitola are $100,000+ for men (640 | 23.2%) and $75,000 to $99,999 for women (480 | 17.5%).
| Income | Male | Female |
| $2,499 or less | 68 (2.5%) | 168 (6.1%) |
| $2,500 to $4,999 | 89 (3.2%) | 167 (6.1%) |
| $5,000 to $7,499 | 93 (3.4%) | 161 (5.9%) |
| $7,500 to $9,999 | 45 (1.6%) | 57 (2.1%) |
| $10,000 to $12,499 | 70 (2.5%) | 69 (2.5%) |
| $12,500 to $14,999 | 117 (4.2%) | 43 (1.6%) |
| $15,000 to $17,499 | 50 (1.8%) | 7 (0.3%) |
| $17,500 to $19,999 | 48 (1.7%) | 80 (2.9%) |
| $20,000 to $22,499 | 34 (1.2%) | 35 (1.3%) |
| $22,500 to $24,999 | 20 (0.7%) | 55 (2.0%) |
| $25,000 to $29,999 | 102 (3.7%) | 175 (6.4%) |
| $30,000 to $34,999 | 257 (9.3%) | 81 (3.0%) |
| $35,000 to $39,999 | 27 (1.0%) | 170 (6.2%) |
| $40,000 to $44,999 | 178 (6.5%) | 53 (1.9%) |
| $45,000 to $49,999 | 59 (2.1%) | 60 (2.2%) |
| $50,000 to $54,999 | 143 (5.2%) | 67 (2.5%) |
| $55,000 to $64,999 | 132 (4.8%) | 135 (4.9%) |
| $65,000 to $74,999 | 58 (2.1%) | 233 (8.5%) |
| $75,000 to $99,999 | 528 (19.1%) | 480 (17.5%) |
| $100,000+ | 640 (23.2%) | 442 (16.1%) |
| Total | 2,758 (100.0%) | 2,738 (100.0%) |
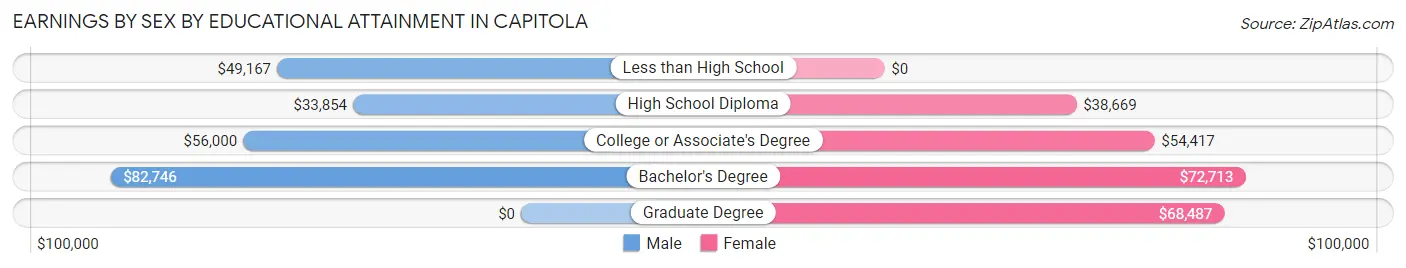
Earnings by Sex by Educational Attainment in Capitola
Average earnings in Capitola are $64,118 for men and $56,136 for women, a difference of 12.4%. Men with an educational attainment of bachelor's degree enjoy the highest average annual earnings of $82,746, while those with high school diploma education earn the least with $33,854. Women with an educational attainment of bachelor's degree earn the most with the average annual earnings of $72,713, while those with high school diploma education have the smallest earnings of $38,669.
| Educational Attainment | Male Income | Female Income |
| Less than High School | $49,167 | $0 |
| High School Diploma | $33,854 | $38,669 |
| College or Associate's Degree | $56,000 | $54,417 |
| Bachelor's Degree | $82,746 | $72,713 |
| Graduate Degree | - | - |
| Total | $64,118 | $56,136 |
Family Income in Capitola
Family Income Brackets in Capitola
According to the Capitola family income data, there are 535 families falling into the $100,000 to $149,999 income range, which is the most common income bracket and makes up 23.1% of all families. Conversely, the $10,000 to $14,999 income bracket is the least frequent group with only 16 families (0.7%) belonging to this category.
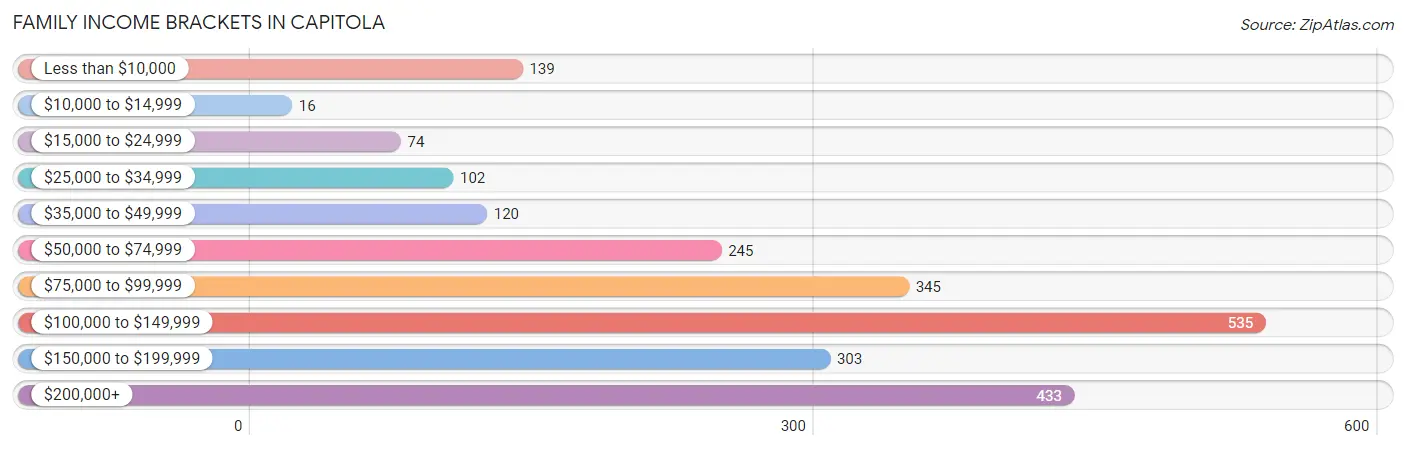
| Income Bracket | # Families | % Families |
| Less than $10,000 | 139 | 6.0% |
| $10,000 to $14,999 | 16 | 0.7% |
| $15,000 to $24,999 | 74 | 3.2% |
| $25,000 to $34,999 | 102 | 4.4% |
| $35,000 to $49,999 | 120 | 5.2% |
| $50,000 to $74,999 | 245 | 10.6% |
| $75,000 to $99,999 | 345 | 14.9% |
| $100,000 to $149,999 | 535 | 23.1% |
| $150,000 to $199,999 | 303 | 13.1% |
| $200,000+ | 433 | 18.7% |
Family Income by Famaliy Size in Capitola
4-person families (423 | 18.3%) account for the highest median family income in Capitola with $117,730 per family, while 2-person families (1,431 | 61.8%) have the highest median income of $54,390 per family member.
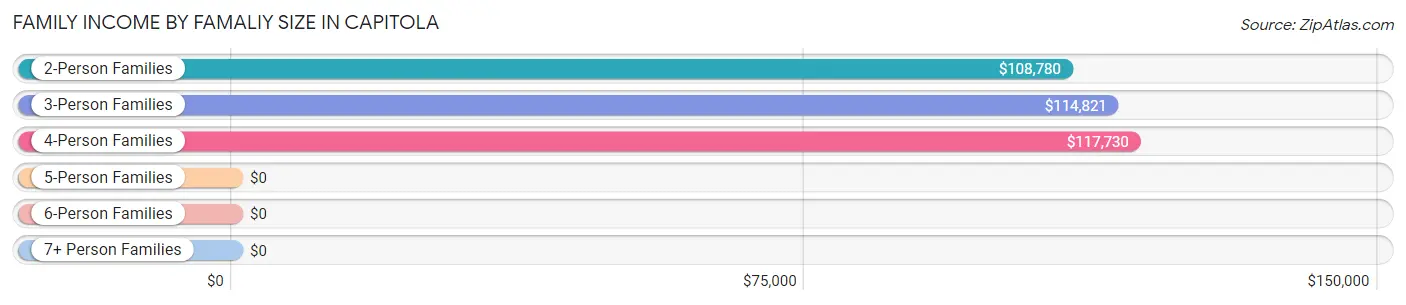
| Income Bracket | # Families | Median Income |
| 2-Person Families | 1,431 (61.8%) | $108,780 |
| 3-Person Families | 340 (14.7%) | $114,821 |
| 4-Person Families | 423 (18.3%) | $117,730 |
| 5-Person Families | 92 (4.0%) | $0 |
| 6-Person Families | 0 (0.0%) | $0 |
| 7+ Person Families | 30 (1.3%) | $0 |
| Total | 2,316 (100.0%) | $109,226 |
Family Income by Number of Earners in Capitola
The median family income in Capitola is $109,226, with families comprising 2 earners (890) having the highest median family income of $137,935, while families with no earners (382) have the lowest median family income of $71,250, accounting for 38.4% and 16.5% of families, respectively.
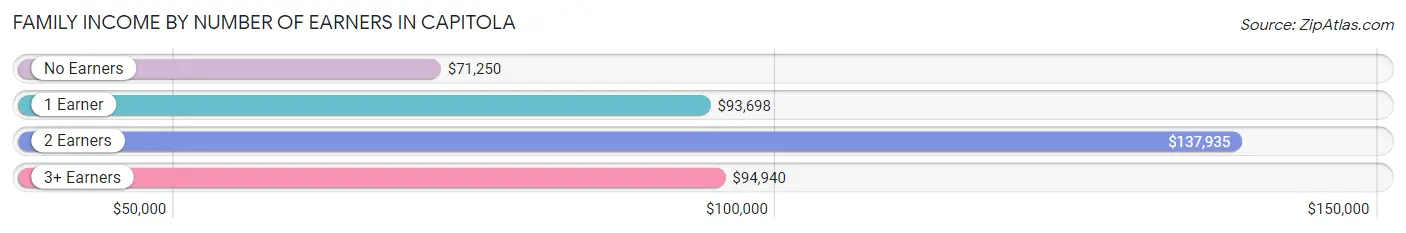
| Number of Earners | # Families | Median Income |
| No Earners | 382 (16.5%) | $71,250 |
| 1 Earner | 781 (33.7%) | $93,698 |
| 2 Earners | 890 (38.4%) | $137,935 |
| 3+ Earners | 263 (11.4%) | $94,940 |
| Total | 2,316 (100.0%) | $109,226 |
Household Income in Capitola
Household Income Brackets in Capitola
With 840 households falling in the category, the $100,000 to $149,999 income range is the most frequent in Capitola, accounting for 18.3% of all households. In contrast, only 60 households (1.3%) fall into the $10,000 to $14,999 income bracket, making it the least populous group.
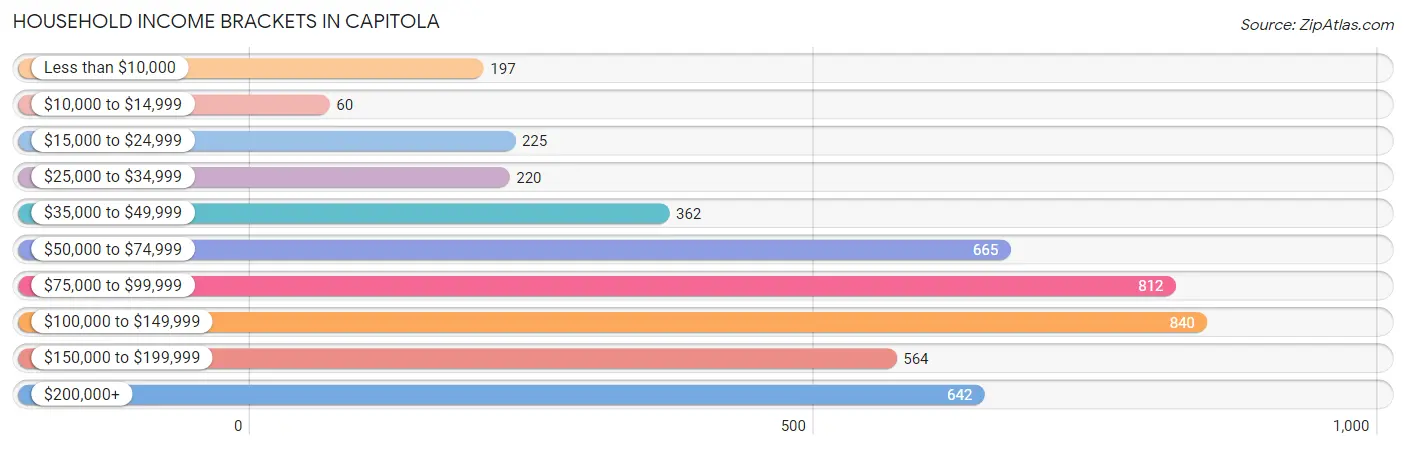
| Income Bracket | # Households | % Households |
| Less than $10,000 | 197 | 4.3% |
| $10,000 to $14,999 | 60 | 1.3% |
| $15,000 to $24,999 | 225 | 4.9% |
| $25,000 to $34,999 | 220 | 4.8% |
| $35,000 to $49,999 | 362 | 7.9% |
| $50,000 to $74,999 | 665 | 14.5% |
| $75,000 to $99,999 | 812 | 17.7% |
| $100,000 to $149,999 | 840 | 18.3% |
| $150,000 to $199,999 | 564 | 12.3% |
| $200,000+ | 642 | 14.0% |
Household Income by Householder Age in Capitola
The median household income in Capitola is $91,850, with the highest median household income of $112,557 found in the 45 to 64 years age bracket for the primary householder. A total of 1,626 households (35.4%) fall into this category. Meanwhile, the 15 to 24 years age bracket for the primary householder has the lowest median household income of $0, with 83 households (1.8%) in this group.
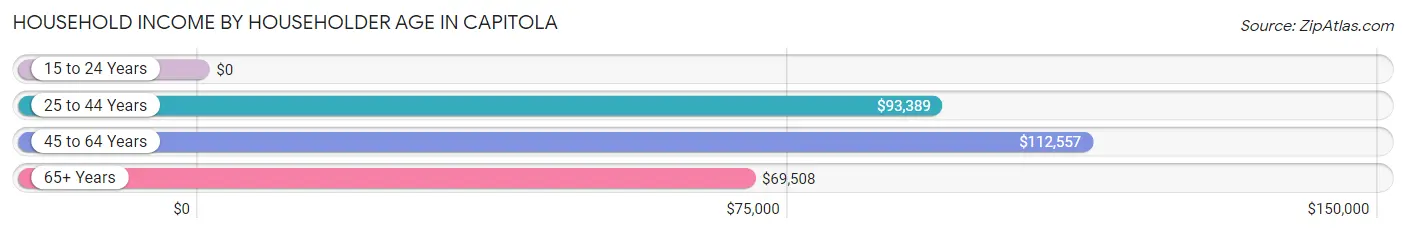
| Income Bracket | # Households | Median Income |
| 15 to 24 Years | 83 (1.8%) | $0 |
| 25 to 44 Years | 1,220 (26.6%) | $93,389 |
| 45 to 64 Years | 1,626 (35.4%) | $112,557 |
| 65+ Years | 1,659 (36.2%) | $69,508 |
| Total | 4,588 (100.0%) | $91,850 |
Poverty in Capitola
Income Below Poverty by Sex and Age in Capitola
With 19.9% poverty level for males and 10.2% for females among the residents of Capitola, 15 year old males and 16 and 17 year old females are the most vulnerable to poverty, with 45 males (100.0%) and 39 females (79.6%) in their respective age groups living below the poverty level.
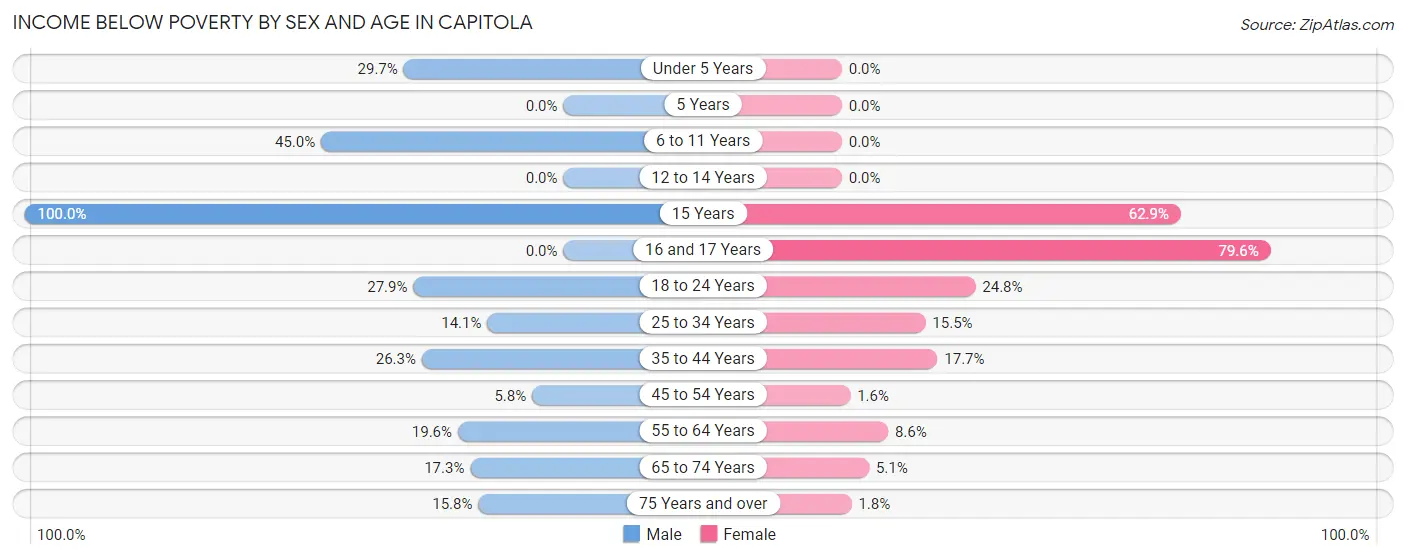
| Age Bracket | Male | Female |
| Under 5 Years | 51 (29.6%) | 0 (0.0%) |
| 5 Years | 0 (0.0%) | 0 (0.0%) |
| 6 to 11 Years | 161 (45.0%) | 0 (0.0%) |
| 12 to 14 Years | 0 (0.0%) | 0 (0.0%) |
| 15 Years | 45 (100.0%) | 56 (62.9%) |
| 16 and 17 Years | 0 (0.0%) | 39 (79.6%) |
| 18 to 24 Years | 134 (27.9%) | 60 (24.8%) |
| 25 to 34 Years | 86 (14.1%) | 95 (15.5%) |
| 35 to 44 Years | 186 (26.3%) | 118 (17.7%) |
| 45 to 54 Years | 44 (5.8%) | 8 (1.6%) |
| 55 to 64 Years | 94 (19.6%) | 78 (8.6%) |
| 65 to 74 Years | 126 (17.3%) | 38 (5.1%) |
| 75 Years and over | 45 (15.8%) | 12 (1.8%) |
| Total | 972 (19.9%) | 504 (10.2%) |
Income Above Poverty by Sex and Age in Capitola
According to the poverty statistics in Capitola, males aged 5 years and females aged under 5 years are the age groups that are most secure financially, with 100.0% of males and 100.0% of females in these age groups living above the poverty line.
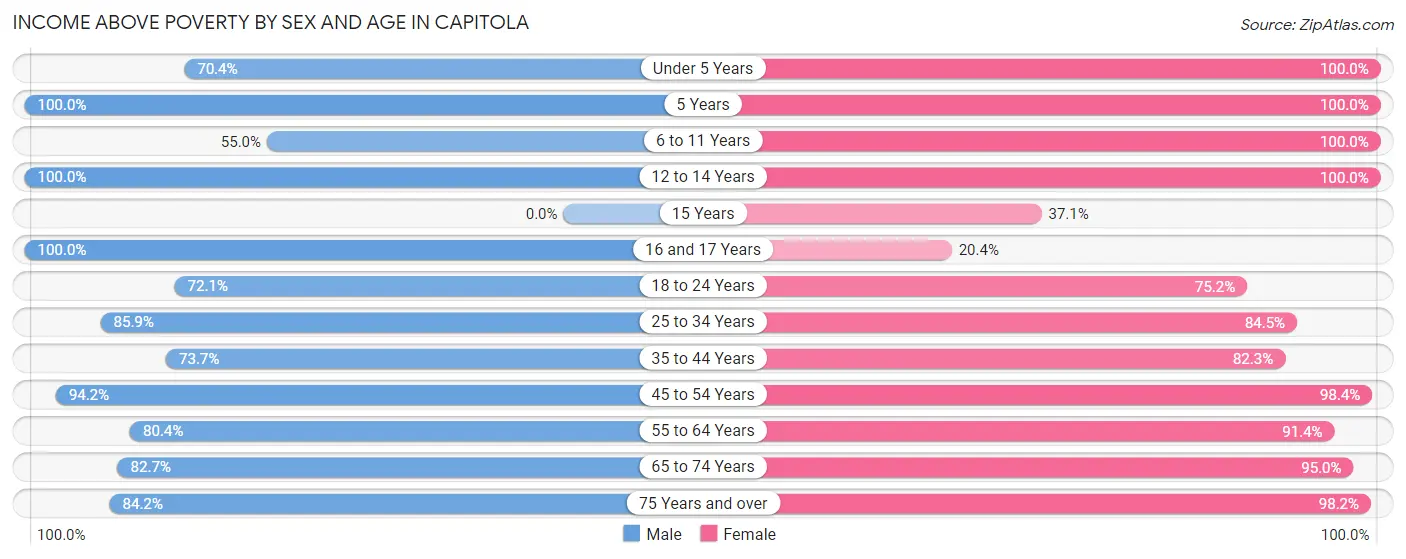
| Age Bracket | Male | Female |
| Under 5 Years | 121 (70.4%) | 110 (100.0%) |
| 5 Years | 23 (100.0%) | 16 (100.0%) |
| 6 to 11 Years | 197 (55.0%) | 247 (100.0%) |
| 12 to 14 Years | 99 (100.0%) | 57 (100.0%) |
| 15 Years | 0 (0.0%) | 33 (37.1%) |
| 16 and 17 Years | 136 (100.0%) | 10 (20.4%) |
| 18 to 24 Years | 347 (72.1%) | 182 (75.2%) |
| 25 to 34 Years | 523 (85.9%) | 517 (84.5%) |
| 35 to 44 Years | 522 (73.7%) | 547 (82.3%) |
| 45 to 54 Years | 713 (94.2%) | 506 (98.4%) |
| 55 to 64 Years | 386 (80.4%) | 832 (91.4%) |
| 65 to 74 Years | 603 (82.7%) | 714 (95.0%) |
| 75 Years and over | 240 (84.2%) | 654 (98.2%) |
| Total | 3,910 (80.1%) | 4,425 (89.8%) |
Income Below Poverty Among Married-Couple Families in Capitola
The poverty statistics for married-couple families in Capitola show that 6.8% or 111 of the total 1,639 families live below the poverty line. Families with 1 or 2 children have the highest poverty rate of 23.7%, comprising of 80 families. On the other hand, families with 3 or 4 children have the lowest poverty rate of 0.0%, which includes 0 families.
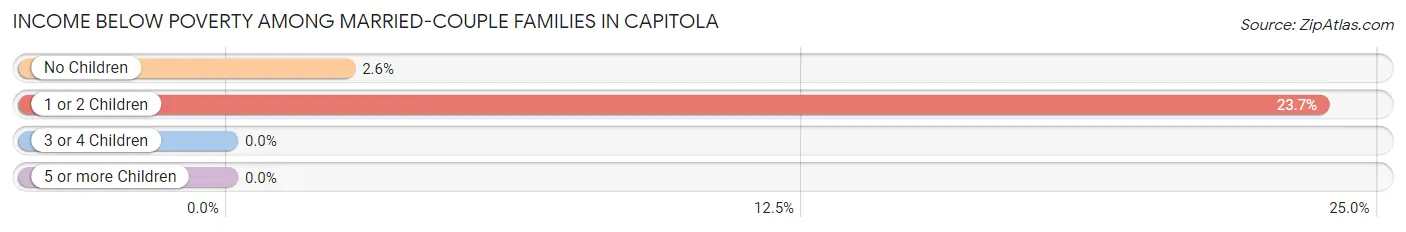
| Children | Above Poverty | Below Poverty |
| No Children | 1,184 (97.5%) | 31 (2.5%) |
| 1 or 2 Children | 257 (76.3%) | 80 (23.7%) |
| 3 or 4 Children | 87 (100.0%) | 0 (0.0%) |
| 5 or more Children | 0 (0.0%) | 0 (0.0%) |
| Total | 1,528 (93.2%) | 111 (6.8%) |
Income Below Poverty Among Single-Parent Households in Capitola
According to the poverty data in Capitola, 36.6% or 75 single-father households and 14.8% or 70 single-mother households are living below the poverty line. Among single-father households, those with 1 or 2 children have the highest poverty rate, with 75 households (49.0%) experiencing poverty. Likewise, among single-mother households, those with 1 or 2 children have the highest poverty rate, with 33 households (15.4%) falling below the poverty line.
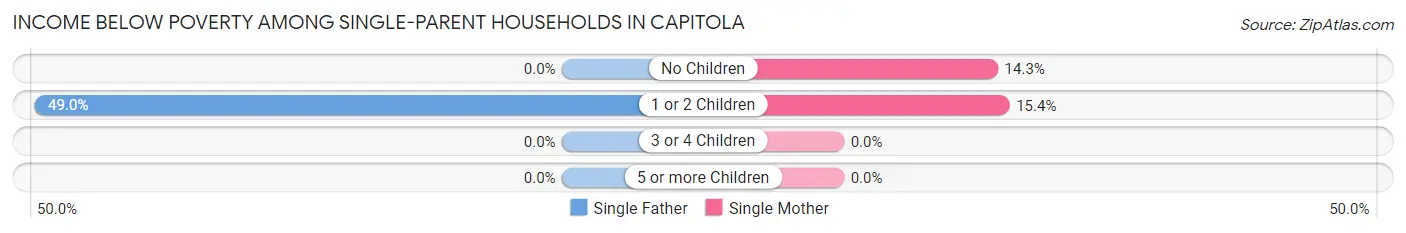
| Children | Single Father | Single Mother |
| No Children | 0 (0.0%) | 37 (14.3%) |
| 1 or 2 Children | 75 (49.0%) | 33 (15.4%) |
| 3 or 4 Children | 0 (0.0%) | 0 (0.0%) |
| 5 or more Children | 0 (0.0%) | 0 (0.0%) |
| Total | 75 (36.6%) | 70 (14.8%) |
Income Below Poverty Among Married-Couple vs Single-Parent Households in Capitola
The poverty data for Capitola shows that 111 of the married-couple family households (6.8%) and 145 of the single-parent households (21.4%) are living below the poverty level. Within the married-couple family households, those with 1 or 2 children have the highest poverty rate, with 80 households (23.7%) falling below the poverty line. Among the single-parent households, those with 1 or 2 children have the highest poverty rate, with 108 household (29.4%) living below poverty.
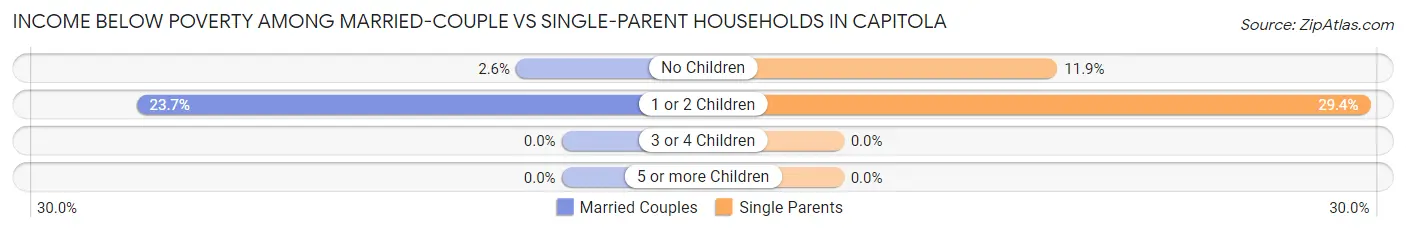
| Children | Married-Couple Families | Single-Parent Households |
| No Children | 31 (2.5%) | 37 (11.9%) |
| 1 or 2 Children | 80 (23.7%) | 108 (29.4%) |
| 3 or 4 Children | 0 (0.0%) | 0 (0.0%) |
| 5 or more Children | 0 (0.0%) | 0 (0.0%) |
| Total | 111 (6.8%) | 145 (21.4%) |
Race in Capitola
The most populous races in Capitola are White / Caucasian (7,286 | 73.4%), Hispanic or Latino (2,700 | 27.2%), and Some other Race (1,020 | 10.3%).
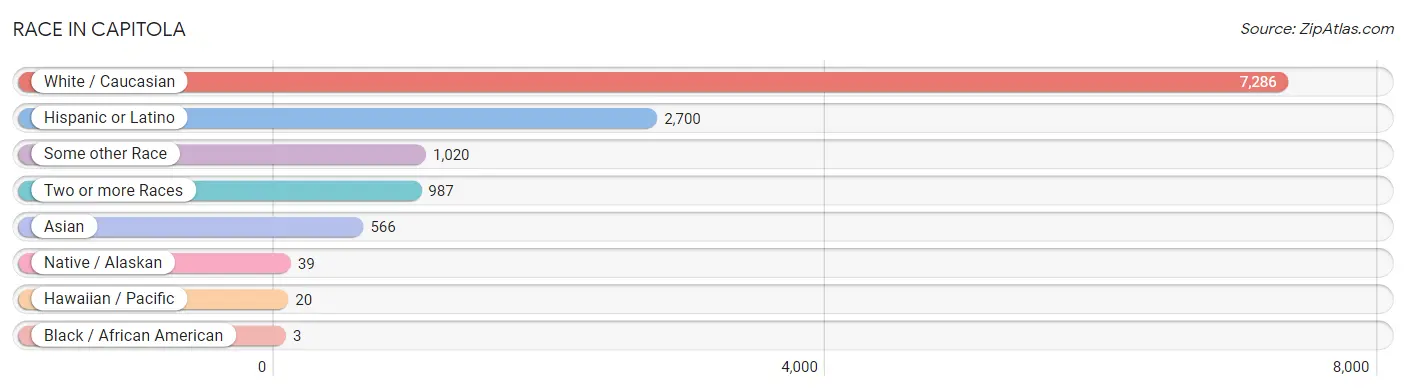
| Race | # Population | % Population |
| Asian | 566 | 5.7% |
| Black / African American | 3 | 0.0% |
| Hawaiian / Pacific | 20 | 0.2% |
| Hispanic or Latino | 2,700 | 27.2% |
| Native / Alaskan | 39 | 0.4% |
| White / Caucasian | 7,286 | 73.4% |
| Two or more Races | 987 | 10.0% |
| Some other Race | 1,020 | 10.3% |
| Total | 9,921 | 100.0% |
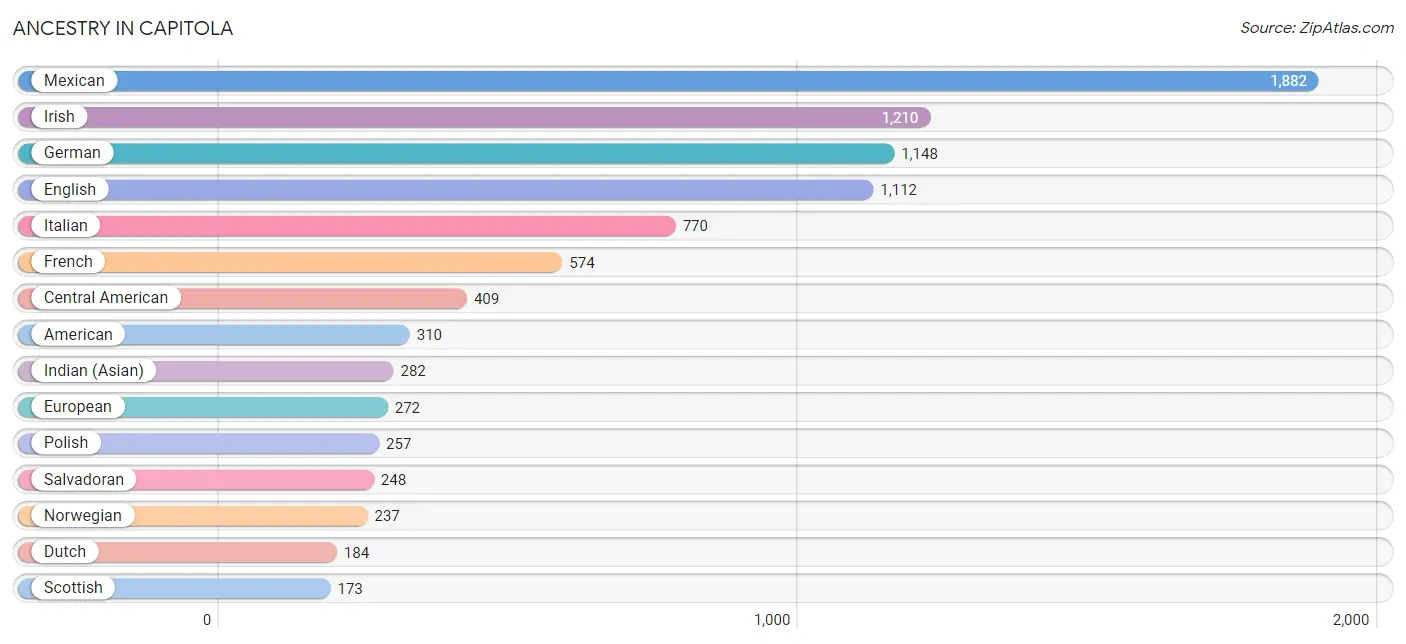
Ancestry in Capitola
The most populous ancestries reported in Capitola are Mexican (1,882 | 19.0%), Irish (1,210 | 12.2%), German (1,148 | 11.6%), English (1,112 | 11.2%), and Italian (770 | 7.8%), together accounting for 61.7% of all Capitola residents.
| Ancestry | # Population | % Population |
| African | 40 | 0.4% |
| American | 310 | 3.1% |
| Apache | 9 | 0.1% |
| Arab | 17 | 0.2% |
| Argentinean | 75 | 0.8% |
| Armenian | 27 | 0.3% |
| Assyrian / Chaldean / Syriac | 13 | 0.1% |
| Austrian | 43 | 0.4% |
| Bhutanese | 122 | 1.2% |
| Blackfeet | 17 | 0.2% |
| British | 132 | 1.3% |
| Burmese | 15 | 0.2% |
| Canadian | 7 | 0.1% |
| Central American | 409 | 4.1% |
| Cherokee | 123 | 1.2% |
| Chickasaw | 73 | 0.7% |
| Chilean | 4 | 0.0% |
| Choctaw | 47 | 0.5% |
| Comanche | 9 | 0.1% |
| Croatian | 16 | 0.2% |
| Cuban | 96 | 1.0% |
| Czech | 140 | 1.4% |
| Czechoslovakian | 11 | 0.1% |
| Danish | 90 | 0.9% |
| Dutch | 184 | 1.8% |
| Eastern European | 6 | 0.1% |
| English | 1,112 | 11.2% |
| European | 272 | 2.7% |
| Finnish | 16 | 0.2% |
| French | 574 | 5.8% |
| French Canadian | 23 | 0.2% |
| German | 1,148 | 11.6% |
| Greek | 85 | 0.9% |
| Hungarian | 40 | 0.4% |
| Indian (Asian) | 282 | 2.8% |
| Iranian | 27 | 0.3% |
| Irish | 1,210 | 12.2% |
| Italian | 770 | 7.8% |
| Korean | 166 | 1.7% |
| Lebanese | 17 | 0.2% |
| Mexican | 1,882 | 19.0% |
| Mexican American Indian | 8 | 0.1% |
| Native Hawaiian | 60 | 0.6% |
| Navajo | 13 | 0.1% |
| Nicaraguan | 72 | 0.7% |
| Northern European | 26 | 0.3% |
| Norwegian | 237 | 2.4% |
| Panamanian | 89 | 0.9% |
| Polish | 257 | 2.6% |
| Portuguese | 119 | 1.2% |
| Puerto Rican | 78 | 0.8% |
| Romanian | 22 | 0.2% |
| Russian | 76 | 0.8% |
| Salvadoran | 248 | 2.5% |
| Scandinavian | 60 | 0.6% |
| Scotch-Irish | 91 | 0.9% |
| Scottish | 173 | 1.7% |
| Serbian | 25 | 0.3% |
| Slavic | 18 | 0.2% |
| Slovak | 106 | 1.1% |
| South American | 79 | 0.8% |
| Spaniard | 31 | 0.3% |
| Spanish | 14 | 0.1% |
| Sri Lankan | 13 | 0.1% |
| Subsaharan African | 40 | 0.4% |
| Swedish | 169 | 1.7% |
| Thai | 155 | 1.6% |
| Ukrainian | 74 | 0.7% |
| Welsh | 134 | 1.3% | View All 69 Rows |
Immigrants in Capitola
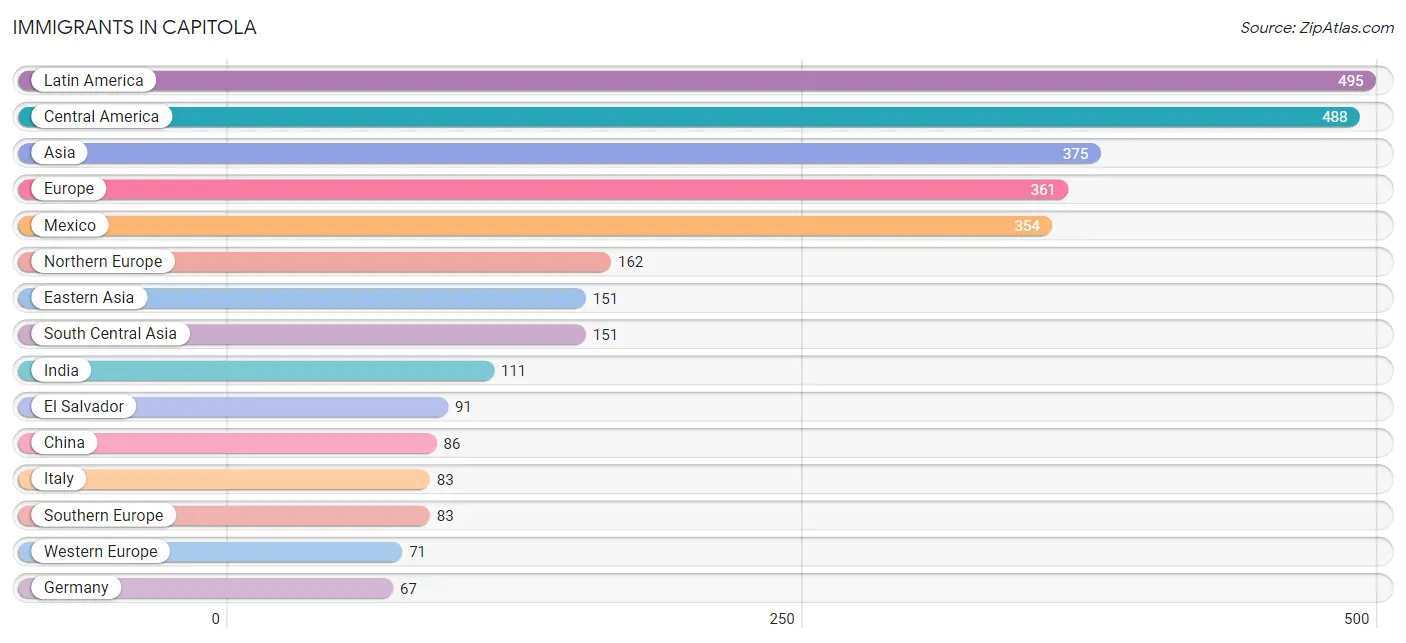
The most numerous immigrant groups reported in Capitola came from Latin America (495 | 5.0%), Central America (488 | 4.9%), Asia (375 | 3.8%), Europe (361 | 3.6%), and Mexico (354 | 3.6%), together accounting for 20.9% of all Capitola residents.
| Immigration Origin | # Population | % Population |
| Argentina | 3 | 0.0% |
| Armenia | 27 | 0.3% |
| Asia | 375 | 3.8% |
| Austria | 4 | 0.0% |
| Belarus | 28 | 0.3% |
| Canada | 12 | 0.1% |
| Central America | 488 | 4.9% |
| Chile | 4 | 0.0% |
| China | 86 | 0.9% |
| Eastern Asia | 151 | 1.5% |
| Eastern Europe | 45 | 0.4% |
| El Salvador | 91 | 0.9% |
| England | 4 | 0.0% |
| Europe | 361 | 3.6% |
| Germany | 67 | 0.7% |
| Guatemala | 6 | 0.1% |
| Hong Kong | 20 | 0.2% |
| India | 111 | 1.1% |
| Iran | 40 | 0.4% |
| Italy | 83 | 0.8% |
| Japan | 65 | 0.7% |
| Latin America | 495 | 5.0% |
| Mexico | 354 | 3.6% |
| Nicaragua | 37 | 0.4% |
| Northern Europe | 162 | 1.6% |
| Philippines | 33 | 0.3% |
| South America | 7 | 0.1% |
| South Central Asia | 151 | 1.5% |
| South Eastern Asia | 46 | 0.5% |
| Southern Europe | 83 | 0.8% |
| Sweden | 17 | 0.2% |
| Taiwan | 12 | 0.1% |
| Vietnam | 13 | 0.1% |
| Western Asia | 27 | 0.3% |
| Western Europe | 71 | 0.7% | View All 35 Rows |
Sex and Age in Capitola
Sex and Age in Capitola
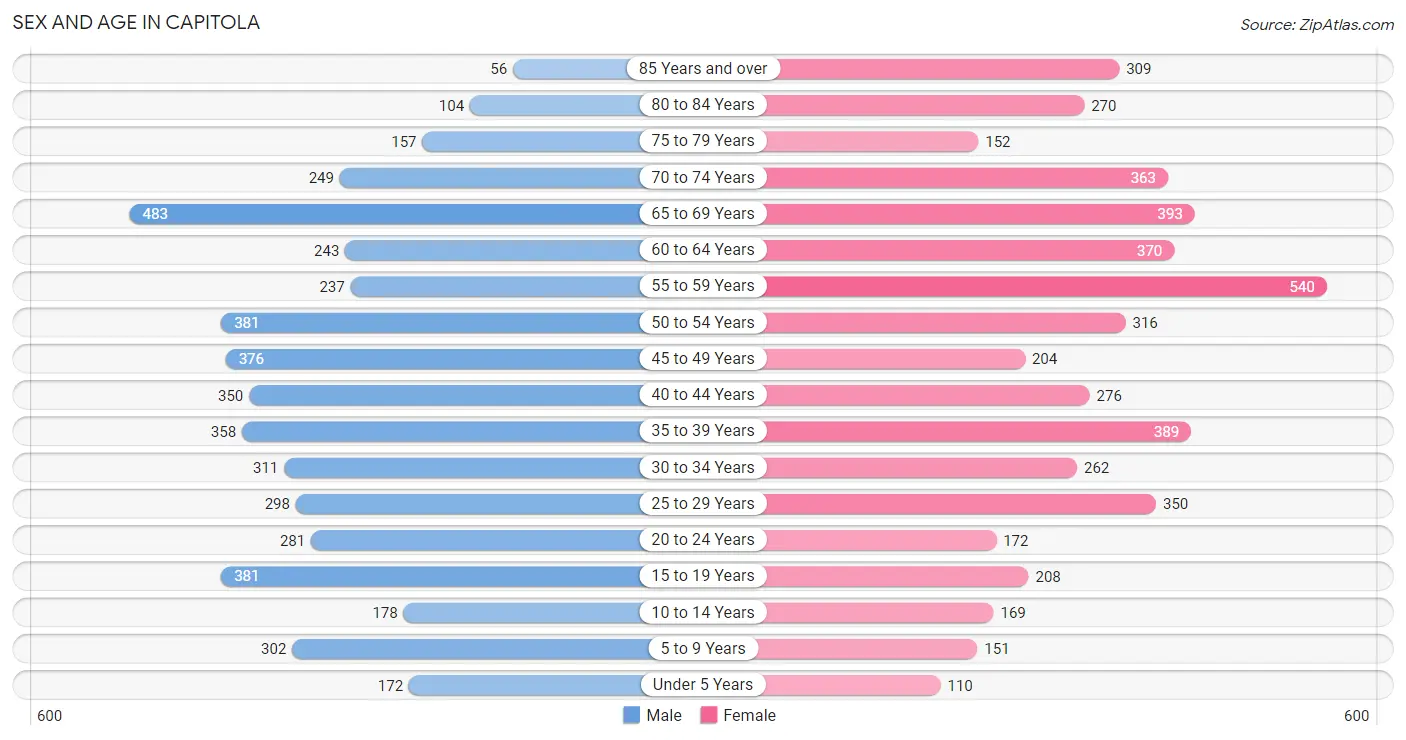
The most populous age groups in Capitola are 65 to 69 Years (483 | 9.8%) for men and 55 to 59 Years (540 | 10.8%) for women.
| Age Bracket | Male | Female |
| Under 5 Years | 172 (3.5%) | 110 (2.2%) |
| 5 to 9 Years | 302 (6.1%) | 151 (3.0%) |
| 10 to 14 Years | 178 (3.6%) | 169 (3.4%) |
| 15 to 19 Years | 381 (7.7%) | 208 (4.2%) |
| 20 to 24 Years | 281 (5.7%) | 172 (3.4%) |
| 25 to 29 Years | 298 (6.1%) | 350 (7.0%) |
| 30 to 34 Years | 311 (6.3%) | 262 (5.2%) |
| 35 to 39 Years | 358 (7.3%) | 389 (7.8%) |
| 40 to 44 Years | 350 (7.1%) | 276 (5.5%) |
| 45 to 49 Years | 376 (7.6%) | 204 (4.1%) |
| 50 to 54 Years | 381 (7.7%) | 316 (6.3%) |
| 55 to 59 Years | 237 (4.8%) | 540 (10.8%) |
| 60 to 64 Years | 243 (4.9%) | 370 (7.4%) |
| 65 to 69 Years | 483 (9.8%) | 393 (7.9%) |
| 70 to 74 Years | 249 (5.1%) | 363 (7.2%) |
| 75 to 79 Years | 157 (3.2%) | 152 (3.0%) |
| 80 to 84 Years | 104 (2.1%) | 270 (5.4%) |
| 85 Years and over | 56 (1.1%) | 309 (6.2%) |
| Total | 4,917 (100.0%) | 5,004 (100.0%) |
Families and Households in Capitola
Median Family Size in Capitola
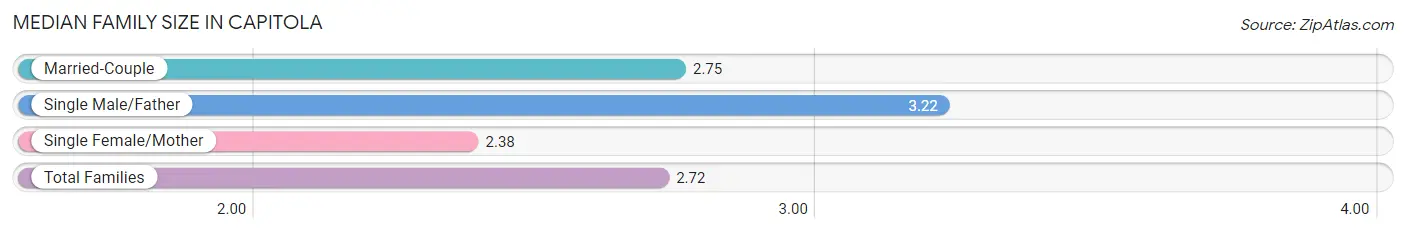
The median family size in Capitola is 2.72 persons per family, with single male/father families (205 | 8.8%) accounting for the largest median family size of 3.22 persons per family. On the other hand, single female/mother families (472 | 20.4%) represent the smallest median family size with 2.38 persons per family.
| Family Type | # Families | Family Size |
| Married-Couple | 1,639 (70.8%) | 2.75 |
| Single Male/Father | 205 (8.8%) | 3.22 |
| Single Female/Mother | 472 (20.4%) | 2.38 |
| Total Families | 2,316 (100.0%) | 2.72 |
Median Household Size in Capitola
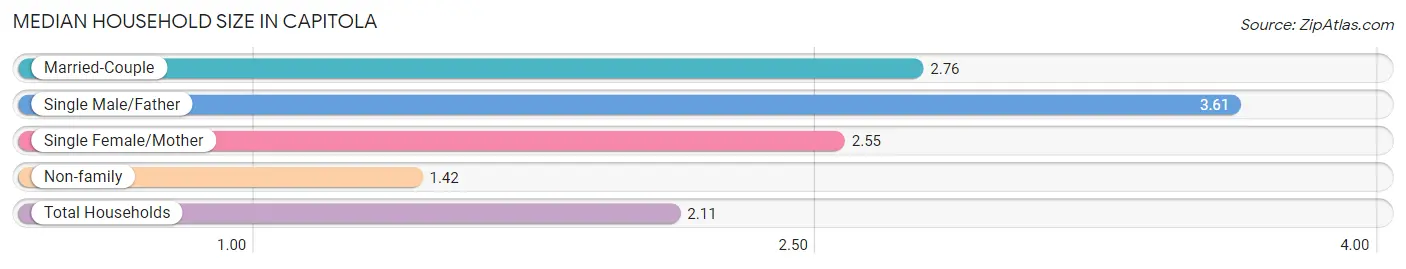
The median household size in Capitola is 2.11 persons per household, with single male/father households (205 | 4.5%) accounting for the largest median household size of 3.61 persons per household. non-family households (2,272 | 49.5%) represent the smallest median household size with 1.42 persons per household.
| Household Type | # Households | Household Size |
| Married-Couple | 1,639 (35.7%) | 2.76 |
| Single Male/Father | 205 (4.5%) | 3.61 |
| Single Female/Mother | 472 (10.3%) | 2.55 |
| Non-family | 2,272 (49.5%) | 1.42 |
| Total Households | 4,588 (100.0%) | 2.11 |
Household Size by Marriage Status in Capitola
Out of a total of 4,588 households in Capitola, 2,316 (50.5%) are family households, while 2,272 (49.5%) are nonfamily households. The most numerous type of family households are 2-person households, comprising 1,328, and the most common type of nonfamily households are 1-person households, comprising 1,581.
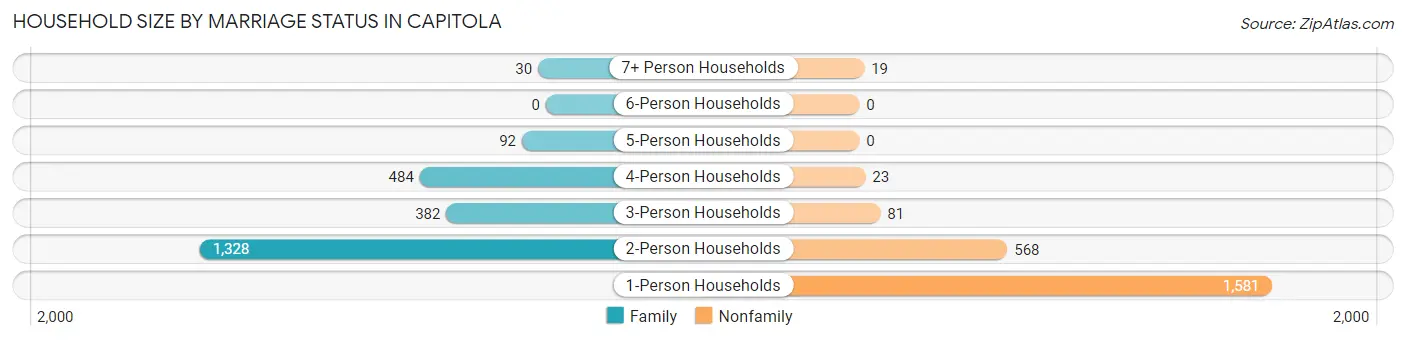
| Household Size | Family Households | Nonfamily Households |
| 1-Person Households | - | 1,581 (34.5%) |
| 2-Person Households | 1,328 (28.9%) | 568 (12.4%) |
| 3-Person Households | 382 (8.3%) | 81 (1.8%) |
| 4-Person Households | 484 (10.5%) | 23 (0.5%) |
| 5-Person Households | 92 (2.0%) | 0 (0.0%) |
| 6-Person Households | 0 (0.0%) | 0 (0.0%) |
| 7+ Person Households | 30 (0.6%) | 19 (0.4%) |
| Total | 2,316 (50.5%) | 2,272 (49.5%) |
Female Fertility in Capitola
Fertility by Age in Capitola
Average fertility rate in Capitola is 18.0 births per 1,000 women. Women in the age bracket of 35 to 50 years have the highest fertility rate with 36.0 births per 1,000 women. Women in the age bracket of 35 to 50 years acount for 100.0% of all women with births.
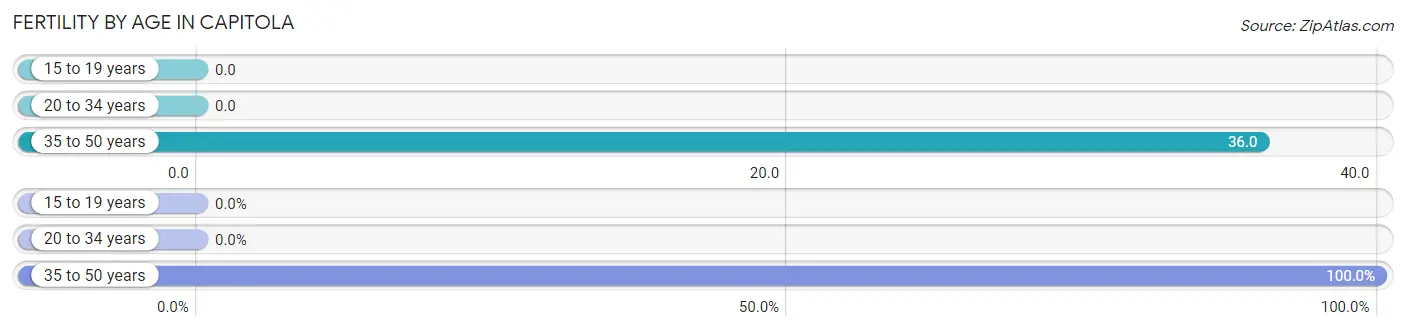
| Age Bracket | Women with Births | Births / 1,000 Women |
| 15 to 19 years | 0 (0.0%) | 0.0 |
| 20 to 34 years | 0 (0.0%) | 0.0 |
| 35 to 50 years | 35 (100.0%) | 36.0 |
| Total | 35 (100.0%) | 18.0 |
Fertility by Age by Marriage Status in Capitola
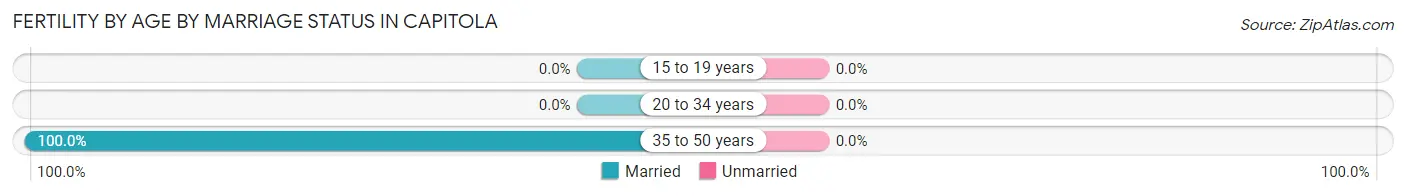
| Age Bracket | Married | Unmarried |
| 15 to 19 years | 0 (0.0%) | 0 (0.0%) |
| 20 to 34 years | 0 (0.0%) | 0 (0.0%) |
| 35 to 50 years | 35 (100.0%) | 0 (0.0%) |
| Total | 35 (100.0%) | 0 (0.0%) |
Fertility by Education in Capitola
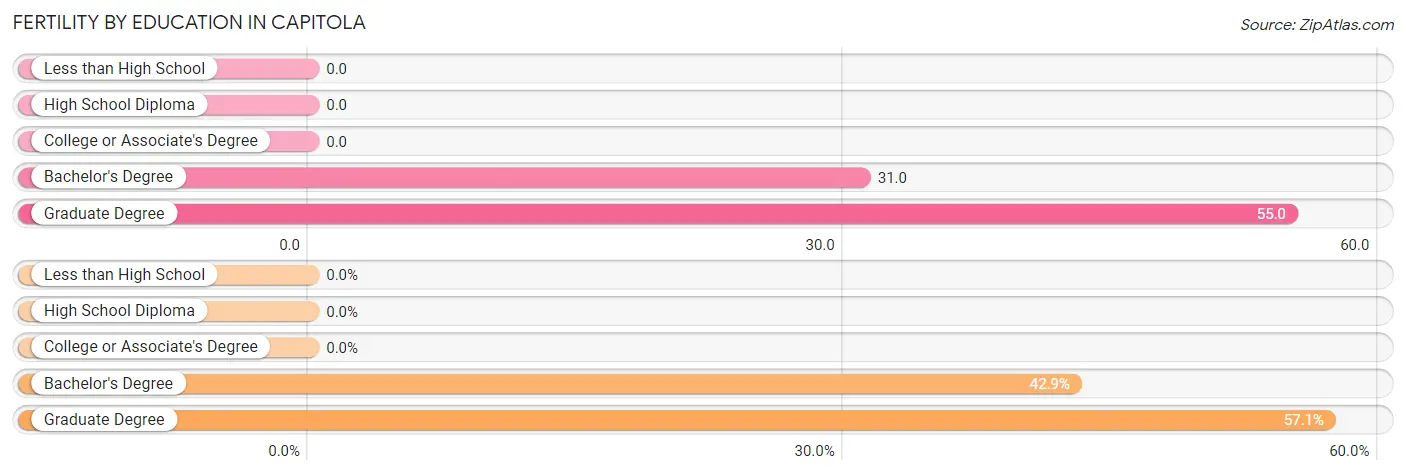
| Educational Attainment | Women with Births | Births / 1,000 Women |
| Less than High School | 0 (0.0%) | 0.0 |
| High School Diploma | 0 (0.0%) | 0.0 |
| College or Associate's Degree | 0 (0.0%) | 0.0 |
| Bachelor's Degree | 15 (42.9%) | 31.0 |
| Graduate Degree | 20 (57.1%) | 55.0 |
| Total | 35 (100.0%) | 18.0 |
Fertility by Education by Marriage Status in Capitola
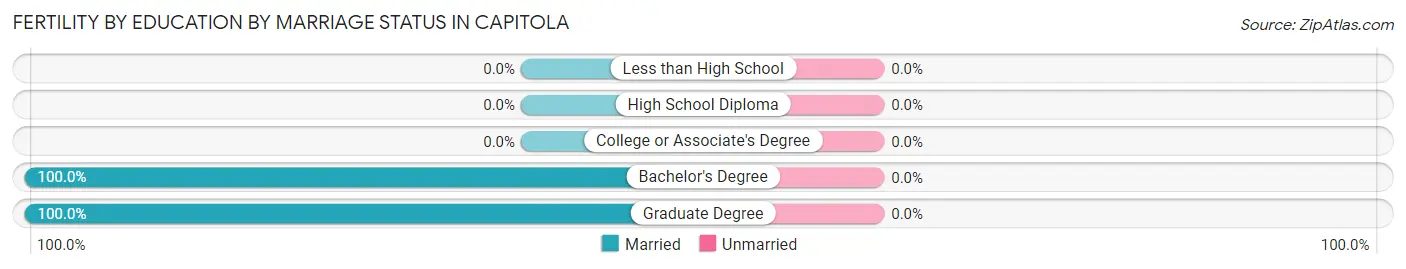
| Educational Attainment | Married | Unmarried |
| Less than High School | 0 (0.0%) | 0 (0.0%) |
| High School Diploma | 0 (0.0%) | 0 (0.0%) |
| College or Associate's Degree | 0 (0.0%) | 0 (0.0%) |
| Bachelor's Degree | 15 (100.0%) | 0 (0.0%) |
| Graduate Degree | 20 (100.0%) | 0 (0.0%) |
| Total | 35 (100.0%) | 0 (0.0%) |
Employment Characteristics in Capitola
Employment by Class of Employer in Capitola
Among the 5,071 employed individuals in Capitola, private company employees (3,120 | 61.5%), local government employees (571 | 11.3%), and self-employed (not incorporated) (539 | 10.6%) make up the most common classes of employment.
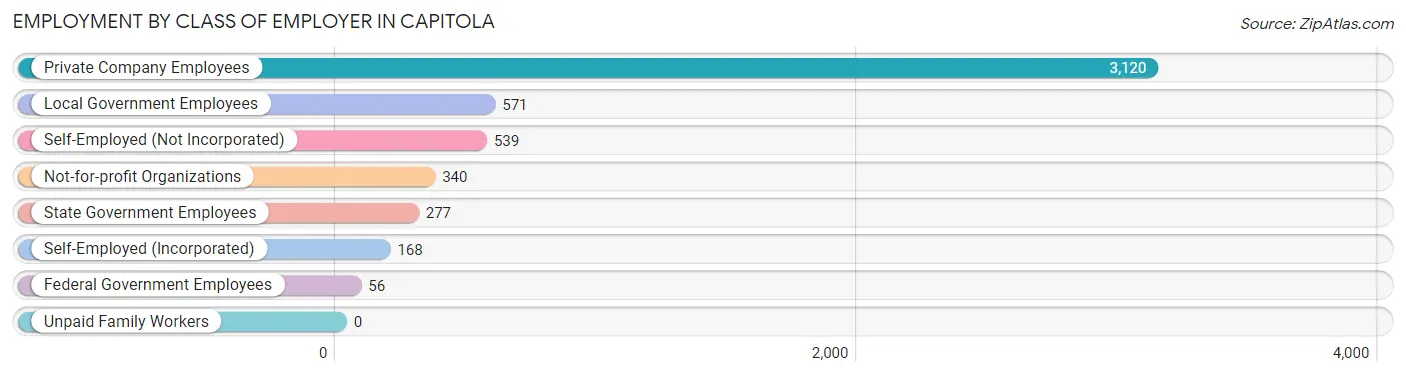
| Employer Class | # Employees | % Employees |
| Private Company Employees | 3,120 | 61.5% |
| Self-Employed (Incorporated) | 168 | 3.3% |
| Self-Employed (Not Incorporated) | 539 | 10.6% |
| Not-for-profit Organizations | 340 | 6.7% |
| Local Government Employees | 571 | 11.3% |
| State Government Employees | 277 | 5.5% |
| Federal Government Employees | 56 | 1.1% |
| Unpaid Family Workers | 0 | 0.0% |
| Total | 5,071 | 100.0% |
Employment Status by Age in Capitola
According to the labor force statistics for Capitola, out of the total population over 16 years of age (8,705), 61.5% or 5,354 individuals are in the labor force, with 2.0% or 107 of them unemployed. The age group with the highest labor force participation rate is 25 to 29 years, with 90.1% or 584 individuals in the labor force. Within the labor force, the 65 to 74 years age range has the highest percentage of unemployed individuals, with 11.1% or 60 of them being unemployed.
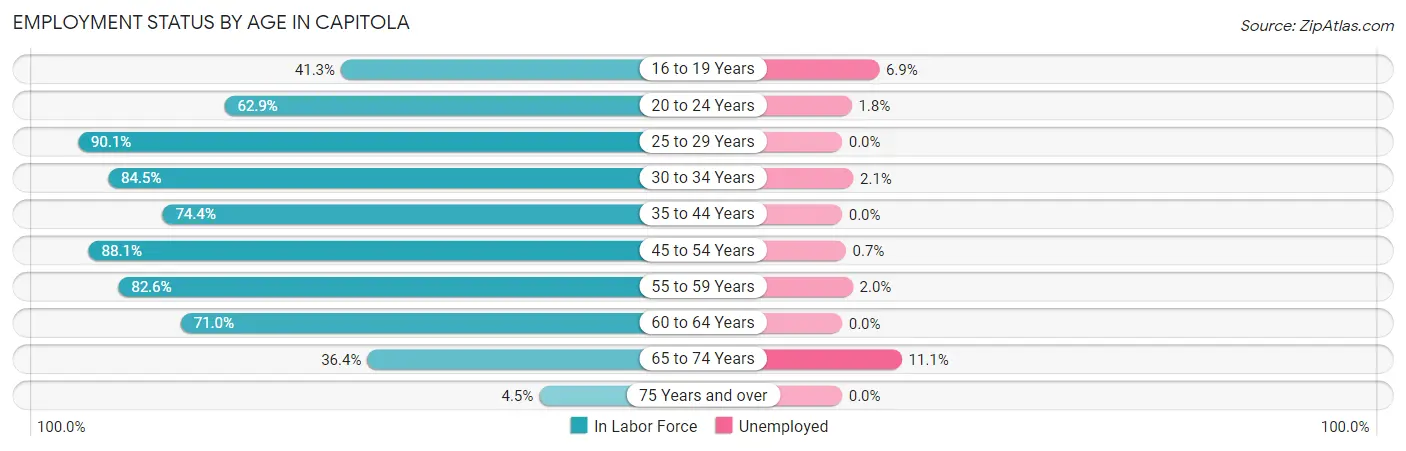
| Age Bracket | In Labor Force | Unemployed |
| 16 to 19 Years | 188 (41.3%) | 13 (6.9%) |
| 20 to 24 Years | 285 (62.9%) | 5 (1.8%) |
| 25 to 29 Years | 584 (90.1%) | 0 (0.0%) |
| 30 to 34 Years | 484 (84.5%) | 10 (2.1%) |
| 35 to 44 Years | 1,022 (74.4%) | 0 (0.0%) |
| 45 to 54 Years | 1,125 (88.1%) | 8 (0.7%) |
| 55 to 59 Years | 642 (82.6%) | 13 (2.0%) |
| 60 to 64 Years | 435 (71.0%) | 0 (0.0%) |
| 65 to 74 Years | 542 (36.4%) | 60 (11.1%) |
| 75 Years and over | 47 (4.5%) | 0 (0.0%) |
| Total | 5,354 (61.5%) | 107 (2.0%) |
Employment Status by Educational Attainment in Capitola
According to labor force statistics for Capitola, 81.6% of individuals (4,293) out of the total population between 25 and 64 years of age (5,261) are in the labor force, with 0.7% or 30 of them being unemployed. The group with the highest labor force participation rate are those with the educational attainment of bachelor's degree or higher, with 88.7% or 2,370 individuals in the labor force. Within the labor force, individuals with less than high school education have the highest percentage of unemployment, with 4.6% or 13 of them being unemployed.
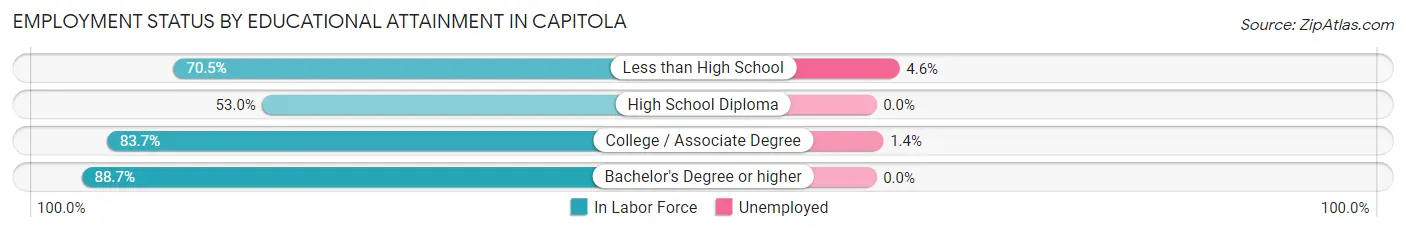
| Educational Attainment | In Labor Force | Unemployed |
| Less than High School | 282 (70.5%) | 18 (4.6%) |
| High School Diploma | 332 (53.0%) | 0 (0.0%) |
| College / Associate Degree | 1,308 (83.7%) | 22 (1.4%) |
| Bachelor's Degree or higher | 2,370 (88.7%) | 0 (0.0%) |
| Total | 4,293 (81.6%) | 37 (0.7%) |
Employment Occupations by Sex in Capitola
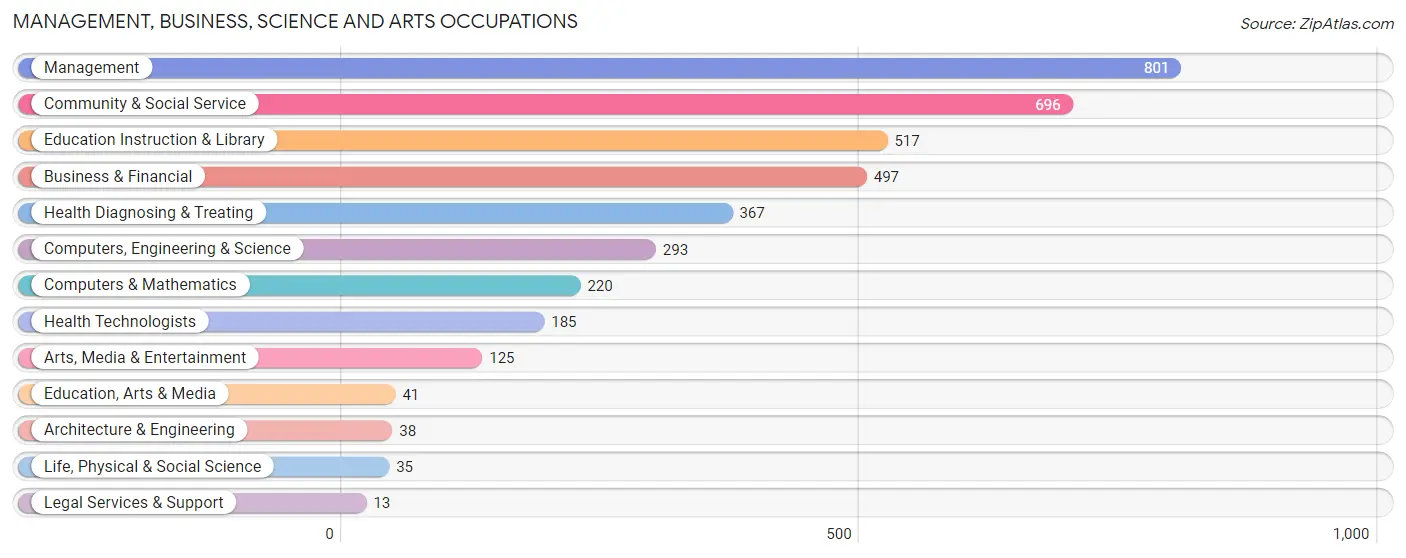
Management, Business, Science and Arts Occupations
The most common Management, Business, Science and Arts occupations in Capitola are Management (801 | 15.3%), Community & Social Service (696 | 13.3%), Education Instruction & Library (517 | 9.9%), Business & Financial (497 | 9.5%), and Health Diagnosing & Treating (367 | 7.0%).
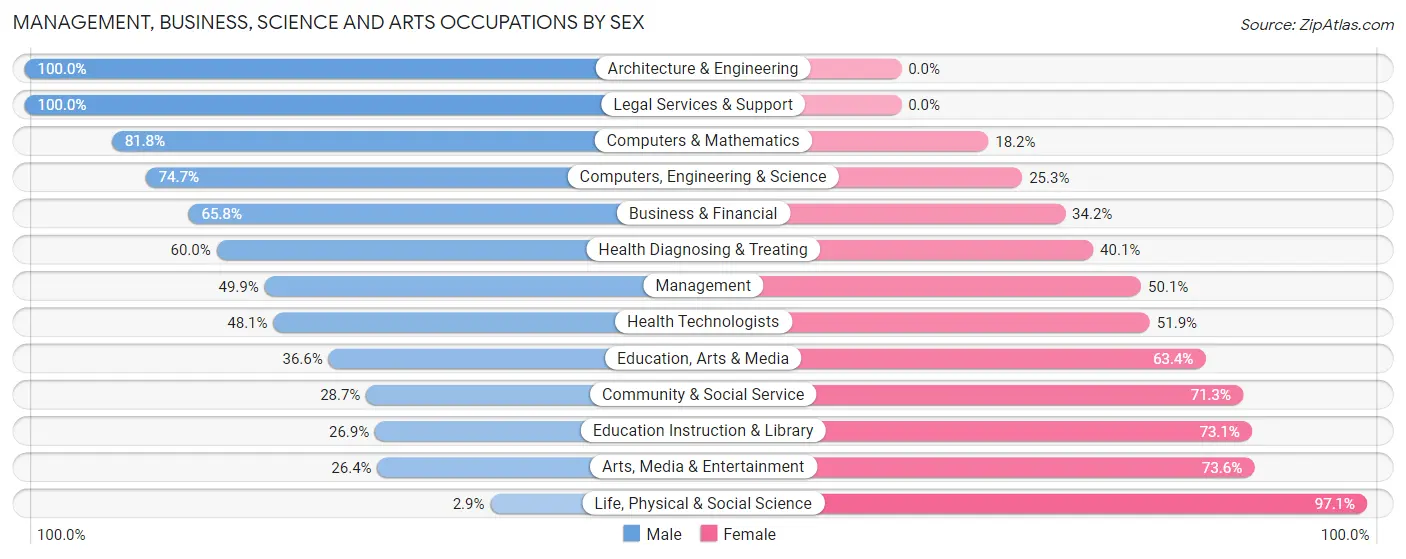
Management, Business, Science and Arts Occupations by Sex
Within the Management, Business, Science and Arts occupations in Capitola, the most male-oriented occupations are Architecture & Engineering (100.0%), Legal Services & Support (100.0%), and Computers & Mathematics (81.8%), while the most female-oriented occupations are Life, Physical & Social Science (97.1%), Arts, Media & Entertainment (73.6%), and Education Instruction & Library (73.1%).
| Occupation | Male | Female |
| Management | 400 (49.9%) | 401 (50.1%) |
| Business & Financial | 327 (65.8%) | 170 (34.2%) |
| Computers, Engineering & Science | 219 (74.7%) | 74 (25.3%) |
| Computers & Mathematics | 180 (81.8%) | 40 (18.2%) |
| Architecture & Engineering | 38 (100.0%) | 0 (0.0%) |
| Life, Physical & Social Science | 1 (2.9%) | 34 (97.1%) |
| Community & Social Service | 200 (28.7%) | 496 (71.3%) |
| Education, Arts & Media | 15 (36.6%) | 26 (63.4%) |
| Legal Services & Support | 13 (100.0%) | 0 (0.0%) |
| Education Instruction & Library | 139 (26.9%) | 378 (73.1%) |
| Arts, Media & Entertainment | 33 (26.4%) | 92 (73.6%) |
| Health Diagnosing & Treating | 220 (60.0%) | 147 (40.1%) |
| Health Technologists | 89 (48.1%) | 96 (51.9%) |
| Total (Category) | 1,366 (51.5%) | 1,288 (48.5%) |
| Total (Overall) | 2,650 (50.5%) | 2,595 (49.5%) |
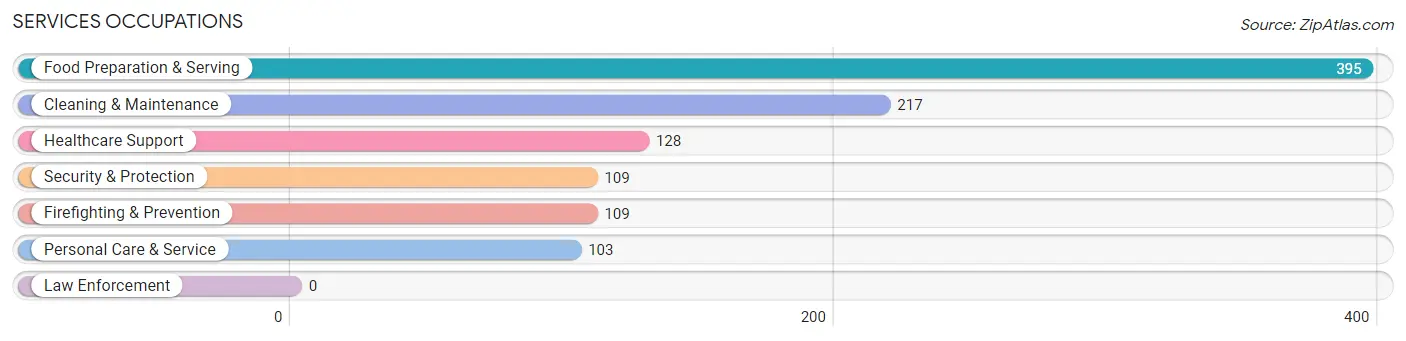
Services Occupations
The most common Services occupations in Capitola are Food Preparation & Serving (395 | 7.5%), Cleaning & Maintenance (217 | 4.1%), Healthcare Support (128 | 2.4%), Security & Protection (109 | 2.1%), and Firefighting & Prevention (109 | 2.1%).
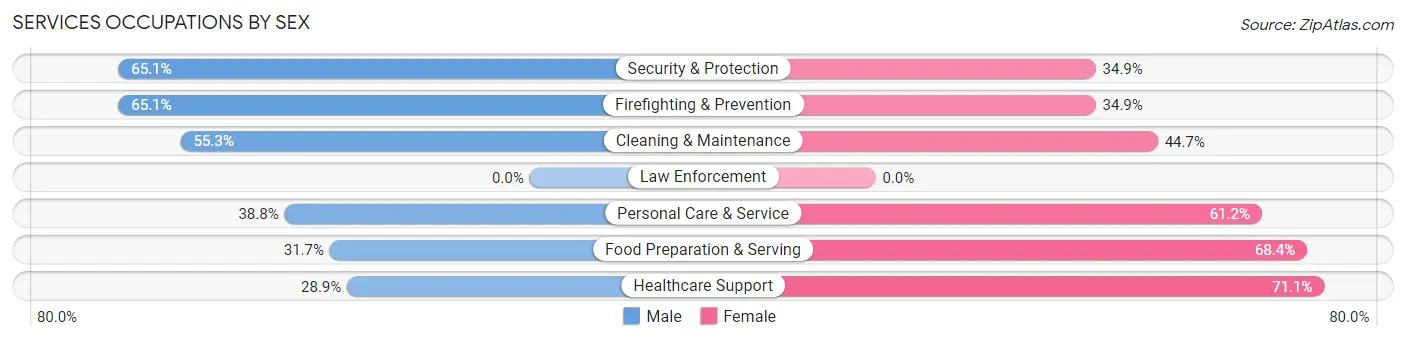
Services Occupations by Sex
Within the Services occupations in Capitola, the most male-oriented occupations are Security & Protection (65.1%), Firefighting & Prevention (65.1%), and Cleaning & Maintenance (55.3%), while the most female-oriented occupations are Healthcare Support (71.1%), Food Preparation & Serving (68.3%), and Personal Care & Service (61.2%).
| Occupation | Male | Female |
| Healthcare Support | 37 (28.9%) | 91 (71.1%) |
| Security & Protection | 71 (65.1%) | 38 (34.9%) |
| Firefighting & Prevention | 71 (65.1%) | 38 (34.9%) |
| Law Enforcement | 0 (0.0%) | 0 (0.0%) |
| Food Preparation & Serving | 125 (31.7%) | 270 (68.3%) |
| Cleaning & Maintenance | 120 (55.3%) | 97 (44.7%) |
| Personal Care & Service | 40 (38.8%) | 63 (61.2%) |
| Total (Category) | 393 (41.3%) | 559 (58.7%) |
| Total (Overall) | 2,650 (50.5%) | 2,595 (49.5%) |
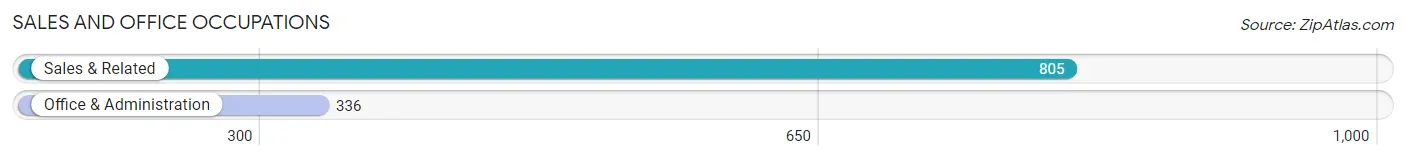
Sales and Office Occupations
The most common Sales and Office occupations in Capitola are Sales & Related (805 | 15.3%), and Office & Administration (336 | 6.4%).
Sales and Office Occupations by Sex
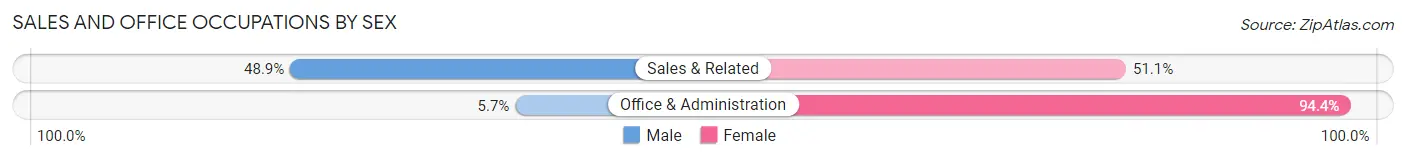
| Occupation | Male | Female |
| Sales & Related | 394 (48.9%) | 411 (51.1%) |
| Office & Administration | 19 (5.7%) | 317 (94.4%) |
| Total (Category) | 413 (36.2%) | 728 (63.8%) |
| Total (Overall) | 2,650 (50.5%) | 2,595 (49.5%) |
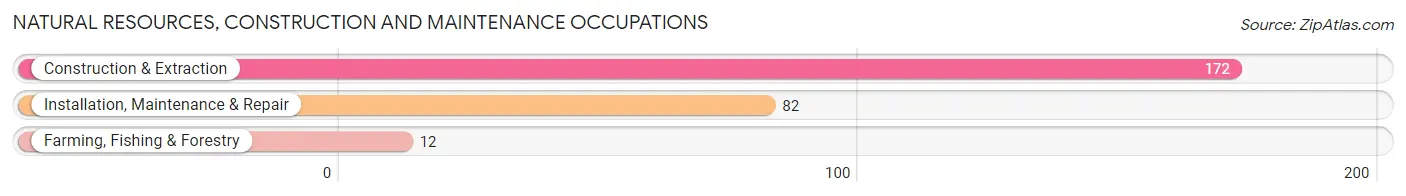
Natural Resources, Construction and Maintenance Occupations
The most common Natural Resources, Construction and Maintenance occupations in Capitola are Construction & Extraction (172 | 3.3%), Installation, Maintenance & Repair (82 | 1.6%), and Farming, Fishing & Forestry (12 | 0.2%).
Natural Resources, Construction and Maintenance Occupations by Sex
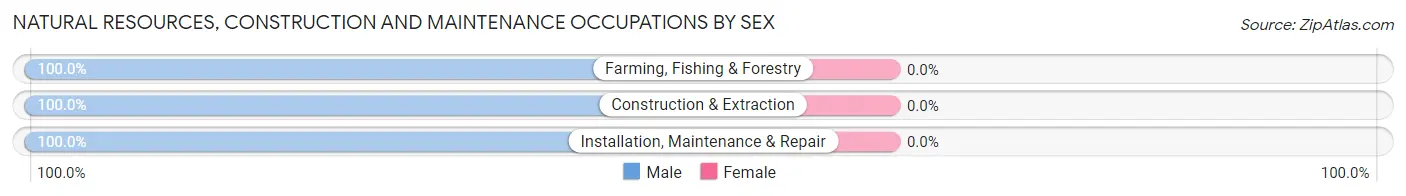
| Occupation | Male | Female |
| Farming, Fishing & Forestry | 12 (100.0%) | 0 (0.0%) |
| Construction & Extraction | 172 (100.0%) | 0 (0.0%) |
| Installation, Maintenance & Repair | 82 (100.0%) | 0 (0.0%) |
| Total (Category) | 266 (100.0%) | 0 (0.0%) |
| Total (Overall) | 2,650 (50.5%) | 2,595 (49.5%) |
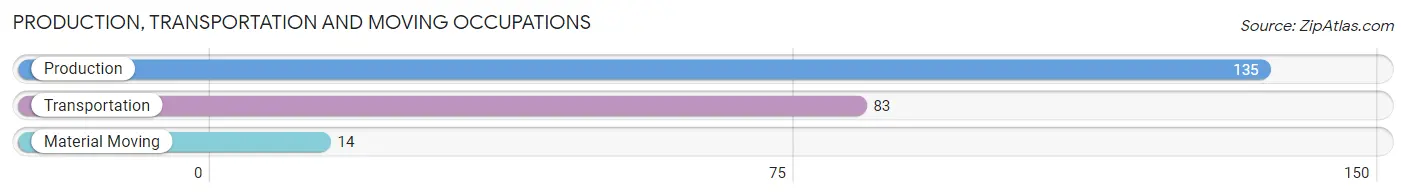
Production, Transportation and Moving Occupations
The most common Production, Transportation and Moving occupations in Capitola are Production (135 | 2.6%), Transportation (83 | 1.6%), and Material Moving (14 | 0.3%).
Production, Transportation and Moving Occupations by Sex
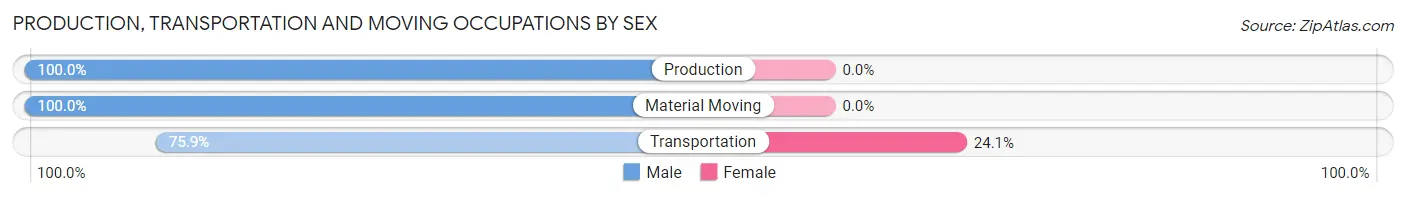
| Occupation | Male | Female |
| Production | 135 (100.0%) | 0 (0.0%) |
| Transportation | 63 (75.9%) | 20 (24.1%) |
| Material Moving | 14 (100.0%) | 0 (0.0%) |
| Total (Category) | 212 (91.4%) | 20 (8.6%) |
| Total (Overall) | 2,650 (50.5%) | 2,595 (49.5%) |
Employment Industries by Sex in Capitola
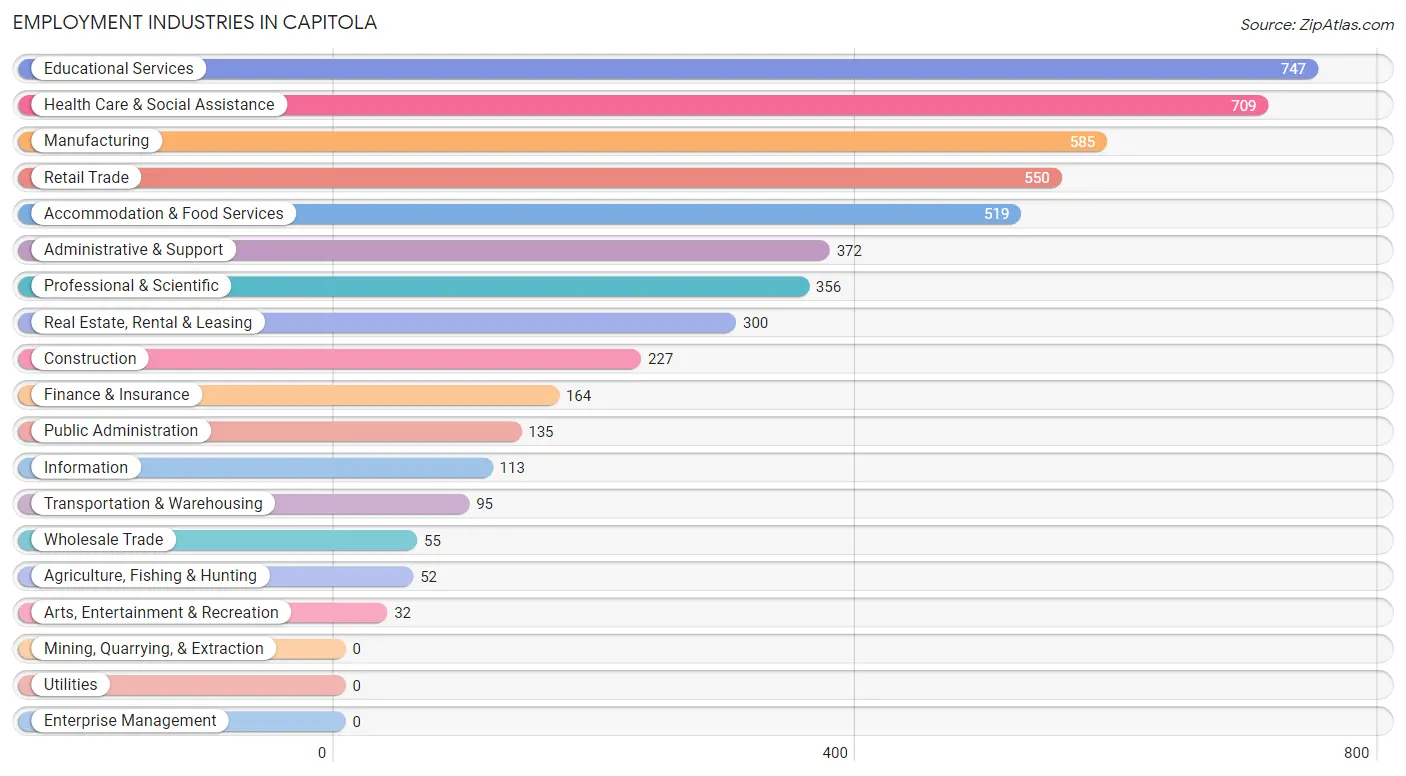
Employment Industries in Capitola
The major employment industries in Capitola include Educational Services (747 | 14.2%), Health Care & Social Assistance (709 | 13.5%), Manufacturing (585 | 11.2%), Retail Trade (550 | 10.5%), and Accommodation & Food Services (519 | 9.9%).
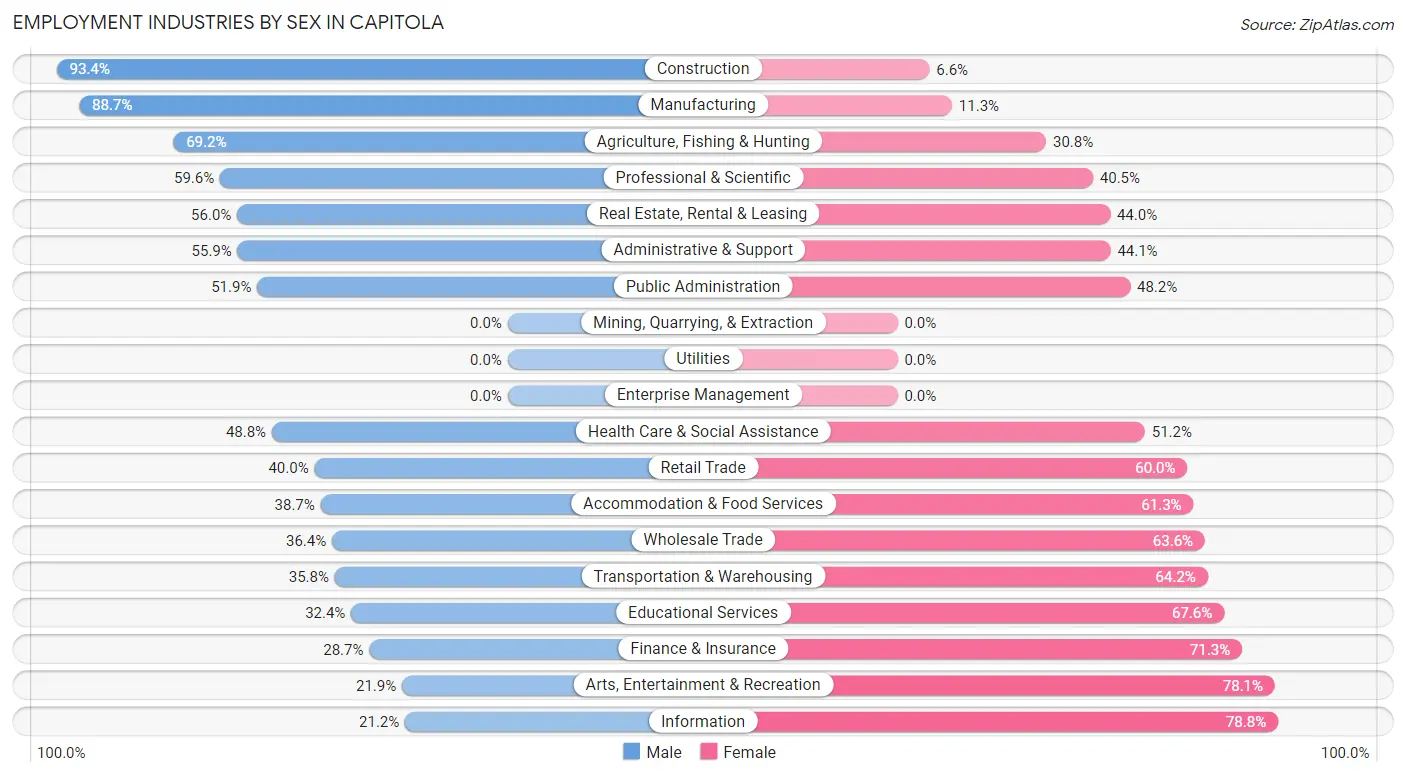
Employment Industries by Sex in Capitola
The Capitola industries that see more men than women are Construction (93.4%), Manufacturing (88.7%), and Agriculture, Fishing & Hunting (69.2%), whereas the industries that tend to have a higher number of women are Information (78.8%), Arts, Entertainment & Recreation (78.1%), and Finance & Insurance (71.3%).
| Industry | Male | Female |
| Agriculture, Fishing & Hunting | 36 (69.2%) | 16 (30.8%) |
| Mining, Quarrying, & Extraction | 0 (0.0%) | 0 (0.0%) |
| Construction | 212 (93.4%) | 15 (6.6%) |
| Manufacturing | 519 (88.7%) | 66 (11.3%) |
| Wholesale Trade | 20 (36.4%) | 35 (63.6%) |
| Retail Trade | 220 (40.0%) | 330 (60.0%) |
| Transportation & Warehousing | 34 (35.8%) | 61 (64.2%) |
| Utilities | 0 (0.0%) | 0 (0.0%) |
| Information | 24 (21.2%) | 89 (78.8%) |
| Finance & Insurance | 47 (28.7%) | 117 (71.3%) |
| Real Estate, Rental & Leasing | 168 (56.0%) | 132 (44.0%) |
| Professional & Scientific | 212 (59.6%) | 144 (40.5%) |
| Enterprise Management | 0 (0.0%) | 0 (0.0%) |
| Administrative & Support | 208 (55.9%) | 164 (44.1%) |
| Educational Services | 242 (32.4%) | 505 (67.6%) |
| Health Care & Social Assistance | 346 (48.8%) | 363 (51.2%) |
| Arts, Entertainment & Recreation | 7 (21.9%) | 25 (78.1%) |
| Accommodation & Food Services | 201 (38.7%) | 318 (61.3%) |
| Public Administration | 70 (51.8%) | 65 (48.1%) |
| Total | 2,650 (50.5%) | 2,595 (49.5%) |
Education in Capitola
School Enrollment in Capitola
The most common levels of schooling among the 2,282 students in Capitola are college / undergraduate (708 | 31.0%), high school (437 | 19.2%), and elementary school (396 | 17.3%).
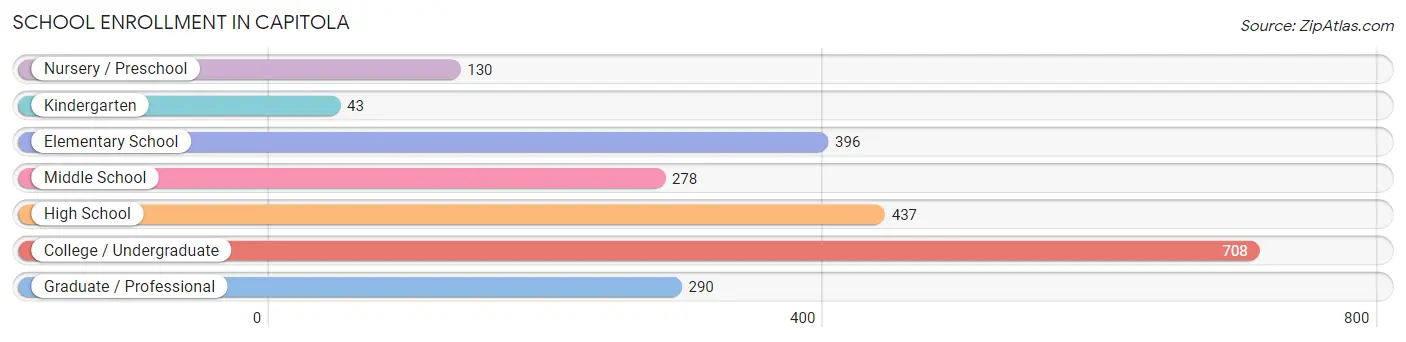
| School Level | # Students | % Students |
| Nursery / Preschool | 130 | 5.7% |
| Kindergarten | 43 | 1.9% |
| Elementary School | 396 | 17.3% |
| Middle School | 278 | 12.2% |
| High School | 437 | 19.2% |
| College / Undergraduate | 708 | 31.0% |
| Graduate / Professional | 290 | 12.7% |
| Total | 2,282 | 100.0% |
School Enrollment by Age by Funding Source in Capitola
Out of a total of 2,282 students who are enrolled in schools in Capitola, 340 (14.9%) attend a private institution, while the remaining 1,942 (85.1%) are enrolled in public schools. The age group of 3 to 4 year olds has the highest likelihood of being enrolled in private schools, with 65 (57.0% in the age bracket) enrolled. Conversely, the age group of 18 to 19 year olds has the lowest likelihood of being enrolled in a private school, with 198 (100.0% in the age bracket) attending a public institution.
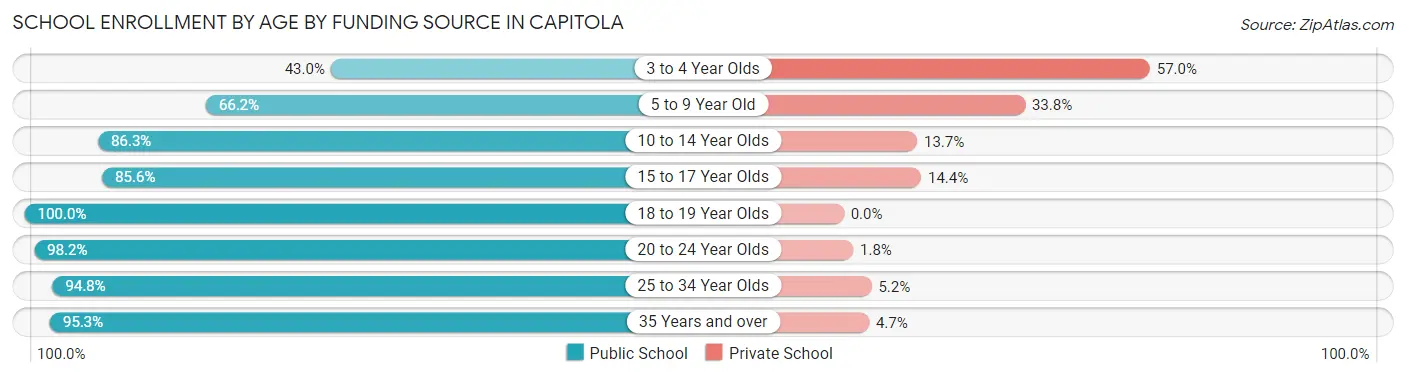
| Age Bracket | Public School | Private School |
| 3 to 4 Year Olds | 49 (43.0%) | 65 (57.0%) |
| 5 to 9 Year Old | 300 (66.2%) | 153 (33.8%) |
| 10 to 14 Year Olds | 259 (86.3%) | 41 (13.7%) |
| 15 to 17 Year Olds | 273 (85.6%) | 46 (14.4%) |
| 18 to 19 Year Olds | 198 (100.0%) | 0 (0.0%) |
| 20 to 24 Year Olds | 279 (98.2%) | 5 (1.8%) |
| 25 to 34 Year Olds | 421 (94.8%) | 23 (5.2%) |
| 35 Years and over | 162 (95.3%) | 8 (4.7%) |
| Total | 1,942 (85.1%) | 340 (14.9%) |
Educational Attainment by Field of Study in Capitola
Business (555 | 14.3%), social sciences (441 | 11.3%), engineering (383 | 9.8%), arts & humanities (343 | 8.8%), and visual & performing arts (316 | 8.1%) are the most common fields of study among 3,892 individuals in Capitola who have obtained a bachelor's degree or higher.
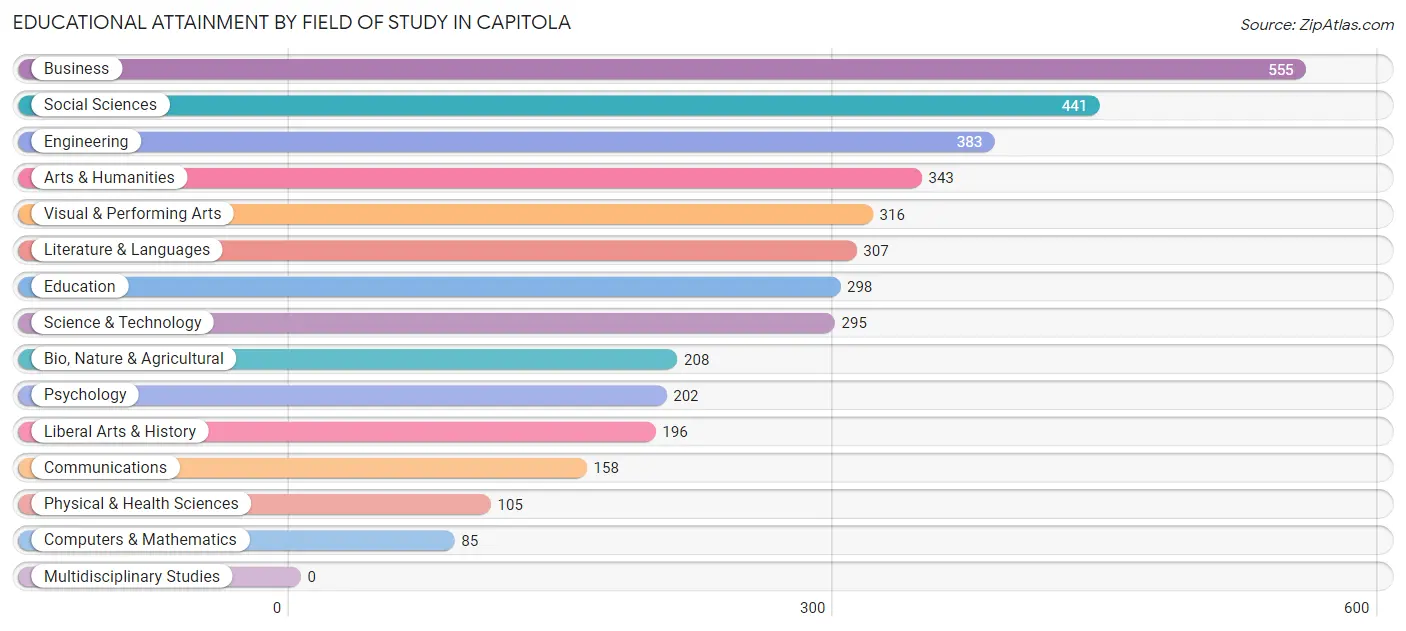
| Field of Study | # Graduates | % Graduates |
| Computers & Mathematics | 85 | 2.2% |
| Bio, Nature & Agricultural | 208 | 5.3% |
| Physical & Health Sciences | 105 | 2.7% |
| Psychology | 202 | 5.2% |
| Social Sciences | 441 | 11.3% |
| Engineering | 383 | 9.8% |
| Multidisciplinary Studies | 0 | 0.0% |
| Science & Technology | 295 | 7.6% |
| Business | 555 | 14.3% |
| Education | 298 | 7.7% |
| Literature & Languages | 307 | 7.9% |
| Liberal Arts & History | 196 | 5.0% |
| Visual & Performing Arts | 316 | 8.1% |
| Communications | 158 | 4.1% |
| Arts & Humanities | 343 | 8.8% |
| Total | 3,892 | 100.0% |
Transportation & Commute in Capitola
Vehicle Availability by Sex in Capitola
The most prevalent vehicle ownership categories in Capitola are males with 2 vehicles (1,480, accounting for 57.2%) and females with 2 vehicles (1,471, making up 59.9%).
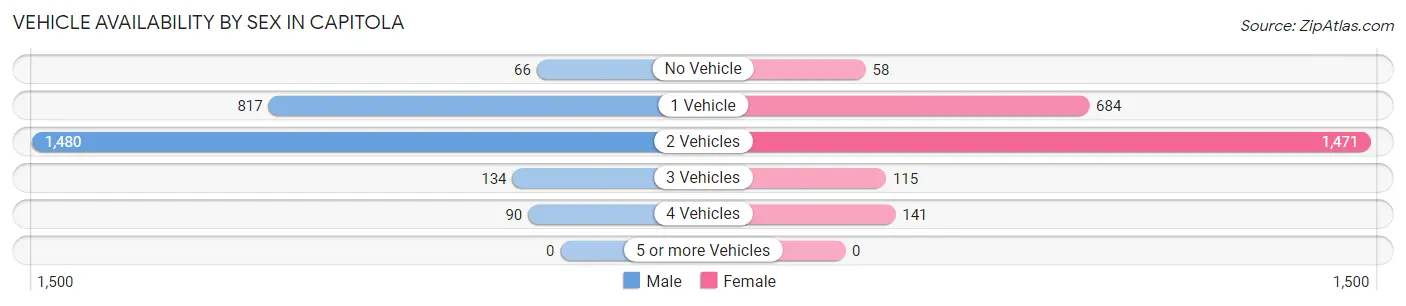
| Vehicles Available | Male | Female |
| No Vehicle | 66 (2.5%) | 58 (2.4%) |
| 1 Vehicle | 817 (31.6%) | 684 (27.7%) |
| 2 Vehicles | 1,480 (57.2%) | 1,471 (59.6%) |
| 3 Vehicles | 134 (5.2%) | 115 (4.7%) |
| 4 Vehicles | 90 (3.5%) | 141 (5.7%) |
| 5 or more Vehicles | 0 (0.0%) | 0 (0.0%) |
| Total | 2,587 (100.0%) | 2,469 (100.0%) |
Commute Time in Capitola
The most frequently occuring commute durations in Capitola are 15 to 19 minutes (751 commuters, 19.9%), 10 to 14 minutes (511 commuters, 13.5%), and 5 to 9 minutes (497 commuters, 13.2%).
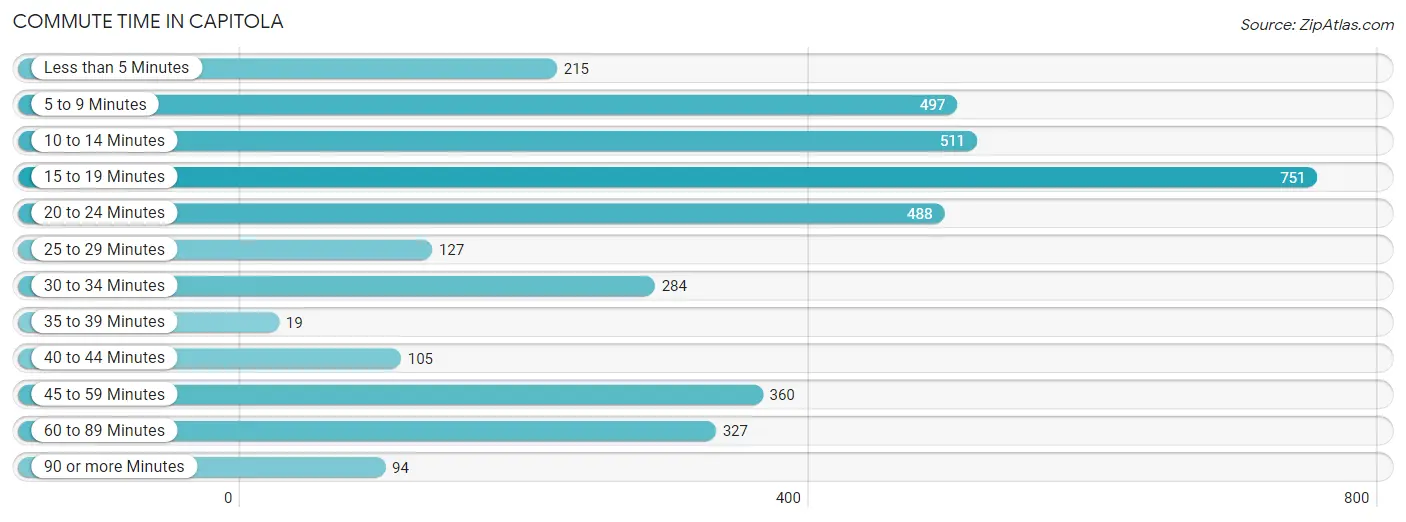
| Commute Time | # Commuters | % Commuters |
| Less than 5 Minutes | 215 | 5.7% |
| 5 to 9 Minutes | 497 | 13.2% |
| 10 to 14 Minutes | 511 | 13.5% |
| 15 to 19 Minutes | 751 | 19.9% |
| 20 to 24 Minutes | 488 | 12.9% |
| 25 to 29 Minutes | 127 | 3.4% |
| 30 to 34 Minutes | 284 | 7.5% |
| 35 to 39 Minutes | 19 | 0.5% |
| 40 to 44 Minutes | 105 | 2.8% |
| 45 to 59 Minutes | 360 | 9.5% |
| 60 to 89 Minutes | 327 | 8.7% |
| 90 or more Minutes | 94 | 2.5% |
Commute Time by Sex in Capitola
The most common commute times in Capitola are 15 to 19 minutes (444 commuters, 21.8%) for males and 5 to 9 minutes (322 commuters, 18.5%) for females.
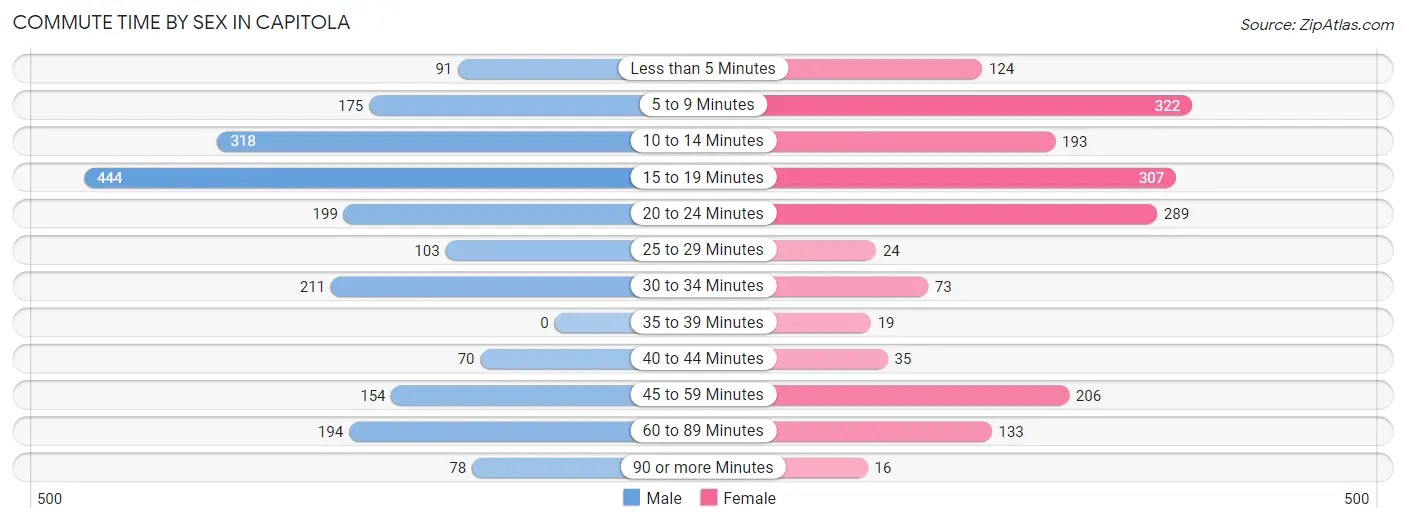
| Commute Time | Male | Female |
| Less than 5 Minutes | 91 (4.5%) | 124 (7.1%) |
| 5 to 9 Minutes | 175 (8.6%) | 322 (18.5%) |
| 10 to 14 Minutes | 318 (15.6%) | 193 (11.1%) |
| 15 to 19 Minutes | 444 (21.8%) | 307 (17.6%) |
| 20 to 24 Minutes | 199 (9.8%) | 289 (16.6%) |
| 25 to 29 Minutes | 103 (5.1%) | 24 (1.4%) |
| 30 to 34 Minutes | 211 (10.4%) | 73 (4.2%) |
| 35 to 39 Minutes | 0 (0.0%) | 19 (1.1%) |
| 40 to 44 Minutes | 70 (3.4%) | 35 (2.0%) |
| 45 to 59 Minutes | 154 (7.6%) | 206 (11.8%) |
| 60 to 89 Minutes | 194 (9.5%) | 133 (7.6%) |
| 90 or more Minutes | 78 (3.8%) | 16 (0.9%) |
Time of Departure to Work by Sex in Capitola
The most frequent times of departure to work in Capitola are 6:00 AM to 6:29 AM (361, 17.7%) for males and 8:00 AM to 8:29 AM (413, 23.7%) for females.
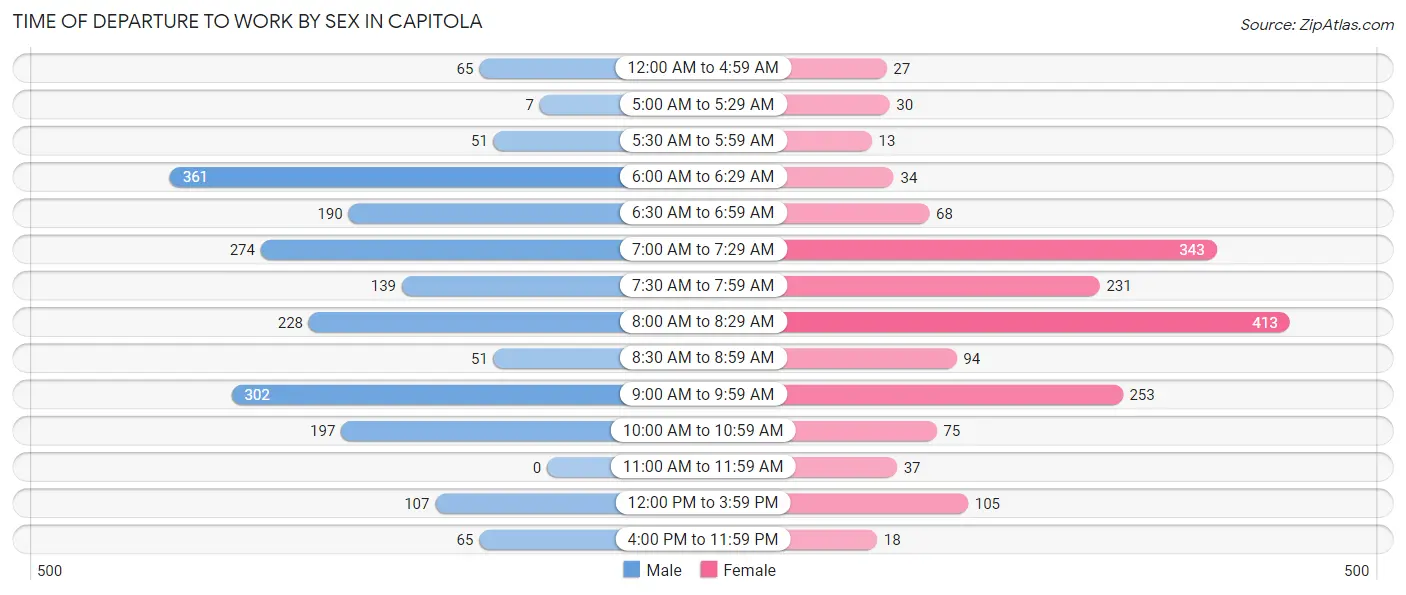
| Time of Departure | Male | Female |
| 12:00 AM to 4:59 AM | 65 (3.2%) | 27 (1.5%) |
| 5:00 AM to 5:29 AM | 7 (0.3%) | 30 (1.7%) |
| 5:30 AM to 5:59 AM | 51 (2.5%) | 13 (0.7%) |
| 6:00 AM to 6:29 AM | 361 (17.7%) | 34 (1.9%) |
| 6:30 AM to 6:59 AM | 190 (9.3%) | 68 (3.9%) |
| 7:00 AM to 7:29 AM | 274 (13.5%) | 343 (19.7%) |
| 7:30 AM to 7:59 AM | 139 (6.8%) | 231 (13.3%) |
| 8:00 AM to 8:29 AM | 228 (11.2%) | 413 (23.7%) |
| 8:30 AM to 8:59 AM | 51 (2.5%) | 94 (5.4%) |
| 9:00 AM to 9:59 AM | 302 (14.8%) | 253 (14.5%) |
| 10:00 AM to 10:59 AM | 197 (9.7%) | 75 (4.3%) |
| 11:00 AM to 11:59 AM | 0 (0.0%) | 37 (2.1%) |
| 12:00 PM to 3:59 PM | 107 (5.2%) | 105 (6.0%) |
| 4:00 PM to 11:59 PM | 65 (3.2%) | 18 (1.0%) |
| Total | 2,037 (100.0%) | 1,741 (100.0%) |
Housing Occupancy in Capitola
Occupancy by Ownership in Capitola
Of the total 4,588 dwellings in Capitola, owner-occupied units account for 2,214 (48.3%), while renter-occupied units make up 2,374 (51.7%).
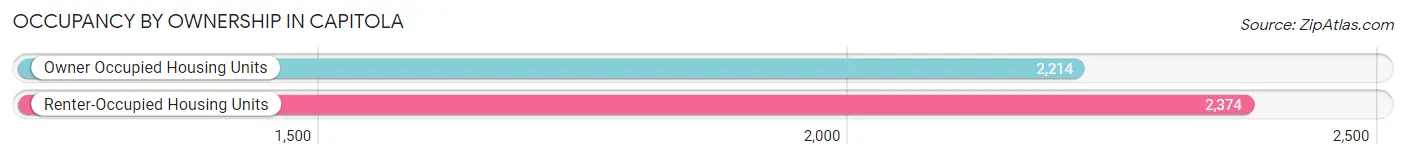
| Occupancy | # Housing Units | % Housing Units |
| Owner Occupied Housing Units | 2,214 | 48.3% |
| Renter-Occupied Housing Units | 2,374 | 51.7% |
| Total Occupied Housing Units | 4,588 | 100.0% |
Occupancy by Household Size in Capitola
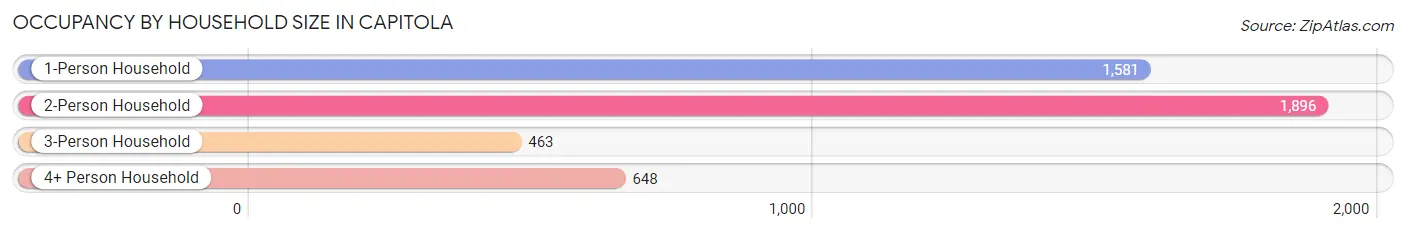
| Household Size | # Housing Units | % Housing Units |
| 1-Person Household | 1,581 | 34.5% |
| 2-Person Household | 1,896 | 41.3% |
| 3-Person Household | 463 | 10.1% |
| 4+ Person Household | 648 | 14.1% |
| Total Housing Units | 4,588 | 100.0% |
Occupancy by Ownership by Household Size in Capitola
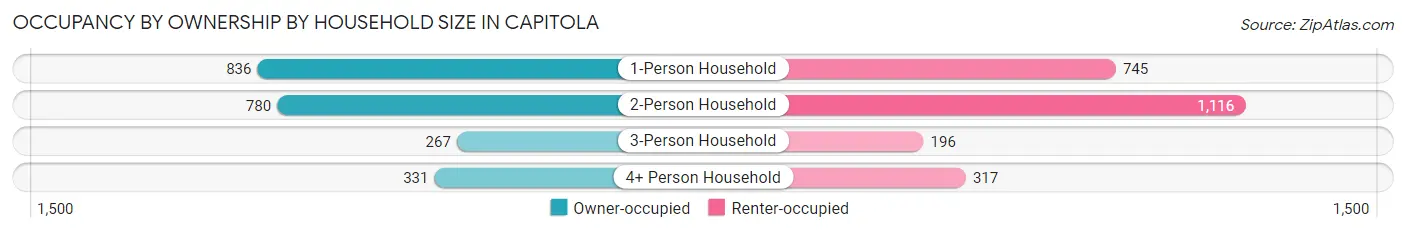
| Household Size | Owner-occupied | Renter-occupied |
| 1-Person Household | 836 (52.9%) | 745 (47.1%) |
| 2-Person Household | 780 (41.1%) | 1,116 (58.9%) |
| 3-Person Household | 267 (57.7%) | 196 (42.3%) |
| 4+ Person Household | 331 (51.1%) | 317 (48.9%) |
| Total Housing Units | 2,214 (48.3%) | 2,374 (51.7%) |
Occupancy by Educational Attainment in Capitola
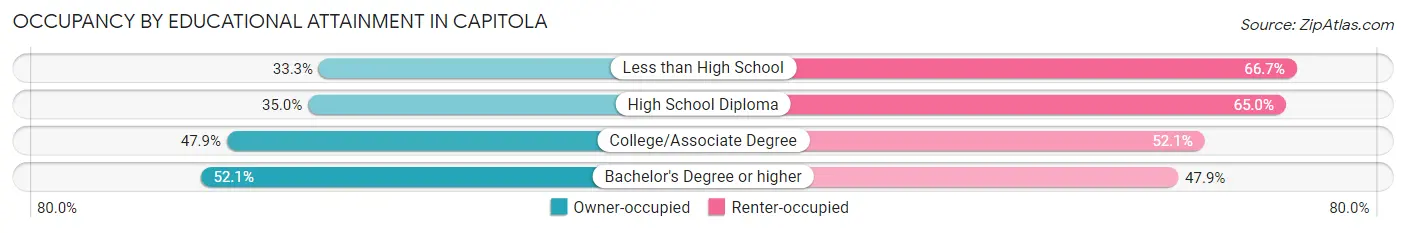
| Household Size | Owner-occupied | Renter-occupied |
| Less than High School | 56 (33.3%) | 112 (66.7%) |
| High School Diploma | 157 (35.0%) | 291 (65.0%) |
| College/Associate Degree | 788 (47.9%) | 856 (52.1%) |
| Bachelor's Degree or higher | 1,213 (52.1%) | 1,115 (47.9%) |
Occupancy by Age of Householder in Capitola
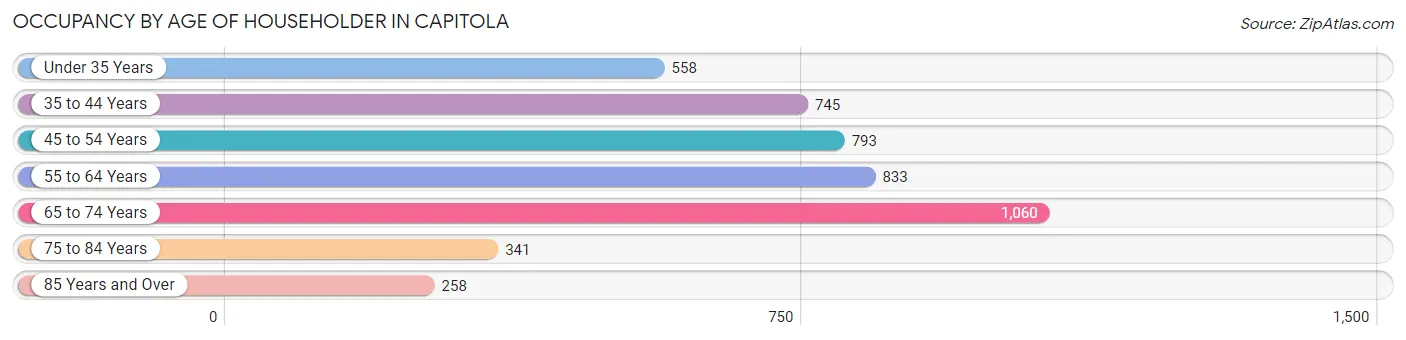
| Age Bracket | # Households | % Households |
| Under 35 Years | 558 | 12.2% |
| 35 to 44 Years | 745 | 16.2% |
| 45 to 54 Years | 793 | 17.3% |
| 55 to 64 Years | 833 | 18.2% |
| 65 to 74 Years | 1,060 | 23.1% |
| 75 to 84 Years | 341 | 7.4% |
| 85 Years and Over | 258 | 5.6% |
| Total | 4,588 | 100.0% |
Housing Finances in Capitola
Median Income by Occupancy in Capitola
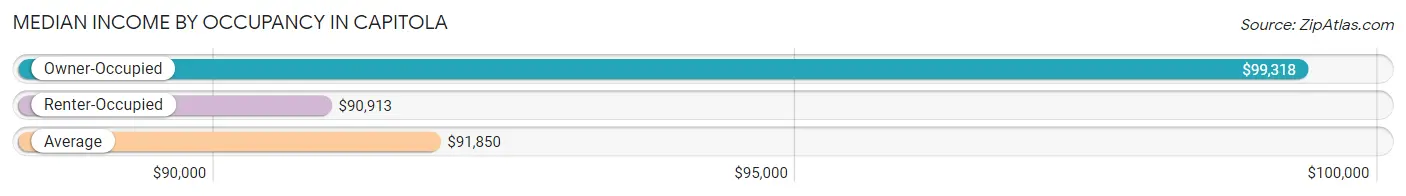
| Occupancy Type | # Households | Median Income |
| Owner-Occupied | 2,214 (48.3%) | $99,318 |
| Renter-Occupied | 2,374 (51.7%) | $90,913 |
| Average | 4,588 (100.0%) | $91,850 |
Occupancy by Householder Income Bracket in Capitola
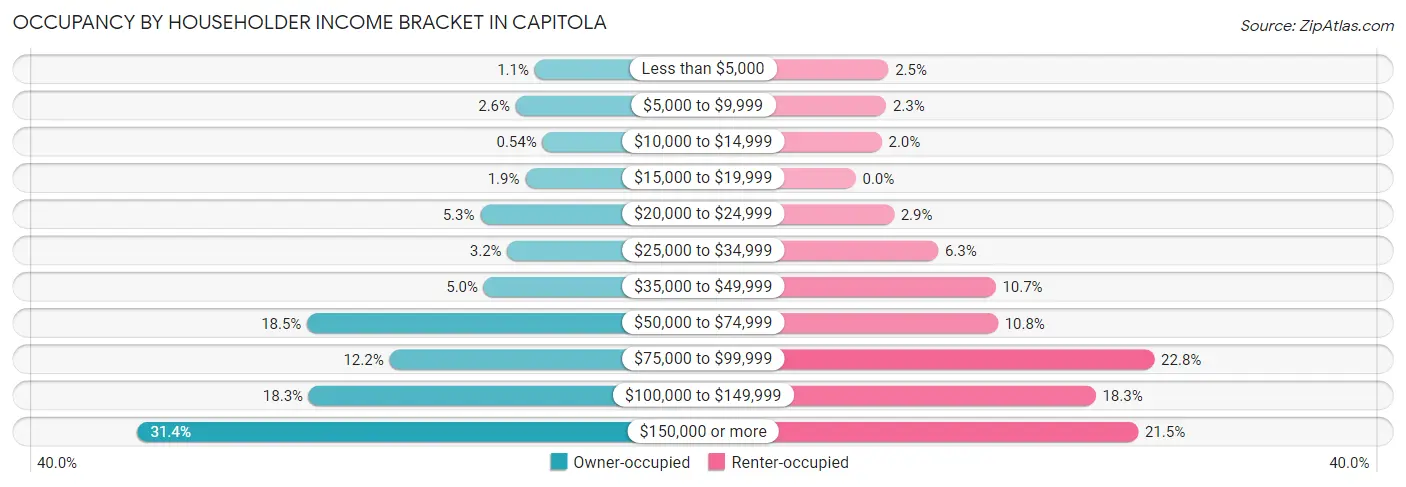
| Income Bracket | Owner-occupied | Renter-occupied |
| Less than $5,000 | 25 (1.1%) | 59 (2.5%) |
| $5,000 to $9,999 | 57 (2.6%) | 55 (2.3%) |
| $10,000 to $14,999 | 12 (0.5%) | 47 (2.0%) |
| $15,000 to $19,999 | 41 (1.8%) | 0 (0.0%) |
| $20,000 to $24,999 | 117 (5.3%) | 69 (2.9%) |
| $25,000 to $34,999 | 71 (3.2%) | 149 (6.3%) |
| $35,000 to $49,999 | 111 (5.0%) | 253 (10.7%) |
| $50,000 to $74,999 | 409 (18.5%) | 257 (10.8%) |
| $75,000 to $99,999 | 270 (12.2%) | 540 (22.8%) |
| $100,000 to $149,999 | 406 (18.3%) | 434 (18.3%) |
| $150,000 or more | 695 (31.4%) | 511 (21.5%) |
| Total | 2,214 (100.0%) | 2,374 (100.0%) |
Monthly Housing Cost Tiers in Capitola
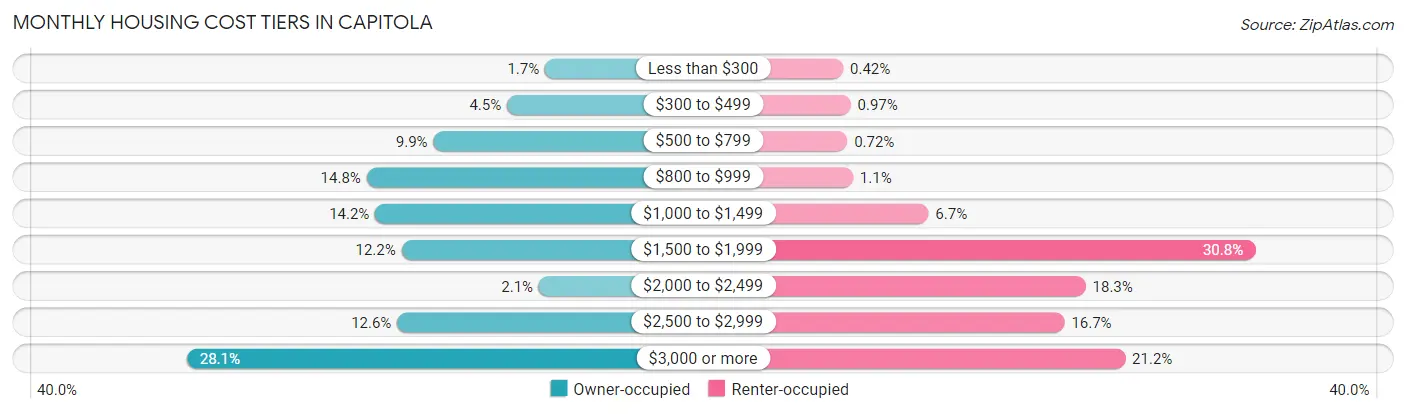
| Monthly Cost | Owner-occupied | Renter-occupied |
| Less than $300 | 37 (1.7%) | 10 (0.4%) |
| $300 to $499 | 99 (4.5%) | 23 (1.0%) |
| $500 to $799 | 219 (9.9%) | 17 (0.7%) |
| $800 to $999 | 328 (14.8%) | 27 (1.1%) |
| $1,000 to $1,499 | 314 (14.2%) | 159 (6.7%) |
| $1,500 to $1,999 | 271 (12.2%) | 730 (30.7%) |
| $2,000 to $2,499 | 47 (2.1%) | 434 (18.3%) |
| $2,500 to $2,999 | 278 (12.6%) | 397 (16.7%) |
| $3,000 or more | 621 (28.1%) | 503 (21.2%) |
| Total | 2,214 (100.0%) | 2,374 (100.0%) |
Physical Housing Characteristics in Capitola
Housing Structures in Capitola
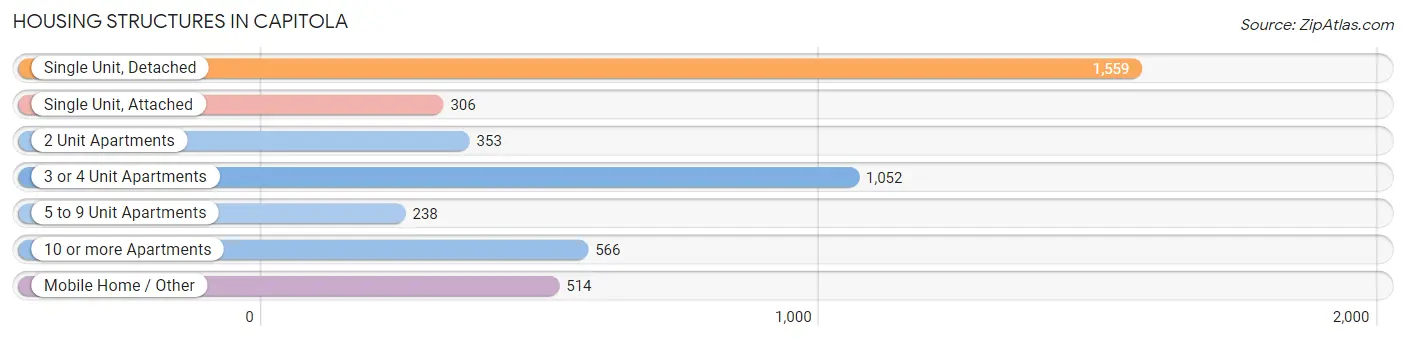
| Structure Type | # Housing Units | % Housing Units |
| Single Unit, Detached | 1,559 | 34.0% |
| Single Unit, Attached | 306 | 6.7% |
| 2 Unit Apartments | 353 | 7.7% |
| 3 or 4 Unit Apartments | 1,052 | 22.9% |
| 5 to 9 Unit Apartments | 238 | 5.2% |
| 10 or more Apartments | 566 | 12.3% |
| Mobile Home / Other | 514 | 11.2% |
| Total | 4,588 | 100.0% |
Housing Structures by Occupancy in Capitola
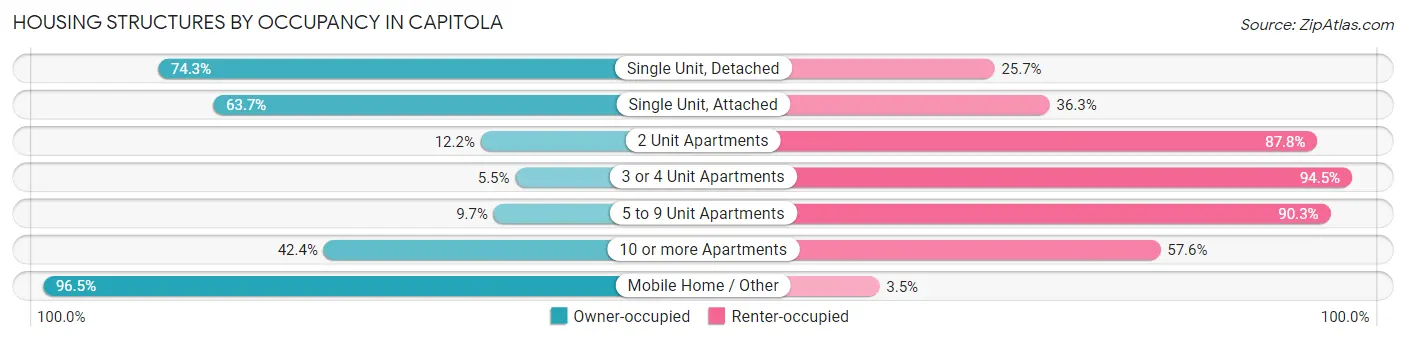
| Structure Type | Owner-occupied | Renter-occupied |
| Single Unit, Detached | 1,159 (74.3%) | 400 (25.7%) |
| Single Unit, Attached | 195 (63.7%) | 111 (36.3%) |
| 2 Unit Apartments | 43 (12.2%) | 310 (87.8%) |
| 3 or 4 Unit Apartments | 58 (5.5%) | 994 (94.5%) |
| 5 to 9 Unit Apartments | 23 (9.7%) | 215 (90.3%) |
| 10 or more Apartments | 240 (42.4%) | 326 (57.6%) |
| Mobile Home / Other | 496 (96.5%) | 18 (3.5%) |
| Total | 2,214 (48.3%) | 2,374 (51.7%) |
Housing Structures by Number of Rooms in Capitola
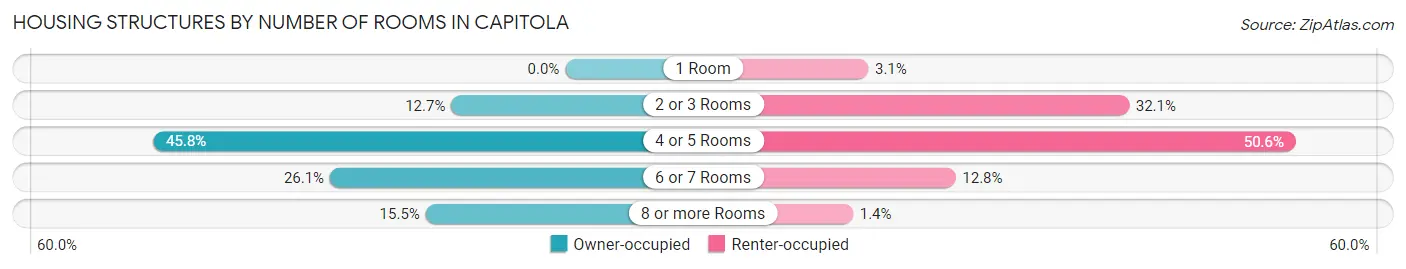
| Number of Rooms | Owner-occupied | Renter-occupied |
| 1 Room | 0 (0.0%) | 74 (3.1%) |
| 2 or 3 Rooms | 280 (12.7%) | 761 (32.1%) |
| 4 or 5 Rooms | 1,013 (45.8%) | 1,201 (50.6%) |
| 6 or 7 Rooms | 578 (26.1%) | 304 (12.8%) |
| 8 or more Rooms | 343 (15.5%) | 34 (1.4%) |
| Total | 2,214 (100.0%) | 2,374 (100.0%) |
Housing Structure by Heating Type in Capitola
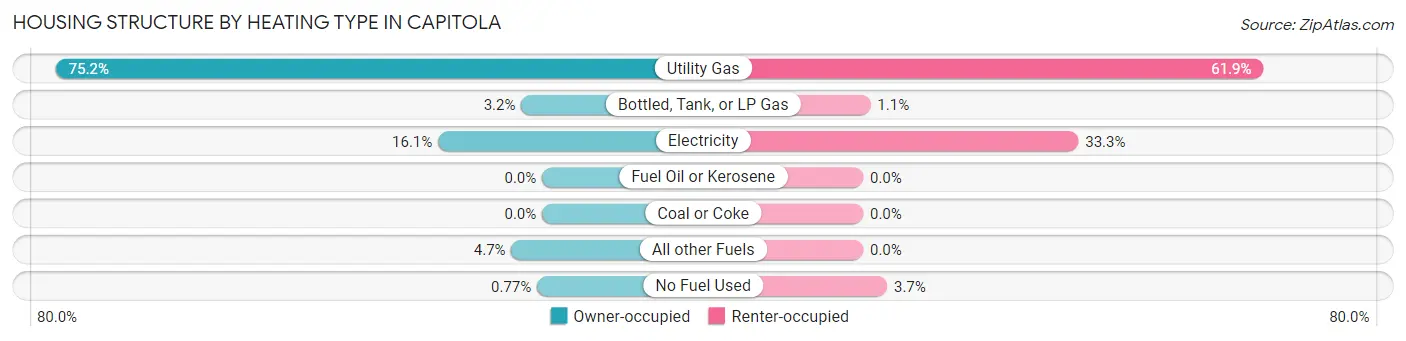
| Heating Type | Owner-occupied | Renter-occupied |
| Utility Gas | 1,665 (75.2%) | 1,469 (61.9%) |
| Bottled, Tank, or LP Gas | 71 (3.2%) | 27 (1.1%) |
| Electricity | 356 (16.1%) | 790 (33.3%) |
| Fuel Oil or Kerosene | 0 (0.0%) | 0 (0.0%) |
| Coal or Coke | 0 (0.0%) | 0 (0.0%) |
| All other Fuels | 105 (4.7%) | 0 (0.0%) |
| No Fuel Used | 17 (0.8%) | 88 (3.7%) |
| Total | 2,214 (100.0%) | 2,374 (100.0%) |
Household Vehicle Usage in Capitola
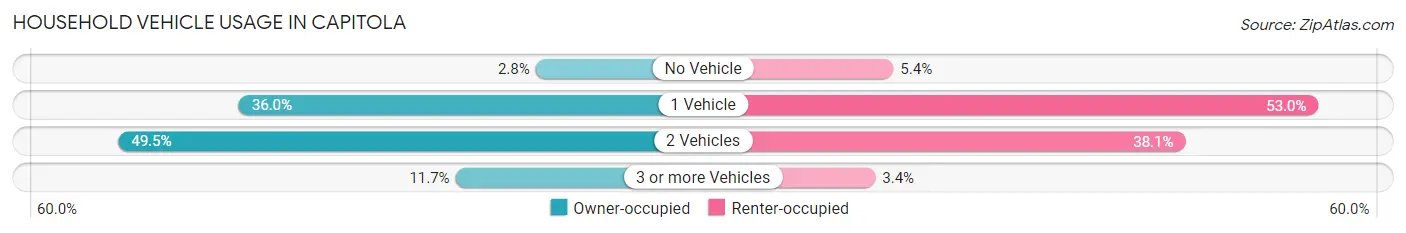
| Vehicles per Household | Owner-occupied | Renter-occupied |
| No Vehicle | 61 (2.8%) | 129 (5.4%) |
| 1 Vehicle | 797 (36.0%) | 1,259 (53.0%) |
| 2 Vehicles | 1,096 (49.5%) | 905 (38.1%) |
| 3 or more Vehicles | 260 (11.7%) | 81 (3.4%) |
| Total | 2,214 (100.0%) | 2,374 (100.0%) |
Real Estate & Mortgages in Capitola
Real Estate and Mortgage Overview in Capitola
| Characteristic | Without Mortgage | With Mortgage |
| Housing Units | 1,036 | 1,178 |
| Median Property Value | $852,700 | $837,700 |
| Median Household Income | $83,000 | $495 |
| Monthly Housing Costs | $876 | $621 |
| Real Estate Taxes | $4,920 | $74 |
Property Value by Mortgage Status in Capitola
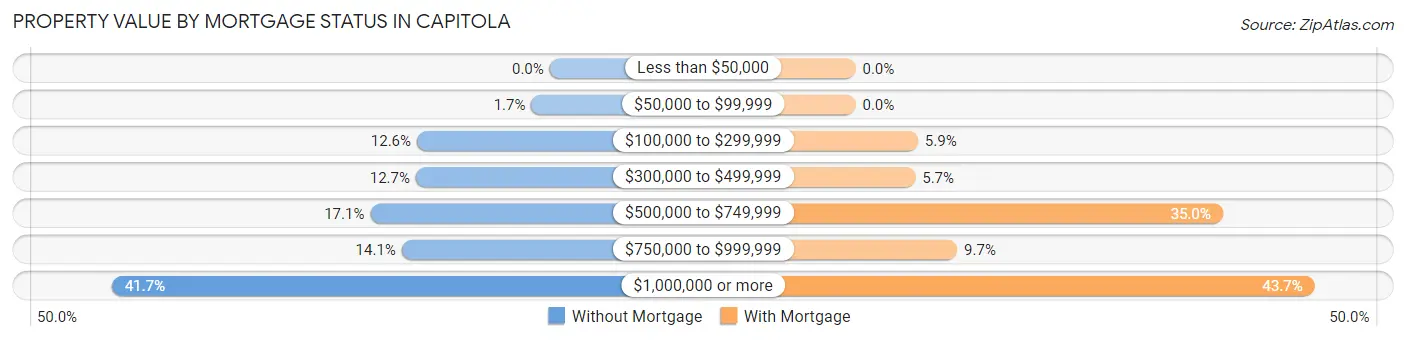
| Property Value | Without Mortgage | With Mortgage |
| Less than $50,000 | 0 (0.0%) | 0 (0.0%) |
| $50,000 to $99,999 | 18 (1.7%) | 0 (0.0%) |
| $100,000 to $299,999 | 131 (12.6%) | 70 (5.9%) |
| $300,000 to $499,999 | 132 (12.7%) | 67 (5.7%) |
| $500,000 to $749,999 | 177 (17.1%) | 412 (35.0%) |
| $750,000 to $999,999 | 146 (14.1%) | 114 (9.7%) |
| $1,000,000 or more | 432 (41.7%) | 515 (43.7%) |
| Total | 1,036 (100.0%) | 1,178 (100.0%) |
Household Income by Mortgage Status in Capitola
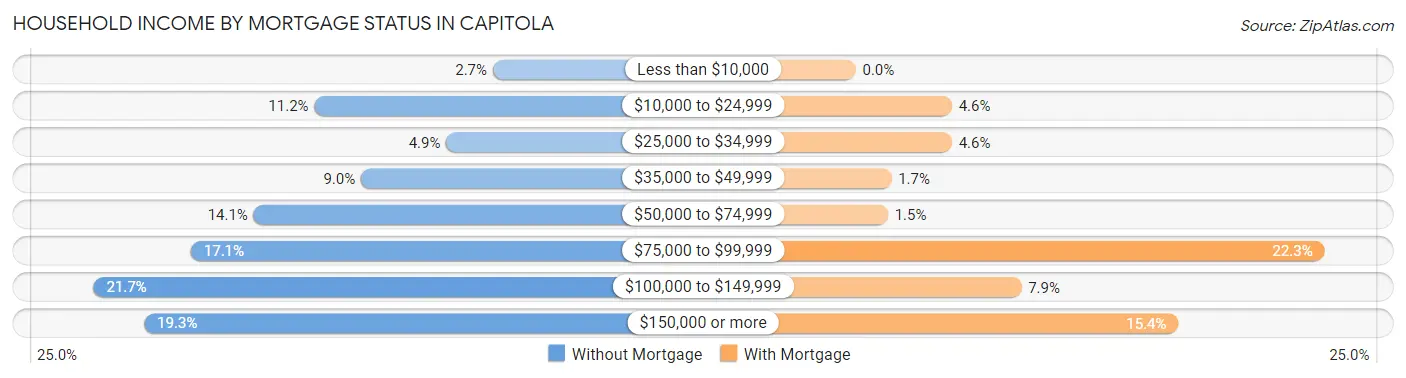
| Household Income | Without Mortgage | With Mortgage |
| Less than $10,000 | 28 (2.7%) | 0 (0.0%) |
| $10,000 to $24,999 | 116 (11.2%) | 54 (4.6%) |
| $25,000 to $34,999 | 51 (4.9%) | 54 (4.6%) |
| $35,000 to $49,999 | 93 (9.0%) | 20 (1.7%) |
| $50,000 to $74,999 | 146 (14.1%) | 18 (1.5%) |
| $75,000 to $99,999 | 177 (17.1%) | 263 (22.3%) |
| $100,000 to $149,999 | 225 (21.7%) | 93 (7.9%) |
| $150,000 or more | 200 (19.3%) | 181 (15.4%) |
| Total | 1,036 (100.0%) | 1,178 (100.0%) |
Property Value to Household Income Ratio in Capitola
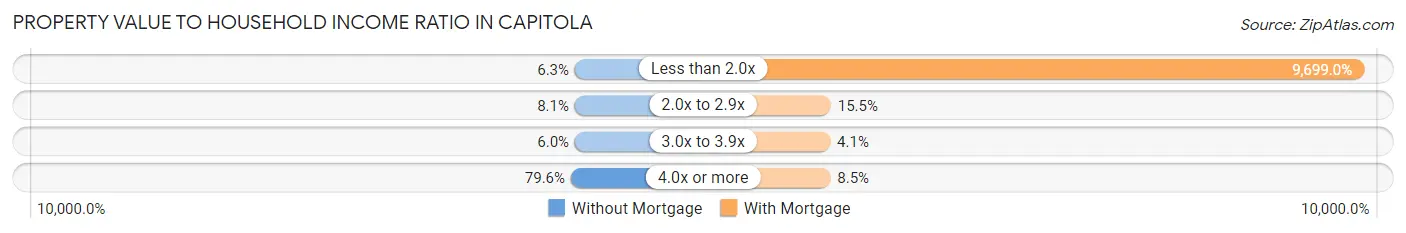
| Value-to-Income Ratio | Without Mortgage | With Mortgage |
| Less than 2.0x | 65 (6.3%) | 114,254 (9,699.0%) |
| 2.0x to 2.9x | 84 (8.1%) | 183 (15.5%) |
| 3.0x to 3.9x | 62 (6.0%) | 48 (4.1%) |
| 4.0x or more | 825 (79.6%) | 100 (8.5%) |
| Total | 1,036 (100.0%) | 1,178 (100.0%) |
Real Estate Taxes by Mortgage Status in Capitola
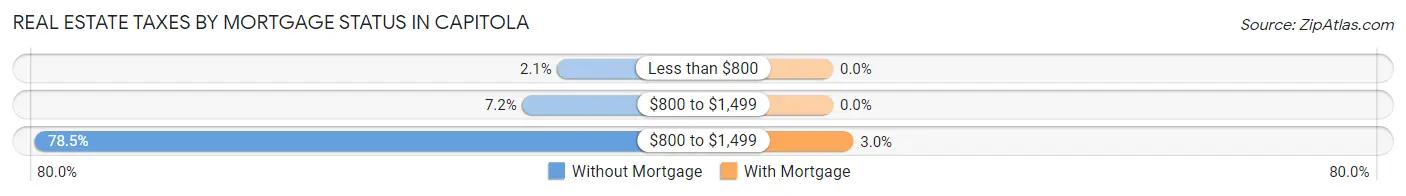
| Property Taxes | Without Mortgage | With Mortgage |
| Less than $800 | 22 (2.1%) | 0 (0.0%) |
| $800 to $1,499 | 75 (7.2%) | 0 (0.0%) |
| $800 to $1,499 | 813 (78.5%) | 35 (3.0%) |
| Total | 1,036 (100.0%) | 1,178 (100.0%) |
Health & Disability in Capitola
Health Insurance Coverage by Age in Capitola
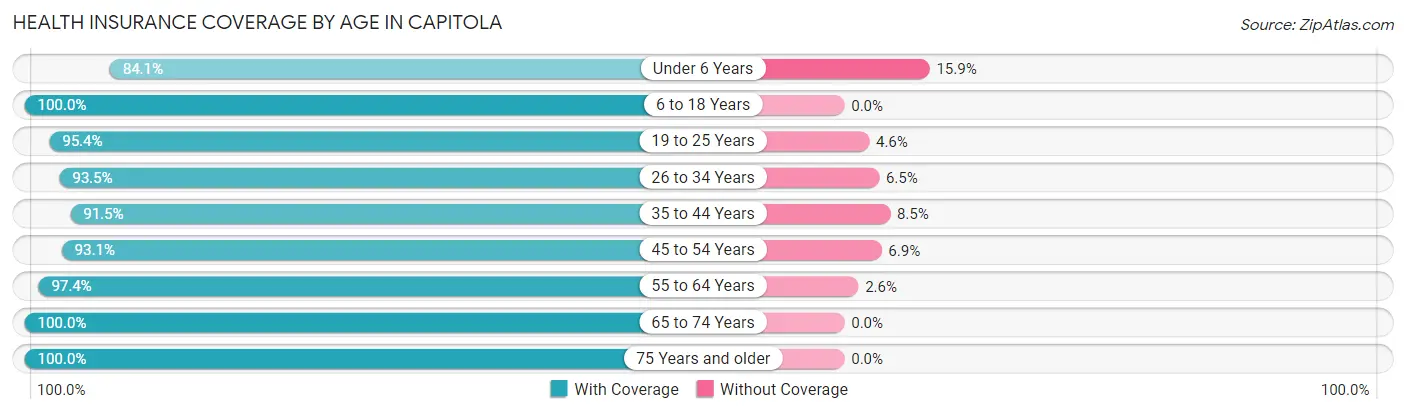
| Age Bracket | With Coverage | Without Coverage |
| Under 6 Years | 270 (84.1%) | 51 (15.9%) |
| 6 to 18 Years | 1,183 (100.0%) | 0 (0.0%) |
| 19 to 25 Years | 724 (95.4%) | 35 (4.6%) |
| 26 to 34 Years | 1,012 (93.5%) | 70 (6.5%) |
| 35 to 44 Years | 1,256 (91.5%) | 117 (8.5%) |
| 45 to 54 Years | 1,183 (93.1%) | 88 (6.9%) |
| 55 to 64 Years | 1,354 (97.4%) | 36 (2.6%) |
| 65 to 74 Years | 1,481 (100.0%) | 0 (0.0%) |
| 75 Years and older | 951 (100.0%) | 0 (0.0%) |
| Total | 9,414 (96.0%) | 397 (4.1%) |
Health Insurance Coverage by Citizenship Status in Capitola
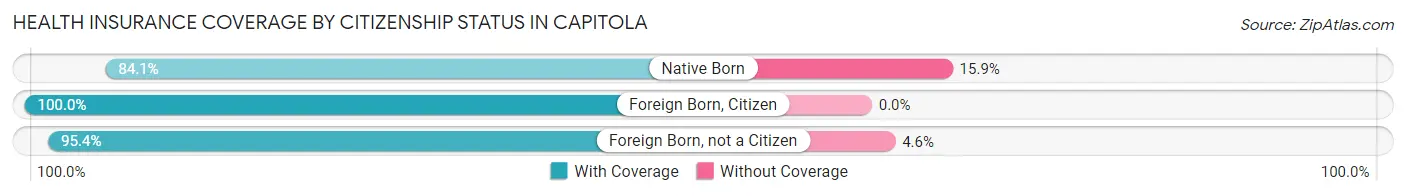
| Citizenship Status | With Coverage | Without Coverage |
| Native Born | 270 (84.1%) | 51 (15.9%) |
| Foreign Born, Citizen | 1,183 (100.0%) | 0 (0.0%) |
| Foreign Born, not a Citizen | 724 (95.4%) | 35 (4.6%) |
Health Insurance Coverage by Household Income in Capitola
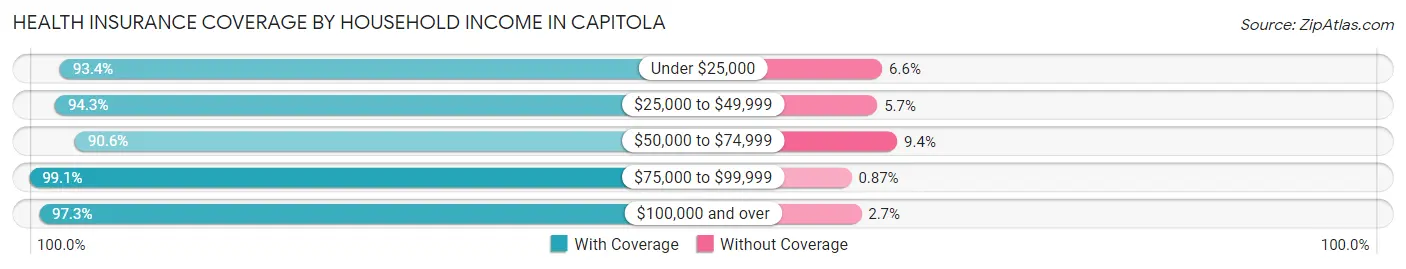
| Household Income | With Coverage | Without Coverage |
| Under $25,000 | 875 (93.4%) | 62 (6.6%) |
| $25,000 to $49,999 | 1,010 (94.3%) | 61 (5.7%) |
| $50,000 to $74,999 | 1,316 (90.6%) | 137 (9.4%) |
| $75,000 to $99,999 | 1,709 (99.1%) | 15 (0.9%) |
| $100,000 and over | 4,384 (97.3%) | 122 (2.7%) |
Public vs Private Health Insurance Coverage by Age in Capitola
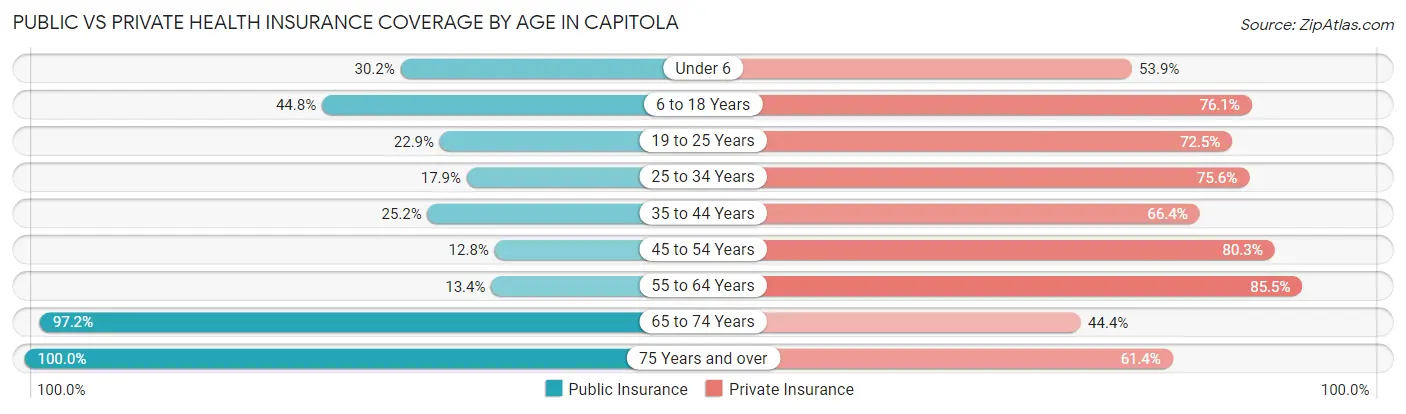
| Age Bracket | Public Insurance | Private Insurance |
| Under 6 | 97 (30.2%) | 173 (53.9%) |
| 6 to 18 Years | 530 (44.8%) | 900 (76.1%) |
| 19 to 25 Years | 174 (22.9%) | 550 (72.5%) |
| 25 to 34 Years | 194 (17.9%) | 818 (75.6%) |
| 35 to 44 Years | 346 (25.2%) | 912 (66.4%) |
| 45 to 54 Years | 162 (12.8%) | 1,021 (80.3%) |
| 55 to 64 Years | 186 (13.4%) | 1,188 (85.5%) |
| 65 to 74 Years | 1,439 (97.2%) | 658 (44.4%) |
| 75 Years and over | 951 (100.0%) | 584 (61.4%) |
| Total | 4,079 (41.6%) | 6,804 (69.4%) |
Disability Status by Sex by Age in Capitola
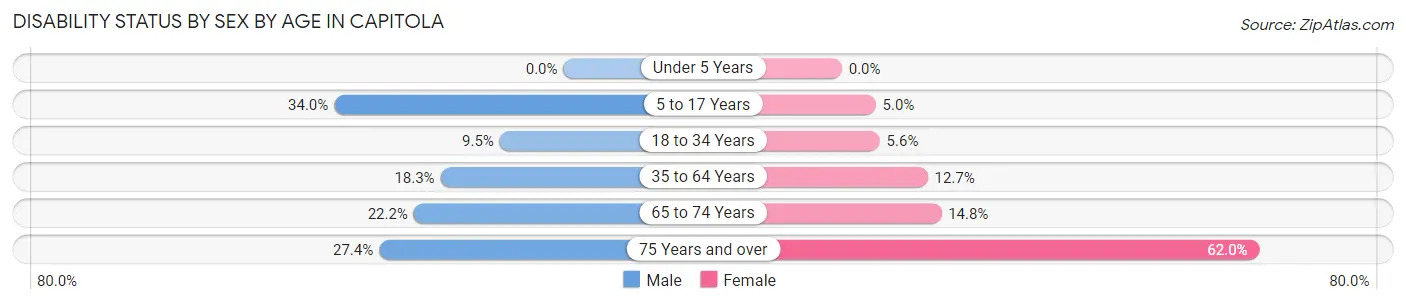
| Age Bracket | Male | Female |
| Under 5 Years | 0 (0.0%) | 0 (0.0%) |
| 5 to 17 Years | 225 (34.0%) | 23 (5.0%) |
| 18 to 34 Years | 103 (9.5%) | 48 (5.6%) |
| 35 to 64 Years | 355 (18.2%) | 266 (12.7%) |
| 65 to 74 Years | 162 (22.2%) | 111 (14.8%) |
| 75 Years and over | 78 (27.4%) | 413 (62.0%) |
Disability Class by Sex by Age in Capitola
Disability Class: Hearing Difficulty
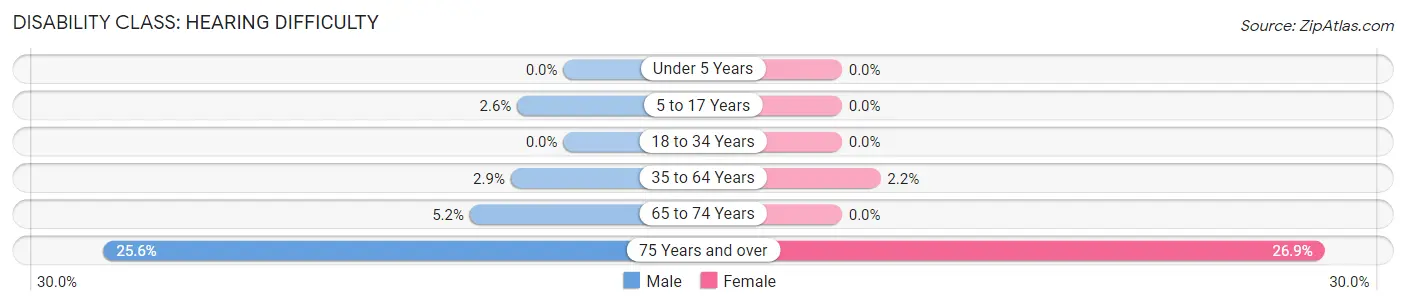
| Age Bracket | Male | Female |
| Under 5 Years | 0 (0.0%) | 0 (0.0%) |
| 5 to 17 Years | 17 (2.6%) | 0 (0.0%) |
| 18 to 34 Years | 0 (0.0%) | 0 (0.0%) |
| 35 to 64 Years | 57 (2.9%) | 45 (2.1%) |
| 65 to 74 Years | 38 (5.2%) | 0 (0.0%) |
| 75 Years and over | 73 (25.6%) | 179 (26.9%) |
Disability Class: Vision Difficulty
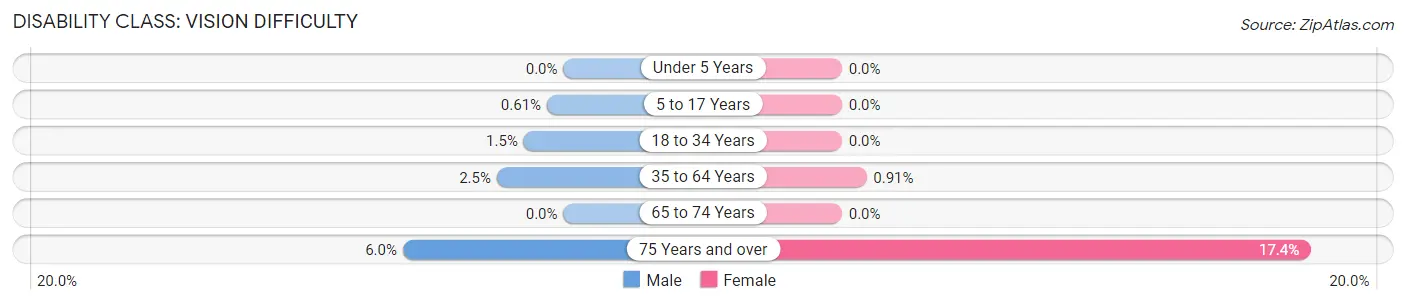
| Age Bracket | Male | Female |
| Under 5 Years | 0 (0.0%) | 0 (0.0%) |
| 5 to 17 Years | 4 (0.6%) | 0 (0.0%) |
| 18 to 34 Years | 16 (1.5%) | 0 (0.0%) |
| 35 to 64 Years | 48 (2.5%) | 19 (0.9%) |
| 65 to 74 Years | 0 (0.0%) | 0 (0.0%) |
| 75 Years and over | 17 (6.0%) | 116 (17.4%) |
Disability Class: Cognitive Difficulty
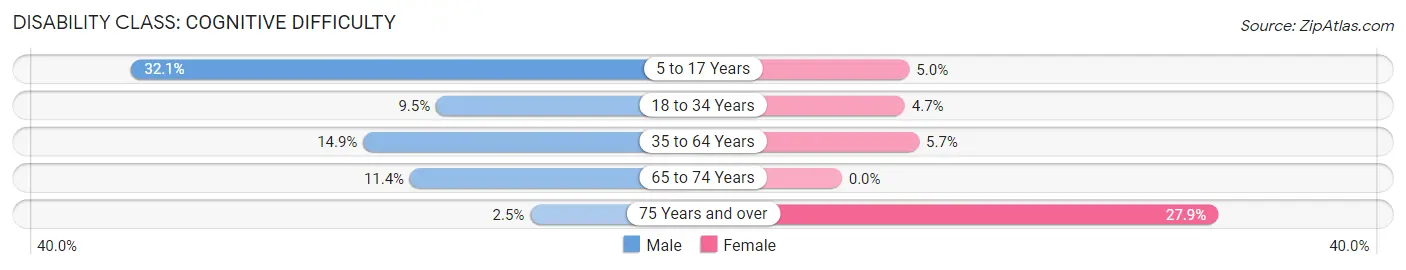
| Age Bracket | Male | Female |
| 5 to 17 Years | 212 (32.1%) | 23 (5.0%) |
| 18 to 34 Years | 103 (9.5%) | 40 (4.7%) |
| 35 to 64 Years | 289 (14.9%) | 120 (5.7%) |
| 65 to 74 Years | 83 (11.4%) | 0 (0.0%) |
| 75 Years and over | 7 (2.5%) | 186 (27.9%) |
Disability Class: Ambulatory Difficulty
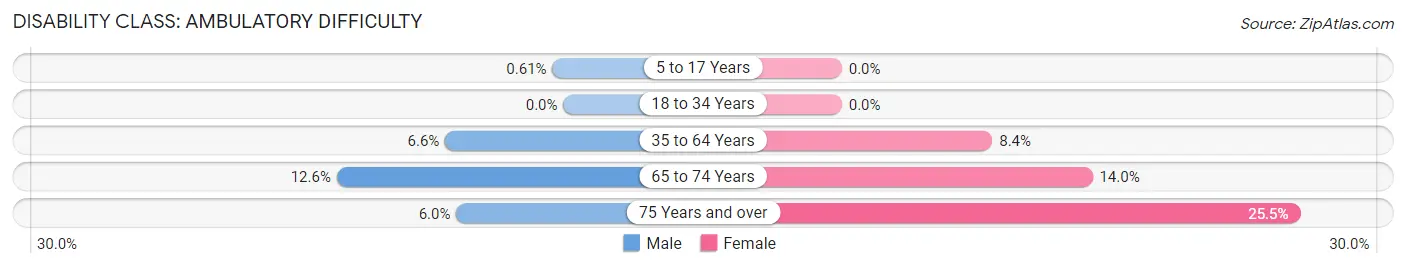
| Age Bracket | Male | Female |
| 5 to 17 Years | 4 (0.6%) | 0 (0.0%) |
| 18 to 34 Years | 0 (0.0%) | 0 (0.0%) |
| 35 to 64 Years | 128 (6.6%) | 175 (8.4%) |
| 65 to 74 Years | 92 (12.6%) | 105 (14.0%) |
| 75 Years and over | 17 (6.0%) | 170 (25.5%) |
Disability Class: Self-Care Difficulty
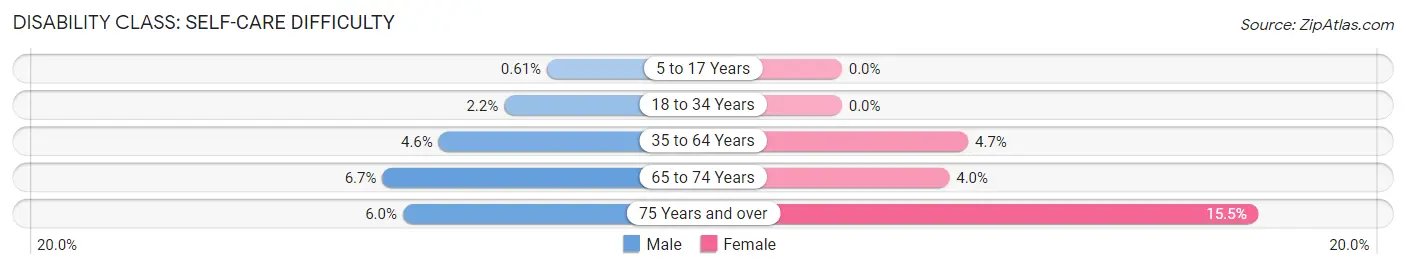
| Age Bracket | Male | Female |
| 5 to 17 Years | 4 (0.6%) | 0 (0.0%) |
| 18 to 34 Years | 24 (2.2%) | 0 (0.0%) |
| 35 to 64 Years | 90 (4.6%) | 98 (4.7%) |
| 65 to 74 Years | 49 (6.7%) | 30 (4.0%) |
| 75 Years and over | 17 (6.0%) | 103 (15.5%) |
Technology Access in Capitola
Computing Device Access in Capitola
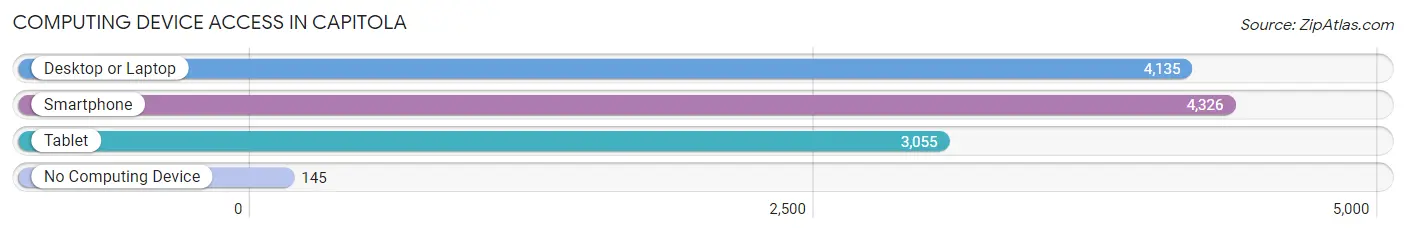
| Device Type | # Households | % Households |
| Desktop or Laptop | 4,135 | 90.1% |
| Smartphone | 4,326 | 94.3% |
| Tablet | 3,055 | 66.6% |
| No Computing Device | 145 | 3.2% |
| Total | 4,588 | 100.0% |
Internet Access in Capitola
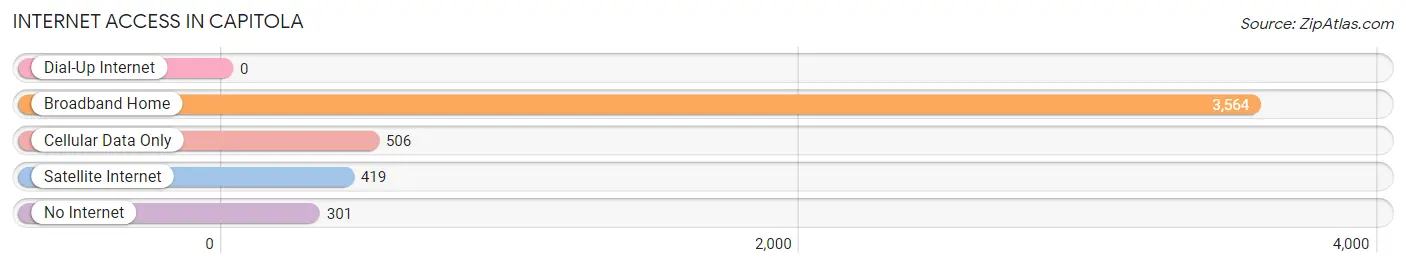
| Internet Type | # Households | % Households |
| Dial-Up Internet | 0 | 0.0% |
| Broadband Home | 3,564 | 77.7% |
| Cellular Data Only | 506 | 11.0% |
| Satellite Internet | 419 | 9.1% |
| No Internet | 301 | 6.6% |
| Total | 4,588 | 100.0% |
Capitola Summary
Capitola, California is a small city located in Santa Cruz County, California. It is situated on the Monterey Bay, just south of Santa Cruz. The city has a population of 9,917 as of the 2010 census, making it the second-smallest incorporated city in the county.
History
Capitola was founded in 1874 by entrepreneur and former San Francisco mayor John Frazier. He purchased the land from the Soquel Indians and named the area after his daughter, Capitola. The city was incorporated in 1887 and was the first beach resort on the Monterey Bay.
In the early 1900s, Capitola was a popular tourist destination, with many visitors coming to enjoy the beach and the nearby amusement park. The city was also known for its fishing industry, with many of the local fishermen selling their catches to the local canneries.
In the 1950s, Capitola began to experience a decline in tourism due to the rise of the automobile and the popularity of other beach destinations. The city was able to rebound in the 1960s and 1970s, thanks to the development of the Capitola Mall and the opening of the Capitola Wharf.
Geography
Capitola is located on the Monterey Bay, just south of Santa Cruz. The city is bordered by the cities of Santa Cruz and Soquel to the north, and the unincorporated community of Live Oak to the south. The city covers an area of 2.3 square miles, with a population density of 4,093 people per square mile.
The city is situated on a bluff overlooking the Monterey Bay, with the Capitola Wharf and the Capitola Beach located at the base of the bluff. The city is also home to the Capitola Venetian, a man-made canal that runs through the city.
Economy
The economy of Capitola is largely based on tourism and retail. The city is home to the Capitola Mall, which is the largest shopping center in the county. The mall is home to a variety of stores, restaurants, and entertainment venues.
The city is also home to a number of hotels and resorts, as well as a number of restaurants and bars. The city is also home to a number of art galleries and museums, as well as the Capitola Historical Museum.
Demographics
As of the 2010 census, the population of Capitola was 9,917. The racial makeup of the city was 79.2% White, 1.3% African American, 0.7% Native American, 5.2% Asian, 0.2% Pacific Islander, 8.7% from other races, and 4.7% from two or more races. Hispanic or Latino of any race were 18.2% of the population.
The median income for a household in the city was $50,945, and the median income for a family was $60,945. The per capita income for the city was $27,945. About 8.2% of families and 11.2% of the population were below the poverty line, including 15.2% of those under age 18 and 6.2% of those age 65 or over.
Common Questions
What is Per Capita Income in Capitola?
Per Capita income in Capitola is $62,768.
What is the Median Family Income in Capitola?
Median Family Income in Capitola is $109,226.
What is the Median Household income in Capitola?
Median Household Income in Capitola is $91,850.
What is Income or Wage Gap in Capitola?
Income or Wage Gap in Capitola is 13.1%.
Women in Capitola earn 86.9 cents for every dollar earned by a man.
What is Inequality or Gini Index in Capitola?
Inequality or Gini Index in Capitola is 0.49.
What is the Total Population of Capitola?
Total Population of Capitola is 9,921.
What is the Total Male Population of Capitola?
Total Male Population of Capitola is 4,917.
What is the Total Female Population of Capitola?
Total Female Population of Capitola is 5,004.
What is the Ratio of Males per 100 Females in Capitola?
There are 98.26 Males per 100 Females in Capitola.
What is the Ratio of Females per 100 Males in Capitola?
There are 101.77 Females per 100 Males in Capitola.
What is the Median Population Age in Capitola?
Median Population Age in Capitola is 48.9 Years.
What is the Average Family Size in Capitola
Average Family Size in Capitola is 2.7 People.
What is the Average Household Size in Capitola
Average Household Size in Capitola is 2.1 People.
How Large is the Labor Force in Capitola?
There are 5,354 People in the Labor Forcein in Capitola.
What is the Percentage of People in the Labor Force in Capitola?
61.5% of People are in the Labor Force in Capitola.
What is the Unemployment Rate in Capitola?
Unemployment Rate in Capitola is 2.0%.