Camino, CA Map & Demographics
Camino Map
Camino Overview
$77,536
PER CAPITA INCOME
$124,643
AVG FAMILY INCOME
$117,258
AVG HOUSEHOLD INCOME
59.6%
WAGE / INCOME GAP [ % ]
40.4¢/ $1
WAGE / INCOME GAP [ $ ]
0.45
INEQUALITY / GINI INDEX
2,002
TOTAL POPULATION
1,012
MALE POPULATION
990
FEMALE POPULATION
102.22
MALES / 100 FEMALES
97.83
FEMALES / 100 MALES
46.4
MEDIAN AGE
2.6
AVG FAMILY SIZE
2.5
AVG HOUSEHOLD SIZE
921
LABOR FORCE [ PEOPLE ]
55.0%
PERCENT IN LABOR FORCE
9.9%
UNEMPLOYMENT RATE
Camino Zip Codes
Camino Area Codes
Income in Camino
Income Overview in Camino
Per Capita Income in Camino is $77,536, while median incomes of families and households are $124,643 and $117,258 respectively.
| Characteristic | Number | Measure |
| Per Capita Income | 2,002 | $77,536 |
| Median Family Income | 698 | $124,643 |
| Mean Family Income | 698 | $173,508 |
| Median Household Income | 808 | $117,258 |
| Mean Household Income | 808 | $186,592 |
| Income Deficit | 698 | $0 |
| Wage / Income Gap (%) | 2,002 | 59.63% |
| Wage / Income Gap ($) | 2,002 | 40.37¢ per $1 |
| Gini / Inequality Index | 2,002 | 0.45 |
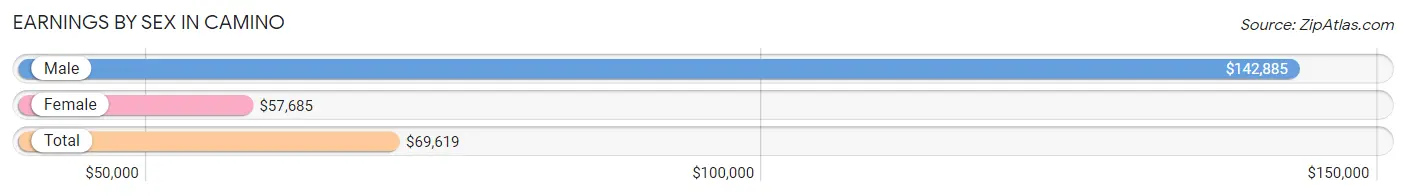
Earnings by Sex in Camino
Average Earnings in Camino are $69,619, $142,885 for men and $57,685 for women, a difference of 59.6%.
| Sex | Number | Average Earnings |
| Male | 516 (55.0%) | $142,885 |
| Female | 422 (45.0%) | $57,685 |
| Total | 938 (100.0%) | $69,619 |
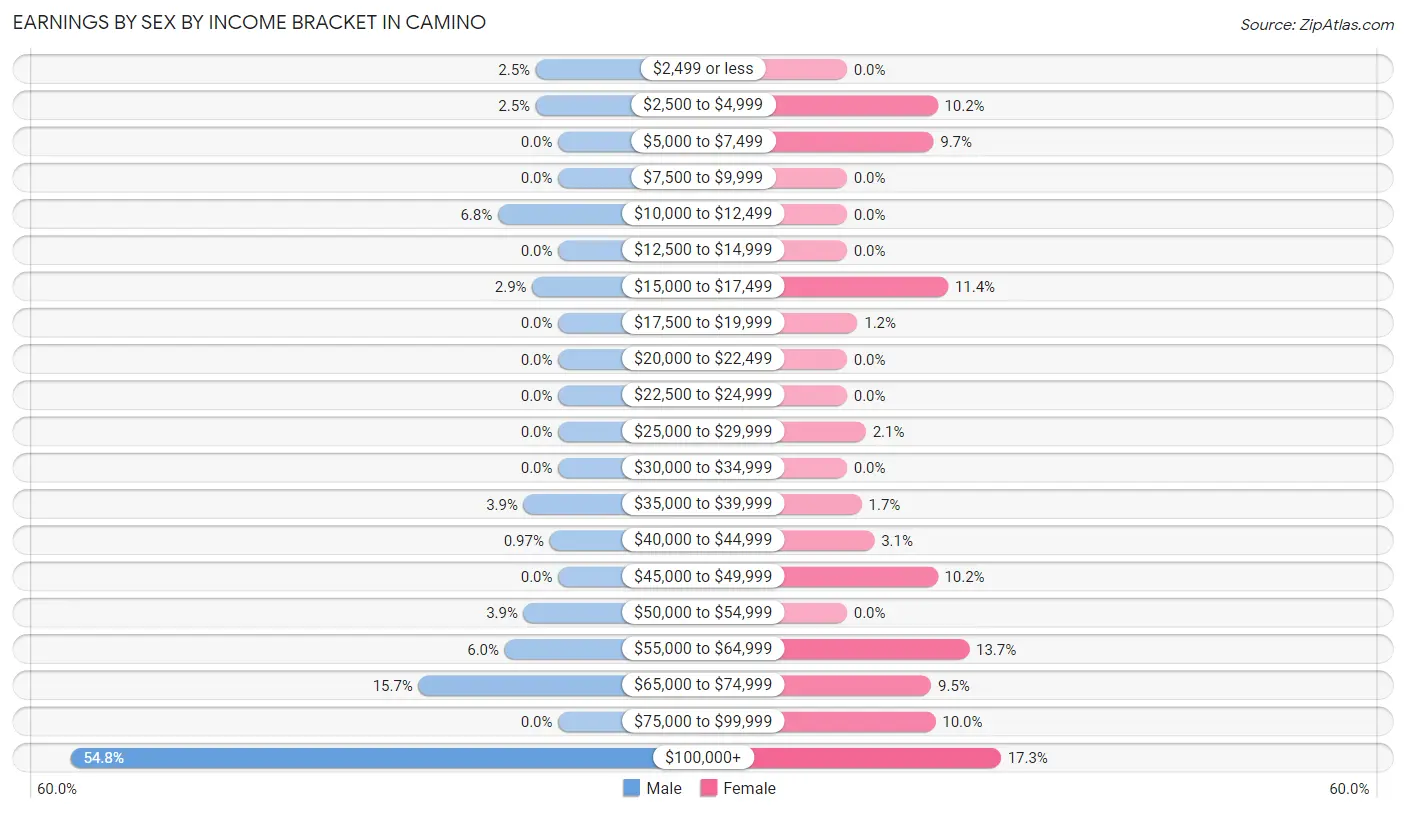
Earnings by Sex by Income Bracket in Camino
The most common earnings brackets in Camino are $100,000+ for men (283 | 54.8%) and $100,000+ for women (73 | 17.3%).
| Income | Male | Female |
| $2,499 or less | 13 (2.5%) | 0 (0.0%) |
| $2,500 to $4,999 | 13 (2.5%) | 43 (10.2%) |
| $5,000 to $7,499 | 0 (0.0%) | 41 (9.7%) |
| $7,500 to $9,999 | 0 (0.0%) | 0 (0.0%) |
| $10,000 to $12,499 | 35 (6.8%) | 0 (0.0%) |
| $12,500 to $14,999 | 0 (0.0%) | 0 (0.0%) |
| $15,000 to $17,499 | 15 (2.9%) | 48 (11.4%) |
| $17,500 to $19,999 | 0 (0.0%) | 5 (1.2%) |
| $20,000 to $22,499 | 0 (0.0%) | 0 (0.0%) |
| $22,500 to $24,999 | 0 (0.0%) | 0 (0.0%) |
| $25,000 to $29,999 | 0 (0.0%) | 9 (2.1%) |
| $30,000 to $34,999 | 0 (0.0%) | 0 (0.0%) |
| $35,000 to $39,999 | 20 (3.9%) | 7 (1.7%) |
| $40,000 to $44,999 | 5 (1.0%) | 13 (3.1%) |
| $45,000 to $49,999 | 0 (0.0%) | 43 (10.2%) |
| $50,000 to $54,999 | 20 (3.9%) | 0 (0.0%) |
| $55,000 to $64,999 | 31 (6.0%) | 58 (13.7%) |
| $65,000 to $74,999 | 81 (15.7%) | 40 (9.5%) |
| $75,000 to $99,999 | 0 (0.0%) | 42 (10.0%) |
| $100,000+ | 283 (54.8%) | 73 (17.3%) |
| Total | 516 (100.0%) | 422 (100.0%) |
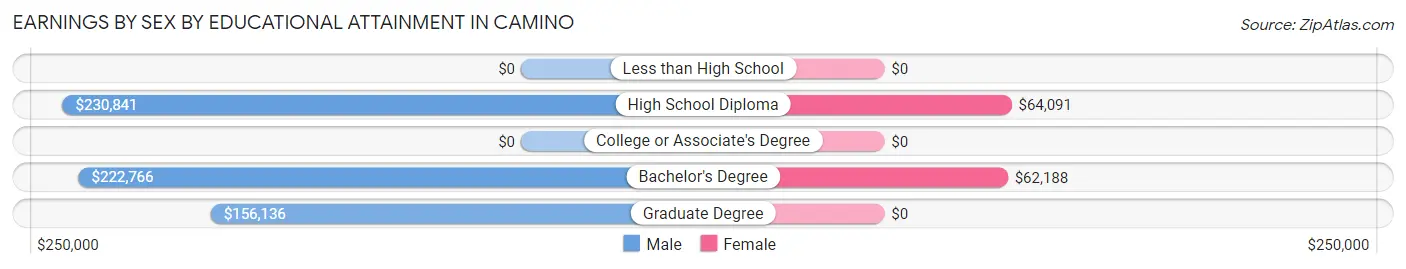
Earnings by Sex by Educational Attainment in Camino
Average earnings in Camino are $155,568 for men and $58,750 for women, a difference of 62.2%. Men with an educational attainment of high school diploma enjoy the highest average annual earnings of $230,841, while those with graduate degree education earn the least with $156,136. Women with an educational attainment of high school diploma earn the most with the average annual earnings of $64,091, while those with bachelor's degree education have the smallest earnings of $62,188.
| Educational Attainment | Male Income | Female Income |
| Less than High School | - | - |
| High School Diploma | $230,841 | $64,091 |
| College or Associate's Degree | - | - |
| Bachelor's Degree | $222,766 | $62,188 |
| Graduate Degree | $156,136 | $0 |
| Total | $155,568 | $58,750 |
Family Income in Camino
Family Income Brackets in Camino
According to the Camino family income data, there are 278 families falling into the $200,000+ income range, which is the most common income bracket and makes up 39.8% of all families.
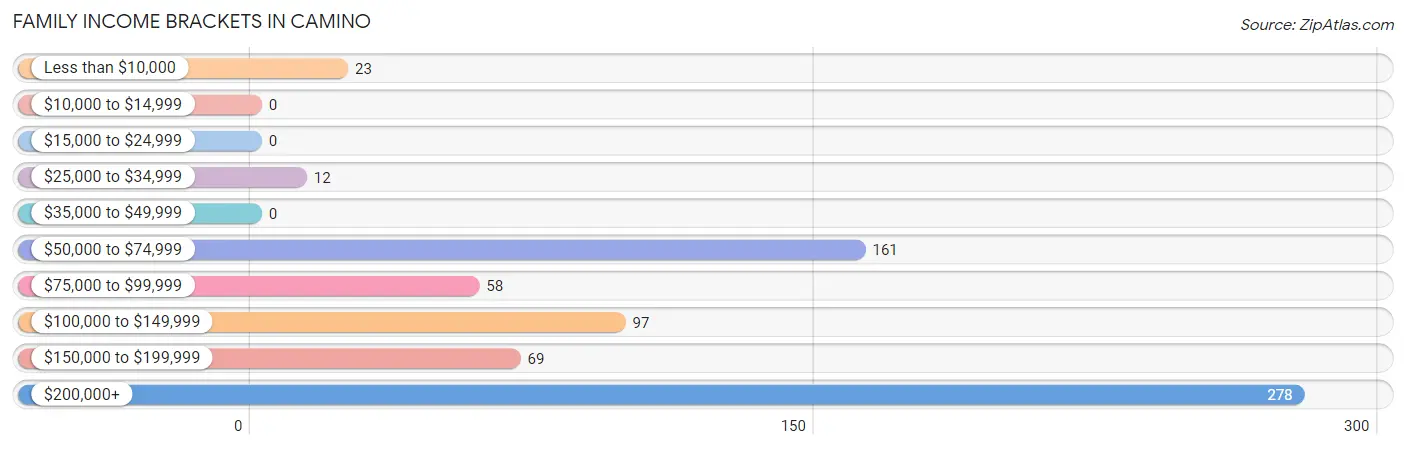
| Income Bracket | # Families | % Families |
| Less than $10,000 | 23 | 3.3% |
| $10,000 to $14,999 | 0 | 0.0% |
| $15,000 to $24,999 | 0 | 0.0% |
| $25,000 to $34,999 | 12 | 1.7% |
| $35,000 to $49,999 | 0 | 0.0% |
| $50,000 to $74,999 | 161 | 23.1% |
| $75,000 to $99,999 | 58 | 8.3% |
| $100,000 to $149,999 | 97 | 13.9% |
| $150,000 to $199,999 | 69 | 9.9% |
| $200,000+ | 278 | 39.8% |
Family Income by Famaliy Size in Camino
3-person families (116 | 16.6%) account for the highest median family income in Camino with $245,260 per family, while 3-person families (116 | 16.6%) have the highest median income of $81,753 per family member.
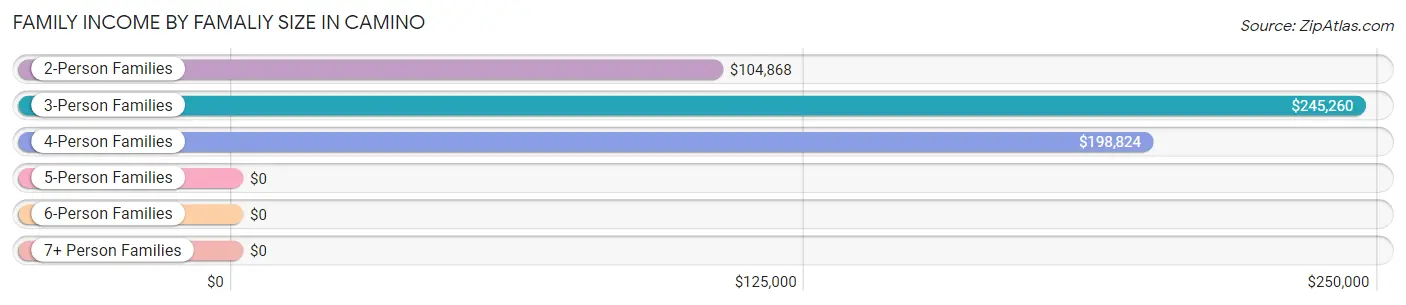
| Income Bracket | # Families | Median Income |
| 2-Person Families | 478 (68.5%) | $104,868 |
| 3-Person Families | 116 (16.6%) | $245,260 |
| 4-Person Families | 68 (9.7%) | $198,824 |
| 5-Person Families | 13 (1.9%) | $0 |
| 6-Person Families | 0 (0.0%) | $0 |
| 7+ Person Families | 23 (3.3%) | $0 |
| Total | 698 (100.0%) | $124,643 |
Family Income by Number of Earners in Camino
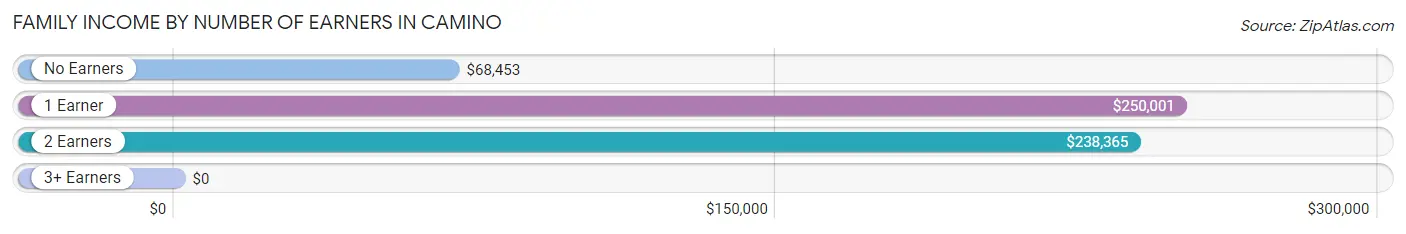
| Number of Earners | # Families | Median Income |
| No Earners | 243 (34.8%) | $68,453 |
| 1 Earner | 146 (20.9%) | $250,001 |
| 2 Earners | 286 (41.0%) | $238,365 |
| 3+ Earners | 23 (3.3%) | $0 |
| Total | 698 (100.0%) | $124,643 |
Household Income in Camino
Household Income Brackets in Camino
With 308 households falling in the category, the $200,000+ income range is the most frequent in Camino, accounting for 38.1% of all households.
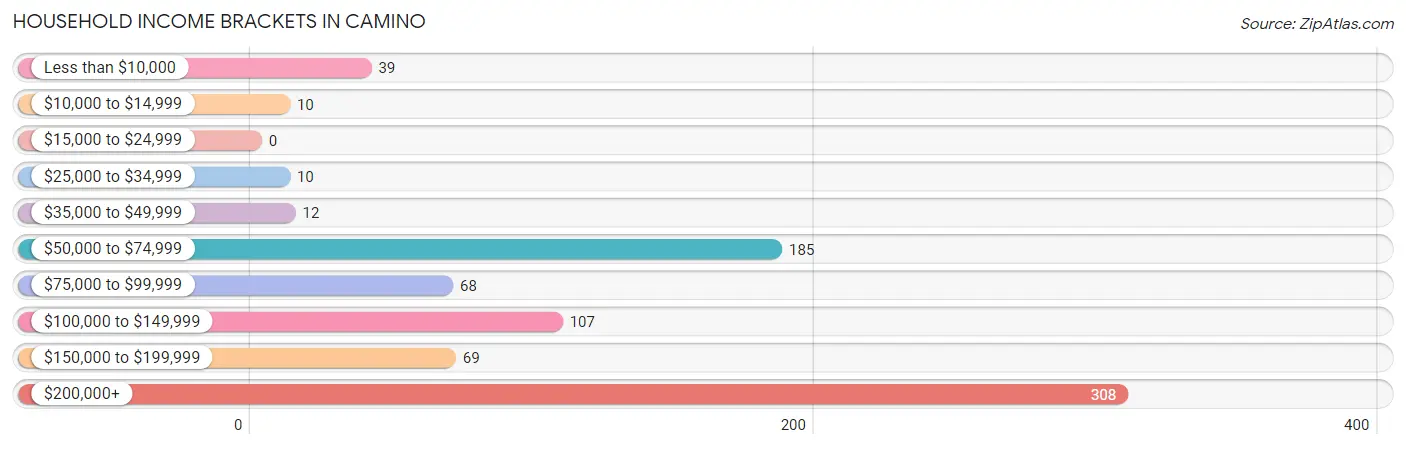
| Income Bracket | # Households | % Households |
| Less than $10,000 | 39 | 4.8% |
| $10,000 to $14,999 | 10 | 1.2% |
| $15,000 to $24,999 | 0 | 0.0% |
| $25,000 to $34,999 | 10 | 1.2% |
| $35,000 to $49,999 | 12 | 1.5% |
| $50,000 to $74,999 | 185 | 22.9% |
| $75,000 to $99,999 | 68 | 8.4% |
| $100,000 to $149,999 | 107 | 13.2% |
| $150,000 to $199,999 | 69 | 8.5% |
| $200,000+ | 308 | 38.1% |
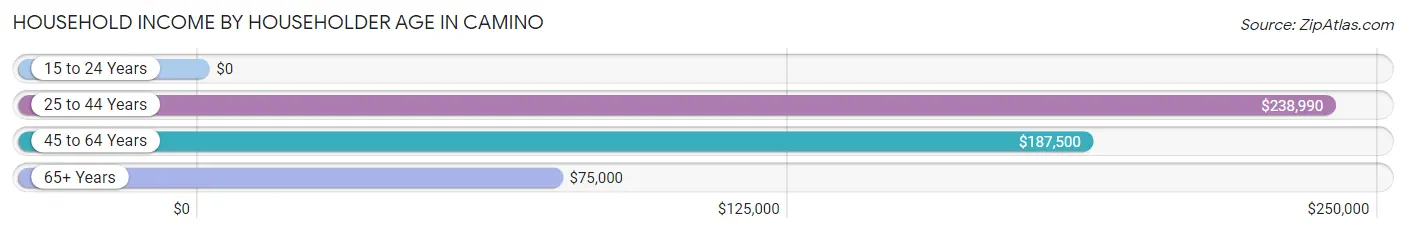
Household Income by Householder Age in Camino
The median household income in Camino is $117,258, with the highest median household income of $238,990 found in the 25 to 44 years age bracket for the primary householder. A total of 225 households (27.9%) fall into this category. Meanwhile, the 15 to 24 years age bracket for the primary householder has the lowest median household income of $0, with 5 households (0.6%) in this group.
| Income Bracket | # Households | Median Income |
| 15 to 24 Years | 5 (0.6%) | $0 |
| 25 to 44 Years | 225 (27.9%) | $238,990 |
| 45 to 64 Years | 208 (25.7%) | $187,500 |
| 65+ Years | 370 (45.8%) | $75,000 |
| Total | 808 (100.0%) | $117,258 |
Poverty in Camino
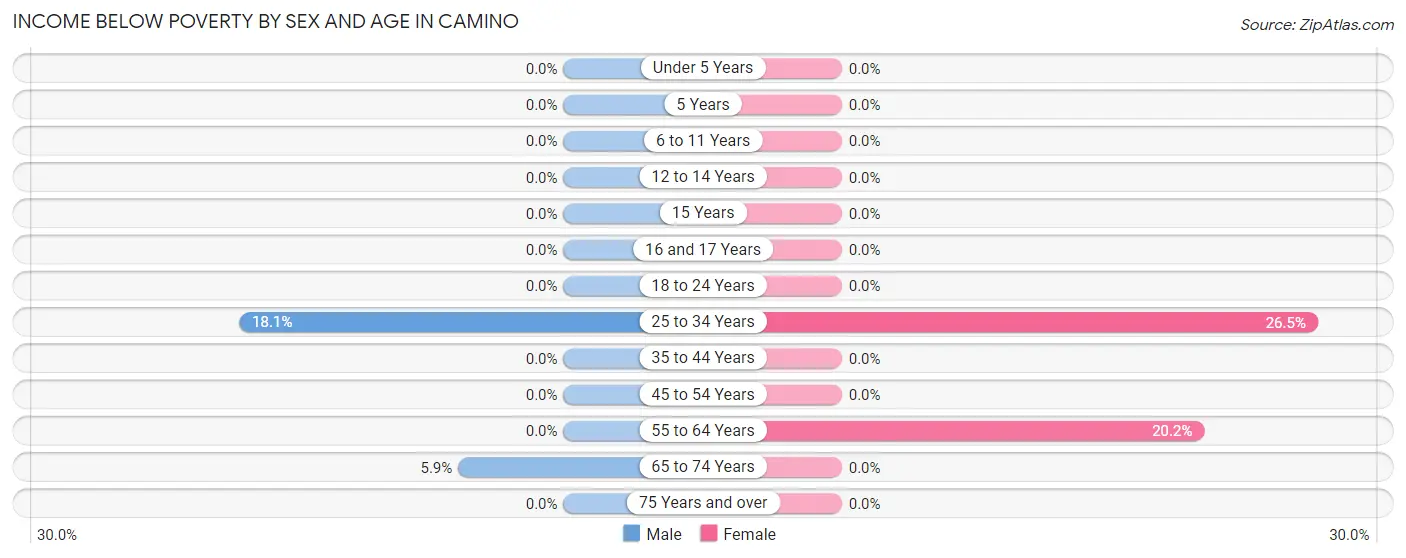
Income Below Poverty by Sex and Age in Camino
With 3.0% poverty level for males and 5.5% for females among the residents of Camino, 25 to 34 year old males and 25 to 34 year old females are the most vulnerable to poverty, with 13 males (18.1%) and 31 females (26.5%) in their respective age groups living below the poverty level.
| Age Bracket | Male | Female |
| Under 5 Years | 0 (0.0%) | 0 (0.0%) |
| 5 Years | 0 (0.0%) | 0 (0.0%) |
| 6 to 11 Years | 0 (0.0%) | 0 (0.0%) |
| 12 to 14 Years | 0 (0.0%) | 0 (0.0%) |
| 15 Years | 0 (0.0%) | 0 (0.0%) |
| 16 and 17 Years | 0 (0.0%) | 0 (0.0%) |
| 18 to 24 Years | 0 (0.0%) | 0 (0.0%) |
| 25 to 34 Years | 13 (18.1%) | 31 (26.5%) |
| 35 to 44 Years | 0 (0.0%) | 0 (0.0%) |
| 45 to 54 Years | 0 (0.0%) | 0 (0.0%) |
| 55 to 64 Years | 0 (0.0%) | 23 (20.2%) |
| 65 to 74 Years | 17 (5.9%) | 0 (0.0%) |
| 75 Years and over | 0 (0.0%) | 0 (0.0%) |
| Total | 30 (3.0%) | 54 (5.5%) |
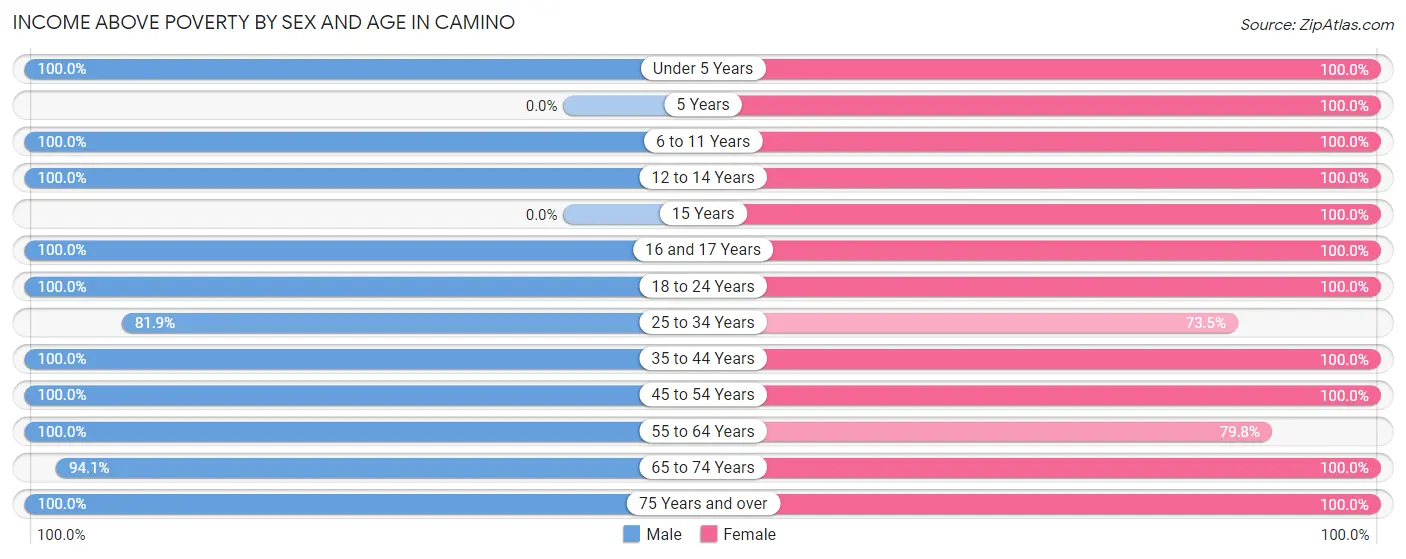
Income Above Poverty by Sex and Age in Camino
According to the poverty statistics in Camino, males aged under 5 years and females aged under 5 years are the age groups that are most secure financially, with 100.0% of males and 100.0% of females in these age groups living above the poverty line.
| Age Bracket | Male | Female |
| Under 5 Years | 28 (100.0%) | 35 (100.0%) |
| 5 Years | 0 (0.0%) | 4 (100.0%) |
| 6 to 11 Years | 60 (100.0%) | 58 (100.0%) |
| 12 to 14 Years | 59 (100.0%) | 12 (100.0%) |
| 15 Years | 0 (0.0%) | 59 (100.0%) |
| 16 and 17 Years | 13 (100.0%) | 18 (100.0%) |
| 18 to 24 Years | 70 (100.0%) | 5 (100.0%) |
| 25 to 34 Years | 59 (81.9%) | 86 (73.5%) |
| 35 to 44 Years | 171 (100.0%) | 172 (100.0%) |
| 45 to 54 Years | 101 (100.0%) | 92 (100.0%) |
| 55 to 64 Years | 60 (100.0%) | 91 (79.8%) |
| 65 to 74 Years | 273 (94.1%) | 247 (100.0%) |
| 75 Years and over | 88 (100.0%) | 45 (100.0%) |
| Total | 982 (97.0%) | 924 (94.5%) |
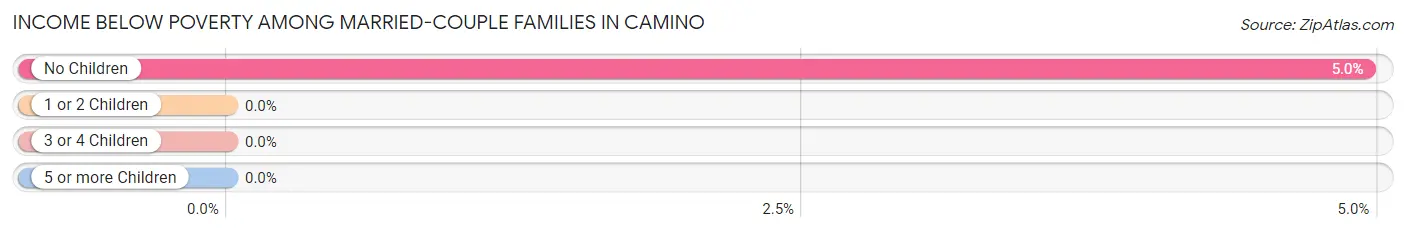
Income Below Poverty Among Married-Couple Families in Camino
The poverty statistics for married-couple families in Camino show that 3.7% or 23 of the total 629 families live below the poverty line. Families with no children have the highest poverty rate of 5.0%, comprising of 23 families. On the other hand, families with 1 or 2 children have the lowest poverty rate of 0.0%, which includes 0 families.
| Children | Above Poverty | Below Poverty |
| No Children | 442 (95.1%) | 23 (5.0%) |
| 1 or 2 Children | 141 (100.0%) | 0 (0.0%) |
| 3 or 4 Children | 9 (100.0%) | 0 (0.0%) |
| 5 or more Children | 14 (100.0%) | 0 (0.0%) |
| Total | 606 (96.3%) | 23 (3.7%) |
Income Below Poverty Among Single-Parent Households in Camino
| Children | Single Father | Single Mother |
| No Children | 0 (0.0%) | 0 (0.0%) |
| 1 or 2 Children | 0 (0.0%) | 0 (0.0%) |
| 3 or 4 Children | 0 (0.0%) | 0 (0.0%) |
| 5 or more Children | 0 (0.0%) | 0 (0.0%) |
| Total | 0 (0.0%) | 0 (0.0%) |
Income Below Poverty Among Married-Couple vs Single-Parent Households in Camino
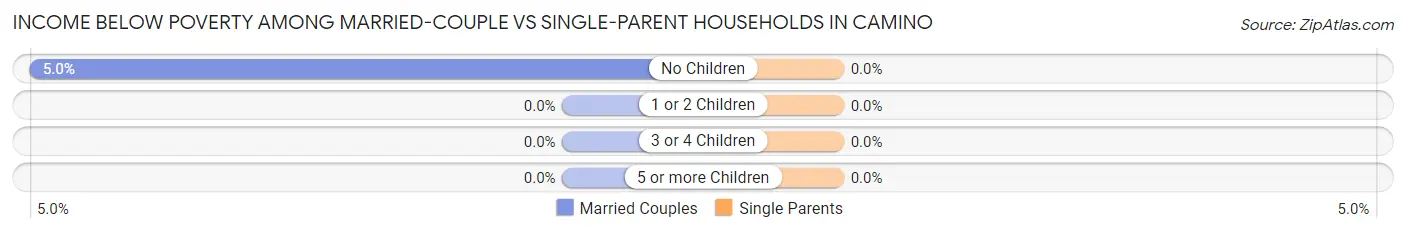
| Children | Married-Couple Families | Single-Parent Households |
| No Children | 23 (5.0%) | 0 (0.0%) |
| 1 or 2 Children | 0 (0.0%) | 0 (0.0%) |
| 3 or 4 Children | 0 (0.0%) | 0 (0.0%) |
| 5 or more Children | 0 (0.0%) | 0 (0.0%) |
| Total | 23 (3.7%) | 0 (0.0%) |
Race in Camino
The most populous races in Camino are White / Caucasian (1,793 | 89.6%), Asian (106 | 5.3%), and Hispanic or Latino (91 | 4.5%).
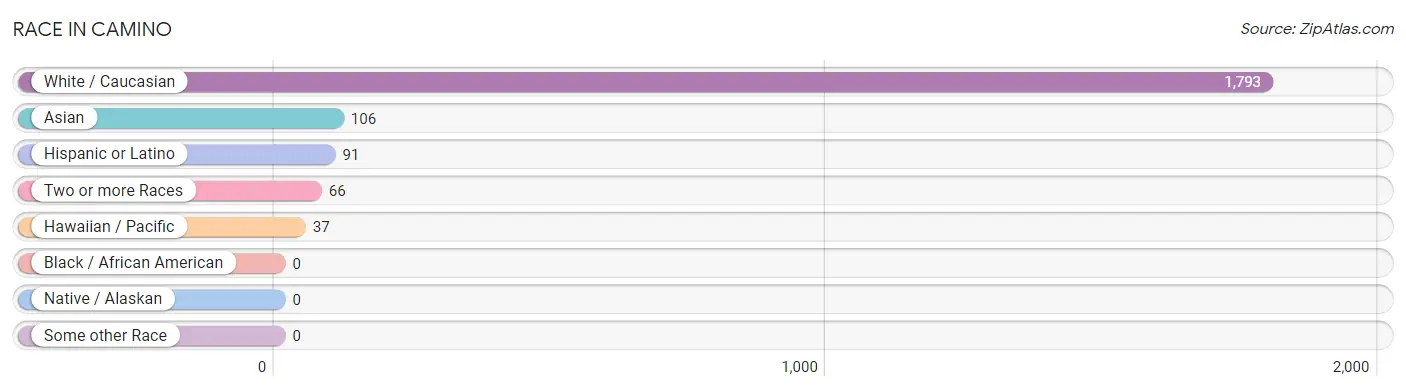
| Race | # Population | % Population |
| Asian | 106 | 5.3% |
| Black / African American | 0 | 0.0% |
| Hawaiian / Pacific | 37 | 1.8% |
| Hispanic or Latino | 91 | 4.5% |
| Native / Alaskan | 0 | 0.0% |
| White / Caucasian | 1,793 | 89.6% |
| Two or more Races | 66 | 3.3% |
| Some other Race | 0 | 0.0% |
| Total | 2,002 | 100.0% |
Ancestry in Camino
The most populous ancestries reported in Camino are German (423 | 21.1%), English (371 | 18.5%), Irish (175 | 8.7%), Italian (122 | 6.1%), and Dutch (117 | 5.8%), together accounting for 60.3% of all Camino residents.
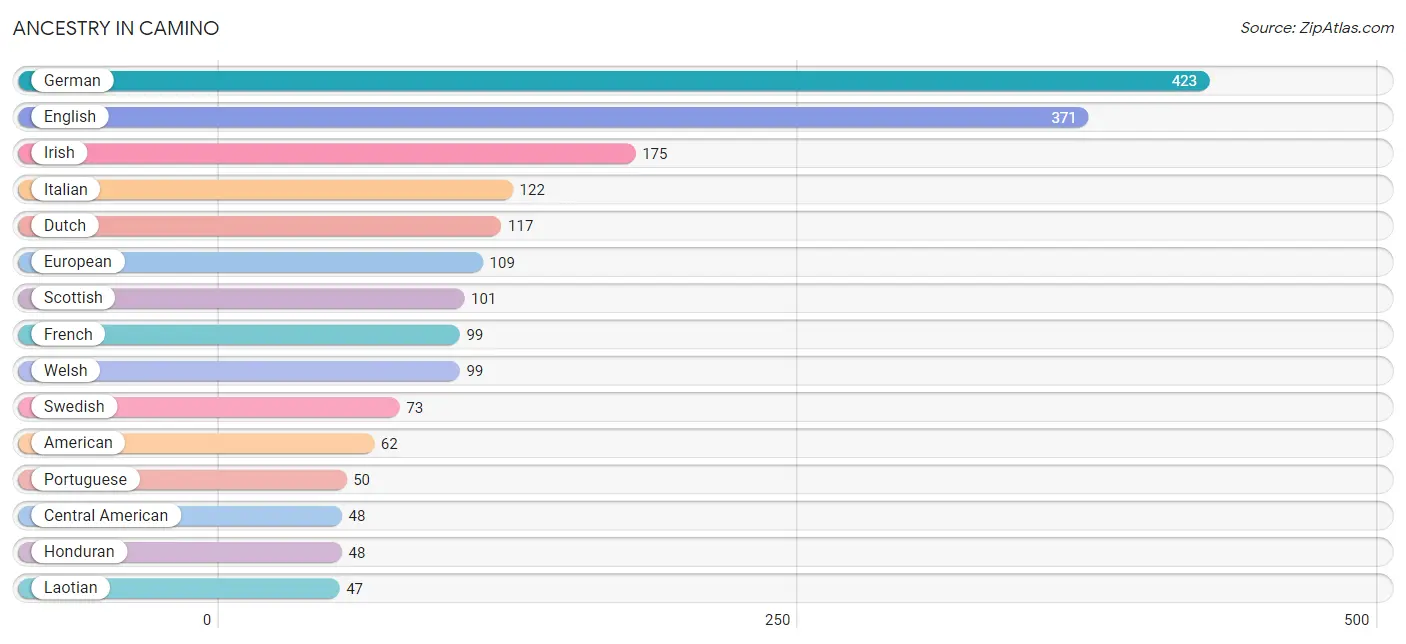
| Ancestry | # Population | % Population |
| American | 62 | 3.1% |
| Bhutanese | 40 | 2.0% |
| British | 38 | 1.9% |
| Burmese | 29 | 1.5% |
| Canadian | 20 | 1.0% |
| Central American | 48 | 2.4% |
| Cherokee | 15 | 0.7% |
| Cuban | 23 | 1.1% |
| Danish | 22 | 1.1% |
| Dutch | 117 | 5.8% |
| English | 371 | 18.5% |
| European | 109 | 5.4% |
| French | 99 | 5.0% |
| German | 423 | 21.1% |
| Honduran | 48 | 2.4% |
| Indian (Asian) | 30 | 1.5% |
| Irish | 175 | 8.7% |
| Italian | 122 | 6.1% |
| Laotian | 47 | 2.4% |
| Marshallese | 22 | 1.1% |
| Mexican | 20 | 1.0% |
| Native Hawaiian | 23 | 1.1% |
| Northern European | 11 | 0.5% |
| Norwegian | 11 | 0.5% |
| Polish | 26 | 1.3% |
| Portuguese | 50 | 2.5% |
| Scotch-Irish | 39 | 1.9% |
| Scottish | 101 | 5.0% |
| Sri Lankan | 7 | 0.4% |
| Swedish | 73 | 3.6% |
| Ukrainian | 30 | 1.5% |
| Welsh | 99 | 5.0% | View All 32 Rows |
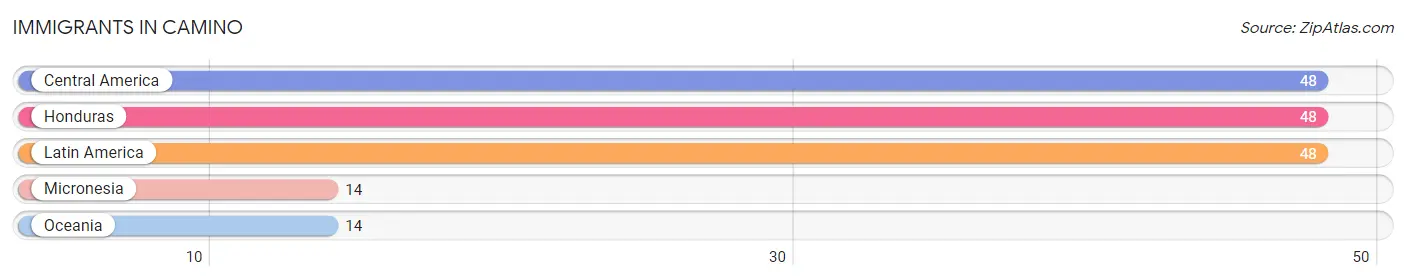
Immigrants in Camino
The most numerous immigrant groups reported in Camino came from Central America (48 | 2.4%), Honduras (48 | 2.4%), Latin America (48 | 2.4%), Micronesia (14 | 0.7%), and Oceania (14 | 0.7%), together accounting for 8.6% of all Camino residents.
| Immigration Origin | # Population | % Population |
| Central America | 48 | 2.4% |
| Honduras | 48 | 2.4% |
| Latin America | 48 | 2.4% |
| Micronesia | 14 | 0.7% |
| Oceania | 14 | 0.7% | View All 5 Rows |
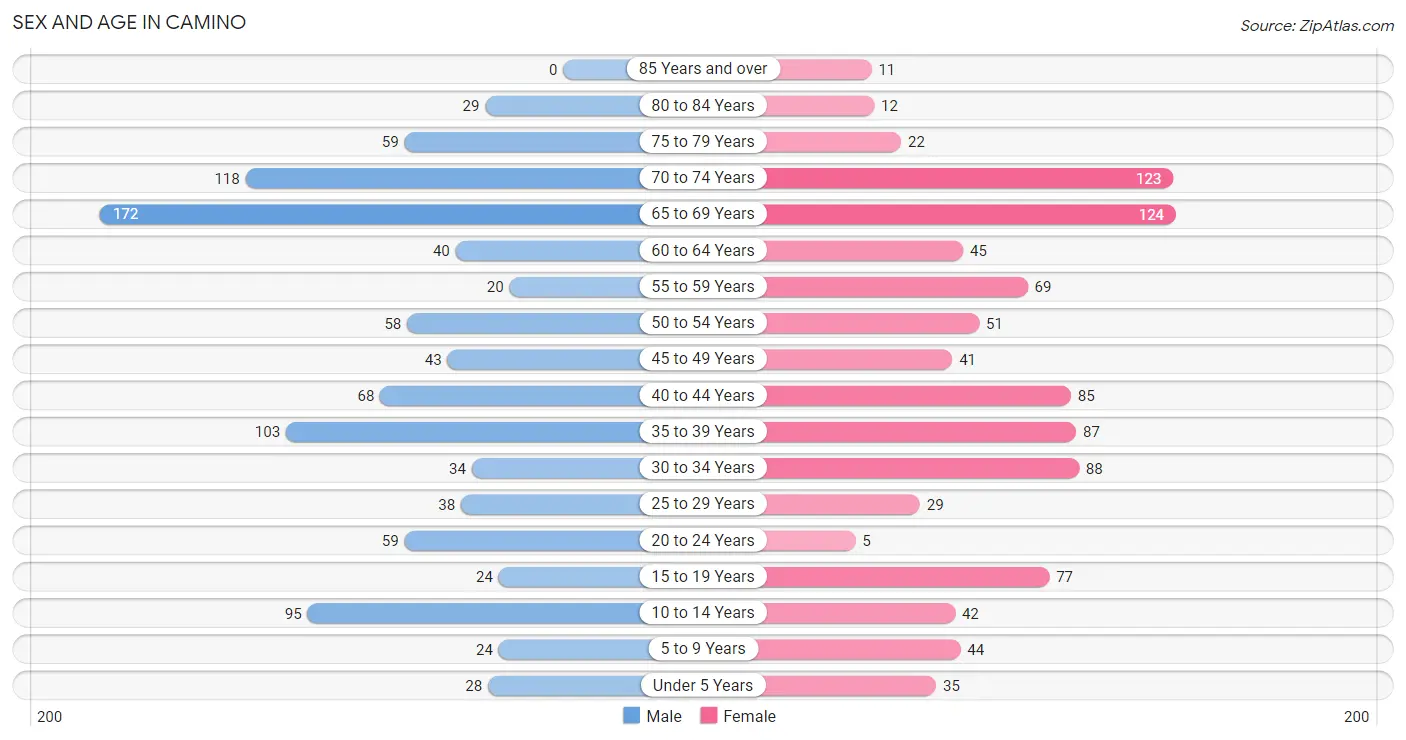
Sex and Age in Camino
Sex and Age in Camino
The most populous age groups in Camino are 65 to 69 Years (172 | 17.0%) for men and 65 to 69 Years (124 | 12.5%) for women.
| Age Bracket | Male | Female |
| Under 5 Years | 28 (2.8%) | 35 (3.5%) |
| 5 to 9 Years | 24 (2.4%) | 44 (4.4%) |
| 10 to 14 Years | 95 (9.4%) | 42 (4.2%) |
| 15 to 19 Years | 24 (2.4%) | 77 (7.8%) |
| 20 to 24 Years | 59 (5.8%) | 5 (0.5%) |
| 25 to 29 Years | 38 (3.7%) | 29 (2.9%) |
| 30 to 34 Years | 34 (3.4%) | 88 (8.9%) |
| 35 to 39 Years | 103 (10.2%) | 87 (8.8%) |
| 40 to 44 Years | 68 (6.7%) | 85 (8.6%) |
| 45 to 49 Years | 43 (4.3%) | 41 (4.1%) |
| 50 to 54 Years | 58 (5.7%) | 51 (5.1%) |
| 55 to 59 Years | 20 (2.0%) | 69 (7.0%) |
| 60 to 64 Years | 40 (4.0%) | 45 (4.5%) |
| 65 to 69 Years | 172 (17.0%) | 124 (12.5%) |
| 70 to 74 Years | 118 (11.7%) | 123 (12.4%) |
| 75 to 79 Years | 59 (5.8%) | 22 (2.2%) |
| 80 to 84 Years | 29 (2.9%) | 12 (1.2%) |
| 85 Years and over | 0 (0.0%) | 11 (1.1%) |
| Total | 1,012 (100.0%) | 990 (100.0%) |
Families and Households in Camino
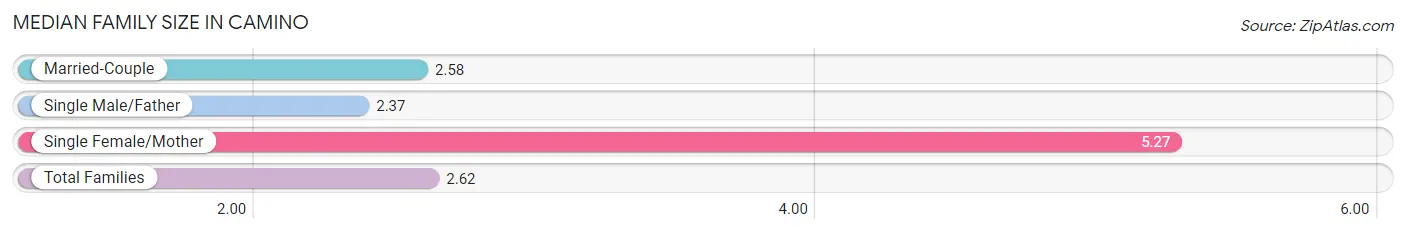
Median Family Size in Camino
The median family size in Camino is 2.62 persons per family, with single female/mother families (15 | 2.1%) accounting for the largest median family size of 5.27 persons per family. On the other hand, single male/father families (54 | 7.7%) represent the smallest median family size with 2.37 persons per family.
| Family Type | # Families | Family Size |
| Married-Couple | 629 (90.1%) | 2.58 |
| Single Male/Father | 54 (7.7%) | 2.37 |
| Single Female/Mother | 15 (2.1%) | 5.27 |
| Total Families | 698 (100.0%) | 2.62 |
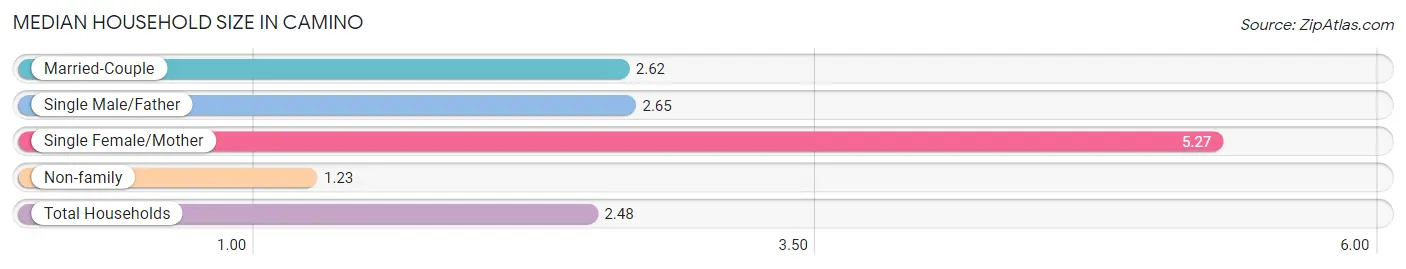
Median Household Size in Camino
The median household size in Camino is 2.48 persons per household, with single female/mother households (15 | 1.9%) accounting for the largest median household size of 5.27 persons per household. non-family households (110 | 13.6%) represent the smallest median household size with 1.23 persons per household.
| Household Type | # Households | Household Size |
| Married-Couple | 629 (77.8%) | 2.62 |
| Single Male/Father | 54 (6.7%) | 2.65 |
| Single Female/Mother | 15 (1.9%) | 5.27 |
| Non-family | 110 (13.6%) | 1.23 |
| Total Households | 808 (100.0%) | 2.48 |
Household Size by Marriage Status in Camino
Out of a total of 808 households in Camino, 698 (86.4%) are family households, while 110 (13.6%) are nonfamily households. The most numerous type of family households are 2-person households, comprising 466, and the most common type of nonfamily households are 1-person households, comprising 87.
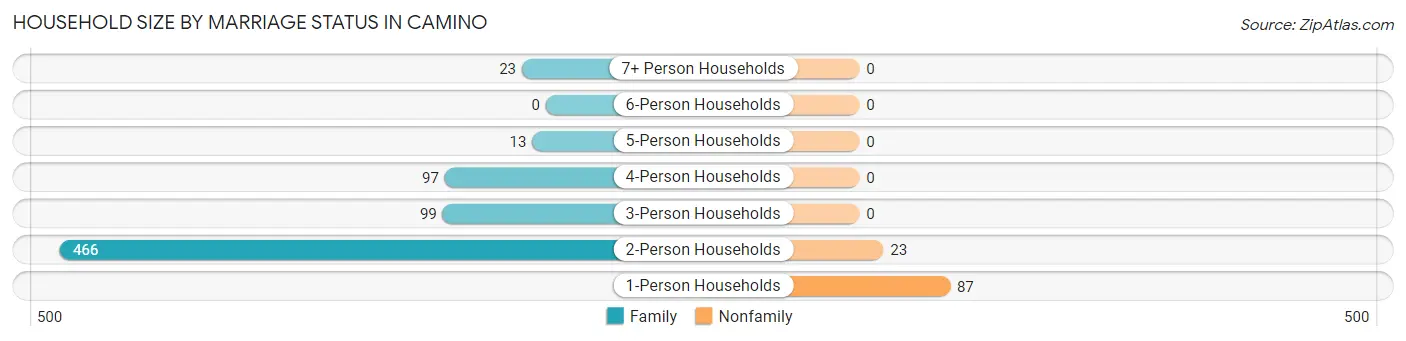
| Household Size | Family Households | Nonfamily Households |
| 1-Person Households | - | 87 (10.8%) |
| 2-Person Households | 466 (57.7%) | 23 (2.9%) |
| 3-Person Households | 99 (12.2%) | 0 (0.0%) |
| 4-Person Households | 97 (12.0%) | 0 (0.0%) |
| 5-Person Households | 13 (1.6%) | 0 (0.0%) |
| 6-Person Households | 0 (0.0%) | 0 (0.0%) |
| 7+ Person Households | 23 (2.9%) | 0 (0.0%) |
| Total | 698 (86.4%) | 110 (13.6%) |
Female Fertility in Camino
Fertility by Age in Camino
| Age Bracket | Women with Births | Births / 1,000 Women |
| 15 to 19 years | 0 (0.0%) | 0.0 |
| 20 to 34 years | 0 (0.0%) | 0.0 |
| 35 to 50 years | 0 (0.0%) | 0.0 |
| Total | 0 (0.0%) | 0.0 |
Fertility by Age by Marriage Status in Camino
| Age Bracket | Married | Unmarried |
| 15 to 19 years | 0 (0.0%) | 0 (0.0%) |
| 20 to 34 years | 0 (0.0%) | 0 (0.0%) |
| 35 to 50 years | 0 (0.0%) | 0 (0.0%) |
| Total | 0 (0.0%) | 0 (0.0%) |
Fertility by Education in Camino
| Educational Attainment | Women with Births | Births / 1,000 Women |
| Less than High School | 0 (0.0%) | 0.0 |
| High School Diploma | 0 (0.0%) | 0.0 |
| College or Associate's Degree | 0 (0.0%) | 0.0 |
| Bachelor's Degree | 0 (0.0%) | 0.0 |
| Graduate Degree | 0 (0.0%) | 0.0 |
| Total | 0 (0.0%) | 0.0 |
Fertility by Education by Marriage Status in Camino
| Educational Attainment | Married | Unmarried |
| Less than High School | 0 (0.0%) | 0 (0.0%) |
| High School Diploma | 0 (0.0%) | 0 (0.0%) |
| College or Associate's Degree | 0 (0.0%) | 0 (0.0%) |
| Bachelor's Degree | 0 (0.0%) | 0 (0.0%) |
| Graduate Degree | 0 (0.0%) | 0 (0.0%) |
| Total | 0 (0.0%) | 0 (0.0%) |
Employment Characteristics in Camino
Employment by Class of Employer in Camino
Among the 765 employed individuals in Camino, private company employees (445 | 58.2%), local government employees (156 | 20.4%), and self-employed (not incorporated) (45 | 5.9%) make up the most common classes of employment.
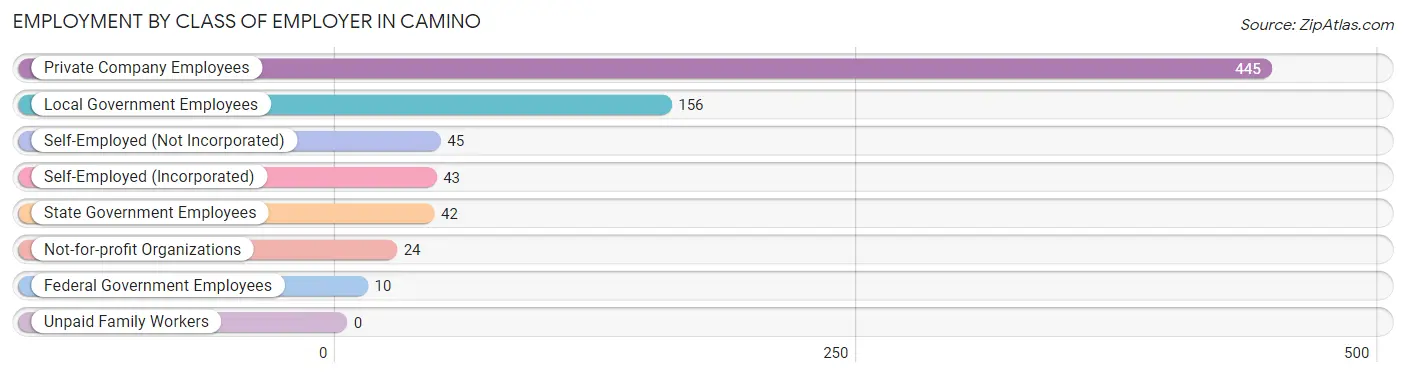
| Employer Class | # Employees | % Employees |
| Private Company Employees | 445 | 58.2% |
| Self-Employed (Incorporated) | 43 | 5.6% |
| Self-Employed (Not Incorporated) | 45 | 5.9% |
| Not-for-profit Organizations | 24 | 3.1% |
| Local Government Employees | 156 | 20.4% |
| State Government Employees | 42 | 5.5% |
| Federal Government Employees | 10 | 1.3% |
| Unpaid Family Workers | 0 | 0.0% |
| Total | 765 | 100.0% |
Employment Status by Age in Camino
According to the labor force statistics for Camino, out of the total population over 16 years of age (1,675), 55.0% or 921 individuals are in the labor force, with 9.9% or 91 of them unemployed. The age group with the highest labor force participation rate is 35 to 44 years, with 94.8% or 325 individuals in the labor force. Within the labor force, the 60 to 64 years age range has the highest percentage of unemployed individuals, with 65.7% or 23 of them being unemployed.
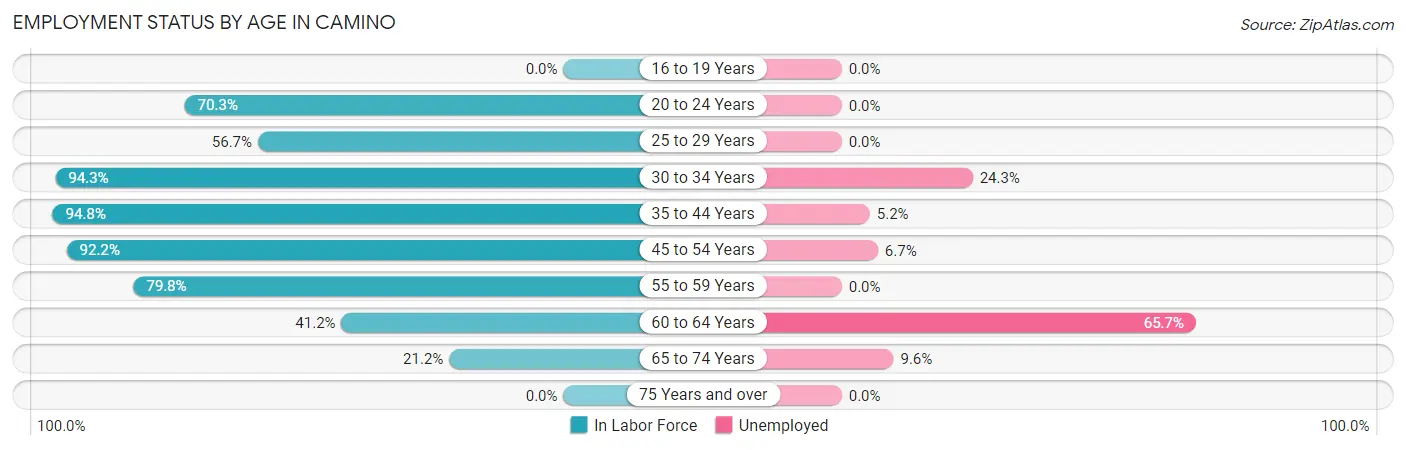
| Age Bracket | In Labor Force | Unemployed |
| 16 to 19 Years | 0 (0.0%) | 0 (0.0%) |
| 20 to 24 Years | 45 (70.3%) | 0 (0.0%) |
| 25 to 29 Years | 38 (56.7%) | 0 (0.0%) |
| 30 to 34 Years | 115 (94.3%) | 28 (24.3%) |
| 35 to 44 Years | 325 (94.8%) | 17 (5.2%) |
| 45 to 54 Years | 178 (92.2%) | 12 (6.7%) |
| 55 to 59 Years | 71 (79.8%) | 0 (0.0%) |
| 60 to 64 Years | 35 (41.2%) | 23 (65.7%) |
| 65 to 74 Years | 114 (21.2%) | 11 (9.6%) |
| 75 Years and over | 0 (0.0%) | 0 (0.0%) |
| Total | 921 (55.0%) | 91 (9.9%) |
Employment Status by Educational Attainment in Camino
According to labor force statistics for Camino, 84.8% of individuals (762) out of the total population between 25 and 64 years of age (899) are in the labor force, with 10.5% or 80 of them being unemployed. The group with the highest labor force participation rate are those with the educational attainment of less than high school, with 100.0% or 15 individuals in the labor force. Within the labor force, individuals with college / associate degree education have the highest percentage of unemployment, with 17.3% or 52 of them being unemployed.
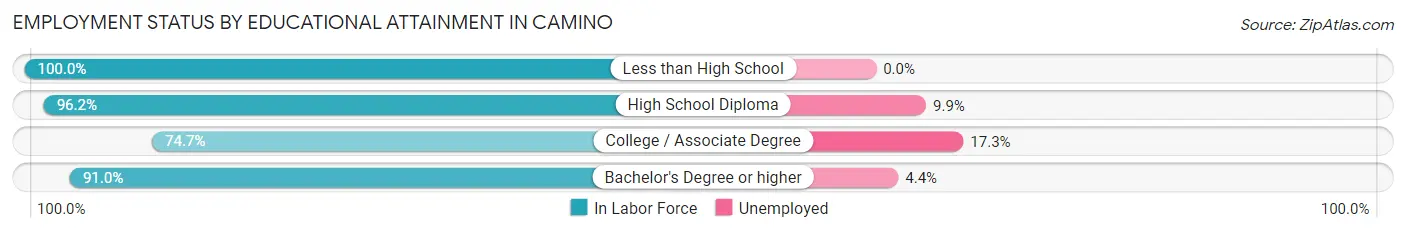
| Educational Attainment | In Labor Force | Unemployed |
| Less than High School | 15 (100.0%) | 0 (0.0%) |
| High School Diploma | 152 (96.2%) | 16 (9.9%) |
| College / Associate Degree | 301 (74.7%) | 70 (17.3%) |
| Bachelor's Degree or higher | 294 (91.0%) | 14 (4.4%) |
| Total | 762 (84.8%) | 94 (10.5%) |
Employment Occupations by Sex in Camino
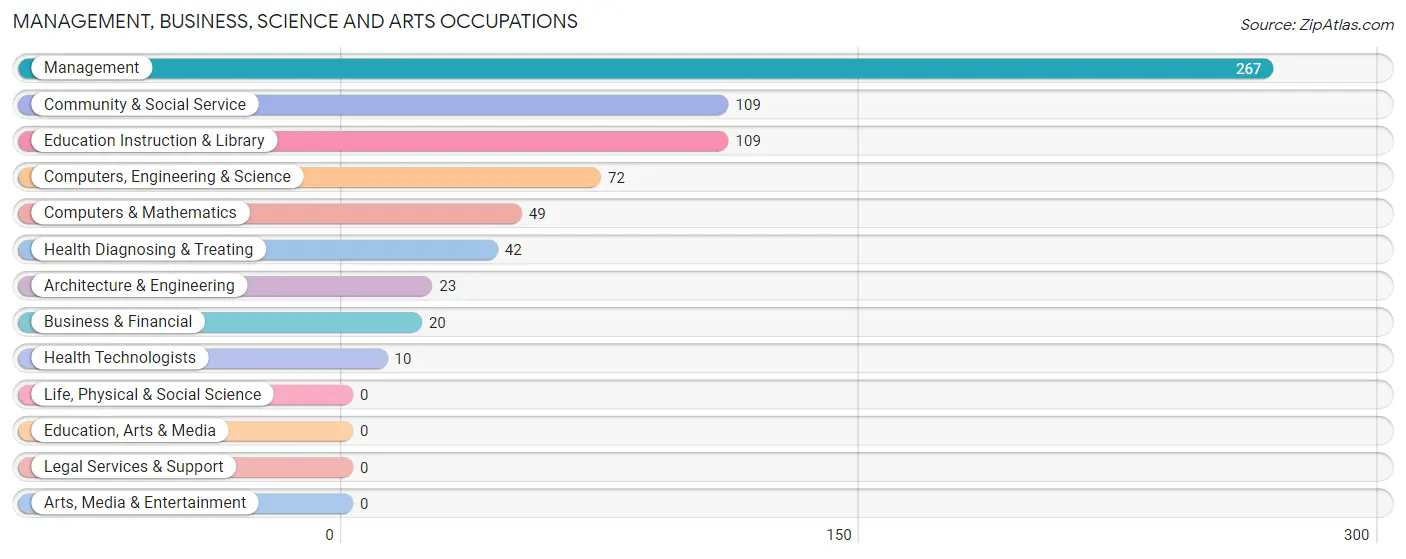
Management, Business, Science and Arts Occupations
The most common Management, Business, Science and Arts occupations in Camino are Management (267 | 32.2%), Community & Social Service (109 | 13.1%), Education Instruction & Library (109 | 13.1%), Computers, Engineering & Science (72 | 8.7%), and Computers & Mathematics (49 | 5.9%).
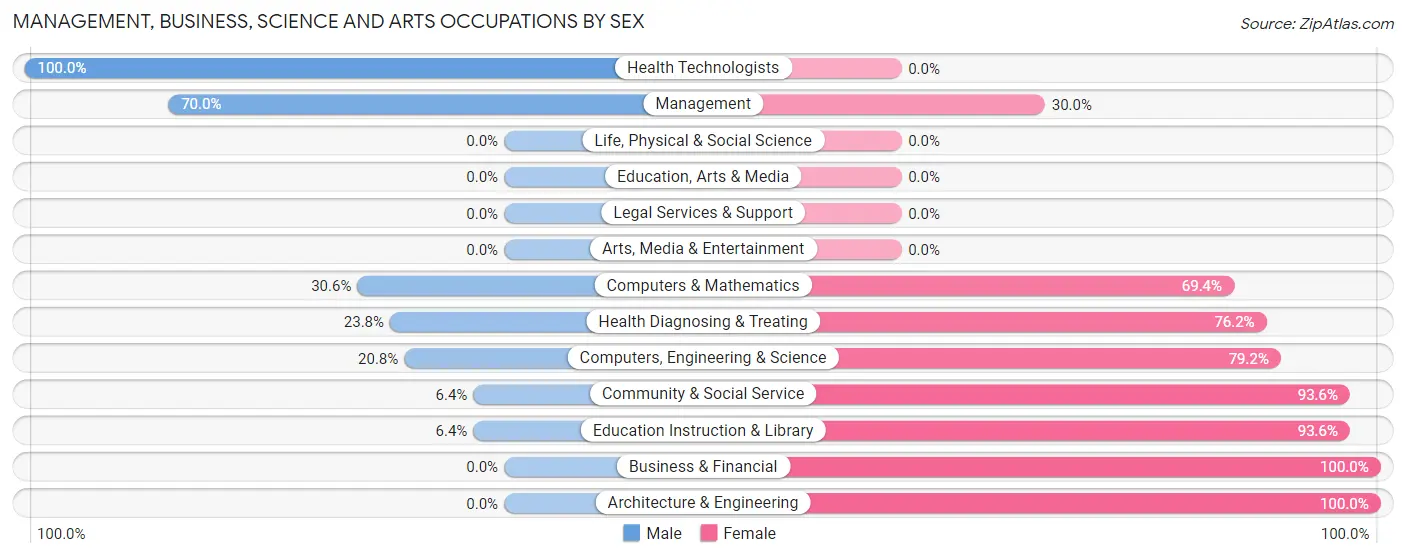
Management, Business, Science and Arts Occupations by Sex
Within the Management, Business, Science and Arts occupations in Camino, the most male-oriented occupations are Health Technologists (100.0%), Management (70.0%), and Computers & Mathematics (30.6%), while the most female-oriented occupations are Business & Financial (100.0%), Architecture & Engineering (100.0%), and Community & Social Service (93.6%).
| Occupation | Male | Female |
| Management | 187 (70.0%) | 80 (30.0%) |
| Business & Financial | 0 (0.0%) | 20 (100.0%) |
| Computers, Engineering & Science | 15 (20.8%) | 57 (79.2%) |
| Computers & Mathematics | 15 (30.6%) | 34 (69.4%) |
| Architecture & Engineering | 0 (0.0%) | 23 (100.0%) |
| Life, Physical & Social Science | 0 (0.0%) | 0 (0.0%) |
| Community & Social Service | 7 (6.4%) | 102 (93.6%) |
| Education, Arts & Media | 0 (0.0%) | 0 (0.0%) |
| Legal Services & Support | 0 (0.0%) | 0 (0.0%) |
| Education Instruction & Library | 7 (6.4%) | 102 (93.6%) |
| Arts, Media & Entertainment | 0 (0.0%) | 0 (0.0%) |
| Health Diagnosing & Treating | 10 (23.8%) | 32 (76.2%) |
| Health Technologists | 10 (100.0%) | 0 (0.0%) |
| Total (Category) | 219 (42.9%) | 291 (57.1%) |
| Total (Overall) | 479 (57.7%) | 351 (42.3%) |
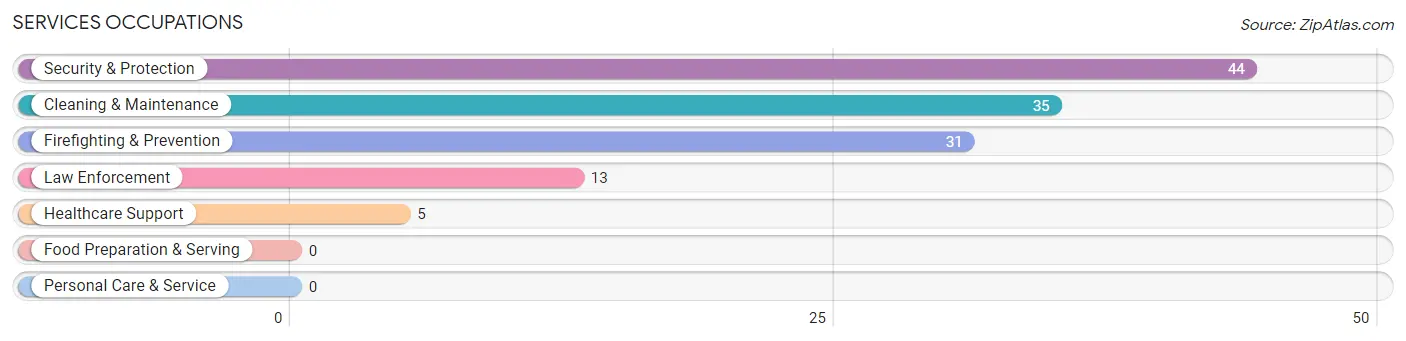
Services Occupations
The most common Services occupations in Camino are Security & Protection (44 | 5.3%), Cleaning & Maintenance (35 | 4.2%), Firefighting & Prevention (31 | 3.7%), Law Enforcement (13 | 1.6%), and Healthcare Support (5 | 0.6%).
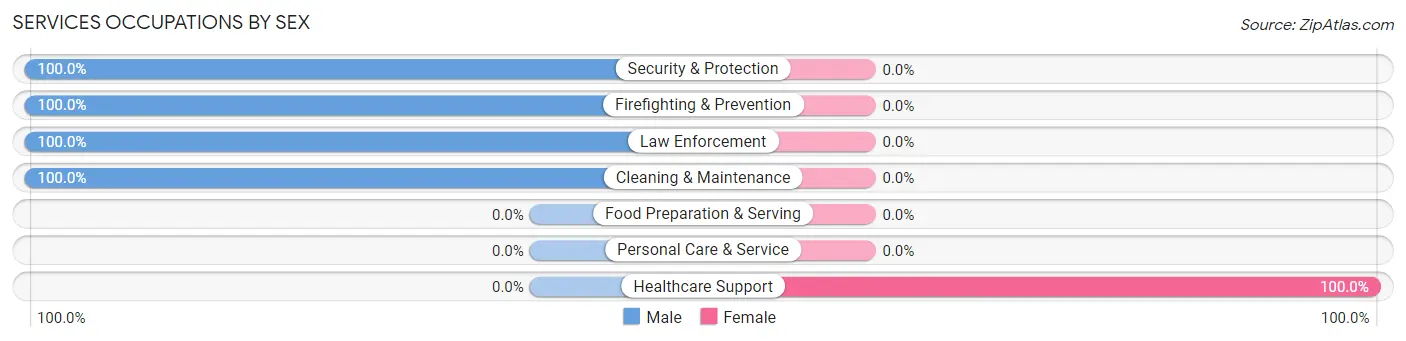
Services Occupations by Sex
| Occupation | Male | Female |
| Healthcare Support | 0 (0.0%) | 5 (100.0%) |
| Security & Protection | 44 (100.0%) | 0 (0.0%) |
| Firefighting & Prevention | 31 (100.0%) | 0 (0.0%) |
| Law Enforcement | 13 (100.0%) | 0 (0.0%) |
| Food Preparation & Serving | 0 (0.0%) | 0 (0.0%) |
| Cleaning & Maintenance | 35 (100.0%) | 0 (0.0%) |
| Personal Care & Service | 0 (0.0%) | 0 (0.0%) |
| Total (Category) | 79 (94.1%) | 5 (5.9%) |
| Total (Overall) | 479 (57.7%) | 351 (42.3%) |
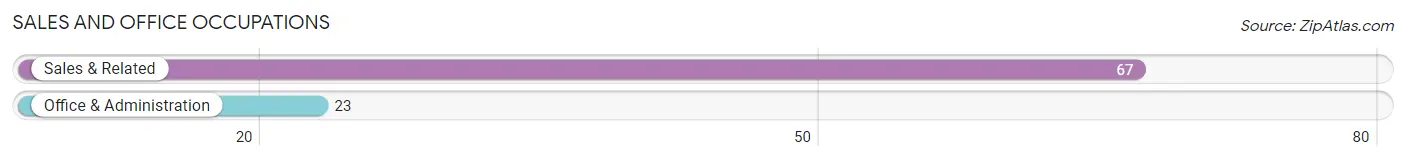
Sales and Office Occupations
The most common Sales and Office occupations in Camino are Sales & Related (67 | 8.1%), and Office & Administration (23 | 2.8%).
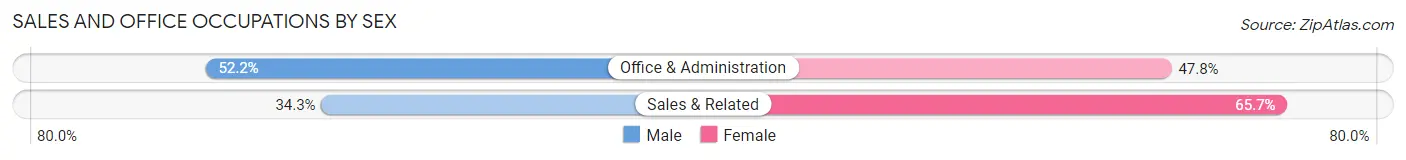
Sales and Office Occupations by Sex
| Occupation | Male | Female |
| Sales & Related | 23 (34.3%) | 44 (65.7%) |
| Office & Administration | 12 (52.2%) | 11 (47.8%) |
| Total (Category) | 35 (38.9%) | 55 (61.1%) |
| Total (Overall) | 479 (57.7%) | 351 (42.3%) |
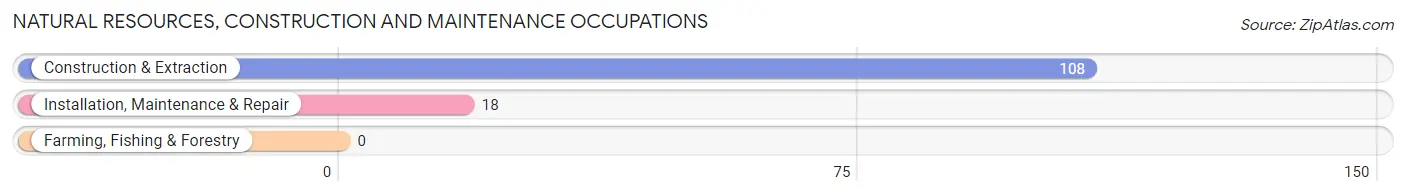
Natural Resources, Construction and Maintenance Occupations
The most common Natural Resources, Construction and Maintenance occupations in Camino are Construction & Extraction (108 | 13.0%), and Installation, Maintenance & Repair (18 | 2.2%).
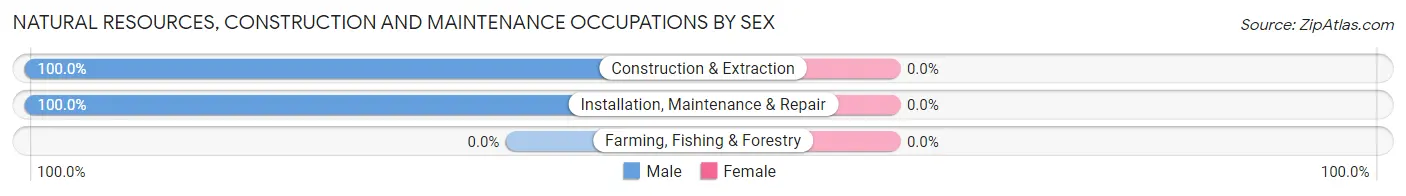
Natural Resources, Construction and Maintenance Occupations by Sex
| Occupation | Male | Female |
| Farming, Fishing & Forestry | 0 (0.0%) | 0 (0.0%) |
| Construction & Extraction | 108 (100.0%) | 0 (0.0%) |
| Installation, Maintenance & Repair | 18 (100.0%) | 0 (0.0%) |
| Total (Category) | 126 (100.0%) | 0 (0.0%) |
| Total (Overall) | 479 (57.7%) | 351 (42.3%) |
Production, Transportation and Moving Occupations
The most common Production, Transportation and Moving occupations in Camino are , and Production (20 | 2.4%).
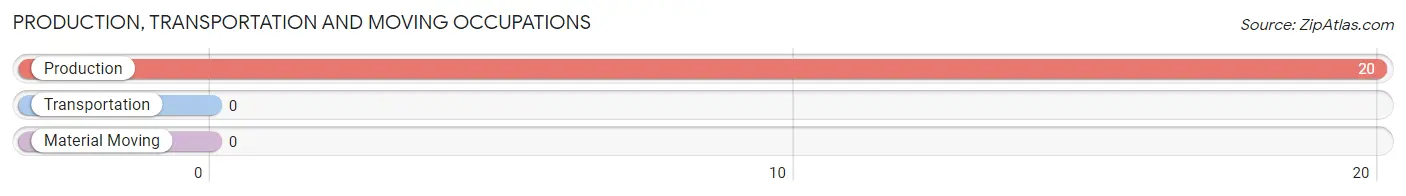
Production, Transportation and Moving Occupations by Sex
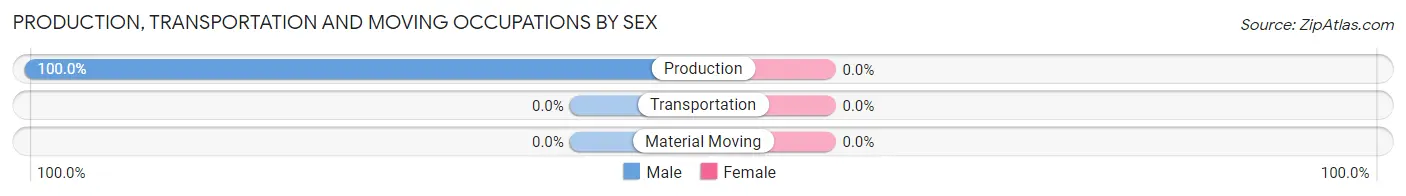
| Occupation | Male | Female |
| Production | 20 (100.0%) | 0 (0.0%) |
| Transportation | 0 (0.0%) | 0 (0.0%) |
| Material Moving | 0 (0.0%) | 0 (0.0%) |
| Total (Category) | 20 (100.0%) | 0 (0.0%) |
| Total (Overall) | 479 (57.7%) | 351 (42.3%) |
Employment Industries by Sex in Camino
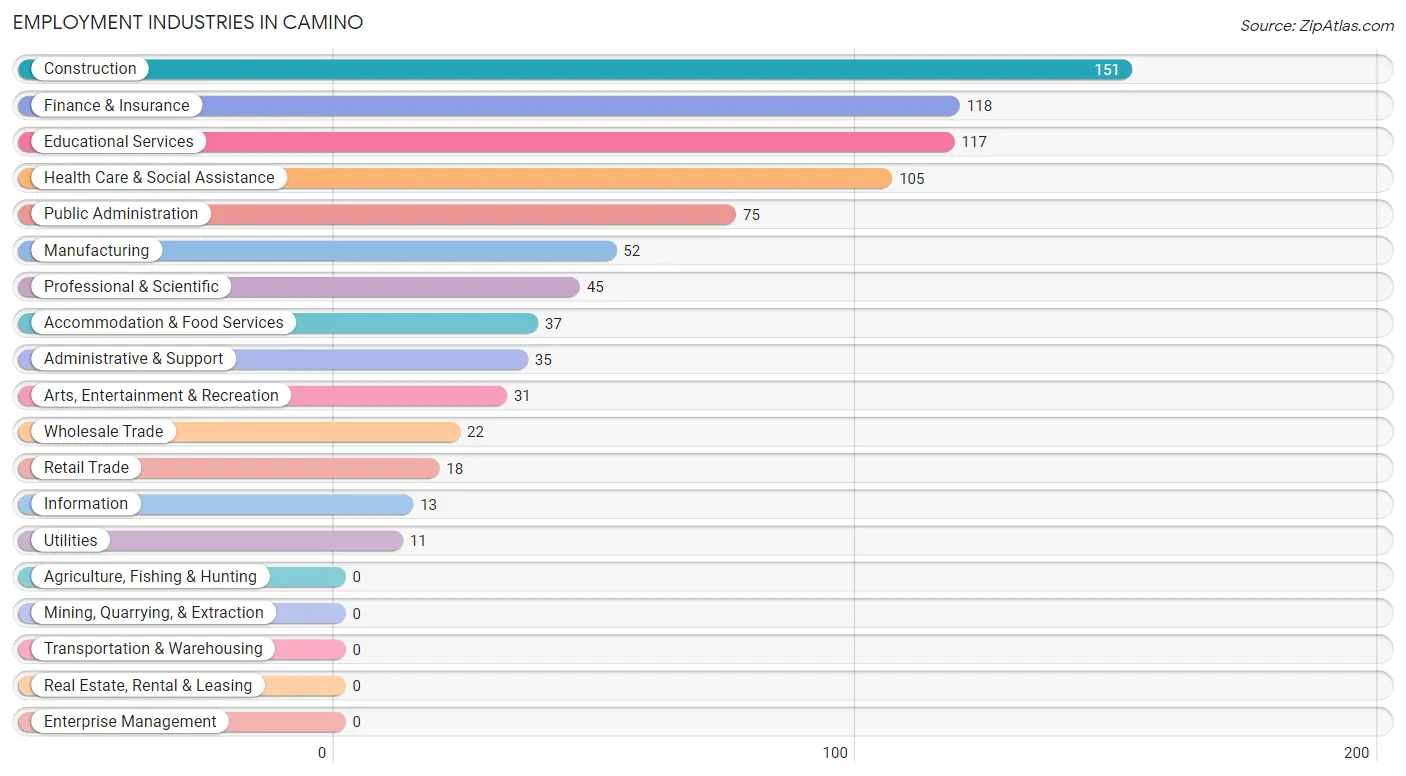
Employment Industries in Camino
The major employment industries in Camino include Construction (151 | 18.2%), Finance & Insurance (118 | 14.2%), Educational Services (117 | 14.1%), Health Care & Social Assistance (105 | 12.7%), and Public Administration (75 | 9.0%).
Employment Industries by Sex in Camino
The Camino industries that see more men than women are Utilities (100.0%), Information (100.0%), and Administrative & Support (100.0%), whereas the industries that tend to have a higher number of women are Health Care & Social Assistance (90.5%), Manufacturing (61.5%), and Educational Services (57.3%).
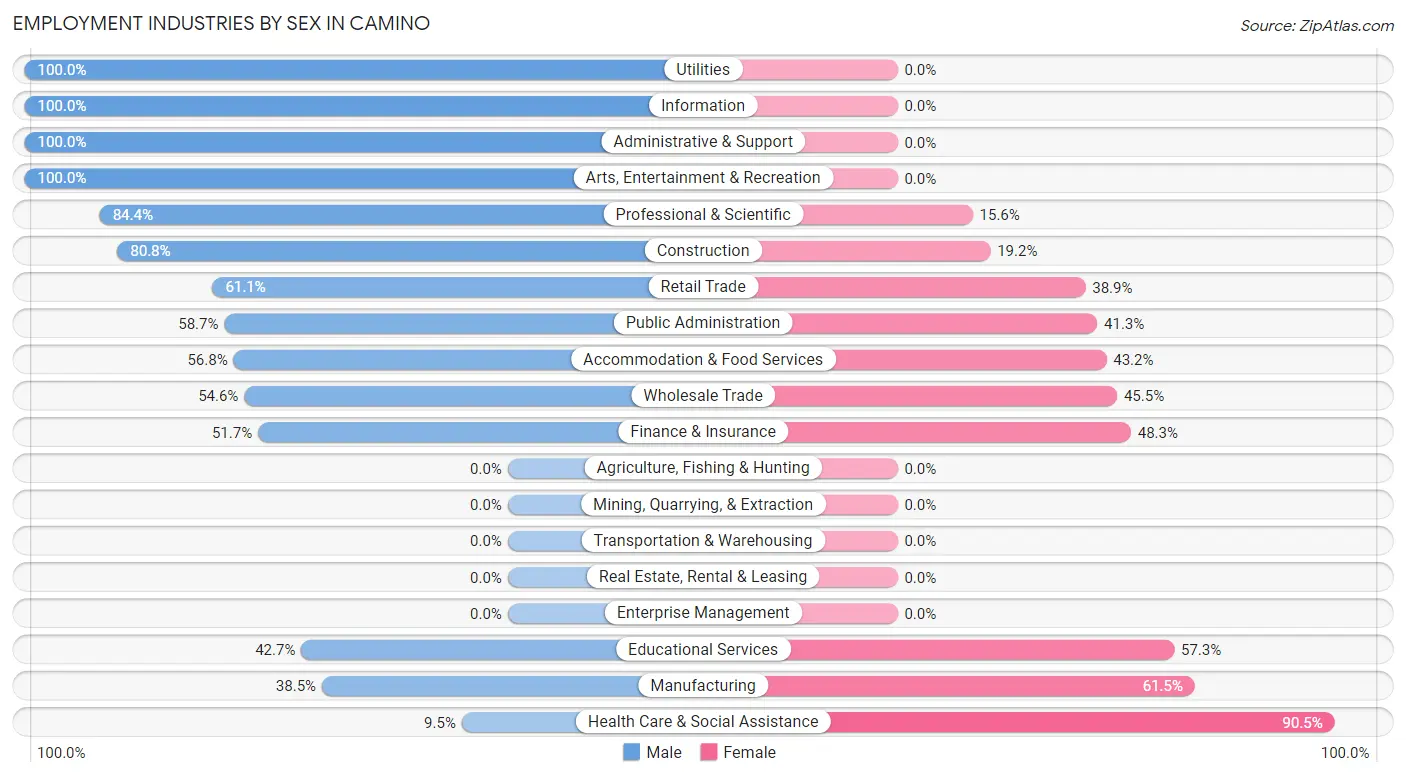
| Industry | Male | Female |
| Agriculture, Fishing & Hunting | 0 (0.0%) | 0 (0.0%) |
| Mining, Quarrying, & Extraction | 0 (0.0%) | 0 (0.0%) |
| Construction | 122 (80.8%) | 29 (19.2%) |
| Manufacturing | 20 (38.5%) | 32 (61.5%) |
| Wholesale Trade | 12 (54.5%) | 10 (45.5%) |
| Retail Trade | 11 (61.1%) | 7 (38.9%) |
| Transportation & Warehousing | 0 (0.0%) | 0 (0.0%) |
| Utilities | 11 (100.0%) | 0 (0.0%) |
| Information | 13 (100.0%) | 0 (0.0%) |
| Finance & Insurance | 61 (51.7%) | 57 (48.3%) |
| Real Estate, Rental & Leasing | 0 (0.0%) | 0 (0.0%) |
| Professional & Scientific | 38 (84.4%) | 7 (15.6%) |
| Enterprise Management | 0 (0.0%) | 0 (0.0%) |
| Administrative & Support | 35 (100.0%) | 0 (0.0%) |
| Educational Services | 50 (42.7%) | 67 (57.3%) |
| Health Care & Social Assistance | 10 (9.5%) | 95 (90.5%) |
| Arts, Entertainment & Recreation | 31 (100.0%) | 0 (0.0%) |
| Accommodation & Food Services | 21 (56.8%) | 16 (43.2%) |
| Public Administration | 44 (58.7%) | 31 (41.3%) |
| Total | 479 (57.7%) | 351 (42.3%) |
Education in Camino
School Enrollment in Camino
The most common levels of schooling among the 421 students in Camino are high school (131 | 31.1%), middle school (102 | 24.2%), and elementary school (77 | 18.3%).
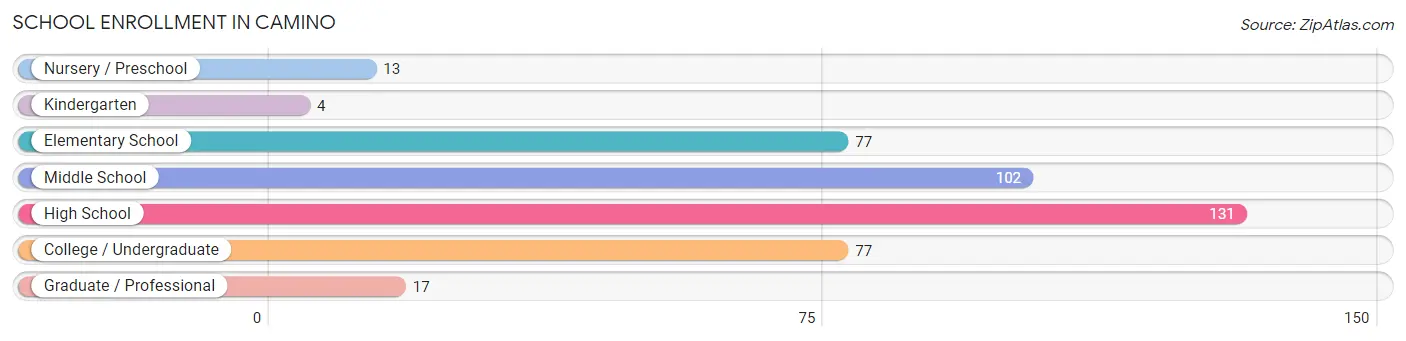
| School Level | # Students | % Students |
| Nursery / Preschool | 13 | 3.1% |
| Kindergarten | 4 | 0.9% |
| Elementary School | 77 | 18.3% |
| Middle School | 102 | 24.2% |
| High School | 131 | 31.1% |
| College / Undergraduate | 77 | 18.3% |
| Graduate / Professional | 17 | 4.0% |
| Total | 421 | 100.0% |
School Enrollment by Age by Funding Source in Camino
Out of a total of 421 students who are enrolled in schools in Camino, 54 (12.8%) attend a private institution, while the remaining 367 (87.2%) are enrolled in public schools. The age group of 3 to 4 year olds has the highest likelihood of being enrolled in private schools, with 13 (100.0% in the age bracket) enrolled. Conversely, the age group of 5 to 9 year old has the lowest likelihood of being enrolled in a private school, with 68 (100.0% in the age bracket) attending a public institution.
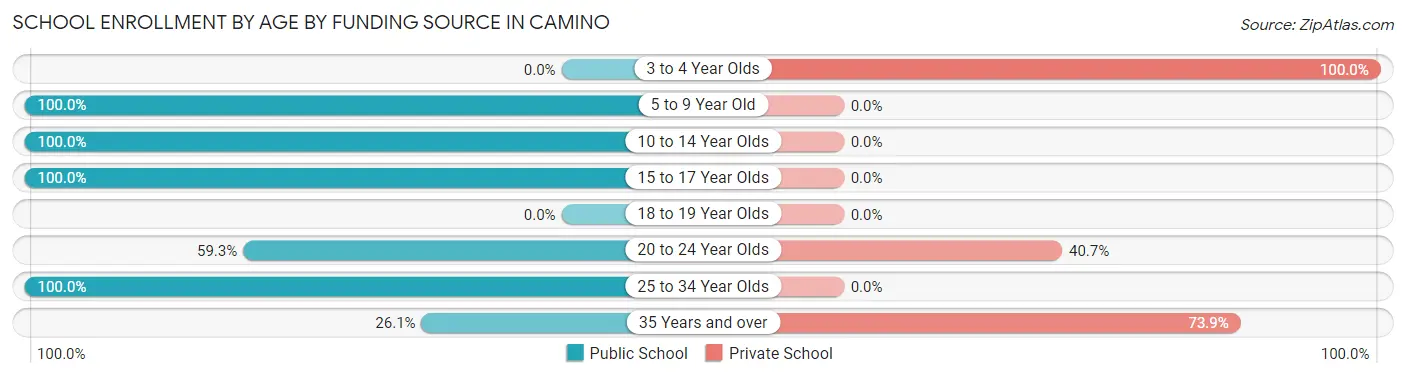
| Age Bracket | Public School | Private School |
| 3 to 4 Year Olds | 0 (0.0%) | 13 (100.0%) |
| 5 to 9 Year Old | 68 (100.0%) | 0 (0.0%) |
| 10 to 14 Year Olds | 137 (100.0%) | 0 (0.0%) |
| 15 to 17 Year Olds | 90 (100.0%) | 0 (0.0%) |
| 18 to 19 Year Olds | 0 (0.0%) | 0 (0.0%) |
| 20 to 24 Year Olds | 35 (59.3%) | 24 (40.7%) |
| 25 to 34 Year Olds | 31 (100.0%) | 0 (0.0%) |
| 35 Years and over | 6 (26.1%) | 17 (73.9%) |
| Total | 367 (87.2%) | 54 (12.8%) |
Educational Attainment by Field of Study in Camino
Business (109 | 20.1%), communications (71 | 13.1%), social sciences (59 | 10.9%), arts & humanities (56 | 10.3%), and science & technology (51 | 9.4%) are the most common fields of study among 542 individuals in Camino who have obtained a bachelor's degree or higher.
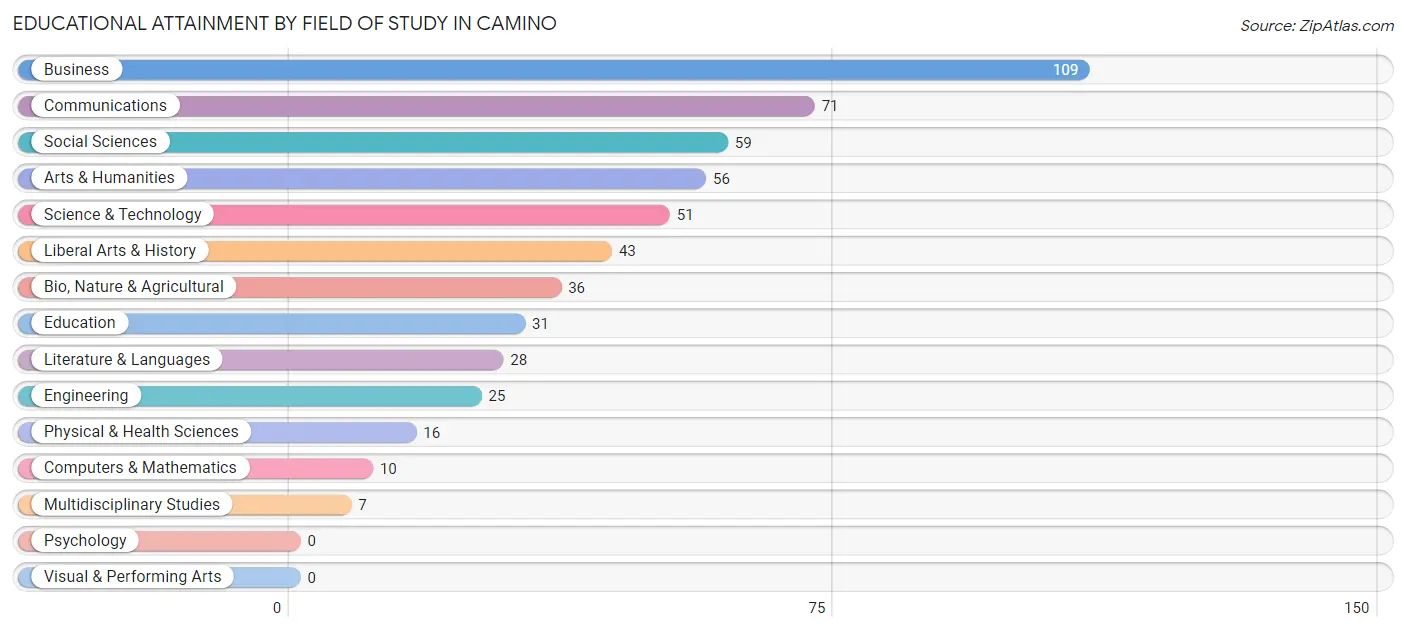
| Field of Study | # Graduates | % Graduates |
| Computers & Mathematics | 10 | 1.8% |
| Bio, Nature & Agricultural | 36 | 6.6% |
| Physical & Health Sciences | 16 | 2.9% |
| Psychology | 0 | 0.0% |
| Social Sciences | 59 | 10.9% |
| Engineering | 25 | 4.6% |
| Multidisciplinary Studies | 7 | 1.3% |
| Science & Technology | 51 | 9.4% |
| Business | 109 | 20.1% |
| Education | 31 | 5.7% |
| Literature & Languages | 28 | 5.2% |
| Liberal Arts & History | 43 | 7.9% |
| Visual & Performing Arts | 0 | 0.0% |
| Communications | 71 | 13.1% |
| Arts & Humanities | 56 | 10.3% |
| Total | 542 | 100.0% |
Transportation & Commute in Camino
Vehicle Availability by Sex in Camino
The most prevalent vehicle ownership categories in Camino are males with 2 vehicles (166, accounting for 38.9%) and females with 2 vehicles (108, making up 49.1%).
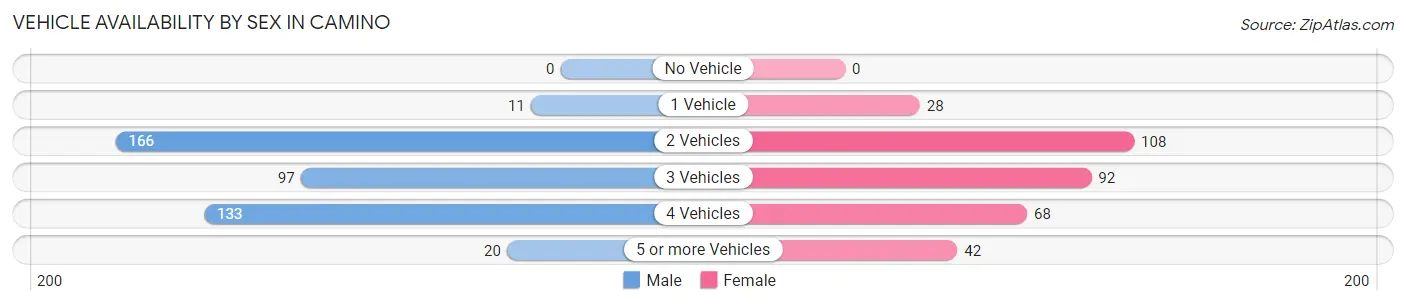
| Vehicles Available | Male | Female |
| No Vehicle | 0 (0.0%) | 0 (0.0%) |
| 1 Vehicle | 11 (2.6%) | 28 (8.3%) |
| 2 Vehicles | 166 (38.9%) | 108 (32.0%) |
| 3 Vehicles | 97 (22.7%) | 92 (27.2%) |
| 4 Vehicles | 133 (31.1%) | 68 (20.1%) |
| 5 or more Vehicles | 20 (4.7%) | 42 (12.4%) |
| Total | 427 (100.0%) | 338 (100.0%) |
Commute Time in Camino
The most frequently occuring commute durations in Camino are 15 to 19 minutes (132 commuters, 19.2%), 45 to 59 minutes (109 commuters, 15.9%), and 10 to 14 minutes (103 commuters, 15.0%).
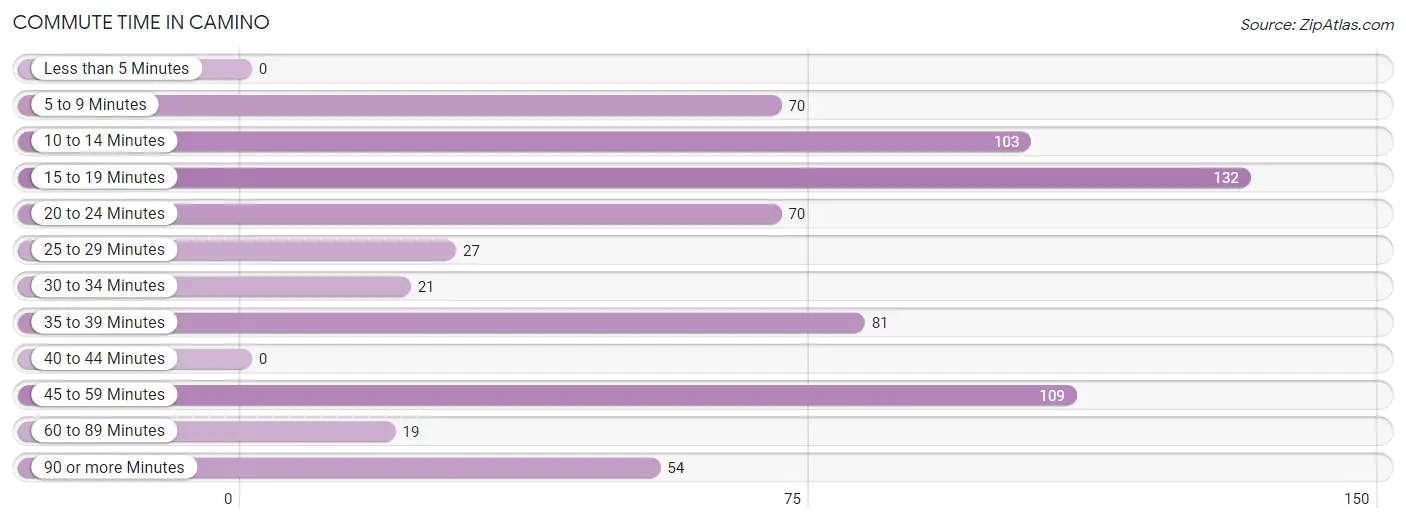
| Commute Time | # Commuters | % Commuters |
| Less than 5 Minutes | 0 | 0.0% |
| 5 to 9 Minutes | 70 | 10.2% |
| 10 to 14 Minutes | 103 | 15.0% |
| 15 to 19 Minutes | 132 | 19.2% |
| 20 to 24 Minutes | 70 | 10.2% |
| 25 to 29 Minutes | 27 | 3.9% |
| 30 to 34 Minutes | 21 | 3.1% |
| 35 to 39 Minutes | 81 | 11.8% |
| 40 to 44 Minutes | 0 | 0.0% |
| 45 to 59 Minutes | 109 | 15.9% |
| 60 to 89 Minutes | 19 | 2.8% |
| 90 or more Minutes | 54 | 7.9% |
Commute Time by Sex in Camino
The most common commute times in Camino are 35 to 39 minutes (81 commuters, 20.5%) for males and 15 to 19 minutes (101 commuters, 34.7%) for females.
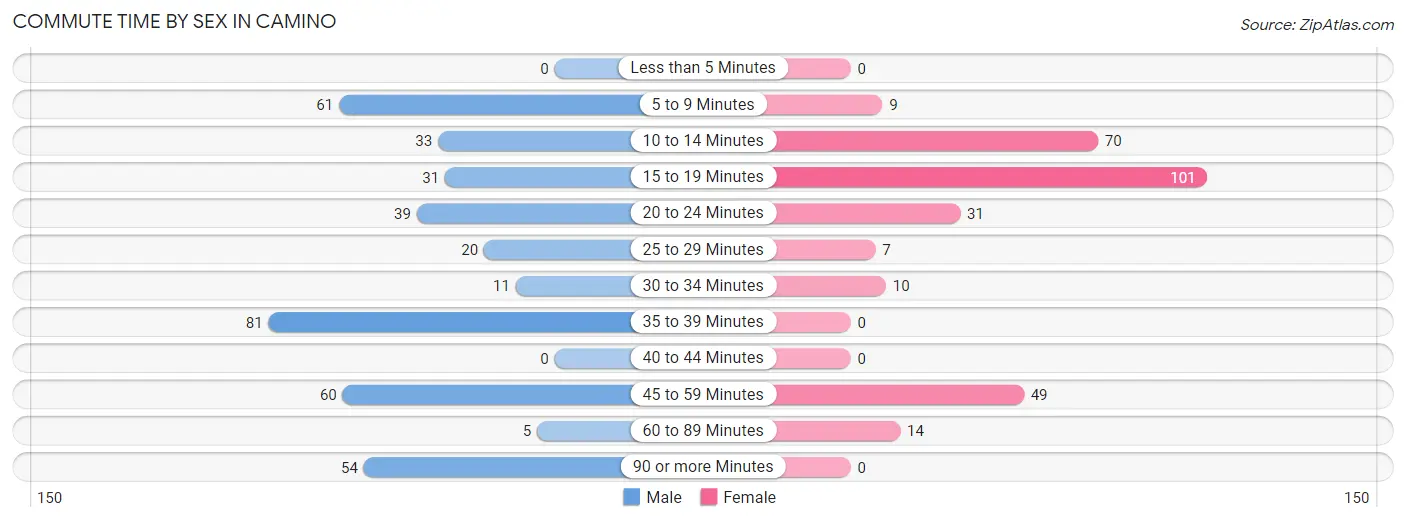
| Commute Time | Male | Female |
| Less than 5 Minutes | 0 (0.0%) | 0 (0.0%) |
| 5 to 9 Minutes | 61 (15.4%) | 9 (3.1%) |
| 10 to 14 Minutes | 33 (8.4%) | 70 (24.0%) |
| 15 to 19 Minutes | 31 (7.9%) | 101 (34.7%) |
| 20 to 24 Minutes | 39 (9.9%) | 31 (10.6%) |
| 25 to 29 Minutes | 20 (5.1%) | 7 (2.4%) |
| 30 to 34 Minutes | 11 (2.8%) | 10 (3.4%) |
| 35 to 39 Minutes | 81 (20.5%) | 0 (0.0%) |
| 40 to 44 Minutes | 0 (0.0%) | 0 (0.0%) |
| 45 to 59 Minutes | 60 (15.2%) | 49 (16.8%) |
| 60 to 89 Minutes | 5 (1.3%) | 14 (4.8%) |
| 90 or more Minutes | 54 (13.7%) | 0 (0.0%) |
Time of Departure to Work by Sex in Camino
The most frequent times of departure to work in Camino are 7:30 AM to 7:59 AM (88, 22.3%) for males and 7:00 AM to 7:29 AM (62, 21.3%) for females.
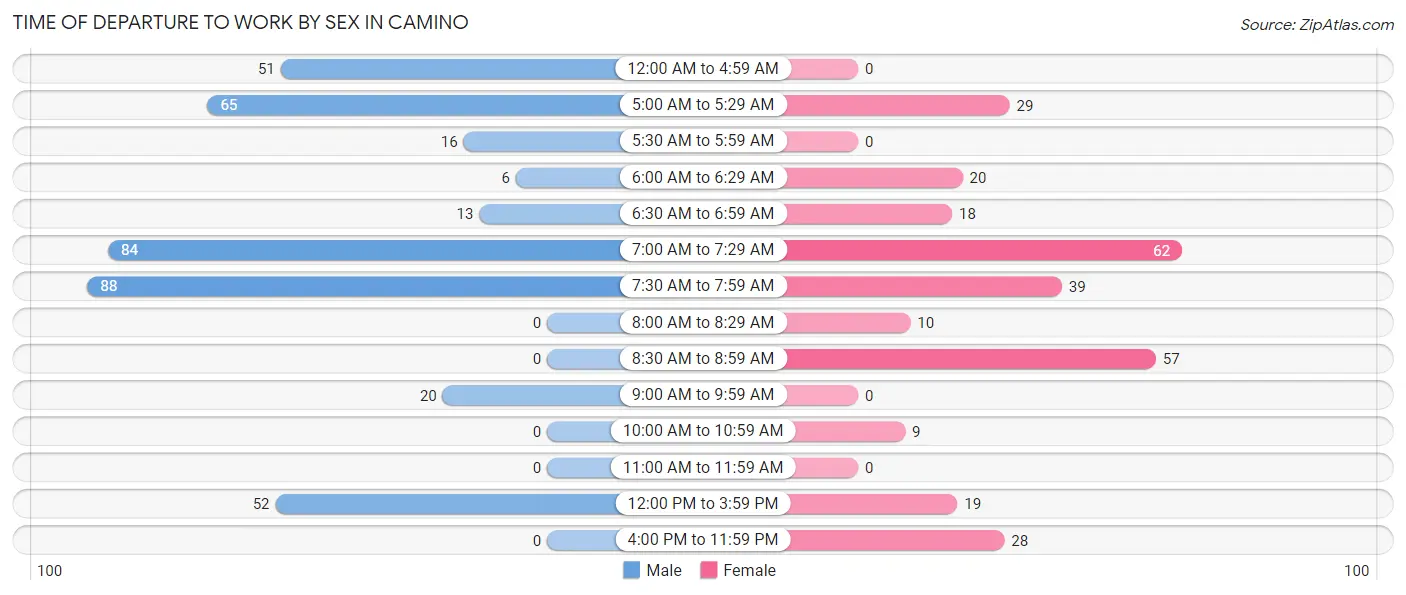
| Time of Departure | Male | Female |
| 12:00 AM to 4:59 AM | 51 (12.9%) | 0 (0.0%) |
| 5:00 AM to 5:29 AM | 65 (16.5%) | 29 (10.0%) |
| 5:30 AM to 5:59 AM | 16 (4.1%) | 0 (0.0%) |
| 6:00 AM to 6:29 AM | 6 (1.5%) | 20 (6.9%) |
| 6:30 AM to 6:59 AM | 13 (3.3%) | 18 (6.2%) |
| 7:00 AM to 7:29 AM | 84 (21.3%) | 62 (21.3%) |
| 7:30 AM to 7:59 AM | 88 (22.3%) | 39 (13.4%) |
| 8:00 AM to 8:29 AM | 0 (0.0%) | 10 (3.4%) |
| 8:30 AM to 8:59 AM | 0 (0.0%) | 57 (19.6%) |
| 9:00 AM to 9:59 AM | 20 (5.1%) | 0 (0.0%) |
| 10:00 AM to 10:59 AM | 0 (0.0%) | 9 (3.1%) |
| 11:00 AM to 11:59 AM | 0 (0.0%) | 0 (0.0%) |
| 12:00 PM to 3:59 PM | 52 (13.2%) | 19 (6.5%) |
| 4:00 PM to 11:59 PM | 0 (0.0%) | 28 (9.6%) |
| Total | 395 (100.0%) | 291 (100.0%) |
Housing Occupancy in Camino
Occupancy by Ownership in Camino
Of the total 808 dwellings in Camino, owner-occupied units account for 603 (74.6%), while renter-occupied units make up 205 (25.4%).
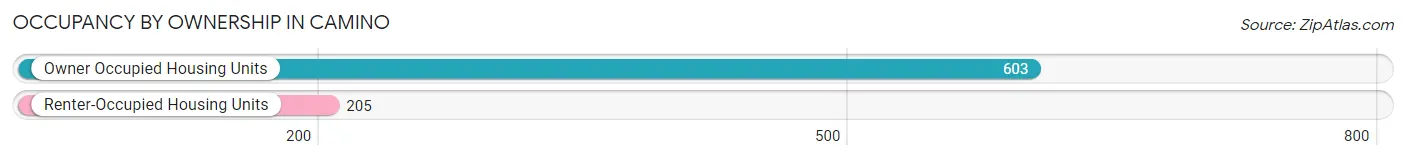
| Occupancy | # Housing Units | % Housing Units |
| Owner Occupied Housing Units | 603 | 74.6% |
| Renter-Occupied Housing Units | 205 | 25.4% |
| Total Occupied Housing Units | 808 | 100.0% |
Occupancy by Household Size in Camino
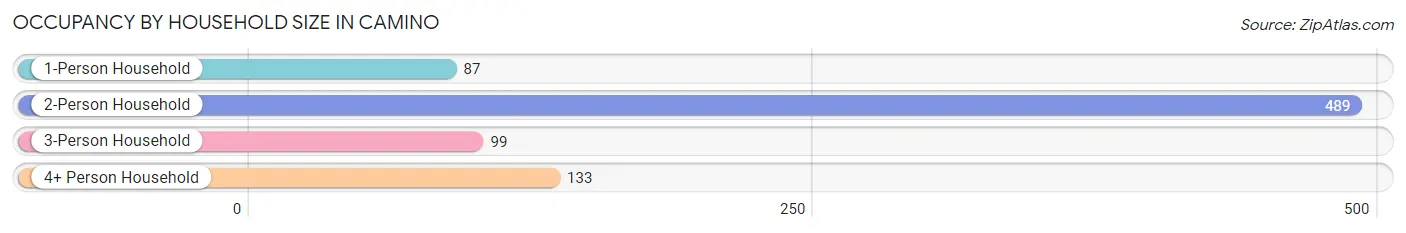
| Household Size | # Housing Units | % Housing Units |
| 1-Person Household | 87 | 10.8% |
| 2-Person Household | 489 | 60.5% |
| 3-Person Household | 99 | 12.2% |
| 4+ Person Household | 133 | 16.5% |
| Total Housing Units | 808 | 100.0% |
Occupancy by Ownership by Household Size in Camino
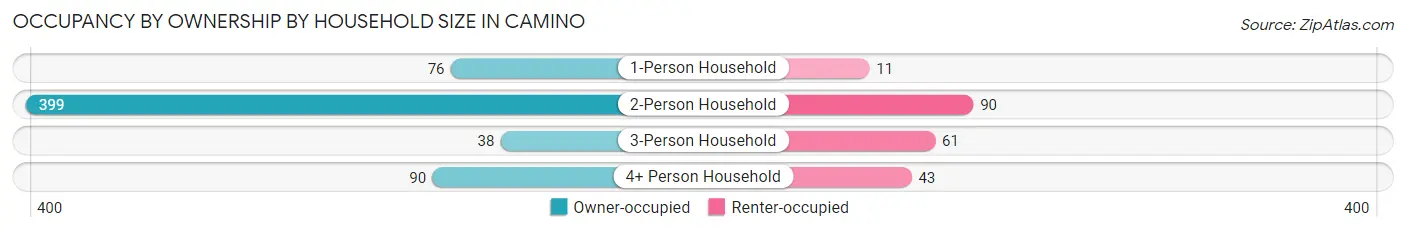
| Household Size | Owner-occupied | Renter-occupied |
| 1-Person Household | 76 (87.4%) | 11 (12.6%) |
| 2-Person Household | 399 (81.6%) | 90 (18.4%) |
| 3-Person Household | 38 (38.4%) | 61 (61.6%) |
| 4+ Person Household | 90 (67.7%) | 43 (32.3%) |
| Total Housing Units | 603 (74.6%) | 205 (25.4%) |
Occupancy by Educational Attainment in Camino
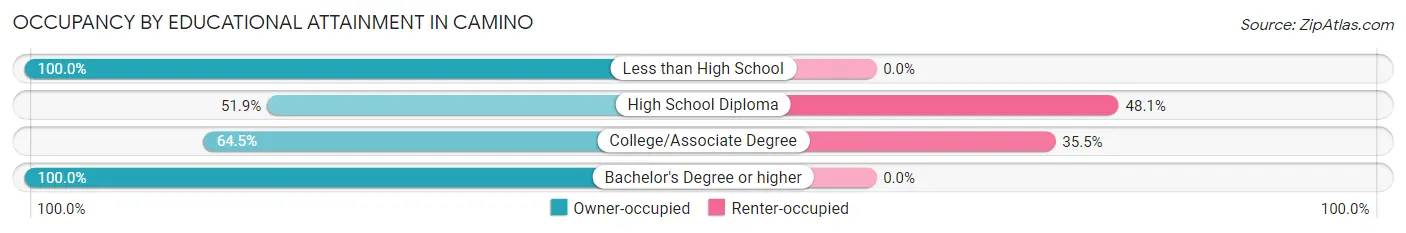
| Household Size | Owner-occupied | Renter-occupied |
| Less than High School | 11 (100.0%) | 0 (0.0%) |
| High School Diploma | 94 (51.9%) | 87 (48.1%) |
| College/Associate Degree | 214 (64.5%) | 118 (35.5%) |
| Bachelor's Degree or higher | 284 (100.0%) | 0 (0.0%) |
Occupancy by Age of Householder in Camino
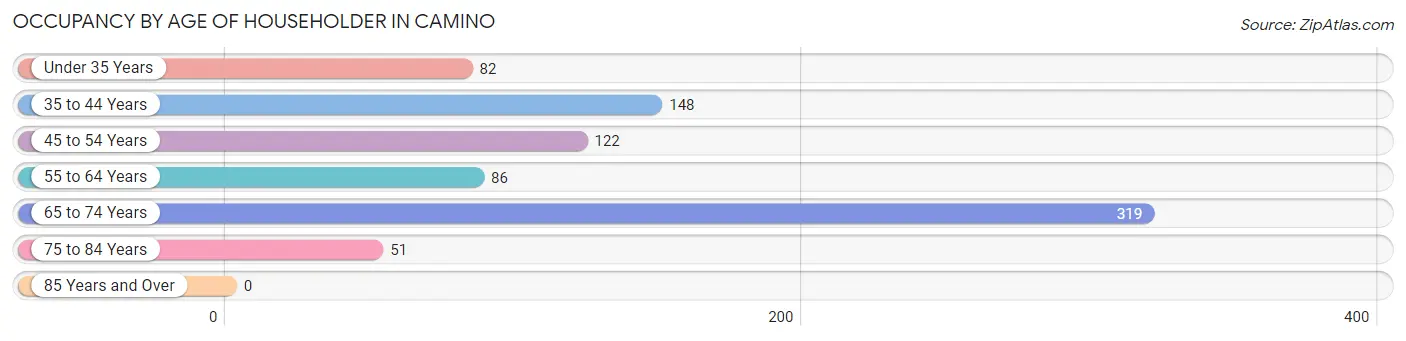
| Age Bracket | # Households | % Households |
| Under 35 Years | 82 | 10.2% |
| 35 to 44 Years | 148 | 18.3% |
| 45 to 54 Years | 122 | 15.1% |
| 55 to 64 Years | 86 | 10.6% |
| 65 to 74 Years | 319 | 39.5% |
| 75 to 84 Years | 51 | 6.3% |
| 85 Years and Over | 0 | 0.0% |
| Total | 808 | 100.0% |
Housing Finances in Camino
Median Income by Occupancy in Camino
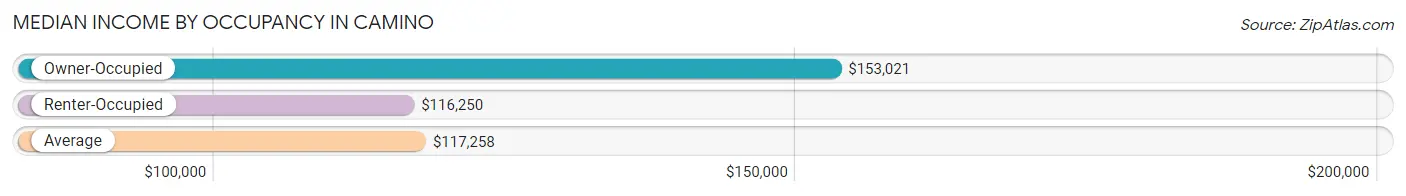
| Occupancy Type | # Households | Median Income |
| Owner-Occupied | 603 (74.6%) | $153,021 |
| Renter-Occupied | 205 (25.4%) | $116,250 |
| Average | 808 (100.0%) | $117,258 |
Occupancy by Householder Income Bracket in Camino
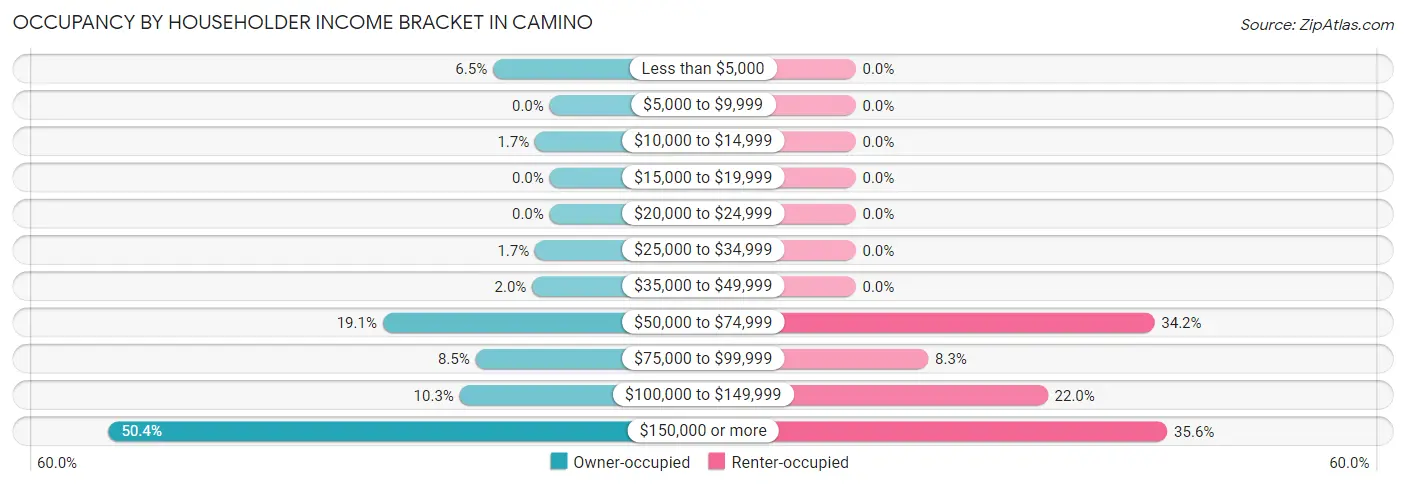
| Income Bracket | Owner-occupied | Renter-occupied |
| Less than $5,000 | 39 (6.5%) | 0 (0.0%) |
| $5,000 to $9,999 | 0 (0.0%) | 0 (0.0%) |
| $10,000 to $14,999 | 10 (1.7%) | 0 (0.0%) |
| $15,000 to $19,999 | 0 (0.0%) | 0 (0.0%) |
| $20,000 to $24,999 | 0 (0.0%) | 0 (0.0%) |
| $25,000 to $34,999 | 10 (1.7%) | 0 (0.0%) |
| $35,000 to $49,999 | 12 (2.0%) | 0 (0.0%) |
| $50,000 to $74,999 | 115 (19.1%) | 70 (34.2%) |
| $75,000 to $99,999 | 51 (8.5%) | 17 (8.3%) |
| $100,000 to $149,999 | 62 (10.3%) | 45 (22.0%) |
| $150,000 or more | 304 (50.4%) | 73 (35.6%) |
| Total | 603 (100.0%) | 205 (100.0%) |
Monthly Housing Cost Tiers in Camino
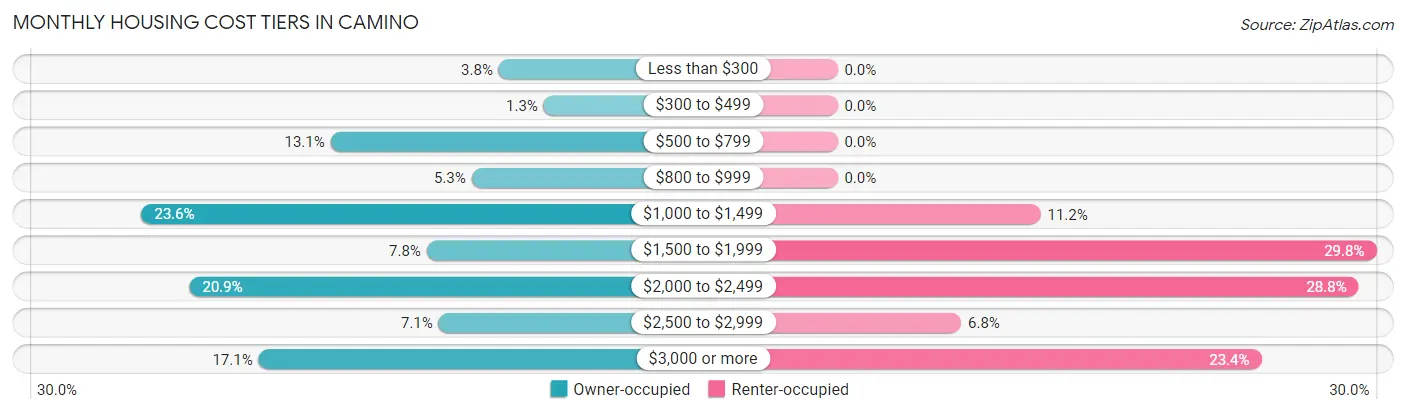
| Monthly Cost | Owner-occupied | Renter-occupied |
| Less than $300 | 23 (3.8%) | 0 (0.0%) |
| $300 to $499 | 8 (1.3%) | 0 (0.0%) |
| $500 to $799 | 79 (13.1%) | 0 (0.0%) |
| $800 to $999 | 32 (5.3%) | 0 (0.0%) |
| $1,000 to $1,499 | 142 (23.5%) | 23 (11.2%) |
| $1,500 to $1,999 | 47 (7.8%) | 61 (29.8%) |
| $2,000 to $2,499 | 126 (20.9%) | 59 (28.8%) |
| $2,500 to $2,999 | 43 (7.1%) | 14 (6.8%) |
| $3,000 or more | 103 (17.1%) | 48 (23.4%) |
| Total | 603 (100.0%) | 205 (100.0%) |
Physical Housing Characteristics in Camino
Housing Structures in Camino
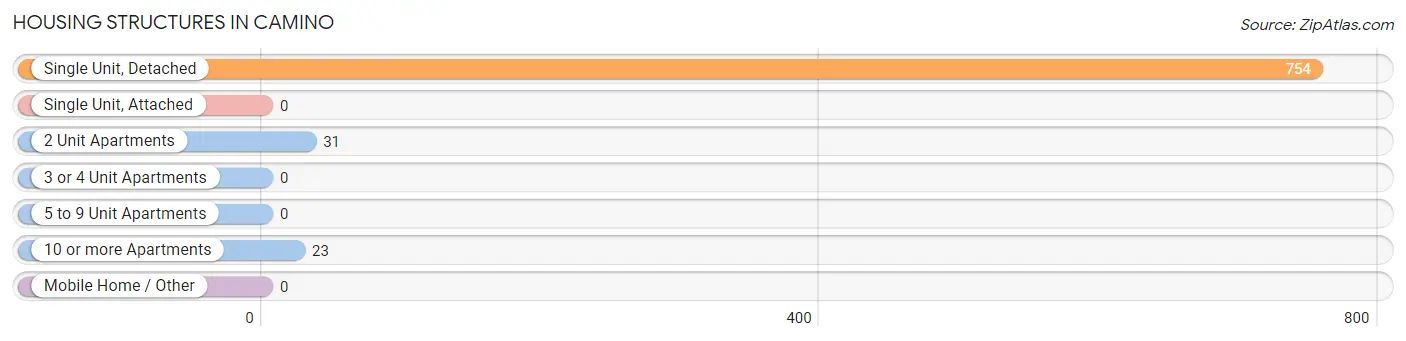
| Structure Type | # Housing Units | % Housing Units |
| Single Unit, Detached | 754 | 93.3% |
| Single Unit, Attached | 0 | 0.0% |
| 2 Unit Apartments | 31 | 3.8% |
| 3 or 4 Unit Apartments | 0 | 0.0% |
| 5 to 9 Unit Apartments | 0 | 0.0% |
| 10 or more Apartments | 23 | 2.9% |
| Mobile Home / Other | 0 | 0.0% |
| Total | 808 | 100.0% |
Housing Structures by Occupancy in Camino
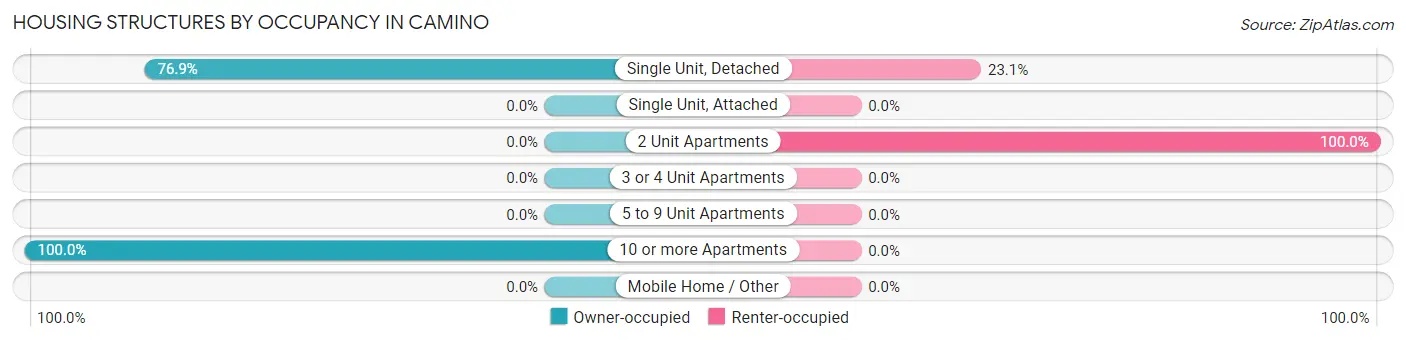
| Structure Type | Owner-occupied | Renter-occupied |
| Single Unit, Detached | 580 (76.9%) | 174 (23.1%) |
| Single Unit, Attached | 0 (0.0%) | 0 (0.0%) |
| 2 Unit Apartments | 0 (0.0%) | 31 (100.0%) |
| 3 or 4 Unit Apartments | 0 (0.0%) | 0 (0.0%) |
| 5 to 9 Unit Apartments | 0 (0.0%) | 0 (0.0%) |
| 10 or more Apartments | 23 (100.0%) | 0 (0.0%) |
| Mobile Home / Other | 0 (0.0%) | 0 (0.0%) |
| Total | 603 (74.6%) | 205 (25.4%) |
Housing Structures by Number of Rooms in Camino
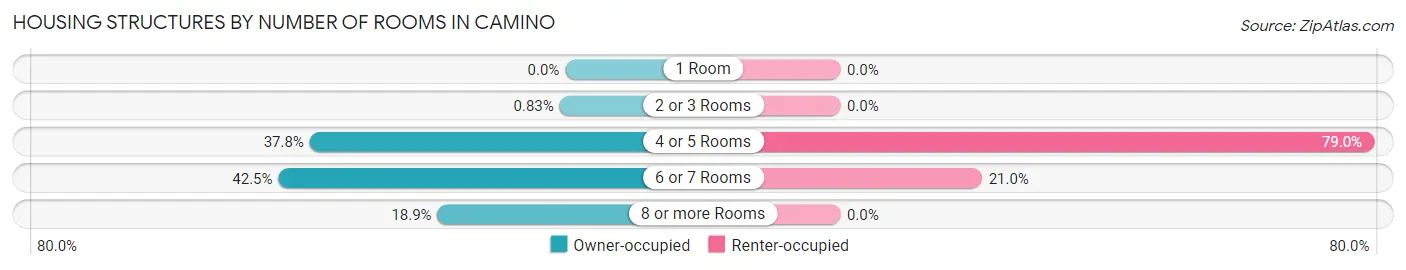
| Number of Rooms | Owner-occupied | Renter-occupied |
| 1 Room | 0 (0.0%) | 0 (0.0%) |
| 2 or 3 Rooms | 5 (0.8%) | 0 (0.0%) |
| 4 or 5 Rooms | 228 (37.8%) | 162 (79.0%) |
| 6 or 7 Rooms | 256 (42.4%) | 43 (21.0%) |
| 8 or more Rooms | 114 (18.9%) | 0 (0.0%) |
| Total | 603 (100.0%) | 205 (100.0%) |
Housing Structure by Heating Type in Camino
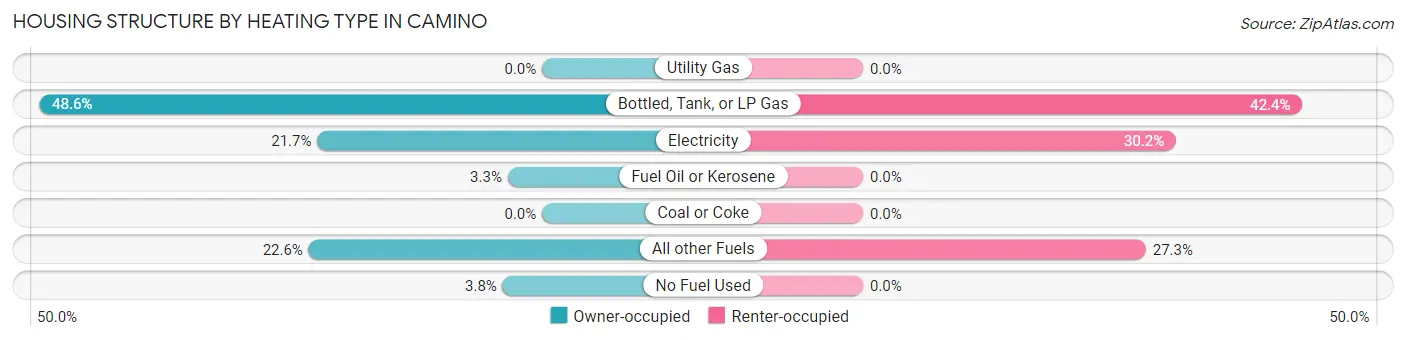
| Heating Type | Owner-occupied | Renter-occupied |
| Utility Gas | 0 (0.0%) | 0 (0.0%) |
| Bottled, Tank, or LP Gas | 293 (48.6%) | 87 (42.4%) |
| Electricity | 131 (21.7%) | 62 (30.2%) |
| Fuel Oil or Kerosene | 20 (3.3%) | 0 (0.0%) |
| Coal or Coke | 0 (0.0%) | 0 (0.0%) |
| All other Fuels | 136 (22.6%) | 56 (27.3%) |
| No Fuel Used | 23 (3.8%) | 0 (0.0%) |
| Total | 603 (100.0%) | 205 (100.0%) |
Household Vehicle Usage in Camino
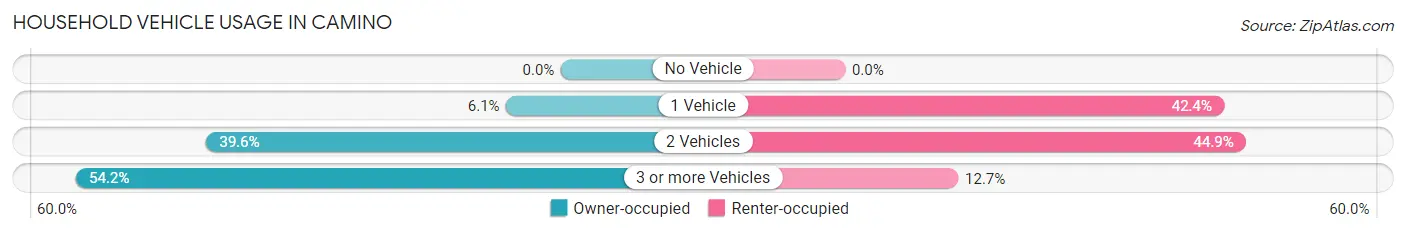
| Vehicles per Household | Owner-occupied | Renter-occupied |
| No Vehicle | 0 (0.0%) | 0 (0.0%) |
| 1 Vehicle | 37 (6.1%) | 87 (42.4%) |
| 2 Vehicles | 239 (39.6%) | 92 (44.9%) |
| 3 or more Vehicles | 327 (54.2%) | 26 (12.7%) |
| Total | 603 (100.0%) | 205 (100.0%) |
Real Estate & Mortgages in Camino
Real Estate and Mortgage Overview in Camino
| Characteristic | Without Mortgage | With Mortgage |
| Housing Units | 237 | 366 |
| Median Property Value | $434,100 | $482,400 |
| Median Household Income | $79,750 | $243 |
| Monthly Housing Costs | $900 | $103 |
| Real Estate Taxes | $2,889 | $5 |
Property Value by Mortgage Status in Camino
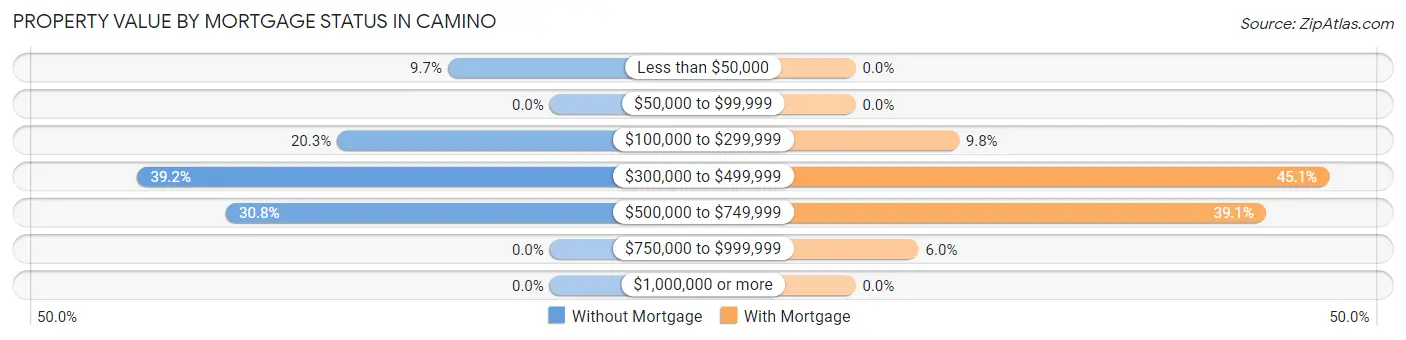
| Property Value | Without Mortgage | With Mortgage |
| Less than $50,000 | 23 (9.7%) | 0 (0.0%) |
| $50,000 to $99,999 | 0 (0.0%) | 0 (0.0%) |
| $100,000 to $299,999 | 48 (20.3%) | 36 (9.8%) |
| $300,000 to $499,999 | 93 (39.2%) | 165 (45.1%) |
| $500,000 to $749,999 | 73 (30.8%) | 143 (39.1%) |
| $750,000 to $999,999 | 0 (0.0%) | 22 (6.0%) |
| $1,000,000 or more | 0 (0.0%) | 0 (0.0%) |
| Total | 237 (100.0%) | 366 (100.0%) |
Household Income by Mortgage Status in Camino
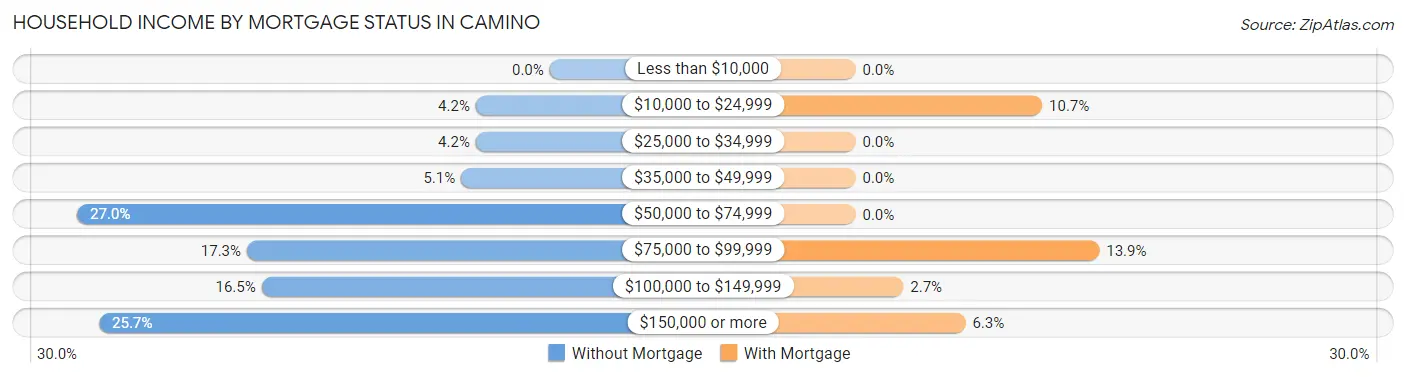
| Household Income | Without Mortgage | With Mortgage |
| Less than $10,000 | 0 (0.0%) | 0 (0.0%) |
| $10,000 to $24,999 | 10 (4.2%) | 39 (10.7%) |
| $25,000 to $34,999 | 10 (4.2%) | 0 (0.0%) |
| $35,000 to $49,999 | 12 (5.1%) | 0 (0.0%) |
| $50,000 to $74,999 | 64 (27.0%) | 0 (0.0%) |
| $75,000 to $99,999 | 41 (17.3%) | 51 (13.9%) |
| $100,000 to $149,999 | 39 (16.5%) | 10 (2.7%) |
| $150,000 or more | 61 (25.7%) | 23 (6.3%) |
| Total | 237 (100.0%) | 366 (100.0%) |
Property Value to Household Income Ratio in Camino
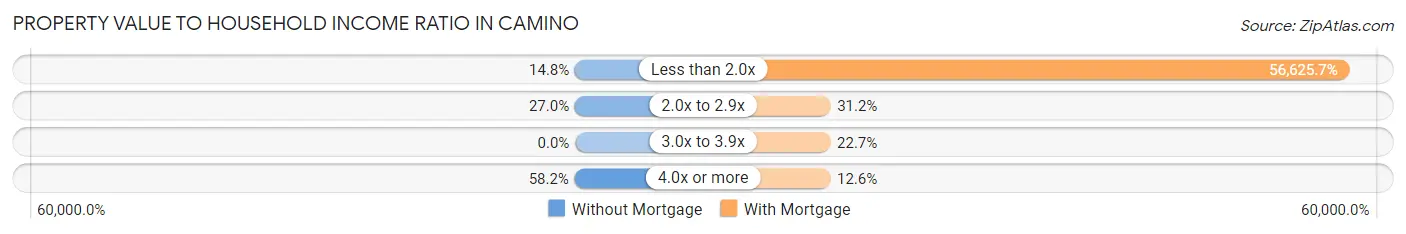
| Value-to-Income Ratio | Without Mortgage | With Mortgage |
| Less than 2.0x | 35 (14.8%) | 207,250 (56,625.7%) |
| 2.0x to 2.9x | 64 (27.0%) | 114 (31.1%) |
| 3.0x to 3.9x | 0 (0.0%) | 83 (22.7%) |
| 4.0x or more | 138 (58.2%) | 46 (12.6%) |
| Total | 237 (100.0%) | 366 (100.0%) |
Real Estate Taxes by Mortgage Status in Camino
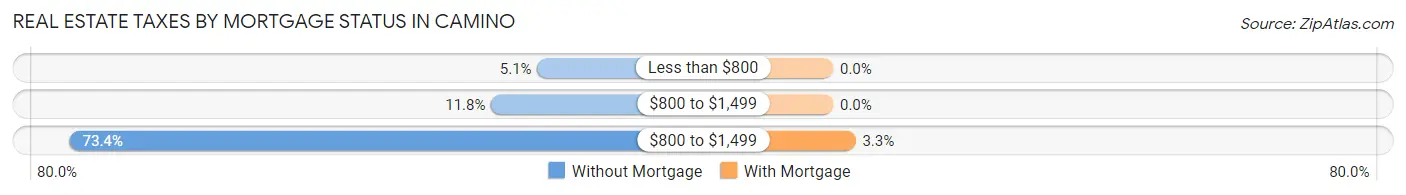
| Property Taxes | Without Mortgage | With Mortgage |
| Less than $800 | 12 (5.1%) | 0 (0.0%) |
| $800 to $1,499 | 28 (11.8%) | 0 (0.0%) |
| $800 to $1,499 | 174 (73.4%) | 12 (3.3%) |
| Total | 237 (100.0%) | 366 (100.0%) |
Health & Disability in Camino
Health Insurance Coverage by Age in Camino
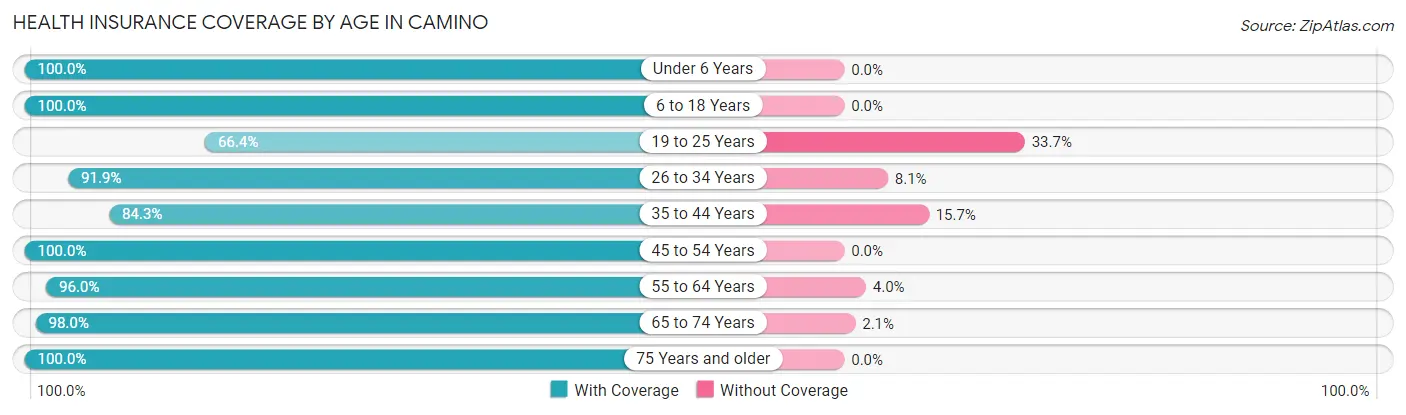
| Age Bracket | With Coverage | Without Coverage |
| Under 6 Years | 67 (100.0%) | 0 (0.0%) |
| 6 to 18 Years | 291 (100.0%) | 0 (0.0%) |
| 19 to 25 Years | 69 (66.3%) | 35 (33.7%) |
| 26 to 34 Years | 147 (91.9%) | 13 (8.1%) |
| 35 to 44 Years | 289 (84.3%) | 54 (15.7%) |
| 45 to 54 Years | 193 (100.0%) | 0 (0.0%) |
| 55 to 64 Years | 167 (96.0%) | 7 (4.0%) |
| 65 to 74 Years | 526 (98.0%) | 11 (2.1%) |
| 75 Years and older | 133 (100.0%) | 0 (0.0%) |
| Total | 1,882 (94.0%) | 120 (6.0%) |
Health Insurance Coverage by Citizenship Status in Camino
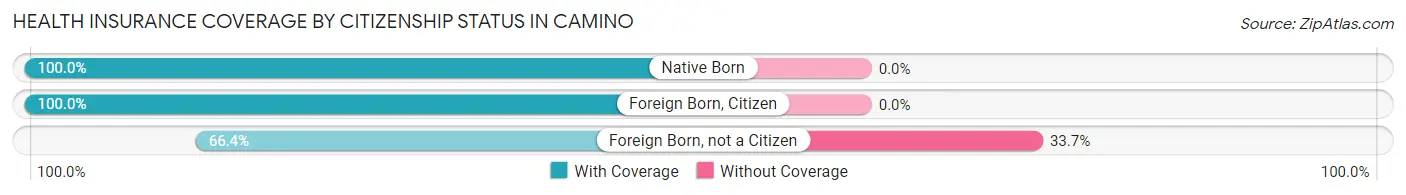
| Citizenship Status | With Coverage | Without Coverage |
| Native Born | 67 (100.0%) | 0 (0.0%) |
| Foreign Born, Citizen | 291 (100.0%) | 0 (0.0%) |
| Foreign Born, not a Citizen | 69 (66.3%) | 35 (33.7%) |
Health Insurance Coverage by Household Income in Camino
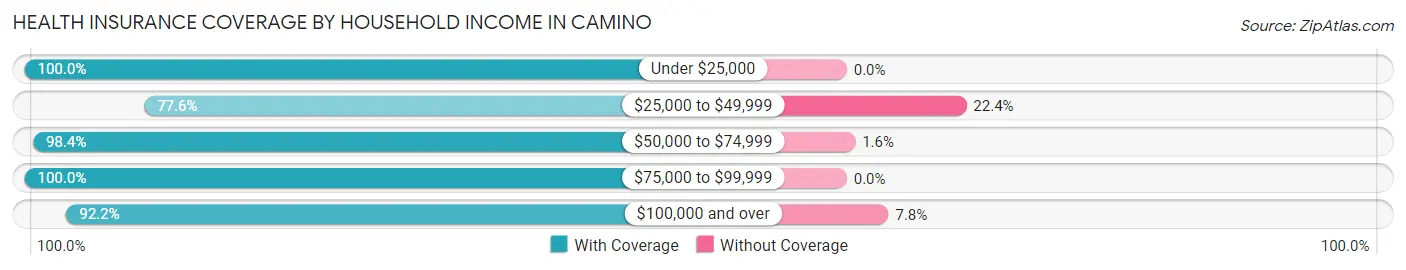
| Household Income | With Coverage | Without Coverage |
| Under $25,000 | 66 (100.0%) | 0 (0.0%) |
| $25,000 to $49,999 | 45 (77.6%) | 13 (22.4%) |
| $50,000 to $74,999 | 437 (98.4%) | 7 (1.6%) |
| $75,000 to $99,999 | 155 (100.0%) | 0 (0.0%) |
| $100,000 and over | 1,179 (92.2%) | 100 (7.8%) |
Public vs Private Health Insurance Coverage by Age in Camino
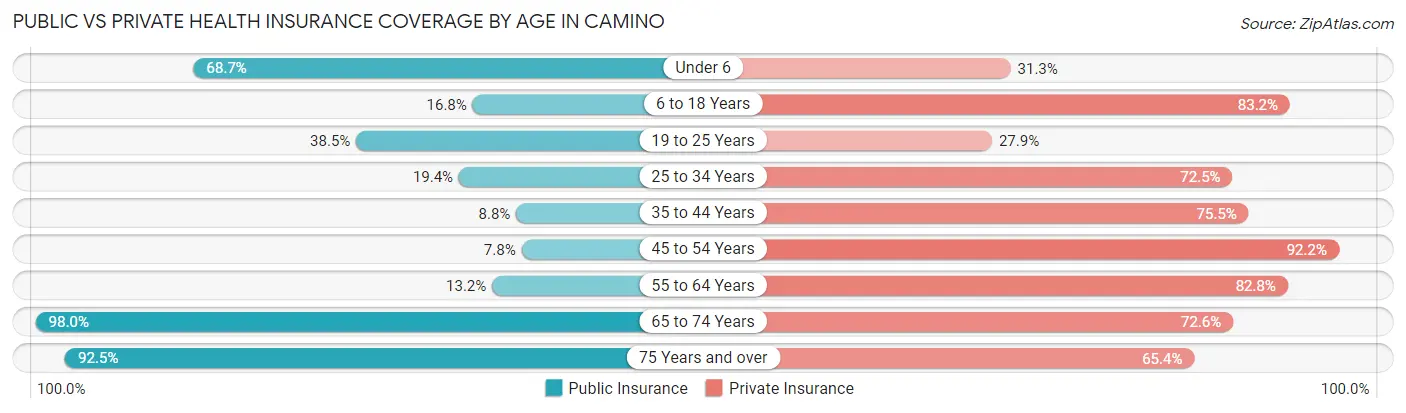
| Age Bracket | Public Insurance | Private Insurance |
| Under 6 | 46 (68.7%) | 21 (31.3%) |
| 6 to 18 Years | 49 (16.8%) | 242 (83.2%) |
| 19 to 25 Years | 40 (38.5%) | 29 (27.9%) |
| 25 to 34 Years | 31 (19.4%) | 116 (72.5%) |
| 35 to 44 Years | 30 (8.7%) | 259 (75.5%) |
| 45 to 54 Years | 15 (7.8%) | 178 (92.2%) |
| 55 to 64 Years | 23 (13.2%) | 144 (82.8%) |
| 65 to 74 Years | 526 (98.0%) | 390 (72.6%) |
| 75 Years and over | 123 (92.5%) | 87 (65.4%) |
| Total | 883 (44.1%) | 1,466 (73.2%) |
Disability Status by Sex by Age in Camino
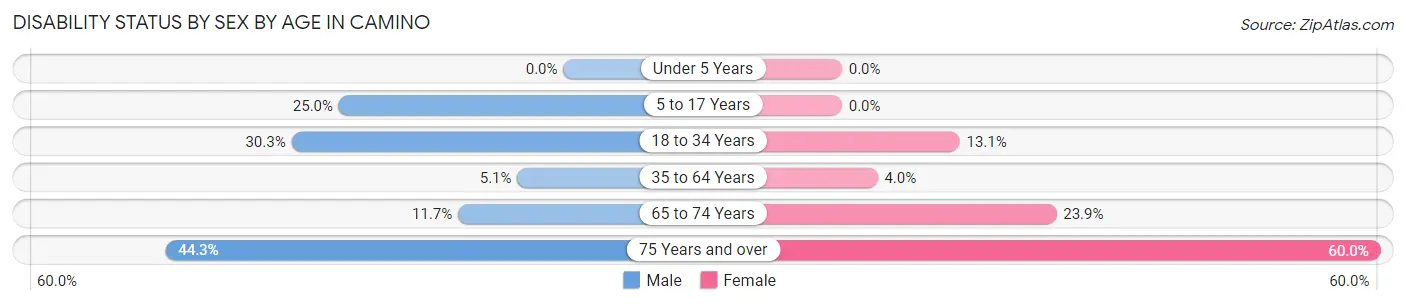
| Age Bracket | Male | Female |
| Under 5 Years | 0 (0.0%) | 0 (0.0%) |
| 5 to 17 Years | 33 (25.0%) | 0 (0.0%) |
| 18 to 34 Years | 43 (30.3%) | 16 (13.1%) |
| 35 to 64 Years | 17 (5.1%) | 15 (4.0%) |
| 65 to 74 Years | 34 (11.7%) | 59 (23.9%) |
| 75 Years and over | 39 (44.3%) | 27 (60.0%) |
Disability Class by Sex by Age in Camino
Disability Class: Hearing Difficulty
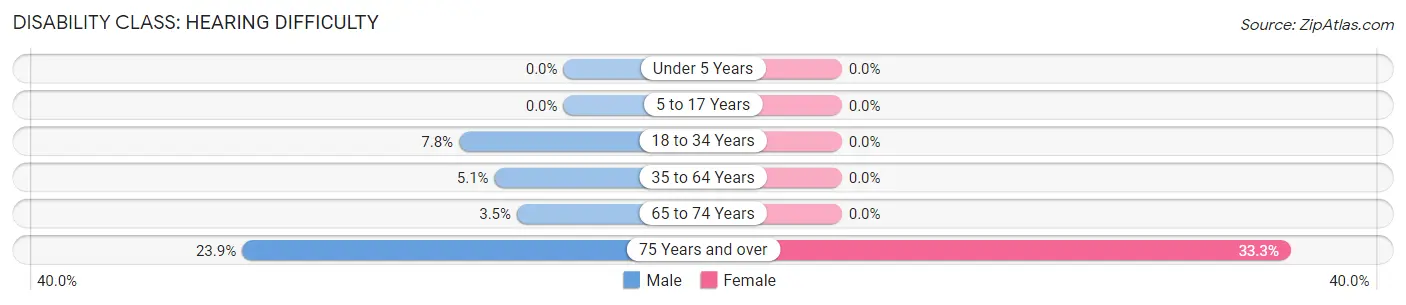
| Age Bracket | Male | Female |
| Under 5 Years | 0 (0.0%) | 0 (0.0%) |
| 5 to 17 Years | 0 (0.0%) | 0 (0.0%) |
| 18 to 34 Years | 11 (7.7%) | 0 (0.0%) |
| 35 to 64 Years | 17 (5.1%) | 0 (0.0%) |
| 65 to 74 Years | 10 (3.5%) | 0 (0.0%) |
| 75 Years and over | 21 (23.9%) | 15 (33.3%) |
Disability Class: Vision Difficulty
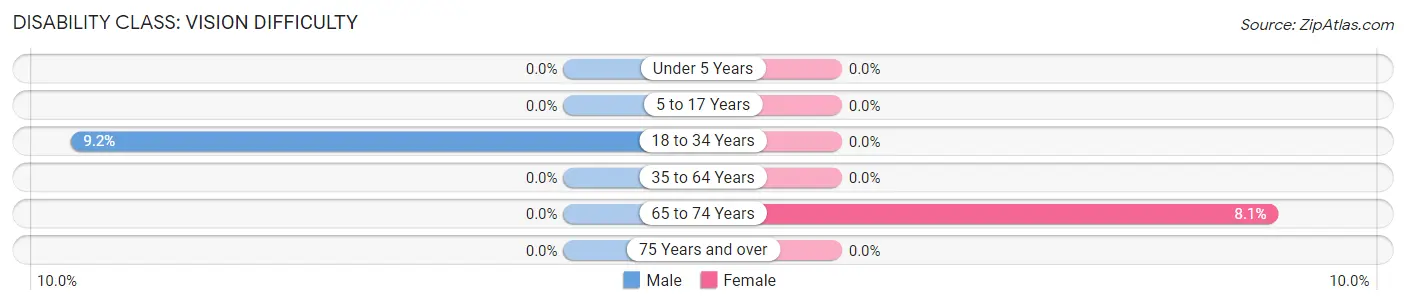
| Age Bracket | Male | Female |
| Under 5 Years | 0 (0.0%) | 0 (0.0%) |
| 5 to 17 Years | 0 (0.0%) | 0 (0.0%) |
| 18 to 34 Years | 13 (9.1%) | 0 (0.0%) |
| 35 to 64 Years | 0 (0.0%) | 0 (0.0%) |
| 65 to 74 Years | 0 (0.0%) | 20 (8.1%) |
| 75 Years and over | 0 (0.0%) | 0 (0.0%) |
Disability Class: Cognitive Difficulty
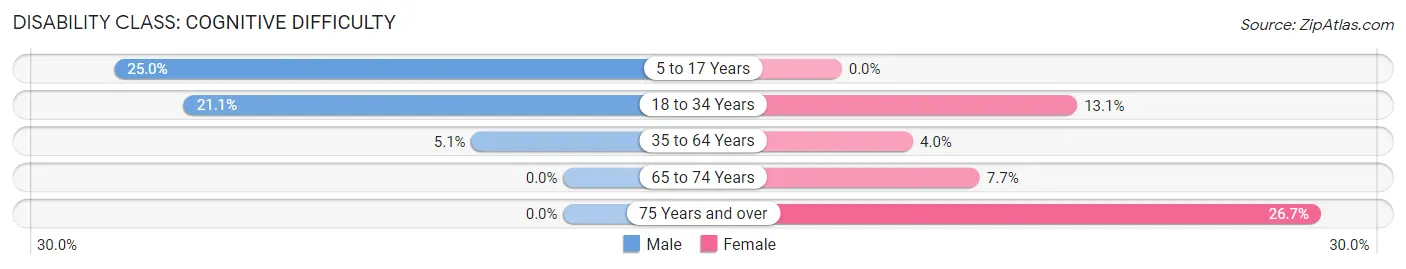
| Age Bracket | Male | Female |
| 5 to 17 Years | 33 (25.0%) | 0 (0.0%) |
| 18 to 34 Years | 30 (21.1%) | 16 (13.1%) |
| 35 to 64 Years | 17 (5.1%) | 15 (4.0%) |
| 65 to 74 Years | 0 (0.0%) | 19 (7.7%) |
| 75 Years and over | 0 (0.0%) | 12 (26.7%) |
Disability Class: Ambulatory Difficulty
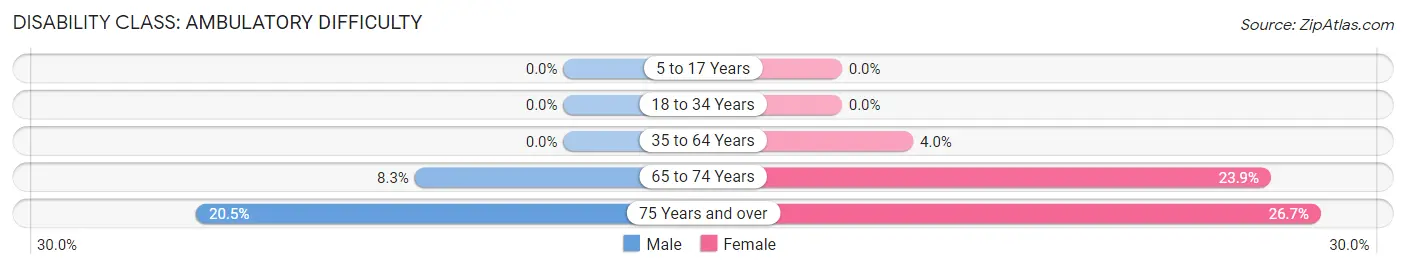
| Age Bracket | Male | Female |
| 5 to 17 Years | 0 (0.0%) | 0 (0.0%) |
| 18 to 34 Years | 0 (0.0%) | 0 (0.0%) |
| 35 to 64 Years | 0 (0.0%) | 15 (4.0%) |
| 65 to 74 Years | 24 (8.3%) | 59 (23.9%) |
| 75 Years and over | 18 (20.4%) | 12 (26.7%) |
Disability Class: Self-Care Difficulty
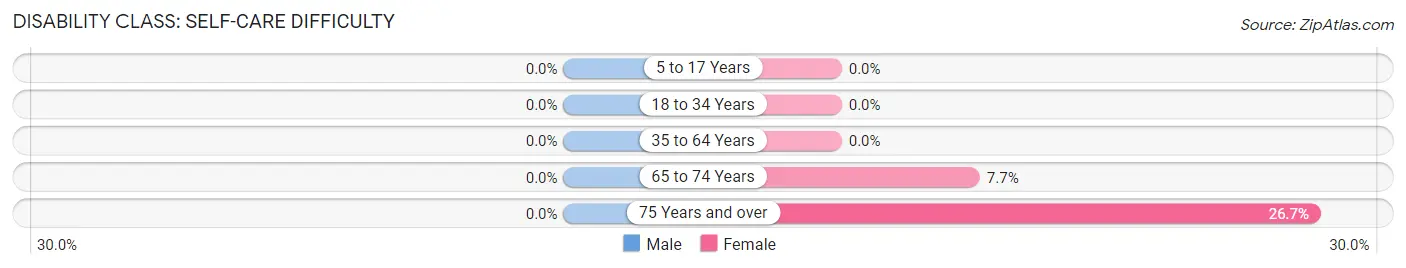
| Age Bracket | Male | Female |
| 5 to 17 Years | 0 (0.0%) | 0 (0.0%) |
| 18 to 34 Years | 0 (0.0%) | 0 (0.0%) |
| 35 to 64 Years | 0 (0.0%) | 0 (0.0%) |
| 65 to 74 Years | 0 (0.0%) | 19 (7.7%) |
| 75 Years and over | 0 (0.0%) | 12 (26.7%) |
Technology Access in Camino
Computing Device Access in Camino
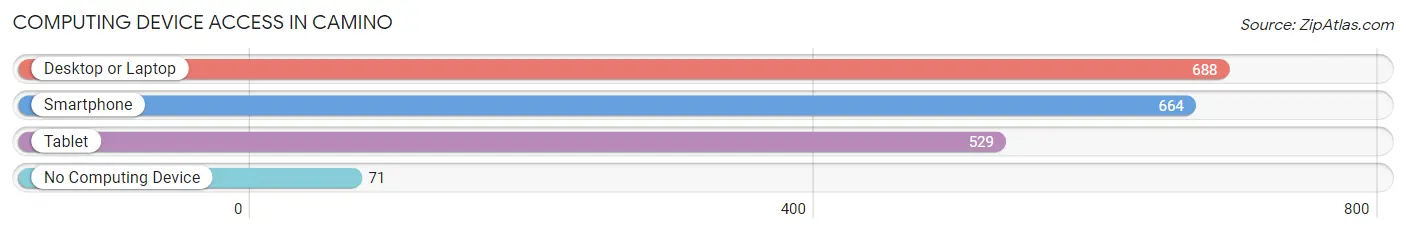
| Device Type | # Households | % Households |
| Desktop or Laptop | 688 | 85.2% |
| Smartphone | 664 | 82.2% |
| Tablet | 529 | 65.5% |
| No Computing Device | 71 | 8.8% |
| Total | 808 | 100.0% |
Internet Access in Camino
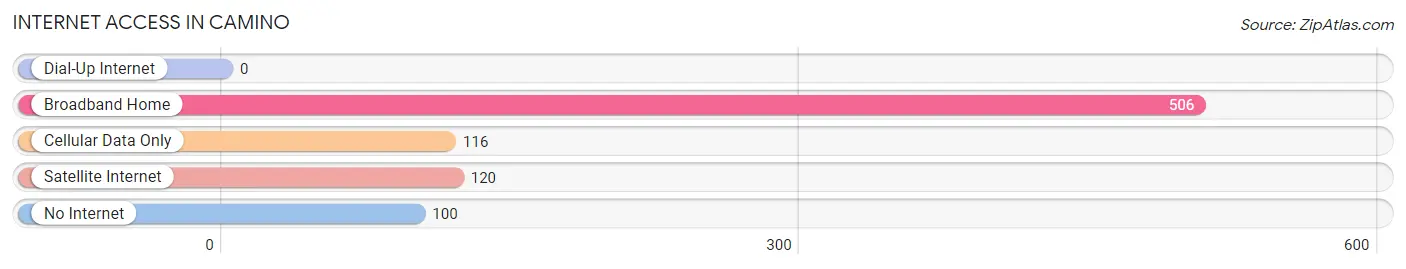
| Internet Type | # Households | % Households |
| Dial-Up Internet | 0 | 0.0% |
| Broadband Home | 506 | 62.6% |
| Cellular Data Only | 116 | 14.4% |
| Satellite Internet | 120 | 14.8% |
| No Internet | 100 | 12.4% |
| Total | 808 | 100.0% |
Camino Summary
Camino, California is a small unincorporated community located in El Dorado County, California. It is situated in the Sierra Nevada foothills, approximately 40 miles east of Sacramento and 30 miles west of South Lake Tahoe. The population of Camino was estimated to be 2,845 in 2019.
Geography
Camino is located in the Sierra Nevada foothills at an elevation of 2,400 feet. The area is characterized by rolling hills, oak woodlands, and grassy meadows. The nearby American River is a popular destination for fishing, swimming, and rafting. Camino is surrounded by the El Dorado National Forest, which provides a variety of recreational activities such as camping, hiking, and mountain biking.
Climate
Camino has a Mediterranean climate with hot, dry summers and cool, wet winters. The average high temperature in the summer is around 90°F and the average low temperature in the winter is around 30°F. The area receives an average of 30 inches of precipitation per year, with most of it falling in the winter months.
Economy
Camino’s economy is largely based on tourism and agriculture. The area is home to several wineries, as well as a number of small businesses that cater to tourists. The nearby Apple Hill Growers Association is a popular destination for visitors, offering a variety of fresh fruits and vegetables. The area is also home to several small farms, which produce a variety of crops such as apples, pears, and walnuts.
Demographics
Camino is a predominantly white community, with approximately 90% of the population identifying as Caucasian. The median household income is $63,000, and the median home value is $400,000. The area is home to a variety of religious denominations, including Catholic, Protestant, and Mormon.
Conclusion
Camino, California is a small unincorporated community located in El Dorado County, California. It is situated in the Sierra Nevada foothills, approximately 40 miles east of Sacramento and 30 miles west of South Lake Tahoe. The area is characterized by rolling hills, oak woodlands, and grassy meadows, and is surrounded by the El Dorado National Forest. The economy of Camino is largely based on tourism and agriculture, and the population is predominantly white. Camino is a popular destination for visitors, offering a variety of recreational activities and fresh produce.
Common Questions
What is Per Capita Income in Camino?
Per Capita income in Camino is $77,536.
What is the Median Family Income in Camino?
Median Family Income in Camino is $124,643.
What is the Median Household income in Camino?
Median Household Income in Camino is $117,258.
What is Income or Wage Gap in Camino?
Income or Wage Gap in Camino is 59.6%.
Women in Camino earn 40.4 cents for every dollar earned by a man.
What is Inequality or Gini Index in Camino?
Inequality or Gini Index in Camino is 0.45.
What is the Total Population of Camino?
Total Population of Camino is 2,002.
What is the Total Male Population of Camino?
Total Male Population of Camino is 1,012.
What is the Total Female Population of Camino?
Total Female Population of Camino is 990.
What is the Ratio of Males per 100 Females in Camino?
There are 102.22 Males per 100 Females in Camino.
What is the Ratio of Females per 100 Males in Camino?
There are 97.83 Females per 100 Males in Camino.
What is the Median Population Age in Camino?
Median Population Age in Camino is 46.4 Years.
What is the Average Family Size in Camino
Average Family Size in Camino is 2.6 People.
What is the Average Household Size in Camino
Average Household Size in Camino is 2.5 People.
How Large is the Labor Force in Camino?
There are 921 People in the Labor Forcein in Camino.
What is the Percentage of People in the Labor Force in Camino?
55.0% of People are in the Labor Force in Camino.
What is the Unemployment Rate in Camino?
Unemployment Rate in Camino is 9.9%.