Cabazon, CA Map & Demographics
Cabazon Map
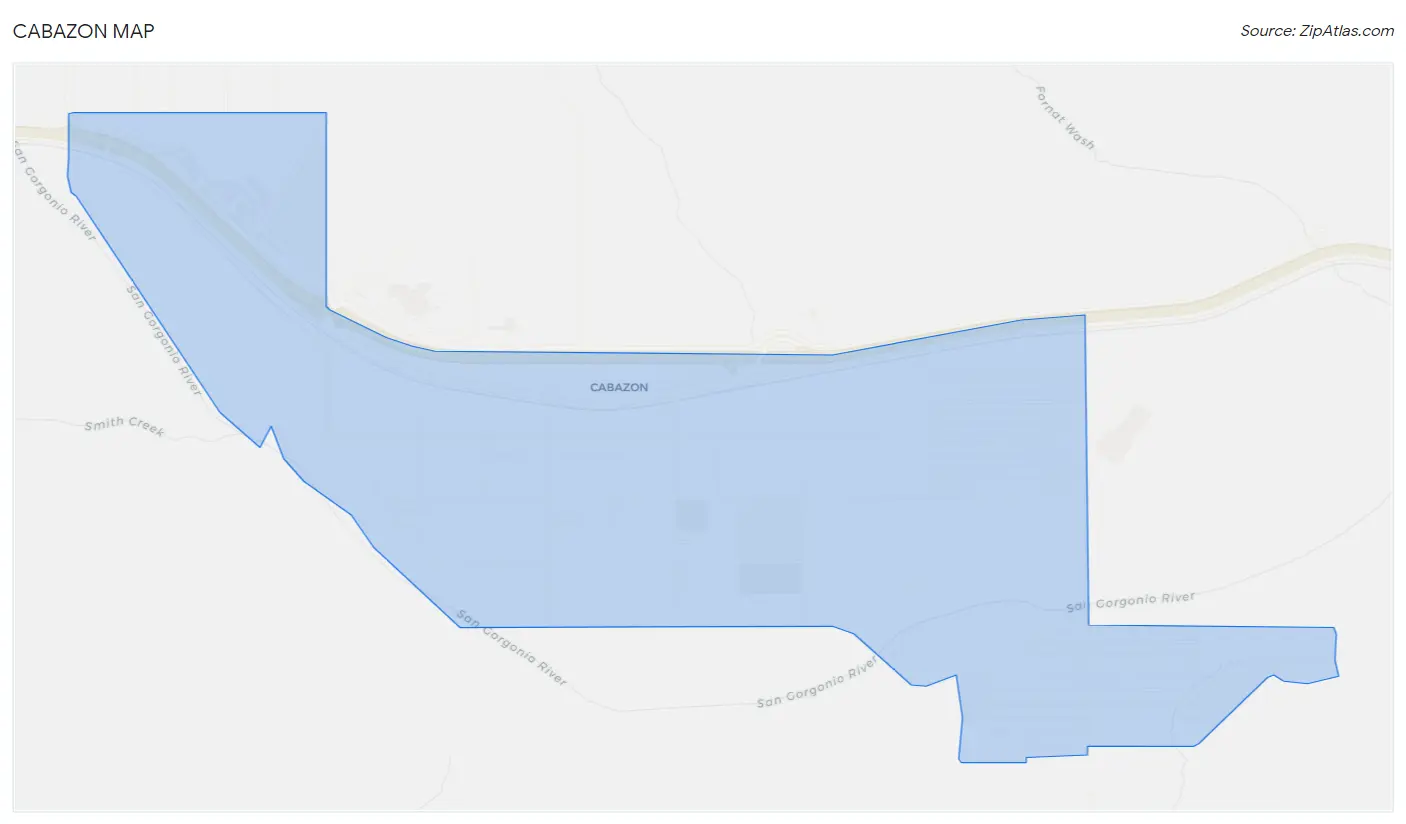
Cabazon Overview
$33,024
PER CAPITA INCOME
$66,597
AVG FAMILY INCOME
$72,266
AVG HOUSEHOLD INCOME
22.9%
WAGE / INCOME GAP [ % ]
77.1¢/ $1
WAGE / INCOME GAP [ $ ]
0.48
INEQUALITY / GINI INDEX
1,946
TOTAL POPULATION
1,017
MALE POPULATION
929
FEMALE POPULATION
109.47
MALES / 100 FEMALES
91.35
FEMALES / 100 MALES
38.3
MEDIAN AGE
3.8
AVG FAMILY SIZE
2.9
AVG HOUSEHOLD SIZE
1,039
LABOR FORCE [ PEOPLE ]
64.4%
PERCENT IN LABOR FORCE
Cabazon Zip Codes
Income in Cabazon
Income Overview in Cabazon
Per Capita Income in Cabazon is $33,024, while median incomes of families and households are $66,597 and $72,266 respectively.
| Characteristic | Number | Measure |
| Per Capita Income | 1,946 | $33,024 |
| Median Family Income | 404 | $66,597 |
| Mean Family Income | 404 | $94,953 |
| Median Household Income | 677 | $72,266 |
| Mean Household Income | 677 | $86,478 |
| Income Deficit | 404 | $0 |
| Wage / Income Gap (%) | 1,946 | 22.89% |
| Wage / Income Gap ($) | 1,946 | 77.11¢ per $1 |
| Gini / Inequality Index | 1,946 | 0.48 |
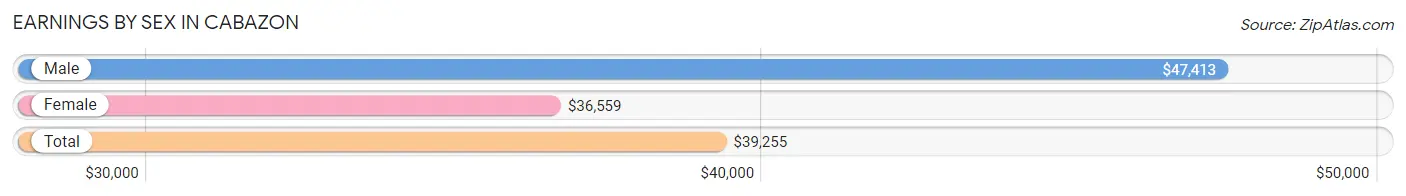
Earnings by Sex in Cabazon
Average Earnings in Cabazon are $39,255, $47,413 for men and $36,559 for women, a difference of 22.9%.
| Sex | Number | Average Earnings |
| Male | 565 (54.3%) | $47,413 |
| Female | 475 (45.7%) | $36,559 |
| Total | 1,040 (100.0%) | $39,255 |
Earnings by Sex by Income Bracket in Cabazon
The most common earnings brackets in Cabazon are $100,000+ for men (142 | 25.1%) and $35,000 to $39,999 for women (144 | 30.3%).
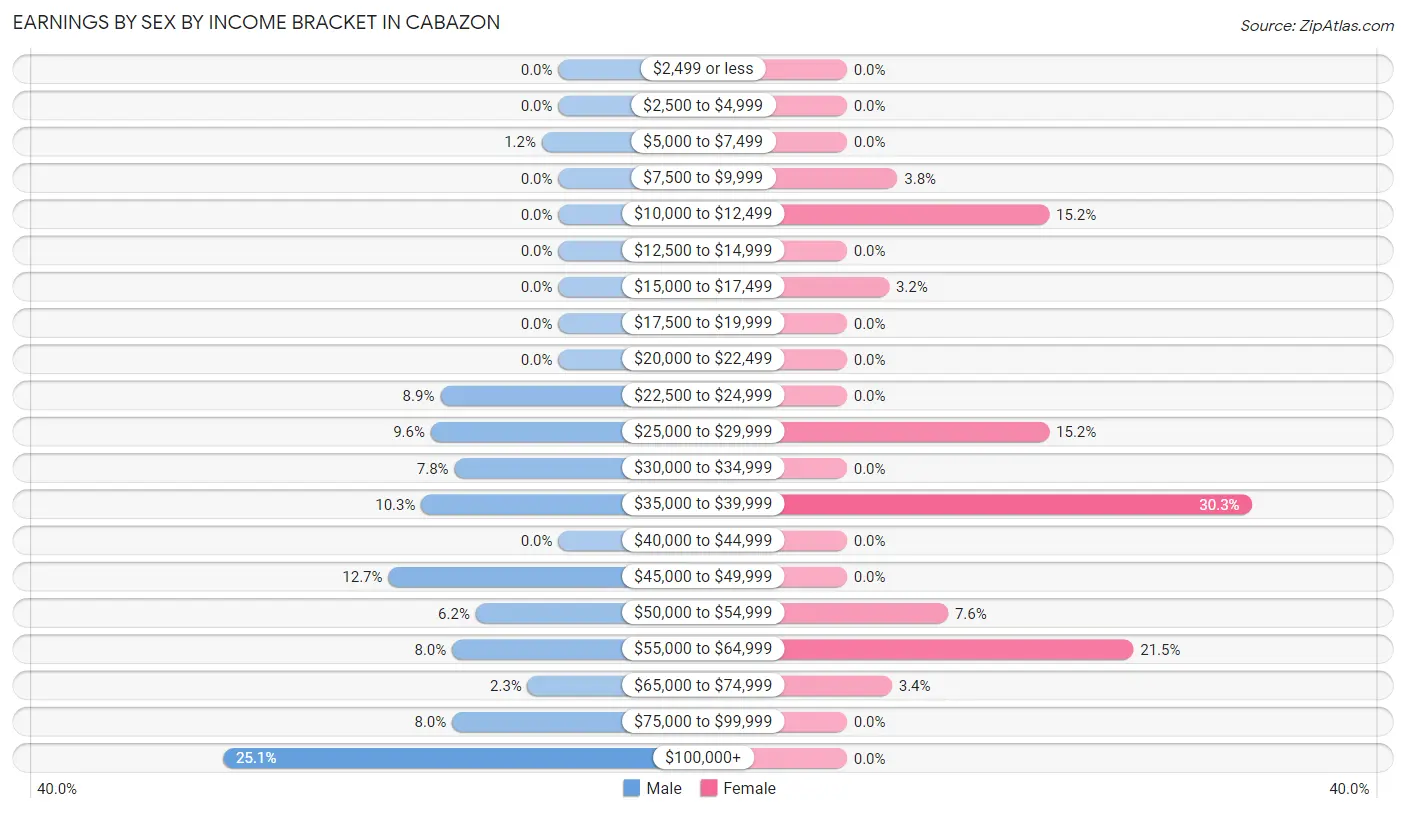
| Income | Male | Female |
| $2,499 or less | 0 (0.0%) | 0 (0.0%) |
| $2,500 to $4,999 | 0 (0.0%) | 0 (0.0%) |
| $5,000 to $7,499 | 7 (1.2%) | 0 (0.0%) |
| $7,500 to $9,999 | 0 (0.0%) | 18 (3.8%) |
| $10,000 to $12,499 | 0 (0.0%) | 72 (15.2%) |
| $12,500 to $14,999 | 0 (0.0%) | 0 (0.0%) |
| $15,000 to $17,499 | 0 (0.0%) | 15 (3.2%) |
| $17,500 to $19,999 | 0 (0.0%) | 0 (0.0%) |
| $20,000 to $22,499 | 0 (0.0%) | 0 (0.0%) |
| $22,500 to $24,999 | 50 (8.8%) | 0 (0.0%) |
| $25,000 to $29,999 | 54 (9.6%) | 72 (15.2%) |
| $30,000 to $34,999 | 44 (7.8%) | 0 (0.0%) |
| $35,000 to $39,999 | 58 (10.3%) | 144 (30.3%) |
| $40,000 to $44,999 | 0 (0.0%) | 0 (0.0%) |
| $45,000 to $49,999 | 72 (12.7%) | 0 (0.0%) |
| $50,000 to $54,999 | 35 (6.2%) | 36 (7.6%) |
| $55,000 to $64,999 | 45 (8.0%) | 102 (21.5%) |
| $65,000 to $74,999 | 13 (2.3%) | 16 (3.4%) |
| $75,000 to $99,999 | 45 (8.0%) | 0 (0.0%) |
| $100,000+ | 142 (25.1%) | 0 (0.0%) |
| Total | 565 (100.0%) | 475 (100.0%) |
Earnings by Sex by Educational Attainment in Cabazon
Average earnings in Cabazon are $50,036 for men and $36,791 for women, a difference of 26.5%. Men with an educational attainment of less than high school enjoy the highest average annual earnings of $51,964, while those with less than high school education earn the least with $51,964. Women with an educational attainment of college or associate's degree earn the most with the average annual earnings of $37,413, while those with high school diploma education have the smallest earnings of $26,603.
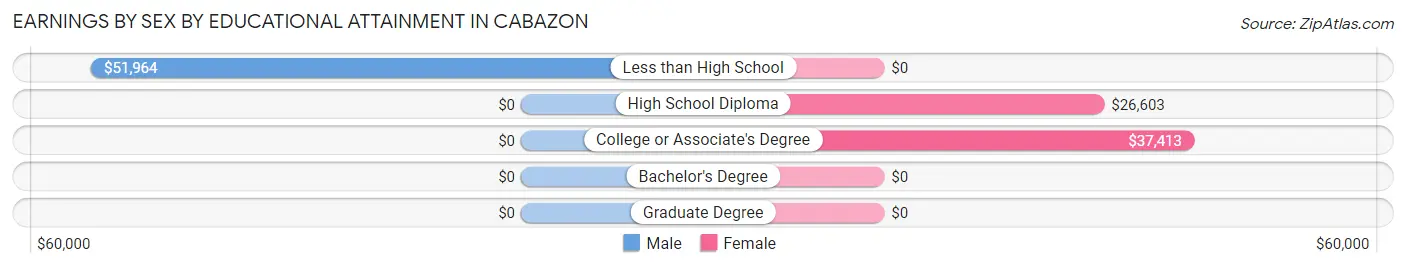
| Educational Attainment | Male Income | Female Income |
| Less than High School | $51,964 | $0 |
| High School Diploma | - | - |
| College or Associate's Degree | - | - |
| Bachelor's Degree | - | - |
| Graduate Degree | - | - |
| Total | $50,036 | $36,791 |
Family Income in Cabazon
Family Income Brackets in Cabazon
According to the Cabazon family income data, there are 86 families falling into the $50,000 to $74,999 income range, which is the most common income bracket and makes up 21.3% of all families.
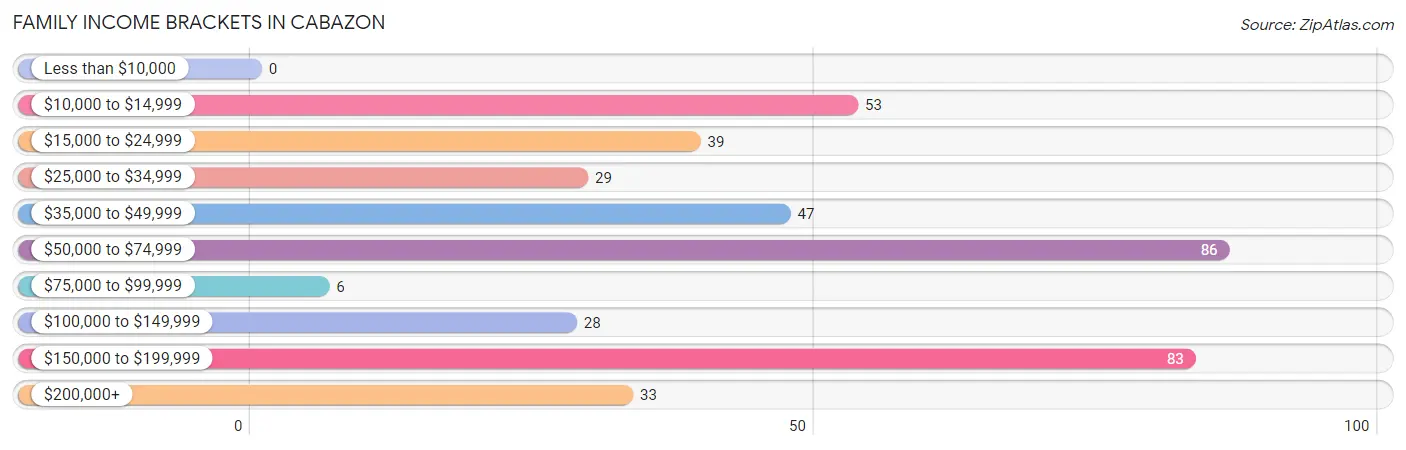
| Income Bracket | # Families | % Families |
| Less than $10,000 | 0 | 0.0% |
| $10,000 to $14,999 | 53 | 13.1% |
| $15,000 to $24,999 | 39 | 9.7% |
| $25,000 to $34,999 | 29 | 7.2% |
| $35,000 to $49,999 | 47 | 11.6% |
| $50,000 to $74,999 | 86 | 21.3% |
| $75,000 to $99,999 | 6 | 1.5% |
| $100,000 to $149,999 | 28 | 6.9% |
| $150,000 to $199,999 | 83 | 20.5% |
| $200,000+ | 33 | 8.2% |
Family Income by Famaliy Size in Cabazon
| Income Bracket | # Families | Median Income |
| 2-Person Families | 207 (51.2%) | $0 |
| 3-Person Families | 63 (15.6%) | $0 |
| 4-Person Families | 47 (11.6%) | $0 |
| 5-Person Families | 10 (2.5%) | $0 |
| 6-Person Families | 33 (8.2%) | $0 |
| 7+ Person Families | 44 (10.9%) | $0 |
| Total | 404 (100.0%) | $66,597 |
Family Income by Number of Earners in Cabazon
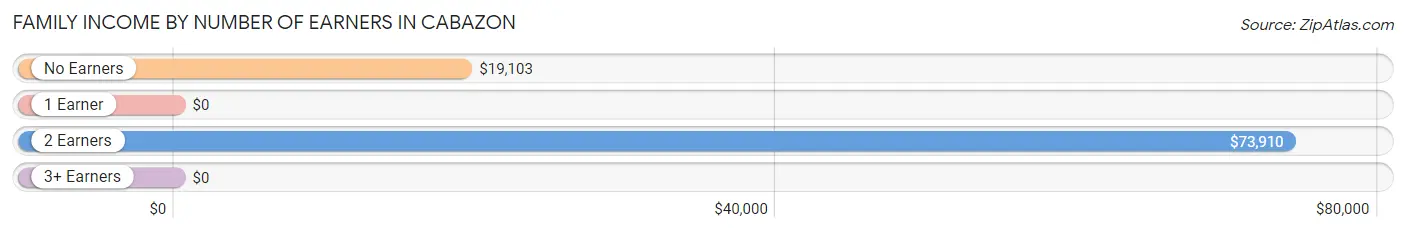
| Number of Earners | # Families | Median Income |
| No Earners | 106 (26.2%) | $19,103 |
| 1 Earner | 61 (15.1%) | $0 |
| 2 Earners | 160 (39.6%) | $73,910 |
| 3+ Earners | 77 (19.1%) | $0 |
| Total | 404 (100.0%) | $66,597 |
Household Income in Cabazon
Household Income Brackets in Cabazon
With 130 households falling in the category, the $10,000 to $14,999 income range is the most frequent in Cabazon, accounting for 19.2% of all households. In contrast, only 29 households (4.3%) fall into the $25,000 to $34,999 income bracket, making it the least populous group.
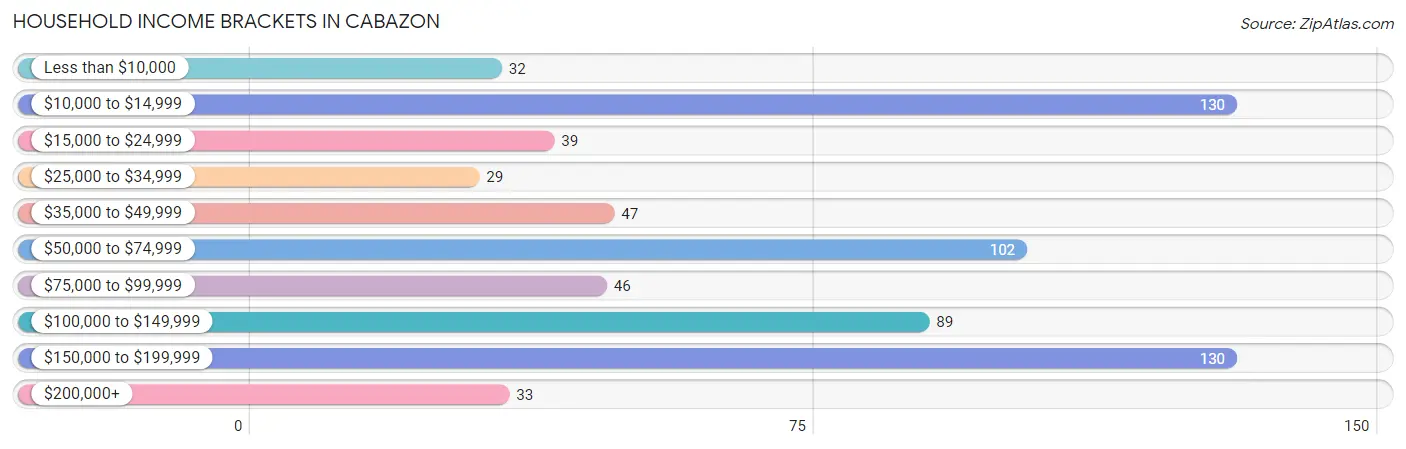
| Income Bracket | # Households | % Households |
| Less than $10,000 | 32 | 4.7% |
| $10,000 to $14,999 | 130 | 19.2% |
| $15,000 to $24,999 | 39 | 5.8% |
| $25,000 to $34,999 | 29 | 4.3% |
| $35,000 to $49,999 | 47 | 6.9% |
| $50,000 to $74,999 | 102 | 15.1% |
| $75,000 to $99,999 | 46 | 6.8% |
| $100,000 to $149,999 | 89 | 13.1% |
| $150,000 to $199,999 | 130 | 19.2% |
| $200,000+ | 33 | 4.9% |
Household Income by Householder Age in Cabazon
The median household income in Cabazon is $72,266, with the highest median household income of $100,521 found in the 25 to 44 years age bracket for the primary householder. A total of 282 households (41.6%) fall into this category. Meanwhile, the 15 to 24 years age bracket for the primary householder has the lowest median household income of $0, with 6 households (0.9%) in this group.
| Income Bracket | # Households | Median Income |
| 15 to 24 Years | 6 (0.9%) | $0 |
| 25 to 44 Years | 282 (41.6%) | $100,521 |
| 45 to 64 Years | 204 (30.1%) | $0 |
| 65+ Years | 185 (27.3%) | $18,494 |
| Total | 677 (100.0%) | $72,266 |
Poverty in Cabazon
Income Below Poverty by Sex and Age in Cabazon
With 8.7% poverty level for males and 22.7% for females among the residents of Cabazon, 65 to 74 year old males and 75 year old and over females are the most vulnerable to poverty, with 78 males (28.4%) and 39 females (100.0%) in their respective age groups living below the poverty level.
| Age Bracket | Male | Female |
| Under 5 Years | 0 (0.0%) | 26 (29.5%) |
| 5 Years | 0 (0.0%) | 0 (0.0%) |
| 6 to 11 Years | 0 (0.0%) | 0 (0.0%) |
| 12 to 14 Years | 0 (0.0%) | 0 (0.0%) |
| 15 Years | 0 (0.0%) | 0 (0.0%) |
| 16 and 17 Years | 0 (0.0%) | 0 (0.0%) |
| 18 to 24 Years | 0 (0.0%) | 0 (0.0%) |
| 25 to 34 Years | 4 (1.9%) | 57 (18.6%) |
| 35 to 44 Years | 0 (0.0%) | 3 (14.3%) |
| 45 to 54 Years | 0 (0.0%) | 0 (0.0%) |
| 55 to 64 Years | 6 (7.2%) | 43 (24.2%) |
| 65 to 74 Years | 78 (28.4%) | 43 (59.7%) |
| 75 Years and over | 0 (0.0%) | 39 (100.0%) |
| Total | 88 (8.7%) | 211 (22.7%) |
Income Above Poverty by Sex and Age in Cabazon
According to the poverty statistics in Cabazon, males aged under 5 years and females aged 12 to 14 years are the age groups that are most secure financially, with 100.0% of males and 100.0% of females in these age groups living above the poverty line.
| Age Bracket | Male | Female |
| Under 5 Years | 90 (100.0%) | 62 (70.5%) |
| 5 Years | 0 (0.0%) | 0 (0.0%) |
| 6 to 11 Years | 20 (100.0%) | 0 (0.0%) |
| 12 to 14 Years | 47 (100.0%) | 87 (100.0%) |
| 15 Years | 0 (0.0%) | 0 (0.0%) |
| 16 and 17 Years | 9 (100.0%) | 0 (0.0%) |
| 18 to 24 Years | 24 (100.0%) | 18 (100.0%) |
| 25 to 34 Years | 211 (98.1%) | 250 (81.4%) |
| 35 to 44 Years | 120 (100.0%) | 18 (85.7%) |
| 45 to 54 Years | 80 (100.0%) | 118 (100.0%) |
| 55 to 64 Years | 77 (92.8%) | 135 (75.8%) |
| 65 to 74 Years | 197 (71.6%) | 29 (40.3%) |
| 75 Years and over | 53 (100.0%) | 0 (0.0%) |
| Total | 928 (91.3%) | 717 (77.3%) |
Income Below Poverty Among Married-Couple Families in Cabazon
The poverty statistics for married-couple families in Cabazon show that 10.9% or 28 of the total 257 families live below the poverty line. Families with no children have the highest poverty rate of 19.1%, comprising of 28 families. On the other hand, families with 1 or 2 children have the lowest poverty rate of 0.0%, which includes 0 families.
| Children | Above Poverty | Below Poverty |
| No Children | 119 (80.9%) | 28 (19.1%) |
| 1 or 2 Children | 110 (100.0%) | 0 (0.0%) |
| 3 or 4 Children | 0 (0.0%) | 0 (0.0%) |
| 5 or more Children | 0 (0.0%) | 0 (0.0%) |
| Total | 229 (89.1%) | 28 (10.9%) |
Income Below Poverty Among Single-Parent Households in Cabazon
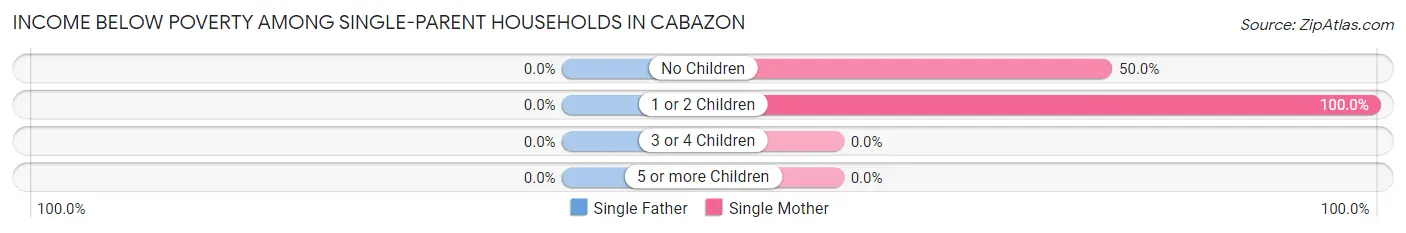
| Children | Single Father | Single Mother |
| No Children | 0 (0.0%) | 39 (50.0%) |
| 1 or 2 Children | 0 (0.0%) | 25 (100.0%) |
| 3 or 4 Children | 0 (0.0%) | 0 (0.0%) |
| 5 or more Children | 0 (0.0%) | 0 (0.0%) |
| Total | 0 (0.0%) | 64 (45.4%) |
Income Below Poverty Among Married-Couple vs Single-Parent Households in Cabazon
The poverty data for Cabazon shows that 28 of the married-couple family households (10.9%) and 64 of the single-parent households (43.5%) are living below the poverty level. Within the married-couple family households, those with no children have the highest poverty rate, with 28 households (19.1%) falling below the poverty line. Among the single-parent households, those with 1 or 2 children have the highest poverty rate, with 25 household (80.6%) living below poverty.
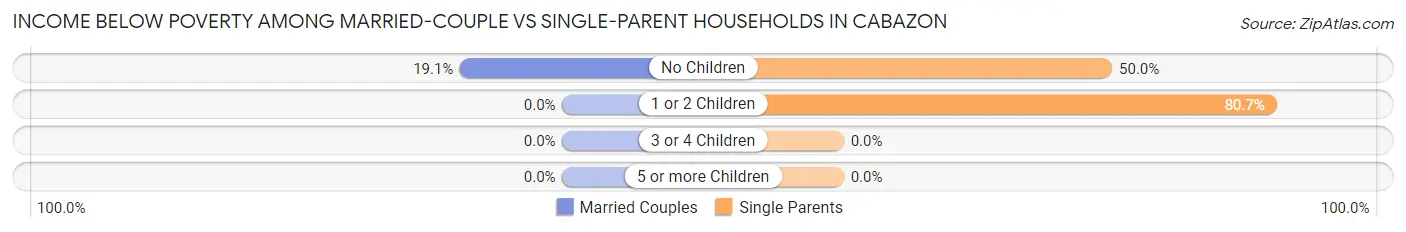
| Children | Married-Couple Families | Single-Parent Households |
| No Children | 28 (19.1%) | 39 (50.0%) |
| 1 or 2 Children | 0 (0.0%) | 25 (80.6%) |
| 3 or 4 Children | 0 (0.0%) | 0 (0.0%) |
| 5 or more Children | 0 (0.0%) | 0 (0.0%) |
| Total | 28 (10.9%) | 64 (43.5%) |
Race in Cabazon
The most populous races in Cabazon are White / Caucasian (1,070 | 55.0%), Hispanic or Latino (867 | 44.6%), and Some other Race (450 | 23.1%).
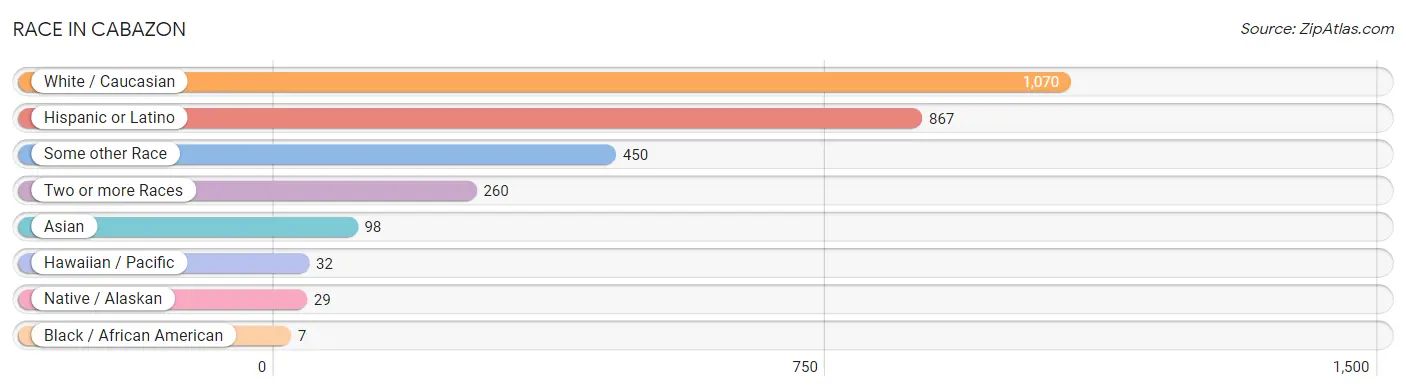
| Race | # Population | % Population |
| Asian | 98 | 5.0% |
| Black / African American | 7 | 0.4% |
| Hawaiian / Pacific | 32 | 1.6% |
| Hispanic or Latino | 867 | 44.6% |
| Native / Alaskan | 29 | 1.5% |
| White / Caucasian | 1,070 | 55.0% |
| Two or more Races | 260 | 13.4% |
| Some other Race | 450 | 23.1% |
| Total | 1,946 | 100.0% |
Ancestry in Cabazon
The most populous ancestries reported in Cabazon are Mexican (785 | 40.3%), Italian (217 | 11.2%), Irish (195 | 10.0%), German (165 | 8.5%), and English (149 | 7.7%), together accounting for 77.6% of all Cabazon residents.
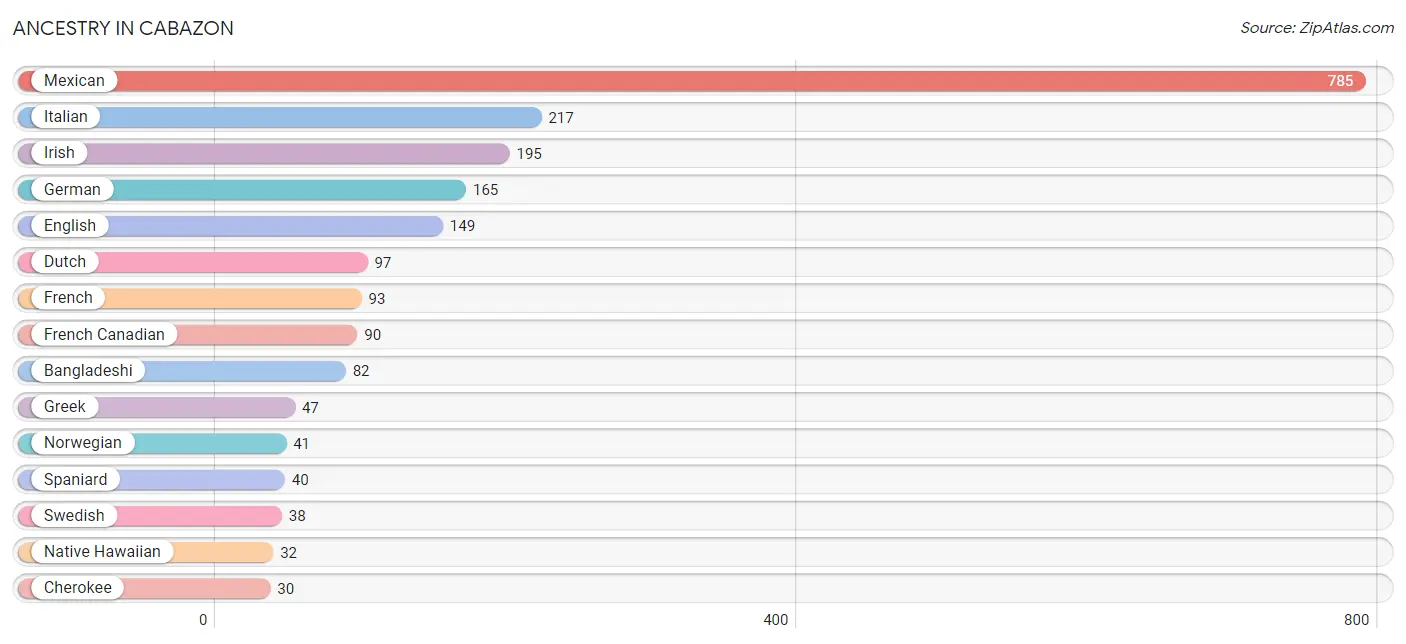
| Ancestry | # Population | % Population |
| Apache | 29 | 1.5% |
| Bangladeshi | 82 | 4.2% |
| Bhutanese | 11 | 0.6% |
| Central American | 1 | 0.1% |
| Cherokee | 30 | 1.5% |
| Choctaw | 30 | 1.5% |
| Dutch | 97 | 5.0% |
| English | 149 | 7.7% |
| French | 93 | 4.8% |
| French Canadian | 90 | 4.6% |
| German | 165 | 8.5% |
| Greek | 47 | 2.4% |
| Indian (Asian) | 1 | 0.1% |
| Irish | 195 | 10.0% |
| Italian | 217 | 11.2% |
| Jamaican | 1 | 0.1% |
| Laotian | 11 | 0.6% |
| Malaysian | 15 | 0.8% |
| Mexican | 785 | 40.3% |
| Native Hawaiian | 32 | 1.6% |
| Norwegian | 41 | 2.1% |
| Salvadoran | 1 | 0.1% |
| Scottish | 6 | 0.3% |
| Sioux | 2 | 0.1% |
| Spaniard | 40 | 2.1% |
| Swedish | 38 | 1.9% | View All 26 Rows |
Immigrants in Cabazon
The most numerous immigrant groups reported in Cabazon came from Central America (365 | 18.8%), Latin America (365 | 18.8%), Mexico (365 | 18.8%), Asia (58 | 3.0%), and Laos (58 | 3.0%), together accounting for 62.2% of all Cabazon residents.
| Immigration Origin | # Population | % Population |
| Asia | 58 | 3.0% |
| Central America | 365 | 18.8% |
| Laos | 58 | 3.0% |
| Latin America | 365 | 18.8% |
| Mexico | 365 | 18.8% |
| South Eastern Asia | 58 | 3.0% | View All 6 Rows |
Sex and Age in Cabazon
Sex and Age in Cabazon
The most populous age groups in Cabazon are 70 to 74 Years (233 | 22.9%) for men and 25 to 29 Years (258 | 27.8%) for women.
| Age Bracket | Male | Female |
| Under 5 Years | 90 (8.8%) | 88 (9.5%) |
| 5 to 9 Years | 20 (2.0%) | 0 (0.0%) |
| 10 to 14 Years | 47 (4.6%) | 87 (9.4%) |
| 15 to 19 Years | 10 (1.0%) | 1 (0.1%) |
| 20 to 24 Years | 24 (2.4%) | 18 (1.9%) |
| 25 to 29 Years | 132 (13.0%) | 258 (27.8%) |
| 30 to 34 Years | 83 (8.2%) | 49 (5.3%) |
| 35 to 39 Years | 92 (9.0%) | 3 (0.3%) |
| 40 to 44 Years | 28 (2.8%) | 18 (1.9%) |
| 45 to 49 Years | 80 (7.9%) | 74 (8.0%) |
| 50 to 54 Years | 0 (0.0%) | 44 (4.7%) |
| 55 to 59 Years | 65 (6.4%) | 73 (7.9%) |
| 60 to 64 Years | 18 (1.8%) | 105 (11.3%) |
| 65 to 69 Years | 42 (4.1%) | 0 (0.0%) |
| 70 to 74 Years | 233 (22.9%) | 72 (7.7%) |
| 75 to 79 Years | 53 (5.2%) | 0 (0.0%) |
| 80 to 84 Years | 0 (0.0%) | 0 (0.0%) |
| 85 Years and over | 0 (0.0%) | 39 (4.2%) |
| Total | 1,017 (100.0%) | 929 (100.0%) |
Families and Households in Cabazon
Median Family Size in Cabazon
The median family size in Cabazon is 3.82 persons per family, with single male/father families (6 | 1.5%) accounting for the largest median family size of 13.67 persons per family. On the other hand, married-couple families (257 | 63.6%) represent the smallest median family size with 3.42 persons per family.
| Family Type | # Families | Family Size |
| Married-Couple | 257 (63.6%) | 3.42 |
| Single Male/Father | 6 (1.5%) | 13.67 |
| Single Female/Mother | 141 (34.9%) | 4.13 |
| Total Families | 404 (100.0%) | 3.82 |
Median Household Size in Cabazon
The median household size in Cabazon is 2.85 persons per household, with single male/father households (6 | 0.9%) accounting for the largest median household size of 13.67 persons per household. non-family households (273 | 40.3%) represent the smallest median household size with 1.40 persons per household.
| Household Type | # Households | Household Size |
| Married-Couple | 257 (38.0%) | 3.42 |
| Single Male/Father | 6 (0.9%) | 13.67 |
| Single Female/Mother | 141 (20.8%) | 4.13 |
| Non-family | 273 (40.3%) | 1.40 |
| Total Households | 677 (100.0%) | 2.85 |
Household Size by Marriage Status in Cabazon
Out of a total of 677 households in Cabazon, 404 (59.7%) are family households, while 273 (40.3%) are nonfamily households. The most numerous type of family households are 2-person households, comprising 207, and the most common type of nonfamily households are 1-person households, comprising 173.
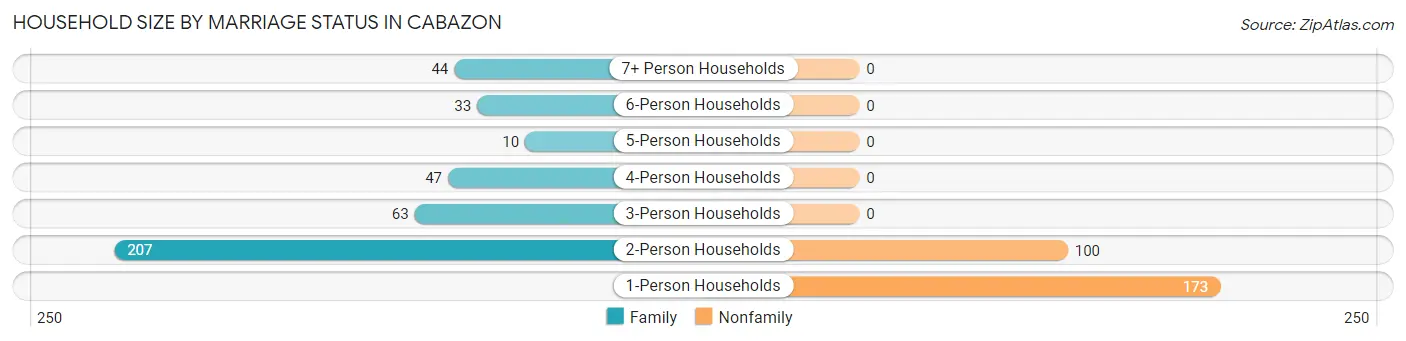
| Household Size | Family Households | Nonfamily Households |
| 1-Person Households | - | 173 (25.6%) |
| 2-Person Households | 207 (30.6%) | 100 (14.8%) |
| 3-Person Households | 63 (9.3%) | 0 (0.0%) |
| 4-Person Households | 47 (6.9%) | 0 (0.0%) |
| 5-Person Households | 10 (1.5%) | 0 (0.0%) |
| 6-Person Households | 33 (4.9%) | 0 (0.0%) |
| 7+ Person Households | 44 (6.5%) | 0 (0.0%) |
| Total | 404 (59.7%) | 273 (40.3%) |
Female Fertility in Cabazon
Fertility by Age in Cabazon
| Age Bracket | Women with Births | Births / 1,000 Women |
| 15 to 19 years | 0 (0.0%) | 0.0 |
| 20 to 34 years | 0 (0.0%) | 0.0 |
| 35 to 50 years | 0 (0.0%) | 0.0 |
| Total | 0 (0.0%) | 0.0 |
Fertility by Age by Marriage Status in Cabazon
| Age Bracket | Married | Unmarried |
| 15 to 19 years | 0 (0.0%) | 0 (0.0%) |
| 20 to 34 years | 0 (0.0%) | 0 (0.0%) |
| 35 to 50 years | 0 (0.0%) | 0 (0.0%) |
| Total | 0 (0.0%) | 0 (0.0%) |
Fertility by Education in Cabazon
| Educational Attainment | Women with Births | Births / 1,000 Women |
| Less than High School | 0 (0.0%) | 0.0 |
| High School Diploma | 0 (0.0%) | 0.0 |
| College or Associate's Degree | 0 (0.0%) | 0.0 |
| Bachelor's Degree | 0 (0.0%) | 0.0 |
| Graduate Degree | 0 (0.0%) | 0.0 |
| Total | 0 (0.0%) | 0.0 |
Fertility by Education by Marriage Status in Cabazon
| Educational Attainment | Married | Unmarried |
| Less than High School | 0 (0.0%) | 0 (0.0%) |
| High School Diploma | 0 (0.0%) | 0 (0.0%) |
| College or Associate's Degree | 0 (0.0%) | 0 (0.0%) |
| Bachelor's Degree | 0 (0.0%) | 0 (0.0%) |
| Graduate Degree | 0 (0.0%) | 0 (0.0%) |
| Total | 0 (0.0%) | 0 (0.0%) |
Employment Characteristics in Cabazon
Employment by Class of Employer in Cabazon
Among the 1,015 employed individuals in Cabazon, private company employees (681 | 67.1%), self-employed (not incorporated) (265 | 26.1%), and self-employed (incorporated) (35 | 3.5%) make up the most common classes of employment.
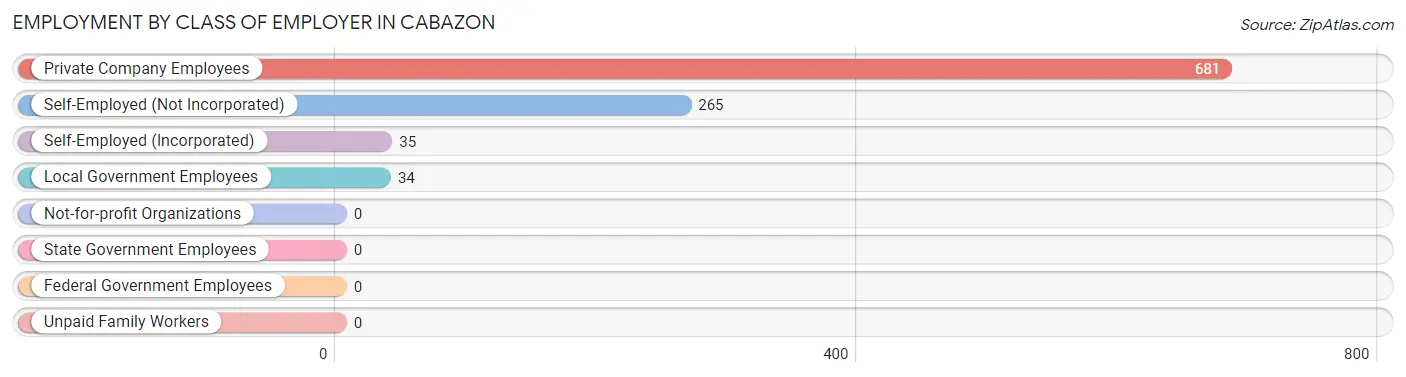
| Employer Class | # Employees | % Employees |
| Private Company Employees | 681 | 67.1% |
| Self-Employed (Incorporated) | 35 | 3.5% |
| Self-Employed (Not Incorporated) | 265 | 26.1% |
| Not-for-profit Organizations | 0 | 0.0% |
| Local Government Employees | 34 | 3.4% |
| State Government Employees | 0 | 0.0% |
| Federal Government Employees | 0 | 0.0% |
| Unpaid Family Workers | 0 | 0.0% |
| Total | 1,015 | 100.0% |
Employment Status by Age in Cabazon
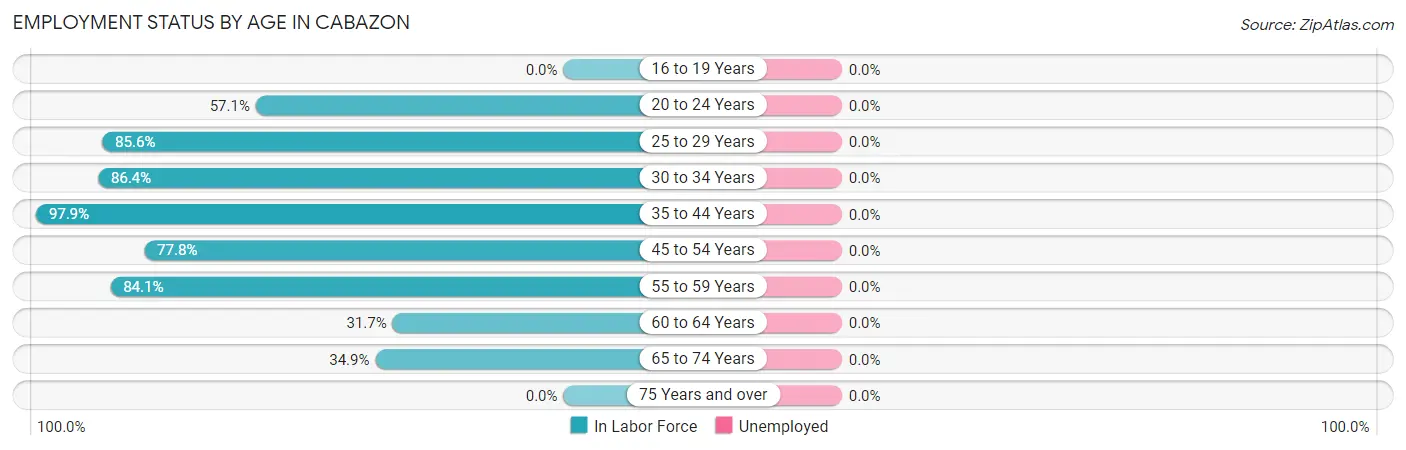
| Age Bracket | In Labor Force | Unemployed |
| 16 to 19 Years | 0 (0.0%) | 0 (0.0%) |
| 20 to 24 Years | 24 (57.1%) | 0 (0.0%) |
| 25 to 29 Years | 334 (85.6%) | 0 (0.0%) |
| 30 to 34 Years | 114 (86.4%) | 0 (0.0%) |
| 35 to 44 Years | 138 (97.9%) | 0 (0.0%) |
| 45 to 54 Years | 154 (77.8%) | 0 (0.0%) |
| 55 to 59 Years | 116 (84.1%) | 0 (0.0%) |
| 60 to 64 Years | 39 (31.7%) | 0 (0.0%) |
| 65 to 74 Years | 121 (34.9%) | 0 (0.0%) |
| 75 Years and over | 0 (0.0%) | 0 (0.0%) |
| Total | 1,039 (64.4%) | 0 (0.0%) |
Employment Status by Educational Attainment in Cabazon
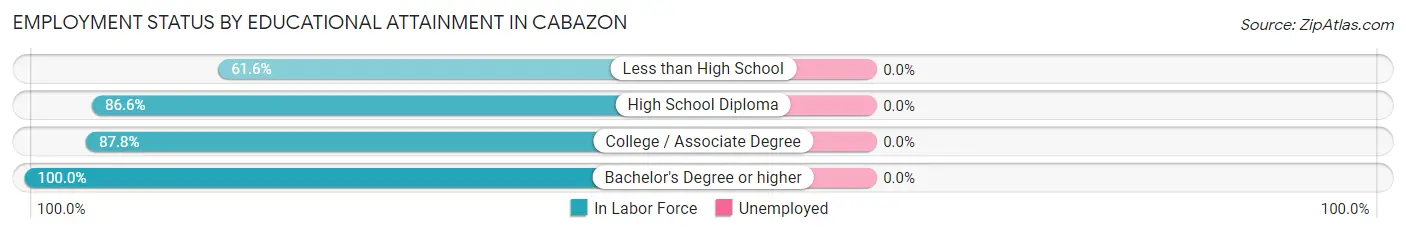
| Educational Attainment | In Labor Force | Unemployed |
| Less than High School | 204 (61.6%) | 0 (0.0%) |
| High School Diploma | 413 (86.6%) | 0 (0.0%) |
| College / Associate Degree | 260 (87.8%) | 0 (0.0%) |
| Bachelor's Degree or higher | 18 (100.0%) | 0 (0.0%) |
| Total | 895 (79.8%) | 0 (0.0%) |
Employment Occupations by Sex in Cabazon
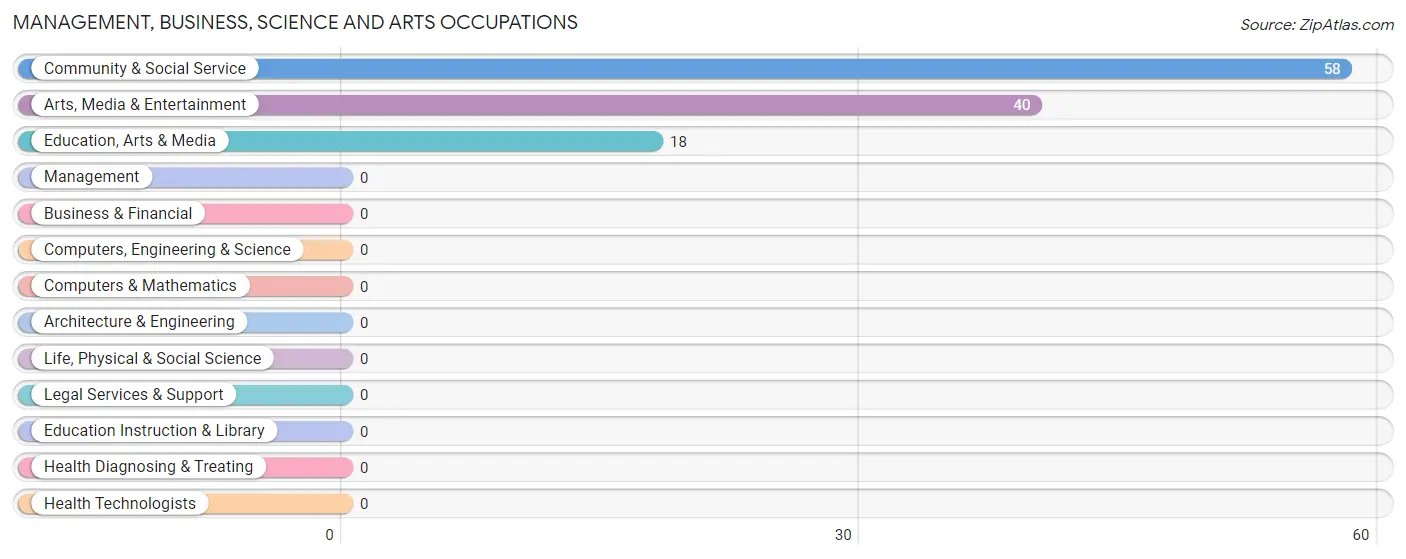
Management, Business, Science and Arts Occupations
The most common Management, Business, Science and Arts occupations in Cabazon are Community & Social Service (58 | 5.6%), Arts, Media & Entertainment (40 | 3.8%), and Education, Arts & Media (18 | 1.7%).
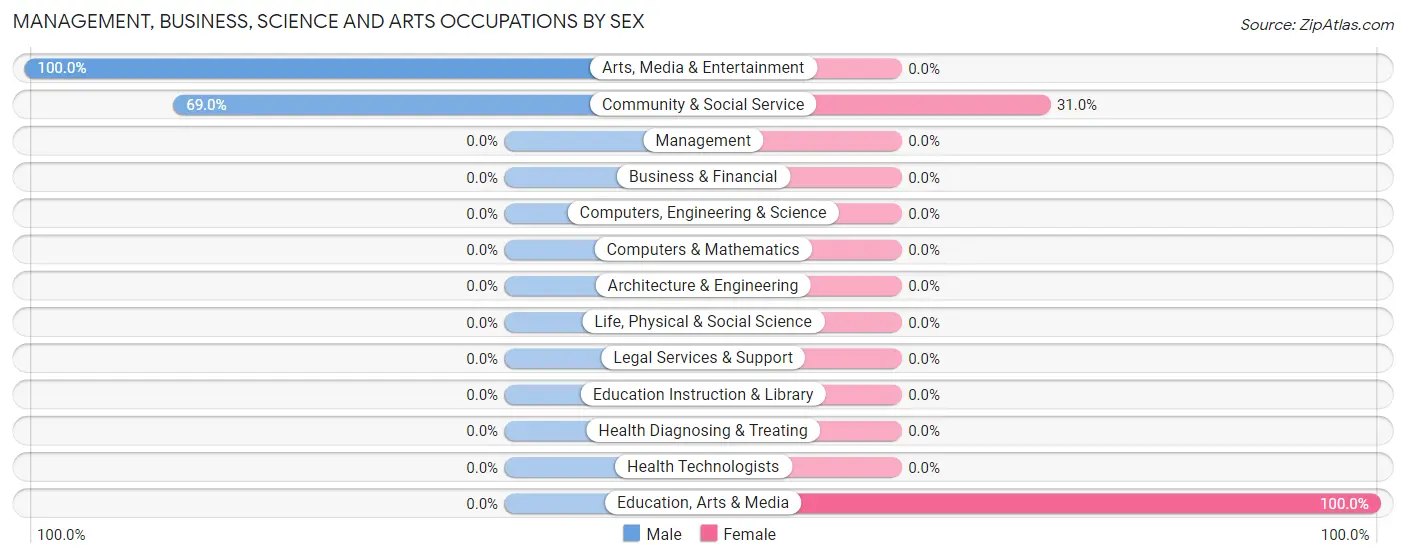
Management, Business, Science and Arts Occupations by Sex
Within the Management, Business, Science and Arts occupations in Cabazon, the most male-oriented occupations are Arts, Media & Entertainment (100.0%), and Community & Social Service (69.0%), while the most female-oriented occupations are Education, Arts & Media (100.0%), and Community & Social Service (31.0%).
| Occupation | Male | Female |
| Management | 0 (0.0%) | 0 (0.0%) |
| Business & Financial | 0 (0.0%) | 0 (0.0%) |
| Computers, Engineering & Science | 0 (0.0%) | 0 (0.0%) |
| Computers & Mathematics | 0 (0.0%) | 0 (0.0%) |
| Architecture & Engineering | 0 (0.0%) | 0 (0.0%) |
| Life, Physical & Social Science | 0 (0.0%) | 0 (0.0%) |
| Community & Social Service | 40 (69.0%) | 18 (31.0%) |
| Education, Arts & Media | 0 (0.0%) | 18 (100.0%) |
| Legal Services & Support | 0 (0.0%) | 0 (0.0%) |
| Education Instruction & Library | 0 (0.0%) | 0 (0.0%) |
| Arts, Media & Entertainment | 40 (100.0%) | 0 (0.0%) |
| Health Diagnosing & Treating | 0 (0.0%) | 0 (0.0%) |
| Health Technologists | 0 (0.0%) | 0 (0.0%) |
| Total (Category) | 40 (69.0%) | 18 (31.0%) |
| Total (Overall) | 565 (54.3%) | 475 (45.7%) |
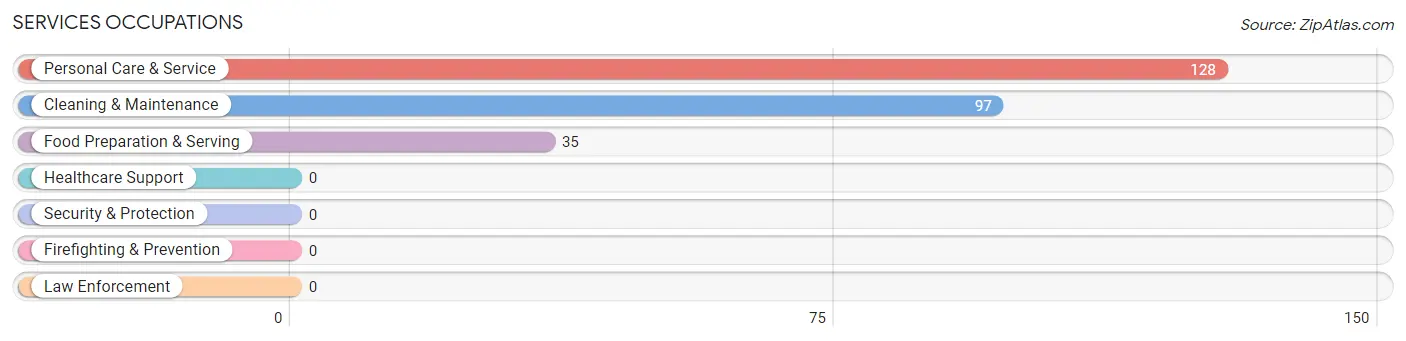
Services Occupations
The most common Services occupations in Cabazon are Personal Care & Service (128 | 12.3%), Cleaning & Maintenance (97 | 9.3%), and Food Preparation & Serving (35 | 3.4%).
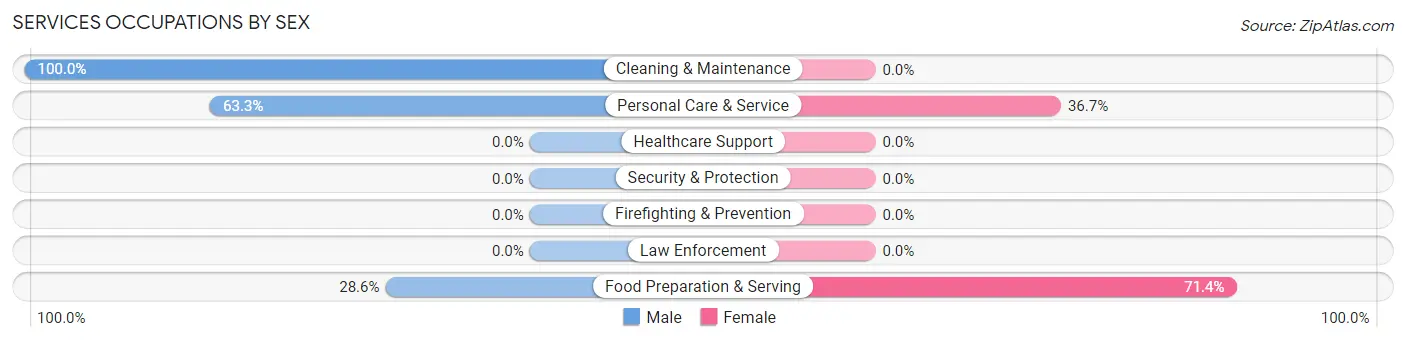
Services Occupations by Sex
Within the Services occupations in Cabazon, the most male-oriented occupations are Cleaning & Maintenance (100.0%), Personal Care & Service (63.3%), and Food Preparation & Serving (28.6%), while the most female-oriented occupations are Food Preparation & Serving (71.4%), and Personal Care & Service (36.7%).
| Occupation | Male | Female |
| Healthcare Support | 0 (0.0%) | 0 (0.0%) |
| Security & Protection | 0 (0.0%) | 0 (0.0%) |
| Firefighting & Prevention | 0 (0.0%) | 0 (0.0%) |
| Law Enforcement | 0 (0.0%) | 0 (0.0%) |
| Food Preparation & Serving | 10 (28.6%) | 25 (71.4%) |
| Cleaning & Maintenance | 97 (100.0%) | 0 (0.0%) |
| Personal Care & Service | 81 (63.3%) | 47 (36.7%) |
| Total (Category) | 188 (72.3%) | 72 (27.7%) |
| Total (Overall) | 565 (54.3%) | 475 (45.7%) |
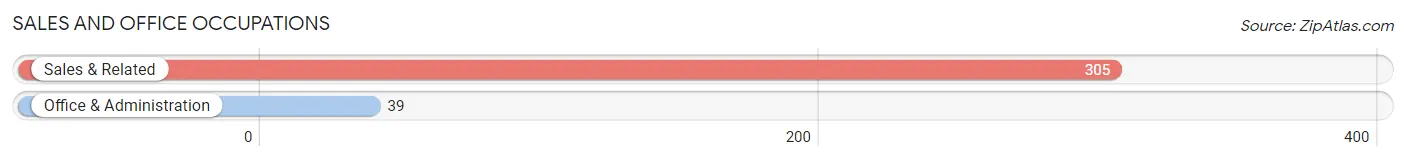
Sales and Office Occupations
The most common Sales and Office occupations in Cabazon are Sales & Related (305 | 29.3%), and Office & Administration (39 | 3.7%).
Sales and Office Occupations by Sex
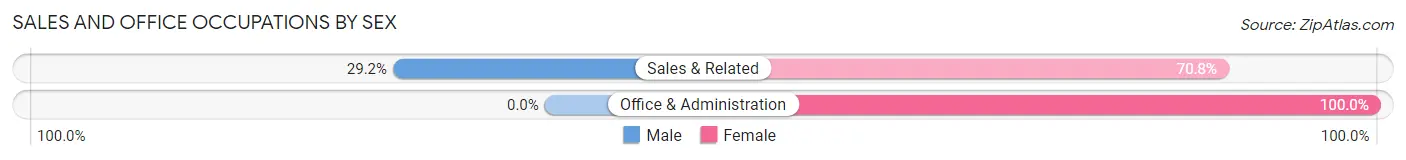
| Occupation | Male | Female |
| Sales & Related | 89 (29.2%) | 216 (70.8%) |
| Office & Administration | 0 (0.0%) | 39 (100.0%) |
| Total (Category) | 89 (25.9%) | 255 (74.1%) |
| Total (Overall) | 565 (54.3%) | 475 (45.7%) |
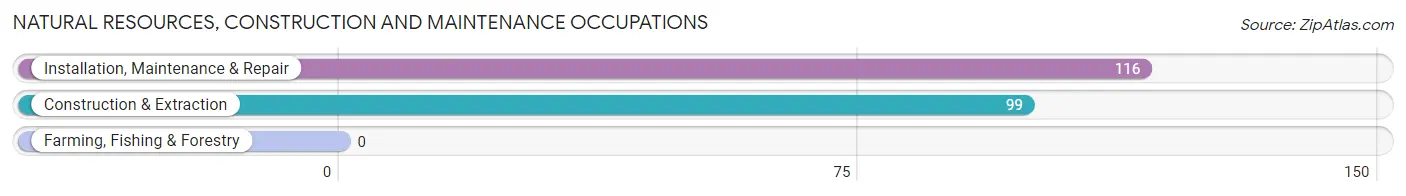
Natural Resources, Construction and Maintenance Occupations
The most common Natural Resources, Construction and Maintenance occupations in Cabazon are Installation, Maintenance & Repair (116 | 11.2%), and Construction & Extraction (99 | 9.5%).
Natural Resources, Construction and Maintenance Occupations by Sex
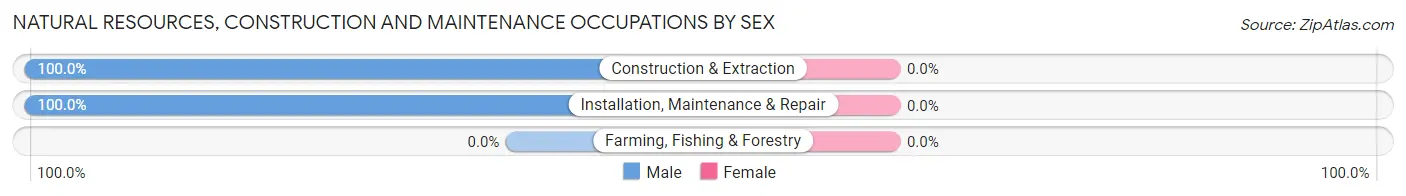
| Occupation | Male | Female |
| Farming, Fishing & Forestry | 0 (0.0%) | 0 (0.0%) |
| Construction & Extraction | 99 (100.0%) | 0 (0.0%) |
| Installation, Maintenance & Repair | 116 (100.0%) | 0 (0.0%) |
| Total (Category) | 215 (100.0%) | 0 (0.0%) |
| Total (Overall) | 565 (54.3%) | 475 (45.7%) |
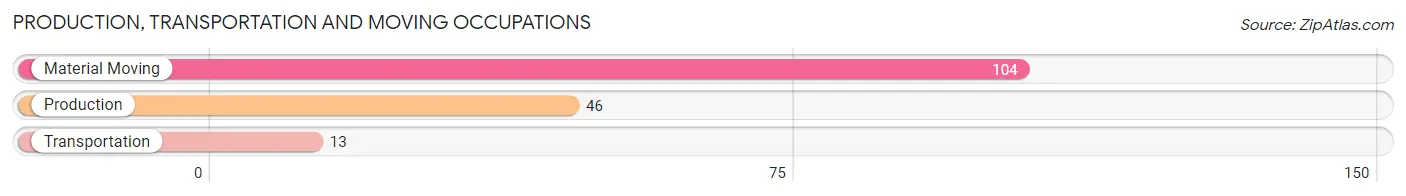
Production, Transportation and Moving Occupations
The most common Production, Transportation and Moving occupations in Cabazon are Material Moving (104 | 10.0%), Production (46 | 4.4%), and Transportation (13 | 1.3%).
Production, Transportation and Moving Occupations by Sex
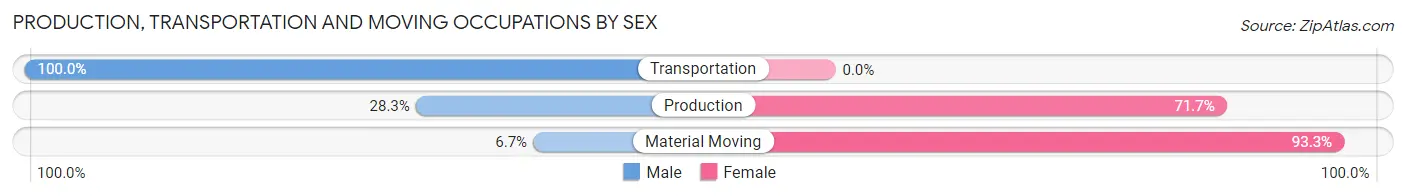
| Occupation | Male | Female |
| Production | 13 (28.3%) | 33 (71.7%) |
| Transportation | 13 (100.0%) | 0 (0.0%) |
| Material Moving | 7 (6.7%) | 97 (93.3%) |
| Total (Category) | 33 (20.3%) | 130 (79.7%) |
| Total (Overall) | 565 (54.3%) | 475 (45.7%) |
Employment Industries by Sex in Cabazon
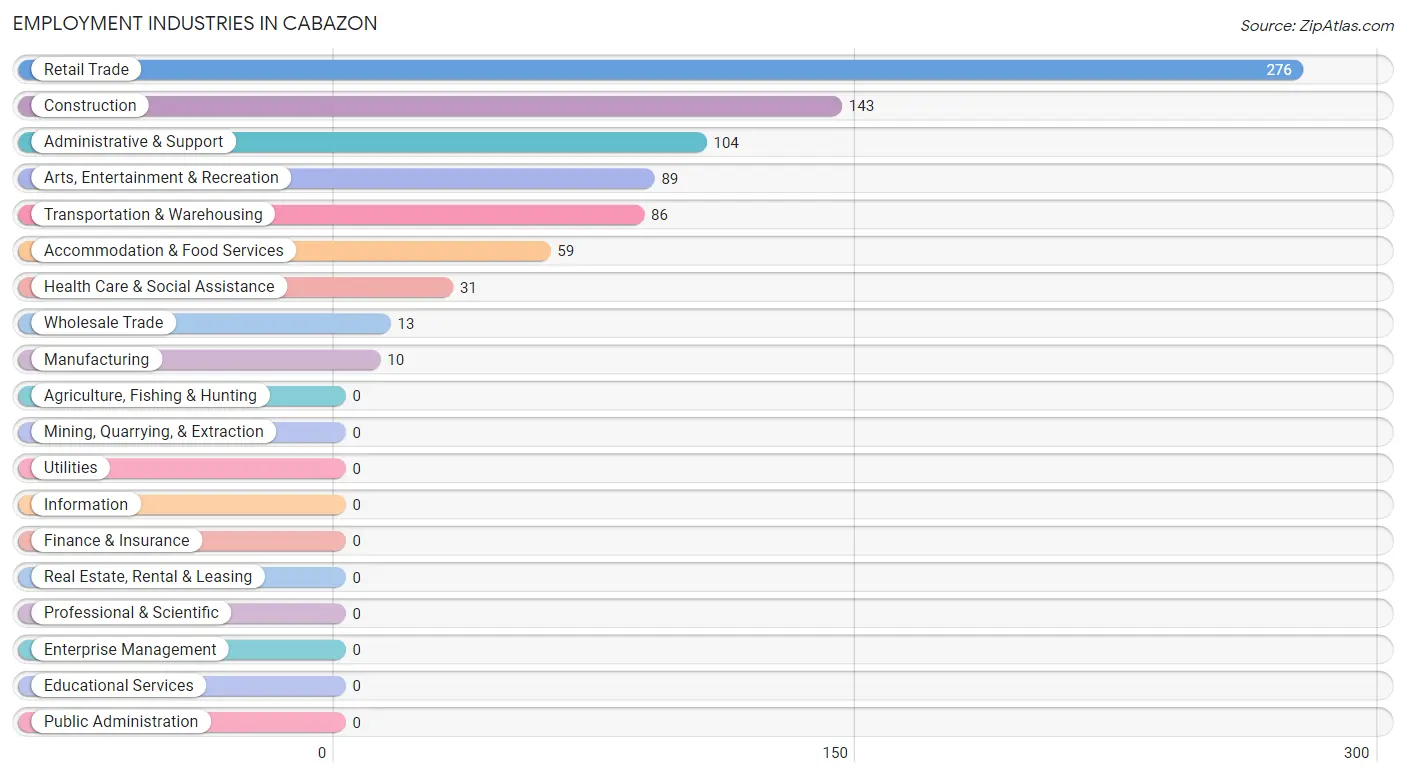
Employment Industries in Cabazon
The major employment industries in Cabazon include Retail Trade (276 | 26.5%), Construction (143 | 13.8%), Administrative & Support (104 | 10.0%), Arts, Entertainment & Recreation (89 | 8.6%), and Transportation & Warehousing (86 | 8.3%).
Employment Industries by Sex in Cabazon
The Cabazon industries that see more men than women are Construction (100.0%), Manufacturing (100.0%), and Wholesale Trade (100.0%), whereas the industries that tend to have a higher number of women are Transportation & Warehousing (100.0%), Accommodation & Food Services (100.0%), and Retail Trade (80.4%).
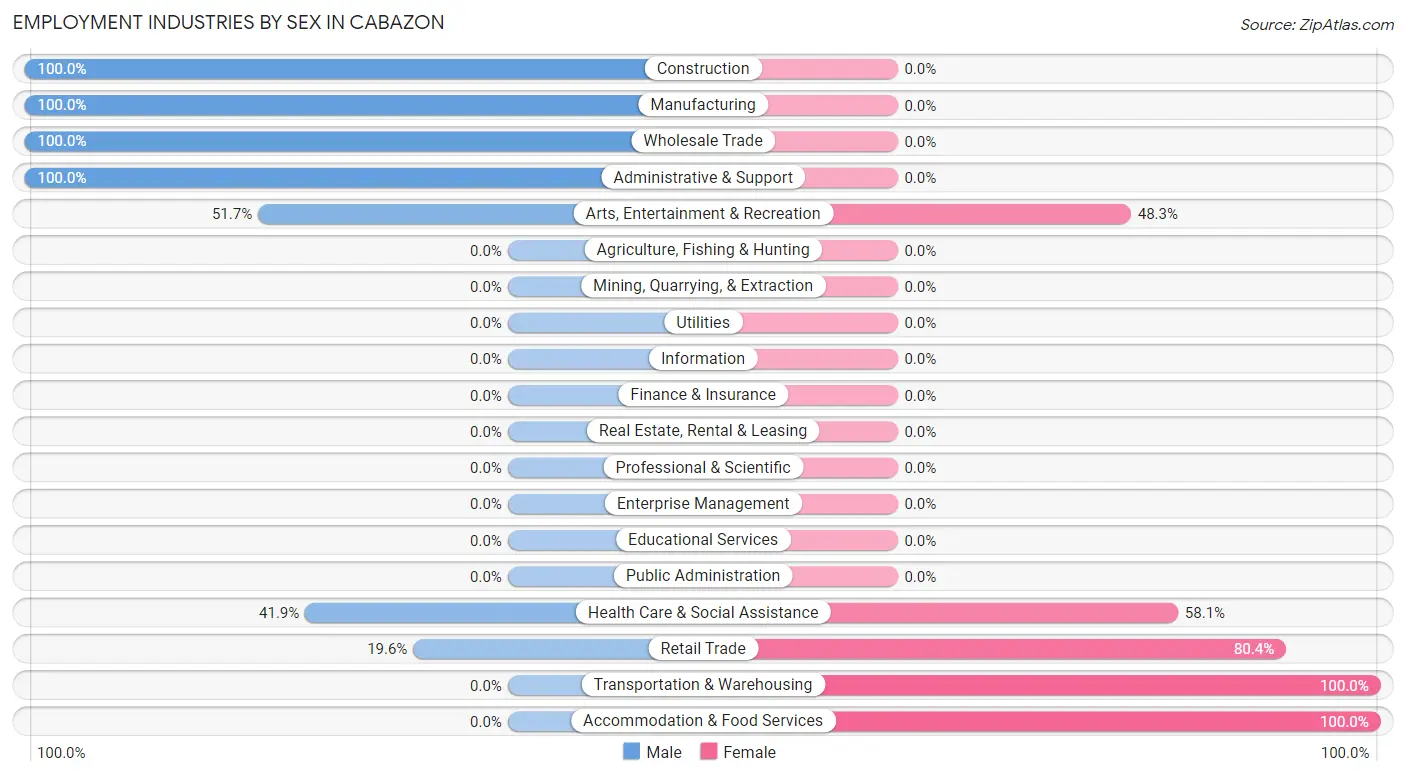
| Industry | Male | Female |
| Agriculture, Fishing & Hunting | 0 (0.0%) | 0 (0.0%) |
| Mining, Quarrying, & Extraction | 0 (0.0%) | 0 (0.0%) |
| Construction | 143 (100.0%) | 0 (0.0%) |
| Manufacturing | 10 (100.0%) | 0 (0.0%) |
| Wholesale Trade | 13 (100.0%) | 0 (0.0%) |
| Retail Trade | 54 (19.6%) | 222 (80.4%) |
| Transportation & Warehousing | 0 (0.0%) | 86 (100.0%) |
| Utilities | 0 (0.0%) | 0 (0.0%) |
| Information | 0 (0.0%) | 0 (0.0%) |
| Finance & Insurance | 0 (0.0%) | 0 (0.0%) |
| Real Estate, Rental & Leasing | 0 (0.0%) | 0 (0.0%) |
| Professional & Scientific | 0 (0.0%) | 0 (0.0%) |
| Enterprise Management | 0 (0.0%) | 0 (0.0%) |
| Administrative & Support | 104 (100.0%) | 0 (0.0%) |
| Educational Services | 0 (0.0%) | 0 (0.0%) |
| Health Care & Social Assistance | 13 (41.9%) | 18 (58.1%) |
| Arts, Entertainment & Recreation | 46 (51.7%) | 43 (48.3%) |
| Accommodation & Food Services | 0 (0.0%) | 59 (100.0%) |
| Public Administration | 0 (0.0%) | 0 (0.0%) |
| Total | 565 (54.3%) | 475 (45.7%) |
Education in Cabazon
School Enrollment in Cabazon
The most common levels of schooling among the 217 students in Cabazon are middle school (87 | 40.1%), high school (58 | 26.7%), and college / undergraduate (34 | 15.7%).
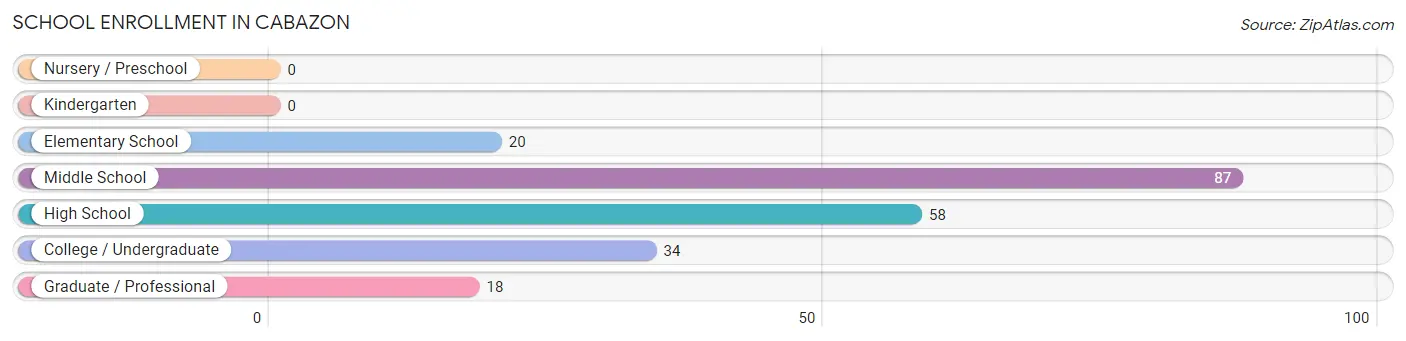
| School Level | # Students | % Students |
| Nursery / Preschool | 0 | 0.0% |
| Kindergarten | 0 | 0.0% |
| Elementary School | 20 | 9.2% |
| Middle School | 87 | 40.1% |
| High School | 58 | 26.7% |
| College / Undergraduate | 34 | 15.7% |
| Graduate / Professional | 18 | 8.3% |
| Total | 217 | 100.0% |
School Enrollment by Age by Funding Source in Cabazon
Out of a total of 217 students who are enrolled in schools in Cabazon, 19 (8.8%) attend a private institution, while the remaining 198 (91.2%) are enrolled in public schools. The age group of 35 years and over has the highest likelihood of being enrolled in private schools, with 18 (100.0% in the age bracket) enrolled. Conversely, the age group of 5 to 9 year old has the lowest likelihood of being enrolled in a private school, with 20 (100.0% in the age bracket) attending a public institution.
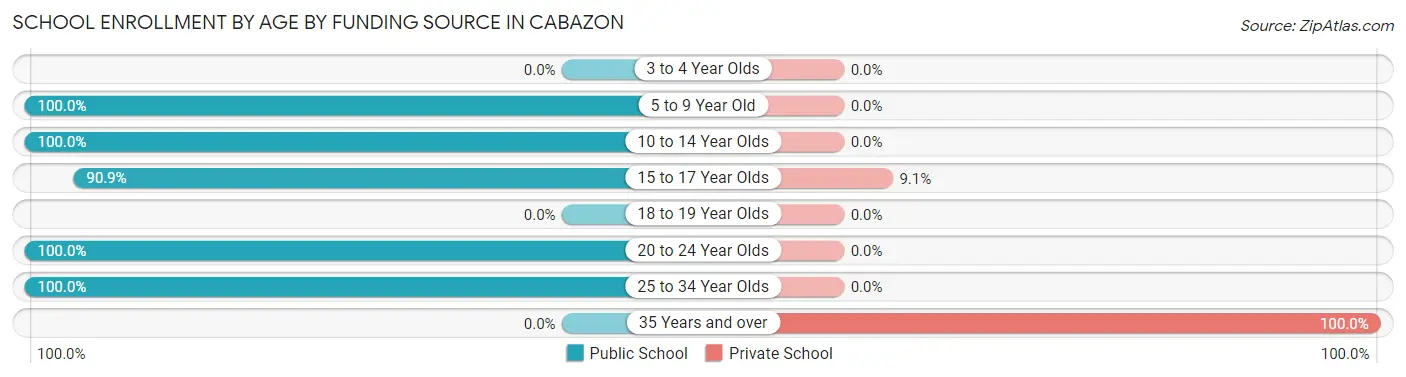
| Age Bracket | Public School | Private School |
| 3 to 4 Year Olds | 0 (0.0%) | 0 (0.0%) |
| 5 to 9 Year Old | 20 (100.0%) | 0 (0.0%) |
| 10 to 14 Year Olds | 134 (100.0%) | 0 (0.0%) |
| 15 to 17 Year Olds | 10 (90.9%) | 1 (9.1%) |
| 18 to 19 Year Olds | 0 (0.0%) | 0 (0.0%) |
| 20 to 24 Year Olds | 18 (100.0%) | 0 (0.0%) |
| 25 to 34 Year Olds | 16 (100.0%) | 0 (0.0%) |
| 35 Years and over | 0 (0.0%) | 18 (100.0%) |
| Total | 198 (91.2%) | 19 (8.8%) |
Educational Attainment by Field of Study in Cabazon
Social sciences (41 | 41.4%), education (40 | 40.4%), and communications (18 | 18.2%) are the most common fields of study among 99 individuals in Cabazon who have obtained a bachelor's degree or higher.
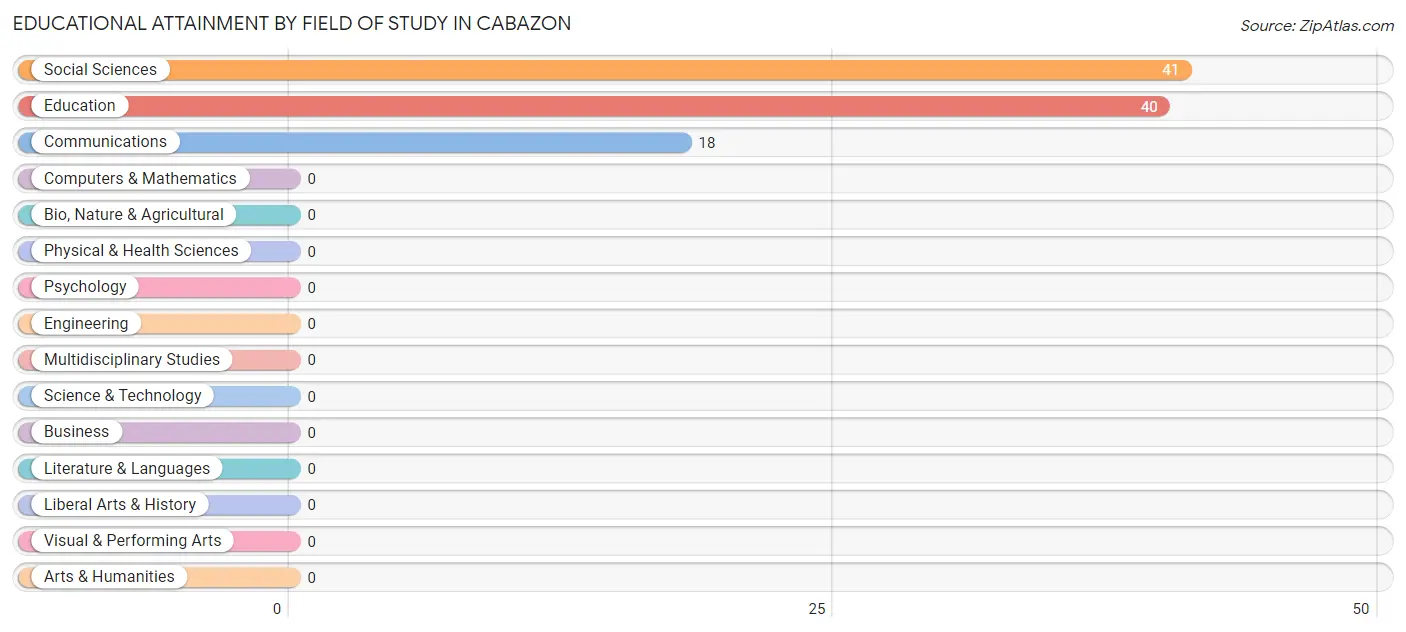
| Field of Study | # Graduates | % Graduates |
| Computers & Mathematics | 0 | 0.0% |
| Bio, Nature & Agricultural | 0 | 0.0% |
| Physical & Health Sciences | 0 | 0.0% |
| Psychology | 0 | 0.0% |
| Social Sciences | 41 | 41.4% |
| Engineering | 0 | 0.0% |
| Multidisciplinary Studies | 0 | 0.0% |
| Science & Technology | 0 | 0.0% |
| Business | 0 | 0.0% |
| Education | 40 | 40.4% |
| Literature & Languages | 0 | 0.0% |
| Liberal Arts & History | 0 | 0.0% |
| Visual & Performing Arts | 0 | 0.0% |
| Communications | 18 | 18.2% |
| Arts & Humanities | 0 | 0.0% |
| Total | 99 | 100.0% |
Transportation & Commute in Cabazon
Vehicle Availability by Sex in Cabazon
The most prevalent vehicle ownership categories in Cabazon are males with 3 vehicles (295, accounting for 52.9%) and females with 3 vehicles (184, making up 65.6%).
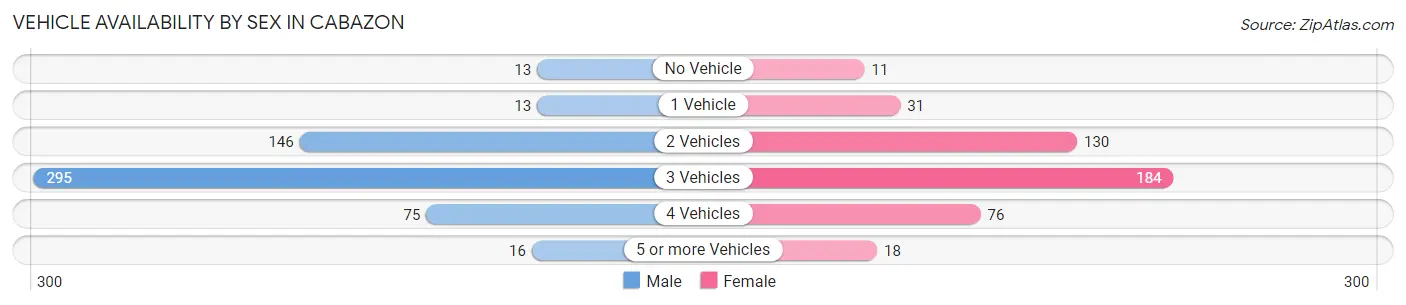
| Vehicles Available | Male | Female |
| No Vehicle | 13 (2.3%) | 11 (2.4%) |
| 1 Vehicle | 13 (2.3%) | 31 (6.9%) |
| 2 Vehicles | 146 (26.2%) | 130 (28.9%) |
| 3 Vehicles | 295 (52.9%) | 184 (40.9%) |
| 4 Vehicles | 75 (13.4%) | 76 (16.9%) |
| 5 or more Vehicles | 16 (2.9%) | 18 (4.0%) |
| Total | 558 (100.0%) | 450 (100.0%) |
Commute Time in Cabazon
The most frequently occuring commute durations in Cabazon are 5 to 9 minutes (259 commuters, 25.5%), 90 or more minutes (195 commuters, 19.2%), and 35 to 39 minutes (187 commuters, 18.4%).
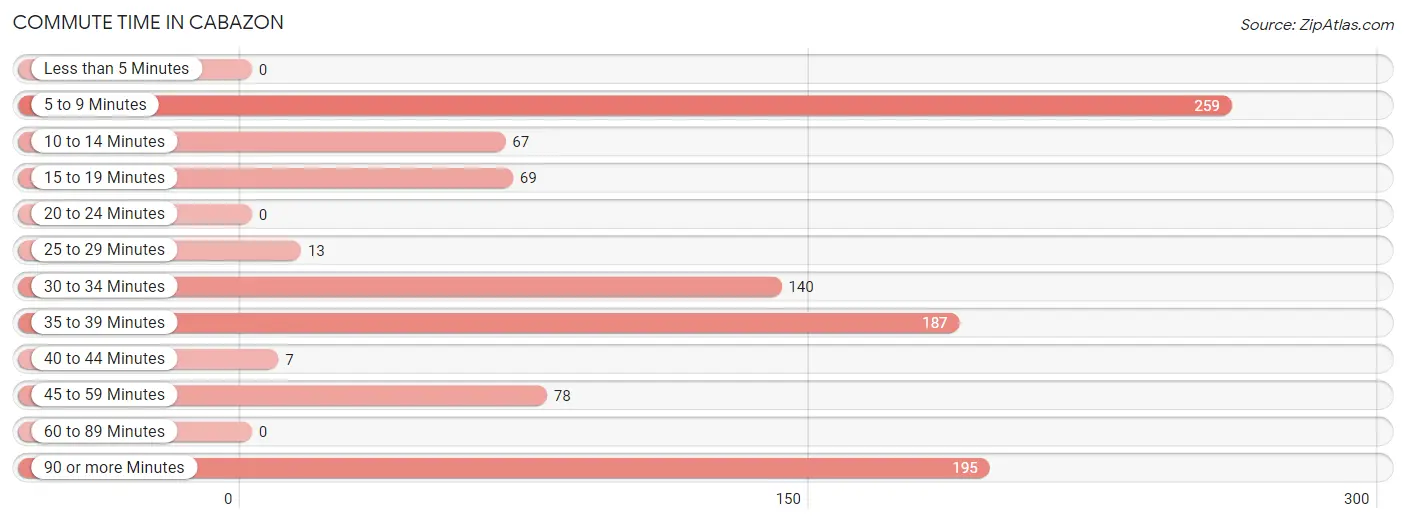
| Commute Time | # Commuters | % Commuters |
| Less than 5 Minutes | 0 | 0.0% |
| 5 to 9 Minutes | 259 | 25.5% |
| 10 to 14 Minutes | 67 | 6.6% |
| 15 to 19 Minutes | 69 | 6.8% |
| 20 to 24 Minutes | 0 | 0.0% |
| 25 to 29 Minutes | 13 | 1.3% |
| 30 to 34 Minutes | 140 | 13.8% |
| 35 to 39 Minutes | 187 | 18.4% |
| 40 to 44 Minutes | 7 | 0.7% |
| 45 to 59 Minutes | 78 | 7.7% |
| 60 to 89 Minutes | 0 | 0.0% |
| 90 or more Minutes | 195 | 19.2% |
Commute Time by Sex in Cabazon
The most common commute times in Cabazon are 90 or more minutes (195 commuters, 34.5%) for males and 35 to 39 minutes (174 commuters, 38.7%) for females.
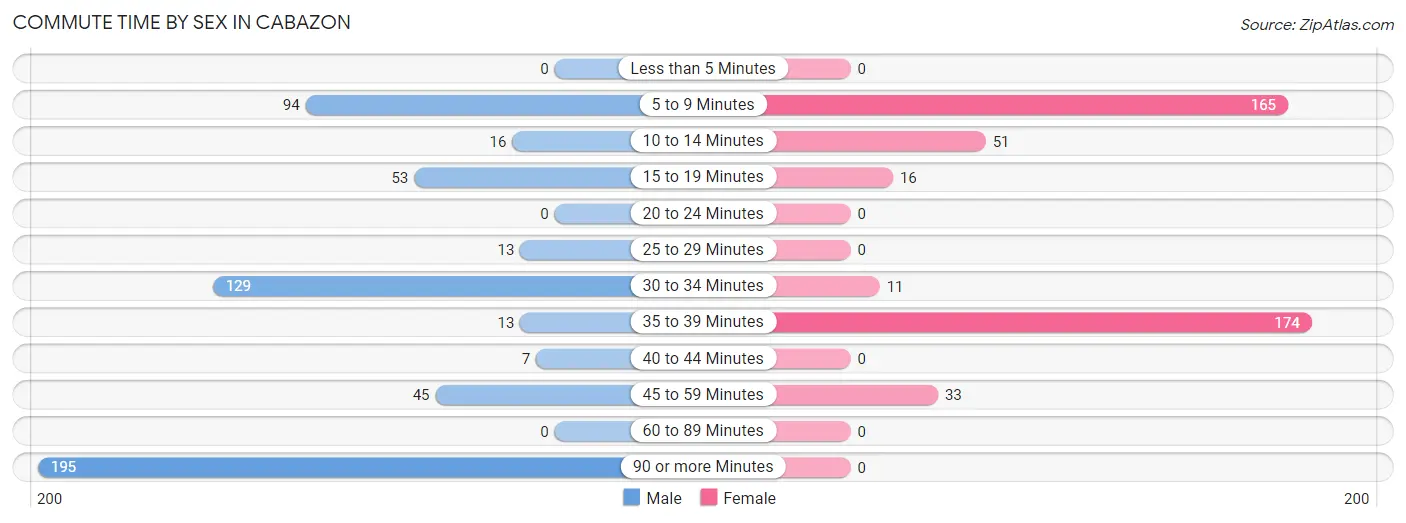
| Commute Time | Male | Female |
| Less than 5 Minutes | 0 (0.0%) | 0 (0.0%) |
| 5 to 9 Minutes | 94 (16.6%) | 165 (36.7%) |
| 10 to 14 Minutes | 16 (2.8%) | 51 (11.3%) |
| 15 to 19 Minutes | 53 (9.4%) | 16 (3.6%) |
| 20 to 24 Minutes | 0 (0.0%) | 0 (0.0%) |
| 25 to 29 Minutes | 13 (2.3%) | 0 (0.0%) |
| 30 to 34 Minutes | 129 (22.8%) | 11 (2.4%) |
| 35 to 39 Minutes | 13 (2.3%) | 174 (38.7%) |
| 40 to 44 Minutes | 7 (1.2%) | 0 (0.0%) |
| 45 to 59 Minutes | 45 (8.0%) | 33 (7.3%) |
| 60 to 89 Minutes | 0 (0.0%) | 0 (0.0%) |
| 90 or more Minutes | 195 (34.5%) | 0 (0.0%) |
Time of Departure to Work by Sex in Cabazon
The most frequent times of departure to work in Cabazon are 12:00 AM to 4:59 AM (142, 25.1%) for males and 12:00 AM to 4:59 AM (129, 28.7%) for females.
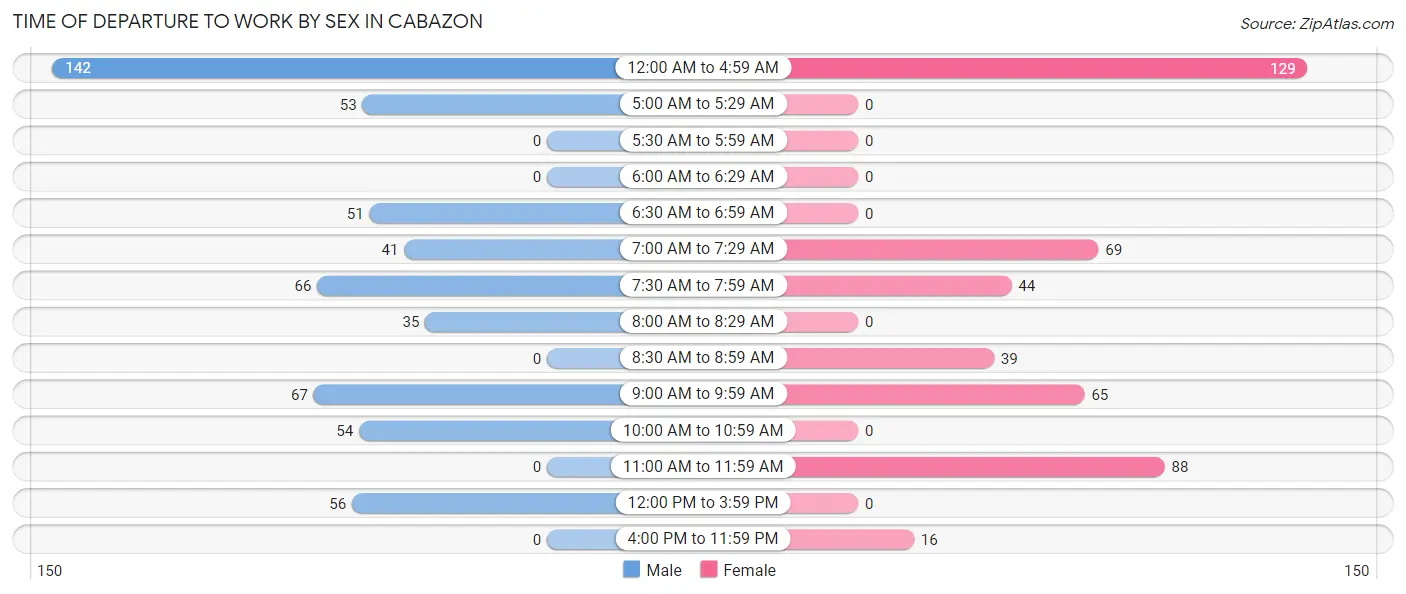
| Time of Departure | Male | Female |
| 12:00 AM to 4:59 AM | 142 (25.1%) | 129 (28.7%) |
| 5:00 AM to 5:29 AM | 53 (9.4%) | 0 (0.0%) |
| 5:30 AM to 5:59 AM | 0 (0.0%) | 0 (0.0%) |
| 6:00 AM to 6:29 AM | 0 (0.0%) | 0 (0.0%) |
| 6:30 AM to 6:59 AM | 51 (9.0%) | 0 (0.0%) |
| 7:00 AM to 7:29 AM | 41 (7.3%) | 69 (15.3%) |
| 7:30 AM to 7:59 AM | 66 (11.7%) | 44 (9.8%) |
| 8:00 AM to 8:29 AM | 35 (6.2%) | 0 (0.0%) |
| 8:30 AM to 8:59 AM | 0 (0.0%) | 39 (8.7%) |
| 9:00 AM to 9:59 AM | 67 (11.9%) | 65 (14.4%) |
| 10:00 AM to 10:59 AM | 54 (9.6%) | 0 (0.0%) |
| 11:00 AM to 11:59 AM | 0 (0.0%) | 88 (19.6%) |
| 12:00 PM to 3:59 PM | 56 (9.9%) | 0 (0.0%) |
| 4:00 PM to 11:59 PM | 0 (0.0%) | 16 (3.6%) |
| Total | 565 (100.0%) | 450 (100.0%) |
Housing Occupancy in Cabazon
Occupancy by Ownership in Cabazon
Of the total 677 dwellings in Cabazon, owner-occupied units account for 542 (80.1%), while renter-occupied units make up 135 (19.9%).
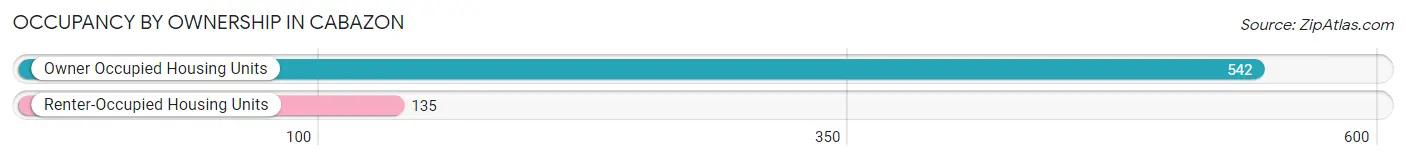
| Occupancy | # Housing Units | % Housing Units |
| Owner Occupied Housing Units | 542 | 80.1% |
| Renter-Occupied Housing Units | 135 | 19.9% |
| Total Occupied Housing Units | 677 | 100.0% |
Occupancy by Household Size in Cabazon
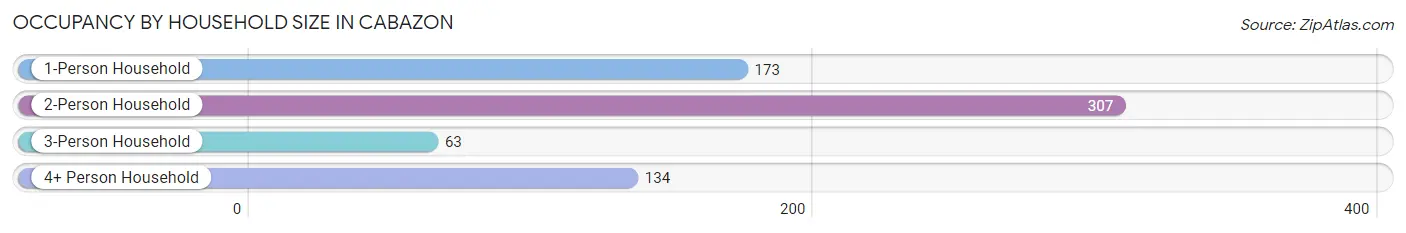
| Household Size | # Housing Units | % Housing Units |
| 1-Person Household | 173 | 25.6% |
| 2-Person Household | 307 | 45.4% |
| 3-Person Household | 63 | 9.3% |
| 4+ Person Household | 134 | 19.8% |
| Total Housing Units | 677 | 100.0% |
Occupancy by Ownership by Household Size in Cabazon
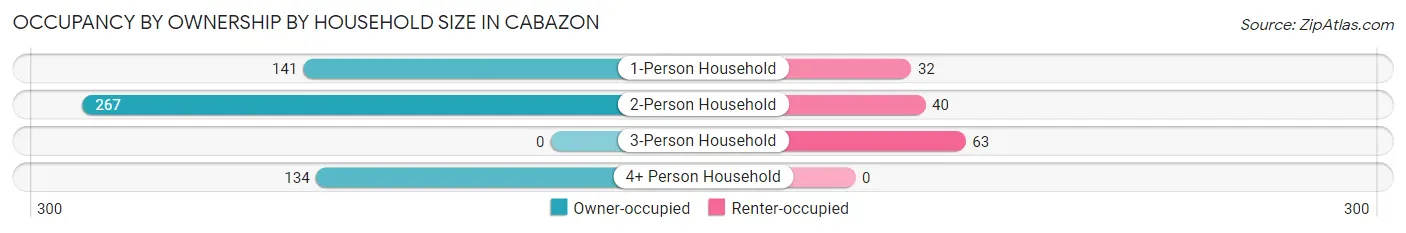
| Household Size | Owner-occupied | Renter-occupied |
| 1-Person Household | 141 (81.5%) | 32 (18.5%) |
| 2-Person Household | 267 (87.0%) | 40 (13.0%) |
| 3-Person Household | 0 (0.0%) | 63 (100.0%) |
| 4+ Person Household | 134 (100.0%) | 0 (0.0%) |
| Total Housing Units | 542 (80.1%) | 135 (19.9%) |
Occupancy by Educational Attainment in Cabazon
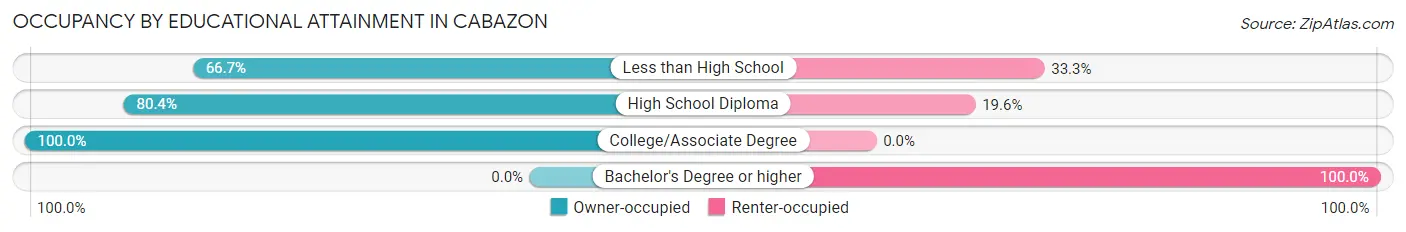
| Household Size | Owner-occupied | Renter-occupied |
| Less than High School | 58 (66.7%) | 29 (33.3%) |
| High School Diploma | 360 (80.4%) | 88 (19.6%) |
| College/Associate Degree | 124 (100.0%) | 0 (0.0%) |
| Bachelor's Degree or higher | 0 (0.0%) | 18 (100.0%) |
Occupancy by Age of Householder in Cabazon
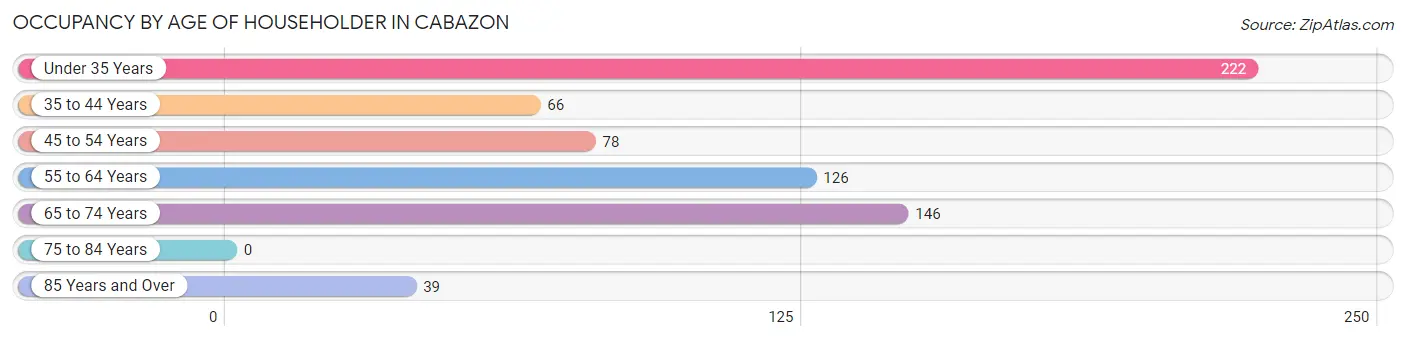
| Age Bracket | # Households | % Households |
| Under 35 Years | 222 | 32.8% |
| 35 to 44 Years | 66 | 9.8% |
| 45 to 54 Years | 78 | 11.5% |
| 55 to 64 Years | 126 | 18.6% |
| 65 to 74 Years | 146 | 21.6% |
| 75 to 84 Years | 0 | 0.0% |
| 85 Years and Over | 39 | 5.8% |
| Total | 677 | 100.0% |
Housing Finances in Cabazon
Median Income by Occupancy in Cabazon
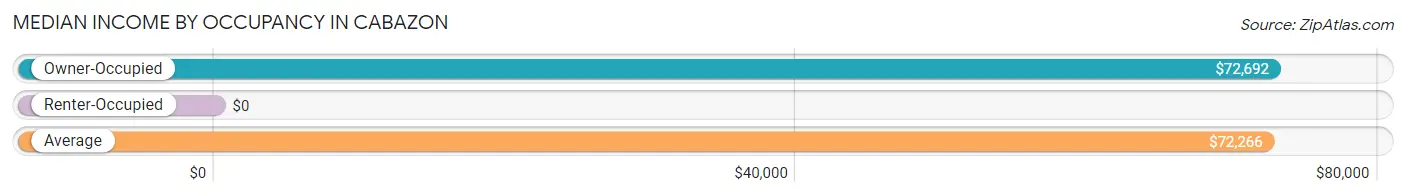
| Occupancy Type | # Households | Median Income |
| Owner-Occupied | 542 (80.1%) | $72,692 |
| Renter-Occupied | 135 (19.9%) | $0 |
| Average | 677 (100.0%) | $72,266 |
Occupancy by Householder Income Bracket in Cabazon
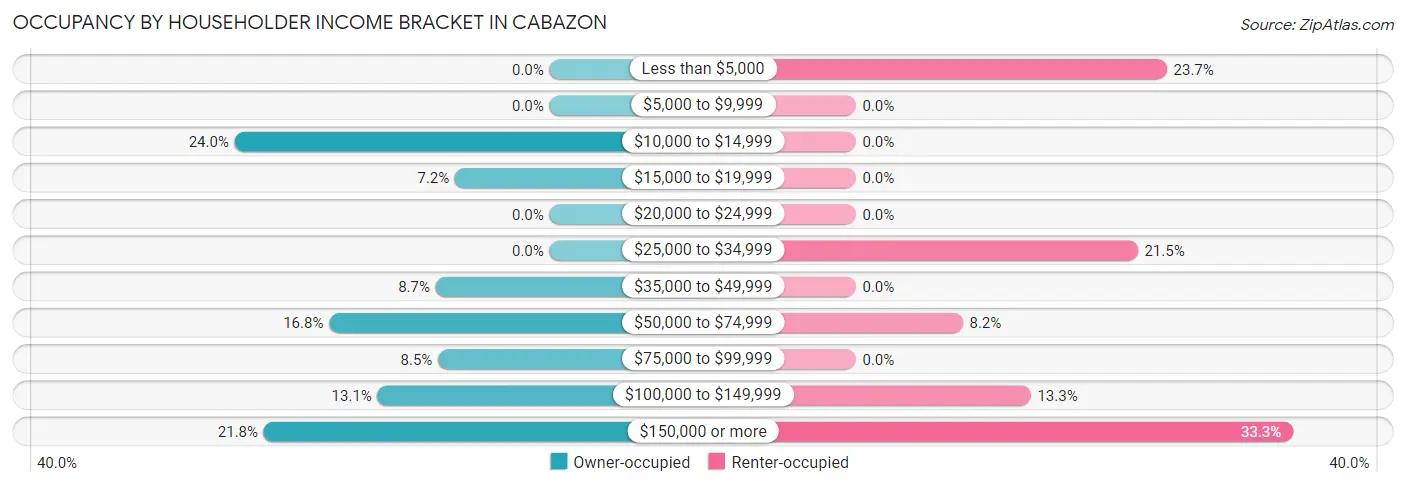
| Income Bracket | Owner-occupied | Renter-occupied |
| Less than $5,000 | 0 (0.0%) | 32 (23.7%) |
| $5,000 to $9,999 | 0 (0.0%) | 0 (0.0%) |
| $10,000 to $14,999 | 130 (24.0%) | 0 (0.0%) |
| $15,000 to $19,999 | 39 (7.2%) | 0 (0.0%) |
| $20,000 to $24,999 | 0 (0.0%) | 0 (0.0%) |
| $25,000 to $34,999 | 0 (0.0%) | 29 (21.5%) |
| $35,000 to $49,999 | 47 (8.7%) | 0 (0.0%) |
| $50,000 to $74,999 | 91 (16.8%) | 11 (8.2%) |
| $75,000 to $99,999 | 46 (8.5%) | 0 (0.0%) |
| $100,000 to $149,999 | 71 (13.1%) | 18 (13.3%) |
| $150,000 or more | 118 (21.8%) | 45 (33.3%) |
| Total | 542 (100.0%) | 135 (100.0%) |
Monthly Housing Cost Tiers in Cabazon
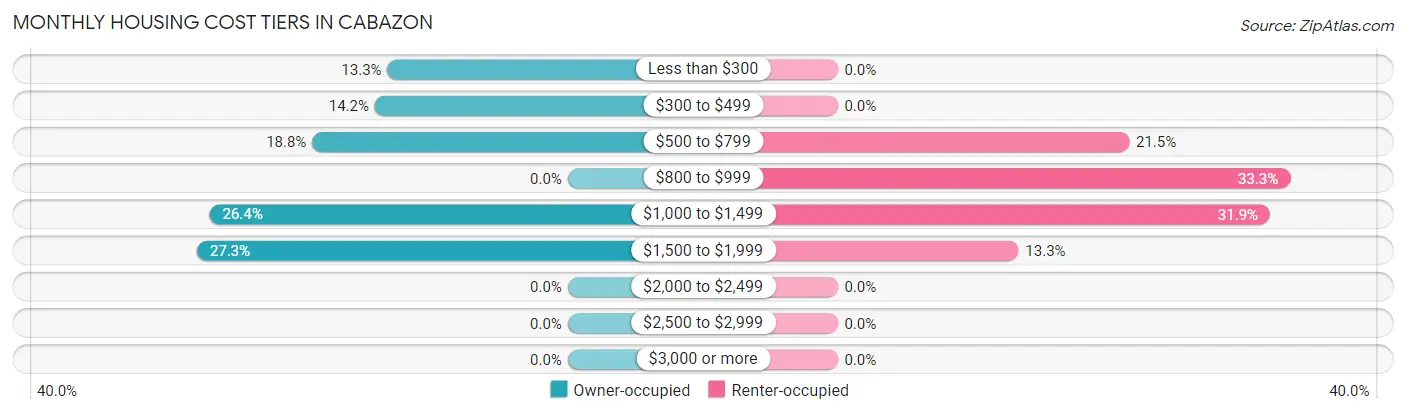
| Monthly Cost | Owner-occupied | Renter-occupied |
| Less than $300 | 72 (13.3%) | 0 (0.0%) |
| $300 to $499 | 77 (14.2%) | 0 (0.0%) |
| $500 to $799 | 102 (18.8%) | 29 (21.5%) |
| $800 to $999 | 0 (0.0%) | 45 (33.3%) |
| $1,000 to $1,499 | 143 (26.4%) | 43 (31.9%) |
| $1,500 to $1,999 | 148 (27.3%) | 18 (13.3%) |
| $2,000 to $2,499 | 0 (0.0%) | 0 (0.0%) |
| $2,500 to $2,999 | 0 (0.0%) | 0 (0.0%) |
| $3,000 or more | 0 (0.0%) | 0 (0.0%) |
| Total | 542 (100.0%) | 135 (100.0%) |
Physical Housing Characteristics in Cabazon
Housing Structures in Cabazon
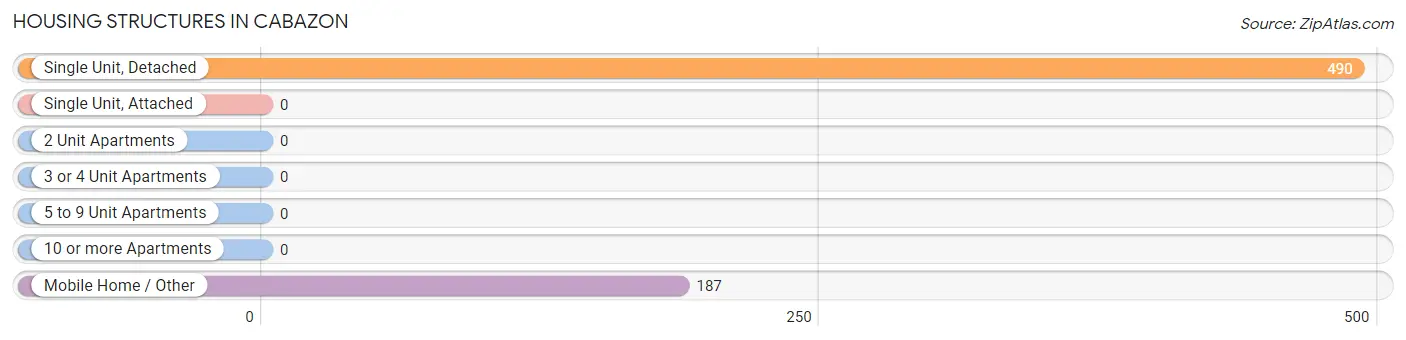
| Structure Type | # Housing Units | % Housing Units |
| Single Unit, Detached | 490 | 72.4% |
| Single Unit, Attached | 0 | 0.0% |
| 2 Unit Apartments | 0 | 0.0% |
| 3 or 4 Unit Apartments | 0 | 0.0% |
| 5 to 9 Unit Apartments | 0 | 0.0% |
| 10 or more Apartments | 0 | 0.0% |
| Mobile Home / Other | 187 | 27.6% |
| Total | 677 | 100.0% |
Housing Structures by Occupancy in Cabazon
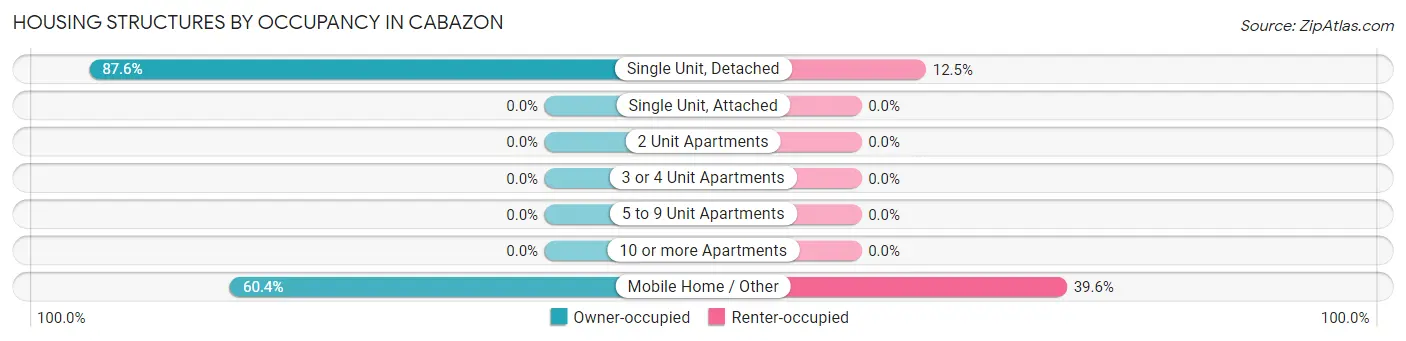
| Structure Type | Owner-occupied | Renter-occupied |
| Single Unit, Detached | 429 (87.5%) | 61 (12.4%) |
| Single Unit, Attached | 0 (0.0%) | 0 (0.0%) |
| 2 Unit Apartments | 0 (0.0%) | 0 (0.0%) |
| 3 or 4 Unit Apartments | 0 (0.0%) | 0 (0.0%) |
| 5 to 9 Unit Apartments | 0 (0.0%) | 0 (0.0%) |
| 10 or more Apartments | 0 (0.0%) | 0 (0.0%) |
| Mobile Home / Other | 113 (60.4%) | 74 (39.6%) |
| Total | 542 (80.1%) | 135 (19.9%) |
Housing Structures by Number of Rooms in Cabazon
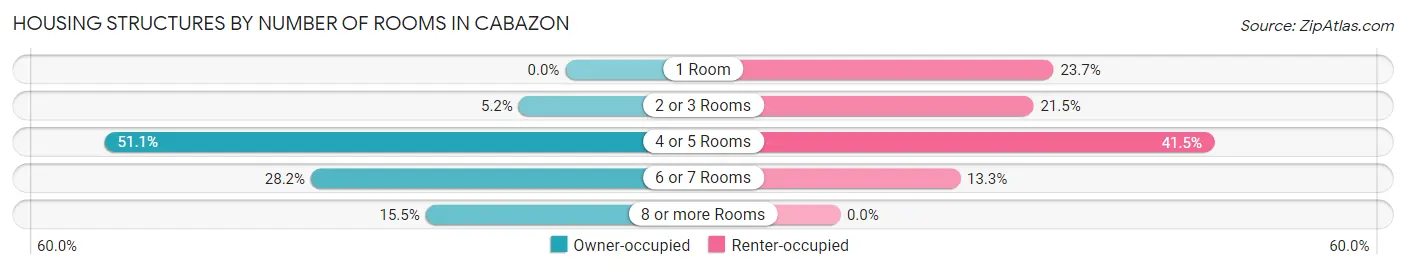
| Number of Rooms | Owner-occupied | Renter-occupied |
| 1 Room | 0 (0.0%) | 32 (23.7%) |
| 2 or 3 Rooms | 28 (5.2%) | 29 (21.5%) |
| 4 or 5 Rooms | 277 (51.1%) | 56 (41.5%) |
| 6 or 7 Rooms | 153 (28.2%) | 18 (13.3%) |
| 8 or more Rooms | 84 (15.5%) | 0 (0.0%) |
| Total | 542 (100.0%) | 135 (100.0%) |
Housing Structure by Heating Type in Cabazon
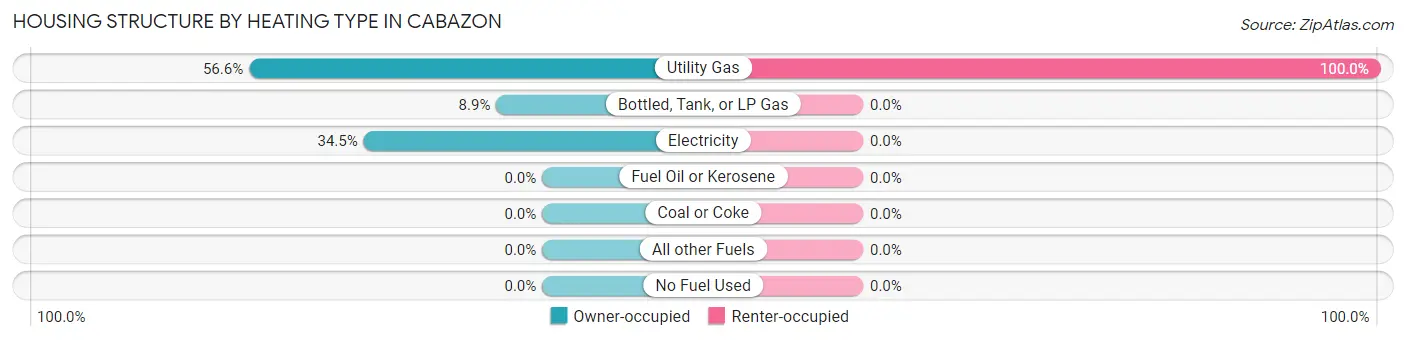
| Heating Type | Owner-occupied | Renter-occupied |
| Utility Gas | 307 (56.6%) | 135 (100.0%) |
| Bottled, Tank, or LP Gas | 48 (8.9%) | 0 (0.0%) |
| Electricity | 187 (34.5%) | 0 (0.0%) |
| Fuel Oil or Kerosene | 0 (0.0%) | 0 (0.0%) |
| Coal or Coke | 0 (0.0%) | 0 (0.0%) |
| All other Fuels | 0 (0.0%) | 0 (0.0%) |
| No Fuel Used | 0 (0.0%) | 0 (0.0%) |
| Total | 542 (100.0%) | 135 (100.0%) |
Household Vehicle Usage in Cabazon
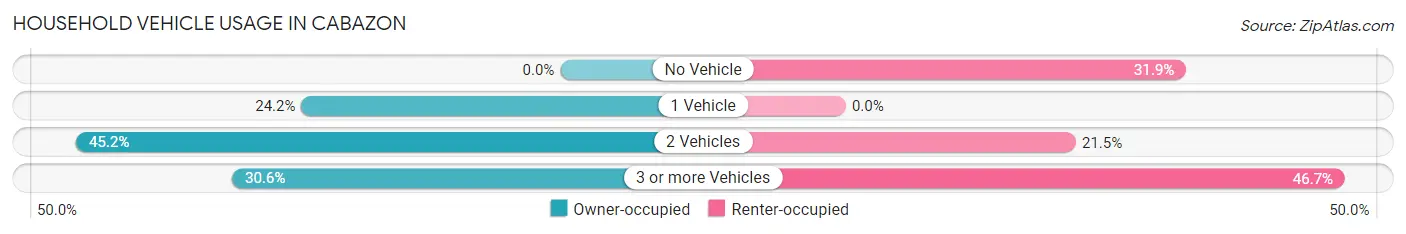
| Vehicles per Household | Owner-occupied | Renter-occupied |
| No Vehicle | 0 (0.0%) | 43 (31.9%) |
| 1 Vehicle | 131 (24.2%) | 0 (0.0%) |
| 2 Vehicles | 245 (45.2%) | 29 (21.5%) |
| 3 or more Vehicles | 166 (30.6%) | 63 (46.7%) |
| Total | 542 (100.0%) | 135 (100.0%) |
Real Estate & Mortgages in Cabazon
Real Estate and Mortgage Overview in Cabazon
| Characteristic | Without Mortgage | With Mortgage |
| Housing Units | 251 | 291 |
| Median Property Value | $161,000 | $257,600 |
| Median Household Income | $67,326 | $47 |
| Monthly Housing Costs | $387 | $0 |
| Real Estate Taxes | $1,247 | $0 |
Property Value by Mortgage Status in Cabazon
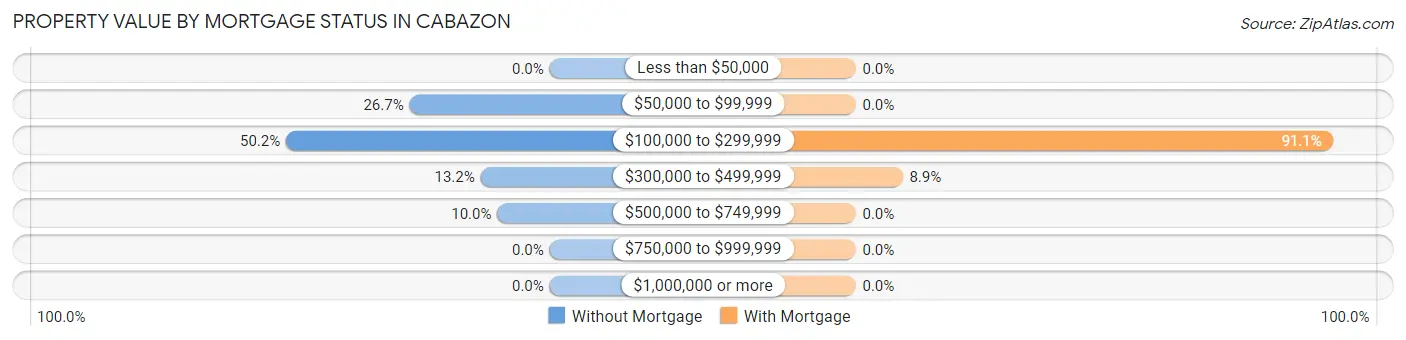
| Property Value | Without Mortgage | With Mortgage |
| Less than $50,000 | 0 (0.0%) | 0 (0.0%) |
| $50,000 to $99,999 | 67 (26.7%) | 0 (0.0%) |
| $100,000 to $299,999 | 126 (50.2%) | 265 (91.1%) |
| $300,000 to $499,999 | 33 (13.2%) | 26 (8.9%) |
| $500,000 to $749,999 | 25 (10.0%) | 0 (0.0%) |
| $750,000 to $999,999 | 0 (0.0%) | 0 (0.0%) |
| $1,000,000 or more | 0 (0.0%) | 0 (0.0%) |
| Total | 251 (100.0%) | 291 (100.0%) |
Household Income by Mortgage Status in Cabazon
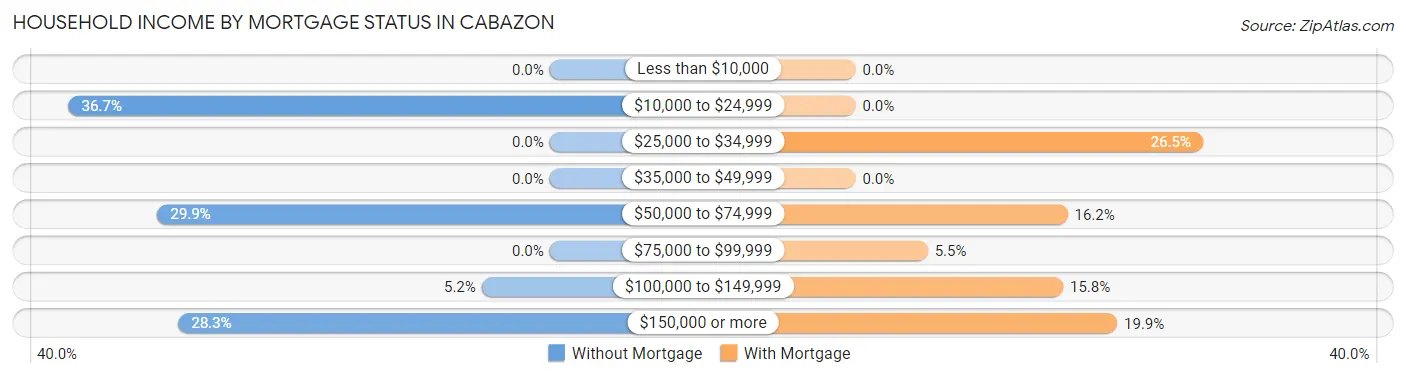
| Household Income | Without Mortgage | With Mortgage |
| Less than $10,000 | 0 (0.0%) | 0 (0.0%) |
| $10,000 to $24,999 | 92 (36.6%) | 0 (0.0%) |
| $25,000 to $34,999 | 0 (0.0%) | 77 (26.5%) |
| $35,000 to $49,999 | 0 (0.0%) | 0 (0.0%) |
| $50,000 to $74,999 | 75 (29.9%) | 47 (16.2%) |
| $75,000 to $99,999 | 0 (0.0%) | 16 (5.5%) |
| $100,000 to $149,999 | 13 (5.2%) | 46 (15.8%) |
| $150,000 or more | 71 (28.3%) | 58 (19.9%) |
| Total | 251 (100.0%) | 291 (100.0%) |
Property Value to Household Income Ratio in Cabazon
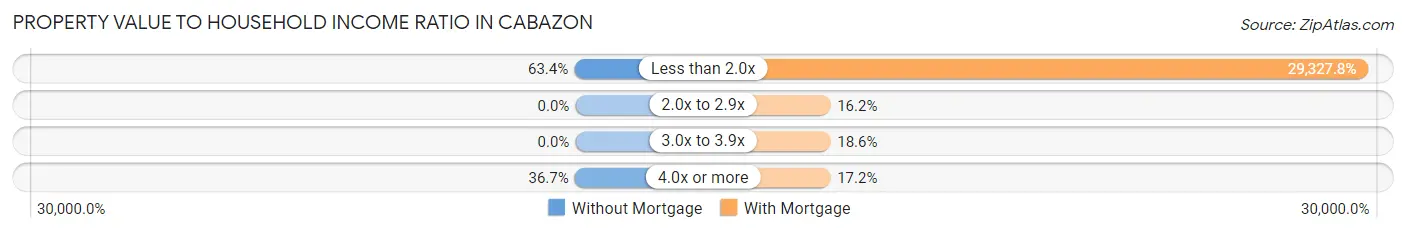
| Value-to-Income Ratio | Without Mortgage | With Mortgage |
| Less than 2.0x | 159 (63.3%) | 85,344 (29,327.8%) |
| 2.0x to 2.9x | 0 (0.0%) | 47 (16.2%) |
| 3.0x to 3.9x | 0 (0.0%) | 54 (18.6%) |
| 4.0x or more | 92 (36.6%) | 50 (17.2%) |
| Total | 251 (100.0%) | 291 (100.0%) |
Real Estate Taxes by Mortgage Status in Cabazon
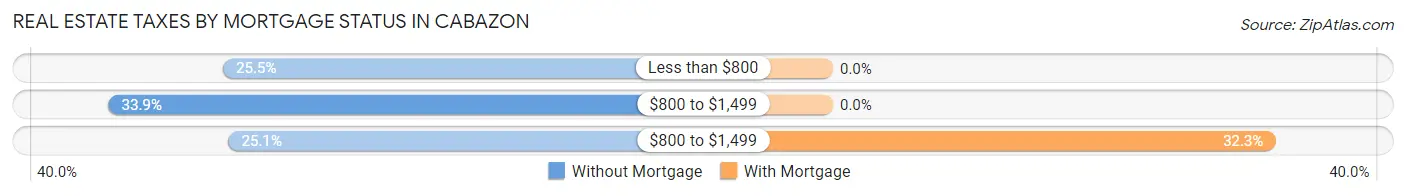
| Property Taxes | Without Mortgage | With Mortgage |
| Less than $800 | 64 (25.5%) | 0 (0.0%) |
| $800 to $1,499 | 85 (33.9%) | 0 (0.0%) |
| $800 to $1,499 | 63 (25.1%) | 94 (32.3%) |
| Total | 251 (100.0%) | 291 (100.0%) |
Health & Disability in Cabazon
Health Insurance Coverage by Age in Cabazon
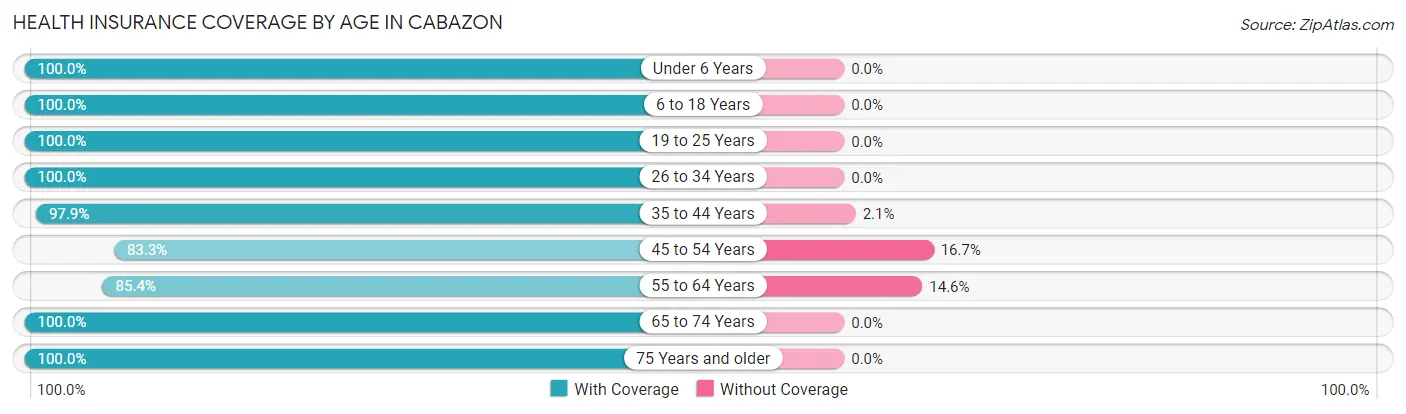
| Age Bracket | With Coverage | Without Coverage |
| Under 6 Years | 178 (100.0%) | 0 (0.0%) |
| 6 to 18 Years | 163 (100.0%) | 0 (0.0%) |
| 19 to 25 Years | 117 (100.0%) | 0 (0.0%) |
| 26 to 34 Years | 447 (100.0%) | 0 (0.0%) |
| 35 to 44 Years | 138 (97.9%) | 3 (2.1%) |
| 45 to 54 Years | 165 (83.3%) | 33 (16.7%) |
| 55 to 64 Years | 223 (85.4%) | 38 (14.6%) |
| 65 to 74 Years | 347 (100.0%) | 0 (0.0%) |
| 75 Years and older | 92 (100.0%) | 0 (0.0%) |
| Total | 1,870 (96.2%) | 74 (3.8%) |
Health Insurance Coverage by Citizenship Status in Cabazon
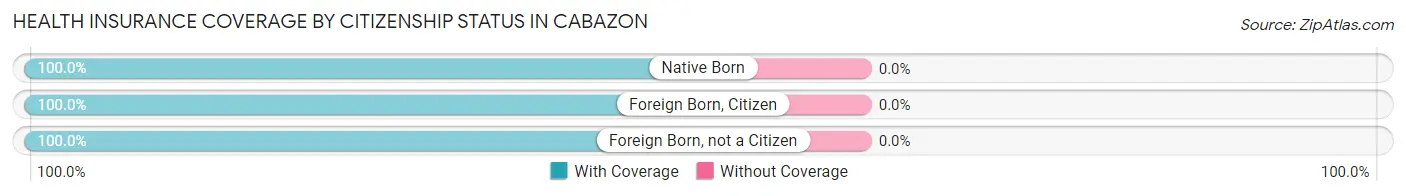
| Citizenship Status | With Coverage | Without Coverage |
| Native Born | 178 (100.0%) | 0 (0.0%) |
| Foreign Born, Citizen | 163 (100.0%) | 0 (0.0%) |
| Foreign Born, not a Citizen | 117 (100.0%) | 0 (0.0%) |
Health Insurance Coverage by Household Income in Cabazon
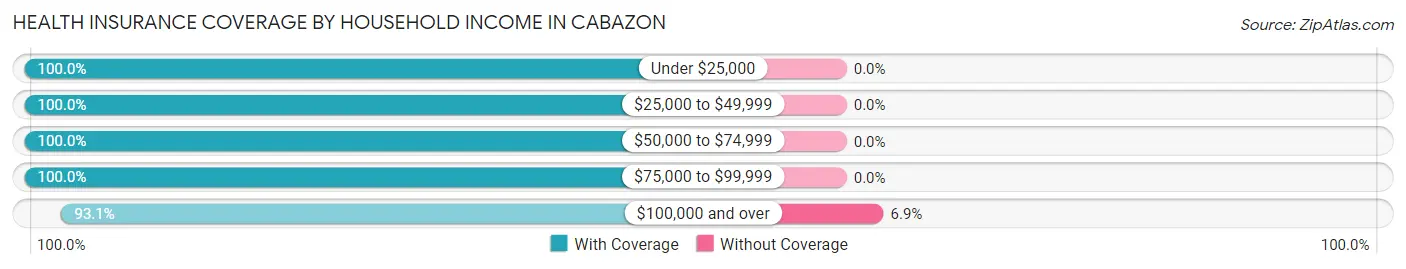
| Household Income | With Coverage | Without Coverage |
| Under $25,000 | 276 (100.0%) | 0 (0.0%) |
| $25,000 to $49,999 | 250 (100.0%) | 0 (0.0%) |
| $50,000 to $74,999 | 209 (100.0%) | 0 (0.0%) |
| $75,000 to $99,999 | 163 (100.0%) | 0 (0.0%) |
| $100,000 and over | 958 (93.1%) | 71 (6.9%) |
Public vs Private Health Insurance Coverage by Age in Cabazon
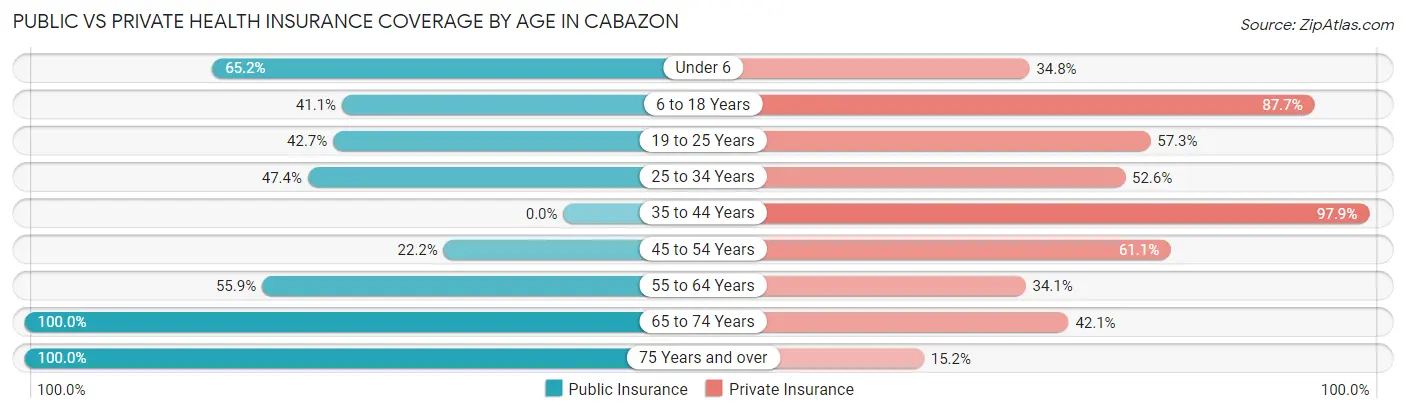
| Age Bracket | Public Insurance | Private Insurance |
| Under 6 | 116 (65.2%) | 62 (34.8%) |
| 6 to 18 Years | 67 (41.1%) | 143 (87.7%) |
| 19 to 25 Years | 50 (42.7%) | 67 (57.3%) |
| 25 to 34 Years | 212 (47.4%) | 235 (52.6%) |
| 35 to 44 Years | 0 (0.0%) | 138 (97.9%) |
| 45 to 54 Years | 44 (22.2%) | 121 (61.1%) |
| 55 to 64 Years | 146 (55.9%) | 89 (34.1%) |
| 65 to 74 Years | 347 (100.0%) | 146 (42.1%) |
| 75 Years and over | 92 (100.0%) | 14 (15.2%) |
| Total | 1,074 (55.2%) | 1,015 (52.2%) |
Disability Status by Sex by Age in Cabazon
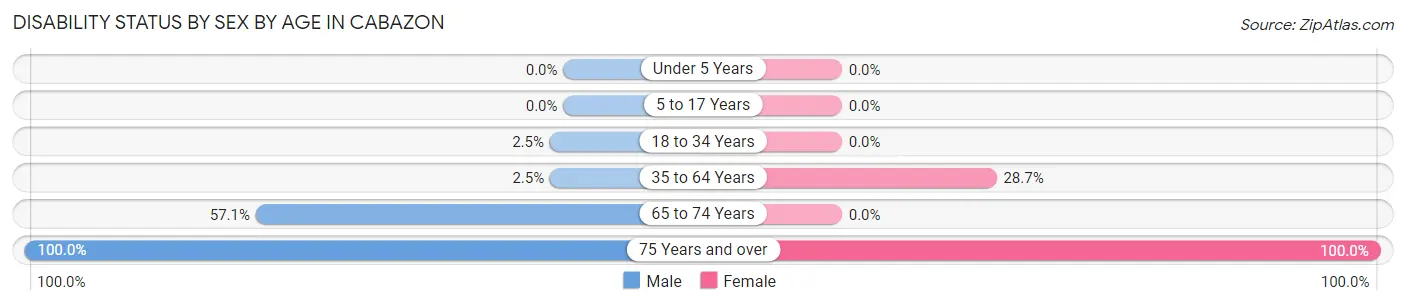
| Age Bracket | Male | Female |
| Under 5 Years | 0 (0.0%) | 0 (0.0%) |
| 5 to 17 Years | 0 (0.0%) | 0 (0.0%) |
| 18 to 34 Years | 6 (2.5%) | 0 (0.0%) |
| 35 to 64 Years | 7 (2.5%) | 91 (28.7%) |
| 65 to 74 Years | 157 (57.1%) | 0 (0.0%) |
| 75 Years and over | 53 (100.0%) | 39 (100.0%) |
Disability Class by Sex by Age in Cabazon
Disability Class: Hearing Difficulty
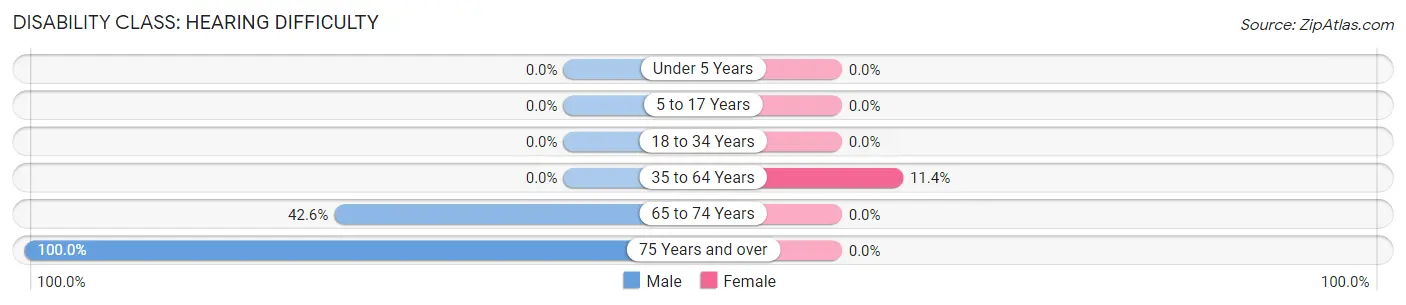
| Age Bracket | Male | Female |
| Under 5 Years | 0 (0.0%) | 0 (0.0%) |
| 5 to 17 Years | 0 (0.0%) | 0 (0.0%) |
| 18 to 34 Years | 0 (0.0%) | 0 (0.0%) |
| 35 to 64 Years | 0 (0.0%) | 36 (11.4%) |
| 65 to 74 Years | 117 (42.5%) | 0 (0.0%) |
| 75 Years and over | 53 (100.0%) | 0 (0.0%) |
Disability Class: Vision Difficulty
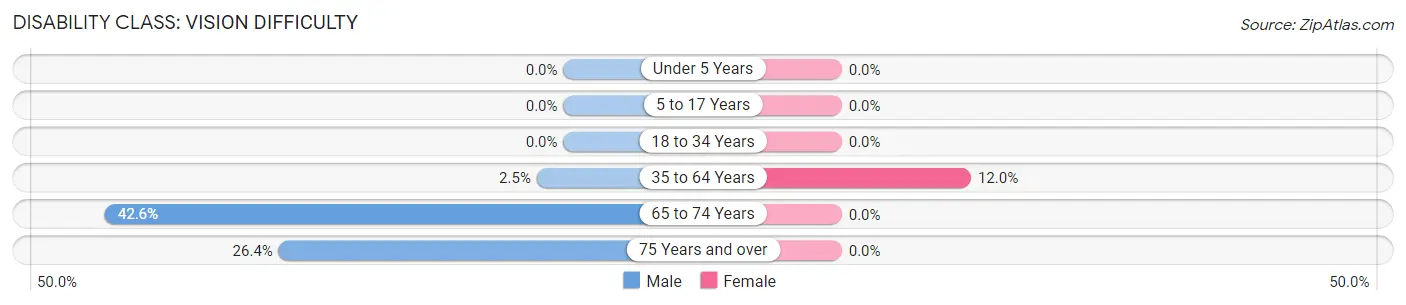
| Age Bracket | Male | Female |
| Under 5 Years | 0 (0.0%) | 0 (0.0%) |
| 5 to 17 Years | 0 (0.0%) | 0 (0.0%) |
| 18 to 34 Years | 0 (0.0%) | 0 (0.0%) |
| 35 to 64 Years | 7 (2.5%) | 38 (12.0%) |
| 65 to 74 Years | 117 (42.5%) | 0 (0.0%) |
| 75 Years and over | 14 (26.4%) | 0 (0.0%) |
Disability Class: Cognitive Difficulty
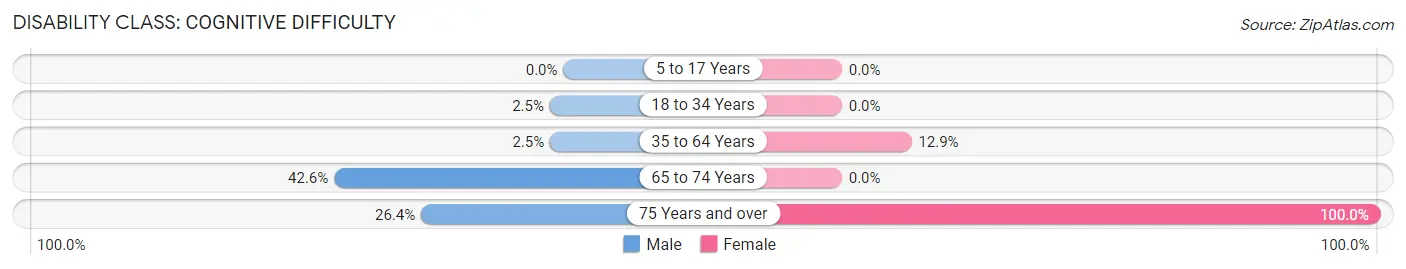
| Age Bracket | Male | Female |
| 5 to 17 Years | 0 (0.0%) | 0 (0.0%) |
| 18 to 34 Years | 6 (2.5%) | 0 (0.0%) |
| 35 to 64 Years | 7 (2.5%) | 41 (12.9%) |
| 65 to 74 Years | 117 (42.5%) | 0 (0.0%) |
| 75 Years and over | 14 (26.4%) | 39 (100.0%) |
Disability Class: Ambulatory Difficulty
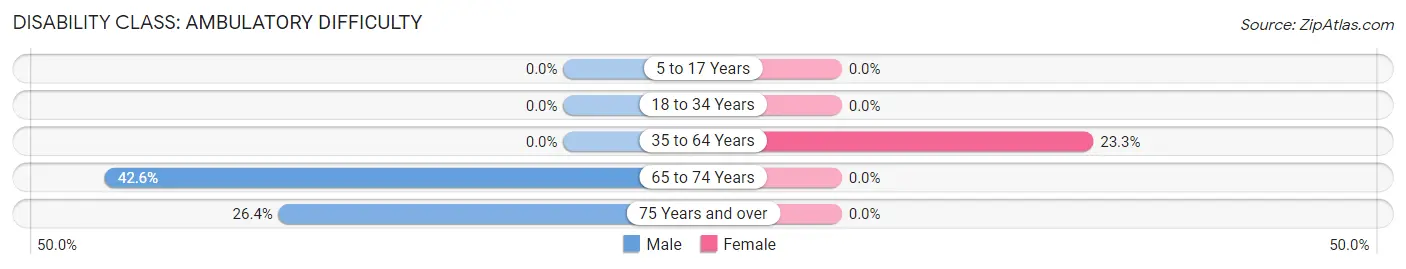
| Age Bracket | Male | Female |
| 5 to 17 Years | 0 (0.0%) | 0 (0.0%) |
| 18 to 34 Years | 0 (0.0%) | 0 (0.0%) |
| 35 to 64 Years | 0 (0.0%) | 74 (23.3%) |
| 65 to 74 Years | 117 (42.5%) | 0 (0.0%) |
| 75 Years and over | 14 (26.4%) | 0 (0.0%) |
Disability Class: Self-Care Difficulty
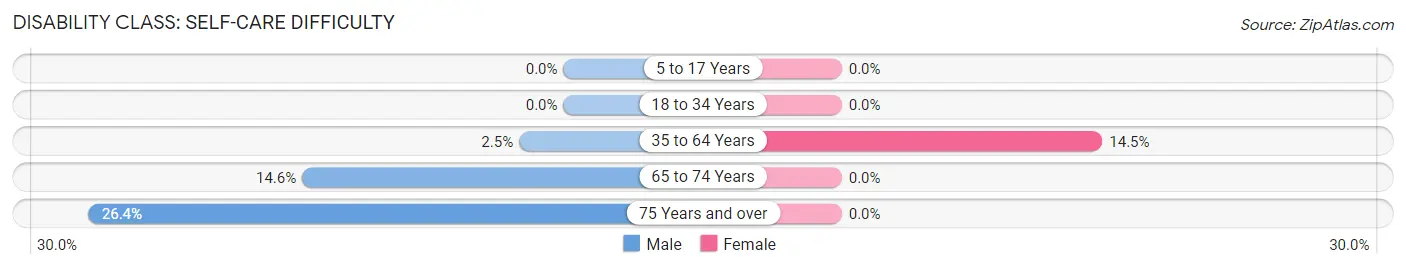
| Age Bracket | Male | Female |
| 5 to 17 Years | 0 (0.0%) | 0 (0.0%) |
| 18 to 34 Years | 0 (0.0%) | 0 (0.0%) |
| 35 to 64 Years | 7 (2.5%) | 46 (14.5%) |
| 65 to 74 Years | 40 (14.5%) | 0 (0.0%) |
| 75 Years and over | 14 (26.4%) | 0 (0.0%) |
Technology Access in Cabazon
Computing Device Access in Cabazon
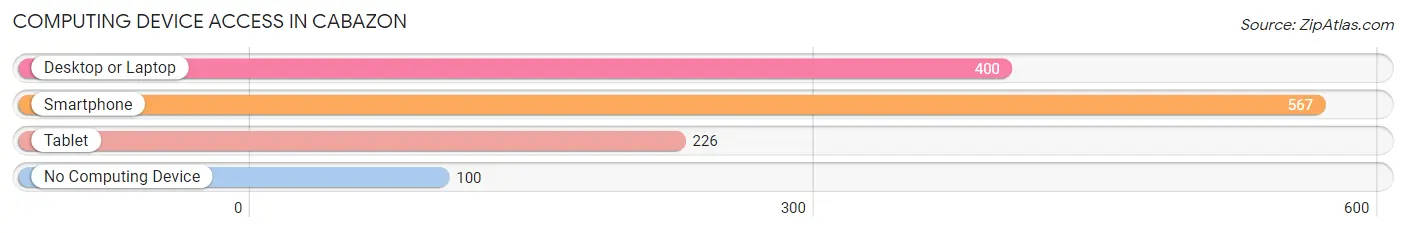
| Device Type | # Households | % Households |
| Desktop or Laptop | 400 | 59.1% |
| Smartphone | 567 | 83.8% |
| Tablet | 226 | 33.4% |
| No Computing Device | 100 | 14.8% |
| Total | 677 | 100.0% |
Internet Access in Cabazon
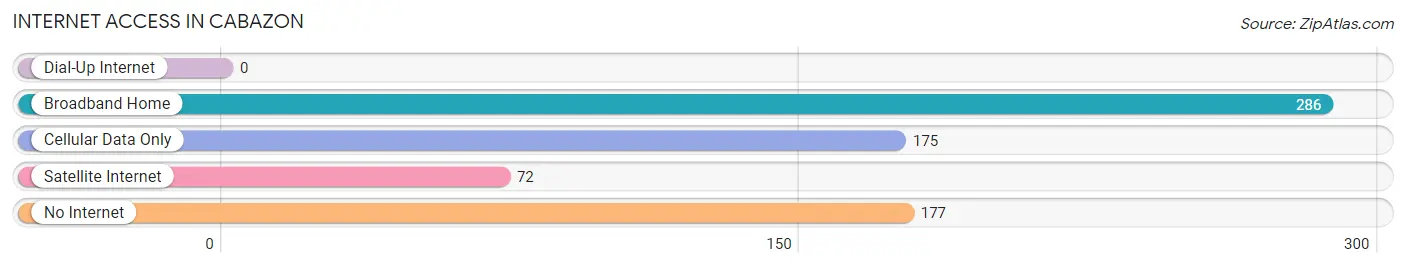
| Internet Type | # Households | % Households |
| Dial-Up Internet | 0 | 0.0% |
| Broadband Home | 286 | 42.2% |
| Cellular Data Only | 175 | 25.9% |
| Satellite Internet | 72 | 10.6% |
| No Internet | 177 | 26.1% |
| Total | 677 | 100.0% |
Cabazon Summary
Cabazon is a small unincorporated community located in Riverside County, California. It is situated in the San Gorgonio Pass, between the San Bernardino Mountains and the San Jacinto Mountains. The population of Cabazon was 2,535 at the 2010 census.
History
The area now known as Cabazon was originally inhabited by the Cahuilla Indians. The first Europeans to settle in the area were the Spanish, who established a mission in the area in 1819. The area was later taken over by the Mexican government, and in 1848, the area became part of the United States after the Mexican-American War.
In the late 19th century, the area was settled by homesteaders, and the town of Cabazon was established in 1884. The town was named after the Cabazon Band of Mission Indians, who had a reservation in the area. The town grew slowly, and by the early 20th century, it had become a popular tourist destination due to its proximity to the San Gorgonio Pass.
In the 1950s, the area began to experience rapid growth due to the construction of the nearby San Gorgonio Pass Freeway. This led to the development of several new businesses in the area, including a casino and a shopping center.
Geography
Cabazon is located in the San Gorgonio Pass, between the San Bernardino Mountains and the San Jacinto Mountains. The town is situated at an elevation of 1,890 feet (576 m). The climate in the area is semi-arid, with hot summers and mild winters.
The town is located near the San Gorgonio Pass Freeway, which connects it to the cities of Banning and Palm Springs. The nearest major airport is Palm Springs International Airport, which is located about 25 miles (40 km) away.
Economy
The economy of Cabazon is largely based on tourism. The town is home to several tourist attractions, including the Cabazon Outlets, a large shopping center, and the Morongo Casino, Resort & Spa, a large casino and resort. The town is also home to several manufacturing companies, including a plastics factory and a furniture factory.
Demographics
As of the 2010 census, the population of Cabazon was 2,535. The racial makeup of the town was 57.3% White, 0.7% African American, 0.7% Native American, 0.7% Asian, 0.1% Pacific Islander, and 37.7% from other races. Hispanic or Latino of any race were 64.2% of the population.
The median household income in Cabazon was $35,938, and the median family income was $41,250. The per capita income in the town was $17,845. About 17.2% of the population was below the poverty line.
Common Questions
What is Per Capita Income in Cabazon?
Per Capita income in Cabazon is $33,024.
What is the Median Family Income in Cabazon?
Median Family Income in Cabazon is $66,597.
What is the Median Household income in Cabazon?
Median Household Income in Cabazon is $72,266.
What is Income or Wage Gap in Cabazon?
Income or Wage Gap in Cabazon is 22.9%.
Women in Cabazon earn 77.1 cents for every dollar earned by a man.
What is Inequality or Gini Index in Cabazon?
Inequality or Gini Index in Cabazon is 0.48.
What is the Total Population of Cabazon?
Total Population of Cabazon is 1,946.
What is the Total Male Population of Cabazon?
Total Male Population of Cabazon is 1,017.
What is the Total Female Population of Cabazon?
Total Female Population of Cabazon is 929.
What is the Ratio of Males per 100 Females in Cabazon?
There are 109.47 Males per 100 Females in Cabazon.
What is the Ratio of Females per 100 Males in Cabazon?
There are 91.35 Females per 100 Males in Cabazon.
What is the Median Population Age in Cabazon?
Median Population Age in Cabazon is 38.3 Years.
What is the Average Family Size in Cabazon
Average Family Size in Cabazon is 3.8 People.
What is the Average Household Size in Cabazon
Average Household Size in Cabazon is 2.9 People.
How Large is the Labor Force in Cabazon?
There are 1,039 People in the Labor Forcein in Cabazon.
What is the Percentage of People in the Labor Force in Cabazon?
64.4% of People are in the Labor Force in Cabazon.