Byron, CA Map & Demographics
Byron Map
Byron Overview
$30,529
PER CAPITA INCOME
$88,281
AVG FAMILY INCOME
$79,196
AVG HOUSEHOLD INCOME
50.7%
WAGE / INCOME GAP [ % ]
49.3¢/ $1
WAGE / INCOME GAP [ $ ]
0.38
INEQUALITY / GINI INDEX
1,918
TOTAL POPULATION
888
MALE POPULATION
1,030
FEMALE POPULATION
86.21
MALES / 100 FEMALES
115.99
FEMALES / 100 MALES
43.7
MEDIAN AGE
3.7
AVG FAMILY SIZE
3.5
AVG HOUSEHOLD SIZE
796
LABOR FORCE [ PEOPLE ]
48.8%
PERCENT IN LABOR FORCE
8.5%
UNEMPLOYMENT RATE
Byron Zip Codes
Byron Area Codes
Income in Byron
Income Overview in Byron
Per Capita Income in Byron is $30,529, while median incomes of families and households are $88,281 and $79,196 respectively.
| Characteristic | Number | Measure |
| Per Capita Income | 1,918 | $30,529 |
| Median Family Income | 435 | $88,281 |
| Mean Family Income | 435 | $107,981 |
| Median Household Income | 549 | $79,196 |
| Mean Household Income | 549 | $104,583 |
| Income Deficit | 435 | $0 |
| Wage / Income Gap (%) | 1,918 | 50.66% |
| Wage / Income Gap ($) | 1,918 | 49.34¢ per $1 |
| Gini / Inequality Index | 1,918 | 0.38 |
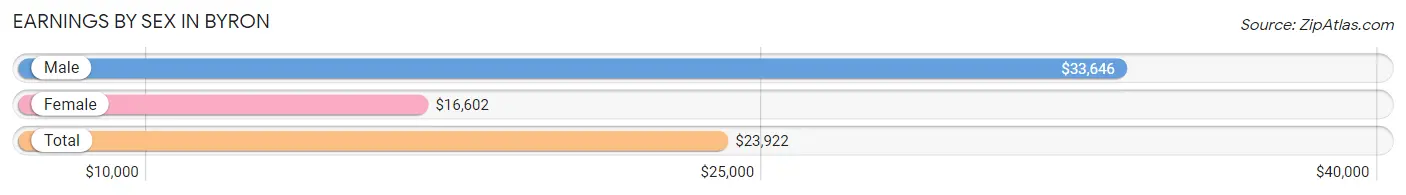
Earnings by Sex in Byron
Average Earnings in Byron are $23,922, $33,646 for men and $16,602 for women, a difference of 50.7%.
| Sex | Number | Average Earnings |
| Male | 398 (47.7%) | $33,646 |
| Female | 437 (52.3%) | $16,602 |
| Total | 835 (100.0%) | $23,922 |
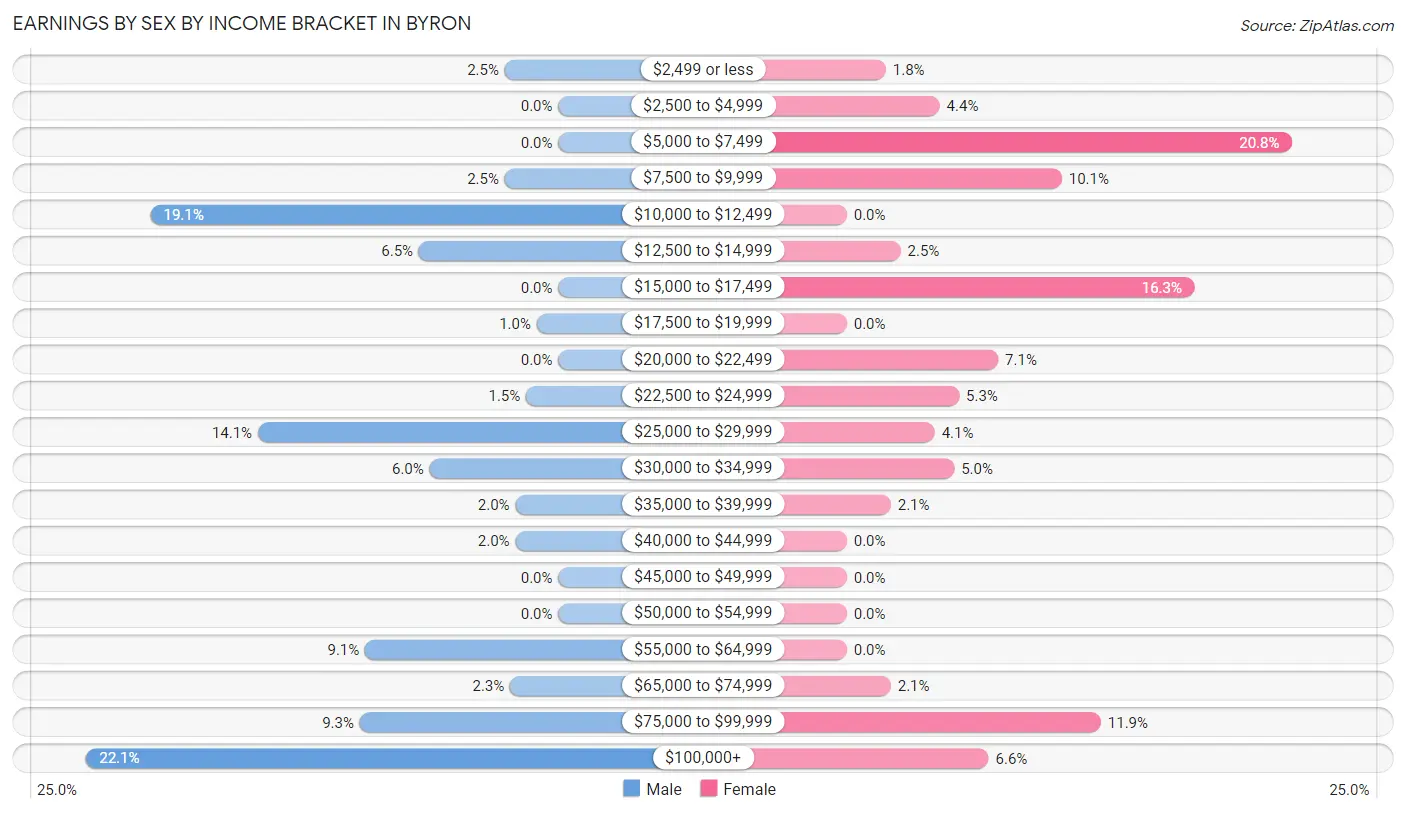
Earnings by Sex by Income Bracket in Byron
The most common earnings brackets in Byron are $100,000+ for men (88 | 22.1%) and $5,000 to $7,499 for women (91 | 20.8%).
| Income | Male | Female |
| $2,499 or less | 10 (2.5%) | 8 (1.8%) |
| $2,500 to $4,999 | 0 (0.0%) | 19 (4.3%) |
| $5,000 to $7,499 | 0 (0.0%) | 91 (20.8%) |
| $7,500 to $9,999 | 10 (2.5%) | 44 (10.1%) |
| $10,000 to $12,499 | 76 (19.1%) | 0 (0.0%) |
| $12,500 to $14,999 | 26 (6.5%) | 11 (2.5%) |
| $15,000 to $17,499 | 0 (0.0%) | 71 (16.3%) |
| $17,500 to $19,999 | 4 (1.0%) | 0 (0.0%) |
| $20,000 to $22,499 | 0 (0.0%) | 31 (7.1%) |
| $22,500 to $24,999 | 6 (1.5%) | 23 (5.3%) |
| $25,000 to $29,999 | 56 (14.1%) | 18 (4.1%) |
| $30,000 to $34,999 | 24 (6.0%) | 22 (5.0%) |
| $35,000 to $39,999 | 8 (2.0%) | 9 (2.1%) |
| $40,000 to $44,999 | 8 (2.0%) | 0 (0.0%) |
| $45,000 to $49,999 | 0 (0.0%) | 0 (0.0%) |
| $50,000 to $54,999 | 0 (0.0%) | 0 (0.0%) |
| $55,000 to $64,999 | 36 (9.0%) | 0 (0.0%) |
| $65,000 to $74,999 | 9 (2.3%) | 9 (2.1%) |
| $75,000 to $99,999 | 37 (9.3%) | 52 (11.9%) |
| $100,000+ | 88 (22.1%) | 29 (6.6%) |
| Total | 398 (100.0%) | 437 (100.0%) |
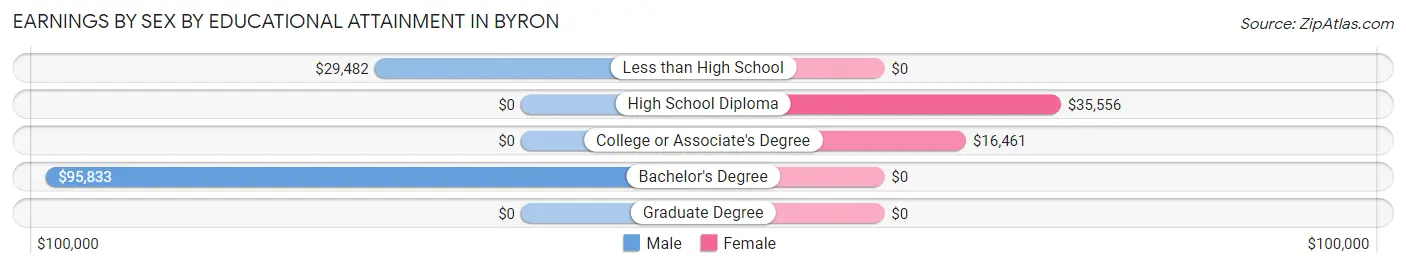
Earnings by Sex by Educational Attainment in Byron
| Educational Attainment | Male Income | Female Income |
| Less than High School | $29,482 | $0 |
| High School Diploma | - | - |
| College or Associate's Degree | - | - |
| Bachelor's Degree | $95,833 | $0 |
| Graduate Degree | - | - |
| Total | - | - |
Family Income in Byron
Family Income Brackets in Byron
According to the Byron family income data, there are 98 families falling into the $50,000 to $74,999 income range, which is the most common income bracket and makes up 22.5% of all families.
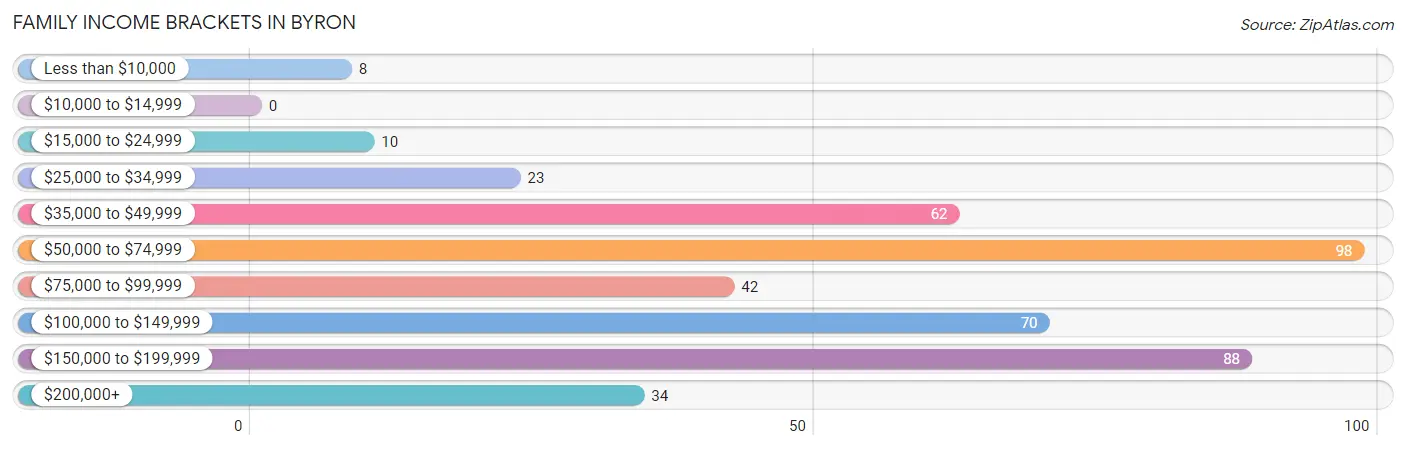
| Income Bracket | # Families | % Families |
| Less than $10,000 | 8 | 1.8% |
| $10,000 to $14,999 | 0 | 0.0% |
| $15,000 to $24,999 | 10 | 2.3% |
| $25,000 to $34,999 | 23 | 5.3% |
| $35,000 to $49,999 | 62 | 14.3% |
| $50,000 to $74,999 | 98 | 22.5% |
| $75,000 to $99,999 | 42 | 9.7% |
| $100,000 to $149,999 | 70 | 16.1% |
| $150,000 to $199,999 | 88 | 20.2% |
| $200,000+ | 34 | 7.8% |
Family Income by Famaliy Size in Byron
6-person families (95 | 21.8%) account for the highest median family income in Byron with $176,593 per family, while 2-person families (225 | 51.7%) have the highest median income of $35,446 per family member.
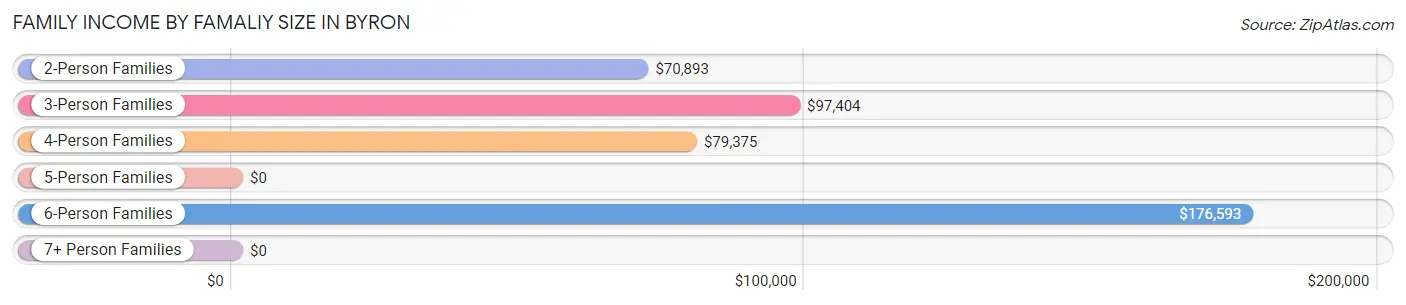
| Income Bracket | # Families | Median Income |
| 2-Person Families | 225 (51.7%) | $70,893 |
| 3-Person Families | 47 (10.8%) | $97,404 |
| 4-Person Families | 33 (7.6%) | $79,375 |
| 5-Person Families | 35 (8.1%) | $0 |
| 6-Person Families | 95 (21.8%) | $176,593 |
| 7+ Person Families | 0 (0.0%) | $0 |
| Total | 435 (100.0%) | $88,281 |
Family Income by Number of Earners in Byron
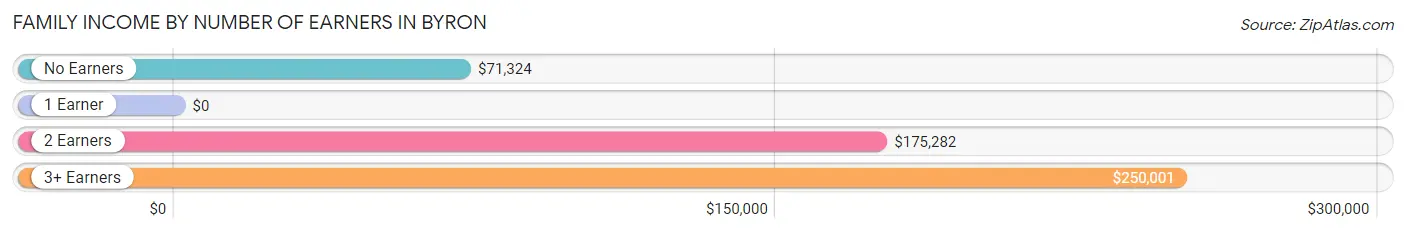
| Number of Earners | # Families | Median Income |
| No Earners | 98 (22.5%) | $71,324 |
| 1 Earner | 150 (34.5%) | $0 |
| 2 Earners | 134 (30.8%) | $175,282 |
| 3+ Earners | 53 (12.2%) | $250,001 |
| Total | 435 (100.0%) | $88,281 |
Household Income in Byron
Household Income Brackets in Byron
With 179 households falling in the category, the $50,000 to $74,999 income range is the most frequent in Byron, accounting for 32.6% of all households.
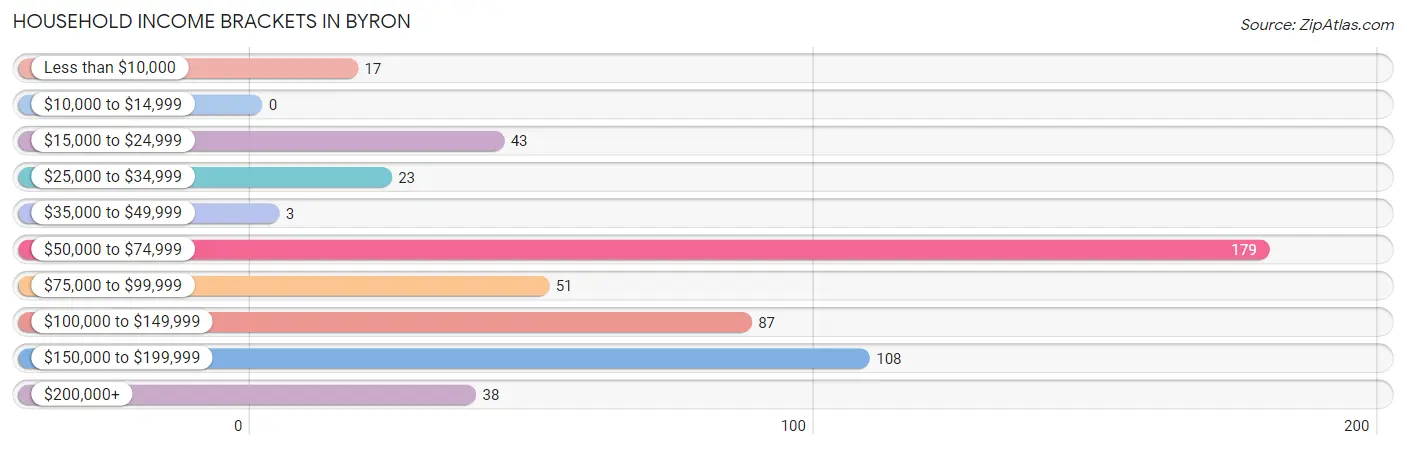
| Income Bracket | # Households | % Households |
| Less than $10,000 | 17 | 3.1% |
| $10,000 to $14,999 | 0 | 0.0% |
| $15,000 to $24,999 | 43 | 7.8% |
| $25,000 to $34,999 | 23 | 4.2% |
| $35,000 to $49,999 | 3 | 0.5% |
| $50,000 to $74,999 | 179 | 32.6% |
| $75,000 to $99,999 | 51 | 9.3% |
| $100,000 to $149,999 | 87 | 15.8% |
| $150,000 to $199,999 | 108 | 19.7% |
| $200,000+ | 38 | 6.9% |
Household Income by Householder Age in Byron
The median household income in Byron is $79,196, with the highest median household income of $71,912 found in the 65+ years age bracket for the primary householder. A total of 230 households (41.9%) fall into this category.
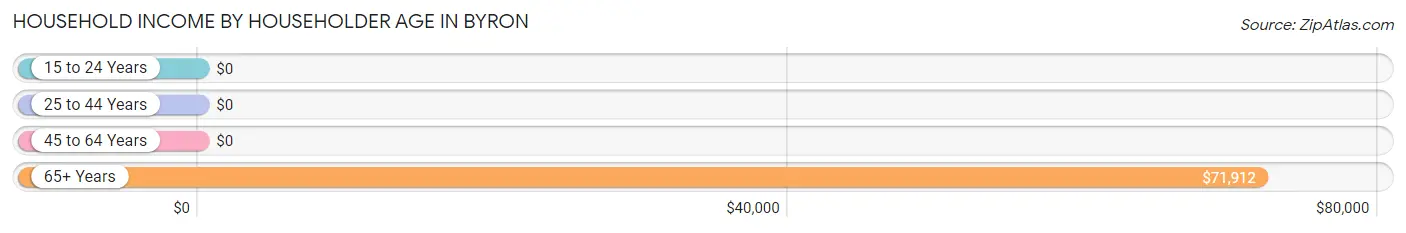
| Income Bracket | # Households | Median Income |
| 15 to 24 Years | 0 (0.0%) | $0 |
| 25 to 44 Years | 51 (9.3%) | $0 |
| 45 to 64 Years | 268 (48.8%) | $0 |
| 65+ Years | 230 (41.9%) | $71,912 |
| Total | 549 (100.0%) | $79,196 |
Poverty in Byron
Income Below Poverty by Sex and Age in Byron
With 5.6% poverty level for males and 16.3% for females among the residents of Byron, 18 to 24 year old males and 35 to 44 year old females are the most vulnerable to poverty, with 10 males (19.2%) and 31 females (79.5%) in their respective age groups living below the poverty level.
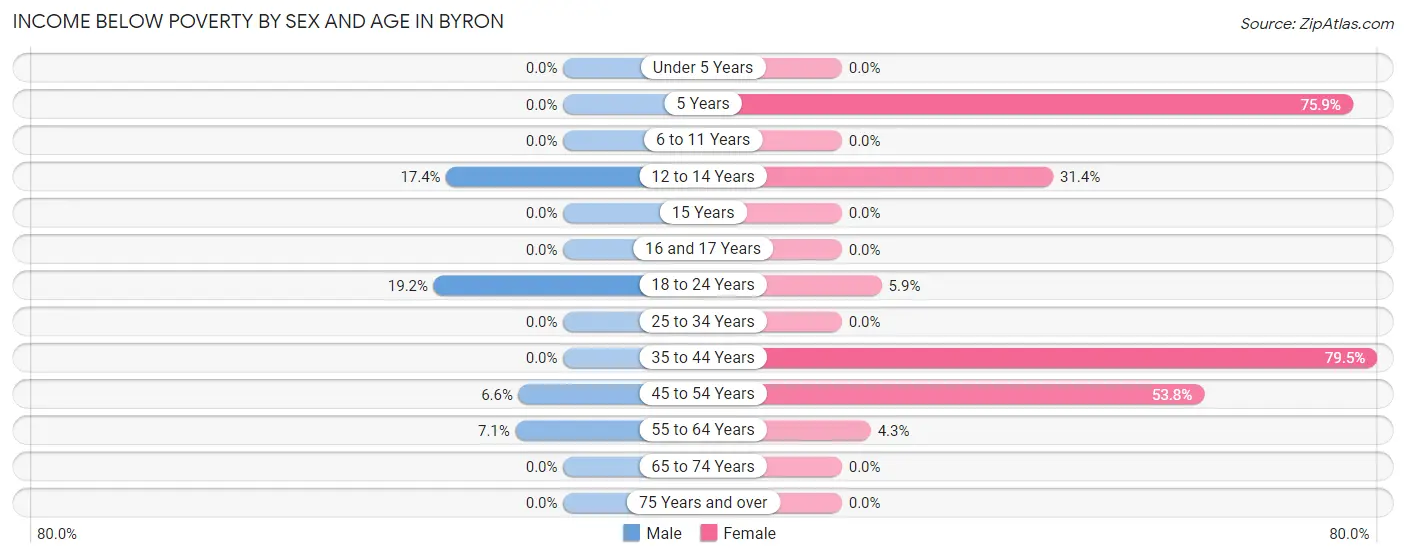
| Age Bracket | Male | Female |
| Under 5 Years | 0 (0.0%) | 0 (0.0%) |
| 5 Years | 0 (0.0%) | 22 (75.9%) |
| 6 to 11 Years | 0 (0.0%) | 0 (0.0%) |
| 12 to 14 Years | 21 (17.4%) | 16 (31.4%) |
| 15 Years | 0 (0.0%) | 0 (0.0%) |
| 16 and 17 Years | 0 (0.0%) | 0 (0.0%) |
| 18 to 24 Years | 10 (19.2%) | 19 (5.9%) |
| 25 to 34 Years | 0 (0.0%) | 0 (0.0%) |
| 35 to 44 Years | 0 (0.0%) | 31 (79.5%) |
| 45 to 54 Years | 9 (6.6%) | 71 (53.8%) |
| 55 to 64 Years | 9 (7.1%) | 9 (4.3%) |
| 65 to 74 Years | 0 (0.0%) | 0 (0.0%) |
| 75 Years and over | 0 (0.0%) | 0 (0.0%) |
| Total | 49 (5.6%) | 168 (16.3%) |
Income Above Poverty by Sex and Age in Byron
According to the poverty statistics in Byron, males aged under 5 years and females aged under 5 years are the age groups that are most secure financially, with 100.0% of males and 100.0% of females in these age groups living above the poverty line.
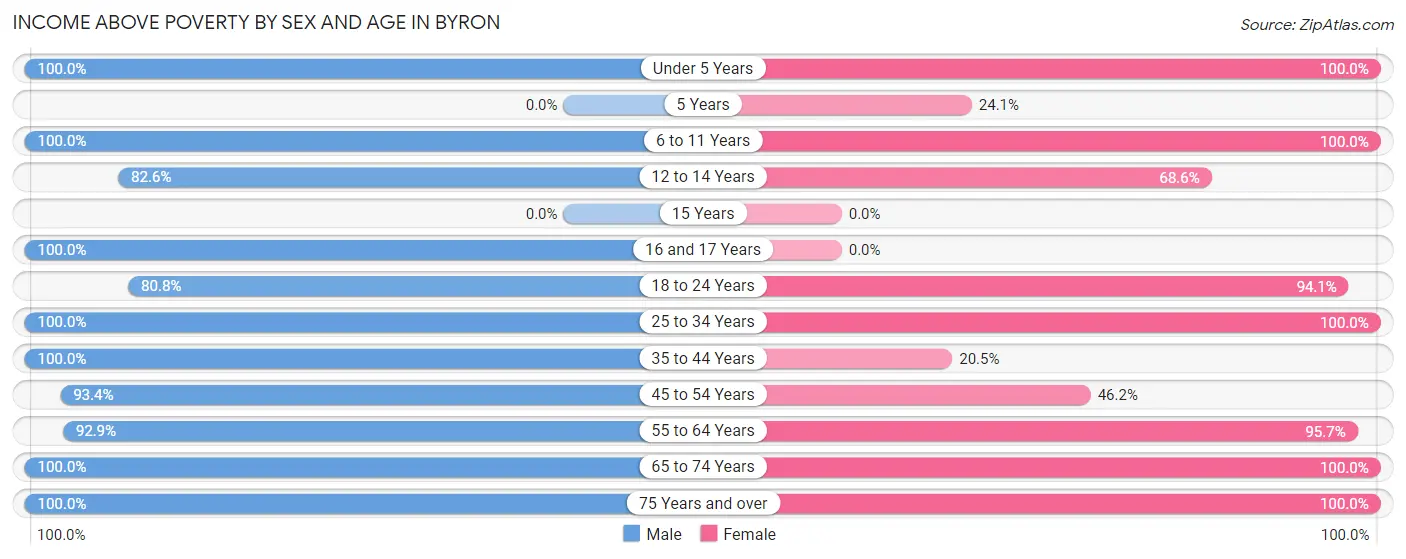
| Age Bracket | Male | Female |
| Under 5 Years | 33 (100.0%) | 7 (100.0%) |
| 5 Years | 0 (0.0%) | 7 (24.1%) |
| 6 to 11 Years | 26 (100.0%) | 16 (100.0%) |
| 12 to 14 Years | 100 (82.6%) | 35 (68.6%) |
| 15 Years | 0 (0.0%) | 0 (0.0%) |
| 16 and 17 Years | 96 (100.0%) | 0 (0.0%) |
| 18 to 24 Years | 42 (80.8%) | 302 (94.1%) |
| 25 to 34 Years | 115 (100.0%) | 41 (100.0%) |
| 35 to 44 Years | 29 (100.0%) | 8 (20.5%) |
| 45 to 54 Years | 127 (93.4%) | 61 (46.2%) |
| 55 to 64 Years | 118 (92.9%) | 201 (95.7%) |
| 65 to 74 Years | 60 (100.0%) | 143 (100.0%) |
| 75 Years and over | 80 (100.0%) | 41 (100.0%) |
| Total | 826 (94.4%) | 862 (83.7%) |
Income Below Poverty Among Married-Couple Families in Byron
The poverty statistics for married-couple families in Byron show that 3.2% or 8 of the total 249 families live below the poverty line. Families with no children have the highest poverty rate of 3.8%, comprising of 8 families. On the other hand, families with 1 or 2 children have the lowest poverty rate of 0.0%, which includes 0 families.
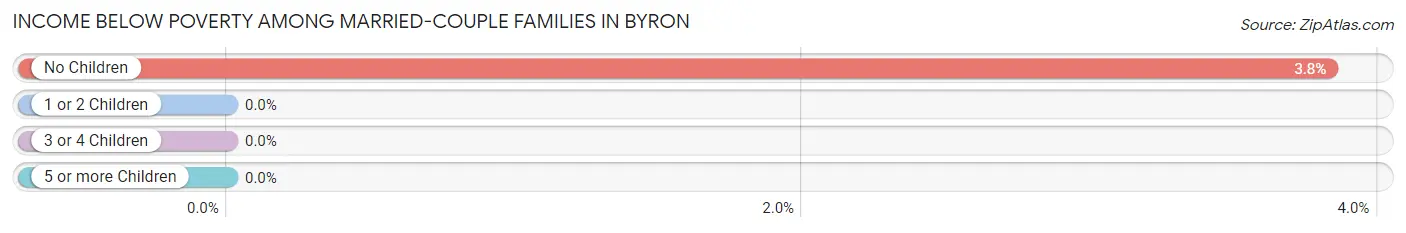
| Children | Above Poverty | Below Poverty |
| No Children | 201 (96.2%) | 8 (3.8%) |
| 1 or 2 Children | 32 (100.0%) | 0 (0.0%) |
| 3 or 4 Children | 8 (100.0%) | 0 (0.0%) |
| 5 or more Children | 0 (0.0%) | 0 (0.0%) |
| Total | 241 (96.8%) | 8 (3.2%) |
Income Below Poverty Among Single-Parent Households in Byron
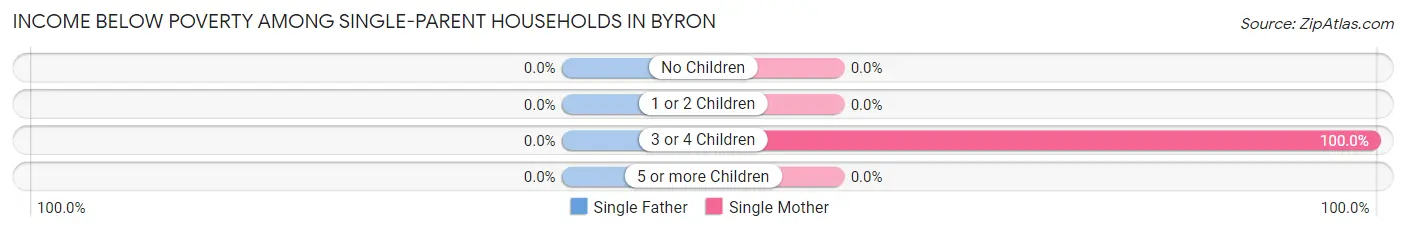
| Children | Single Father | Single Mother |
| No Children | 0 (0.0%) | 0 (0.0%) |
| 1 or 2 Children | 0 (0.0%) | 0 (0.0%) |
| 3 or 4 Children | 0 (0.0%) | 23 (100.0%) |
| 5 or more Children | 0 (0.0%) | 0 (0.0%) |
| Total | 0 (0.0%) | 23 (20.2%) |
Income Below Poverty Among Married-Couple vs Single-Parent Households in Byron
The poverty data for Byron shows that 8 of the married-couple family households (3.2%) and 23 of the single-parent households (12.4%) are living below the poverty level. Within the married-couple family households, those with no children have the highest poverty rate, with 8 households (3.8%) falling below the poverty line. Among the single-parent households, those with 3 or 4 children have the highest poverty rate, with 23 household (100.0%) living below poverty.
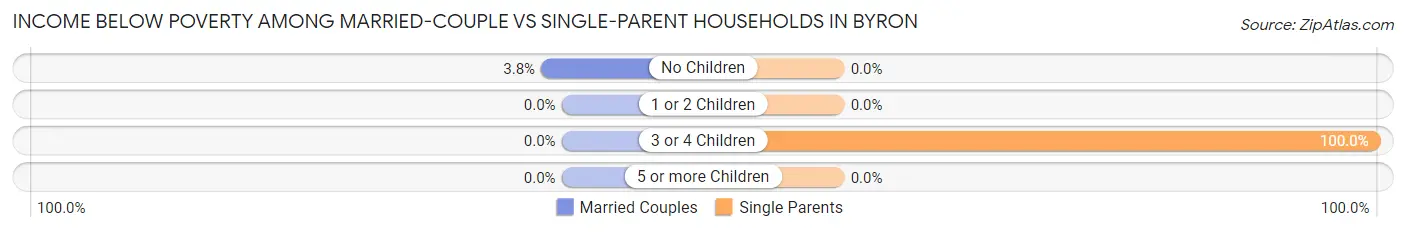
| Children | Married-Couple Families | Single-Parent Households |
| No Children | 8 (3.8%) | 0 (0.0%) |
| 1 or 2 Children | 0 (0.0%) | 0 (0.0%) |
| 3 or 4 Children | 0 (0.0%) | 23 (100.0%) |
| 5 or more Children | 0 (0.0%) | 0 (0.0%) |
| Total | 8 (3.2%) | 23 (12.4%) |
Race in Byron
The most populous races in Byron are White / Caucasian (1,223 | 63.8%), Hispanic or Latino (805 | 42.0%), and Two or more Races (337 | 17.6%).
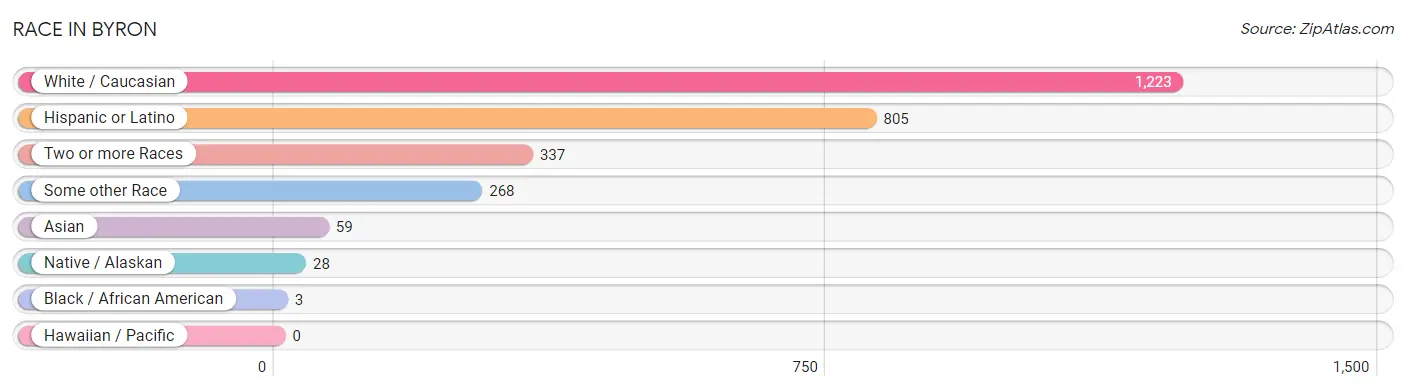
| Race | # Population | % Population |
| Asian | 59 | 3.1% |
| Black / African American | 3 | 0.2% |
| Hawaiian / Pacific | 0 | 0.0% |
| Hispanic or Latino | 805 | 42.0% |
| Native / Alaskan | 28 | 1.5% |
| White / Caucasian | 1,223 | 63.8% |
| Two or more Races | 337 | 17.6% |
| Some other Race | 268 | 14.0% |
| Total | 1,918 | 100.0% |
Ancestry in Byron
The most populous ancestries reported in Byron are Mexican (732 | 38.2%), Irish (296 | 15.4%), German (119 | 6.2%), Korean (68 | 3.5%), and French Canadian (62 | 3.2%), together accounting for 66.6% of all Byron residents.
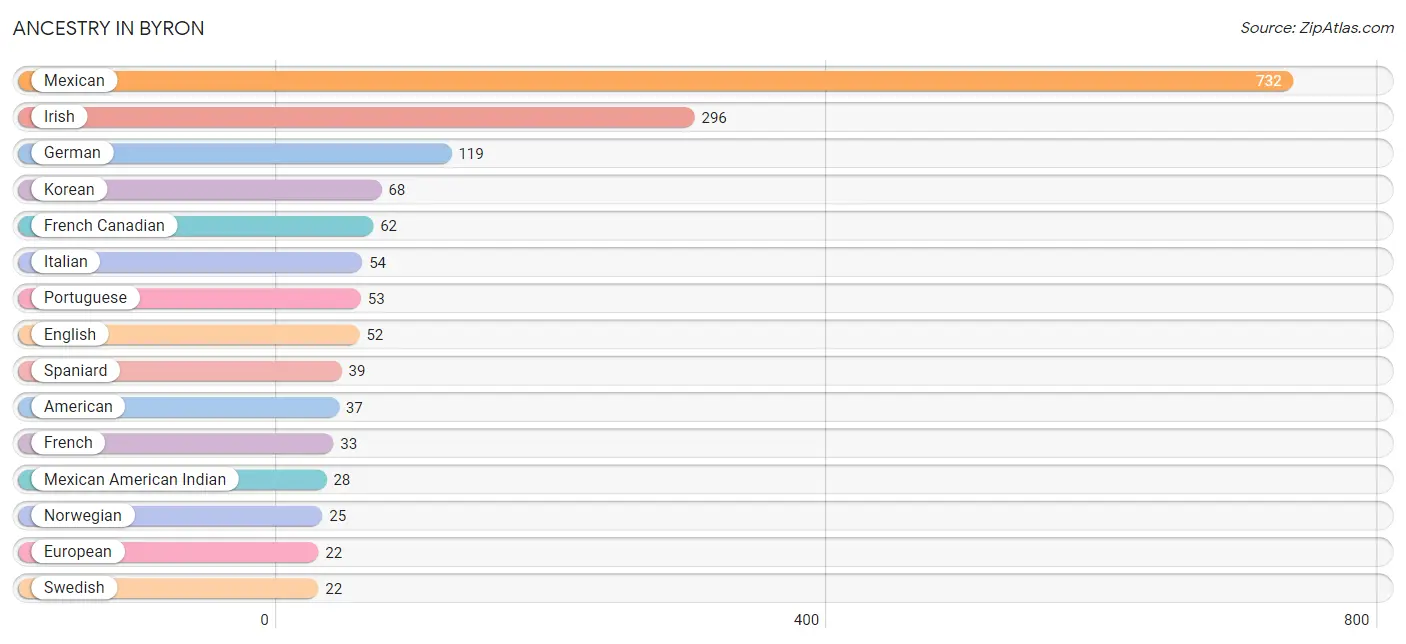
| Ancestry | # Population | % Population |
| African | 1 | 0.1% |
| American | 37 | 1.9% |
| Basque | 19 | 1.0% |
| Cherokee | 19 | 1.0% |
| Eastern European | 8 | 0.4% |
| English | 52 | 2.7% |
| European | 22 | 1.1% |
| French | 33 | 1.7% |
| French Canadian | 62 | 3.2% |
| German | 119 | 6.2% |
| Indian (Asian) | 1 | 0.1% |
| Irish | 296 | 15.4% |
| Italian | 54 | 2.8% |
| Korean | 68 | 3.5% |
| Lithuanian | 4 | 0.2% |
| Mexican | 732 | 38.2% |
| Mexican American Indian | 28 | 1.5% |
| Norwegian | 25 | 1.3% |
| Peruvian | 15 | 0.8% |
| Portuguese | 53 | 2.8% |
| Puerto Rican | 3 | 0.2% |
| South American | 15 | 0.8% |
| Spaniard | 39 | 2.0% |
| Spanish | 8 | 0.4% |
| Subsaharan African | 1 | 0.1% |
| Swedish | 22 | 1.1% | View All 26 Rows |
Immigrants in Byron
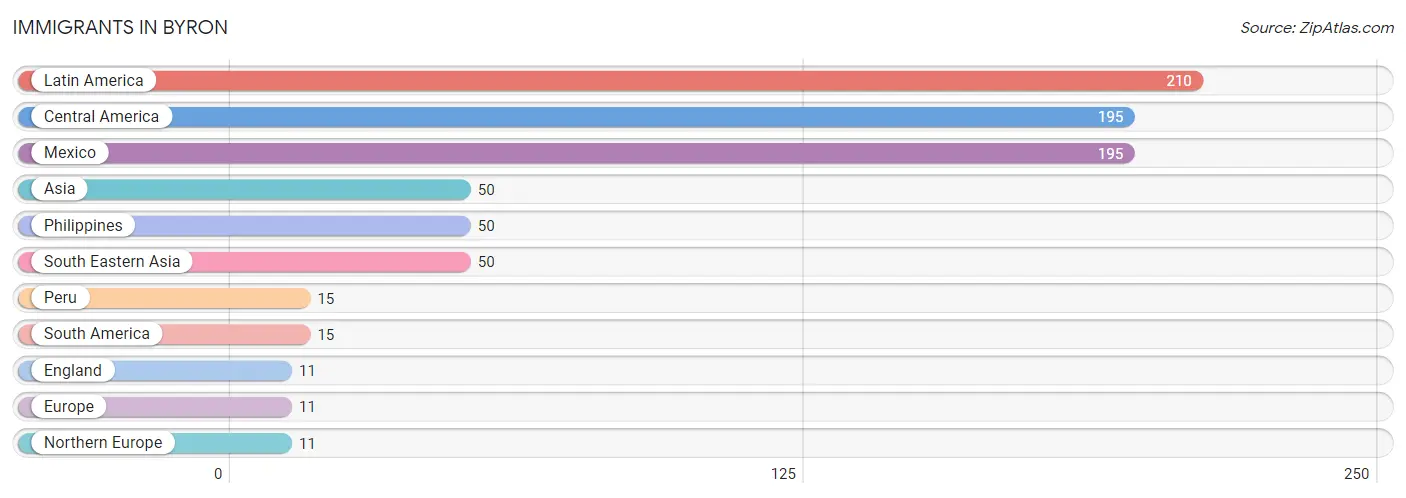
The most numerous immigrant groups reported in Byron came from Latin America (210 | 11.0%), Central America (195 | 10.2%), Mexico (195 | 10.2%), Asia (50 | 2.6%), and Philippines (50 | 2.6%), together accounting for 36.5% of all Byron residents.
| Immigration Origin | # Population | % Population |
| Asia | 50 | 2.6% |
| Central America | 195 | 10.2% |
| England | 11 | 0.6% |
| Europe | 11 | 0.6% |
| Latin America | 210 | 11.0% |
| Mexico | 195 | 10.2% |
| Northern Europe | 11 | 0.6% |
| Peru | 15 | 0.8% |
| Philippines | 50 | 2.6% |
| South America | 15 | 0.8% |
| South Eastern Asia | 50 | 2.6% | View All 11 Rows |
Sex and Age in Byron
Sex and Age in Byron
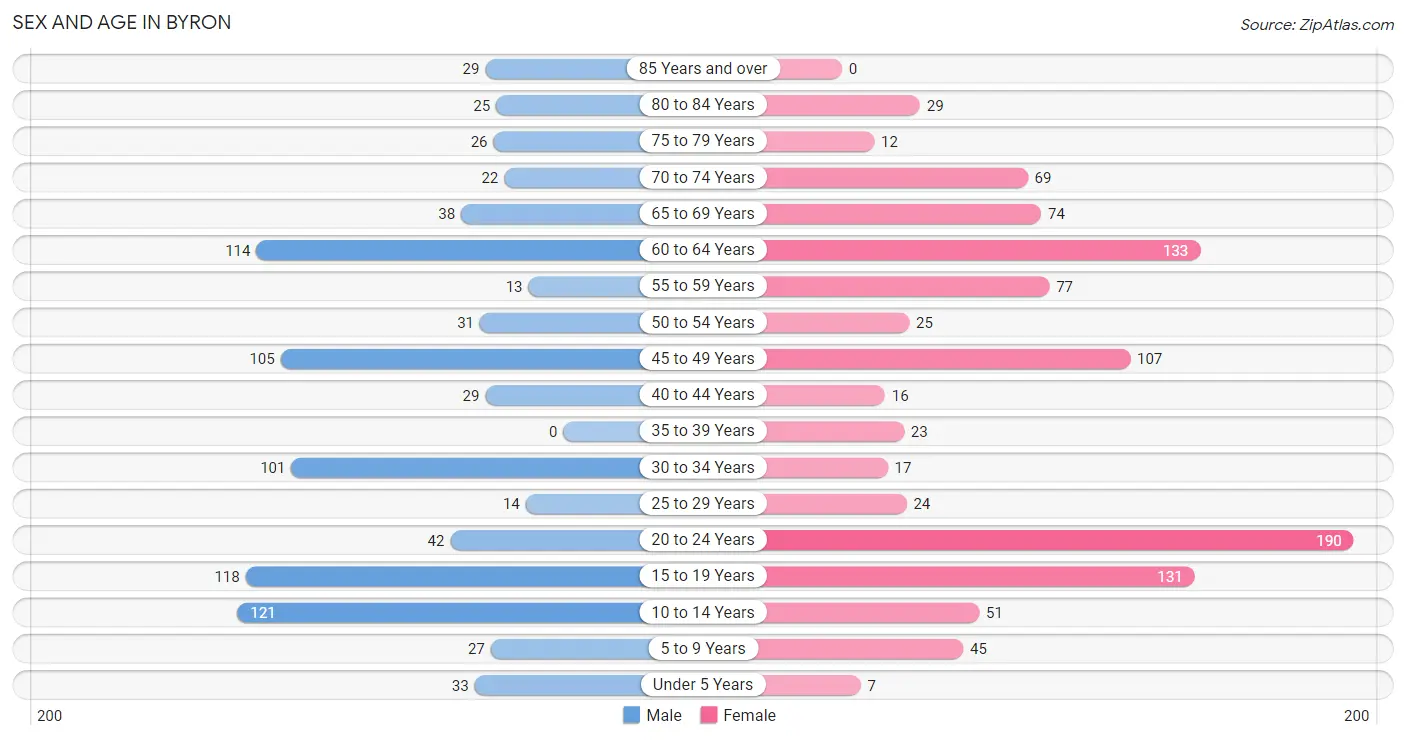
The most populous age groups in Byron are 10 to 14 Years (121 | 13.6%) for men and 20 to 24 Years (190 | 18.4%) for women.
| Age Bracket | Male | Female |
| Under 5 Years | 33 (3.7%) | 7 (0.7%) |
| 5 to 9 Years | 27 (3.0%) | 45 (4.4%) |
| 10 to 14 Years | 121 (13.6%) | 51 (5.0%) |
| 15 to 19 Years | 118 (13.3%) | 131 (12.7%) |
| 20 to 24 Years | 42 (4.7%) | 190 (18.4%) |
| 25 to 29 Years | 14 (1.6%) | 24 (2.3%) |
| 30 to 34 Years | 101 (11.4%) | 17 (1.7%) |
| 35 to 39 Years | 0 (0.0%) | 23 (2.2%) |
| 40 to 44 Years | 29 (3.3%) | 16 (1.5%) |
| 45 to 49 Years | 105 (11.8%) | 107 (10.4%) |
| 50 to 54 Years | 31 (3.5%) | 25 (2.4%) |
| 55 to 59 Years | 13 (1.5%) | 77 (7.5%) |
| 60 to 64 Years | 114 (12.8%) | 133 (12.9%) |
| 65 to 69 Years | 38 (4.3%) | 74 (7.2%) |
| 70 to 74 Years | 22 (2.5%) | 69 (6.7%) |
| 75 to 79 Years | 26 (2.9%) | 12 (1.2%) |
| 80 to 84 Years | 25 (2.8%) | 29 (2.8%) |
| 85 Years and over | 29 (3.3%) | 0 (0.0%) |
| Total | 888 (100.0%) | 1,030 (100.0%) |
Families and Households in Byron
Median Family Size in Byron
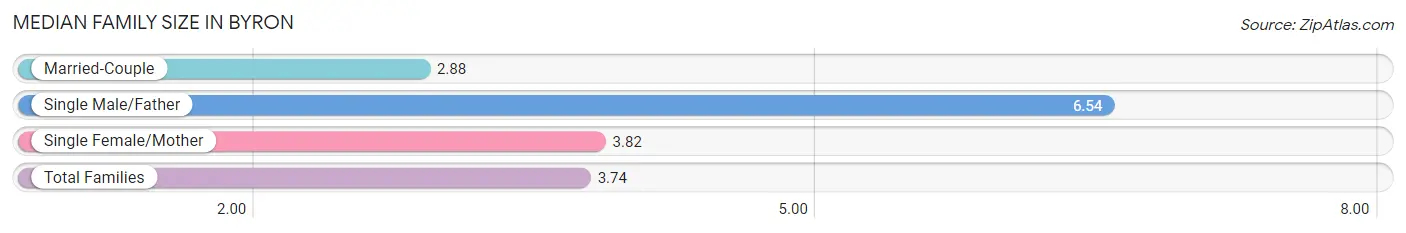
The median family size in Byron is 3.74 persons per family, with single male/father families (72 | 16.6%) accounting for the largest median family size of 6.54 persons per family. On the other hand, married-couple families (249 | 57.2%) represent the smallest median family size with 2.88 persons per family.
| Family Type | # Families | Family Size |
| Married-Couple | 249 (57.2%) | 2.88 |
| Single Male/Father | 72 (16.6%) | 6.54 |
| Single Female/Mother | 114 (26.2%) | 3.82 |
| Total Families | 435 (100.0%) | 3.74 |
Median Household Size in Byron
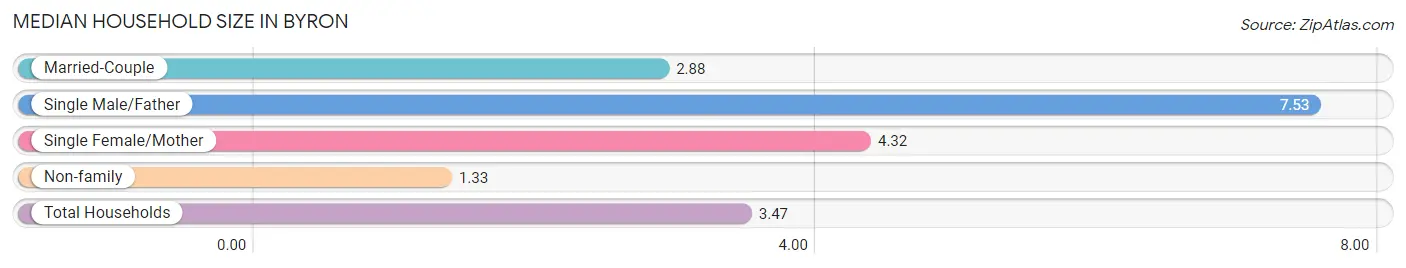
The median household size in Byron is 3.47 persons per household, with single male/father households (72 | 13.1%) accounting for the largest median household size of 7.53 persons per household. non-family households (114 | 20.8%) represent the smallest median household size with 1.33 persons per household.
| Household Type | # Households | Household Size |
| Married-Couple | 249 (45.4%) | 2.88 |
| Single Male/Father | 72 (13.1%) | 7.53 |
| Single Female/Mother | 114 (20.8%) | 4.32 |
| Non-family | 114 (20.8%) | 1.33 |
| Total Households | 549 (100.0%) | 3.47 |
Household Size by Marriage Status in Byron
Out of a total of 549 households in Byron, 435 (79.2%) are family households, while 114 (20.8%) are nonfamily households. The most numerous type of family households are 2-person households, comprising 166, and the most common type of nonfamily households are 1-person households, comprising 76.
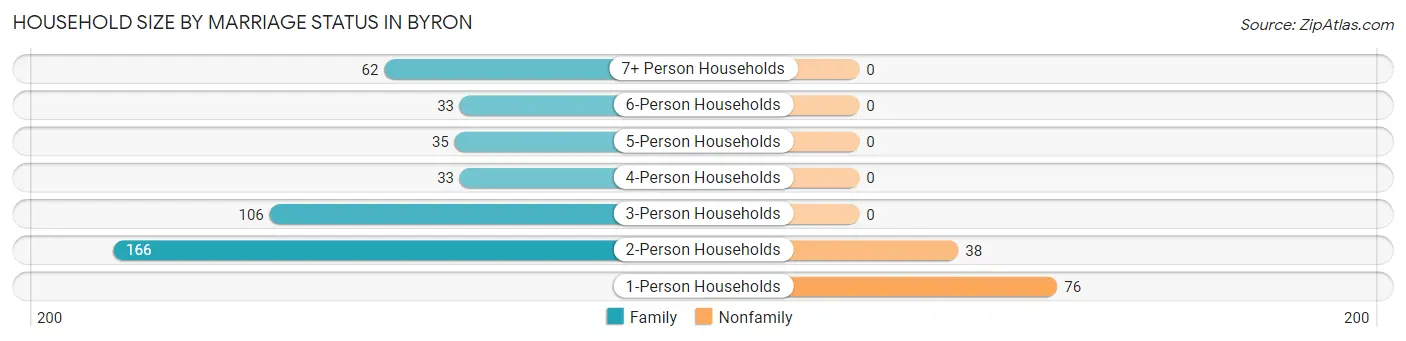
| Household Size | Family Households | Nonfamily Households |
| 1-Person Households | - | 76 (13.8%) |
| 2-Person Households | 166 (30.2%) | 38 (6.9%) |
| 3-Person Households | 106 (19.3%) | 0 (0.0%) |
| 4-Person Households | 33 (6.0%) | 0 (0.0%) |
| 5-Person Households | 35 (6.4%) | 0 (0.0%) |
| 6-Person Households | 33 (6.0%) | 0 (0.0%) |
| 7+ Person Households | 62 (11.3%) | 0 (0.0%) |
| Total | 435 (79.2%) | 114 (20.8%) |
Female Fertility in Byron
Fertility by Age in Byron
| Age Bracket | Women with Births | Births / 1,000 Women |
| 15 to 19 years | 0 (0.0%) | 0.0 |
| 20 to 34 years | 0 (0.0%) | 0.0 |
| 35 to 50 years | 0 (0.0%) | 0.0 |
| Total | 0 (0.0%) | 0.0 |
Fertility by Age by Marriage Status in Byron
| Age Bracket | Married | Unmarried |
| 15 to 19 years | 0 (0.0%) | 0 (0.0%) |
| 20 to 34 years | 0 (0.0%) | 0 (0.0%) |
| 35 to 50 years | 0 (0.0%) | 0 (0.0%) |
| Total | 0 (0.0%) | 0 (0.0%) |
Fertility by Education in Byron
| Educational Attainment | Women with Births | Births / 1,000 Women |
| Less than High School | 0 (0.0%) | 0.0 |
| High School Diploma | 0 (0.0%) | 0.0 |
| College or Associate's Degree | 0 (0.0%) | 0.0 |
| Bachelor's Degree | 0 (0.0%) | 0.0 |
| Graduate Degree | 0 (0.0%) | 0.0 |
| Total | 0 (0.0%) | 0.0 |
Fertility by Education by Marriage Status in Byron
| Educational Attainment | Married | Unmarried |
| Less than High School | 0 (0.0%) | 0 (0.0%) |
| High School Diploma | 0 (0.0%) | 0 (0.0%) |
| College or Associate's Degree | 0 (0.0%) | 0 (0.0%) |
| Bachelor's Degree | 0 (0.0%) | 0 (0.0%) |
| Graduate Degree | 0 (0.0%) | 0 (0.0%) |
| Total | 0 (0.0%) | 0 (0.0%) |
Employment Characteristics in Byron
Employment by Class of Employer in Byron
Among the 728 employed individuals in Byron, private company employees (502 | 69.0%), local government employees (148 | 20.3%), and self-employed (not incorporated) (52 | 7.1%) make up the most common classes of employment.
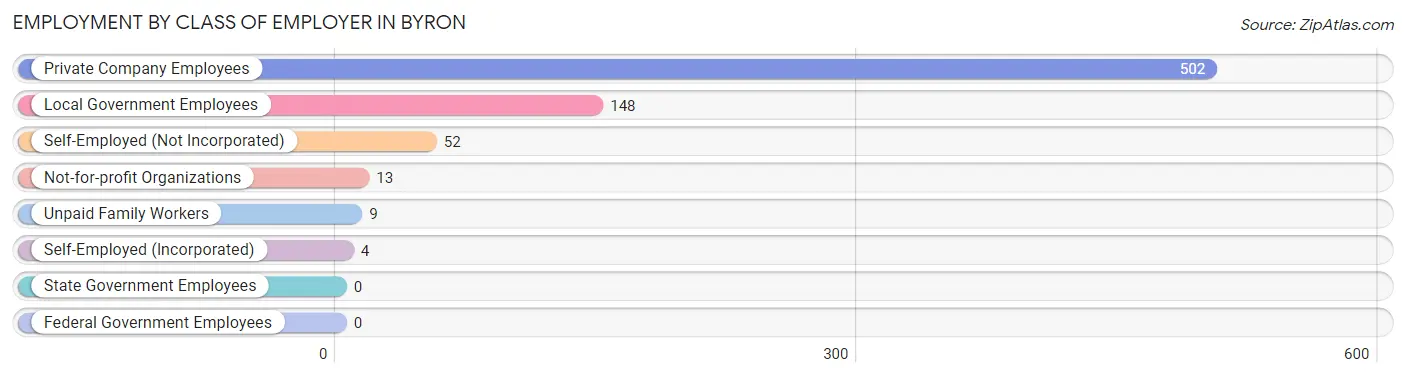
| Employer Class | # Employees | % Employees |
| Private Company Employees | 502 | 69.0% |
| Self-Employed (Incorporated) | 4 | 0.5% |
| Self-Employed (Not Incorporated) | 52 | 7.1% |
| Not-for-profit Organizations | 13 | 1.8% |
| Local Government Employees | 148 | 20.3% |
| State Government Employees | 0 | 0.0% |
| Federal Government Employees | 0 | 0.0% |
| Unpaid Family Workers | 9 | 1.2% |
| Total | 728 | 100.0% |
Employment Status by Age in Byron
According to the labor force statistics for Byron, out of the total population over 16 years of age (1,631), 48.8% or 796 individuals are in the labor force, with 8.5% or 68 of them unemployed. The age group with the highest labor force participation rate is 55 to 59 years, with 90.0% or 81 individuals in the labor force. Within the labor force, the 55 to 59 years age range has the highest percentage of unemployed individuals, with 72.8% or 59 of them being unemployed.
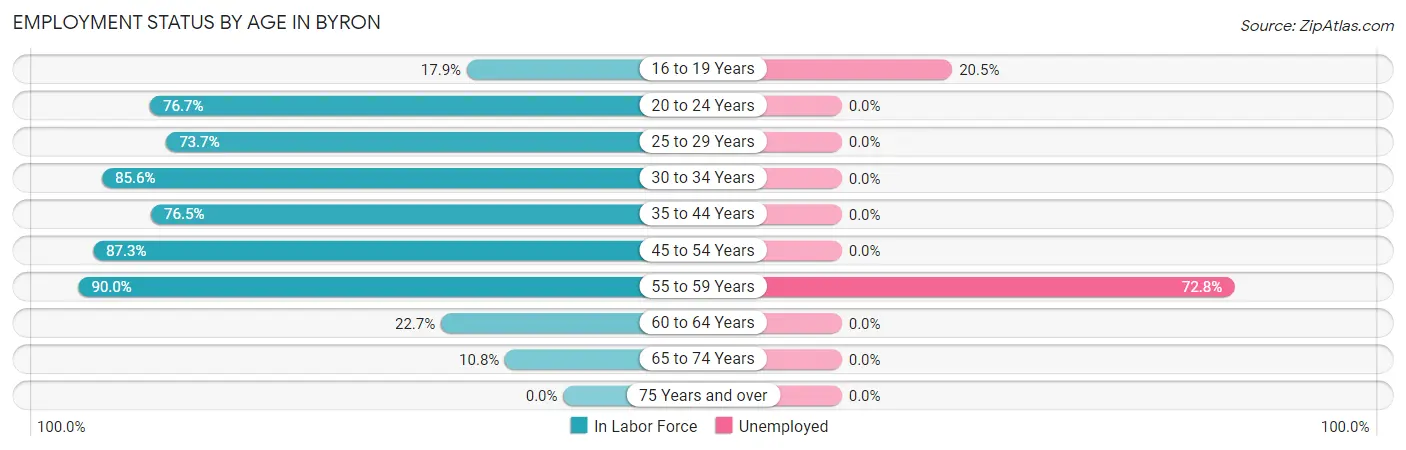
| Age Bracket | In Labor Force | Unemployed |
| 16 to 19 Years | 44 (17.9%) | 9 (20.5%) |
| 20 to 24 Years | 178 (76.7%) | 0 (0.0%) |
| 25 to 29 Years | 28 (73.7%) | 0 (0.0%) |
| 30 to 34 Years | 101 (85.6%) | 0 (0.0%) |
| 35 to 44 Years | 52 (76.5%) | 0 (0.0%) |
| 45 to 54 Years | 234 (87.3%) | 0 (0.0%) |
| 55 to 59 Years | 81 (90.0%) | 59 (72.8%) |
| 60 to 64 Years | 56 (22.7%) | 0 (0.0%) |
| 65 to 74 Years | 22 (10.8%) | 0 (0.0%) |
| 75 Years and over | 0 (0.0%) | 0 (0.0%) |
| Total | 796 (48.8%) | 68 (8.5%) |
Employment Status by Educational Attainment in Byron
According to labor force statistics for Byron, 66.6% of individuals (552) out of the total population between 25 and 64 years of age (829) are in the labor force, with 10.7% or 59 of them being unemployed. The group with the highest labor force participation rate are those with the educational attainment of college / associate degree, with 80.7% or 296 individuals in the labor force. Within the labor force, individuals with college / associate degree education have the highest percentage of unemployment, with 19.9% or 59 of them being unemployed.
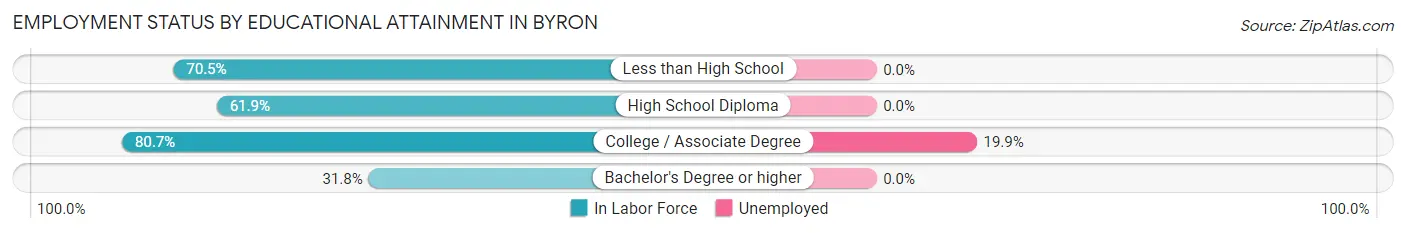
| Educational Attainment | In Labor Force | Unemployed |
| Less than High School | 79 (70.5%) | 0 (0.0%) |
| High School Diploma | 135 (61.9%) | 0 (0.0%) |
| College / Associate Degree | 296 (80.7%) | 73 (19.9%) |
| Bachelor's Degree or higher | 42 (31.8%) | 0 (0.0%) |
| Total | 552 (66.6%) | 89 (10.7%) |
Employment Occupations by Sex in Byron
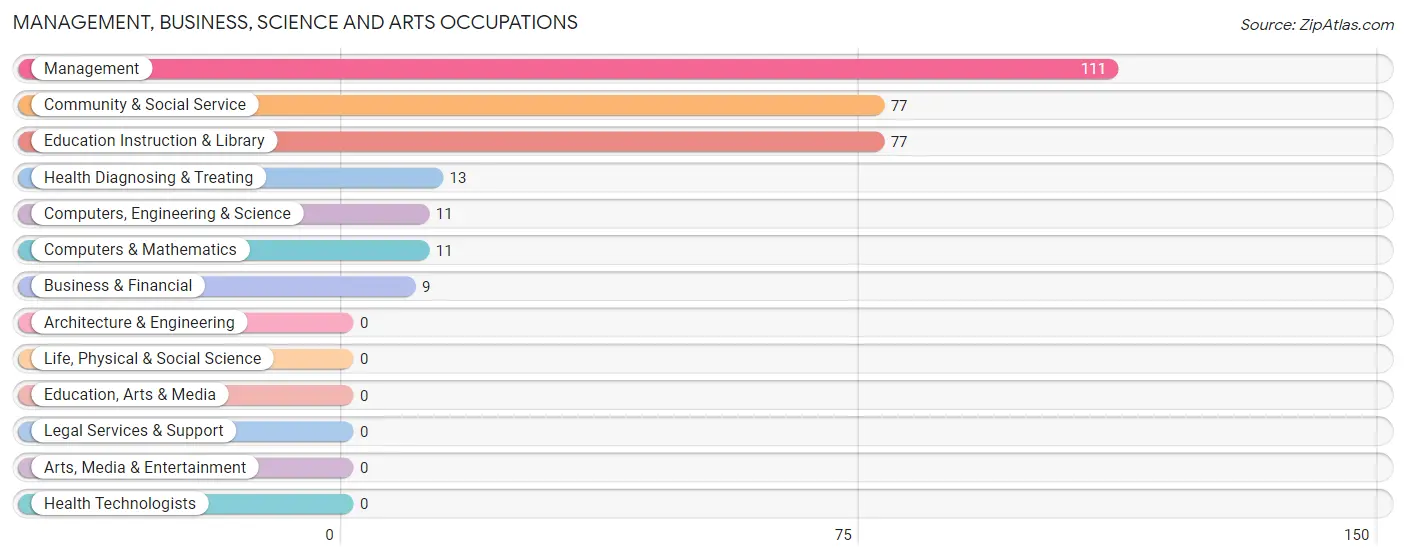
Management, Business, Science and Arts Occupations
The most common Management, Business, Science and Arts occupations in Byron are Management (111 | 15.2%), Community & Social Service (77 | 10.6%), Education Instruction & Library (77 | 10.6%), Health Diagnosing & Treating (13 | 1.8%), and Computers, Engineering & Science (11 | 1.5%).
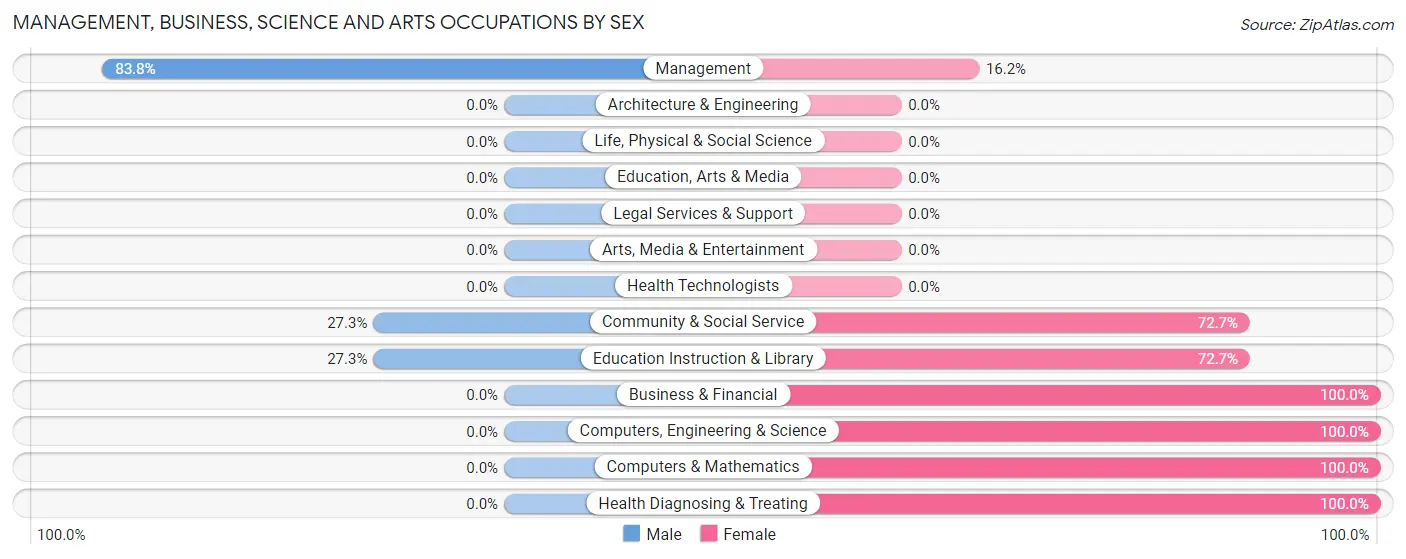
Management, Business, Science and Arts Occupations by Sex
Within the Management, Business, Science and Arts occupations in Byron, the most male-oriented occupations are Management (83.8%), Community & Social Service (27.3%), and Education Instruction & Library (27.3%), while the most female-oriented occupations are Business & Financial (100.0%), Computers, Engineering & Science (100.0%), and Computers & Mathematics (100.0%).
| Occupation | Male | Female |
| Management | 93 (83.8%) | 18 (16.2%) |
| Business & Financial | 0 (0.0%) | 9 (100.0%) |
| Computers, Engineering & Science | 0 (0.0%) | 11 (100.0%) |
| Computers & Mathematics | 0 (0.0%) | 11 (100.0%) |
| Architecture & Engineering | 0 (0.0%) | 0 (0.0%) |
| Life, Physical & Social Science | 0 (0.0%) | 0 (0.0%) |
| Community & Social Service | 21 (27.3%) | 56 (72.7%) |
| Education, Arts & Media | 0 (0.0%) | 0 (0.0%) |
| Legal Services & Support | 0 (0.0%) | 0 (0.0%) |
| Education Instruction & Library | 21 (27.3%) | 56 (72.7%) |
| Arts, Media & Entertainment | 0 (0.0%) | 0 (0.0%) |
| Health Diagnosing & Treating | 0 (0.0%) | 13 (100.0%) |
| Health Technologists | 0 (0.0%) | 0 (0.0%) |
| Total (Category) | 114 (51.6%) | 107 (48.4%) |
| Total (Overall) | 355 (48.8%) | 373 (51.2%) |
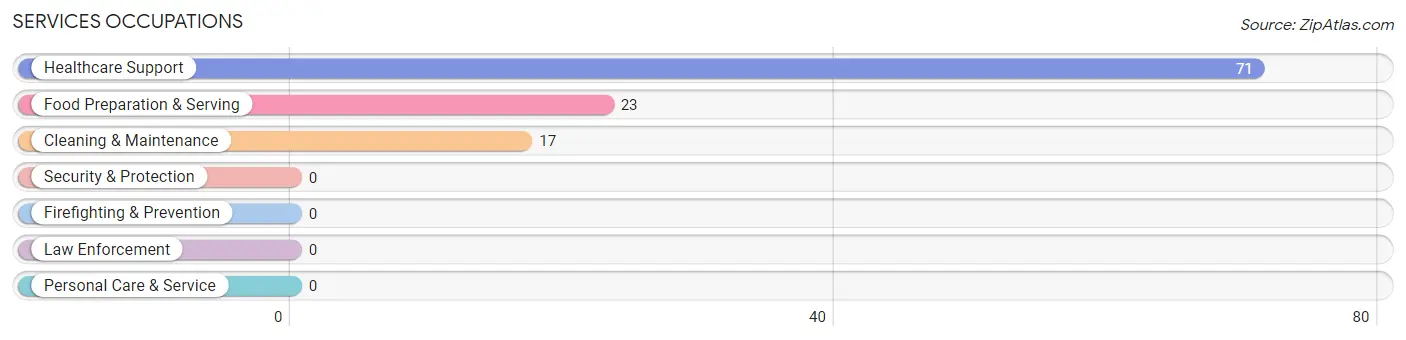
Services Occupations
The most common Services occupations in Byron are Healthcare Support (71 | 9.8%), Food Preparation & Serving (23 | 3.2%), and Cleaning & Maintenance (17 | 2.3%).
Services Occupations by Sex
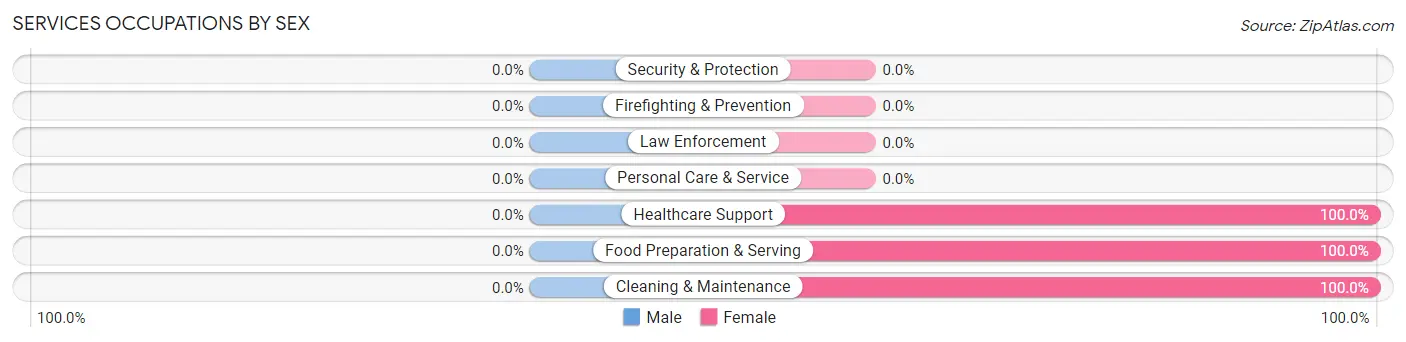
| Occupation | Male | Female |
| Healthcare Support | 0 (0.0%) | 71 (100.0%) |
| Security & Protection | 0 (0.0%) | 0 (0.0%) |
| Firefighting & Prevention | 0 (0.0%) | 0 (0.0%) |
| Law Enforcement | 0 (0.0%) | 0 (0.0%) |
| Food Preparation & Serving | 0 (0.0%) | 23 (100.0%) |
| Cleaning & Maintenance | 0 (0.0%) | 17 (100.0%) |
| Personal Care & Service | 0 (0.0%) | 0 (0.0%) |
| Total (Category) | 0 (0.0%) | 111 (100.0%) |
| Total (Overall) | 355 (48.8%) | 373 (51.2%) |
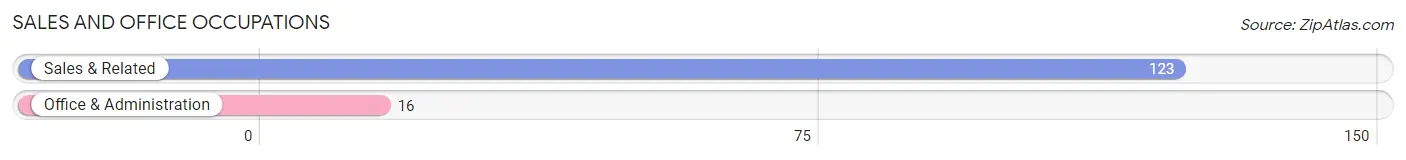
Sales and Office Occupations
The most common Sales and Office occupations in Byron are Sales & Related (123 | 16.9%), and Office & Administration (16 | 2.2%).
Sales and Office Occupations by Sex
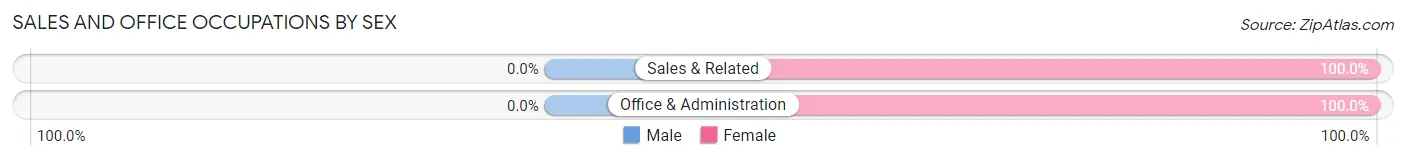
| Occupation | Male | Female |
| Sales & Related | 0 (0.0%) | 123 (100.0%) |
| Office & Administration | 0 (0.0%) | 16 (100.0%) |
| Total (Category) | 0 (0.0%) | 139 (100.0%) |
| Total (Overall) | 355 (48.8%) | 373 (51.2%) |
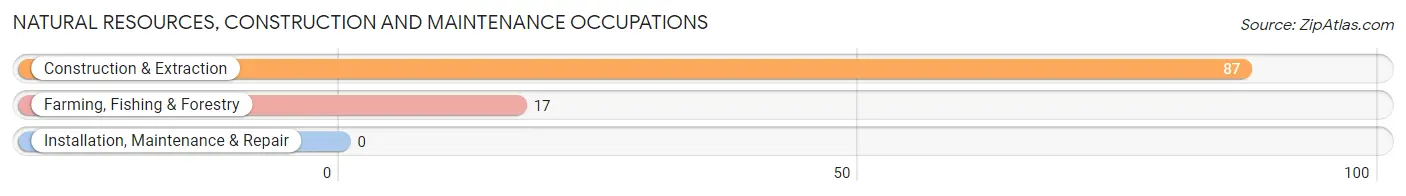
Natural Resources, Construction and Maintenance Occupations
The most common Natural Resources, Construction and Maintenance occupations in Byron are Construction & Extraction (87 | 11.9%), and Farming, Fishing & Forestry (17 | 2.3%).
Natural Resources, Construction and Maintenance Occupations by Sex
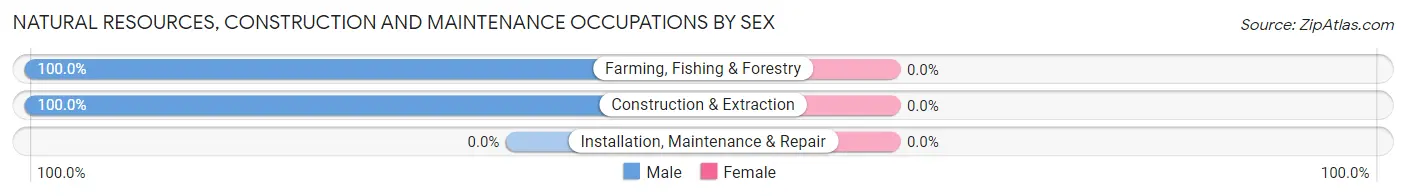
| Occupation | Male | Female |
| Farming, Fishing & Forestry | 17 (100.0%) | 0 (0.0%) |
| Construction & Extraction | 87 (100.0%) | 0 (0.0%) |
| Installation, Maintenance & Repair | 0 (0.0%) | 0 (0.0%) |
| Total (Category) | 104 (100.0%) | 0 (0.0%) |
| Total (Overall) | 355 (48.8%) | 373 (51.2%) |
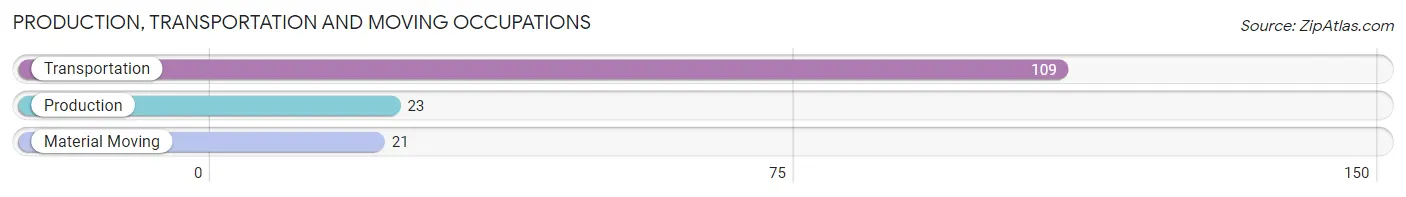
Production, Transportation and Moving Occupations
The most common Production, Transportation and Moving occupations in Byron are Transportation (109 | 15.0%), Production (23 | 3.2%), and Material Moving (21 | 2.9%).
Production, Transportation and Moving Occupations by Sex
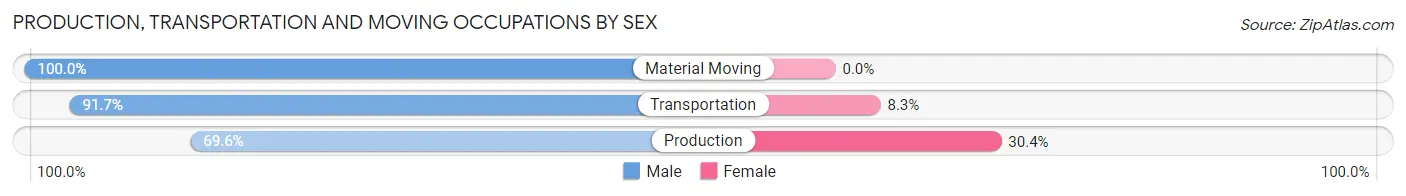
| Occupation | Male | Female |
| Production | 16 (69.6%) | 7 (30.4%) |
| Transportation | 100 (91.7%) | 9 (8.3%) |
| Material Moving | 21 (100.0%) | 0 (0.0%) |
| Total (Category) | 137 (89.5%) | 16 (10.5%) |
| Total (Overall) | 355 (48.8%) | 373 (51.2%) |
Employment Industries by Sex in Byron
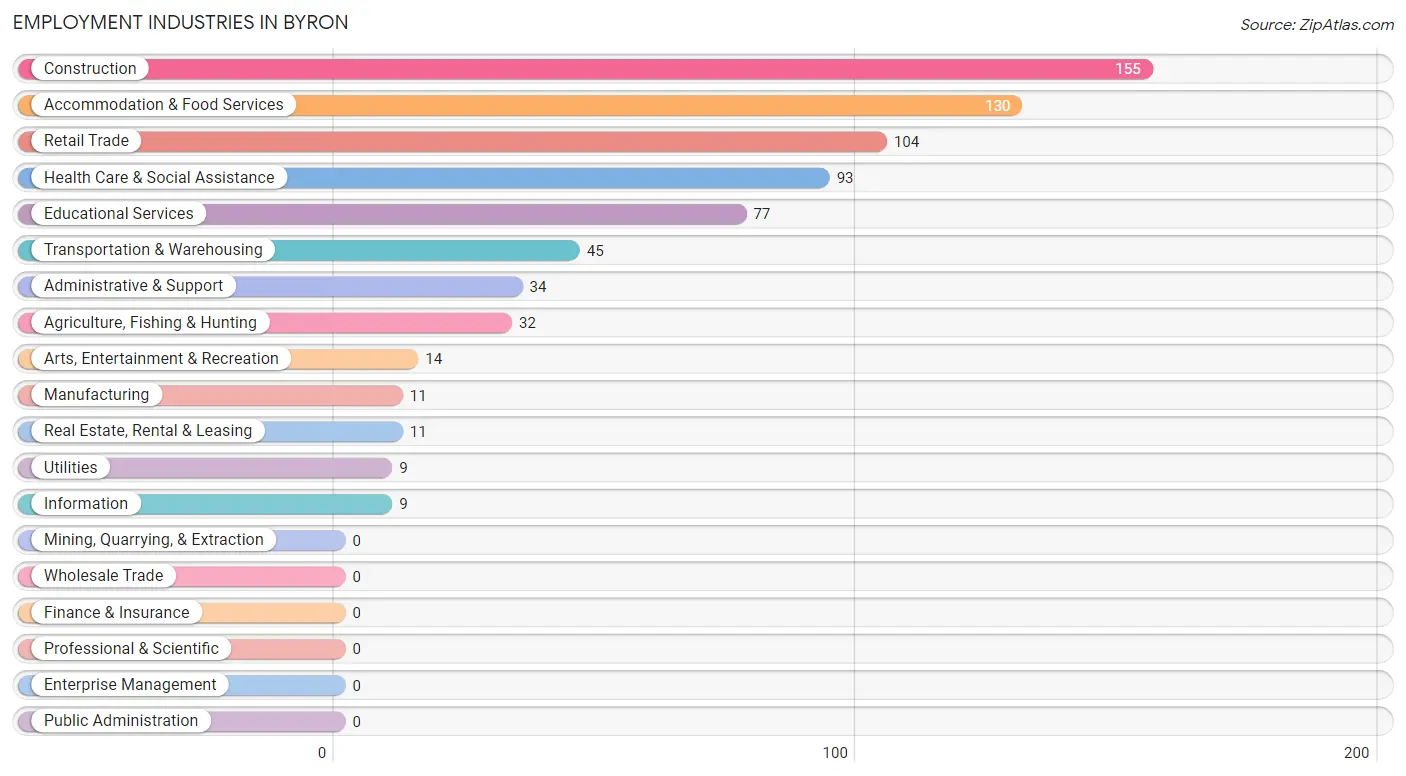
Employment Industries in Byron
The major employment industries in Byron include Construction (155 | 21.3%), Accommodation & Food Services (130 | 17.9%), Retail Trade (104 | 14.3%), Health Care & Social Assistance (93 | 12.8%), and Educational Services (77 | 10.6%).
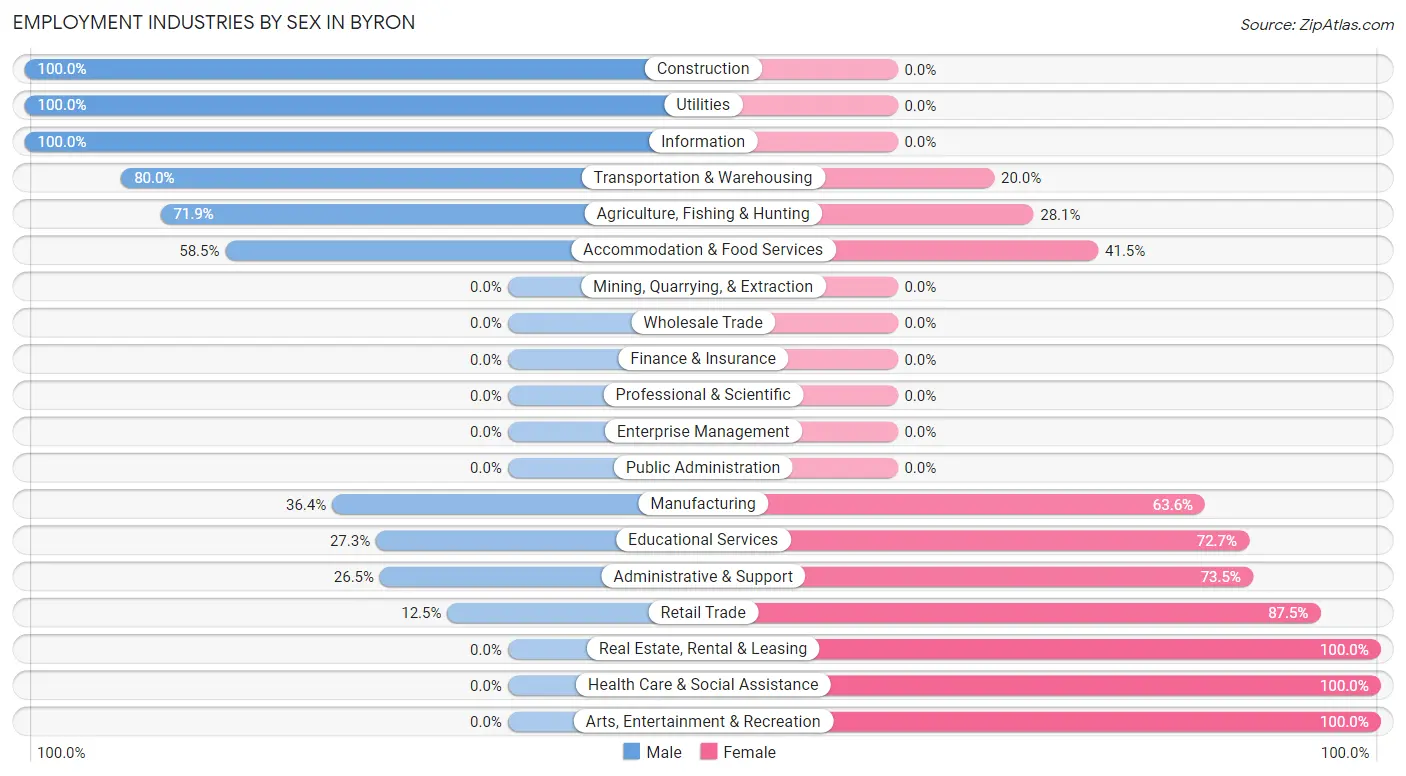
Employment Industries by Sex in Byron
The Byron industries that see more men than women are Construction (100.0%), Utilities (100.0%), and Information (100.0%), whereas the industries that tend to have a higher number of women are Real Estate, Rental & Leasing (100.0%), Health Care & Social Assistance (100.0%), and Arts, Entertainment & Recreation (100.0%).
| Industry | Male | Female |
| Agriculture, Fishing & Hunting | 23 (71.9%) | 9 (28.1%) |
| Mining, Quarrying, & Extraction | 0 (0.0%) | 0 (0.0%) |
| Construction | 155 (100.0%) | 0 (0.0%) |
| Manufacturing | 4 (36.4%) | 7 (63.6%) |
| Wholesale Trade | 0 (0.0%) | 0 (0.0%) |
| Retail Trade | 13 (12.5%) | 91 (87.5%) |
| Transportation & Warehousing | 36 (80.0%) | 9 (20.0%) |
| Utilities | 9 (100.0%) | 0 (0.0%) |
| Information | 9 (100.0%) | 0 (0.0%) |
| Finance & Insurance | 0 (0.0%) | 0 (0.0%) |
| Real Estate, Rental & Leasing | 0 (0.0%) | 11 (100.0%) |
| Professional & Scientific | 0 (0.0%) | 0 (0.0%) |
| Enterprise Management | 0 (0.0%) | 0 (0.0%) |
| Administrative & Support | 9 (26.5%) | 25 (73.5%) |
| Educational Services | 21 (27.3%) | 56 (72.7%) |
| Health Care & Social Assistance | 0 (0.0%) | 93 (100.0%) |
| Arts, Entertainment & Recreation | 0 (0.0%) | 14 (100.0%) |
| Accommodation & Food Services | 76 (58.5%) | 54 (41.5%) |
| Public Administration | 0 (0.0%) | 0 (0.0%) |
| Total | 355 (48.8%) | 373 (51.2%) |
Education in Byron
School Enrollment in Byron
The most common levels of schooling among the 592 students in Byron are college / undergraduate (179 | 30.2%), high school (176 | 29.7%), and middle school (151 | 25.5%).
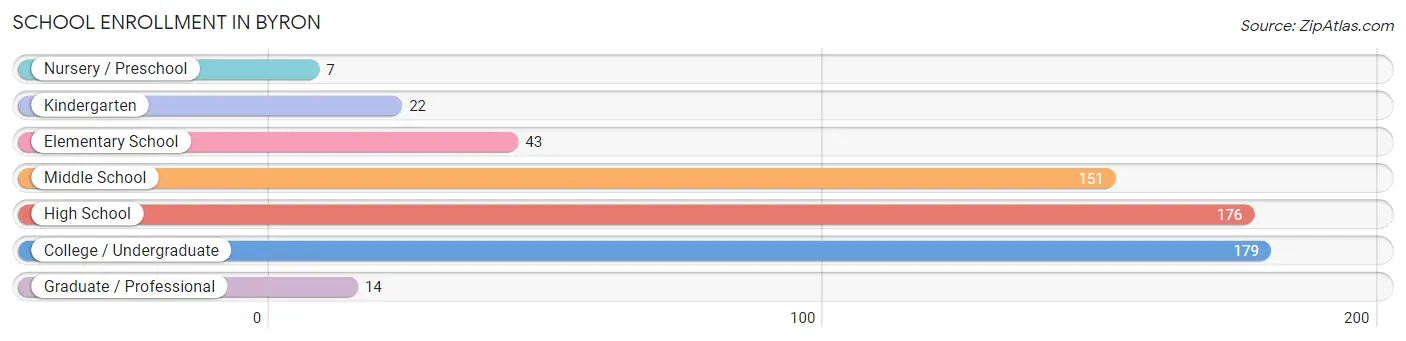
| School Level | # Students | % Students |
| Nursery / Preschool | 7 | 1.2% |
| Kindergarten | 22 | 3.7% |
| Elementary School | 43 | 7.3% |
| Middle School | 151 | 25.5% |
| High School | 176 | 29.7% |
| College / Undergraduate | 179 | 30.2% |
| Graduate / Professional | 14 | 2.4% |
| Total | 592 | 100.0% |
School Enrollment by Age by Funding Source in Byron
Out of a total of 592 students who are enrolled in schools in Byron, 77 (13.0%) attend a private institution, while the remaining 515 (87.0%) are enrolled in public schools. The age group of 18 to 19 year olds has the highest likelihood of being enrolled in private schools, with 77 (55.8% in the age bracket) enrolled. Conversely, the age group of 5 to 9 year old has the lowest likelihood of being enrolled in a private school, with 72 (100.0% in the age bracket) attending a public institution.
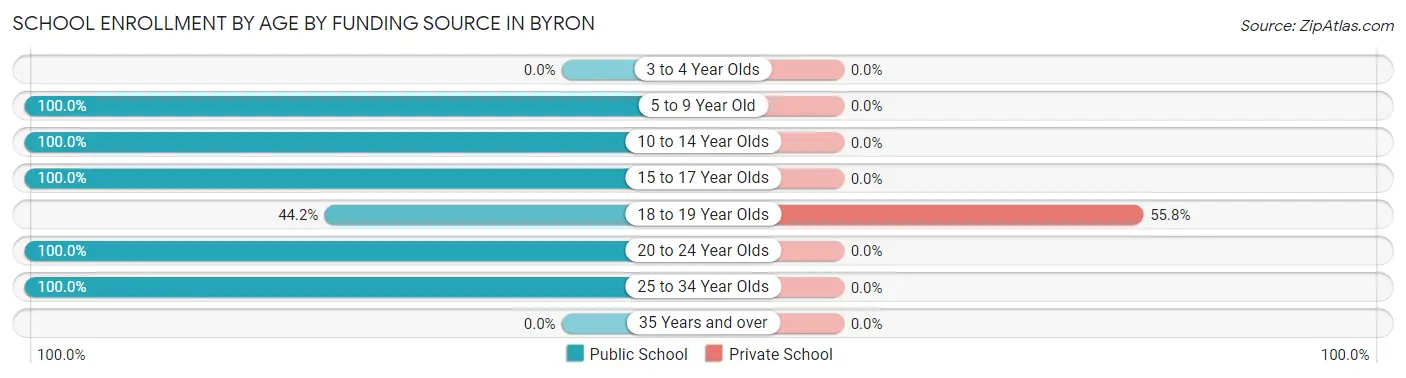
| Age Bracket | Public School | Private School |
| 3 to 4 Year Olds | 0 (0.0%) | 0 (0.0%) |
| 5 to 9 Year Old | 72 (100.0%) | 0 (0.0%) |
| 10 to 14 Year Olds | 172 (100.0%) | 0 (0.0%) |
| 15 to 17 Year Olds | 107 (100.0%) | 0 (0.0%) |
| 18 to 19 Year Olds | 61 (44.2%) | 77 (55.8%) |
| 20 to 24 Year Olds | 92 (100.0%) | 0 (0.0%) |
| 25 to 34 Year Olds | 11 (100.0%) | 0 (0.0%) |
| 35 Years and over | 0 (0.0%) | 0 (0.0%) |
| Total | 515 (87.0%) | 77 (13.0%) |
Educational Attainment by Field of Study in Byron
Bio, nature & agricultural (95 | 42.2%), education (42 | 18.7%), psychology (25 | 11.1%), literature & languages (24 | 10.7%), and engineering (12 | 5.3%) are the most common fields of study among 225 individuals in Byron who have obtained a bachelor's degree or higher.
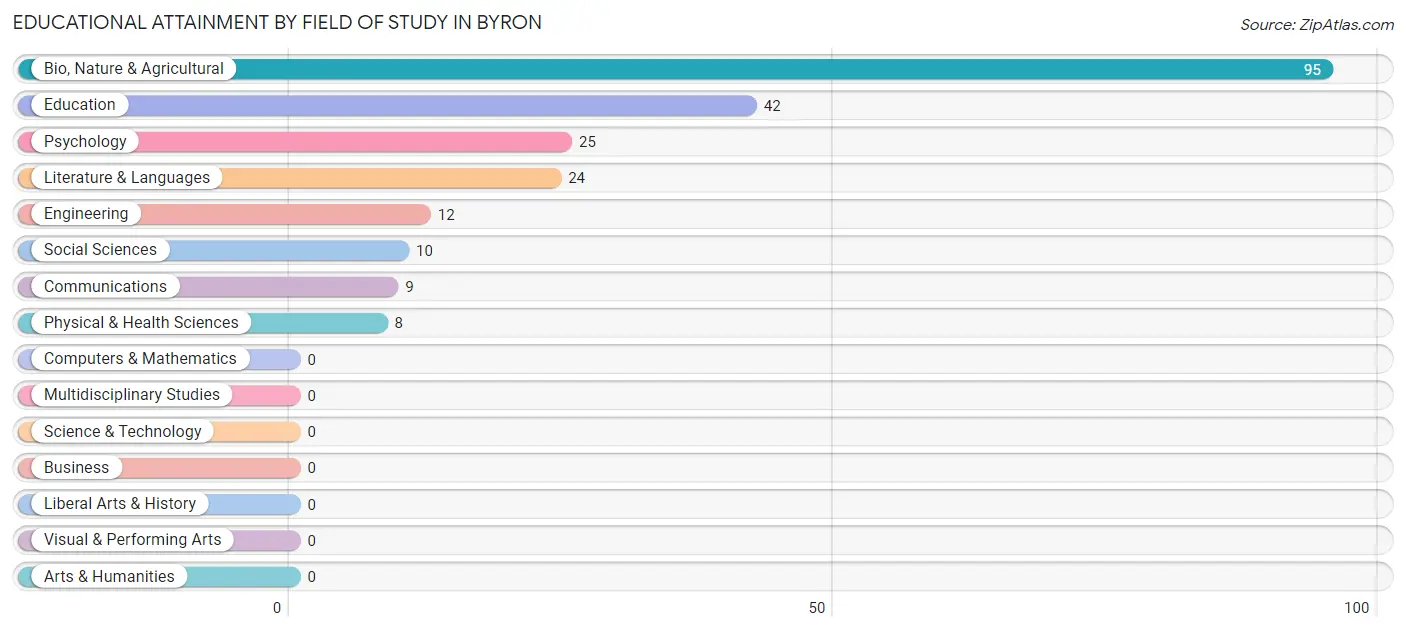
| Field of Study | # Graduates | % Graduates |
| Computers & Mathematics | 0 | 0.0% |
| Bio, Nature & Agricultural | 95 | 42.2% |
| Physical & Health Sciences | 8 | 3.6% |
| Psychology | 25 | 11.1% |
| Social Sciences | 10 | 4.4% |
| Engineering | 12 | 5.3% |
| Multidisciplinary Studies | 0 | 0.0% |
| Science & Technology | 0 | 0.0% |
| Business | 0 | 0.0% |
| Education | 42 | 18.7% |
| Literature & Languages | 24 | 10.7% |
| Liberal Arts & History | 0 | 0.0% |
| Visual & Performing Arts | 0 | 0.0% |
| Communications | 9 | 4.0% |
| Arts & Humanities | 0 | 0.0% |
| Total | 225 | 100.0% |
Transportation & Commute in Byron
Vehicle Availability by Sex in Byron
The most prevalent vehicle ownership categories in Byron are males with 5 or more vehicles (168, accounting for 47.3%) and females with 5 or more vehicles (174, making up 45.0%).
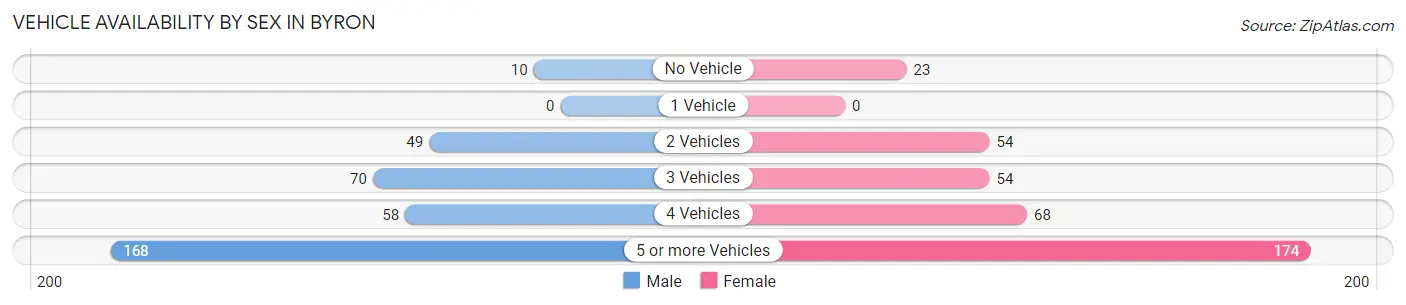
| Vehicles Available | Male | Female |
| No Vehicle | 10 (2.8%) | 23 (6.2%) |
| 1 Vehicle | 0 (0.0%) | 0 (0.0%) |
| 2 Vehicles | 49 (13.8%) | 54 (14.5%) |
| 3 Vehicles | 70 (19.7%) | 54 (14.5%) |
| 4 Vehicles | 58 (16.3%) | 68 (18.2%) |
| 5 or more Vehicles | 168 (47.3%) | 174 (46.7%) |
| Total | 355 (100.0%) | 373 (100.0%) |
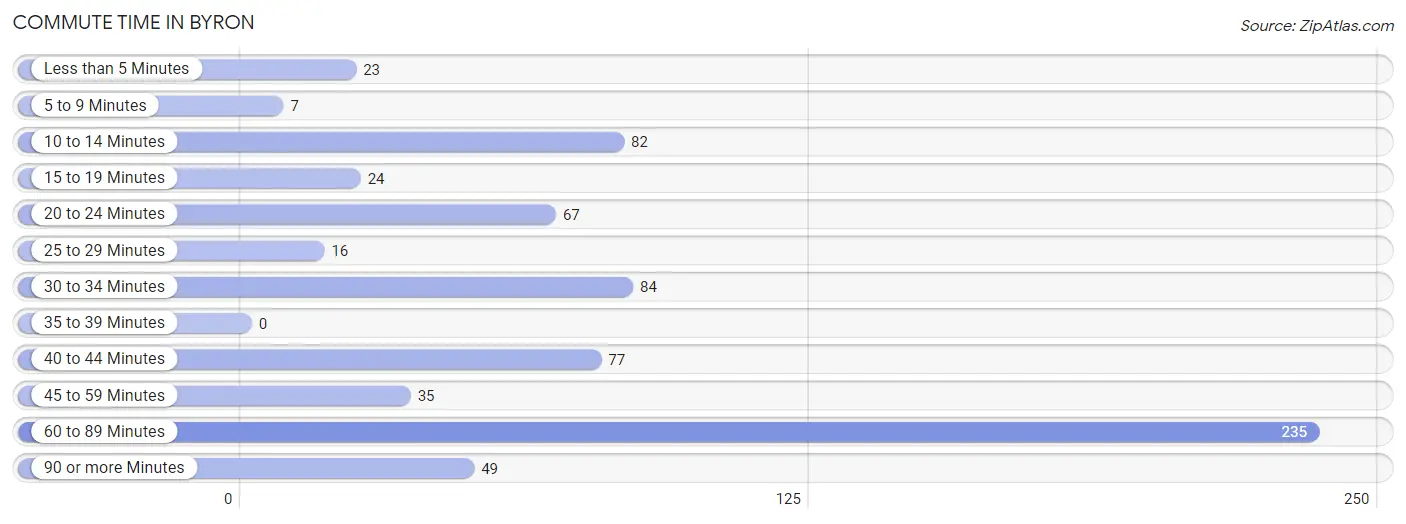
Commute Time in Byron
The most frequently occuring commute durations in Byron are 60 to 89 minutes (235 commuters, 33.6%), 30 to 34 minutes (84 commuters, 12.0%), and 10 to 14 minutes (82 commuters, 11.7%).
| Commute Time | # Commuters | % Commuters |
| Less than 5 Minutes | 23 | 3.3% |
| 5 to 9 Minutes | 7 | 1.0% |
| 10 to 14 Minutes | 82 | 11.7% |
| 15 to 19 Minutes | 24 | 3.4% |
| 20 to 24 Minutes | 67 | 9.6% |
| 25 to 29 Minutes | 16 | 2.3% |
| 30 to 34 Minutes | 84 | 12.0% |
| 35 to 39 Minutes | 0 | 0.0% |
| 40 to 44 Minutes | 77 | 11.0% |
| 45 to 59 Minutes | 35 | 5.0% |
| 60 to 89 Minutes | 235 | 33.6% |
| 90 or more Minutes | 49 | 7.0% |
Commute Time by Sex in Byron
The most common commute times in Byron are 60 to 89 minutes (79 commuters, 23.4%) for males and 60 to 89 minutes (156 commuters, 43.1%) for females.
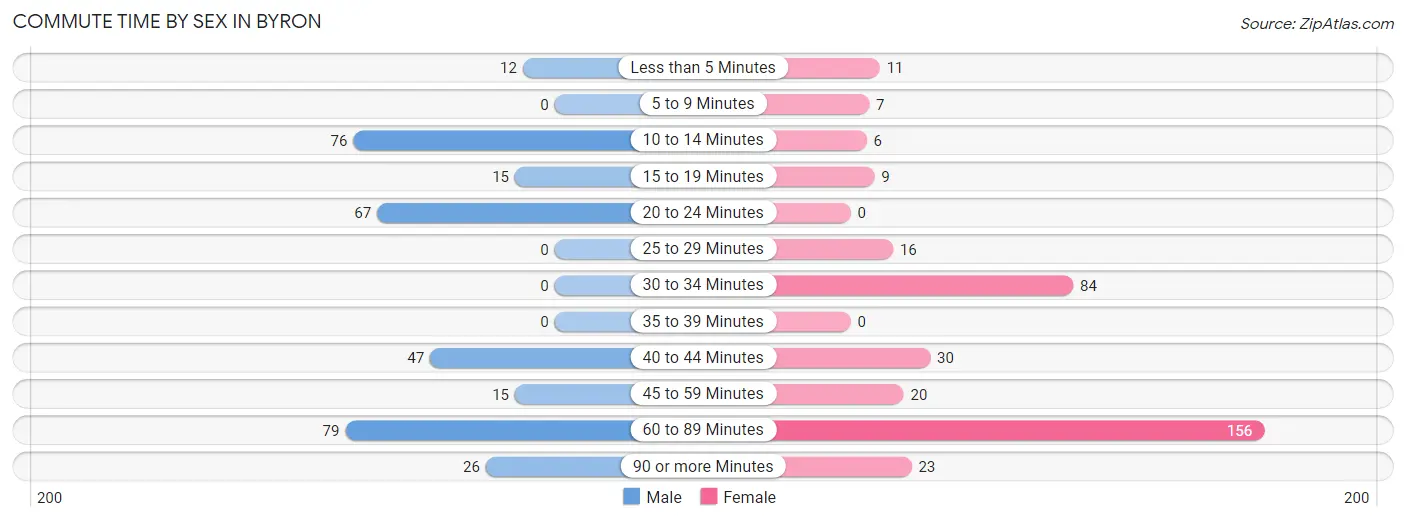
| Commute Time | Male | Female |
| Less than 5 Minutes | 12 (3.6%) | 11 (3.0%) |
| 5 to 9 Minutes | 0 (0.0%) | 7 (1.9%) |
| 10 to 14 Minutes | 76 (22.6%) | 6 (1.7%) |
| 15 to 19 Minutes | 15 (4.4%) | 9 (2.5%) |
| 20 to 24 Minutes | 67 (19.9%) | 0 (0.0%) |
| 25 to 29 Minutes | 0 (0.0%) | 16 (4.4%) |
| 30 to 34 Minutes | 0 (0.0%) | 84 (23.2%) |
| 35 to 39 Minutes | 0 (0.0%) | 0 (0.0%) |
| 40 to 44 Minutes | 47 (14.0%) | 30 (8.3%) |
| 45 to 59 Minutes | 15 (4.4%) | 20 (5.5%) |
| 60 to 89 Minutes | 79 (23.4%) | 156 (43.1%) |
| 90 or more Minutes | 26 (7.7%) | 23 (6.4%) |
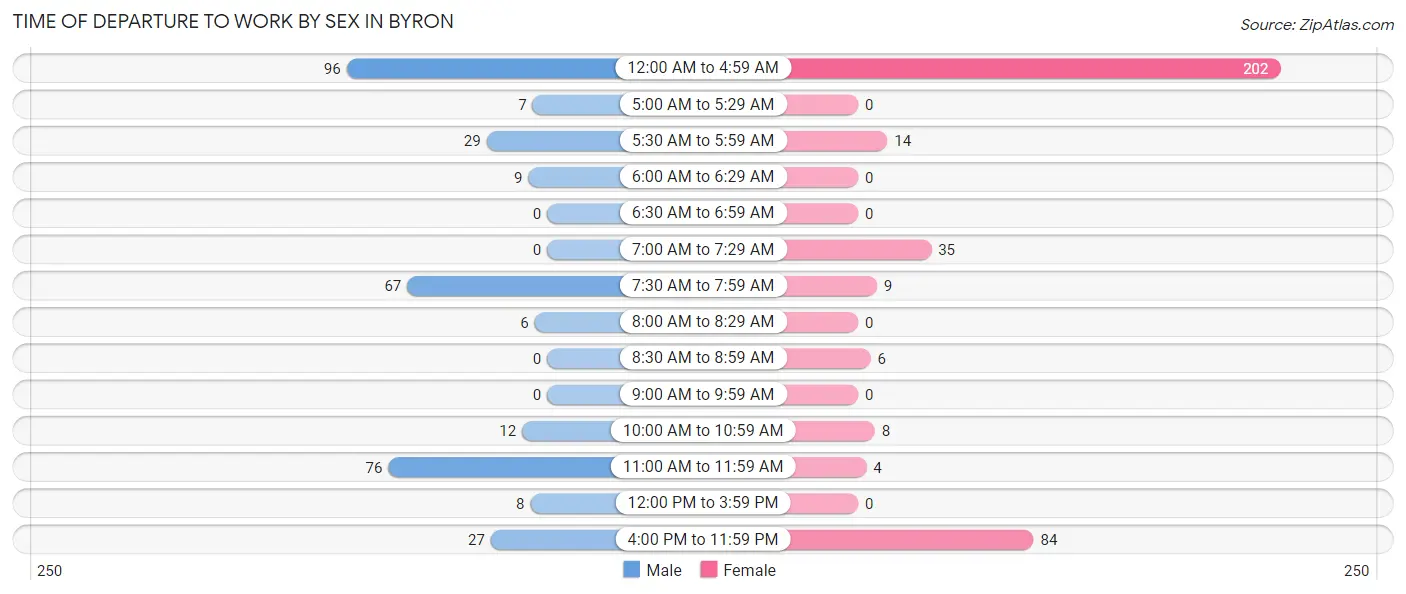
Time of Departure to Work by Sex in Byron
The most frequent times of departure to work in Byron are 12:00 AM to 4:59 AM (96, 28.5%) for males and 12:00 AM to 4:59 AM (202, 55.8%) for females.
| Time of Departure | Male | Female |
| 12:00 AM to 4:59 AM | 96 (28.5%) | 202 (55.8%) |
| 5:00 AM to 5:29 AM | 7 (2.1%) | 0 (0.0%) |
| 5:30 AM to 5:59 AM | 29 (8.6%) | 14 (3.9%) |
| 6:00 AM to 6:29 AM | 9 (2.7%) | 0 (0.0%) |
| 6:30 AM to 6:59 AM | 0 (0.0%) | 0 (0.0%) |
| 7:00 AM to 7:29 AM | 0 (0.0%) | 35 (9.7%) |
| 7:30 AM to 7:59 AM | 67 (19.9%) | 9 (2.5%) |
| 8:00 AM to 8:29 AM | 6 (1.8%) | 0 (0.0%) |
| 8:30 AM to 8:59 AM | 0 (0.0%) | 6 (1.7%) |
| 9:00 AM to 9:59 AM | 0 (0.0%) | 0 (0.0%) |
| 10:00 AM to 10:59 AM | 12 (3.6%) | 8 (2.2%) |
| 11:00 AM to 11:59 AM | 76 (22.6%) | 4 (1.1%) |
| 12:00 PM to 3:59 PM | 8 (2.4%) | 0 (0.0%) |
| 4:00 PM to 11:59 PM | 27 (8.0%) | 84 (23.2%) |
| Total | 337 (100.0%) | 362 (100.0%) |
Housing Occupancy in Byron
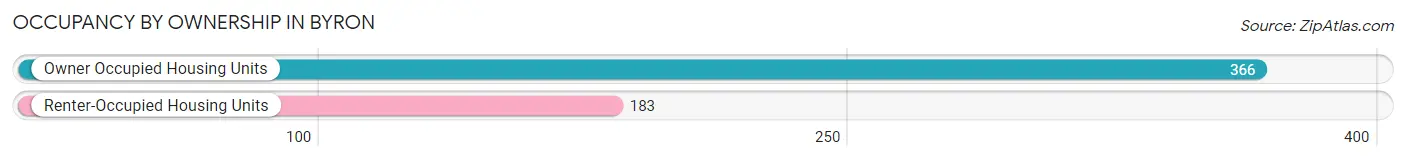
Occupancy by Ownership in Byron
Of the total 549 dwellings in Byron, owner-occupied units account for 366 (66.7%), while renter-occupied units make up 183 (33.3%).
| Occupancy | # Housing Units | % Housing Units |
| Owner Occupied Housing Units | 366 | 66.7% |
| Renter-Occupied Housing Units | 183 | 33.3% |
| Total Occupied Housing Units | 549 | 100.0% |
Occupancy by Household Size in Byron
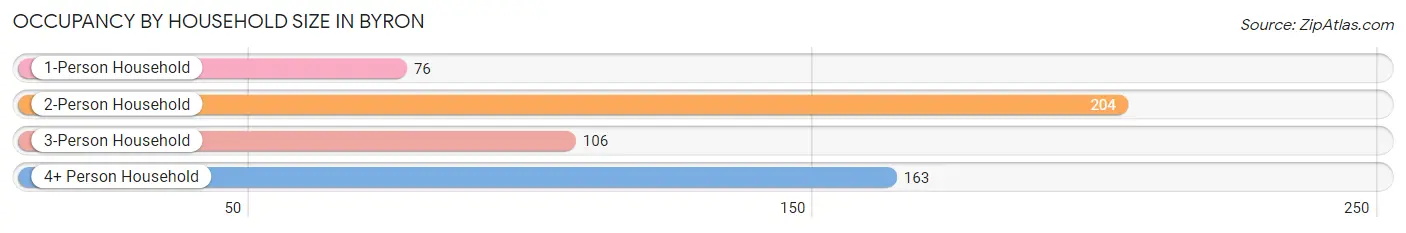
| Household Size | # Housing Units | % Housing Units |
| 1-Person Household | 76 | 13.8% |
| 2-Person Household | 204 | 37.2% |
| 3-Person Household | 106 | 19.3% |
| 4+ Person Household | 163 | 29.7% |
| Total Housing Units | 549 | 100.0% |
Occupancy by Ownership by Household Size in Byron
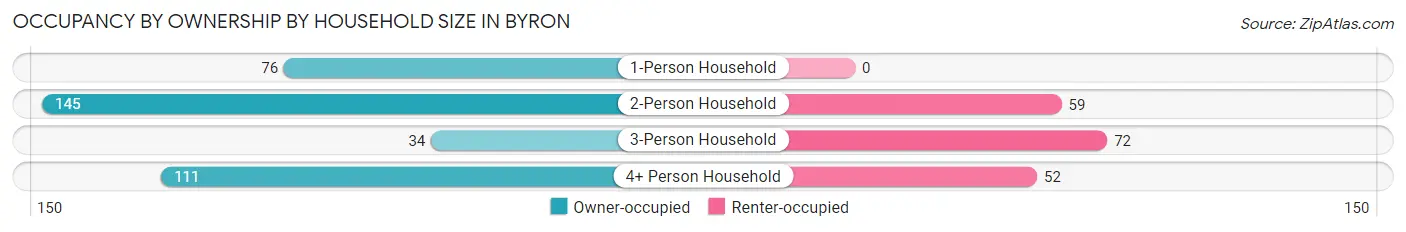
| Household Size | Owner-occupied | Renter-occupied |
| 1-Person Household | 76 (100.0%) | 0 (0.0%) |
| 2-Person Household | 145 (71.1%) | 59 (28.9%) |
| 3-Person Household | 34 (32.1%) | 72 (67.9%) |
| 4+ Person Household | 111 (68.1%) | 52 (31.9%) |
| Total Housing Units | 366 (66.7%) | 183 (33.3%) |
Occupancy by Educational Attainment in Byron
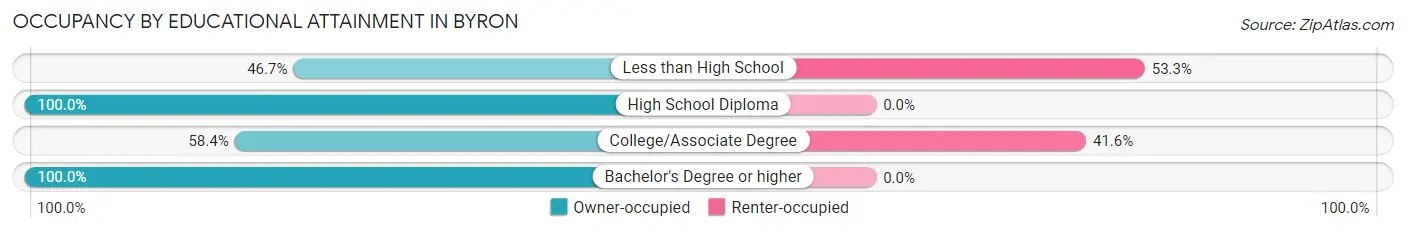
| Household Size | Owner-occupied | Renter-occupied |
| Less than High School | 43 (46.7%) | 49 (53.3%) |
| High School Diploma | 55 (100.0%) | 0 (0.0%) |
| College/Associate Degree | 188 (58.4%) | 134 (41.6%) |
| Bachelor's Degree or higher | 80 (100.0%) | 0 (0.0%) |
Occupancy by Age of Householder in Byron
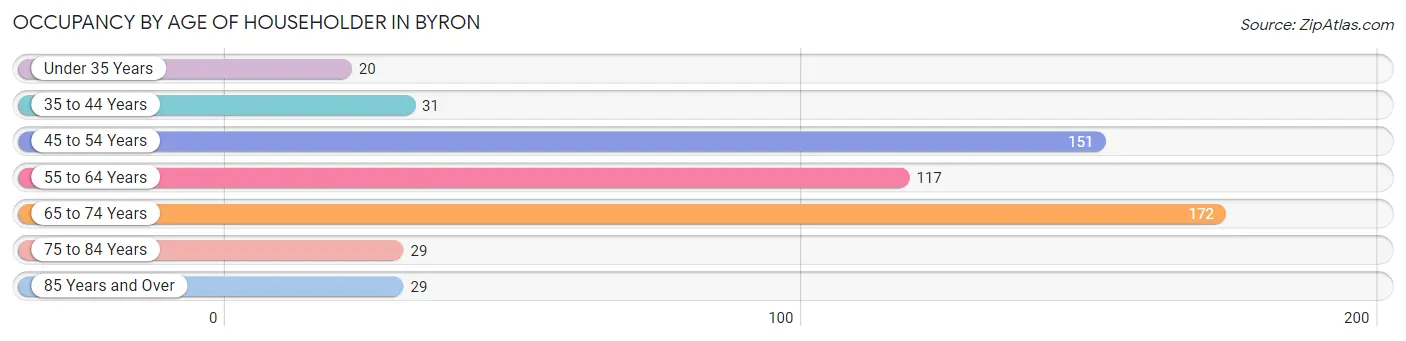
| Age Bracket | # Households | % Households |
| Under 35 Years | 20 | 3.6% |
| 35 to 44 Years | 31 | 5.7% |
| 45 to 54 Years | 151 | 27.5% |
| 55 to 64 Years | 117 | 21.3% |
| 65 to 74 Years | 172 | 31.3% |
| 75 to 84 Years | 29 | 5.3% |
| 85 Years and Over | 29 | 5.3% |
| Total | 549 | 100.0% |
Housing Finances in Byron
Median Income by Occupancy in Byron
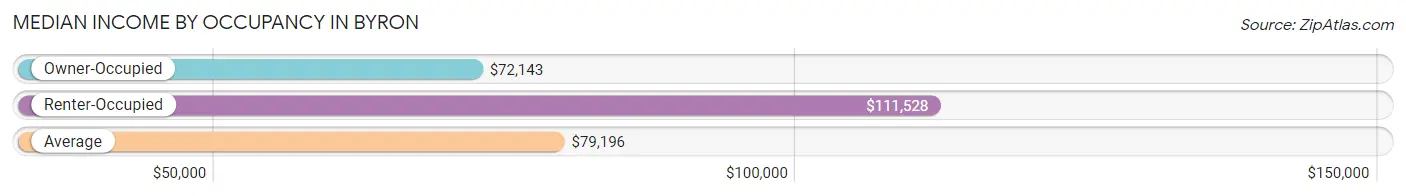
| Occupancy Type | # Households | Median Income |
| Owner-Occupied | 366 (66.7%) | $72,143 |
| Renter-Occupied | 183 (33.3%) | $111,528 |
| Average | 549 (100.0%) | $79,196 |
Occupancy by Householder Income Bracket in Byron
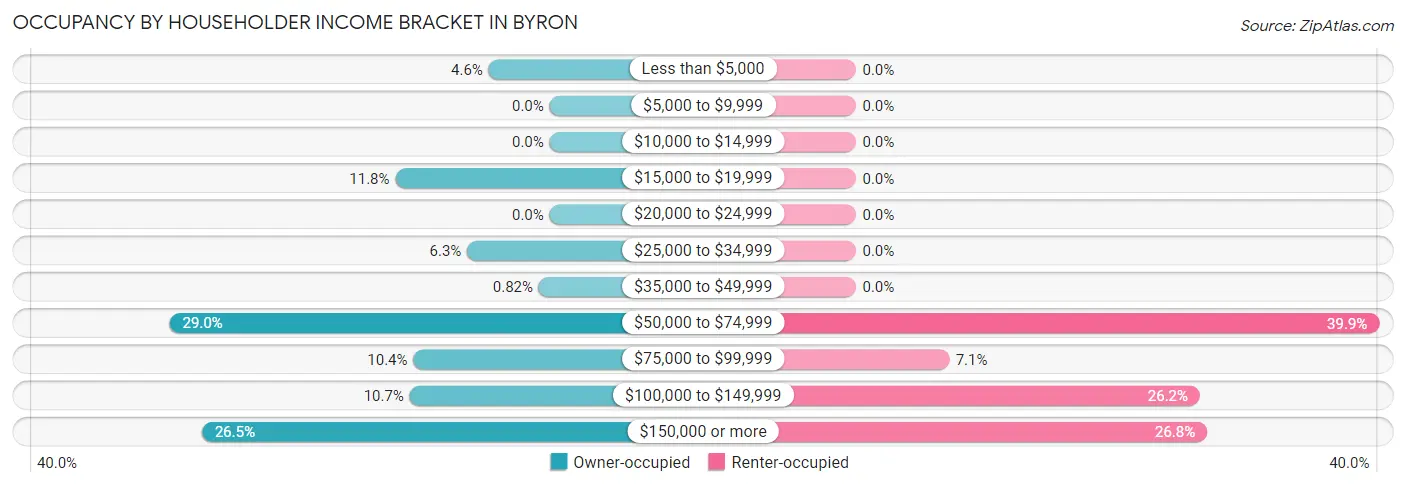
| Income Bracket | Owner-occupied | Renter-occupied |
| Less than $5,000 | 17 (4.6%) | 0 (0.0%) |
| $5,000 to $9,999 | 0 (0.0%) | 0 (0.0%) |
| $10,000 to $14,999 | 0 (0.0%) | 0 (0.0%) |
| $15,000 to $19,999 | 43 (11.7%) | 0 (0.0%) |
| $20,000 to $24,999 | 0 (0.0%) | 0 (0.0%) |
| $25,000 to $34,999 | 23 (6.3%) | 0 (0.0%) |
| $35,000 to $49,999 | 3 (0.8%) | 0 (0.0%) |
| $50,000 to $74,999 | 106 (29.0%) | 73 (39.9%) |
| $75,000 to $99,999 | 38 (10.4%) | 13 (7.1%) |
| $100,000 to $149,999 | 39 (10.7%) | 48 (26.2%) |
| $150,000 or more | 97 (26.5%) | 49 (26.8%) |
| Total | 366 (100.0%) | 183 (100.0%) |
Monthly Housing Cost Tiers in Byron
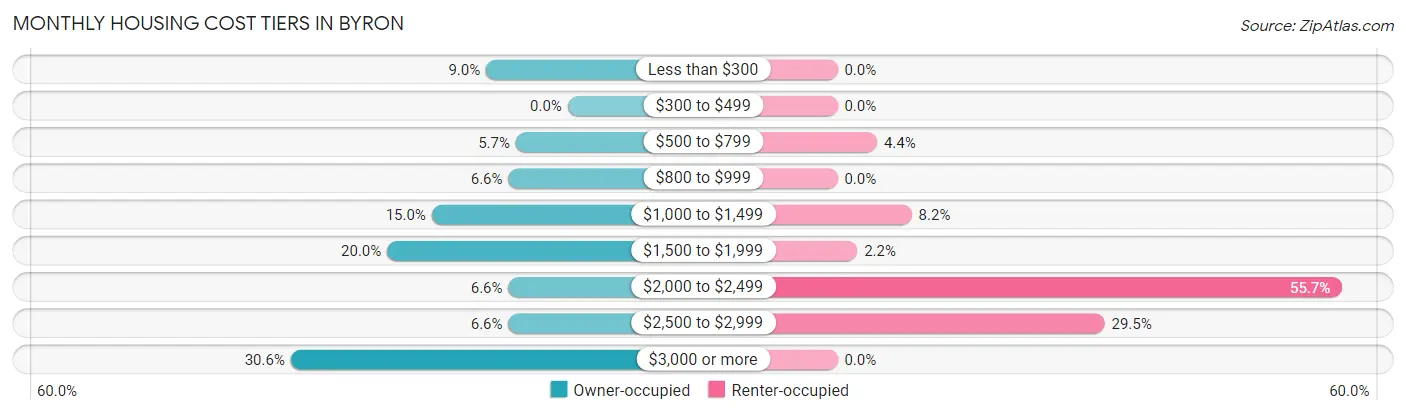
| Monthly Cost | Owner-occupied | Renter-occupied |
| Less than $300 | 33 (9.0%) | 0 (0.0%) |
| $300 to $499 | 0 (0.0%) | 0 (0.0%) |
| $500 to $799 | 21 (5.7%) | 8 (4.4%) |
| $800 to $999 | 24 (6.6%) | 0 (0.0%) |
| $1,000 to $1,499 | 55 (15.0%) | 15 (8.2%) |
| $1,500 to $1,999 | 73 (20.0%) | 4 (2.2%) |
| $2,000 to $2,499 | 24 (6.6%) | 102 (55.7%) |
| $2,500 to $2,999 | 24 (6.6%) | 54 (29.5%) |
| $3,000 or more | 112 (30.6%) | 0 (0.0%) |
| Total | 366 (100.0%) | 183 (100.0%) |
Physical Housing Characteristics in Byron
Housing Structures in Byron
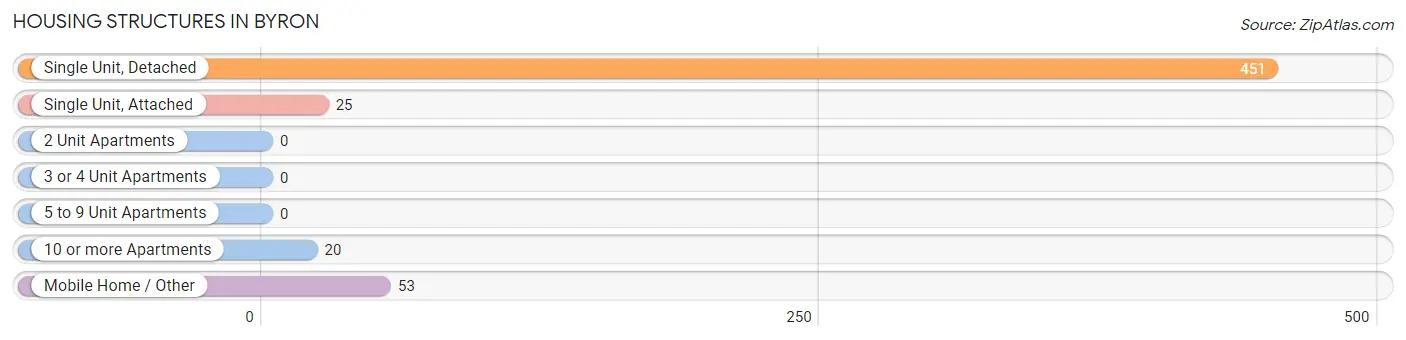
| Structure Type | # Housing Units | % Housing Units |
| Single Unit, Detached | 451 | 82.2% |
| Single Unit, Attached | 25 | 4.5% |
| 2 Unit Apartments | 0 | 0.0% |
| 3 or 4 Unit Apartments | 0 | 0.0% |
| 5 to 9 Unit Apartments | 0 | 0.0% |
| 10 or more Apartments | 20 | 3.6% |
| Mobile Home / Other | 53 | 9.7% |
| Total | 549 | 100.0% |
Housing Structures by Occupancy in Byron
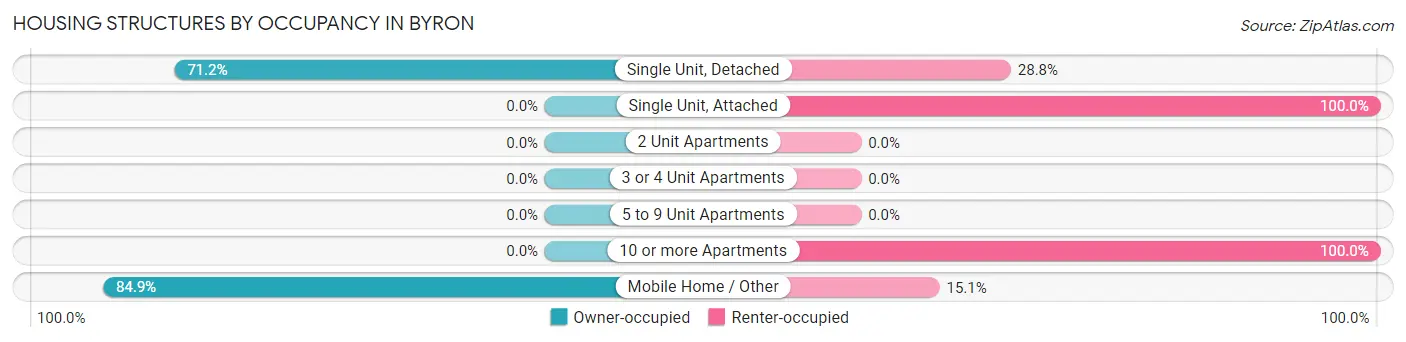
| Structure Type | Owner-occupied | Renter-occupied |
| Single Unit, Detached | 321 (71.2%) | 130 (28.8%) |
| Single Unit, Attached | 0 (0.0%) | 25 (100.0%) |
| 2 Unit Apartments | 0 (0.0%) | 0 (0.0%) |
| 3 or 4 Unit Apartments | 0 (0.0%) | 0 (0.0%) |
| 5 to 9 Unit Apartments | 0 (0.0%) | 0 (0.0%) |
| 10 or more Apartments | 0 (0.0%) | 20 (100.0%) |
| Mobile Home / Other | 45 (84.9%) | 8 (15.1%) |
| Total | 366 (66.7%) | 183 (33.3%) |
Housing Structures by Number of Rooms in Byron
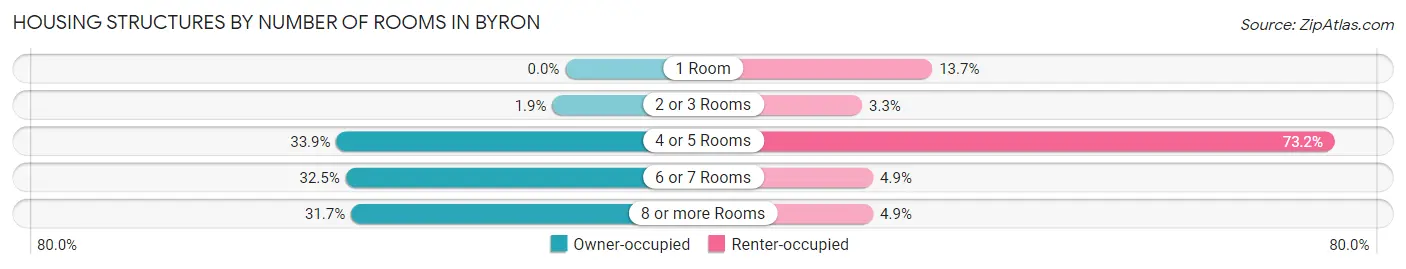
| Number of Rooms | Owner-occupied | Renter-occupied |
| 1 Room | 0 (0.0%) | 25 (13.7%) |
| 2 or 3 Rooms | 7 (1.9%) | 6 (3.3%) |
| 4 or 5 Rooms | 124 (33.9%) | 134 (73.2%) |
| 6 or 7 Rooms | 119 (32.5%) | 9 (4.9%) |
| 8 or more Rooms | 116 (31.7%) | 9 (4.9%) |
| Total | 366 (100.0%) | 183 (100.0%) |
Housing Structure by Heating Type in Byron
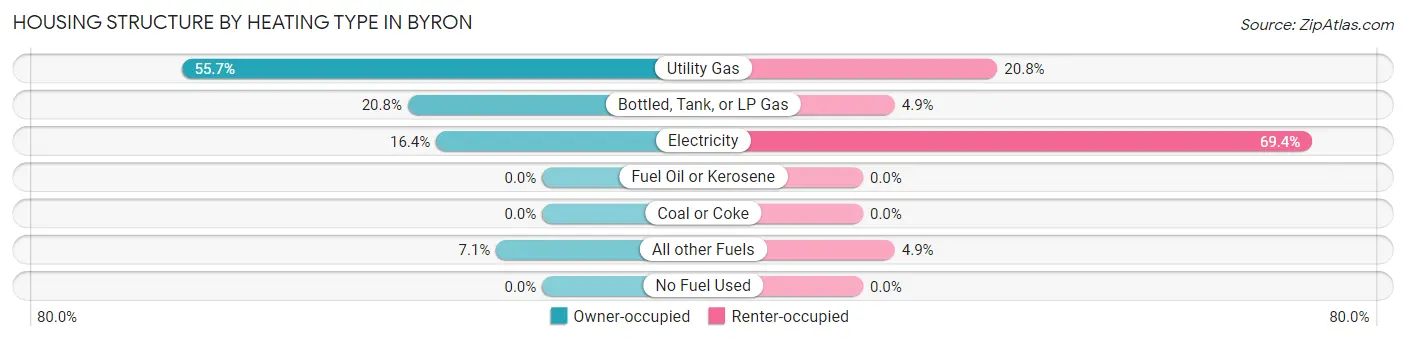
| Heating Type | Owner-occupied | Renter-occupied |
| Utility Gas | 204 (55.7%) | 38 (20.8%) |
| Bottled, Tank, or LP Gas | 76 (20.8%) | 9 (4.9%) |
| Electricity | 60 (16.4%) | 127 (69.4%) |
| Fuel Oil or Kerosene | 0 (0.0%) | 0 (0.0%) |
| Coal or Coke | 0 (0.0%) | 0 (0.0%) |
| All other Fuels | 26 (7.1%) | 9 (4.9%) |
| No Fuel Used | 0 (0.0%) | 0 (0.0%) |
| Total | 366 (100.0%) | 183 (100.0%) |
Household Vehicle Usage in Byron
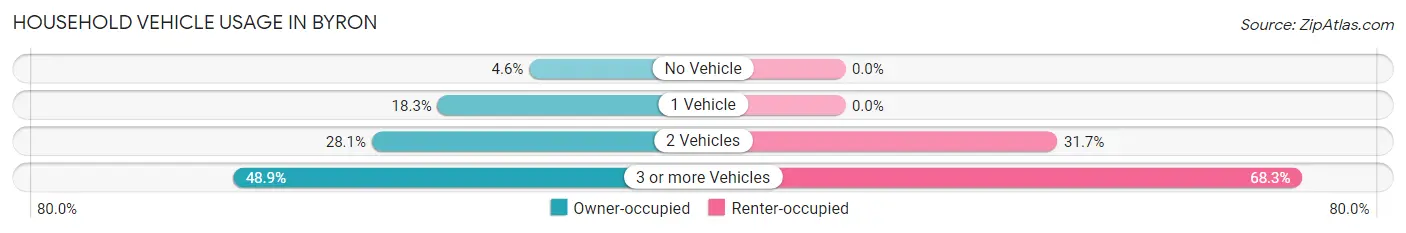
| Vehicles per Household | Owner-occupied | Renter-occupied |
| No Vehicle | 17 (4.6%) | 0 (0.0%) |
| 1 Vehicle | 67 (18.3%) | 0 (0.0%) |
| 2 Vehicles | 103 (28.1%) | 58 (31.7%) |
| 3 or more Vehicles | 179 (48.9%) | 125 (68.3%) |
| Total | 366 (100.0%) | 183 (100.0%) |
Real Estate & Mortgages in Byron
Real Estate and Mortgage Overview in Byron
| Characteristic | Without Mortgage | With Mortgage |
| Housing Units | 156 | 210 |
| Median Property Value | $613,600 | $1,055,600 |
| Median Household Income | $50,000 | $87 |
| Monthly Housing Costs | $1,100 | $112 |
| Real Estate Taxes | - | - |
Property Value by Mortgage Status in Byron
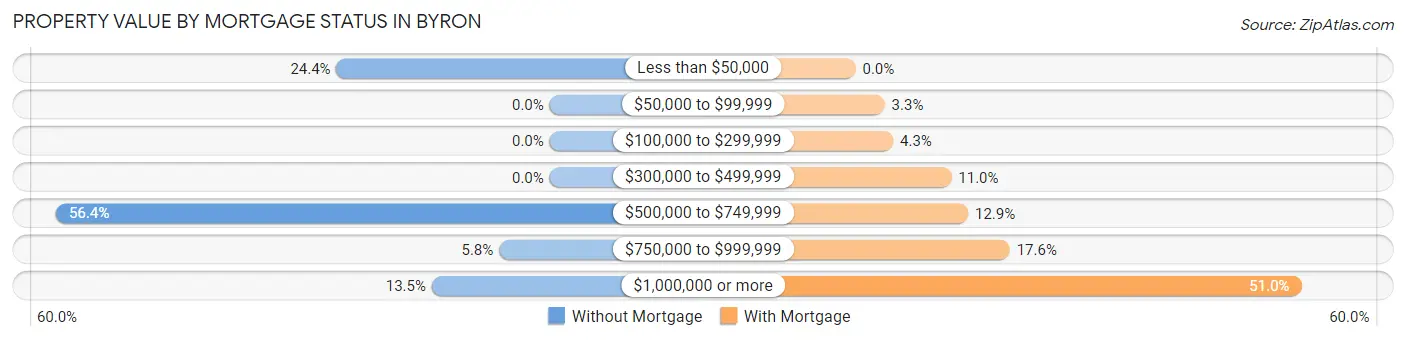
| Property Value | Without Mortgage | With Mortgage |
| Less than $50,000 | 38 (24.4%) | 0 (0.0%) |
| $50,000 to $99,999 | 0 (0.0%) | 7 (3.3%) |
| $100,000 to $299,999 | 0 (0.0%) | 9 (4.3%) |
| $300,000 to $499,999 | 0 (0.0%) | 23 (11.0%) |
| $500,000 to $749,999 | 88 (56.4%) | 27 (12.9%) |
| $750,000 to $999,999 | 9 (5.8%) | 37 (17.6%) |
| $1,000,000 or more | 21 (13.5%) | 107 (50.9%) |
| Total | 156 (100.0%) | 210 (100.0%) |
Household Income by Mortgage Status in Byron
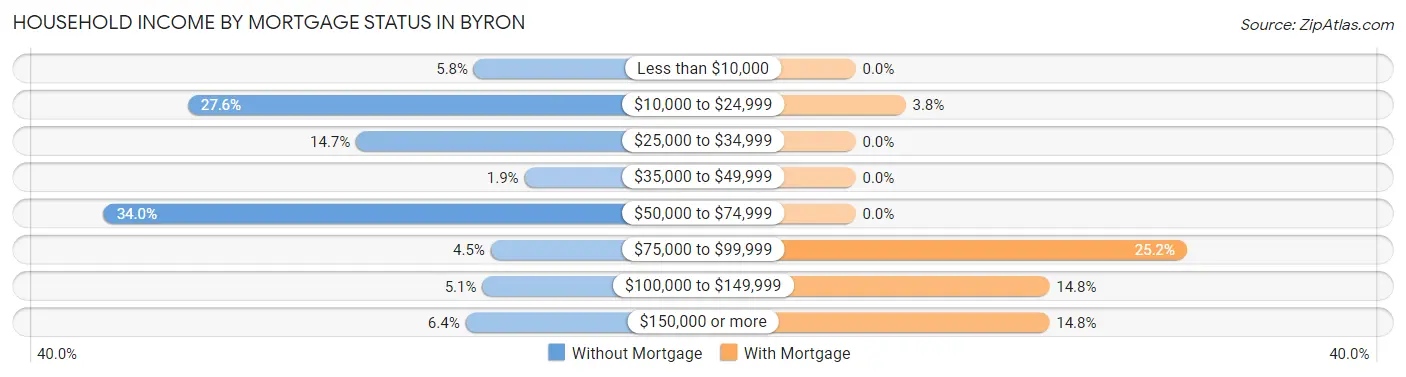
| Household Income | Without Mortgage | With Mortgage |
| Less than $10,000 | 9 (5.8%) | 0 (0.0%) |
| $10,000 to $24,999 | 43 (27.6%) | 8 (3.8%) |
| $25,000 to $34,999 | 23 (14.7%) | 0 (0.0%) |
| $35,000 to $49,999 | 3 (1.9%) | 0 (0.0%) |
| $50,000 to $74,999 | 53 (34.0%) | 0 (0.0%) |
| $75,000 to $99,999 | 7 (4.5%) | 53 (25.2%) |
| $100,000 to $149,999 | 8 (5.1%) | 31 (14.8%) |
| $150,000 or more | 10 (6.4%) | 31 (14.8%) |
| Total | 156 (100.0%) | 210 (100.0%) |
Property Value to Household Income Ratio in Byron
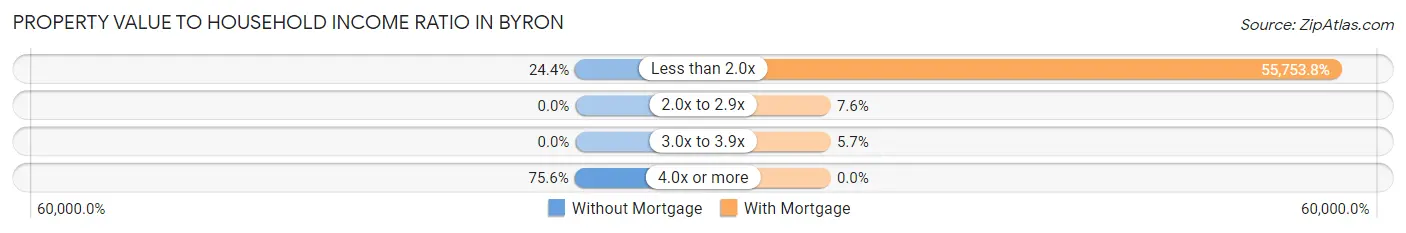
| Value-to-Income Ratio | Without Mortgage | With Mortgage |
| Less than 2.0x | 38 (24.4%) | 117,083 (55,753.8%) |
| 2.0x to 2.9x | 0 (0.0%) | 16 (7.6%) |
| 3.0x to 3.9x | 0 (0.0%) | 12 (5.7%) |
| 4.0x or more | 118 (75.6%) | 0 (0.0%) |
| Total | 156 (100.0%) | 210 (100.0%) |
Real Estate Taxes by Mortgage Status in Byron
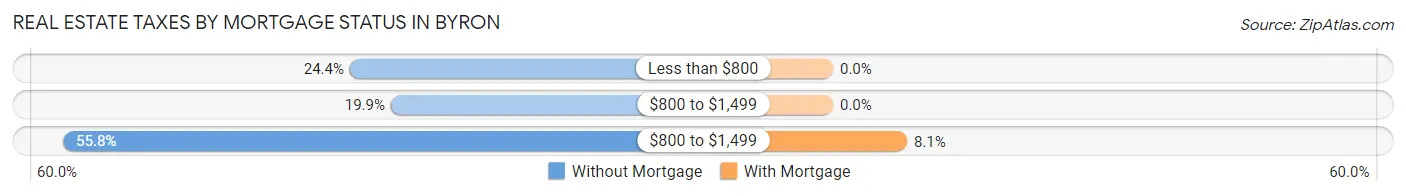
| Property Taxes | Without Mortgage | With Mortgage |
| Less than $800 | 38 (24.4%) | 0 (0.0%) |
| $800 to $1,499 | 31 (19.9%) | 0 (0.0%) |
| $800 to $1,499 | 87 (55.8%) | 17 (8.1%) |
| Total | 156 (100.0%) | 210 (100.0%) |
Health & Disability in Byron
Health Insurance Coverage by Age in Byron
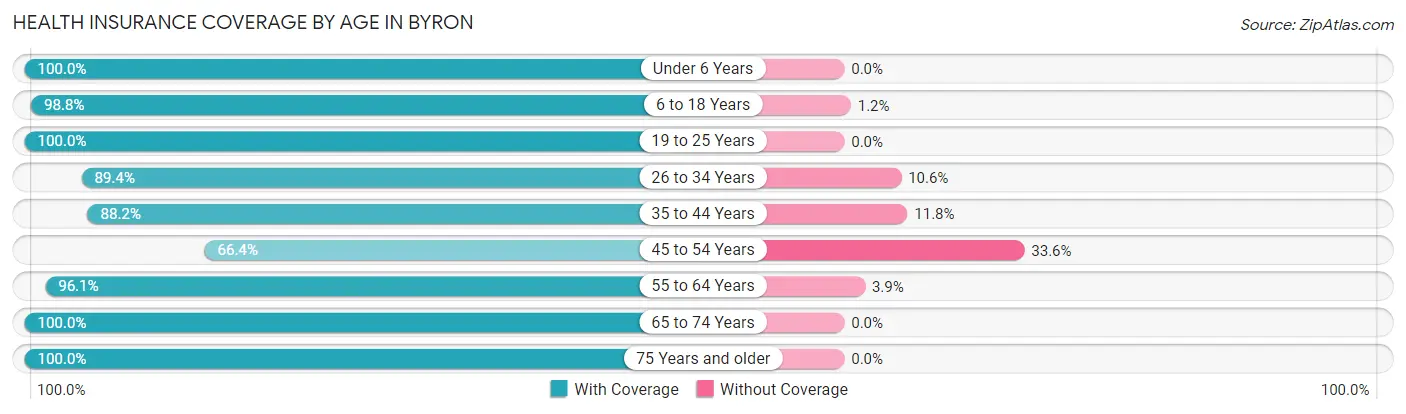
| Age Bracket | With Coverage | Without Coverage |
| Under 6 Years | 69 (100.0%) | 0 (0.0%) |
| 6 to 18 Years | 327 (98.8%) | 4 (1.2%) |
| 19 to 25 Years | 376 (100.0%) | 0 (0.0%) |
| 26 to 34 Years | 118 (89.4%) | 14 (10.6%) |
| 35 to 44 Years | 60 (88.2%) | 8 (11.8%) |
| 45 to 54 Years | 178 (66.4%) | 90 (33.6%) |
| 55 to 64 Years | 324 (96.1%) | 13 (3.9%) |
| 65 to 74 Years | 203 (100.0%) | 0 (0.0%) |
| 75 Years and older | 121 (100.0%) | 0 (0.0%) |
| Total | 1,776 (93.2%) | 129 (6.8%) |
Health Insurance Coverage by Citizenship Status in Byron
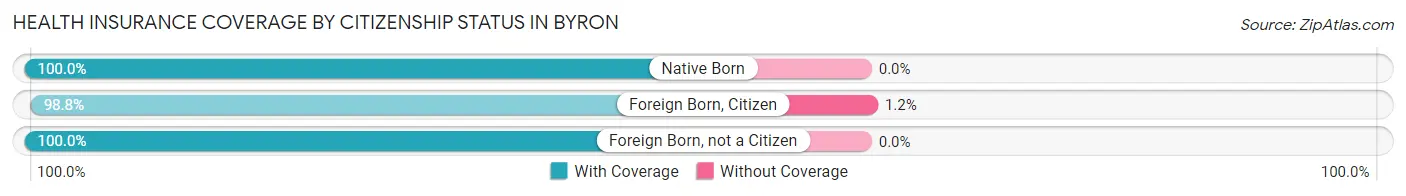
| Citizenship Status | With Coverage | Without Coverage |
| Native Born | 69 (100.0%) | 0 (0.0%) |
| Foreign Born, Citizen | 327 (98.8%) | 4 (1.2%) |
| Foreign Born, not a Citizen | 376 (100.0%) | 0 (0.0%) |
Health Insurance Coverage by Household Income in Byron
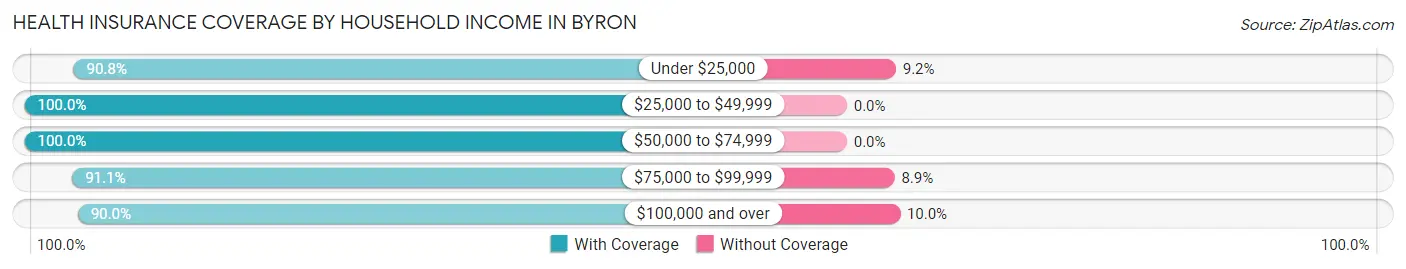
| Household Income | With Coverage | Without Coverage |
| Under $25,000 | 89 (90.8%) | 9 (9.2%) |
| $25,000 to $49,999 | 117 (100.0%) | 0 (0.0%) |
| $50,000 to $74,999 | 468 (100.0%) | 0 (0.0%) |
| $75,000 to $99,999 | 153 (91.1%) | 15 (8.9%) |
| $100,000 and over | 949 (90.0%) | 105 (10.0%) |
Public vs Private Health Insurance Coverage by Age in Byron
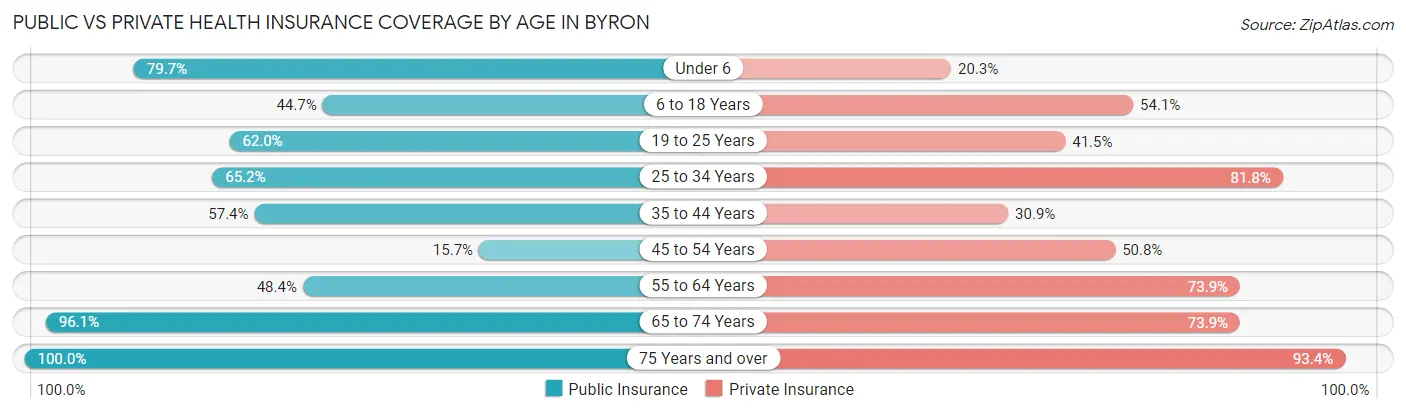
| Age Bracket | Public Insurance | Private Insurance |
| Under 6 | 55 (79.7%) | 14 (20.3%) |
| 6 to 18 Years | 148 (44.7%) | 179 (54.1%) |
| 19 to 25 Years | 233 (62.0%) | 156 (41.5%) |
| 25 to 34 Years | 86 (65.1%) | 108 (81.8%) |
| 35 to 44 Years | 39 (57.4%) | 21 (30.9%) |
| 45 to 54 Years | 42 (15.7%) | 136 (50.7%) |
| 55 to 64 Years | 163 (48.4%) | 249 (73.9%) |
| 65 to 74 Years | 195 (96.1%) | 150 (73.9%) |
| 75 Years and over | 121 (100.0%) | 113 (93.4%) |
| Total | 1,082 (56.8%) | 1,126 (59.1%) |
Disability Status by Sex by Age in Byron
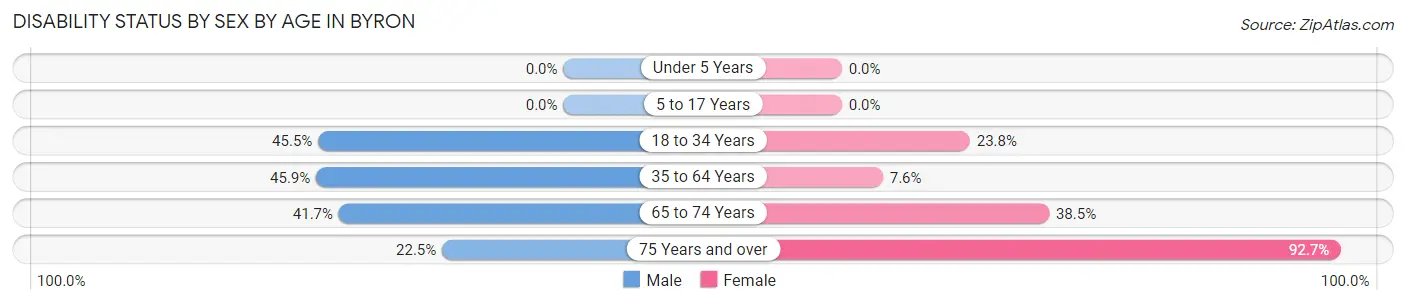
| Age Bracket | Male | Female |
| Under 5 Years | 0 (0.0%) | 0 (0.0%) |
| 5 to 17 Years | 0 (0.0%) | 0 (0.0%) |
| 18 to 34 Years | 76 (45.5%) | 86 (23.8%) |
| 35 to 64 Years | 134 (45.9%) | 29 (7.6%) |
| 65 to 74 Years | 25 (41.7%) | 55 (38.5%) |
| 75 Years and over | 18 (22.5%) | 38 (92.7%) |
Disability Class by Sex by Age in Byron
Disability Class: Hearing Difficulty
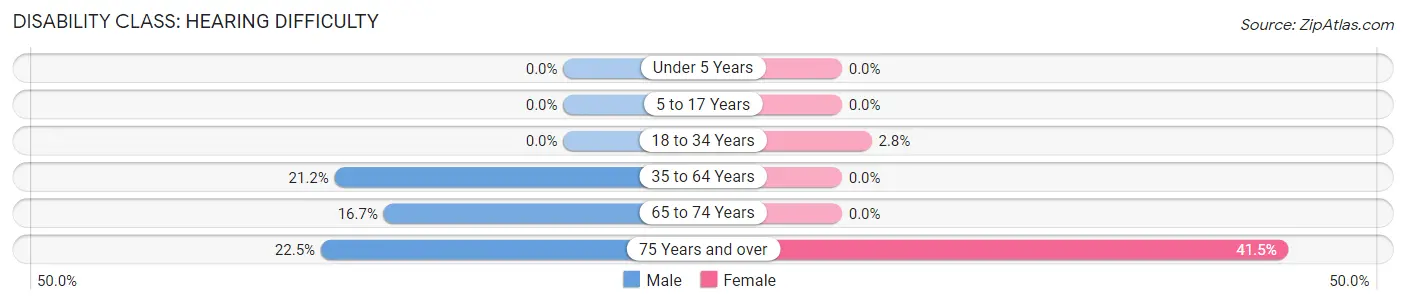
| Age Bracket | Male | Female |
| Under 5 Years | 0 (0.0%) | 0 (0.0%) |
| 5 to 17 Years | 0 (0.0%) | 0 (0.0%) |
| 18 to 34 Years | 0 (0.0%) | 10 (2.8%) |
| 35 to 64 Years | 62 (21.2%) | 0 (0.0%) |
| 65 to 74 Years | 10 (16.7%) | 0 (0.0%) |
| 75 Years and over | 18 (22.5%) | 17 (41.5%) |
Disability Class: Vision Difficulty
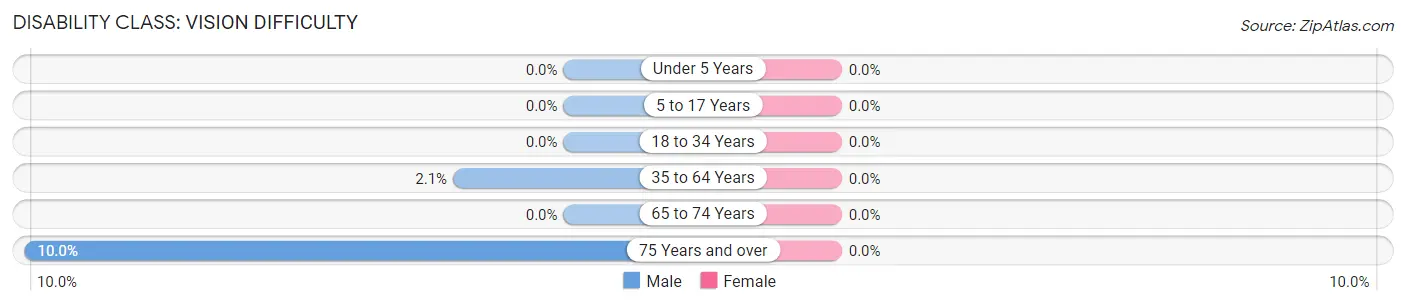
| Age Bracket | Male | Female |
| Under 5 Years | 0 (0.0%) | 0 (0.0%) |
| 5 to 17 Years | 0 (0.0%) | 0 (0.0%) |
| 18 to 34 Years | 0 (0.0%) | 0 (0.0%) |
| 35 to 64 Years | 6 (2.1%) | 0 (0.0%) |
| 65 to 74 Years | 0 (0.0%) | 0 (0.0%) |
| 75 Years and over | 8 (10.0%) | 0 (0.0%) |
Disability Class: Cognitive Difficulty
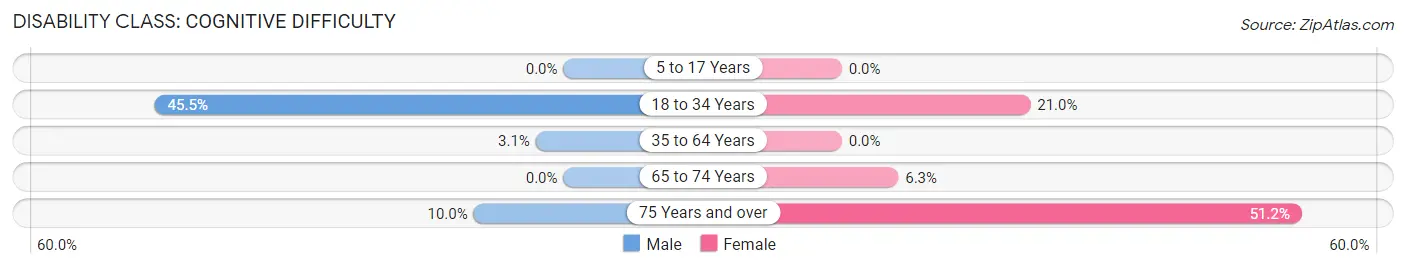
| Age Bracket | Male | Female |
| 5 to 17 Years | 0 (0.0%) | 0 (0.0%) |
| 18 to 34 Years | 76 (45.5%) | 76 (21.0%) |
| 35 to 64 Years | 9 (3.1%) | 0 (0.0%) |
| 65 to 74 Years | 0 (0.0%) | 9 (6.3%) |
| 75 Years and over | 8 (10.0%) | 21 (51.2%) |
Disability Class: Ambulatory Difficulty
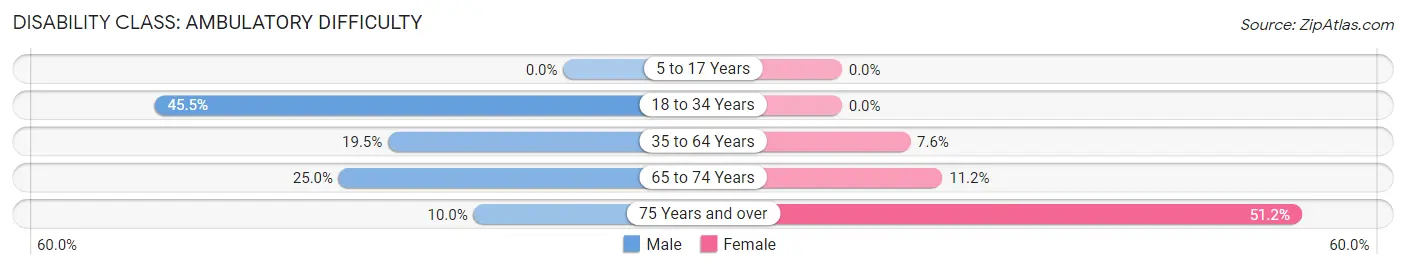
| Age Bracket | Male | Female |
| 5 to 17 Years | 0 (0.0%) | 0 (0.0%) |
| 18 to 34 Years | 76 (45.5%) | 0 (0.0%) |
| 35 to 64 Years | 57 (19.5%) | 29 (7.6%) |
| 65 to 74 Years | 15 (25.0%) | 16 (11.2%) |
| 75 Years and over | 8 (10.0%) | 21 (51.2%) |
Disability Class: Self-Care Difficulty
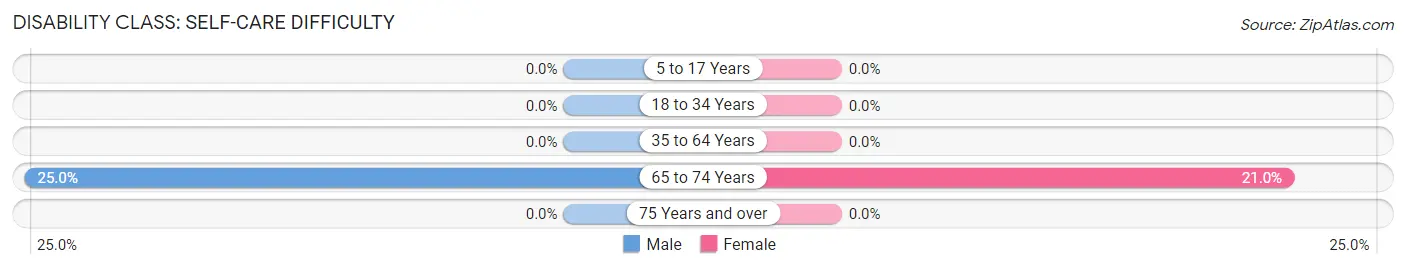
| Age Bracket | Male | Female |
| 5 to 17 Years | 0 (0.0%) | 0 (0.0%) |
| 18 to 34 Years | 0 (0.0%) | 0 (0.0%) |
| 35 to 64 Years | 0 (0.0%) | 0 (0.0%) |
| 65 to 74 Years | 15 (25.0%) | 30 (21.0%) |
| 75 Years and over | 0 (0.0%) | 0 (0.0%) |
Technology Access in Byron
Computing Device Access in Byron
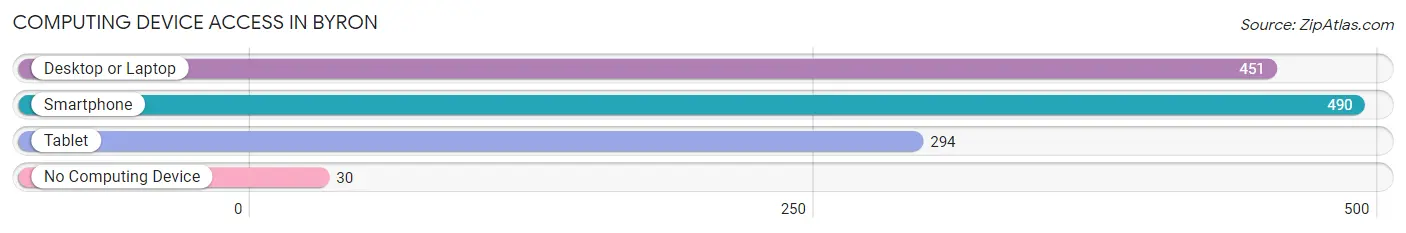
| Device Type | # Households | % Households |
| Desktop or Laptop | 451 | 82.2% |
| Smartphone | 490 | 89.2% |
| Tablet | 294 | 53.5% |
| No Computing Device | 30 | 5.5% |
| Total | 549 | 100.0% |
Internet Access in Byron
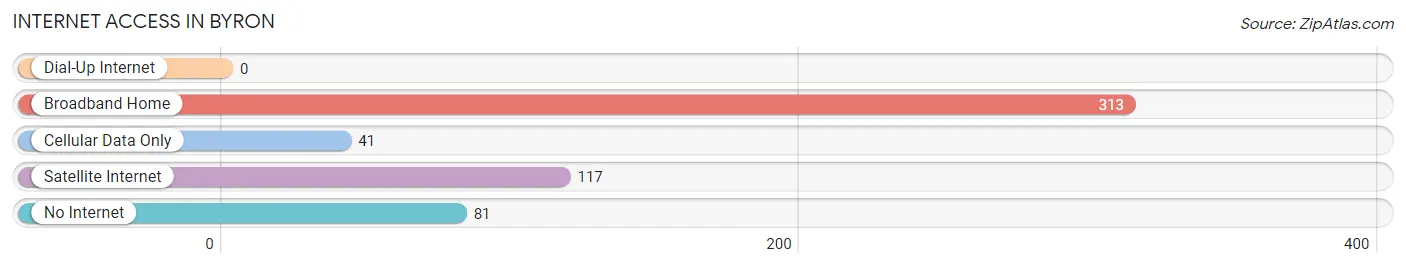
| Internet Type | # Households | % Households |
| Dial-Up Internet | 0 | 0.0% |
| Broadband Home | 313 | 57.0% |
| Cellular Data Only | 41 | 7.5% |
| Satellite Internet | 117 | 21.3% |
| No Internet | 81 | 14.7% |
| Total | 549 | 100.0% |
Byron Summary
Byron, California is a small unincorporated community located in Contra Costa County, California. It is situated in the East Bay region of the San Francisco Bay Area, approximately 25 miles east of Oakland and 40 miles northeast of San Francisco. The population of Byron was estimated to be 1,845 in 2019.
History
Byron was founded in 1856 by William B. Byron, a former miner who had come to California during the Gold Rush. He purchased a large tract of land in the area and began to develop it for agricultural purposes. The town was named after him and was incorporated in 1876.
Byron was a small agricultural community for many years, with its main crops being wheat, barley, and oats. In the early 1900s, the town began to grow as a result of the construction of the Central Pacific Railroad. This allowed for the transportation of goods and people to and from the area, which helped to spur economic growth.
Byron was also home to a number of businesses, including a blacksmith shop, a general store, a hotel, and a post office. The town also had a school, which was established in 1876.
Geography
Byron is located in the East Bay region of the San Francisco Bay Area. It is situated in Contra Costa County, approximately 25 miles east of Oakland and 40 miles northeast of San Francisco. The town is located in the Diablo Range, which is a mountain range that runs along the eastern side of the San Francisco Bay.
The town of Byron is situated at an elevation of approximately 500 feet above sea level. The climate in the area is generally mild, with temperatures ranging from the mid-50s to the mid-80s throughout the year.
Economy
Byron’s economy is largely based on agriculture. The town is home to a number of farms, which produce a variety of crops, including wheat, barley, oats, and hay. In addition, the town is home to a number of wineries, which produce a variety of wines.
The town is also home to a number of businesses, including a gas station, a grocery store, a hardware store, and a restaurant. In addition, the town is home to a number of small businesses, such as a barber shop, a beauty salon, and a florist.
Demographics
As of 2019, the population of Byron was estimated to be 1,845. The racial makeup of the town was 79.3% White, 11.2% Hispanic or Latino, 4.2% Asian, and 2.3% African American. The median household income in the town was $76,944, and the median home value was $541,000.
Conclusion
Byron, California is a small unincorporated community located in Contra Costa County, California. It is situated in the East Bay region of the San Francisco Bay Area, approximately 25 miles east of Oakland and 40 miles northeast of San Francisco. The population of Byron was estimated to be 1,845 in 2019. The town’s economy is largely based on agriculture, with a number of farms producing a variety of crops. In addition, the town is home to a number of businesses, including a gas station, a grocery store, a hardware store, and a restaurant. The racial makeup of the town was 79.3% White, 11.2% Hispanic or Latino, 4.2% Asian, and 2.3% African American. The median household income in the town was $76,944, and the median home value was $541,000.
Common Questions
What is Per Capita Income in Byron?
Per Capita income in Byron is $30,529.
What is the Median Family Income in Byron?
Median Family Income in Byron is $88,281.
What is the Median Household income in Byron?
Median Household Income in Byron is $79,196.
What is Income or Wage Gap in Byron?
Income or Wage Gap in Byron is 50.7%.
Women in Byron earn 49.3 cents for every dollar earned by a man.
What is Inequality or Gini Index in Byron?
Inequality or Gini Index in Byron is 0.38.
What is the Total Population of Byron?
Total Population of Byron is 1,918.
What is the Total Male Population of Byron?
Total Male Population of Byron is 888.
What is the Total Female Population of Byron?
Total Female Population of Byron is 1,030.
What is the Ratio of Males per 100 Females in Byron?
There are 86.21 Males per 100 Females in Byron.
What is the Ratio of Females per 100 Males in Byron?
There are 115.99 Females per 100 Males in Byron.
What is the Median Population Age in Byron?
Median Population Age in Byron is 43.7 Years.
What is the Average Family Size in Byron
Average Family Size in Byron is 3.7 People.
What is the Average Household Size in Byron
Average Household Size in Byron is 3.5 People.
How Large is the Labor Force in Byron?
There are 796 People in the Labor Forcein in Byron.
What is the Percentage of People in the Labor Force in Byron?
48.8% of People are in the Labor Force in Byron.
What is the Unemployment Rate in Byron?
Unemployment Rate in Byron is 8.5%.