Burney, CA Map & Demographics
Burney Map
Burney Overview
$30,560
PER CAPITA INCOME
$73,424
AVG FAMILY INCOME
$64,655
AVG HOUSEHOLD INCOME
0.40
INEQUALITY / GINI INDEX
3,186
TOTAL POPULATION
1,477
MALE POPULATION
1,709
FEMALE POPULATION
86.42
MALES / 100 FEMALES
115.71
FEMALES / 100 MALES
41.1
MEDIAN AGE
3.4
AVG FAMILY SIZE
2.6
AVG HOUSEHOLD SIZE
1,064
LABOR FORCE [ PEOPLE ]
45.5%
PERCENT IN LABOR FORCE
14.1%
UNEMPLOYMENT RATE
Burney Zip Codes
Burney Area Codes
Income in Burney
Income Overview in Burney
Per Capita Income in Burney is $30,560, while median incomes of families and households are $73,424 and $64,655 respectively.
| Characteristic | Number | Measure |
| Per Capita Income | 3,186 | $30,560 |
| Median Family Income | 783 | $73,424 |
| Mean Family Income | 783 | $91,513 |
| Median Household Income | 1,191 | $64,655 |
| Mean Household Income | 1,191 | $78,448 |
| Income Deficit | 783 | $0 |
| Wage / Income Gap (%) | 3,186 | 0.00% |
| Wage / Income Gap ($) | 3,186 | 100.00¢ per $1 |
| Gini / Inequality Index | 3,186 | 0.40 |
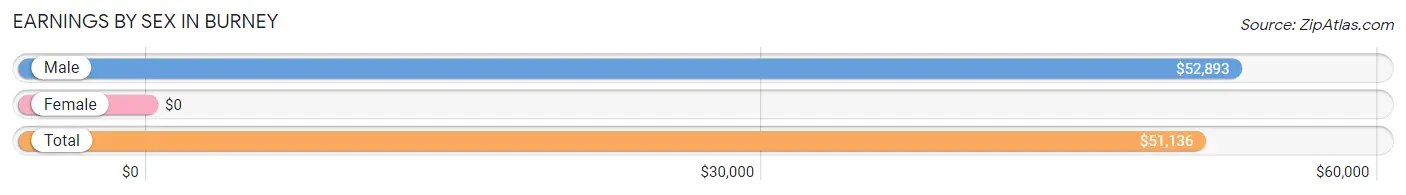
Earnings by Sex in Burney
| Sex | Number | Average Earnings |
| Male | 625 (55.1%) | $52,893 |
| Female | 509 (44.9%) | $0 |
| Total | 1,134 (100.0%) | $51,136 |
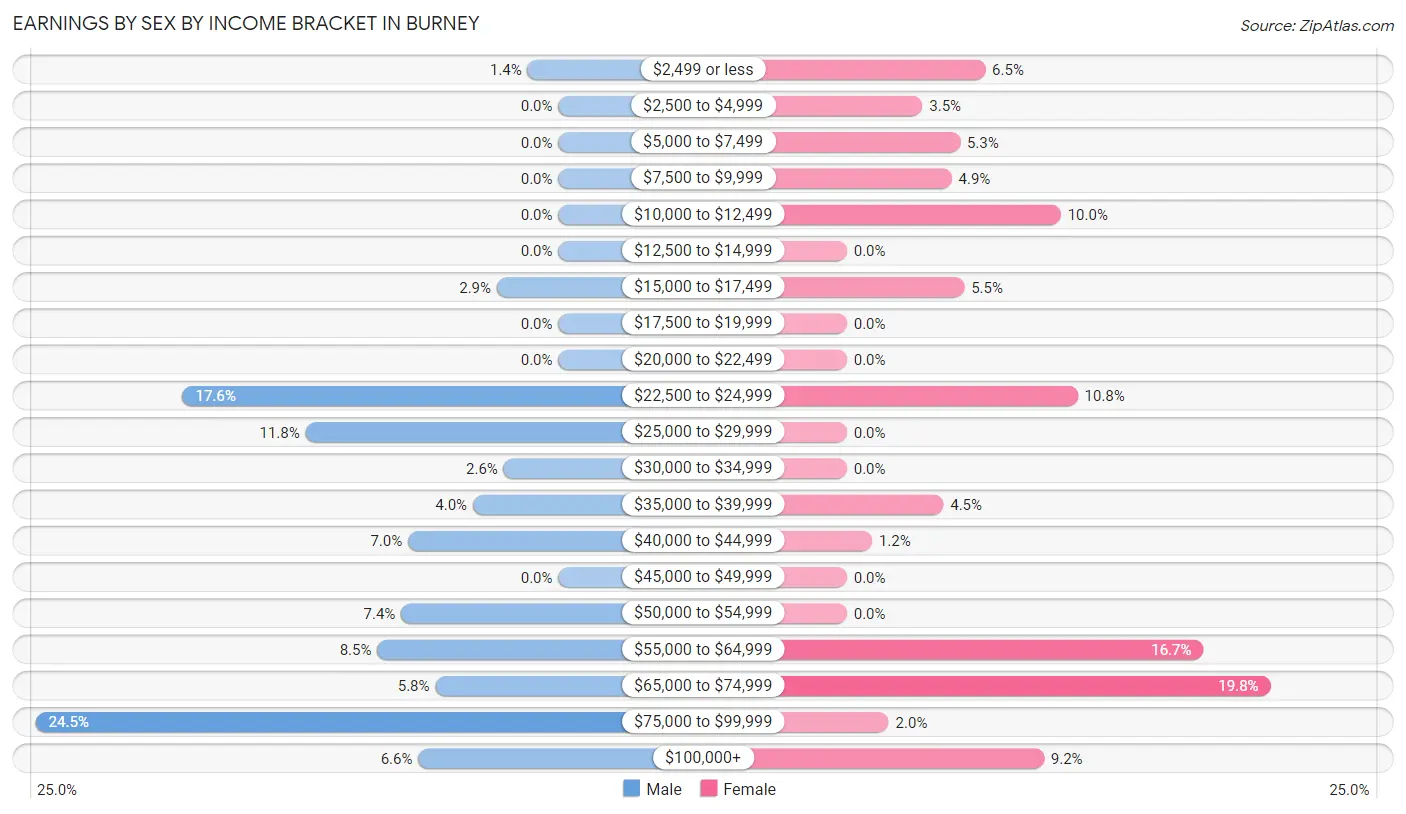
Earnings by Sex by Income Bracket in Burney
The most common earnings brackets in Burney are $75,000 to $99,999 for men (153 | 24.5%) and $65,000 to $74,999 for women (101 | 19.8%).
| Income | Male | Female |
| $2,499 or less | 9 (1.4%) | 33 (6.5%) |
| $2,500 to $4,999 | 0 (0.0%) | 18 (3.5%) |
| $5,000 to $7,499 | 0 (0.0%) | 27 (5.3%) |
| $7,500 to $9,999 | 0 (0.0%) | 25 (4.9%) |
| $10,000 to $12,499 | 0 (0.0%) | 51 (10.0%) |
| $12,500 to $14,999 | 0 (0.0%) | 0 (0.0%) |
| $15,000 to $17,499 | 18 (2.9%) | 28 (5.5%) |
| $17,500 to $19,999 | 0 (0.0%) | 0 (0.0%) |
| $20,000 to $22,499 | 0 (0.0%) | 0 (0.0%) |
| $22,500 to $24,999 | 110 (17.6%) | 55 (10.8%) |
| $25,000 to $29,999 | 74 (11.8%) | 0 (0.0%) |
| $30,000 to $34,999 | 16 (2.6%) | 0 (0.0%) |
| $35,000 to $39,999 | 25 (4.0%) | 23 (4.5%) |
| $40,000 to $44,999 | 44 (7.0%) | 6 (1.2%) |
| $45,000 to $49,999 | 0 (0.0%) | 0 (0.0%) |
| $50,000 to $54,999 | 46 (7.4%) | 0 (0.0%) |
| $55,000 to $64,999 | 53 (8.5%) | 85 (16.7%) |
| $65,000 to $74,999 | 36 (5.8%) | 101 (19.8%) |
| $75,000 to $99,999 | 153 (24.5%) | 10 (2.0%) |
| $100,000+ | 41 (6.6%) | 47 (9.2%) |
| Total | 625 (100.0%) | 509 (100.0%) |
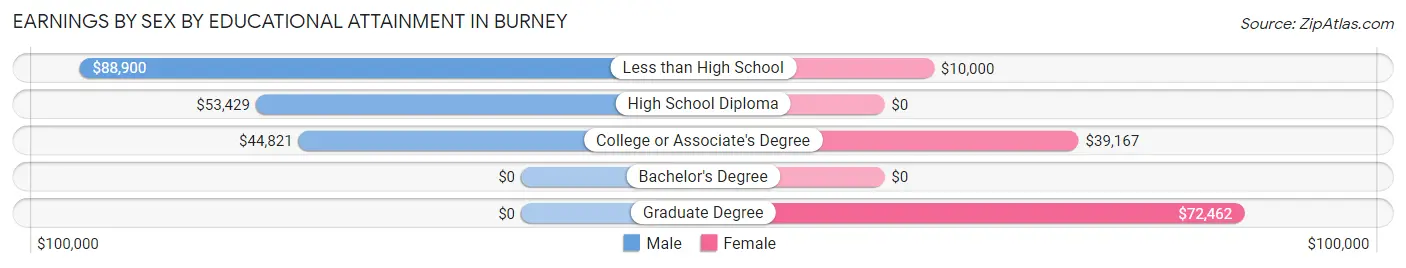
Earnings by Sex by Educational Attainment in Burney
Average earnings in Burney are $58,250 for men and $56,321 for women, a difference of 3.3%. Men with an educational attainment of less than high school enjoy the highest average annual earnings of $88,900, while those with college or associate's degree education earn the least with $44,821. Women with an educational attainment of graduate degree earn the most with the average annual earnings of $72,462, while those with less than high school education have the smallest earnings of $10,000.
| Educational Attainment | Male Income | Female Income |
| Less than High School | $88,900 | $10,000 |
| High School Diploma | $53,429 | $0 |
| College or Associate's Degree | $44,821 | $39,167 |
| Bachelor's Degree | - | - |
| Graduate Degree | - | - |
| Total | $58,250 | $56,321 |
Family Income in Burney
Family Income Brackets in Burney
According to the Burney family income data, there are 240 families falling into the $50,000 to $74,999 income range, which is the most common income bracket and makes up 30.6% of all families. Conversely, the $10,000 to $14,999 income bracket is the least frequent group with only 6 families (0.8%) belonging to this category.
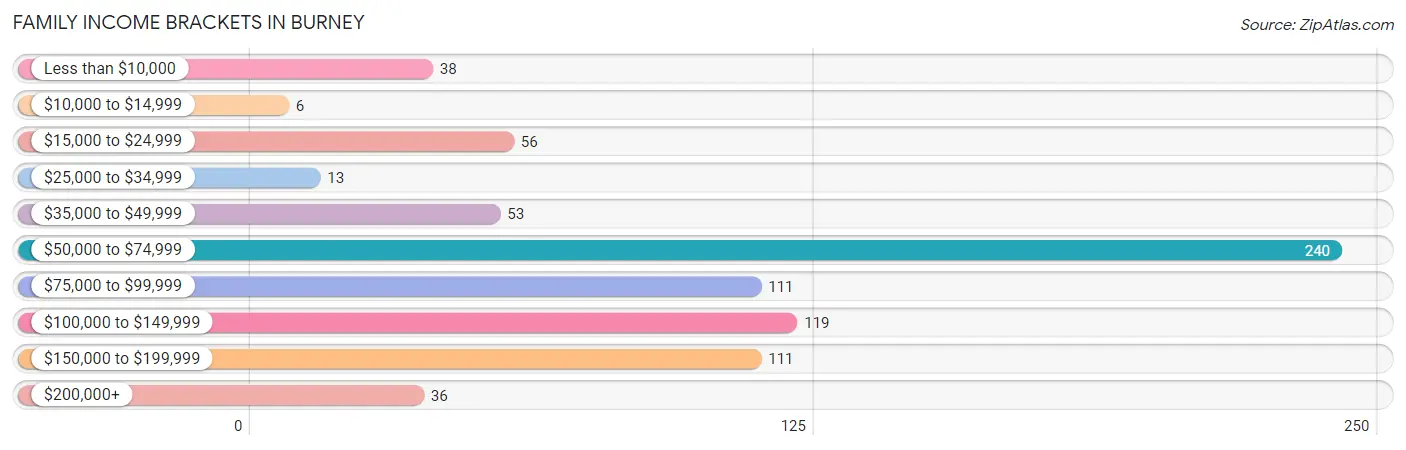
| Income Bracket | # Families | % Families |
| Less than $10,000 | 38 | 4.9% |
| $10,000 to $14,999 | 6 | 0.8% |
| $15,000 to $24,999 | 56 | 7.2% |
| $25,000 to $34,999 | 13 | 1.7% |
| $35,000 to $49,999 | 53 | 6.8% |
| $50,000 to $74,999 | 240 | 30.7% |
| $75,000 to $99,999 | 111 | 14.2% |
| $100,000 to $149,999 | 119 | 15.2% |
| $150,000 to $199,999 | 111 | 14.2% |
| $200,000+ | 36 | 4.6% |
Family Income by Famaliy Size in Burney
4-person families (115 | 14.7%) account for the highest median family income in Burney with $173,073 per family, while 4-person families (115 | 14.7%) have the highest median income of $43,268 per family member.
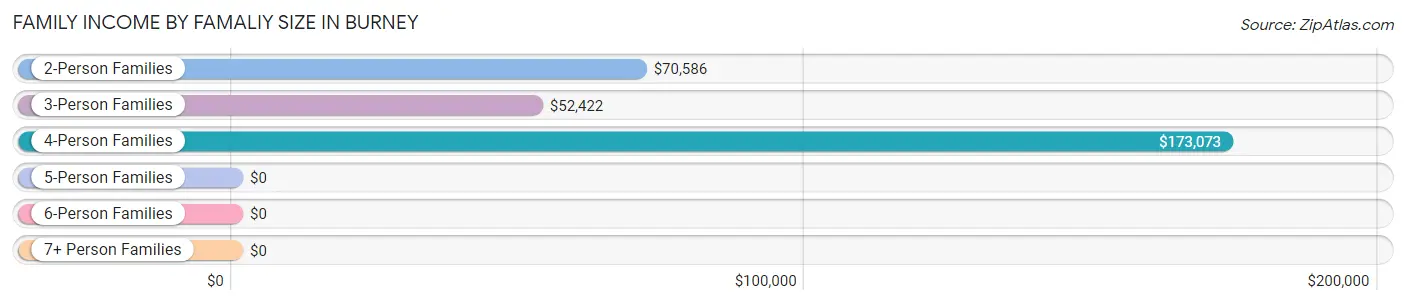
| Income Bracket | # Families | Median Income |
| 2-Person Families | 357 (45.6%) | $70,586 |
| 3-Person Families | 191 (24.4%) | $52,422 |
| 4-Person Families | 115 (14.7%) | $173,073 |
| 5-Person Families | 68 (8.7%) | $0 |
| 6-Person Families | 40 (5.1%) | $0 |
| 7+ Person Families | 12 (1.5%) | $0 |
| Total | 783 (100.0%) | $73,424 |
Family Income by Number of Earners in Burney
The median family income in Burney is $73,424, with families comprising 3+ earners (56) having the highest median family income of $172,813, while families with no earners (282) have the lowest median family income of $63,452, accounting for 7.1% and 36.0% of families, respectively.
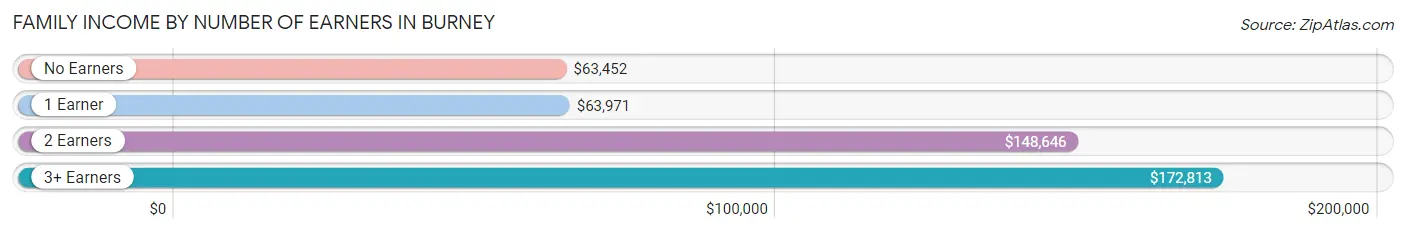
| Number of Earners | # Families | Median Income |
| No Earners | 282 (36.0%) | $63,452 |
| 1 Earner | 234 (29.9%) | $63,971 |
| 2 Earners | 211 (27.0%) | $148,646 |
| 3+ Earners | 56 (7.1%) | $172,813 |
| Total | 783 (100.0%) | $73,424 |
Household Income in Burney
Household Income Brackets in Burney
With 278 households falling in the category, the $50,000 to $74,999 income range is the most frequent in Burney, accounting for 23.3% of all households. In contrast, only 36 households (3.0%) fall into the less than $10,000 income bracket, making it the least populous group.
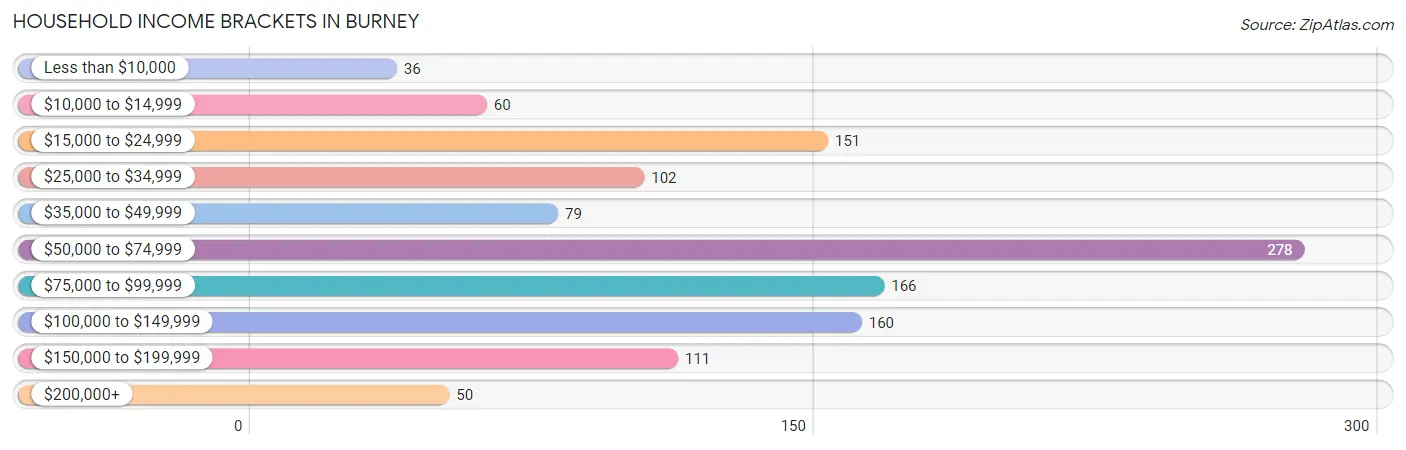
| Income Bracket | # Households | % Households |
| Less than $10,000 | 36 | 3.0% |
| $10,000 to $14,999 | 60 | 5.0% |
| $15,000 to $24,999 | 151 | 12.7% |
| $25,000 to $34,999 | 102 | 8.6% |
| $35,000 to $49,999 | 79 | 6.6% |
| $50,000 to $74,999 | 278 | 23.3% |
| $75,000 to $99,999 | 166 | 13.9% |
| $100,000 to $149,999 | 160 | 13.4% |
| $150,000 to $199,999 | 111 | 9.3% |
| $200,000+ | 50 | 4.2% |
Household Income by Householder Age in Burney
The median household income in Burney is $64,655, with the highest median household income of $85,455 found in the 45 to 64 years age bracket for the primary householder. A total of 390 households (32.8%) fall into this category. Meanwhile, the 15 to 24 years age bracket for the primary householder has the lowest median household income of $0, with 30 households (2.5%) in this group.
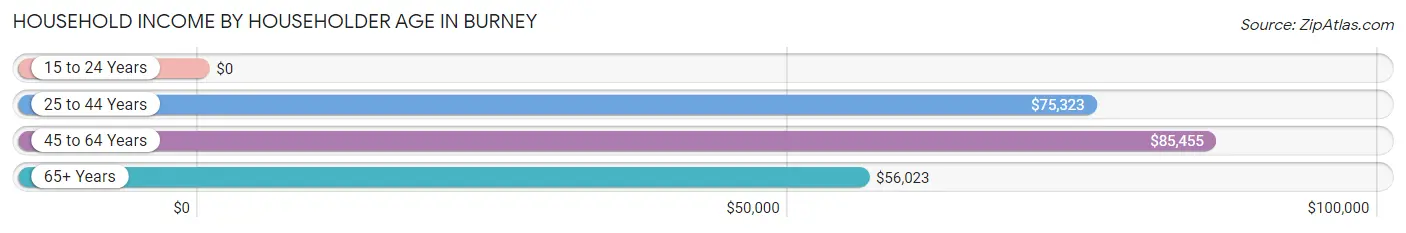
| Income Bracket | # Households | Median Income |
| 15 to 24 Years | 30 (2.5%) | $0 |
| 25 to 44 Years | 286 (24.0%) | $75,323 |
| 45 to 64 Years | 390 (32.8%) | $85,455 |
| 65+ Years | 485 (40.7%) | $56,023 |
| Total | 1,191 (100.0%) | $64,655 |
Poverty in Burney
Income Below Poverty by Sex and Age in Burney
With 8.5% poverty level for males and 21.8% for females among the residents of Burney, 12 to 14 year old males and 25 to 34 year old females are the most vulnerable to poverty, with 34 males (46.6%) and 131 females (59.3%) in their respective age groups living below the poverty level.
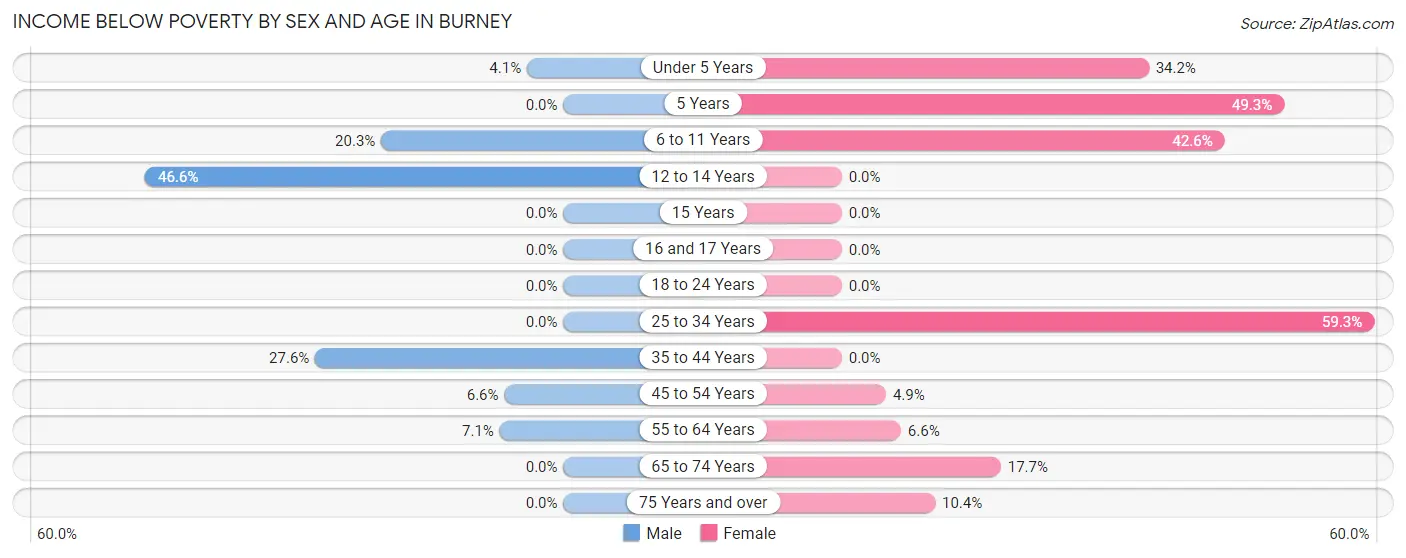
| Age Bracket | Male | Female |
| Under 5 Years | 6 (4.1%) | 67 (34.2%) |
| 5 Years | 0 (0.0%) | 33 (49.2%) |
| 6 to 11 Years | 28 (20.3%) | 52 (42.6%) |
| 12 to 14 Years | 34 (46.6%) | 0 (0.0%) |
| 15 Years | 0 (0.0%) | 0 (0.0%) |
| 16 and 17 Years | 0 (0.0%) | 0 (0.0%) |
| 18 to 24 Years | 0 (0.0%) | 0 (0.0%) |
| 25 to 34 Years | 0 (0.0%) | 131 (59.3%) |
| 35 to 44 Years | 34 (27.6%) | 0 (0.0%) |
| 45 to 54 Years | 14 (6.6%) | 9 (4.9%) |
| 55 to 64 Years | 9 (7.1%) | 10 (6.6%) |
| 65 to 74 Years | 0 (0.0%) | 48 (17.7%) |
| 75 Years and over | 0 (0.0%) | 22 (10.4%) |
| Total | 125 (8.5%) | 372 (21.8%) |
Income Above Poverty by Sex and Age in Burney
According to the poverty statistics in Burney, males aged 5 years and females aged 12 to 14 years are the age groups that are most secure financially, with 100.0% of males and 100.0% of females in these age groups living above the poverty line.
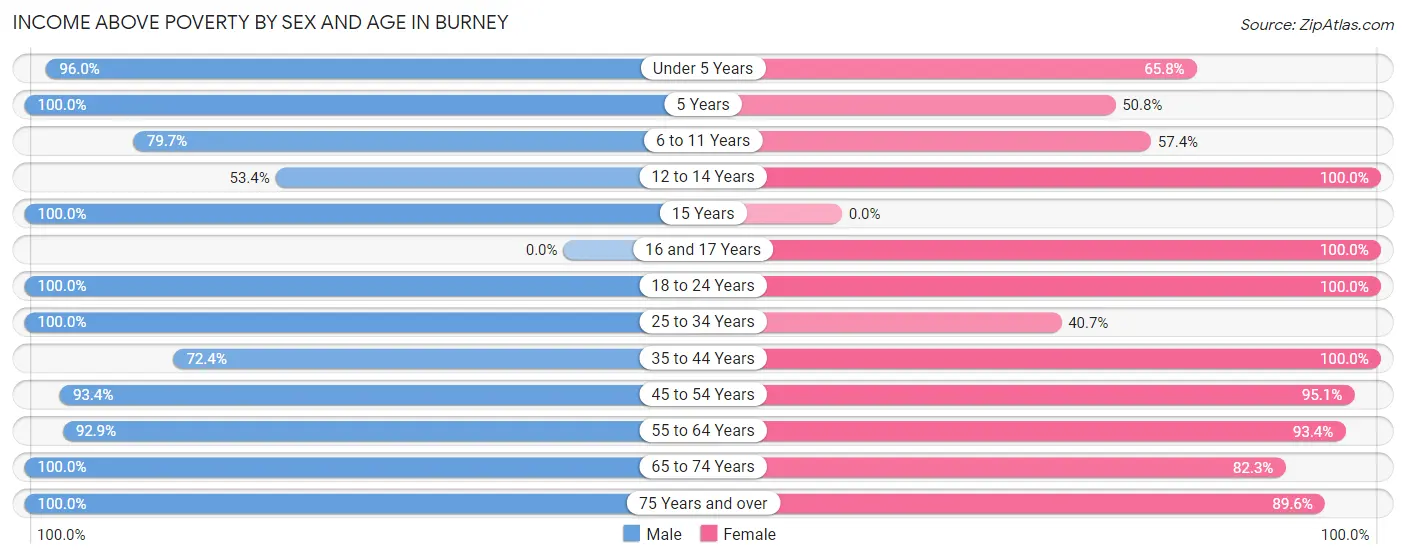
| Age Bracket | Male | Female |
| Under 5 Years | 142 (96.0%) | 129 (65.8%) |
| 5 Years | 9 (100.0%) | 34 (50.7%) |
| 6 to 11 Years | 110 (79.7%) | 70 (57.4%) |
| 12 to 14 Years | 39 (53.4%) | 67 (100.0%) |
| 15 Years | 27 (100.0%) | 0 (0.0%) |
| 16 and 17 Years | 0 (0.0%) | 78 (100.0%) |
| 18 to 24 Years | 122 (100.0%) | 49 (100.0%) |
| 25 to 34 Years | 146 (100.0%) | 90 (40.7%) |
| 35 to 44 Years | 89 (72.4%) | 91 (100.0%) |
| 45 to 54 Years | 199 (93.4%) | 174 (95.1%) |
| 55 to 64 Years | 118 (92.9%) | 142 (93.4%) |
| 65 to 74 Years | 213 (100.0%) | 223 (82.3%) |
| 75 Years and over | 138 (100.0%) | 190 (89.6%) |
| Total | 1,352 (91.5%) | 1,337 (78.2%) |
Income Below Poverty Among Married-Couple Families in Burney
The poverty statistics for married-couple families in Burney show that 5.6% or 33 of the total 590 families live below the poverty line. Families with 3 or 4 children have the highest poverty rate of 27.6%, comprising of 27 families. On the other hand, families with 1 or 2 children have the lowest poverty rate of 0.0%, which includes 0 families.
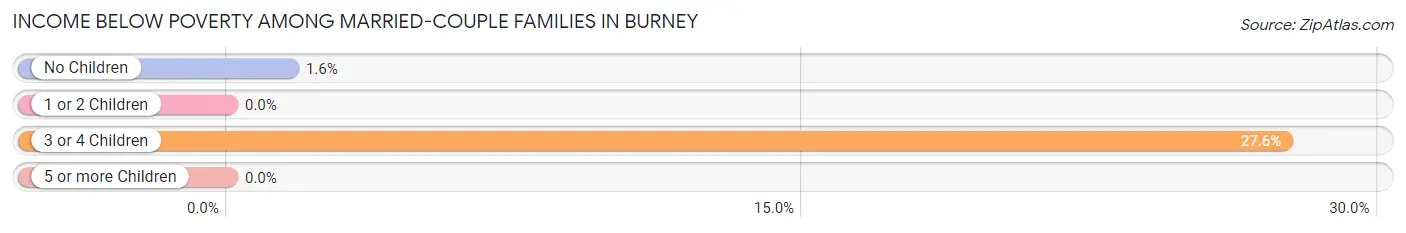
| Children | Above Poverty | Below Poverty |
| No Children | 372 (98.4%) | 6 (1.6%) |
| 1 or 2 Children | 102 (100.0%) | 0 (0.0%) |
| 3 or 4 Children | 71 (72.5%) | 27 (27.6%) |
| 5 or more Children | 12 (100.0%) | 0 (0.0%) |
| Total | 557 (94.4%) | 33 (5.6%) |
Income Below Poverty Among Single-Parent Households in Burney
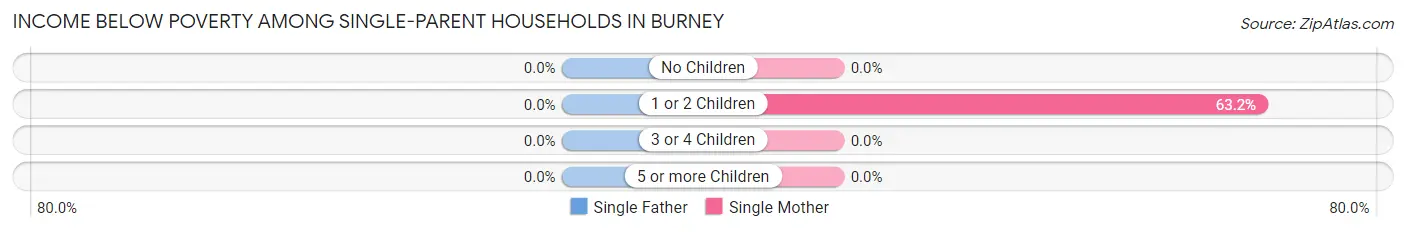
| Children | Single Father | Single Mother |
| No Children | 0 (0.0%) | 0 (0.0%) |
| 1 or 2 Children | 0 (0.0%) | 67 (63.2%) |
| 3 or 4 Children | 0 (0.0%) | 0 (0.0%) |
| 5 or more Children | 0 (0.0%) | 0 (0.0%) |
| Total | 0 (0.0%) | 67 (47.2%) |
Income Below Poverty Among Married-Couple vs Single-Parent Households in Burney
The poverty data for Burney shows that 33 of the married-couple family households (5.6%) and 67 of the single-parent households (34.7%) are living below the poverty level. Within the married-couple family households, those with 3 or 4 children have the highest poverty rate, with 27 households (27.6%) falling below the poverty line. Among the single-parent households, those with 1 or 2 children have the highest poverty rate, with 67 household (42.7%) living below poverty.
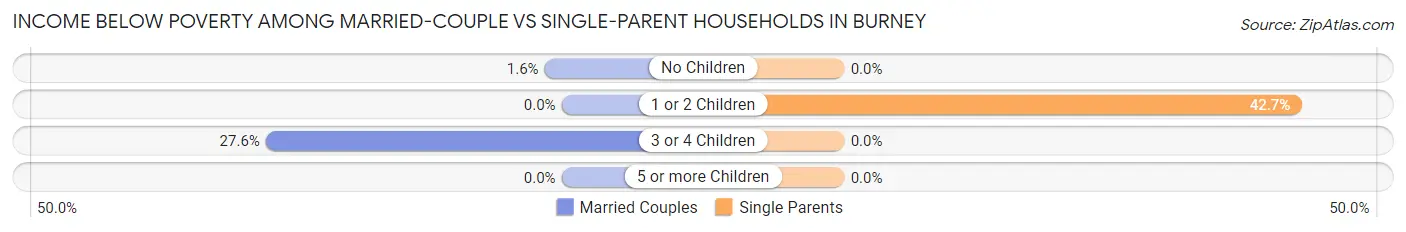
| Children | Married-Couple Families | Single-Parent Households |
| No Children | 6 (1.6%) | 0 (0.0%) |
| 1 or 2 Children | 0 (0.0%) | 67 (42.7%) |
| 3 or 4 Children | 27 (27.6%) | 0 (0.0%) |
| 5 or more Children | 0 (0.0%) | 0 (0.0%) |
| Total | 33 (5.6%) | 67 (34.7%) |
Race in Burney
The most populous races in Burney are White / Caucasian (2,672 | 83.9%), Two or more Races (252 | 7.9%), and Hispanic or Latino (159 | 5.0%).
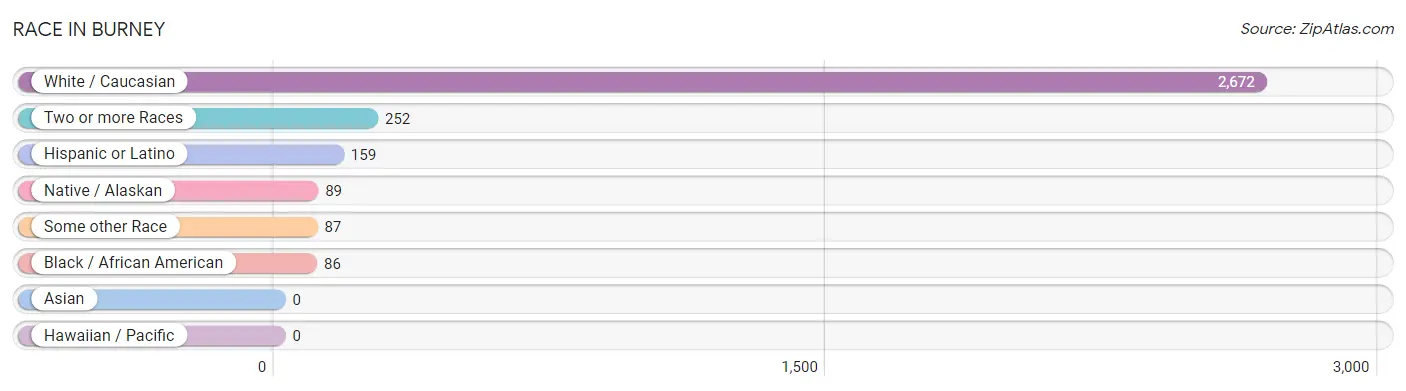
| Race | # Population | % Population |
| Asian | 0 | 0.0% |
| Black / African American | 86 | 2.7% |
| Hawaiian / Pacific | 0 | 0.0% |
| Hispanic or Latino | 159 | 5.0% |
| Native / Alaskan | 89 | 2.8% |
| White / Caucasian | 2,672 | 83.9% |
| Two or more Races | 252 | 7.9% |
| Some other Race | 87 | 2.7% |
| Total | 3,186 | 100.0% |
Ancestry in Burney
The most populous ancestries reported in Burney are German (377 | 11.8%), English (312 | 9.8%), Irish (279 | 8.8%), Italian (200 | 6.3%), and Iranian (129 | 4.1%), together accounting for 40.7% of all Burney residents.
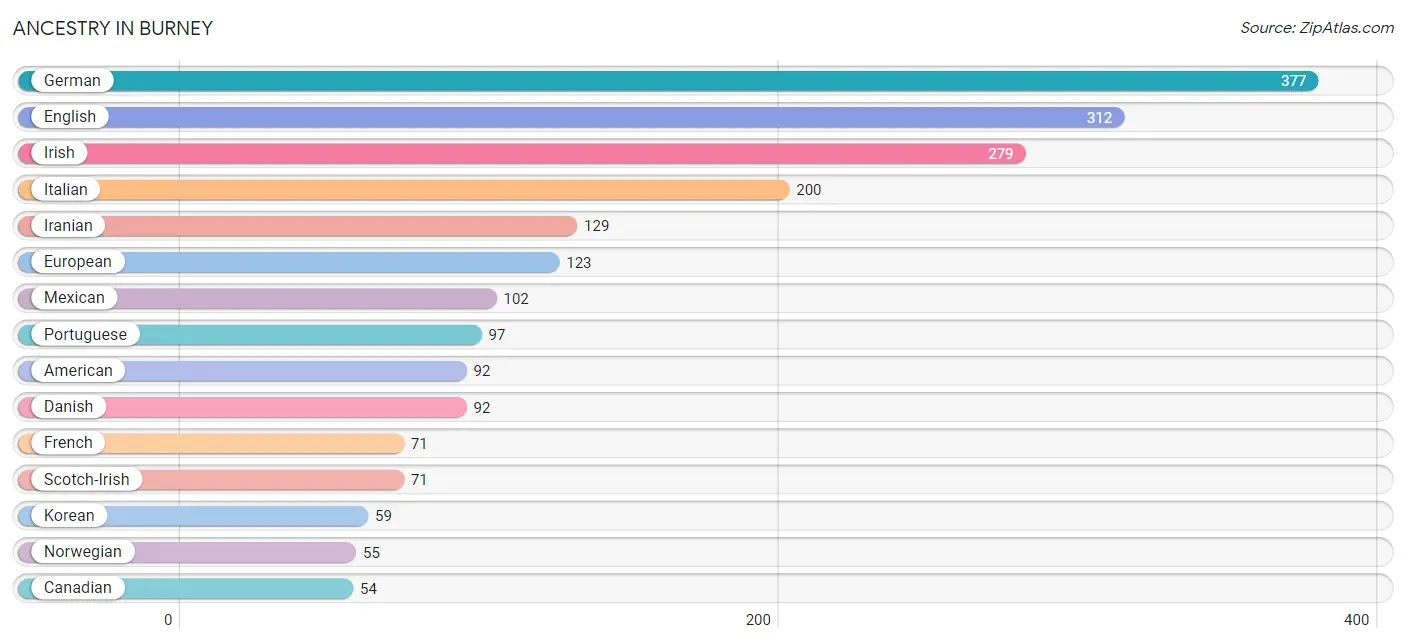
| Ancestry | # Population | % Population |
| American | 92 | 2.9% |
| Arab | 21 | 0.7% |
| Basque | 7 | 0.2% |
| British | 7 | 0.2% |
| Canadian | 54 | 1.7% |
| Czech | 34 | 1.1% |
| Danish | 92 | 2.9% |
| Dutch | 17 | 0.5% |
| English | 312 | 9.8% |
| European | 123 | 3.9% |
| Finnish | 22 | 0.7% |
| French | 71 | 2.2% |
| German | 377 | 11.8% |
| Greek | 24 | 0.7% |
| Hungarian | 11 | 0.4% |
| Iranian | 129 | 4.1% |
| Irish | 279 | 8.8% |
| Italian | 200 | 6.3% |
| Korean | 59 | 1.8% |
| Lebanese | 21 | 0.7% |
| Mexican | 102 | 3.2% |
| Norwegian | 55 | 1.7% |
| Osage | 24 | 0.7% |
| Paiute | 7 | 0.2% |
| Polish | 26 | 0.8% |
| Portuguese | 97 | 3.0% |
| Puerto Rican | 43 | 1.3% |
| Russian | 42 | 1.3% |
| Scotch-Irish | 71 | 2.2% |
| Scottish | 45 | 1.4% |
| Spaniard | 14 | 0.4% |
| Ukrainian | 10 | 0.3% | View All 32 Rows |
Immigrants in Burney
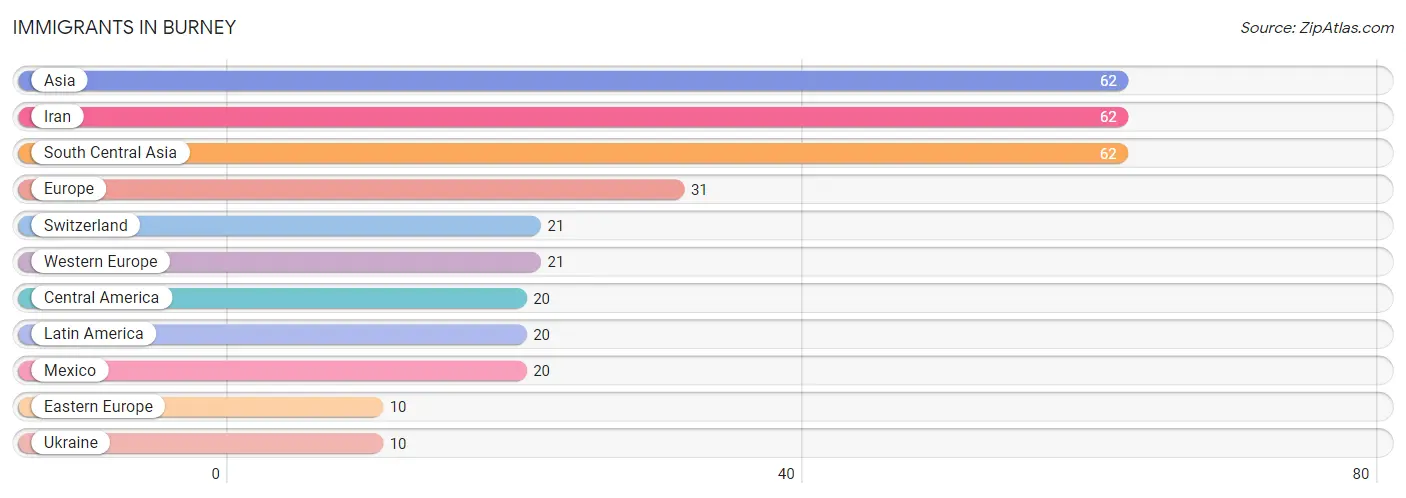
The most numerous immigrant groups reported in Burney came from Asia (62 | 1.9%), Iran (62 | 1.9%), South Central Asia (62 | 1.9%), Europe (31 | 1.0%), and Switzerland (21 | 0.7%), together accounting for 7.5% of all Burney residents.
| Immigration Origin | # Population | % Population |
| Asia | 62 | 1.9% |
| Central America | 20 | 0.6% |
| Eastern Europe | 10 | 0.3% |
| Europe | 31 | 1.0% |
| Iran | 62 | 1.9% |
| Latin America | 20 | 0.6% |
| Mexico | 20 | 0.6% |
| South Central Asia | 62 | 1.9% |
| Switzerland | 21 | 0.7% |
| Ukraine | 10 | 0.3% |
| Western Europe | 21 | 0.7% | View All 11 Rows |
Sex and Age in Burney
Sex and Age in Burney
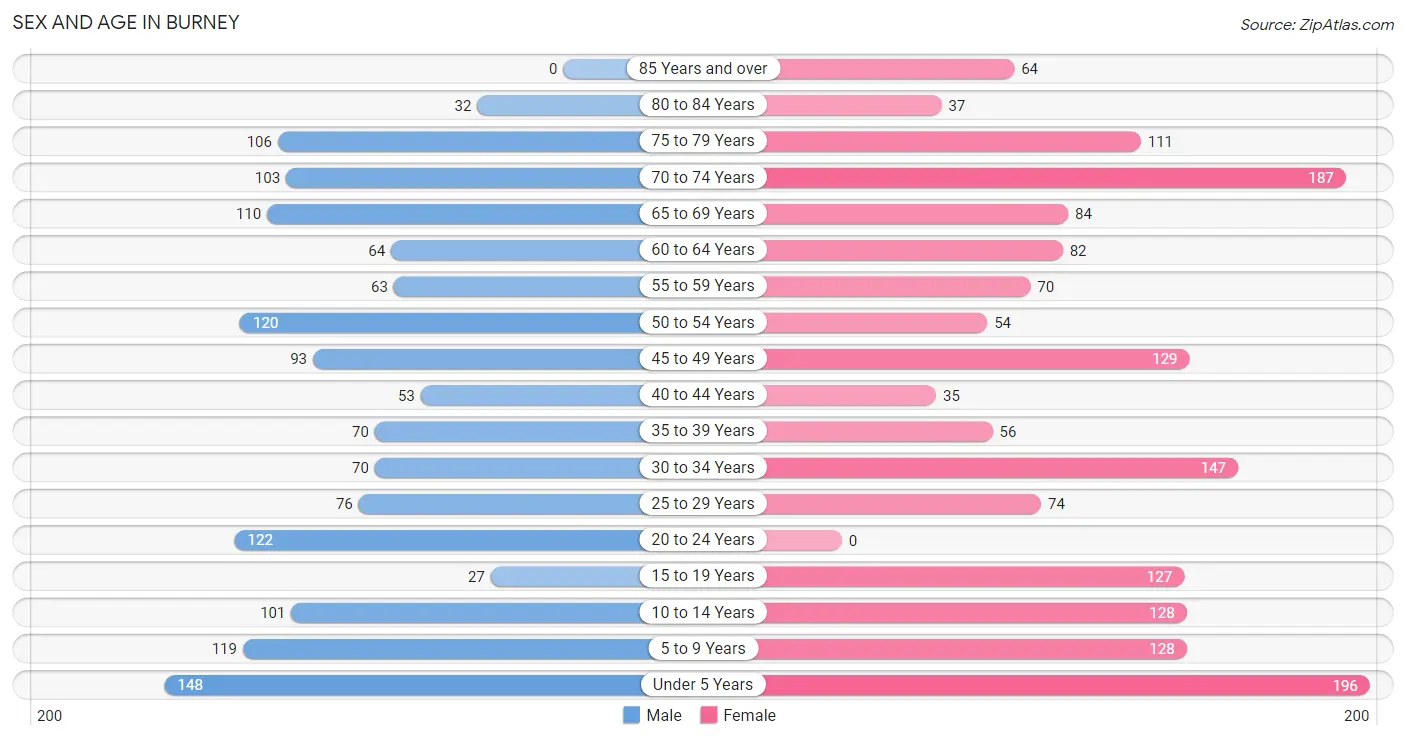
The most populous age groups in Burney are Under 5 Years (148 | 10.0%) for men and Under 5 Years (196 | 11.5%) for women.
| Age Bracket | Male | Female |
| Under 5 Years | 148 (10.0%) | 196 (11.5%) |
| 5 to 9 Years | 119 (8.1%) | 128 (7.5%) |
| 10 to 14 Years | 101 (6.8%) | 128 (7.5%) |
| 15 to 19 Years | 27 (1.8%) | 127 (7.4%) |
| 20 to 24 Years | 122 (8.3%) | 0 (0.0%) |
| 25 to 29 Years | 76 (5.1%) | 74 (4.3%) |
| 30 to 34 Years | 70 (4.7%) | 147 (8.6%) |
| 35 to 39 Years | 70 (4.7%) | 56 (3.3%) |
| 40 to 44 Years | 53 (3.6%) | 35 (2.1%) |
| 45 to 49 Years | 93 (6.3%) | 129 (7.5%) |
| 50 to 54 Years | 120 (8.1%) | 54 (3.2%) |
| 55 to 59 Years | 63 (4.3%) | 70 (4.1%) |
| 60 to 64 Years | 64 (4.3%) | 82 (4.8%) |
| 65 to 69 Years | 110 (7.4%) | 84 (4.9%) |
| 70 to 74 Years | 103 (7.0%) | 187 (10.9%) |
| 75 to 79 Years | 106 (7.2%) | 111 (6.5%) |
| 80 to 84 Years | 32 (2.2%) | 37 (2.2%) |
| 85 Years and over | 0 (0.0%) | 64 (3.7%) |
| Total | 1,477 (100.0%) | 1,709 (100.0%) |
Families and Households in Burney
Median Family Size in Burney
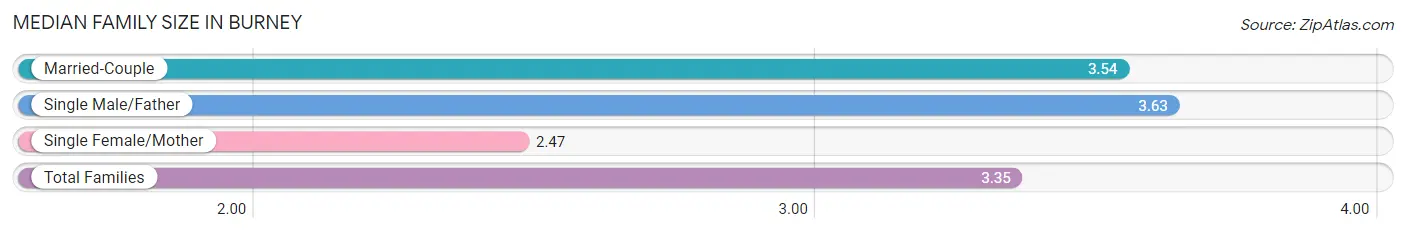
The median family size in Burney is 3.35 persons per family, with single male/father families (51 | 6.5%) accounting for the largest median family size of 3.63 persons per family. On the other hand, single female/mother families (142 | 18.1%) represent the smallest median family size with 2.47 persons per family.
| Family Type | # Families | Family Size |
| Married-Couple | 590 (75.3%) | 3.54 |
| Single Male/Father | 51 (6.5%) | 3.63 |
| Single Female/Mother | 142 (18.1%) | 2.47 |
| Total Families | 783 (100.0%) | 3.35 |
Median Household Size in Burney
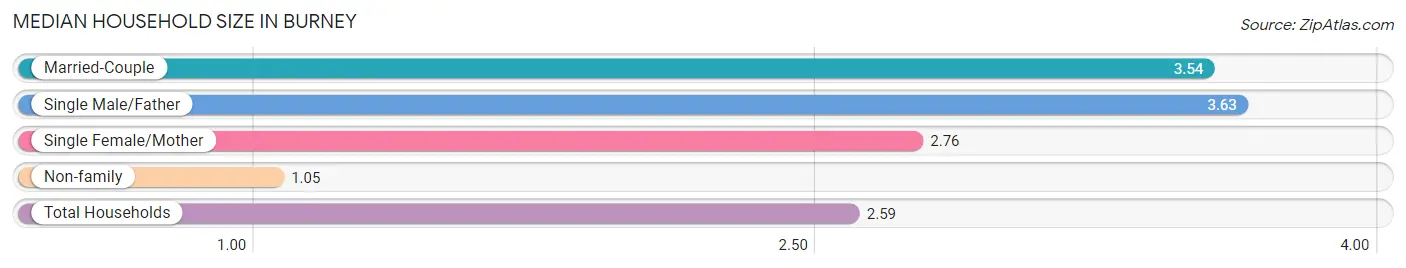
The median household size in Burney is 2.59 persons per household, with single male/father households (51 | 4.3%) accounting for the largest median household size of 3.63 persons per household. non-family households (408 | 34.3%) represent the smallest median household size with 1.05 persons per household.
| Household Type | # Households | Household Size |
| Married-Couple | 590 (49.5%) | 3.54 |
| Single Male/Father | 51 (4.3%) | 3.63 |
| Single Female/Mother | 142 (11.9%) | 2.76 |
| Non-family | 408 (34.3%) | 1.05 |
| Total Households | 1,191 (100.0%) | 2.59 |
Household Size by Marriage Status in Burney
Out of a total of 1,191 households in Burney, 783 (65.7%) are family households, while 408 (34.3%) are nonfamily households. The most numerous type of family households are 2-person households, comprising 350, and the most common type of nonfamily households are 1-person households, comprising 387.
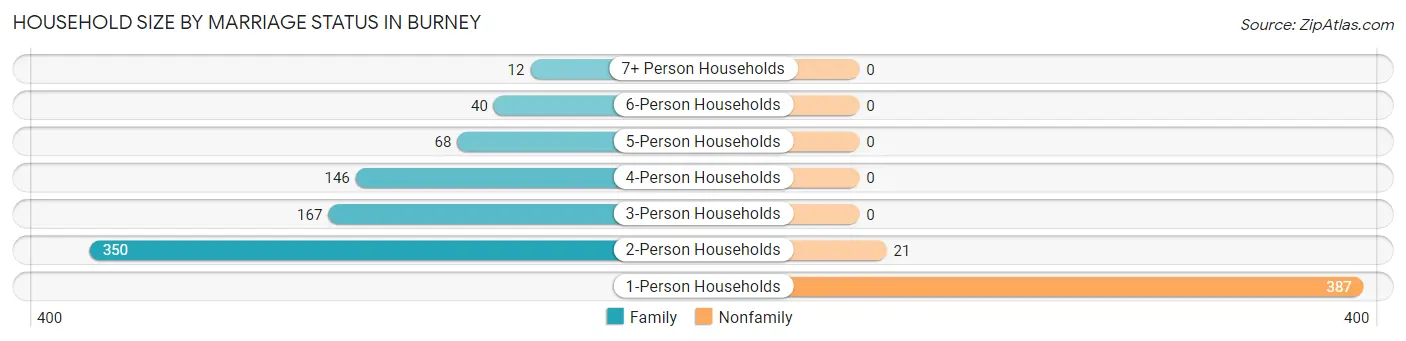
| Household Size | Family Households | Nonfamily Households |
| 1-Person Households | - | 387 (32.5%) |
| 2-Person Households | 350 (29.4%) | 21 (1.8%) |
| 3-Person Households | 167 (14.0%) | 0 (0.0%) |
| 4-Person Households | 146 (12.3%) | 0 (0.0%) |
| 5-Person Households | 68 (5.7%) | 0 (0.0%) |
| 6-Person Households | 40 (3.4%) | 0 (0.0%) |
| 7+ Person Households | 12 (1.0%) | 0 (0.0%) |
| Total | 783 (65.7%) | 408 (34.3%) |
Female Fertility in Burney
Fertility by Age in Burney
Average fertility rate in Burney is 21.0 births per 1,000 women. Women in the age bracket of 20 to 34 years have the highest fertility rate with 54.0 births per 1,000 women. Women in the age bracket of 20 to 34 years acount for 100.0% of all women with births.
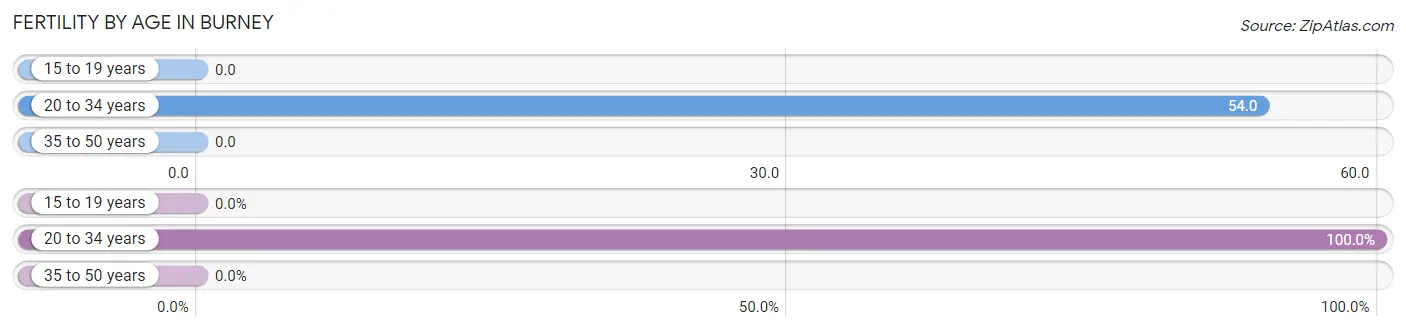
| Age Bracket | Women with Births | Births / 1,000 Women |
| 15 to 19 years | 0 (0.0%) | 0.0 |
| 20 to 34 years | 12 (100.0%) | 54.0 |
| 35 to 50 years | 0 (0.0%) | 0.0 |
| Total | 12 (100.0%) | 21.0 |
Fertility by Age by Marriage Status in Burney
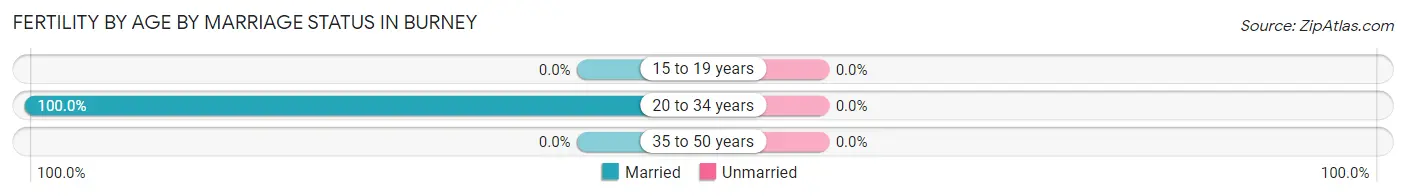
| Age Bracket | Married | Unmarried |
| 15 to 19 years | 0 (0.0%) | 0 (0.0%) |
| 20 to 34 years | 12 (100.0%) | 0 (0.0%) |
| 35 to 50 years | 0 (0.0%) | 0 (0.0%) |
| Total | 12 (100.0%) | 0 (0.0%) |
Fertility by Education in Burney
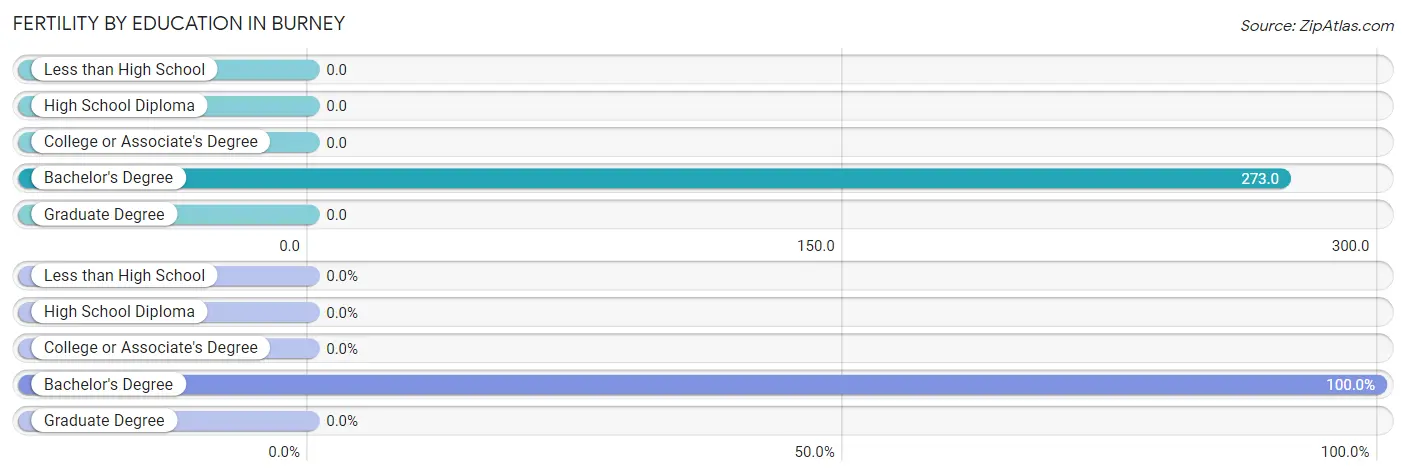
| Educational Attainment | Women with Births | Births / 1,000 Women |
| Less than High School | 0 (0.0%) | 0.0 |
| High School Diploma | 0 (0.0%) | 0.0 |
| College or Associate's Degree | 0 (0.0%) | 0.0 |
| Bachelor's Degree | 12 (100.0%) | 273.0 |
| Graduate Degree | 0 (0.0%) | 0.0 |
| Total | 12 (100.0%) | 21.0 |
Fertility by Education by Marriage Status in Burney
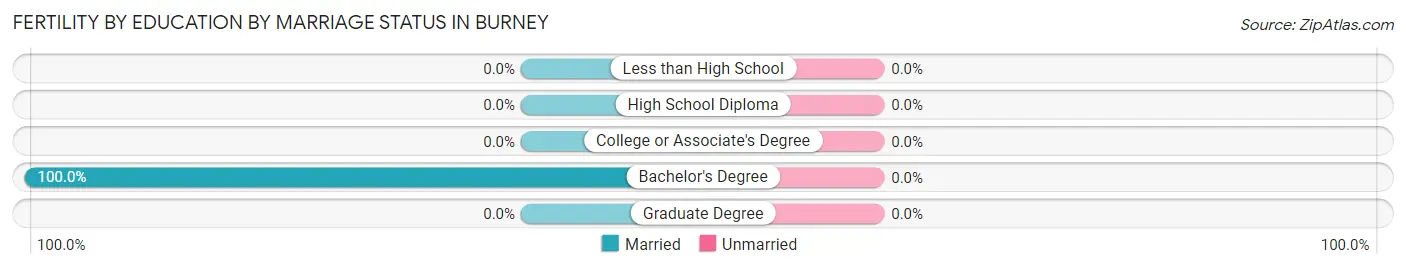
| Educational Attainment | Married | Unmarried |
| Less than High School | 0 (0.0%) | 0 (0.0%) |
| High School Diploma | 0 (0.0%) | 0 (0.0%) |
| College or Associate's Degree | 0 (0.0%) | 0 (0.0%) |
| Bachelor's Degree | 12 (100.0%) | 0 (0.0%) |
| Graduate Degree | 0 (0.0%) | 0 (0.0%) |
| Total | 12 (100.0%) | 0 (0.0%) |
Employment Characteristics in Burney
Employment by Class of Employer in Burney
Among the 904 employed individuals in Burney, private company employees (665 | 73.6%), local government employees (122 | 13.5%), and self-employed (incorporated) (55 | 6.1%) make up the most common classes of employment.
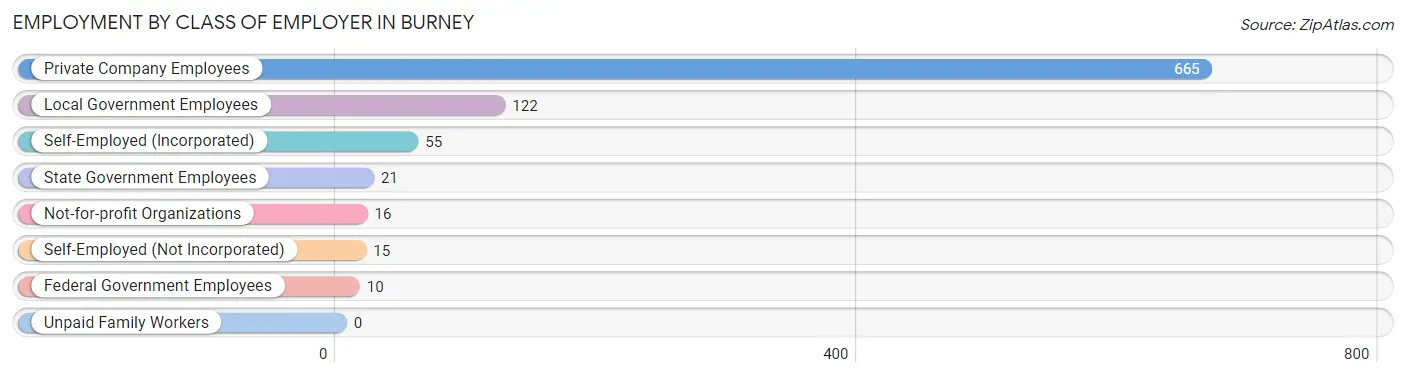
| Employer Class | # Employees | % Employees |
| Private Company Employees | 665 | 73.6% |
| Self-Employed (Incorporated) | 55 | 6.1% |
| Self-Employed (Not Incorporated) | 15 | 1.7% |
| Not-for-profit Organizations | 16 | 1.8% |
| Local Government Employees | 122 | 13.5% |
| State Government Employees | 21 | 2.3% |
| Federal Government Employees | 10 | 1.1% |
| Unpaid Family Workers | 0 | 0.0% |
| Total | 904 | 100.0% |
Employment Status by Age in Burney
According to the labor force statistics for Burney, out of the total population over 16 years of age (2,339), 45.5% or 1,064 individuals are in the labor force, with 14.1% or 150 of them unemployed. The age group with the highest labor force participation rate is 35 to 44 years, with 86.9% or 186 individuals in the labor force. Within the labor force, the 60 to 64 years age range has the highest percentage of unemployed individuals, with 40.3% or 27 of them being unemployed.
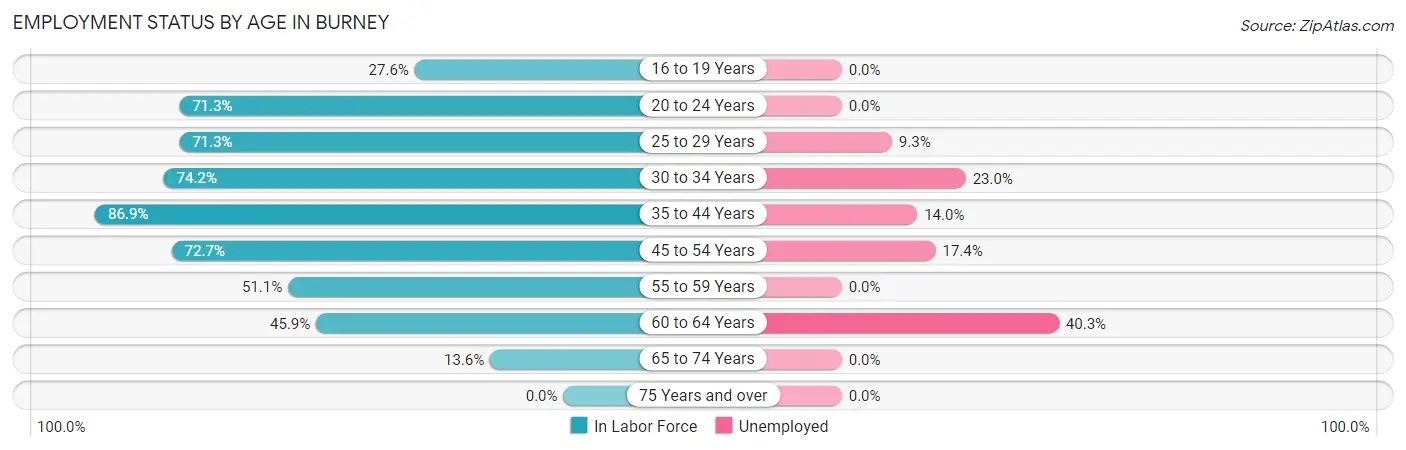
| Age Bracket | In Labor Force | Unemployed |
| 16 to 19 Years | 35 (27.6%) | 0 (0.0%) |
| 20 to 24 Years | 87 (71.3%) | 0 (0.0%) |
| 25 to 29 Years | 107 (71.3%) | 10 (9.3%) |
| 30 to 34 Years | 161 (74.2%) | 37 (23.0%) |
| 35 to 44 Years | 186 (86.9%) | 26 (14.0%) |
| 45 to 54 Years | 288 (72.7%) | 50 (17.4%) |
| 55 to 59 Years | 68 (51.1%) | 0 (0.0%) |
| 60 to 64 Years | 67 (45.9%) | 27 (40.3%) |
| 65 to 74 Years | 66 (13.6%) | 0 (0.0%) |
| 75 Years and over | 0 (0.0%) | 0 (0.0%) |
| Total | 1,064 (45.5%) | 150 (14.1%) |
Employment Status by Educational Attainment in Burney
According to labor force statistics for Burney, 69.8% of individuals (877) out of the total population between 25 and 64 years of age (1,256) are in the labor force, with 17.1% or 150 of them being unemployed. The group with the highest labor force participation rate are those with the educational attainment of high school diploma, with 78.1% or 335 individuals in the labor force. Within the labor force, individuals with less than high school education have the highest percentage of unemployment, with 33.3% or 37 of them being unemployed.
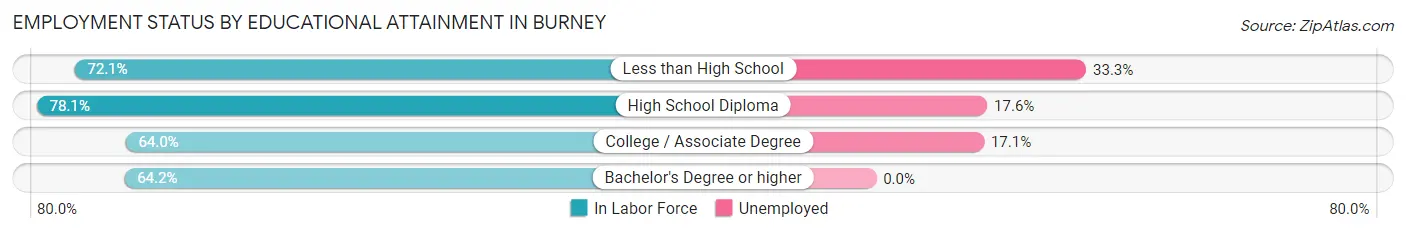
| Educational Attainment | In Labor Force | Unemployed |
| Less than High School | 111 (72.1%) | 51 (33.3%) |
| High School Diploma | 335 (78.1%) | 76 (17.6%) |
| College / Associate Degree | 316 (64.0%) | 84 (17.1%) |
| Bachelor's Degree or higher | 115 (64.2%) | 0 (0.0%) |
| Total | 877 (69.8%) | 215 (17.1%) |
Employment Occupations by Sex in Burney
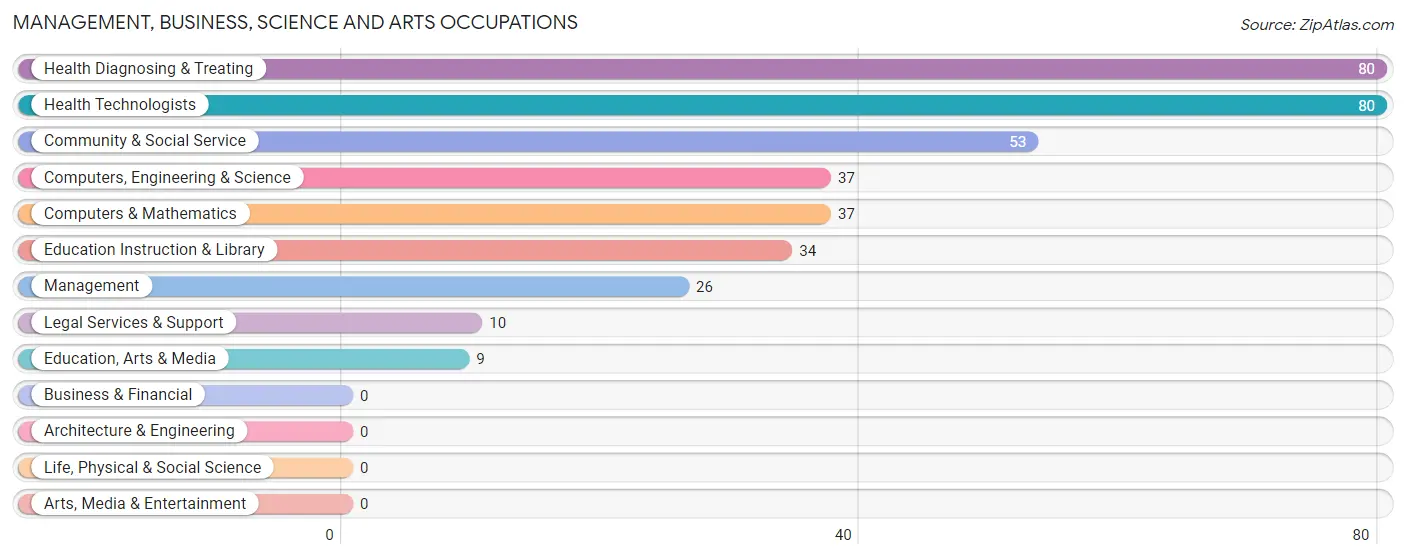
Management, Business, Science and Arts Occupations
The most common Management, Business, Science and Arts occupations in Burney are Health Diagnosing & Treating (80 | 8.7%), Health Technologists (80 | 8.7%), Community & Social Service (53 | 5.8%), Computers, Engineering & Science (37 | 4.0%), and Computers & Mathematics (37 | 4.0%).
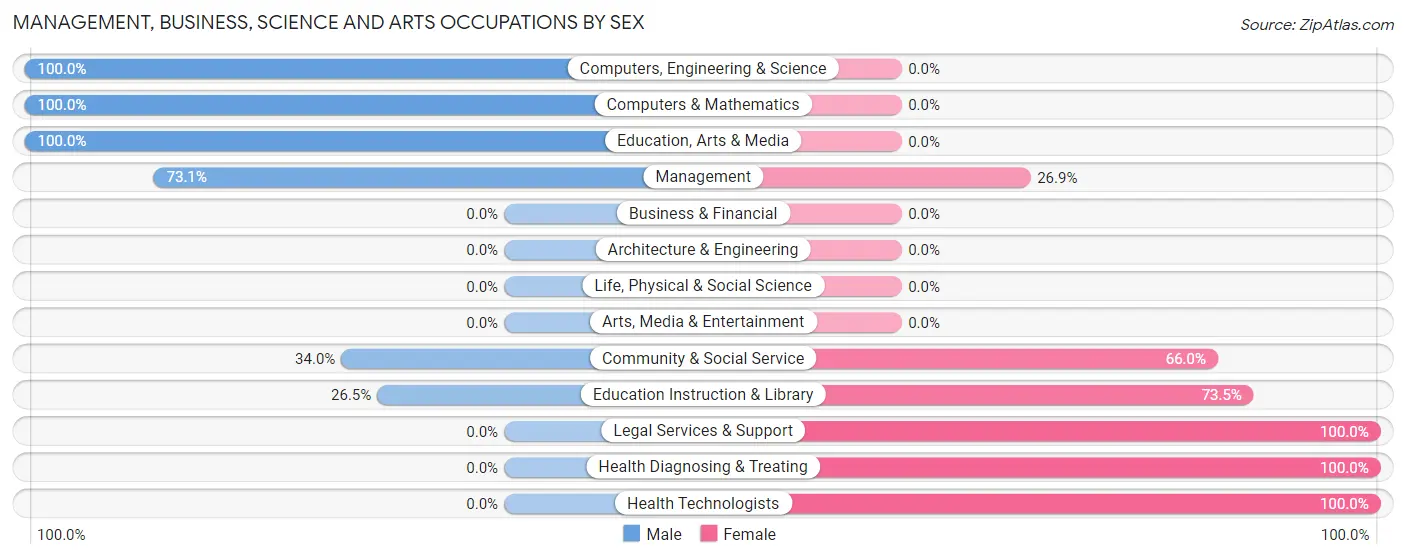
Management, Business, Science and Arts Occupations by Sex
Within the Management, Business, Science and Arts occupations in Burney, the most male-oriented occupations are Computers, Engineering & Science (100.0%), Computers & Mathematics (100.0%), and Education, Arts & Media (100.0%), while the most female-oriented occupations are Legal Services & Support (100.0%), Health Diagnosing & Treating (100.0%), and Health Technologists (100.0%).
| Occupation | Male | Female |
| Management | 19 (73.1%) | 7 (26.9%) |
| Business & Financial | 0 (0.0%) | 0 (0.0%) |
| Computers, Engineering & Science | 37 (100.0%) | 0 (0.0%) |
| Computers & Mathematics | 37 (100.0%) | 0 (0.0%) |
| Architecture & Engineering | 0 (0.0%) | 0 (0.0%) |
| Life, Physical & Social Science | 0 (0.0%) | 0 (0.0%) |
| Community & Social Service | 18 (34.0%) | 35 (66.0%) |
| Education, Arts & Media | 9 (100.0%) | 0 (0.0%) |
| Legal Services & Support | 0 (0.0%) | 10 (100.0%) |
| Education Instruction & Library | 9 (26.5%) | 25 (73.5%) |
| Arts, Media & Entertainment | 0 (0.0%) | 0 (0.0%) |
| Health Diagnosing & Treating | 0 (0.0%) | 80 (100.0%) |
| Health Technologists | 0 (0.0%) | 80 (100.0%) |
| Total (Category) | 74 (37.8%) | 122 (62.2%) |
| Total (Overall) | 528 (57.7%) | 387 (42.3%) |
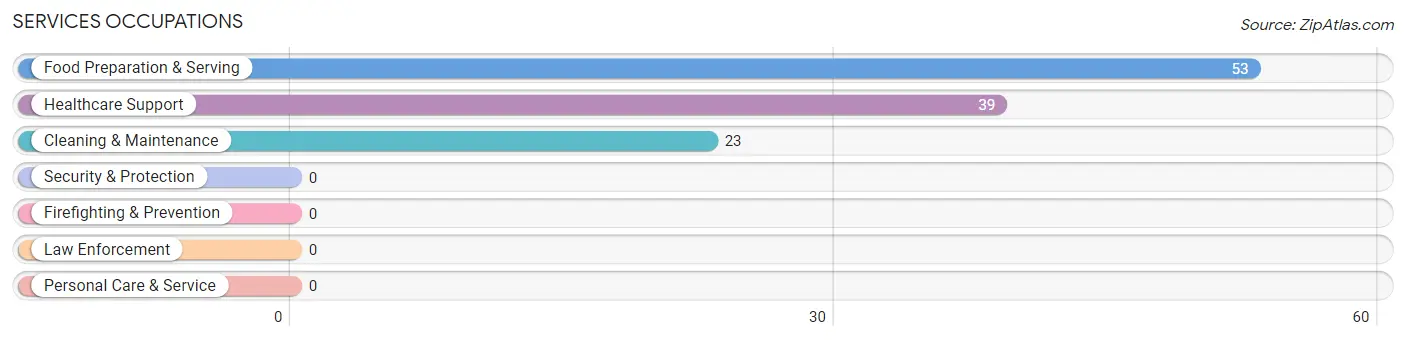
Services Occupations
The most common Services occupations in Burney are Food Preparation & Serving (53 | 5.8%), Healthcare Support (39 | 4.3%), and Cleaning & Maintenance (23 | 2.5%).
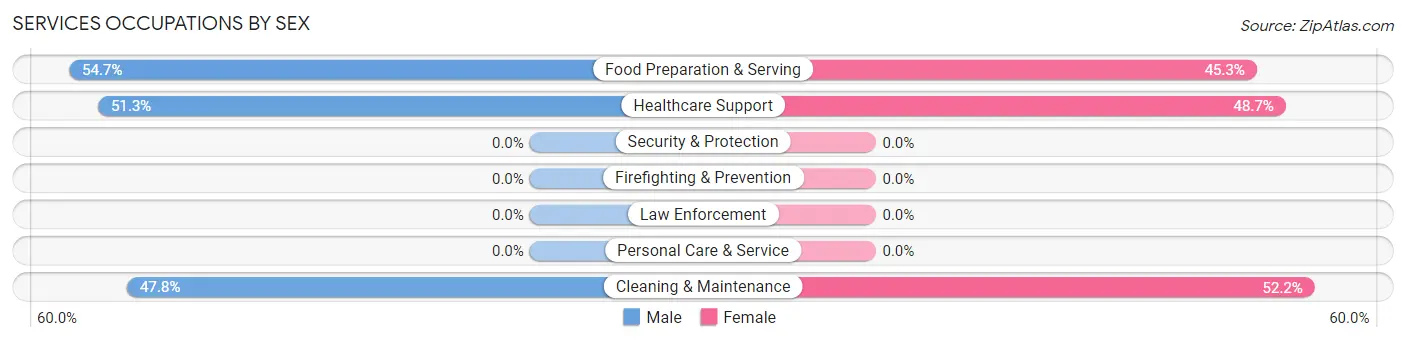
Services Occupations by Sex
Within the Services occupations in Burney, the most male-oriented occupations are Food Preparation & Serving (54.7%), Healthcare Support (51.3%), and Cleaning & Maintenance (47.8%), while the most female-oriented occupations are Cleaning & Maintenance (52.2%), Healthcare Support (48.7%), and Food Preparation & Serving (45.3%).
| Occupation | Male | Female |
| Healthcare Support | 20 (51.3%) | 19 (48.7%) |
| Security & Protection | 0 (0.0%) | 0 (0.0%) |
| Firefighting & Prevention | 0 (0.0%) | 0 (0.0%) |
| Law Enforcement | 0 (0.0%) | 0 (0.0%) |
| Food Preparation & Serving | 29 (54.7%) | 24 (45.3%) |
| Cleaning & Maintenance | 11 (47.8%) | 12 (52.2%) |
| Personal Care & Service | 0 (0.0%) | 0 (0.0%) |
| Total (Category) | 60 (52.2%) | 55 (47.8%) |
| Total (Overall) | 528 (57.7%) | 387 (42.3%) |
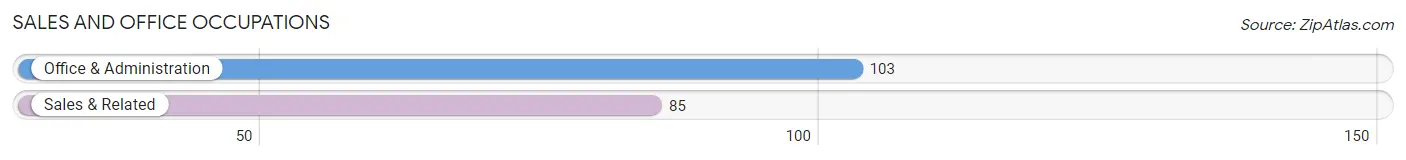
Sales and Office Occupations
The most common Sales and Office occupations in Burney are Office & Administration (103 | 11.3%), and Sales & Related (85 | 9.3%).
Sales and Office Occupations by Sex
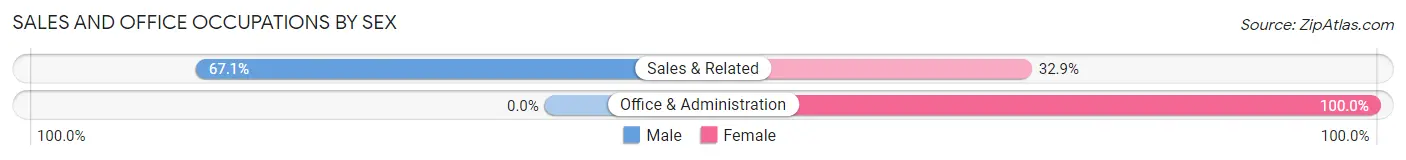
| Occupation | Male | Female |
| Sales & Related | 57 (67.1%) | 28 (32.9%) |
| Office & Administration | 0 (0.0%) | 103 (100.0%) |
| Total (Category) | 57 (30.3%) | 131 (69.7%) |
| Total (Overall) | 528 (57.7%) | 387 (42.3%) |
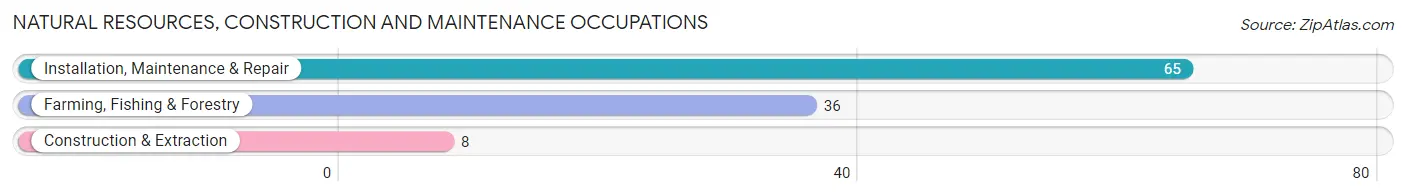
Natural Resources, Construction and Maintenance Occupations
The most common Natural Resources, Construction and Maintenance occupations in Burney are Installation, Maintenance & Repair (65 | 7.1%), Farming, Fishing & Forestry (36 | 3.9%), and Construction & Extraction (8 | 0.9%).
Natural Resources, Construction and Maintenance Occupations by Sex
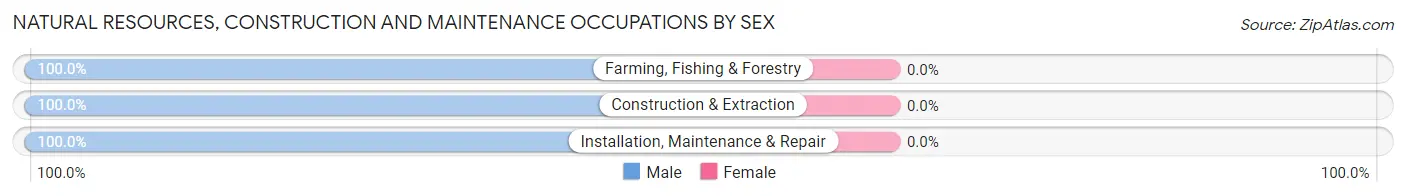
| Occupation | Male | Female |
| Farming, Fishing & Forestry | 36 (100.0%) | 0 (0.0%) |
| Construction & Extraction | 8 (100.0%) | 0 (0.0%) |
| Installation, Maintenance & Repair | 65 (100.0%) | 0 (0.0%) |
| Total (Category) | 109 (100.0%) | 0 (0.0%) |
| Total (Overall) | 528 (57.7%) | 387 (42.3%) |
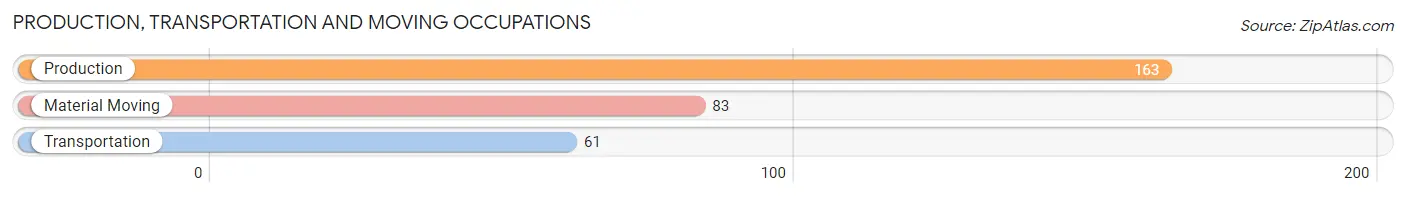
Production, Transportation and Moving Occupations
The most common Production, Transportation and Moving occupations in Burney are Production (163 | 17.8%), Material Moving (83 | 9.1%), and Transportation (61 | 6.7%).
Production, Transportation and Moving Occupations by Sex
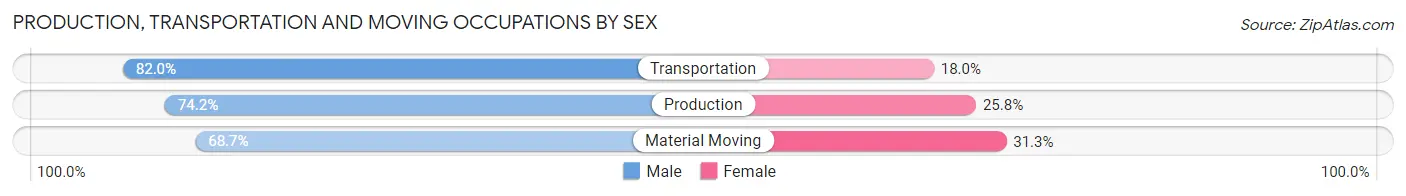
| Occupation | Male | Female |
| Production | 121 (74.2%) | 42 (25.8%) |
| Transportation | 50 (82.0%) | 11 (18.0%) |
| Material Moving | 57 (68.7%) | 26 (31.3%) |
| Total (Category) | 228 (74.3%) | 79 (25.7%) |
| Total (Overall) | 528 (57.7%) | 387 (42.3%) |
Employment Industries by Sex in Burney
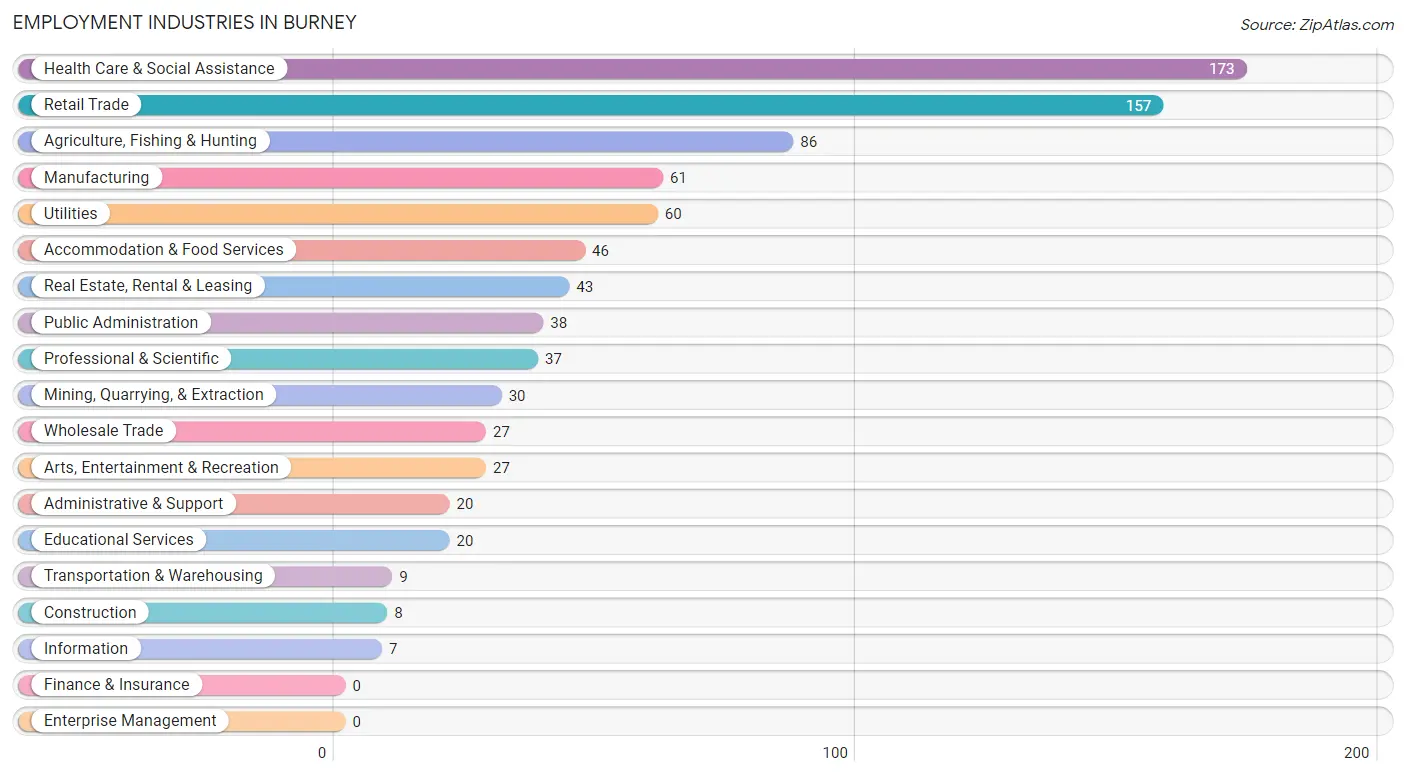
Employment Industries in Burney
The major employment industries in Burney include Health Care & Social Assistance (173 | 18.9%), Retail Trade (157 | 17.2%), Agriculture, Fishing & Hunting (86 | 9.4%), Manufacturing (61 | 6.7%), and Utilities (60 | 6.6%).
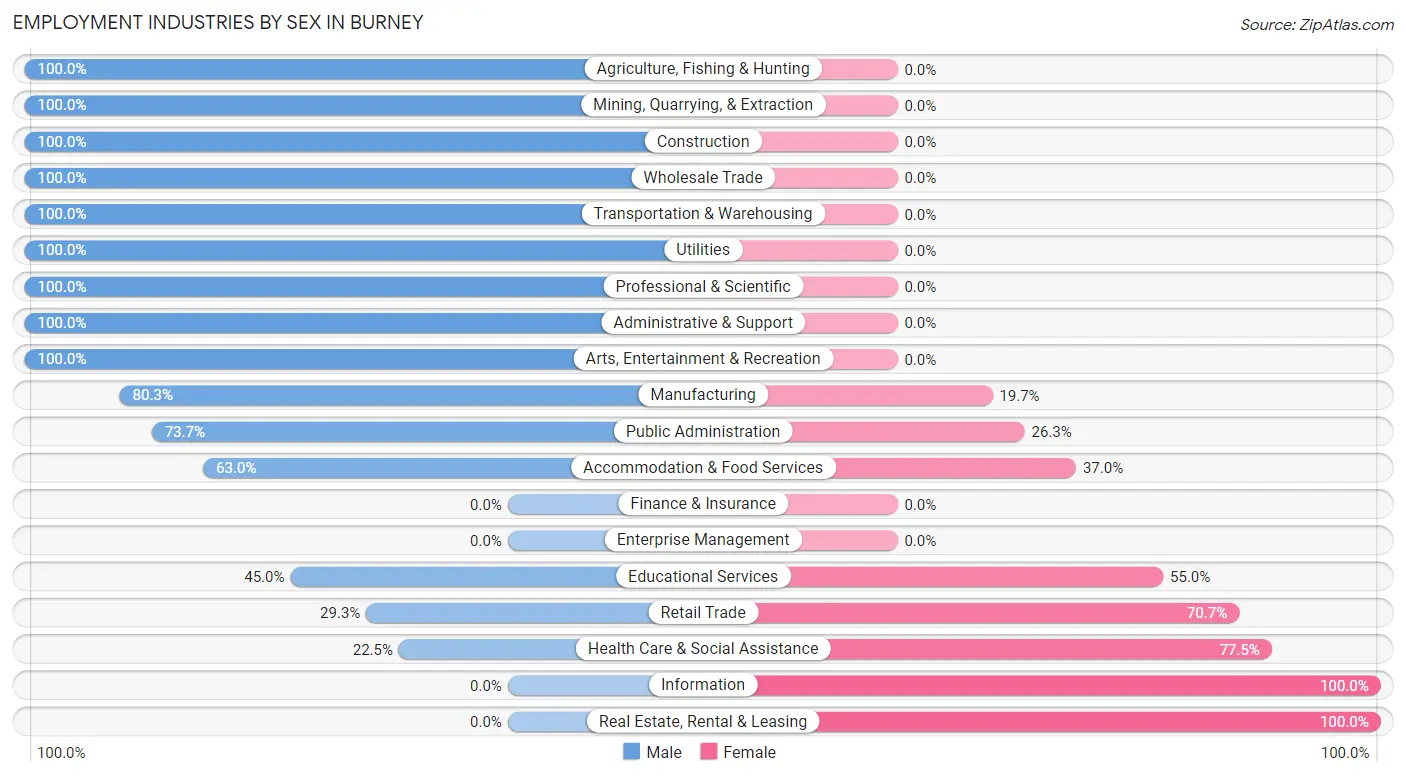
Employment Industries by Sex in Burney
The Burney industries that see more men than women are Agriculture, Fishing & Hunting (100.0%), Mining, Quarrying, & Extraction (100.0%), and Construction (100.0%), whereas the industries that tend to have a higher number of women are Information (100.0%), Real Estate, Rental & Leasing (100.0%), and Health Care & Social Assistance (77.5%).
| Industry | Male | Female |
| Agriculture, Fishing & Hunting | 86 (100.0%) | 0 (0.0%) |
| Mining, Quarrying, & Extraction | 30 (100.0%) | 0 (0.0%) |
| Construction | 8 (100.0%) | 0 (0.0%) |
| Manufacturing | 49 (80.3%) | 12 (19.7%) |
| Wholesale Trade | 27 (100.0%) | 0 (0.0%) |
| Retail Trade | 46 (29.3%) | 111 (70.7%) |
| Transportation & Warehousing | 9 (100.0%) | 0 (0.0%) |
| Utilities | 60 (100.0%) | 0 (0.0%) |
| Information | 0 (0.0%) | 7 (100.0%) |
| Finance & Insurance | 0 (0.0%) | 0 (0.0%) |
| Real Estate, Rental & Leasing | 0 (0.0%) | 43 (100.0%) |
| Professional & Scientific | 37 (100.0%) | 0 (0.0%) |
| Enterprise Management | 0 (0.0%) | 0 (0.0%) |
| Administrative & Support | 20 (100.0%) | 0 (0.0%) |
| Educational Services | 9 (45.0%) | 11 (55.0%) |
| Health Care & Social Assistance | 39 (22.5%) | 134 (77.5%) |
| Arts, Entertainment & Recreation | 27 (100.0%) | 0 (0.0%) |
| Accommodation & Food Services | 29 (63.0%) | 17 (37.0%) |
| Public Administration | 28 (73.7%) | 10 (26.3%) |
| Total | 528 (57.7%) | 387 (42.3%) |
Education in Burney
School Enrollment in Burney
The most common levels of schooling among the 661 students in Burney are middle school (217 | 32.8%), elementary school (170 | 25.7%), and high school (105 | 15.9%).
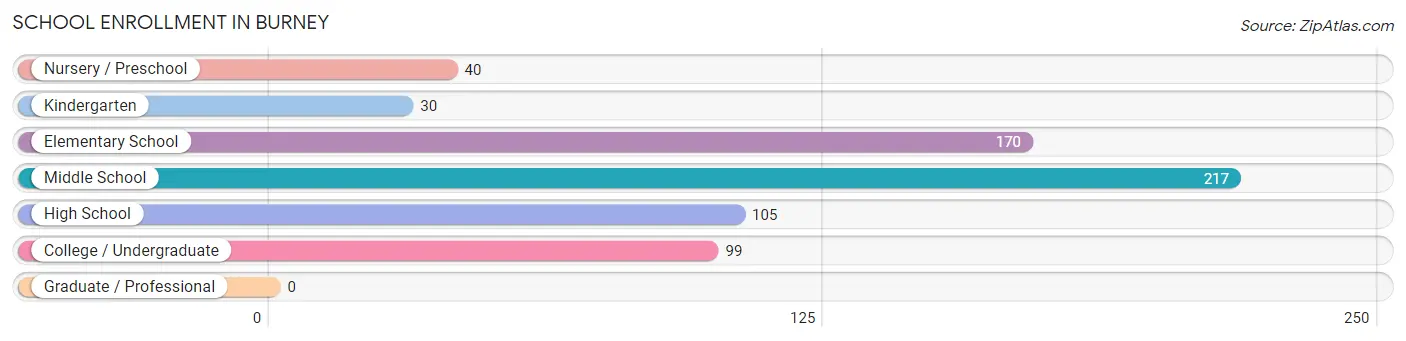
| School Level | # Students | % Students |
| Nursery / Preschool | 40 | 6.0% |
| Kindergarten | 30 | 4.5% |
| Elementary School | 170 | 25.7% |
| Middle School | 217 | 32.8% |
| High School | 105 | 15.9% |
| College / Undergraduate | 99 | 15.0% |
| Graduate / Professional | 0 | 0.0% |
| Total | 661 | 100.0% |
School Enrollment by Age by Funding Source in Burney
Out of a total of 661 students who are enrolled in schools in Burney, 51 (7.7%) attend a private institution, while the remaining 610 (92.3%) are enrolled in public schools. The age group of 18 to 19 year olds has the highest likelihood of being enrolled in private schools, with 32 (100.0% in the age bracket) enrolled. Conversely, the age group of 3 to 4 year olds has the lowest likelihood of being enrolled in a private school, with 14 (100.0% in the age bracket) attending a public institution.
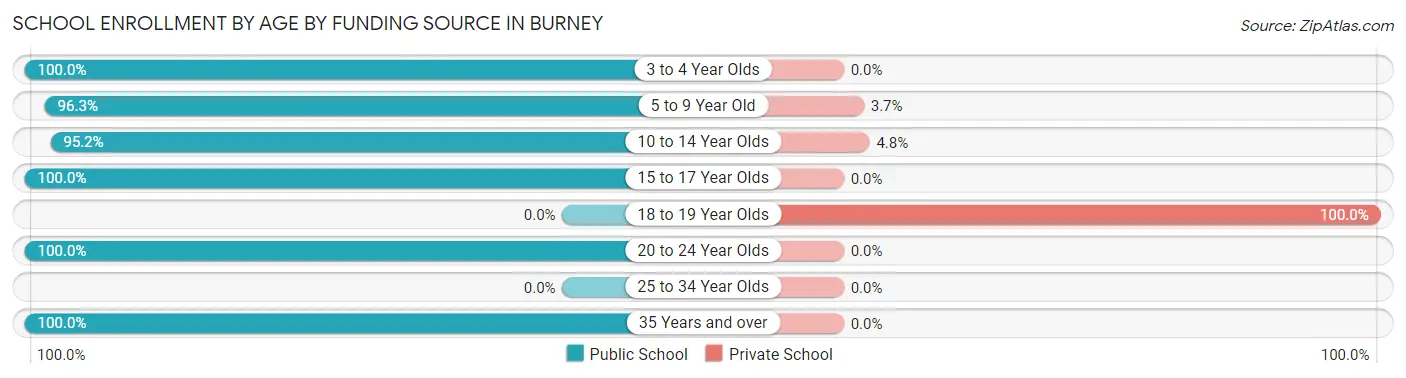
| Age Bracket | Public School | Private School |
| 3 to 4 Year Olds | 14 (100.0%) | 0 (0.0%) |
| 5 to 9 Year Old | 206 (96.3%) | 8 (3.7%) |
| 10 to 14 Year Olds | 218 (95.2%) | 11 (4.8%) |
| 15 to 17 Year Olds | 105 (100.0%) | 0 (0.0%) |
| 18 to 19 Year Olds | 0 (0.0%) | 32 (100.0%) |
| 20 to 24 Year Olds | 35 (100.0%) | 0 (0.0%) |
| 25 to 34 Year Olds | 0 (0.0%) | 0 (0.0%) |
| 35 Years and over | 32 (100.0%) | 0 (0.0%) |
| Total | 610 (92.3%) | 51 (7.7%) |
Educational Attainment by Field of Study in Burney
Science & technology (72 | 29.4%), business (34 | 13.9%), literature & languages (34 | 13.9%), social sciences (19 | 7.8%), and arts & humanities (15 | 6.1%) are the most common fields of study among 245 individuals in Burney who have obtained a bachelor's degree or higher.
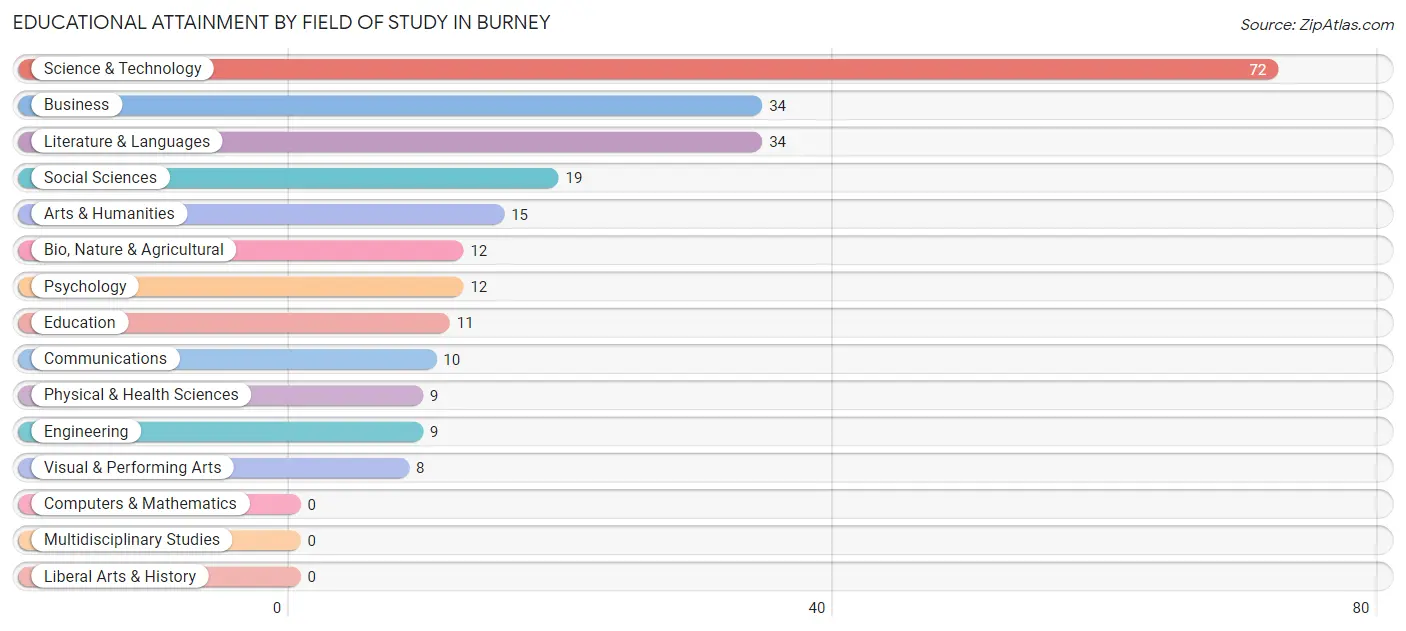
| Field of Study | # Graduates | % Graduates |
| Computers & Mathematics | 0 | 0.0% |
| Bio, Nature & Agricultural | 12 | 4.9% |
| Physical & Health Sciences | 9 | 3.7% |
| Psychology | 12 | 4.9% |
| Social Sciences | 19 | 7.8% |
| Engineering | 9 | 3.7% |
| Multidisciplinary Studies | 0 | 0.0% |
| Science & Technology | 72 | 29.4% |
| Business | 34 | 13.9% |
| Education | 11 | 4.5% |
| Literature & Languages | 34 | 13.9% |
| Liberal Arts & History | 0 | 0.0% |
| Visual & Performing Arts | 8 | 3.3% |
| Communications | 10 | 4.1% |
| Arts & Humanities | 15 | 6.1% |
| Total | 245 | 100.0% |
Transportation & Commute in Burney
Vehicle Availability by Sex in Burney
The most prevalent vehicle ownership categories in Burney are males with 2 vehicles (184, accounting for 38.3%) and females with 2 vehicles (166, making up 47.5%).
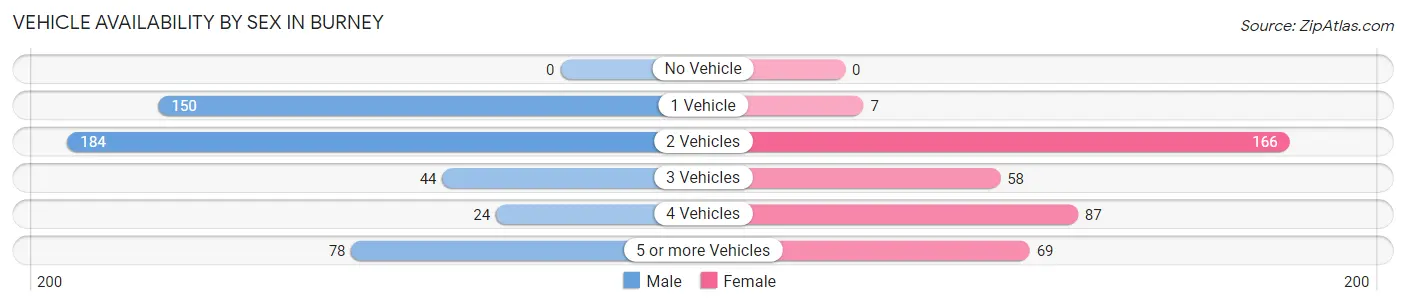
| Vehicles Available | Male | Female |
| No Vehicle | 0 (0.0%) | 0 (0.0%) |
| 1 Vehicle | 150 (31.2%) | 7 (1.8%) |
| 2 Vehicles | 184 (38.3%) | 166 (42.9%) |
| 3 Vehicles | 44 (9.2%) | 58 (15.0%) |
| 4 Vehicles | 24 (5.0%) | 87 (22.5%) |
| 5 or more Vehicles | 78 (16.3%) | 69 (17.8%) |
| Total | 480 (100.0%) | 387 (100.0%) |
Commute Time in Burney
The most frequently occuring commute durations in Burney are less than 5 minutes (231 commuters, 25.8%), 10 to 14 minutes (165 commuters, 18.4%), and 5 to 9 minutes (142 commuters, 15.9%).
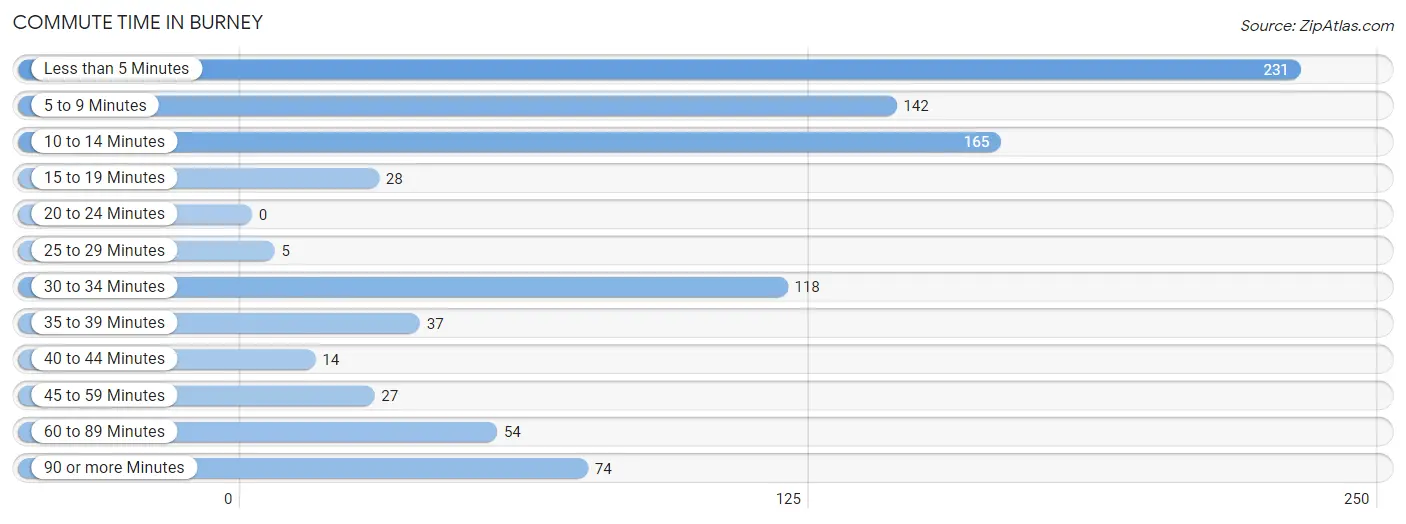
| Commute Time | # Commuters | % Commuters |
| Less than 5 Minutes | 231 | 25.8% |
| 5 to 9 Minutes | 142 | 15.9% |
| 10 to 14 Minutes | 165 | 18.4% |
| 15 to 19 Minutes | 28 | 3.1% |
| 20 to 24 Minutes | 0 | 0.0% |
| 25 to 29 Minutes | 5 | 0.6% |
| 30 to 34 Minutes | 118 | 13.2% |
| 35 to 39 Minutes | 37 | 4.1% |
| 40 to 44 Minutes | 14 | 1.6% |
| 45 to 59 Minutes | 27 | 3.0% |
| 60 to 89 Minutes | 54 | 6.0% |
| 90 or more Minutes | 74 | 8.3% |
Commute Time by Sex in Burney
The most common commute times in Burney are 10 to 14 minutes (109 commuters, 21.1%) for males and less than 5 minutes (135 commuters, 35.7%) for females.
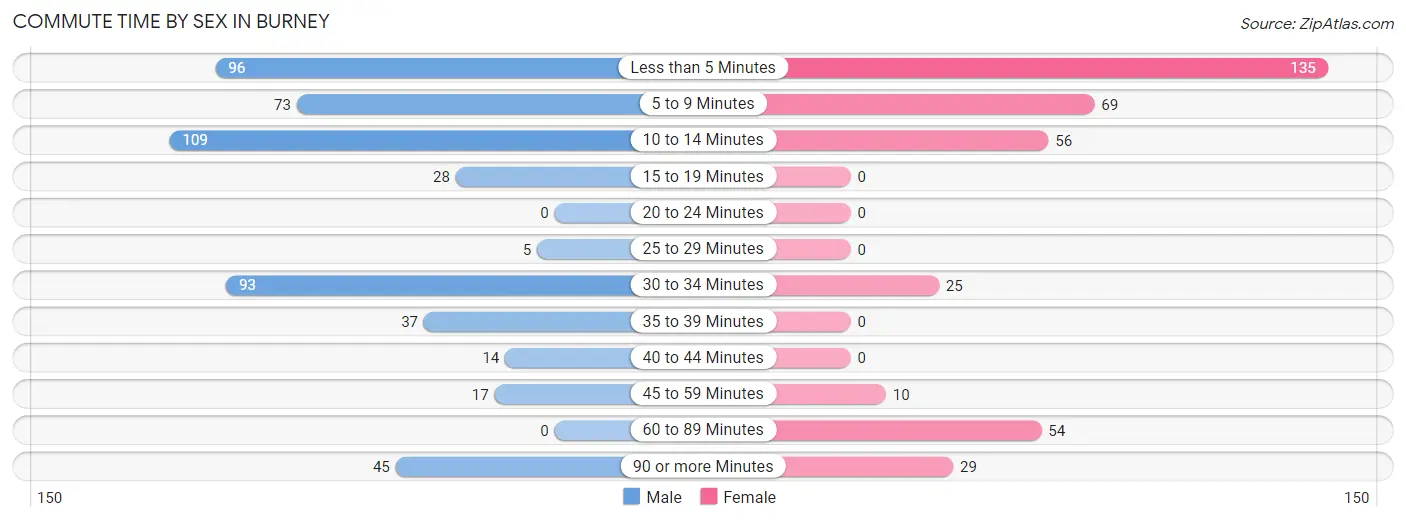
| Commute Time | Male | Female |
| Less than 5 Minutes | 96 (18.6%) | 135 (35.7%) |
| 5 to 9 Minutes | 73 (14.1%) | 69 (18.2%) |
| 10 to 14 Minutes | 109 (21.1%) | 56 (14.8%) |
| 15 to 19 Minutes | 28 (5.4%) | 0 (0.0%) |
| 20 to 24 Minutes | 0 (0.0%) | 0 (0.0%) |
| 25 to 29 Minutes | 5 (1.0%) | 0 (0.0%) |
| 30 to 34 Minutes | 93 (18.0%) | 25 (6.6%) |
| 35 to 39 Minutes | 37 (7.2%) | 0 (0.0%) |
| 40 to 44 Minutes | 14 (2.7%) | 0 (0.0%) |
| 45 to 59 Minutes | 17 (3.3%) | 10 (2.6%) |
| 60 to 89 Minutes | 0 (0.0%) | 54 (14.3%) |
| 90 or more Minutes | 45 (8.7%) | 29 (7.7%) |
Time of Departure to Work by Sex in Burney
The most frequent times of departure to work in Burney are 12:00 AM to 4:59 AM (131, 25.3%) for males and 7:30 AM to 7:59 AM (151, 40.0%) for females.
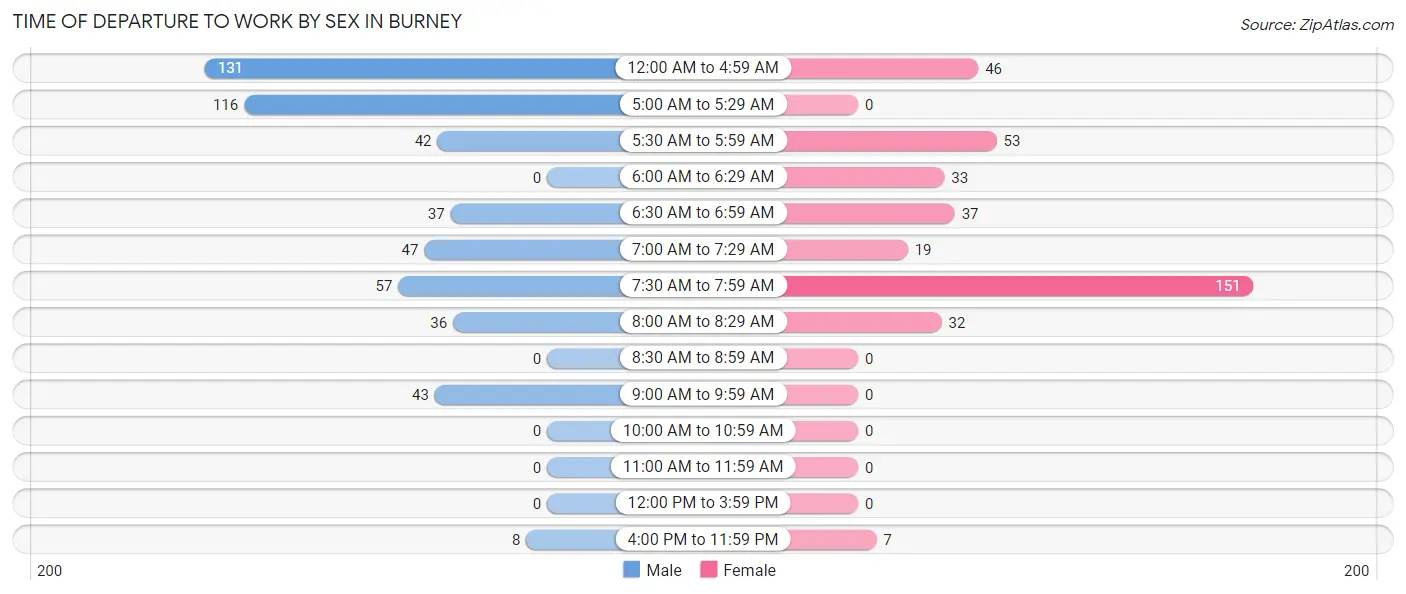
| Time of Departure | Male | Female |
| 12:00 AM to 4:59 AM | 131 (25.3%) | 46 (12.2%) |
| 5:00 AM to 5:29 AM | 116 (22.4%) | 0 (0.0%) |
| 5:30 AM to 5:59 AM | 42 (8.1%) | 53 (14.0%) |
| 6:00 AM to 6:29 AM | 0 (0.0%) | 33 (8.7%) |
| 6:30 AM to 6:59 AM | 37 (7.2%) | 37 (9.8%) |
| 7:00 AM to 7:29 AM | 47 (9.1%) | 19 (5.0%) |
| 7:30 AM to 7:59 AM | 57 (11.0%) | 151 (40.0%) |
| 8:00 AM to 8:29 AM | 36 (7.0%) | 32 (8.5%) |
| 8:30 AM to 8:59 AM | 0 (0.0%) | 0 (0.0%) |
| 9:00 AM to 9:59 AM | 43 (8.3%) | 0 (0.0%) |
| 10:00 AM to 10:59 AM | 0 (0.0%) | 0 (0.0%) |
| 11:00 AM to 11:59 AM | 0 (0.0%) | 0 (0.0%) |
| 12:00 PM to 3:59 PM | 0 (0.0%) | 0 (0.0%) |
| 4:00 PM to 11:59 PM | 8 (1.5%) | 7 (1.8%) |
| Total | 517 (100.0%) | 378 (100.0%) |
Housing Occupancy in Burney
Occupancy by Ownership in Burney
Of the total 1,191 dwellings in Burney, owner-occupied units account for 892 (74.9%), while renter-occupied units make up 299 (25.1%).
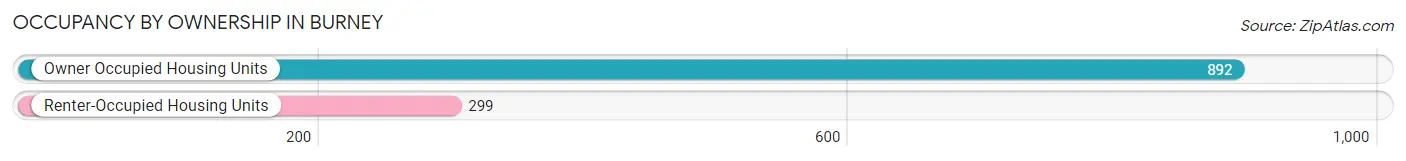
| Occupancy | # Housing Units | % Housing Units |
| Owner Occupied Housing Units | 892 | 74.9% |
| Renter-Occupied Housing Units | 299 | 25.1% |
| Total Occupied Housing Units | 1,191 | 100.0% |
Occupancy by Household Size in Burney
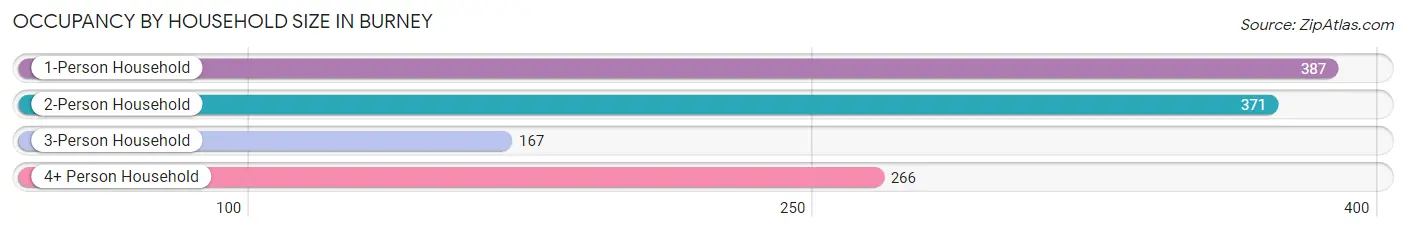
| Household Size | # Housing Units | % Housing Units |
| 1-Person Household | 387 | 32.5% |
| 2-Person Household | 371 | 31.1% |
| 3-Person Household | 167 | 14.0% |
| 4+ Person Household | 266 | 22.3% |
| Total Housing Units | 1,191 | 100.0% |
Occupancy by Ownership by Household Size in Burney
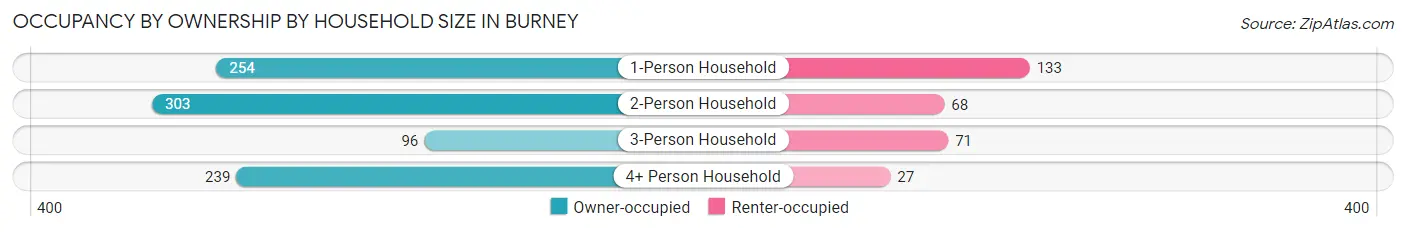
| Household Size | Owner-occupied | Renter-occupied |
| 1-Person Household | 254 (65.6%) | 133 (34.4%) |
| 2-Person Household | 303 (81.7%) | 68 (18.3%) |
| 3-Person Household | 96 (57.5%) | 71 (42.5%) |
| 4+ Person Household | 239 (89.8%) | 27 (10.2%) |
| Total Housing Units | 892 (74.9%) | 299 (25.1%) |
Occupancy by Educational Attainment in Burney
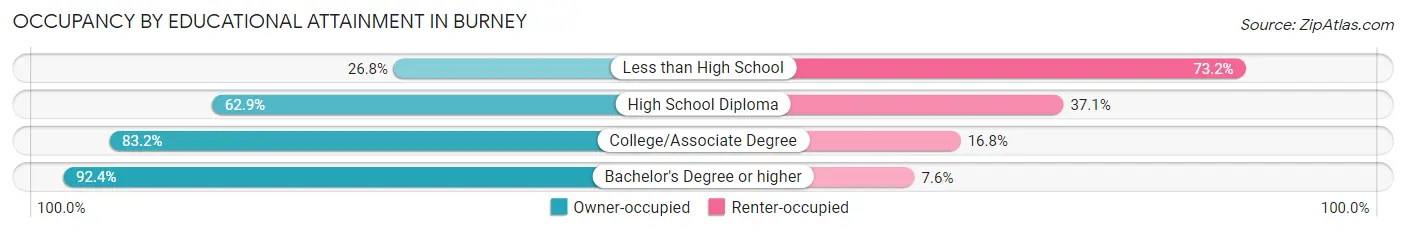
| Household Size | Owner-occupied | Renter-occupied |
| Less than High School | 15 (26.8%) | 41 (73.2%) |
| High School Diploma | 242 (62.9%) | 143 (37.1%) |
| College/Associate Degree | 526 (83.2%) | 106 (16.8%) |
| Bachelor's Degree or higher | 109 (92.4%) | 9 (7.6%) |
Occupancy by Age of Householder in Burney
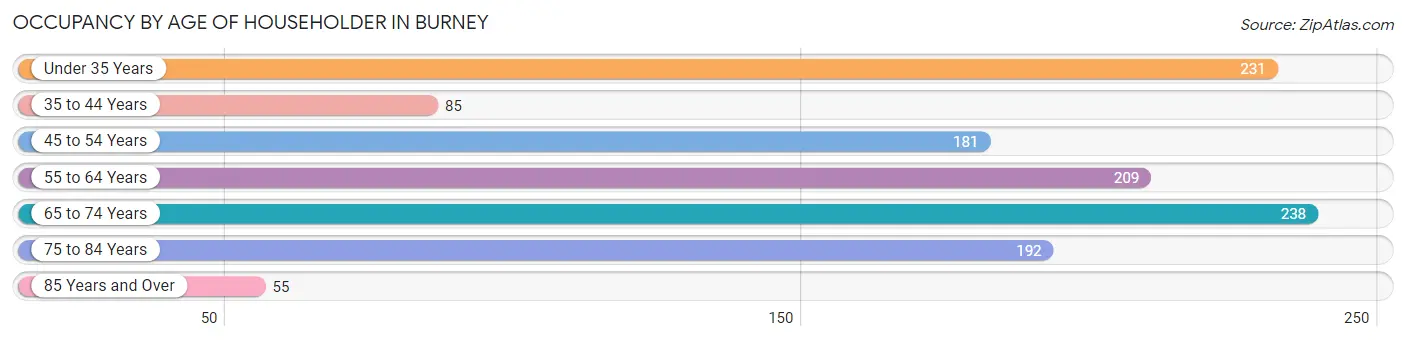
| Age Bracket | # Households | % Households |
| Under 35 Years | 231 | 19.4% |
| 35 to 44 Years | 85 | 7.1% |
| 45 to 54 Years | 181 | 15.2% |
| 55 to 64 Years | 209 | 17.5% |
| 65 to 74 Years | 238 | 20.0% |
| 75 to 84 Years | 192 | 16.1% |
| 85 Years and Over | 55 | 4.6% |
| Total | 1,191 | 100.0% |
Housing Finances in Burney
Median Income by Occupancy in Burney
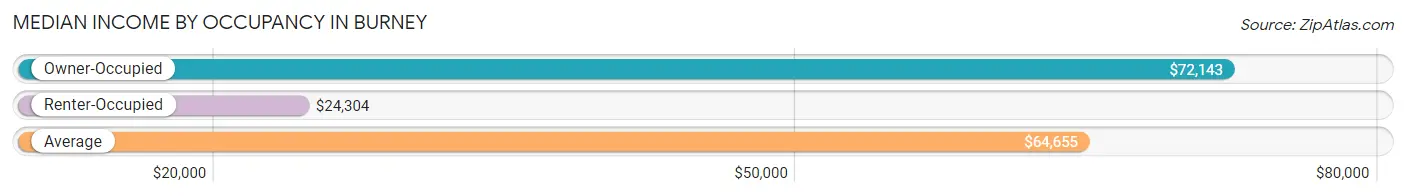
| Occupancy Type | # Households | Median Income |
| Owner-Occupied | 892 (74.9%) | $72,143 |
| Renter-Occupied | 299 (25.1%) | $24,304 |
| Average | 1,191 (100.0%) | $64,655 |
Occupancy by Householder Income Bracket in Burney
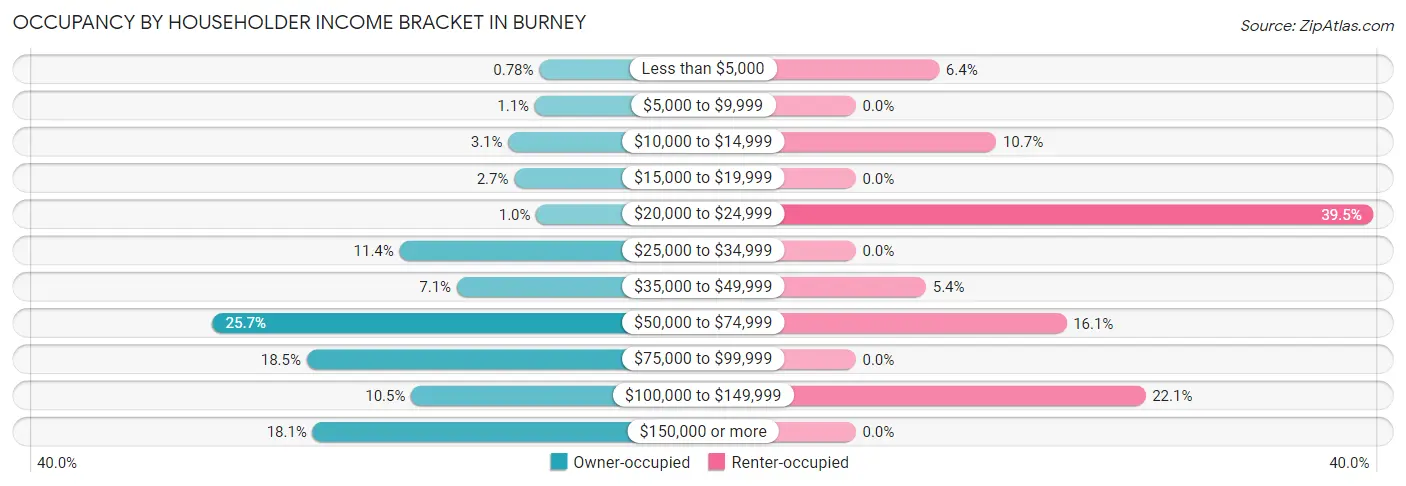
| Income Bracket | Owner-occupied | Renter-occupied |
| Less than $5,000 | 7 (0.8%) | 19 (6.4%) |
| $5,000 to $9,999 | 10 (1.1%) | 0 (0.0%) |
| $10,000 to $14,999 | 28 (3.1%) | 32 (10.7%) |
| $15,000 to $19,999 | 24 (2.7%) | 0 (0.0%) |
| $20,000 to $24,999 | 9 (1.0%) | 118 (39.5%) |
| $25,000 to $34,999 | 102 (11.4%) | 0 (0.0%) |
| $35,000 to $49,999 | 63 (7.1%) | 16 (5.3%) |
| $50,000 to $74,999 | 229 (25.7%) | 48 (16.1%) |
| $75,000 to $99,999 | 165 (18.5%) | 0 (0.0%) |
| $100,000 to $149,999 | 94 (10.5%) | 66 (22.1%) |
| $150,000 or more | 161 (18.0%) | 0 (0.0%) |
| Total | 892 (100.0%) | 299 (100.0%) |
Monthly Housing Cost Tiers in Burney
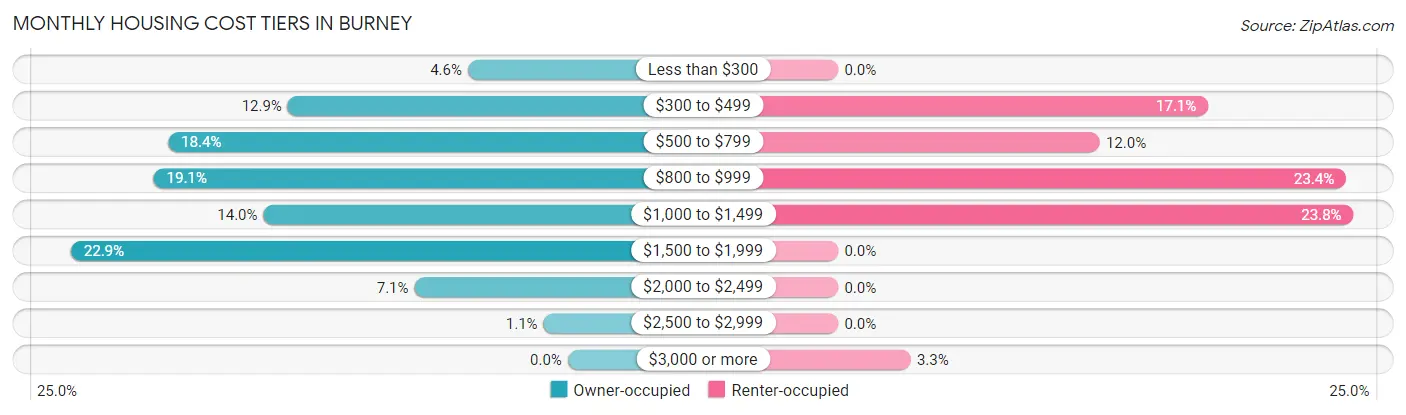
| Monthly Cost | Owner-occupied | Renter-occupied |
| Less than $300 | 41 (4.6%) | 0 (0.0%) |
| $300 to $499 | 115 (12.9%) | 51 (17.1%) |
| $500 to $799 | 164 (18.4%) | 36 (12.0%) |
| $800 to $999 | 170 (19.1%) | 70 (23.4%) |
| $1,000 to $1,499 | 125 (14.0%) | 71 (23.7%) |
| $1,500 to $1,999 | 204 (22.9%) | 0 (0.0%) |
| $2,000 to $2,499 | 63 (7.1%) | 0 (0.0%) |
| $2,500 to $2,999 | 10 (1.1%) | 0 (0.0%) |
| $3,000 or more | 0 (0.0%) | 10 (3.3%) |
| Total | 892 (100.0%) | 299 (100.0%) |
Physical Housing Characteristics in Burney
Housing Structures in Burney
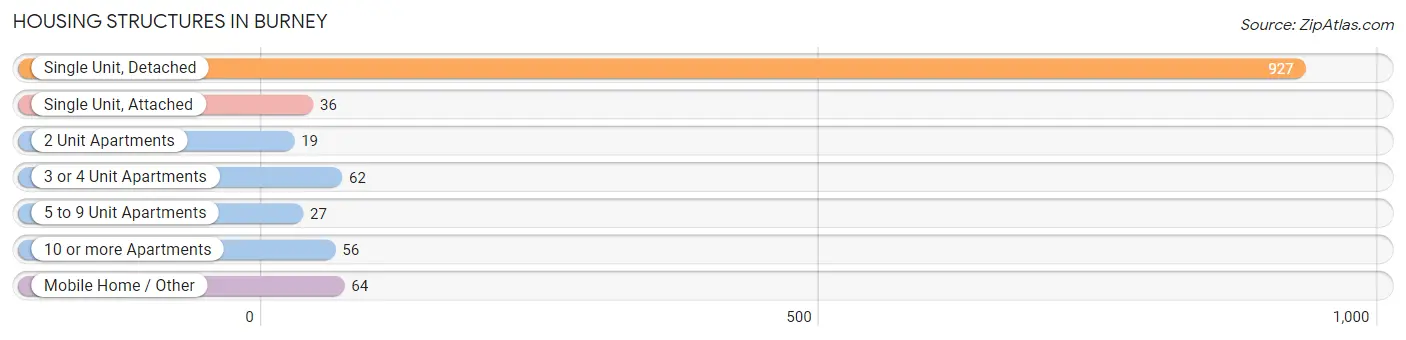
| Structure Type | # Housing Units | % Housing Units |
| Single Unit, Detached | 927 | 77.8% |
| Single Unit, Attached | 36 | 3.0% |
| 2 Unit Apartments | 19 | 1.6% |
| 3 or 4 Unit Apartments | 62 | 5.2% |
| 5 to 9 Unit Apartments | 27 | 2.3% |
| 10 or more Apartments | 56 | 4.7% |
| Mobile Home / Other | 64 | 5.4% |
| Total | 1,191 | 100.0% |
Housing Structures by Occupancy in Burney
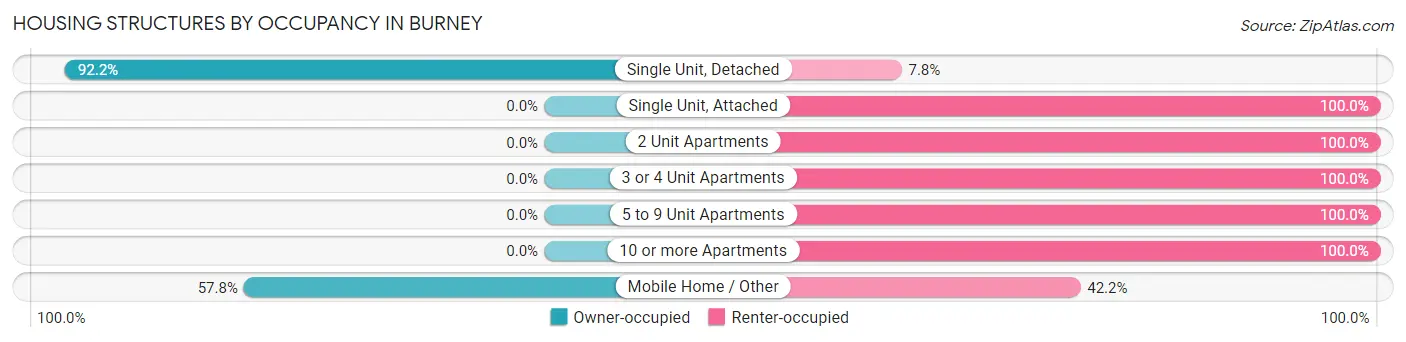
| Structure Type | Owner-occupied | Renter-occupied |
| Single Unit, Detached | 855 (92.2%) | 72 (7.8%) |
| Single Unit, Attached | 0 (0.0%) | 36 (100.0%) |
| 2 Unit Apartments | 0 (0.0%) | 19 (100.0%) |
| 3 or 4 Unit Apartments | 0 (0.0%) | 62 (100.0%) |
| 5 to 9 Unit Apartments | 0 (0.0%) | 27 (100.0%) |
| 10 or more Apartments | 0 (0.0%) | 56 (100.0%) |
| Mobile Home / Other | 37 (57.8%) | 27 (42.2%) |
| Total | 892 (74.9%) | 299 (25.1%) |
Housing Structures by Number of Rooms in Burney
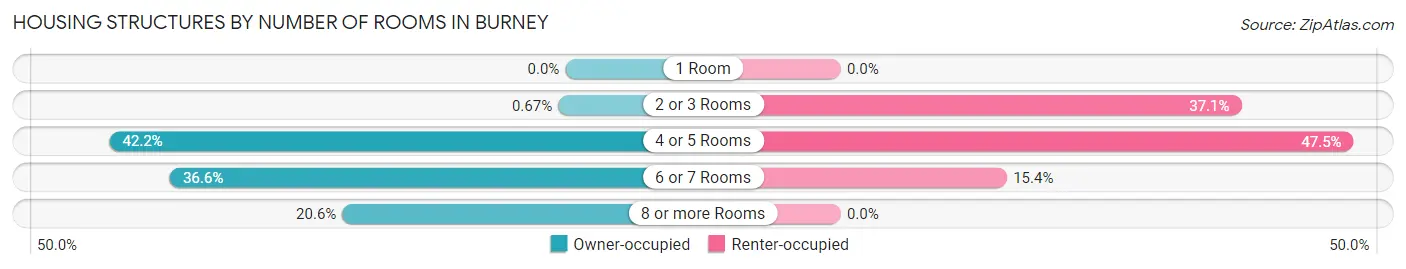
| Number of Rooms | Owner-occupied | Renter-occupied |
| 1 Room | 0 (0.0%) | 0 (0.0%) |
| 2 or 3 Rooms | 6 (0.7%) | 111 (37.1%) |
| 4 or 5 Rooms | 376 (42.1%) | 142 (47.5%) |
| 6 or 7 Rooms | 326 (36.5%) | 46 (15.4%) |
| 8 or more Rooms | 184 (20.6%) | 0 (0.0%) |
| Total | 892 (100.0%) | 299 (100.0%) |
Housing Structure by Heating Type in Burney
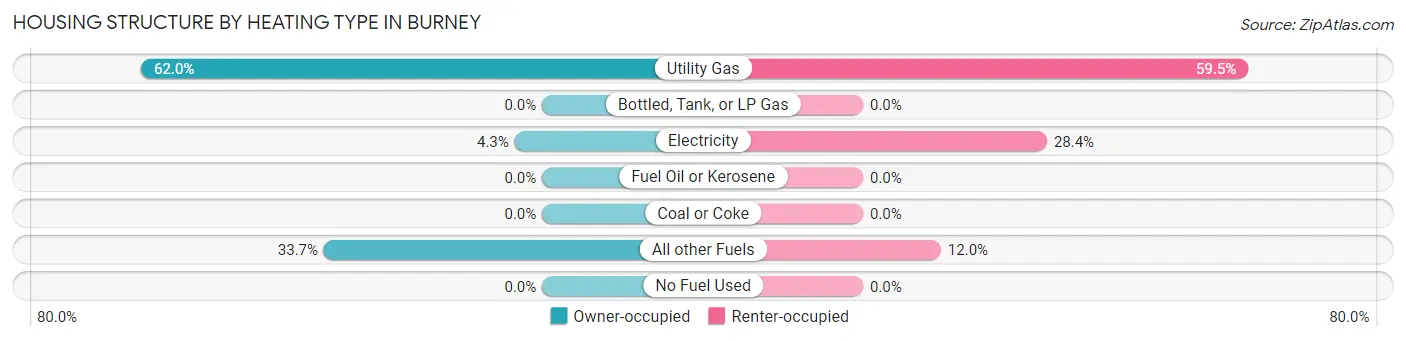
| Heating Type | Owner-occupied | Renter-occupied |
| Utility Gas | 553 (62.0%) | 178 (59.5%) |
| Bottled, Tank, or LP Gas | 0 (0.0%) | 0 (0.0%) |
| Electricity | 38 (4.3%) | 85 (28.4%) |
| Fuel Oil or Kerosene | 0 (0.0%) | 0 (0.0%) |
| Coal or Coke | 0 (0.0%) | 0 (0.0%) |
| All other Fuels | 301 (33.7%) | 36 (12.0%) |
| No Fuel Used | 0 (0.0%) | 0 (0.0%) |
| Total | 892 (100.0%) | 299 (100.0%) |
Household Vehicle Usage in Burney
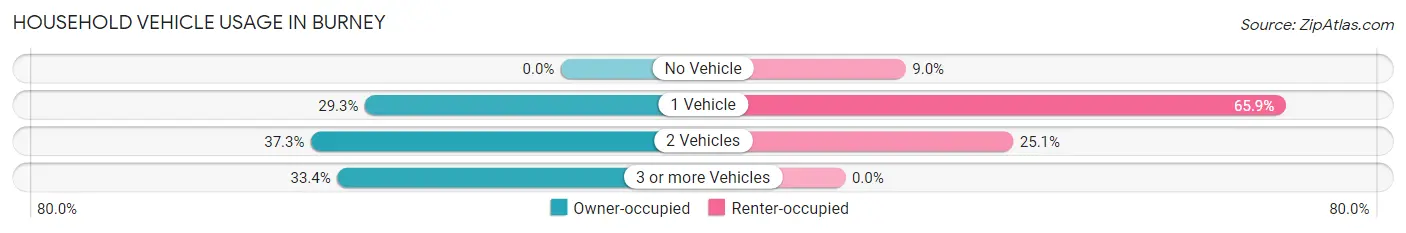
| Vehicles per Household | Owner-occupied | Renter-occupied |
| No Vehicle | 0 (0.0%) | 27 (9.0%) |
| 1 Vehicle | 261 (29.3%) | 197 (65.9%) |
| 2 Vehicles | 333 (37.3%) | 75 (25.1%) |
| 3 or more Vehicles | 298 (33.4%) | 0 (0.0%) |
| Total | 892 (100.0%) | 299 (100.0%) |
Real Estate & Mortgages in Burney
Real Estate and Mortgage Overview in Burney
| Characteristic | Without Mortgage | With Mortgage |
| Housing Units | 371 | 521 |
| Median Property Value | $226,000 | $199,800 |
| Median Household Income | $64,831 | $125 |
| Monthly Housing Costs | $550 | $0 |
| Real Estate Taxes | $1,346 | $13 |
Property Value by Mortgage Status in Burney
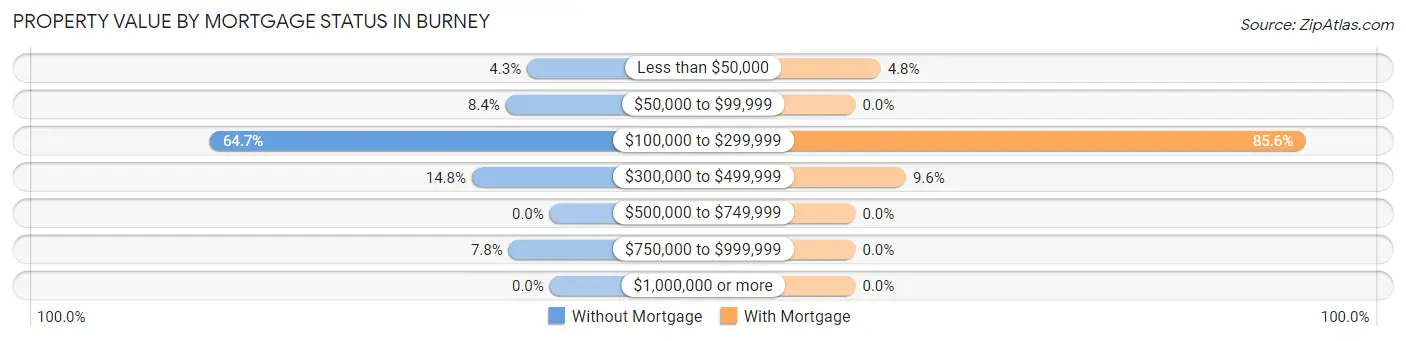
| Property Value | Without Mortgage | With Mortgage |
| Less than $50,000 | 16 (4.3%) | 25 (4.8%) |
| $50,000 to $99,999 | 31 (8.4%) | 0 (0.0%) |
| $100,000 to $299,999 | 240 (64.7%) | 446 (85.6%) |
| $300,000 to $499,999 | 55 (14.8%) | 50 (9.6%) |
| $500,000 to $749,999 | 0 (0.0%) | 0 (0.0%) |
| $750,000 to $999,999 | 29 (7.8%) | 0 (0.0%) |
| $1,000,000 or more | 0 (0.0%) | 0 (0.0%) |
| Total | 371 (100.0%) | 521 (100.0%) |
Household Income by Mortgage Status in Burney
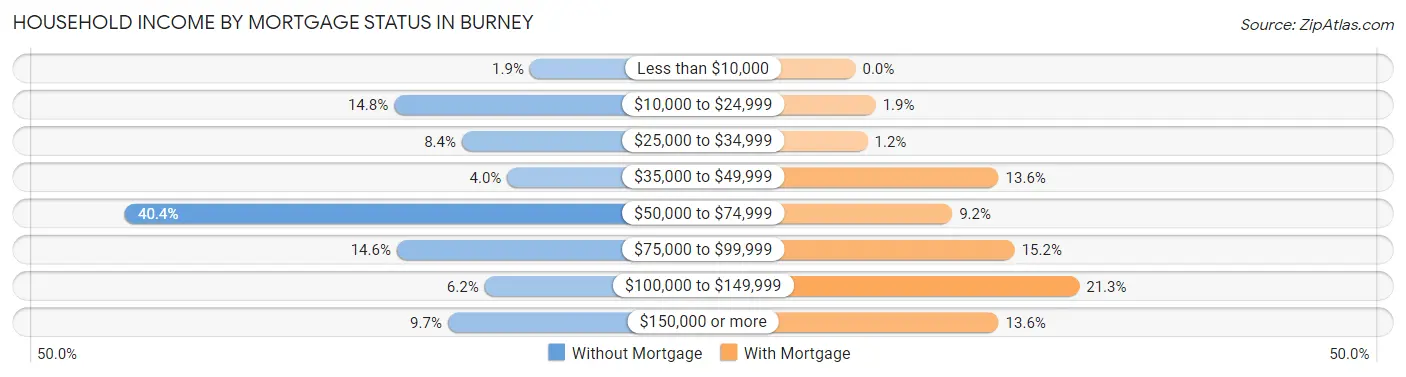
| Household Income | Without Mortgage | With Mortgage |
| Less than $10,000 | 7 (1.9%) | 0 (0.0%) |
| $10,000 to $24,999 | 55 (14.8%) | 10 (1.9%) |
| $25,000 to $34,999 | 31 (8.4%) | 6 (1.1%) |
| $35,000 to $49,999 | 15 (4.0%) | 71 (13.6%) |
| $50,000 to $74,999 | 150 (40.4%) | 48 (9.2%) |
| $75,000 to $99,999 | 54 (14.6%) | 79 (15.2%) |
| $100,000 to $149,999 | 23 (6.2%) | 111 (21.3%) |
| $150,000 or more | 36 (9.7%) | 71 (13.6%) |
| Total | 371 (100.0%) | 521 (100.0%) |
Property Value to Household Income Ratio in Burney
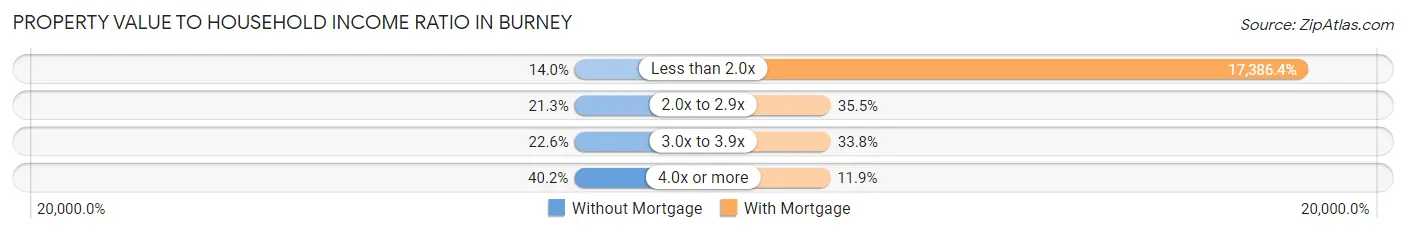
| Value-to-Income Ratio | Without Mortgage | With Mortgage |
| Less than 2.0x | 52 (14.0%) | 90,583 (17,386.4%) |
| 2.0x to 2.9x | 79 (21.3%) | 185 (35.5%) |
| 3.0x to 3.9x | 84 (22.6%) | 176 (33.8%) |
| 4.0x or more | 149 (40.2%) | 62 (11.9%) |
| Total | 371 (100.0%) | 521 (100.0%) |
Real Estate Taxes by Mortgage Status in Burney
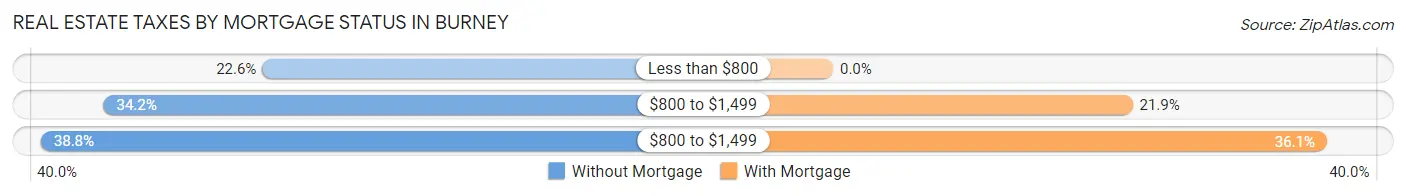
| Property Taxes | Without Mortgage | With Mortgage |
| Less than $800 | 84 (22.6%) | 0 (0.0%) |
| $800 to $1,499 | 127 (34.2%) | 114 (21.9%) |
| $800 to $1,499 | 144 (38.8%) | 188 (36.1%) |
| Total | 371 (100.0%) | 521 (100.0%) |
Health & Disability in Burney
Health Insurance Coverage by Age in Burney
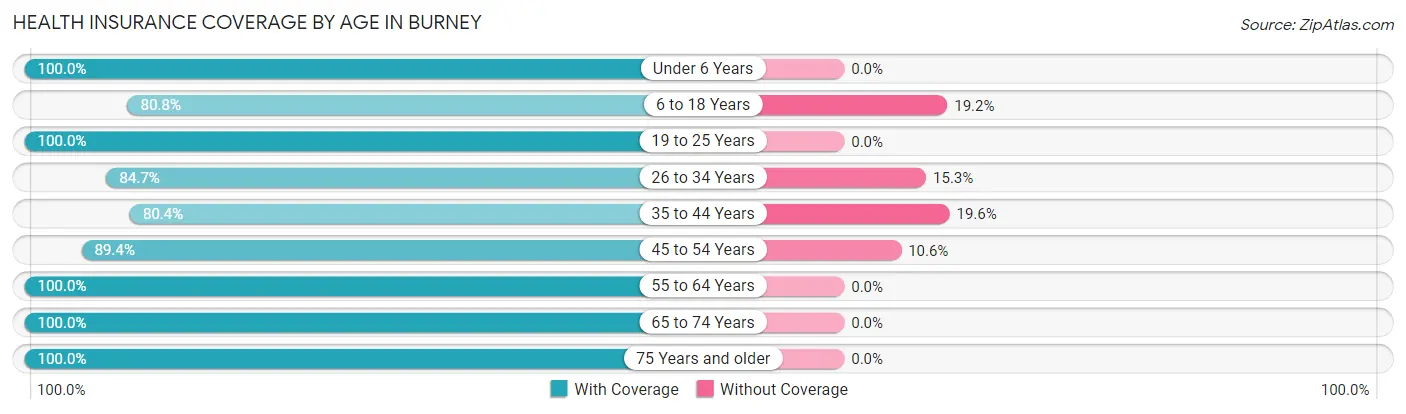
| Age Bracket | With Coverage | Without Coverage |
| Under 6 Years | 420 (100.0%) | 0 (0.0%) |
| 6 to 18 Years | 408 (80.8%) | 97 (19.2%) |
| 19 to 25 Years | 171 (100.0%) | 0 (0.0%) |
| 26 to 34 Years | 311 (84.7%) | 56 (15.3%) |
| 35 to 44 Years | 172 (80.4%) | 42 (19.6%) |
| 45 to 54 Years | 354 (89.4%) | 42 (10.6%) |
| 55 to 64 Years | 279 (100.0%) | 0 (0.0%) |
| 65 to 74 Years | 484 (100.0%) | 0 (0.0%) |
| 75 Years and older | 350 (100.0%) | 0 (0.0%) |
| Total | 2,949 (92.6%) | 237 (7.4%) |
Health Insurance Coverage by Citizenship Status in Burney
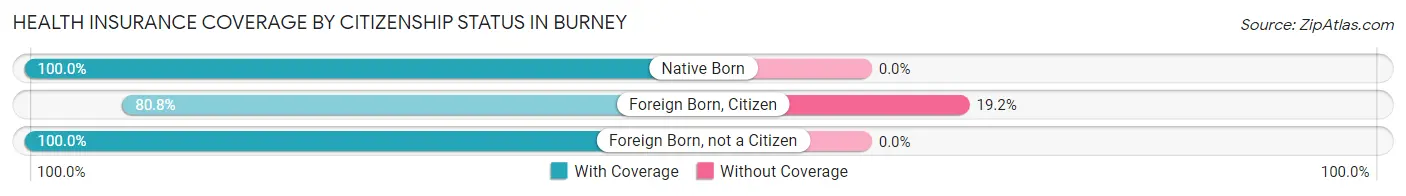
| Citizenship Status | With Coverage | Without Coverage |
| Native Born | 420 (100.0%) | 0 (0.0%) |
| Foreign Born, Citizen | 408 (80.8%) | 97 (19.2%) |
| Foreign Born, not a Citizen | 171 (100.0%) | 0 (0.0%) |
Health Insurance Coverage by Household Income in Burney
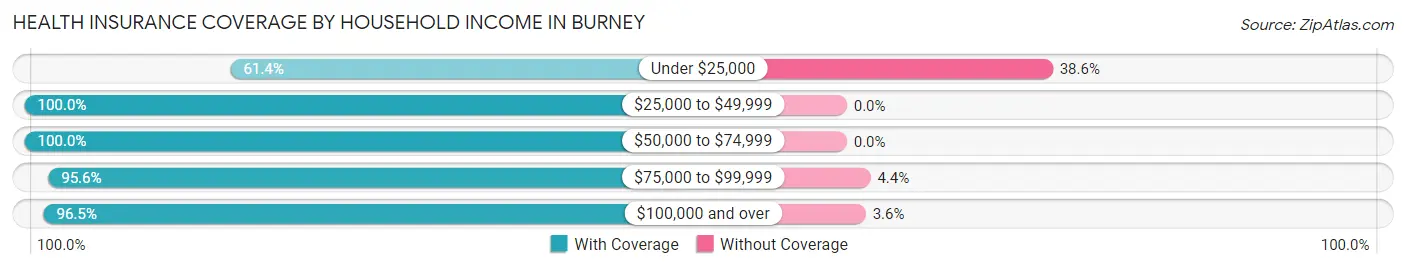
| Household Income | With Coverage | Without Coverage |
| Under $25,000 | 269 (61.4%) | 169 (38.6%) |
| $25,000 to $49,999 | 277 (100.0%) | 0 (0.0%) |
| $50,000 to $74,999 | 631 (100.0%) | 0 (0.0%) |
| $75,000 to $99,999 | 645 (95.6%) | 30 (4.4%) |
| $100,000 and over | 1,031 (96.5%) | 38 (3.5%) |
Public vs Private Health Insurance Coverage by Age in Burney
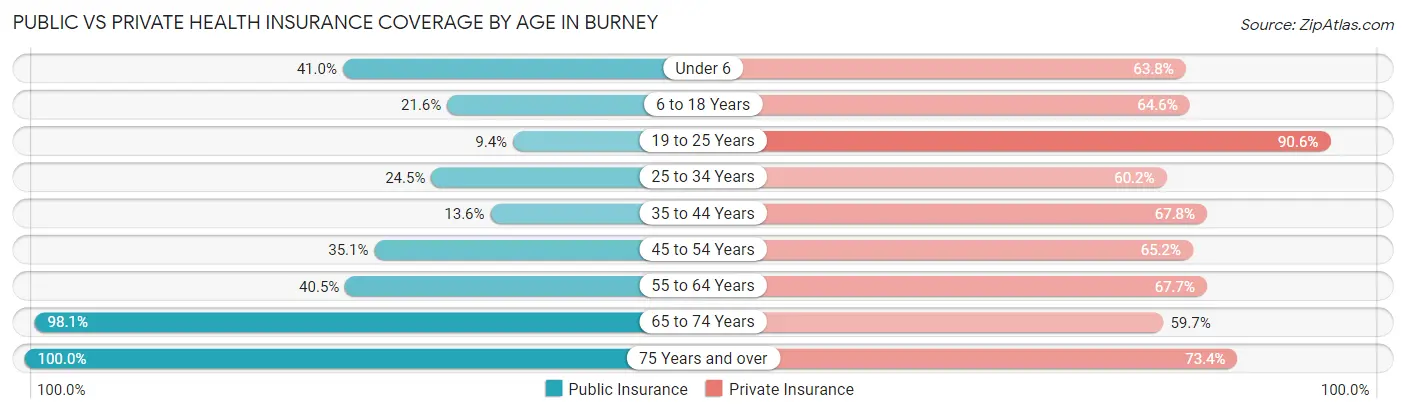
| Age Bracket | Public Insurance | Private Insurance |
| Under 6 | 172 (40.9%) | 268 (63.8%) |
| 6 to 18 Years | 109 (21.6%) | 326 (64.5%) |
| 19 to 25 Years | 16 (9.4%) | 155 (90.6%) |
| 25 to 34 Years | 90 (24.5%) | 221 (60.2%) |
| 35 to 44 Years | 29 (13.6%) | 145 (67.8%) |
| 45 to 54 Years | 139 (35.1%) | 258 (65.1%) |
| 55 to 64 Years | 113 (40.5%) | 189 (67.7%) |
| 65 to 74 Years | 475 (98.1%) | 289 (59.7%) |
| 75 Years and over | 350 (100.0%) | 257 (73.4%) |
| Total | 1,493 (46.9%) | 2,108 (66.2%) |
Disability Status by Sex by Age in Burney
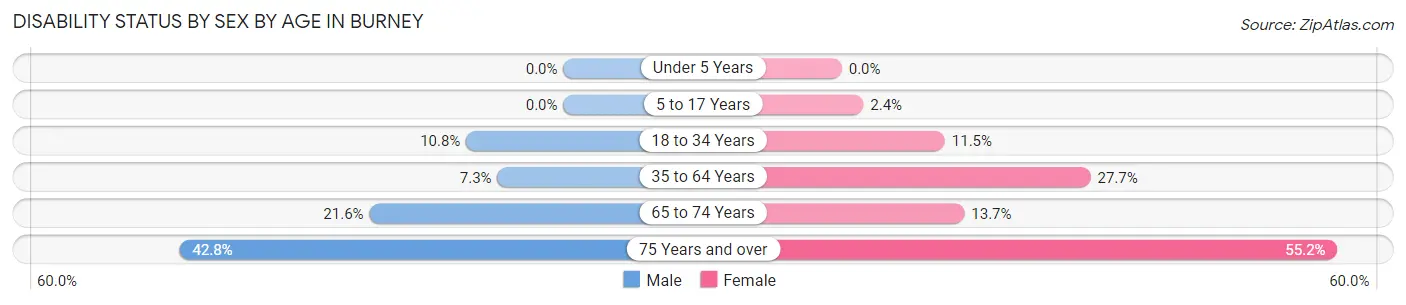
| Age Bracket | Male | Female |
| Under 5 Years | 0 (0.0%) | 0 (0.0%) |
| 5 to 17 Years | 0 (0.0%) | 8 (2.4%) |
| 18 to 34 Years | 29 (10.8%) | 31 (11.5%) |
| 35 to 64 Years | 34 (7.3%) | 118 (27.7%) |
| 65 to 74 Years | 46 (21.6%) | 37 (13.7%) |
| 75 Years and over | 59 (42.7%) | 117 (55.2%) |
Disability Class by Sex by Age in Burney
Disability Class: Hearing Difficulty
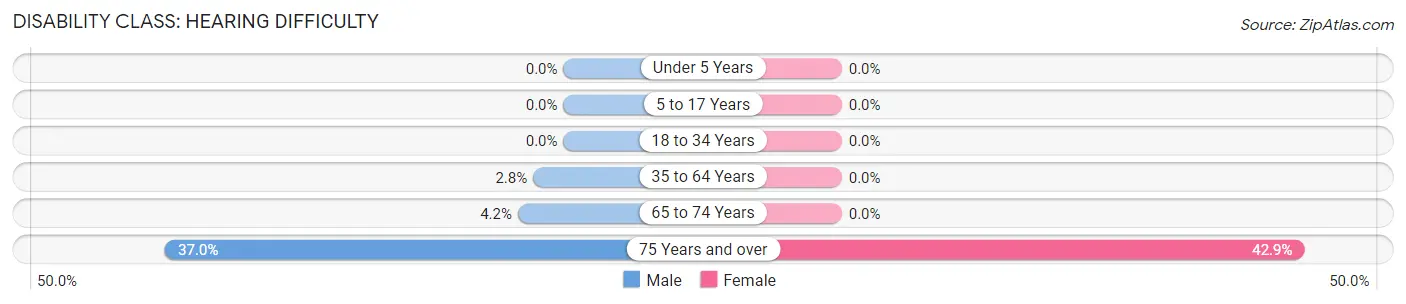
| Age Bracket | Male | Female |
| Under 5 Years | 0 (0.0%) | 0 (0.0%) |
| 5 to 17 Years | 0 (0.0%) | 0 (0.0%) |
| 18 to 34 Years | 0 (0.0%) | 0 (0.0%) |
| 35 to 64 Years | 13 (2.8%) | 0 (0.0%) |
| 65 to 74 Years | 9 (4.2%) | 0 (0.0%) |
| 75 Years and over | 51 (37.0%) | 91 (42.9%) |
Disability Class: Vision Difficulty
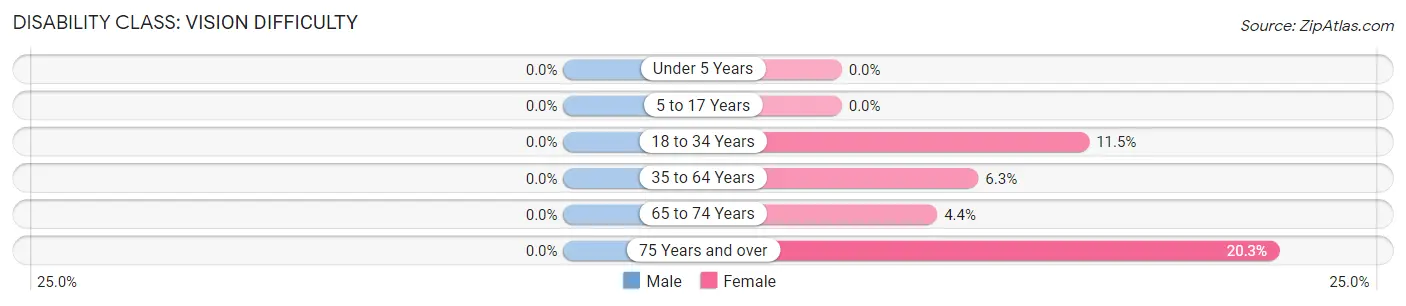
| Age Bracket | Male | Female |
| Under 5 Years | 0 (0.0%) | 0 (0.0%) |
| 5 to 17 Years | 0 (0.0%) | 0 (0.0%) |
| 18 to 34 Years | 0 (0.0%) | 31 (11.5%) |
| 35 to 64 Years | 0 (0.0%) | 27 (6.3%) |
| 65 to 74 Years | 0 (0.0%) | 12 (4.4%) |
| 75 Years and over | 0 (0.0%) | 43 (20.3%) |
Disability Class: Cognitive Difficulty
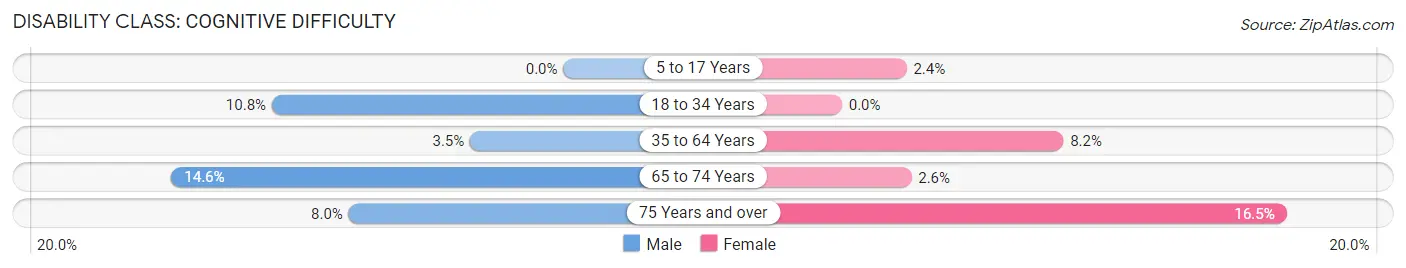
| Age Bracket | Male | Female |
| 5 to 17 Years | 0 (0.0%) | 8 (2.4%) |
| 18 to 34 Years | 29 (10.8%) | 0 (0.0%) |
| 35 to 64 Years | 16 (3.5%) | 35 (8.2%) |
| 65 to 74 Years | 31 (14.5%) | 7 (2.6%) |
| 75 Years and over | 11 (8.0%) | 35 (16.5%) |
Disability Class: Ambulatory Difficulty
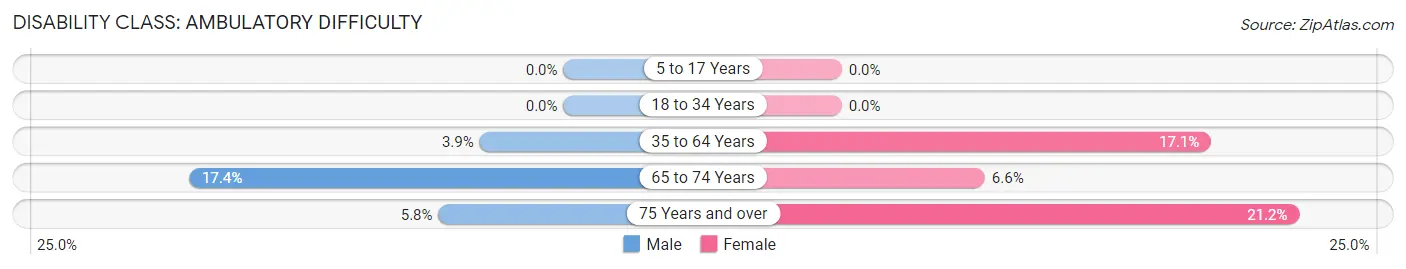
| Age Bracket | Male | Female |
| 5 to 17 Years | 0 (0.0%) | 0 (0.0%) |
| 18 to 34 Years | 0 (0.0%) | 0 (0.0%) |
| 35 to 64 Years | 18 (3.9%) | 73 (17.1%) |
| 65 to 74 Years | 37 (17.4%) | 18 (6.6%) |
| 75 Years and over | 8 (5.8%) | 45 (21.2%) |
Disability Class: Self-Care Difficulty
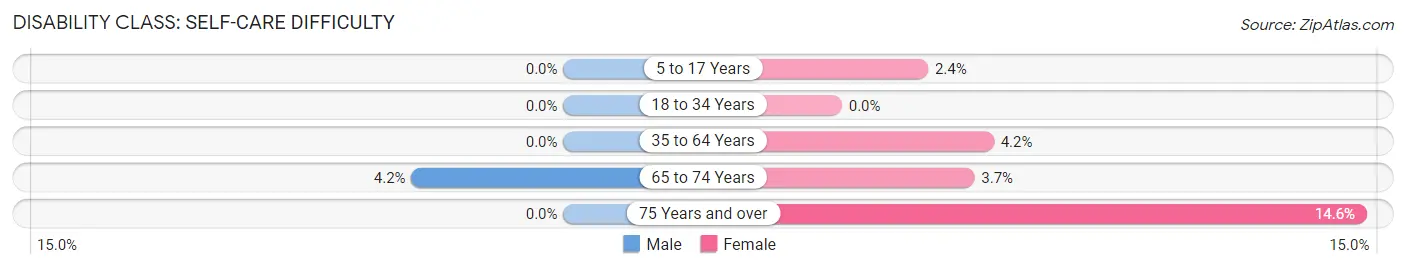
| Age Bracket | Male | Female |
| 5 to 17 Years | 0 (0.0%) | 8 (2.4%) |
| 18 to 34 Years | 0 (0.0%) | 0 (0.0%) |
| 35 to 64 Years | 0 (0.0%) | 18 (4.2%) |
| 65 to 74 Years | 9 (4.2%) | 10 (3.7%) |
| 75 Years and over | 0 (0.0%) | 31 (14.6%) |
Technology Access in Burney
Computing Device Access in Burney
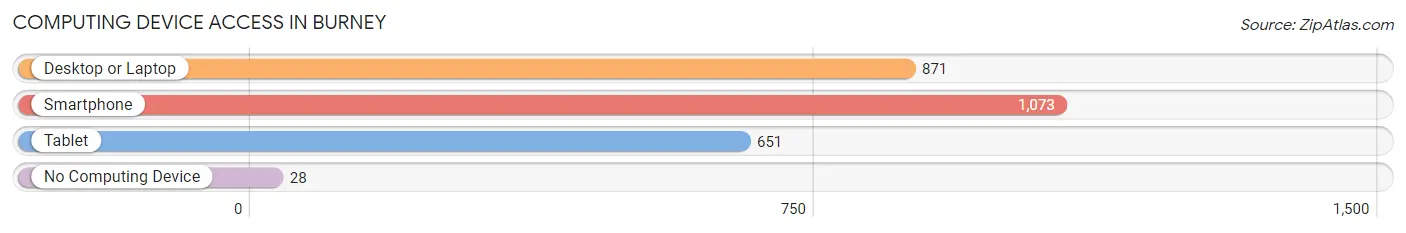
| Device Type | # Households | % Households |
| Desktop or Laptop | 871 | 73.1% |
| Smartphone | 1,073 | 90.1% |
| Tablet | 651 | 54.7% |
| No Computing Device | 28 | 2.4% |
| Total | 1,191 | 100.0% |
Internet Access in Burney
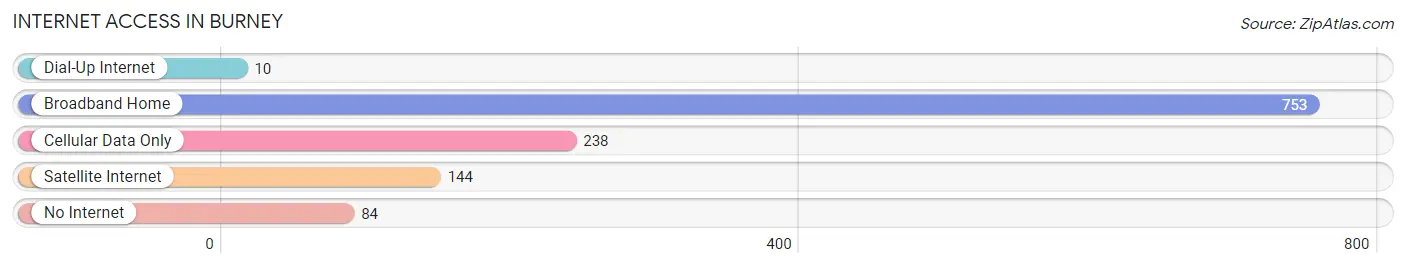
| Internet Type | # Households | % Households |
| Dial-Up Internet | 10 | 0.8% |
| Broadband Home | 753 | 63.2% |
| Cellular Data Only | 238 | 20.0% |
| Satellite Internet | 144 | 12.1% |
| No Internet | 84 | 7.0% |
| Total | 1,191 | 100.0% |
Burney Summary
Burney is a small unincorporated community located in Shasta County, California. It is situated in the Cascade Range, approximately 20 miles east of Redding. The town is located at an elevation of 2,890 feet and has a population of approximately 2,000 people.
History
Burney was first settled in the late 1800s by settlers from the Midwest. The town was named after a local rancher, John Burney, who owned a large ranch in the area. The town was officially incorporated in 1891.
In the early 1900s, Burney was a thriving logging and ranching community. The town was home to several sawmills, a flour mill, and a creamery. The town also had a hotel, a bank, and a post office.
In the 1920s, the town began to decline as the logging industry moved away from the area. The town was further impacted by the Great Depression and World War II. By the 1950s, the town had become a small, quiet community.
Geography
Burney is located in the Cascade Range, approximately 20 miles east of Redding. The town is situated at an elevation of 2,890 feet. The town is surrounded by the Shasta-Trinity National Forest and is located near several lakes, including Lake Britton, Lake McCumber, and Lake Siskiyou.
The climate in Burney is generally mild, with hot summers and cold winters. The average annual temperature is around 50 degrees Fahrenheit. The average annual precipitation is around 20 inches.
Economy
The economy of Burney is largely based on tourism. The town is home to several campgrounds, resorts, and recreational areas. The town is also home to several restaurants, stores, and other businesses.
The town is also home to several small businesses, including a lumber mill, a sawmill, and a furniture store. The town is also home to several farms and ranches.
Demographics
As of the 2010 census, the population of Burney was 2,000. The racial makeup of the town was 94.2% White, 0.7% African American, 0.7% Native American, 0.7% Asian, 0.3% Pacific Islander, and 2.3% from other races. The median household income was $37,500.
Conclusion
Burney is a small unincorporated community located in Shasta County, California. It is situated in the Cascade Range, approximately 20 miles east of Redding. The town is located at an elevation of 2,890 feet and has a population of approximately 2,000 people. The economy of Burney is largely based on tourism, with several campgrounds, resorts, and recreational areas. The town is also home to several small businesses, including a lumber mill, a sawmill, and a furniture store. The racial makeup of the town is 94.2% White, 0.7% African American, 0.7% Native American, 0.7% Asian, 0.3% Pacific Islander, and 2.3% from other races. The median household income was $37,500.
Common Questions
What is Per Capita Income in Burney?
Per Capita income in Burney is $30,560.
What is the Median Family Income in Burney?
Median Family Income in Burney is $73,424.
What is the Median Household income in Burney?
Median Household Income in Burney is $64,655.
What is Inequality or Gini Index in Burney?
Inequality or Gini Index in Burney is 0.40.
What is the Total Population of Burney?
Total Population of Burney is 3,186.
What is the Total Male Population of Burney?
Total Male Population of Burney is 1,477.
What is the Total Female Population of Burney?
Total Female Population of Burney is 1,709.
What is the Ratio of Males per 100 Females in Burney?
There are 86.42 Males per 100 Females in Burney.
What is the Ratio of Females per 100 Males in Burney?
There are 115.71 Females per 100 Males in Burney.
What is the Median Population Age in Burney?
Median Population Age in Burney is 41.1 Years.
What is the Average Family Size in Burney
Average Family Size in Burney is 3.4 People.
What is the Average Household Size in Burney
Average Household Size in Burney is 2.6 People.
How Large is the Labor Force in Burney?
There are 1,064 People in the Labor Forcein in Burney.
What is the Percentage of People in the Labor Force in Burney?
45.5% of People are in the Labor Force in Burney.
What is the Unemployment Rate in Burney?
Unemployment Rate in Burney is 14.1%.