Buellton, CA Map & Demographics
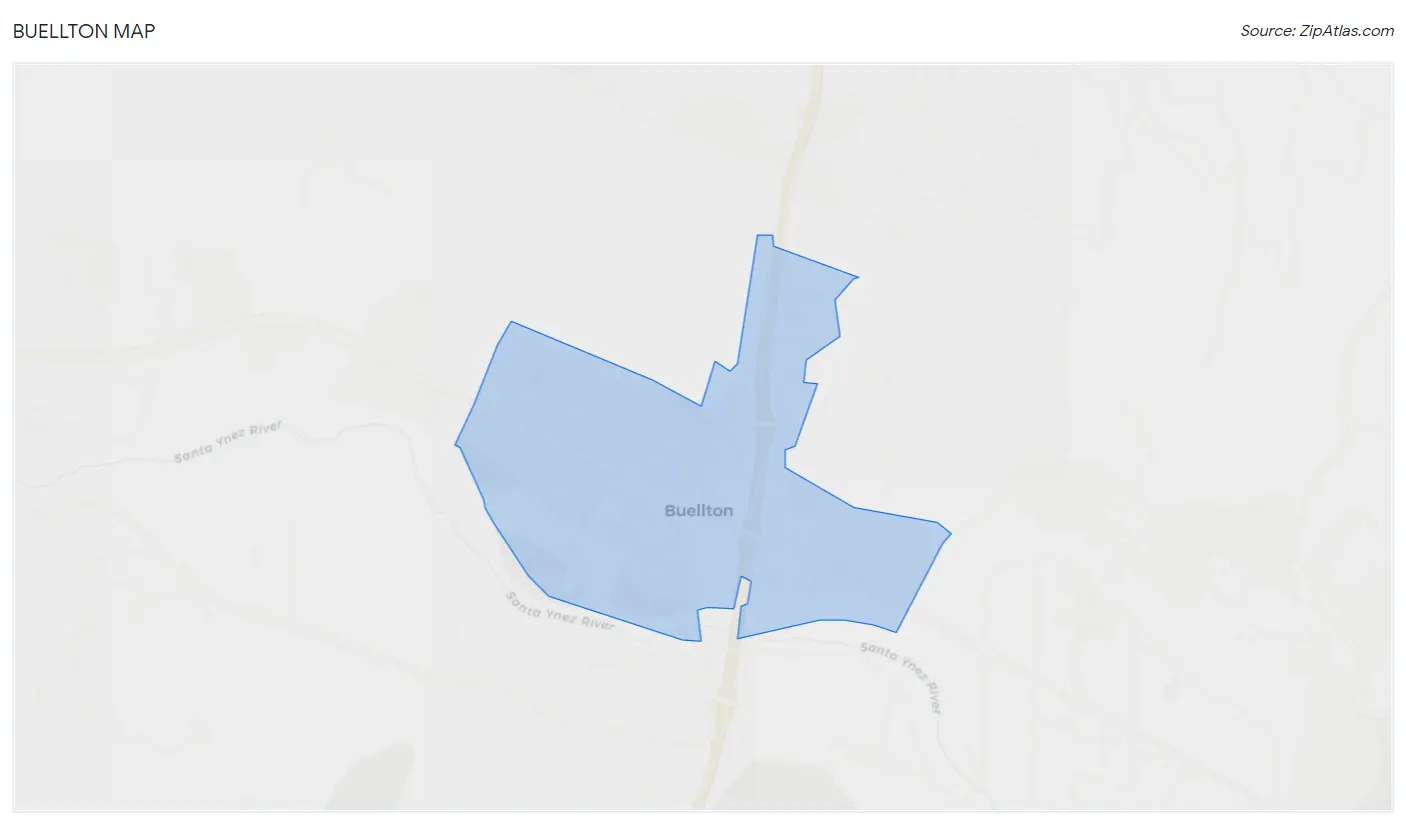
Buellton Map
Buellton Overview
$47,903
PER CAPITA INCOME
$126,447
AVG FAMILY INCOME
$102,361
AVG HOUSEHOLD INCOME
30.0%
WAGE / INCOME GAP [ % ]
70.0¢/ $1
WAGE / INCOME GAP [ $ ]
0.39
INEQUALITY / GINI INDEX
5,151
TOTAL POPULATION
2,387
MALE POPULATION
2,764
FEMALE POPULATION
86.36
MALES / 100 FEMALES
115.79
FEMALES / 100 MALES
37.9
MEDIAN AGE
3.0
AVG FAMILY SIZE
2.7
AVG HOUSEHOLD SIZE
3,125
LABOR FORCE [ PEOPLE ]
77.0%
PERCENT IN LABOR FORCE
2.9%
UNEMPLOYMENT RATE
Buellton Zip Codes
Buellton Area Codes
Income in Buellton
Income Overview in Buellton
Per Capita Income in Buellton is $47,903, while median incomes of families and households are $126,447 and $102,361 respectively.
| Characteristic | Number | Measure |
| Per Capita Income | 5,151 | $47,903 |
| Median Family Income | 1,574 | $126,447 |
| Mean Family Income | 1,574 | $140,324 |
| Median Household Income | 1,929 | $102,361 |
| Mean Household Income | 1,929 | $126,107 |
| Income Deficit | 1,574 | $0 |
| Wage / Income Gap (%) | 5,151 | 29.99% |
| Wage / Income Gap ($) | 5,151 | 70.01¢ per $1 |
| Gini / Inequality Index | 5,151 | 0.39 |
Earnings by Sex in Buellton
Average Earnings in Buellton are $55,669, $65,433 for men and $45,812 for women, a difference of 30.0%.
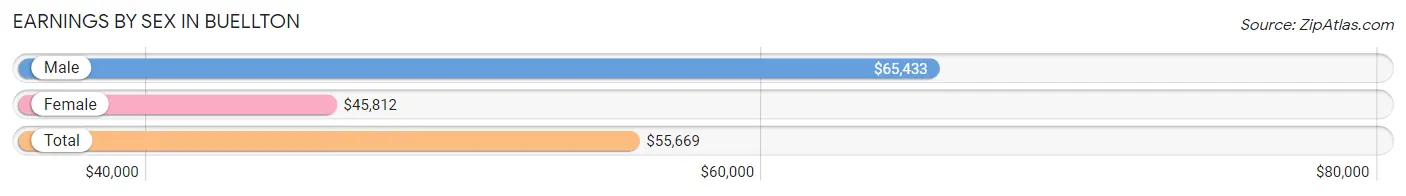
| Sex | Number | Average Earnings |
| Male | 1,639 (51.7%) | $65,433 |
| Female | 1,530 (48.3%) | $45,812 |
| Total | 3,169 (100.0%) | $55,669 |
Earnings by Sex by Income Bracket in Buellton
The most common earnings brackets in Buellton are $100,000+ for men (391 | 23.9%) and $75,000 to $99,999 for women (280 | 18.3%).
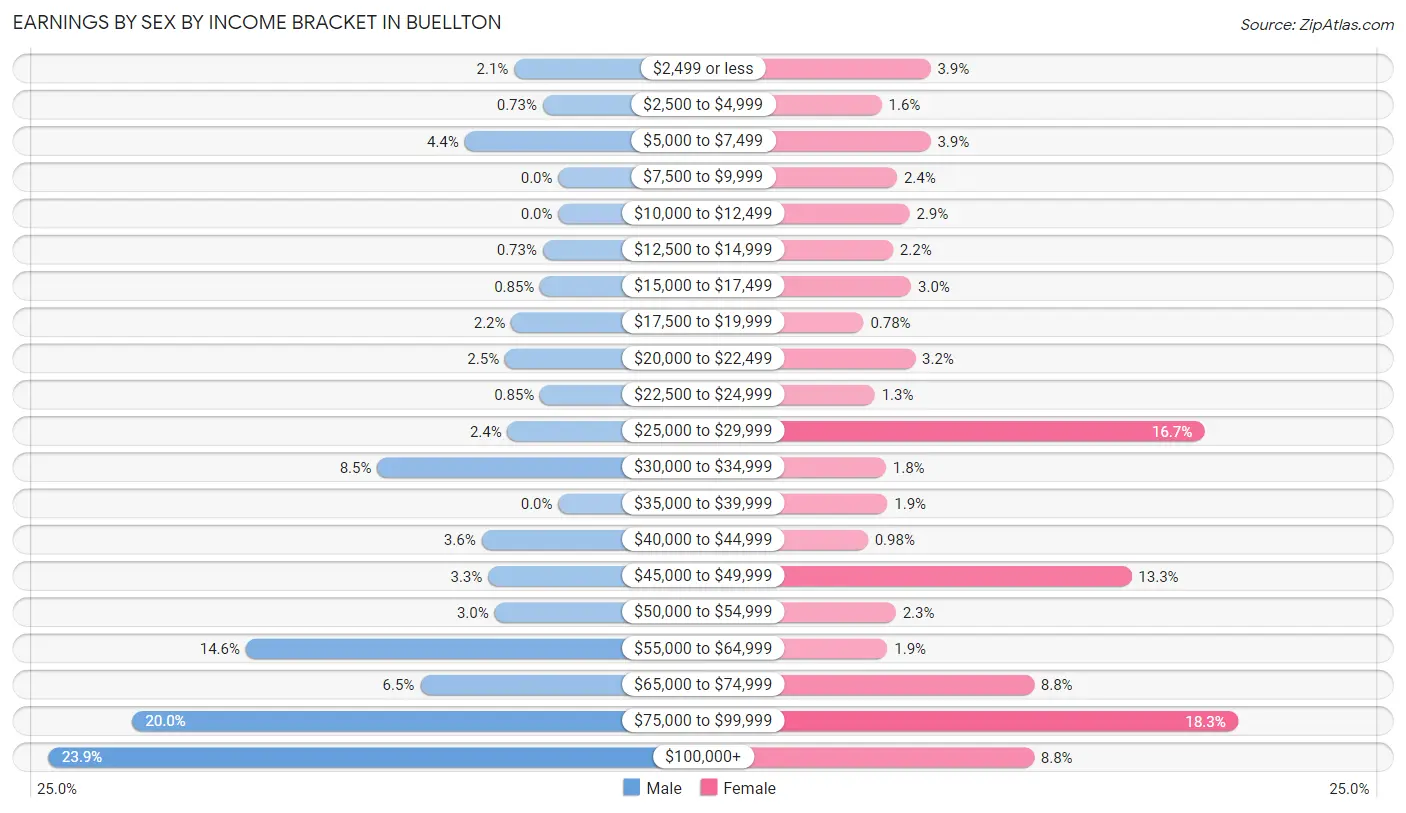
| Income | Male | Female |
| $2,499 or less | 34 (2.1%) | 60 (3.9%) |
| $2,500 to $4,999 | 12 (0.7%) | 25 (1.6%) |
| $5,000 to $7,499 | 72 (4.4%) | 60 (3.9%) |
| $7,500 to $9,999 | 0 (0.0%) | 36 (2.4%) |
| $10,000 to $12,499 | 0 (0.0%) | 45 (2.9%) |
| $12,500 to $14,999 | 12 (0.7%) | 33 (2.2%) |
| $15,000 to $17,499 | 14 (0.9%) | 46 (3.0%) |
| $17,500 to $19,999 | 36 (2.2%) | 12 (0.8%) |
| $20,000 to $22,499 | 41 (2.5%) | 49 (3.2%) |
| $22,500 to $24,999 | 14 (0.9%) | 20 (1.3%) |
| $25,000 to $29,999 | 39 (2.4%) | 256 (16.7%) |
| $30,000 to $34,999 | 139 (8.5%) | 28 (1.8%) |
| $35,000 to $39,999 | 0 (0.0%) | 29 (1.9%) |
| $40,000 to $44,999 | 59 (3.6%) | 15 (1.0%) |
| $45,000 to $49,999 | 54 (3.3%) | 204 (13.3%) |
| $50,000 to $54,999 | 49 (3.0%) | 35 (2.3%) |
| $55,000 to $64,999 | 240 (14.6%) | 29 (1.9%) |
| $65,000 to $74,999 | 106 (6.5%) | 134 (8.8%) |
| $75,000 to $99,999 | 327 (20.0%) | 280 (18.3%) |
| $100,000+ | 391 (23.9%) | 134 (8.8%) |
| Total | 1,639 (100.0%) | 1,530 (100.0%) |
Earnings by Sex by Educational Attainment in Buellton
Average earnings in Buellton are $68,407 for men and $46,855 for women, a difference of 31.5%. Men with an educational attainment of graduate degree enjoy the highest average annual earnings of $96,743, while those with high school diploma education earn the least with $54,500. Women with an educational attainment of graduate degree earn the most with the average annual earnings of $88,250, while those with less than high school education have the smallest earnings of $21,434.
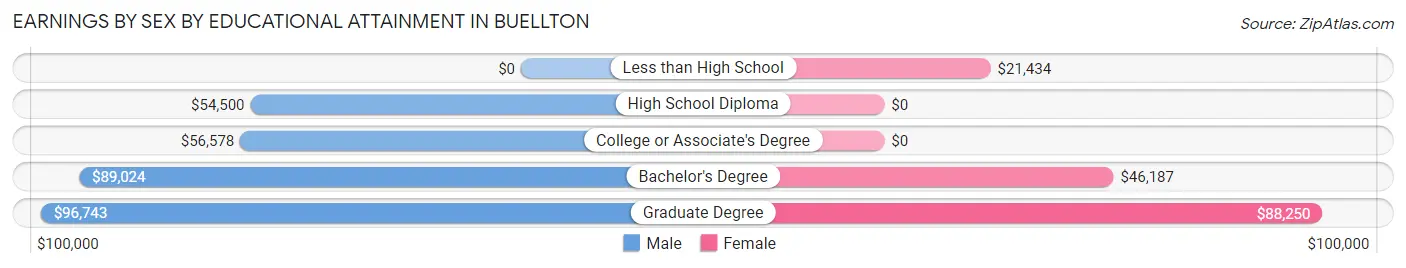
| Educational Attainment | Male Income | Female Income |
| Less than High School | - | - |
| High School Diploma | $54,500 | $0 |
| College or Associate's Degree | $56,578 | $0 |
| Bachelor's Degree | $89,024 | $46,187 |
| Graduate Degree | $96,743 | $88,250 |
| Total | $68,407 | $46,855 |
Family Income in Buellton
Family Income Brackets in Buellton
According to the Buellton family income data, there are 382 families falling into the $100,000 to $149,999 income range, which is the most common income bracket and makes up 24.3% of all families.
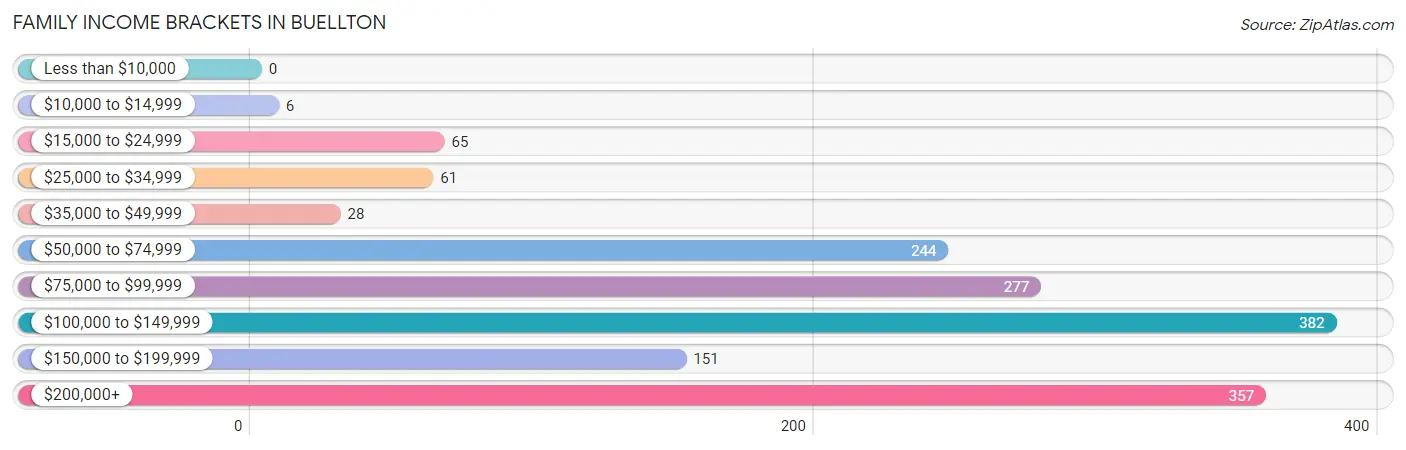
| Income Bracket | # Families | % Families |
| Less than $10,000 | 0 | 0.0% |
| $10,000 to $14,999 | 6 | 0.4% |
| $15,000 to $24,999 | 65 | 4.1% |
| $25,000 to $34,999 | 61 | 3.9% |
| $35,000 to $49,999 | 28 | 1.8% |
| $50,000 to $74,999 | 244 | 15.5% |
| $75,000 to $99,999 | 277 | 17.6% |
| $100,000 to $149,999 | 382 | 24.3% |
| $150,000 to $199,999 | 151 | 9.6% |
| $200,000+ | 357 | 22.7% |
Family Income by Famaliy Size in Buellton
5-person families (99 | 6.3%) account for the highest median family income in Buellton with $142,574 per family, while 2-person families (683 | 43.4%) have the highest median income of $47,682 per family member.
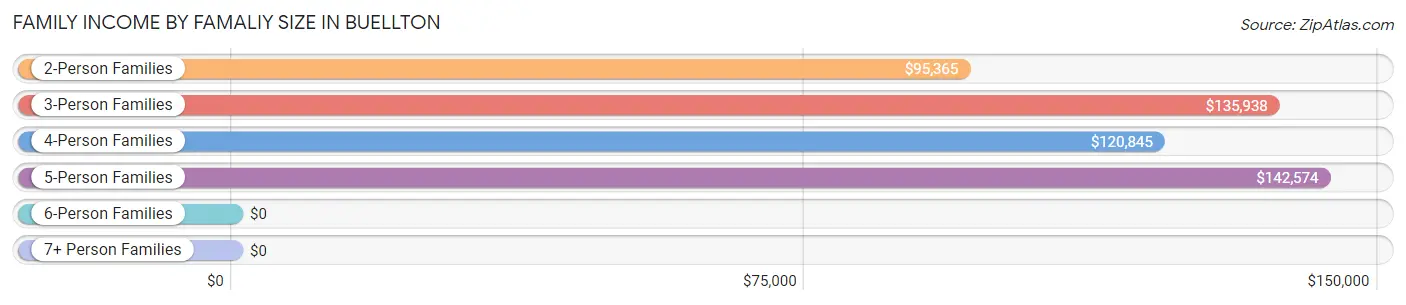
| Income Bracket | # Families | Median Income |
| 2-Person Families | 683 (43.4%) | $95,365 |
| 3-Person Families | 524 (33.3%) | $135,938 |
| 4-Person Families | 225 (14.3%) | $120,845 |
| 5-Person Families | 99 (6.3%) | $142,574 |
| 6-Person Families | 19 (1.2%) | $0 |
| 7+ Person Families | 24 (1.5%) | $0 |
| Total | 1,574 (100.0%) | $126,447 |
Family Income by Number of Earners in Buellton
The median family income in Buellton is $126,447, with families comprising 2 earners (862) having the highest median family income of $149,295, while families with no earners (117) have the lowest median family income of $57,153, accounting for 54.8% and 7.4% of families, respectively.
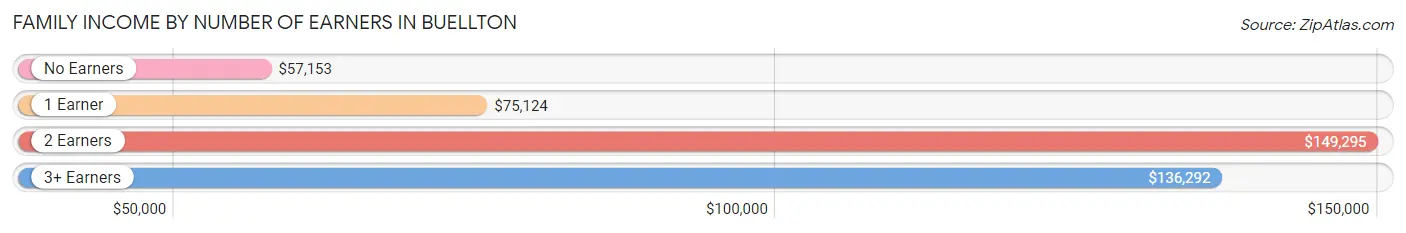
| Number of Earners | # Families | Median Income |
| No Earners | 117 (7.4%) | $57,153 |
| 1 Earner | 387 (24.6%) | $75,124 |
| 2 Earners | 862 (54.8%) | $149,295 |
| 3+ Earners | 208 (13.2%) | $136,292 |
| Total | 1,574 (100.0%) | $126,447 |
Household Income in Buellton
Household Income Brackets in Buellton
With 453 households falling in the category, the $100,000 to $149,999 income range is the most frequent in Buellton, accounting for 23.5% of all households. In contrast, only 10 households (0.5%) fall into the less than $10,000 income bracket, making it the least populous group.
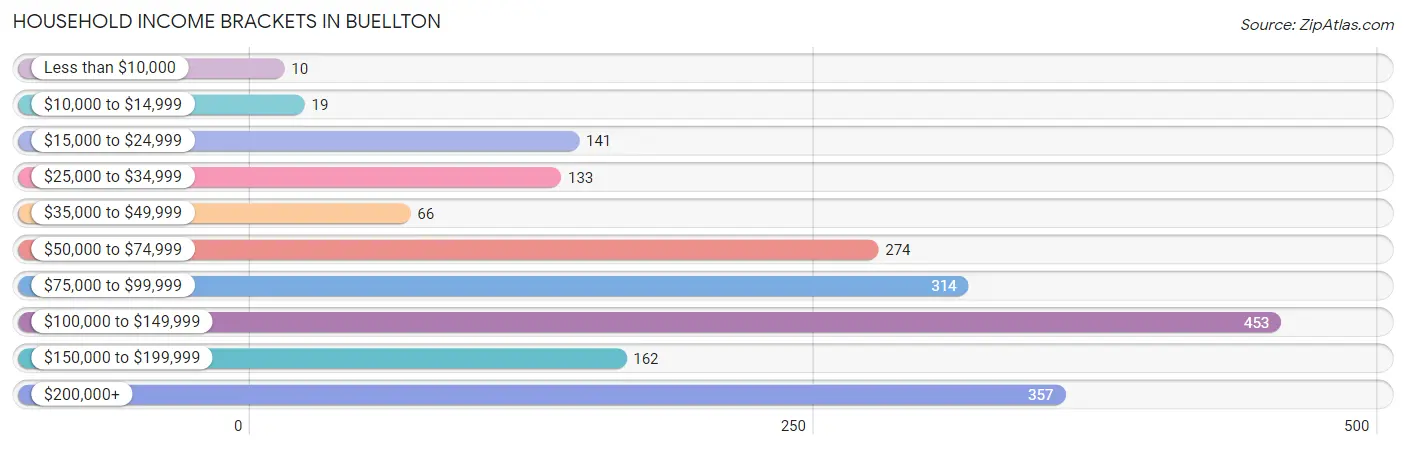
| Income Bracket | # Households | % Households |
| Less than $10,000 | 10 | 0.5% |
| $10,000 to $14,999 | 19 | 1.0% |
| $15,000 to $24,999 | 141 | 7.3% |
| $25,000 to $34,999 | 133 | 6.9% |
| $35,000 to $49,999 | 66 | 3.4% |
| $50,000 to $74,999 | 274 | 14.2% |
| $75,000 to $99,999 | 314 | 16.3% |
| $100,000 to $149,999 | 453 | 23.5% |
| $150,000 to $199,999 | 162 | 8.4% |
| $200,000+ | 357 | 18.5% |
Household Income by Householder Age in Buellton
The median household income in Buellton is $102,361, with the highest median household income of $148,878 found in the 25 to 44 years age bracket for the primary householder. A total of 585 households (30.3%) fall into this category. Meanwhile, the 15 to 24 years age bracket for the primary householder has the lowest median household income of $0, with 63 households (3.3%) in this group.
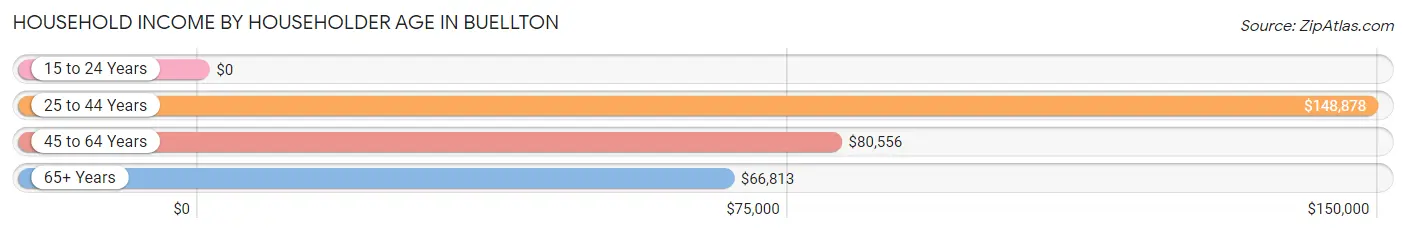
| Income Bracket | # Households | Median Income |
| 15 to 24 Years | 63 (3.3%) | $0 |
| 25 to 44 Years | 585 (30.3%) | $148,878 |
| 45 to 64 Years | 850 (44.1%) | $80,556 |
| 65+ Years | 431 (22.3%) | $66,813 |
| Total | 1,929 (100.0%) | $102,361 |
Poverty in Buellton
Income Below Poverty by Sex and Age in Buellton
With 1.9% poverty level for males and 2.1% for females among the residents of Buellton, 55 to 64 year old males and 25 to 34 year old females are the most vulnerable to poverty, with 31 males (8.6%) and 26 females (7.9%) in their respective age groups living below the poverty level.
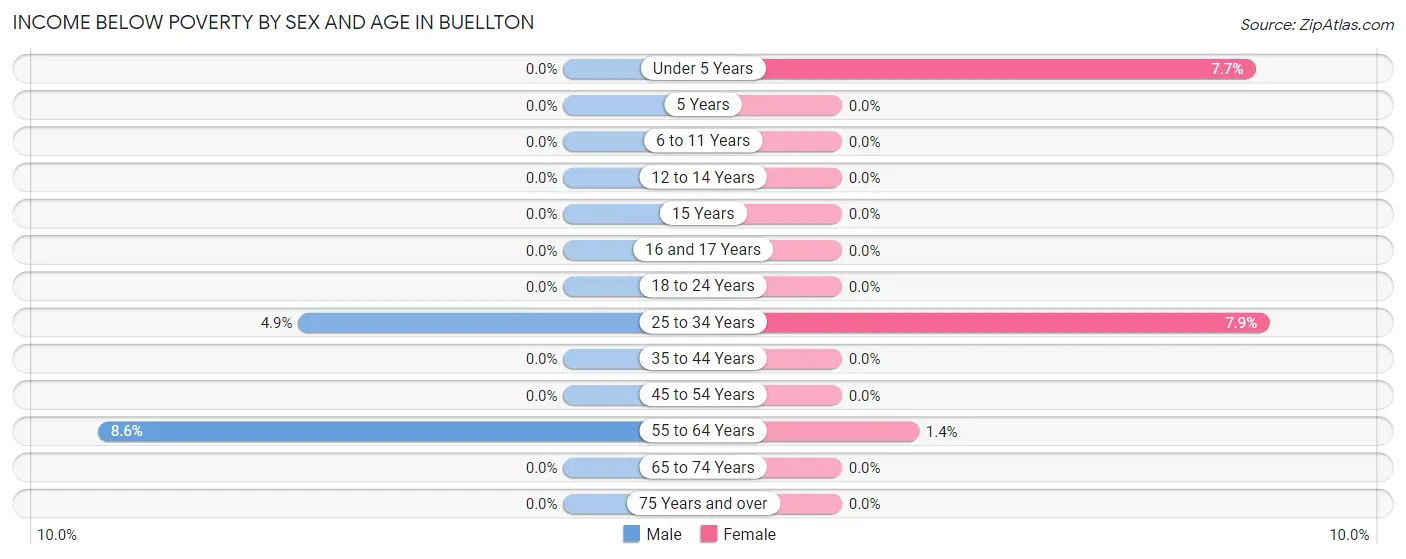
| Age Bracket | Male | Female |
| Under 5 Years | 0 (0.0%) | 25 (7.7%) |
| 5 Years | 0 (0.0%) | 0 (0.0%) |
| 6 to 11 Years | 0 (0.0%) | 0 (0.0%) |
| 12 to 14 Years | 0 (0.0%) | 0 (0.0%) |
| 15 Years | 0 (0.0%) | 0 (0.0%) |
| 16 and 17 Years | 0 (0.0%) | 0 (0.0%) |
| 18 to 24 Years | 0 (0.0%) | 0 (0.0%) |
| 25 to 34 Years | 15 (4.9%) | 26 (7.9%) |
| 35 to 44 Years | 0 (0.0%) | 0 (0.0%) |
| 45 to 54 Years | 0 (0.0%) | 0 (0.0%) |
| 55 to 64 Years | 31 (8.6%) | 7 (1.4%) |
| 65 to 74 Years | 0 (0.0%) | 0 (0.0%) |
| 75 Years and over | 0 (0.0%) | 0 (0.0%) |
| Total | 46 (1.9%) | 58 (2.1%) |
Income Above Poverty by Sex and Age in Buellton
According to the poverty statistics in Buellton, males aged under 5 years and females aged 6 to 11 years are the age groups that are most secure financially, with 100.0% of males and 100.0% of females in these age groups living above the poverty line.
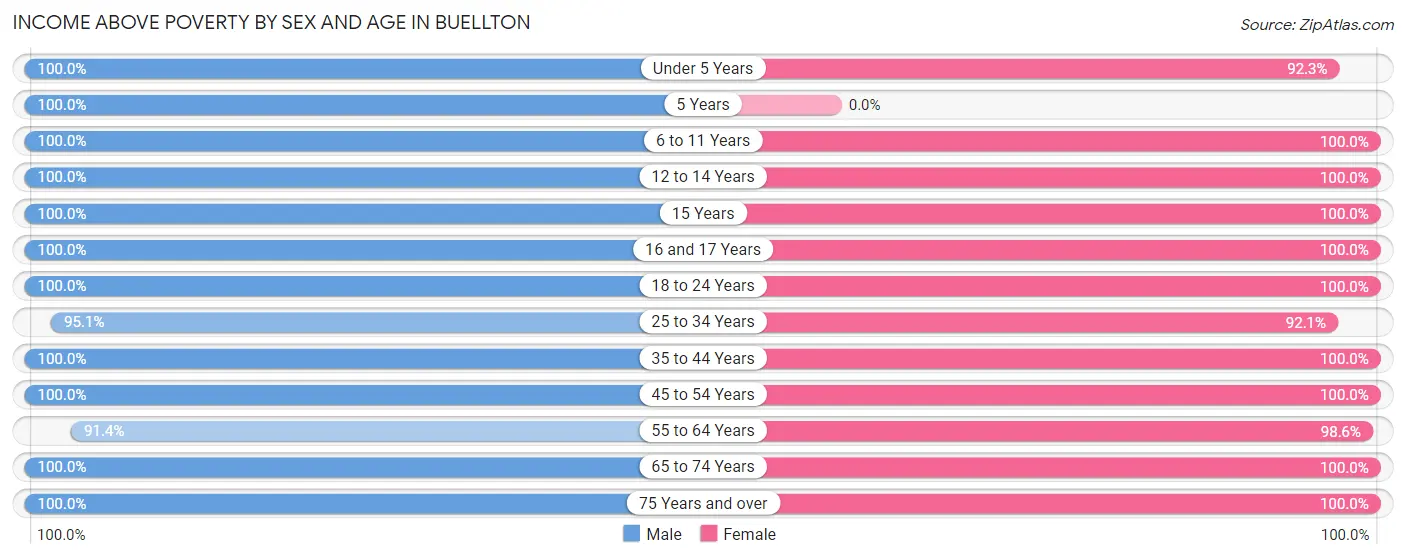
| Age Bracket | Male | Female |
| Under 5 Years | 128 (100.0%) | 301 (92.3%) |
| 5 Years | 30 (100.0%) | 0 (0.0%) |
| 6 to 11 Years | 148 (100.0%) | 220 (100.0%) |
| 12 to 14 Years | 86 (100.0%) | 75 (100.0%) |
| 15 Years | 52 (100.0%) | 28 (100.0%) |
| 16 and 17 Years | 28 (100.0%) | 76 (100.0%) |
| 18 to 24 Years | 80 (100.0%) | 199 (100.0%) |
| 25 to 34 Years | 290 (95.1%) | 302 (92.1%) |
| 35 to 44 Years | 604 (100.0%) | 422 (100.0%) |
| 45 to 54 Years | 275 (100.0%) | 210 (100.0%) |
| 55 to 64 Years | 328 (91.4%) | 481 (98.6%) |
| 65 to 74 Years | 109 (100.0%) | 151 (100.0%) |
| 75 Years and over | 183 (100.0%) | 241 (100.0%) |
| Total | 2,341 (98.1%) | 2,706 (97.9%) |
Income Below Poverty Among Married-Couple Families in Buellton
The poverty statistics for married-couple families in Buellton show that 1.1% or 13 of the total 1,134 families live below the poverty line. Families with 1 or 2 children have the highest poverty rate of 3.7%, comprising of 13 families. On the other hand, families with no children have the lowest poverty rate of 0.0%, which includes 0 families.
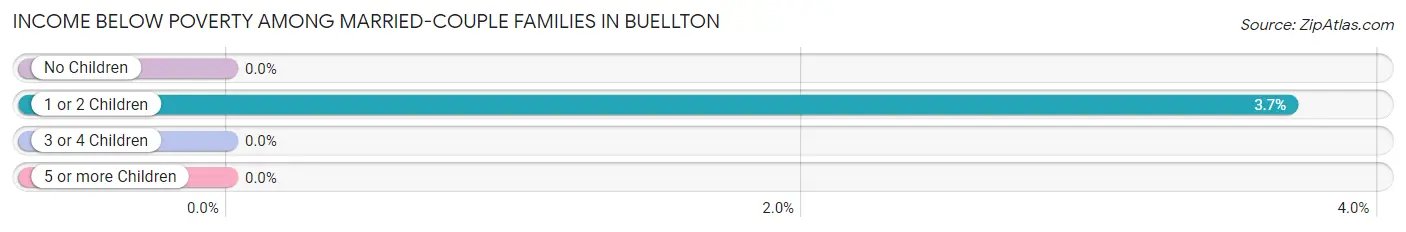
| Children | Above Poverty | Below Poverty |
| No Children | 675 (100.0%) | 0 (0.0%) |
| 1 or 2 Children | 339 (96.3%) | 13 (3.7%) |
| 3 or 4 Children | 107 (100.0%) | 0 (0.0%) |
| 5 or more Children | 0 (0.0%) | 0 (0.0%) |
| Total | 1,121 (98.9%) | 13 (1.1%) |
Income Below Poverty Among Single-Parent Households in Buellton
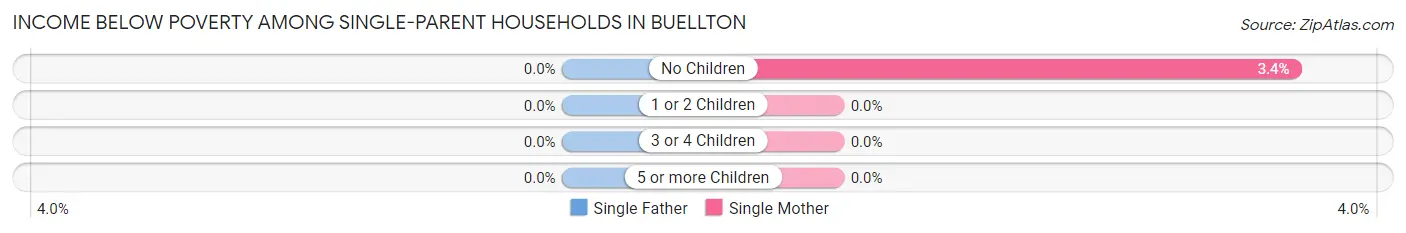
| Children | Single Father | Single Mother |
| No Children | 0 (0.0%) | 7 (3.4%) |
| 1 or 2 Children | 0 (0.0%) | 0 (0.0%) |
| 3 or 4 Children | 0 (0.0%) | 0 (0.0%) |
| 5 or more Children | 0 (0.0%) | 0 (0.0%) |
| Total | 0 (0.0%) | 7 (2.1%) |
Income Below Poverty Among Married-Couple vs Single-Parent Households in Buellton
The poverty data for Buellton shows that 13 of the married-couple family households (1.1%) and 7 of the single-parent households (1.6%) are living below the poverty level. Within the married-couple family households, those with 1 or 2 children have the highest poverty rate, with 13 households (3.7%) falling below the poverty line. Among the single-parent households, those with no children have the highest poverty rate, with 7 household (3.1%) living below poverty.
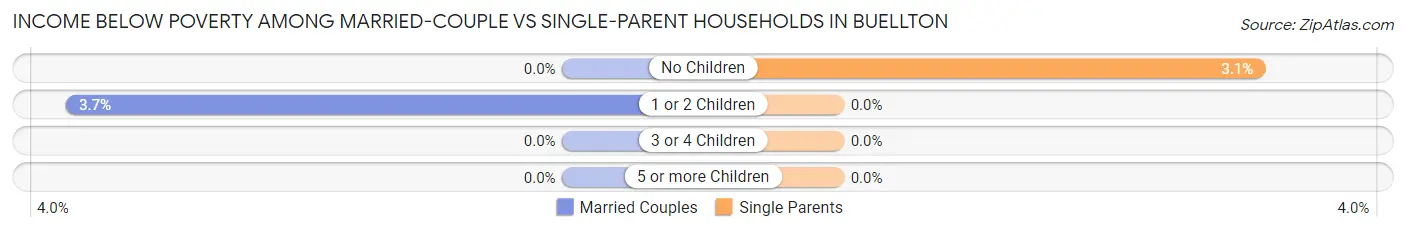
| Children | Married-Couple Families | Single-Parent Households |
| No Children | 0 (0.0%) | 7 (3.1%) |
| 1 or 2 Children | 13 (3.7%) | 0 (0.0%) |
| 3 or 4 Children | 0 (0.0%) | 0 (0.0%) |
| 5 or more Children | 0 (0.0%) | 0 (0.0%) |
| Total | 13 (1.1%) | 7 (1.6%) |
Race in Buellton
The most populous races in Buellton are White / Caucasian (4,436 | 86.1%), Hispanic or Latino (1,169 | 22.7%), and Some other Race (372 | 7.2%).
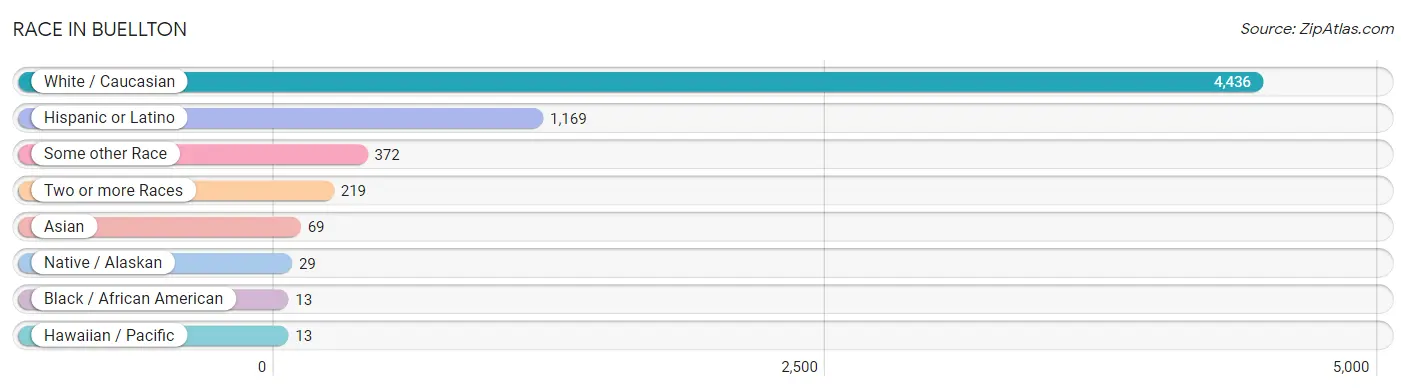
| Race | # Population | % Population |
| Asian | 69 | 1.3% |
| Black / African American | 13 | 0.3% |
| Hawaiian / Pacific | 13 | 0.3% |
| Hispanic or Latino | 1,169 | 22.7% |
| Native / Alaskan | 29 | 0.6% |
| White / Caucasian | 4,436 | 86.1% |
| Two or more Races | 219 | 4.3% |
| Some other Race | 372 | 7.2% |
| Total | 5,151 | 100.0% |
Ancestry in Buellton
The most populous ancestries reported in Buellton are German (1,130 | 21.9%), Mexican (826 | 16.0%), Irish (814 | 15.8%), English (563 | 10.9%), and Italian (297 | 5.8%), together accounting for 70.5% of all Buellton residents.
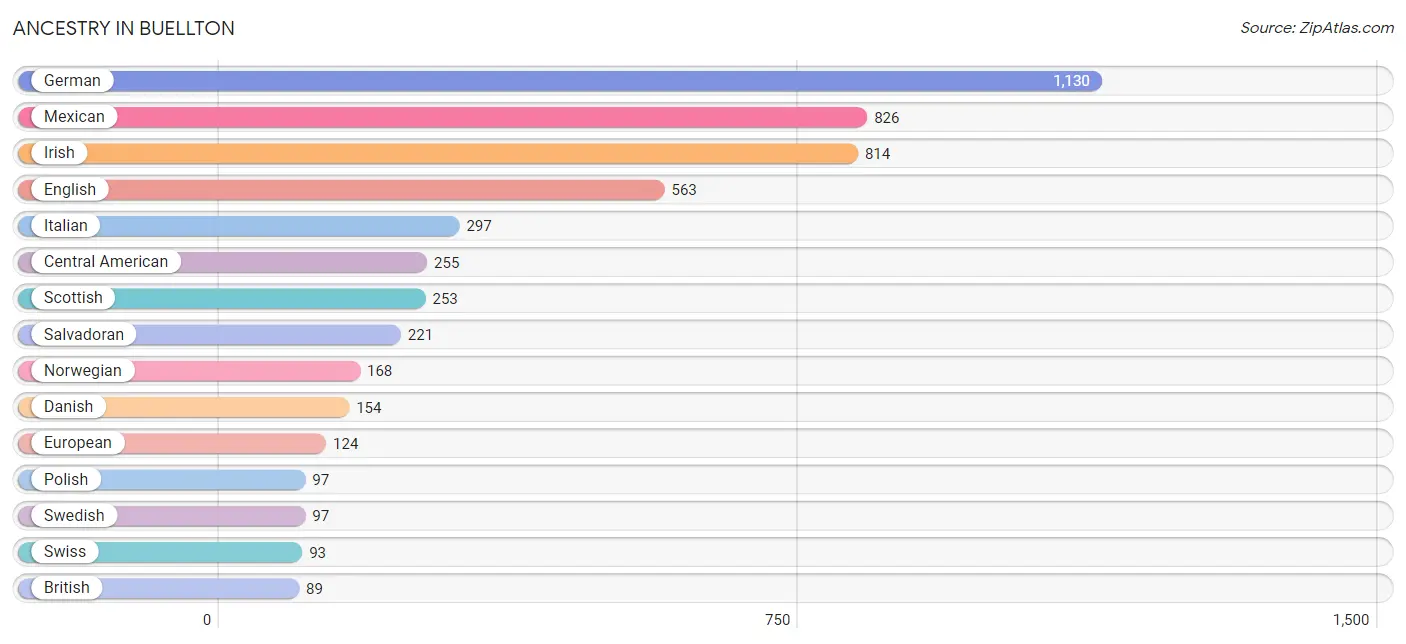
| Ancestry | # Population | % Population |
| American | 88 | 1.7% |
| Arab | 14 | 0.3% |
| Australian | 12 | 0.2% |
| Bhutanese | 40 | 0.8% |
| Brazilian | 34 | 0.7% |
| British | 89 | 1.7% |
| Canadian | 39 | 0.8% |
| Central American | 255 | 5.0% |
| Cuban | 21 | 0.4% |
| Czechoslovakian | 17 | 0.3% |
| Danish | 154 | 3.0% |
| Dominican | 10 | 0.2% |
| Dutch | 51 | 1.0% |
| English | 563 | 10.9% |
| European | 124 | 2.4% |
| Finnish | 35 | 0.7% |
| French | 30 | 0.6% |
| German | 1,130 | 21.9% |
| Greek | 20 | 0.4% |
| Honduran | 34 | 0.7% |
| Indian (Asian) | 12 | 0.2% |
| Irish | 814 | 15.8% |
| Israeli | 47 | 0.9% |
| Italian | 297 | 5.8% |
| Korean | 38 | 0.7% |
| Mexican | 826 | 16.0% |
| Mexican American Indian | 9 | 0.2% |
| Moroccan | 14 | 0.3% |
| Norwegian | 168 | 3.3% |
| Peruvian | 50 | 1.0% |
| Polish | 97 | 1.9% |
| Portuguese | 20 | 0.4% |
| Romanian | 18 | 0.4% |
| Salvadoran | 221 | 4.3% |
| Samoan | 13 | 0.3% |
| Scandinavian | 66 | 1.3% |
| Scotch-Irish | 88 | 1.7% |
| Scottish | 253 | 4.9% |
| South American | 50 | 1.0% |
| Spanish | 7 | 0.1% |
| Swedish | 97 | 1.9% |
| Swiss | 93 | 1.8% |
| Tlingit-Haida | 20 | 0.4% |
| Turkish | 38 | 0.7% | View All 44 Rows |
Immigrants in Buellton
The most numerous immigrant groups reported in Buellton came from Latin America (476 | 9.2%), Central America (399 | 7.7%), Mexico (336 | 6.5%), Europe (141 | 2.7%), and Northern Europe (121 | 2.4%), together accounting for 28.6% of all Buellton residents.
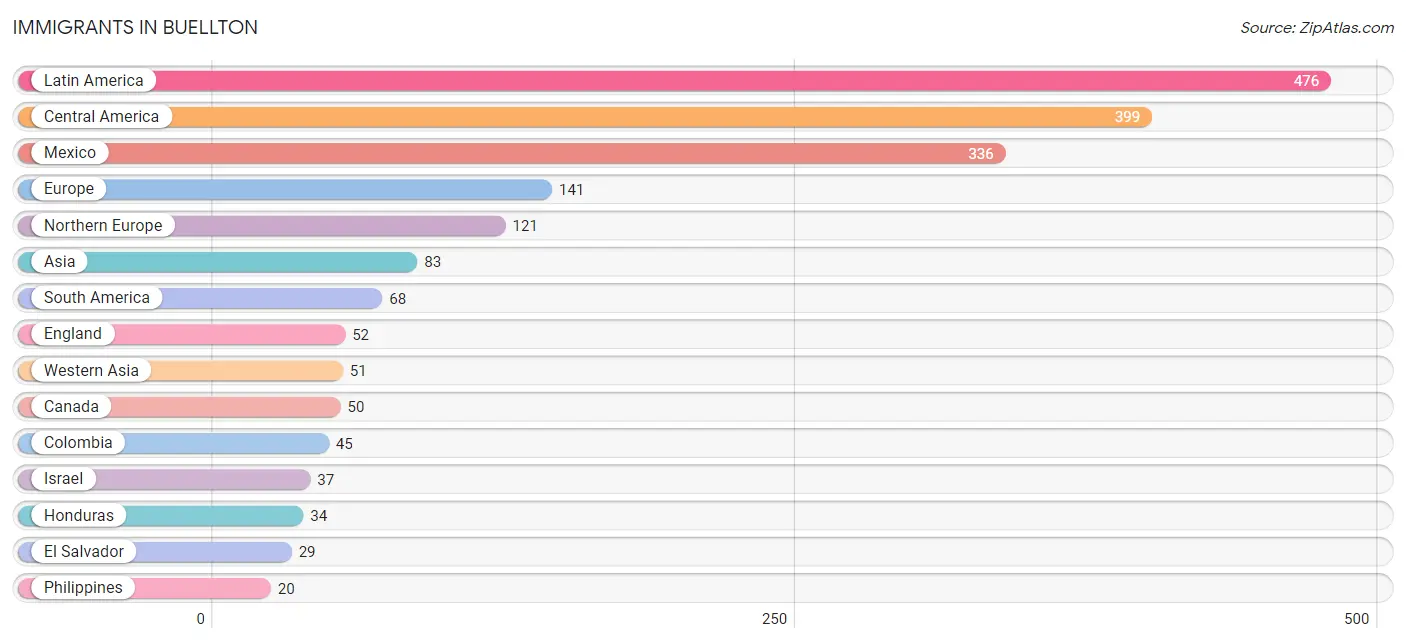
| Immigration Origin | # Population | % Population |
| Asia | 83 | 1.6% |
| Brazil | 10 | 0.2% |
| Canada | 50 | 1.0% |
| Caribbean | 9 | 0.2% |
| Central America | 399 | 7.7% |
| China | 12 | 0.2% |
| Colombia | 45 | 0.9% |
| Cuba | 9 | 0.2% |
| Denmark | 10 | 0.2% |
| Eastern Asia | 12 | 0.2% |
| Eastern Europe | 8 | 0.2% |
| El Salvador | 29 | 0.6% |
| England | 52 | 1.0% |
| Europe | 141 | 2.7% |
| Honduras | 34 | 0.7% |
| Hong Kong | 12 | 0.2% |
| Israel | 37 | 0.7% |
| Latin America | 476 | 9.2% |
| Mexico | 336 | 6.5% |
| Northern Europe | 121 | 2.4% |
| Peru | 13 | 0.3% |
| Philippines | 20 | 0.4% |
| Romania | 8 | 0.2% |
| South America | 68 | 1.3% |
| South Eastern Asia | 20 | 0.4% |
| Sweden | 12 | 0.2% |
| Switzerland | 12 | 0.2% |
| Western Asia | 51 | 1.0% |
| Western Europe | 12 | 0.2% | View All 29 Rows |
Sex and Age in Buellton
Sex and Age in Buellton
The most populous age groups in Buellton are 35 to 39 Years (345 | 14.4%) for men and 55 to 59 Years (360 | 13.0%) for women.
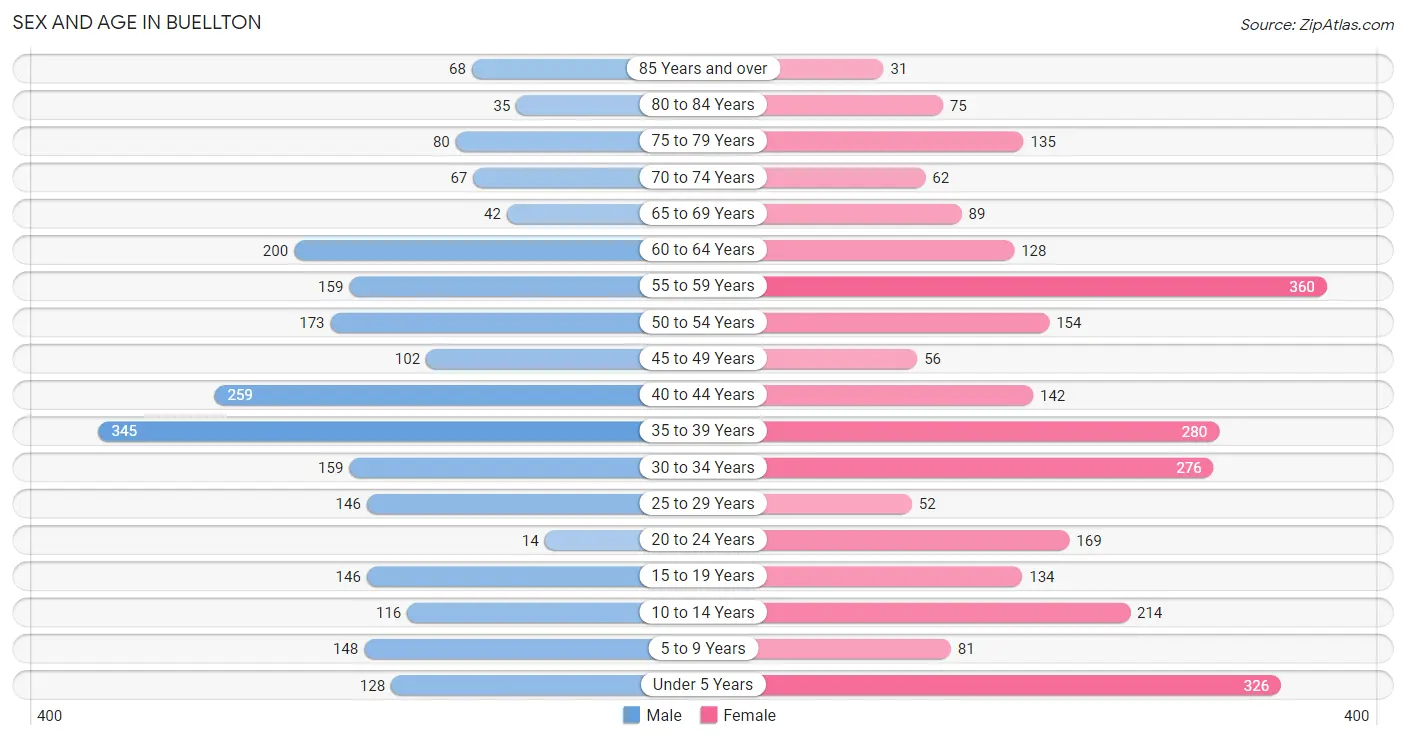
| Age Bracket | Male | Female |
| Under 5 Years | 128 (5.4%) | 326 (11.8%) |
| 5 to 9 Years | 148 (6.2%) | 81 (2.9%) |
| 10 to 14 Years | 116 (4.9%) | 214 (7.7%) |
| 15 to 19 Years | 146 (6.1%) | 134 (4.9%) |
| 20 to 24 Years | 14 (0.6%) | 169 (6.1%) |
| 25 to 29 Years | 146 (6.1%) | 52 (1.9%) |
| 30 to 34 Years | 159 (6.7%) | 276 (10.0%) |
| 35 to 39 Years | 345 (14.4%) | 280 (10.1%) |
| 40 to 44 Years | 259 (10.8%) | 142 (5.1%) |
| 45 to 49 Years | 102 (4.3%) | 56 (2.0%) |
| 50 to 54 Years | 173 (7.2%) | 154 (5.6%) |
| 55 to 59 Years | 159 (6.7%) | 360 (13.0%) |
| 60 to 64 Years | 200 (8.4%) | 128 (4.6%) |
| 65 to 69 Years | 42 (1.8%) | 89 (3.2%) |
| 70 to 74 Years | 67 (2.8%) | 62 (2.2%) |
| 75 to 79 Years | 80 (3.4%) | 135 (4.9%) |
| 80 to 84 Years | 35 (1.5%) | 75 (2.7%) |
| 85 Years and over | 68 (2.9%) | 31 (1.1%) |
| Total | 2,387 (100.0%) | 2,764 (100.0%) |
Families and Households in Buellton
Median Family Size in Buellton
The median family size in Buellton is 2.99 persons per family, with single female/mother families (337 | 21.4%) accounting for the largest median family size of 3.34 persons per family. On the other hand, single male/father families (103 | 6.5%) represent the smallest median family size with 2.69 persons per family.
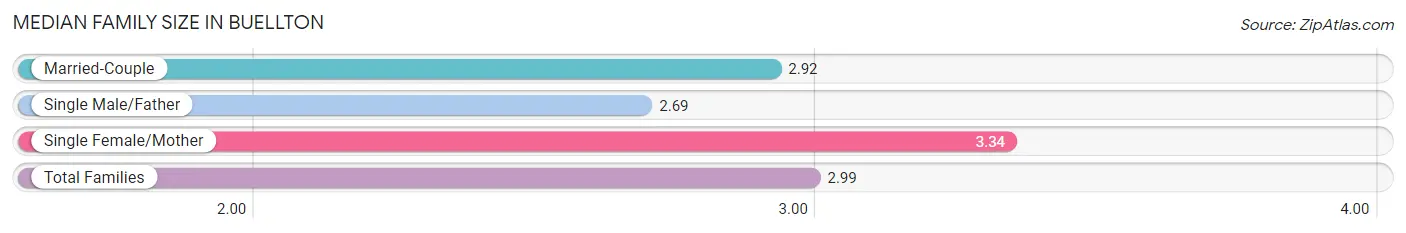
| Family Type | # Families | Family Size |
| Married-Couple | 1,134 (72.1%) | 2.92 |
| Single Male/Father | 103 (6.5%) | 2.69 |
| Single Female/Mother | 337 (21.4%) | 3.34 |
| Total Families | 1,574 (100.0%) | 2.99 |
Median Household Size in Buellton
The median household size in Buellton is 2.67 persons per household, with single female/mother households (337 | 17.5%) accounting for the largest median household size of 3.47 persons per household. non-family households (355 | 18.4%) represent the smallest median household size with 1.12 persons per household.
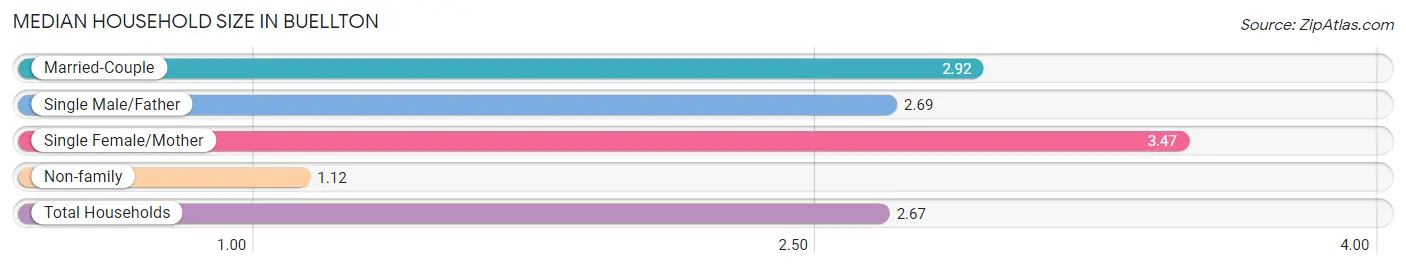
| Household Type | # Households | Household Size |
| Married-Couple | 1,134 (58.8%) | 2.92 |
| Single Male/Father | 103 (5.3%) | 2.69 |
| Single Female/Mother | 337 (17.5%) | 3.47 |
| Non-family | 355 (18.4%) | 1.12 |
| Total Households | 1,929 (100.0%) | 2.67 |
Household Size by Marriage Status in Buellton
Out of a total of 1,929 households in Buellton, 1,574 (81.6%) are family households, while 355 (18.4%) are nonfamily households. The most numerous type of family households are 2-person households, comprising 683, and the most common type of nonfamily households are 1-person households, comprising 314.
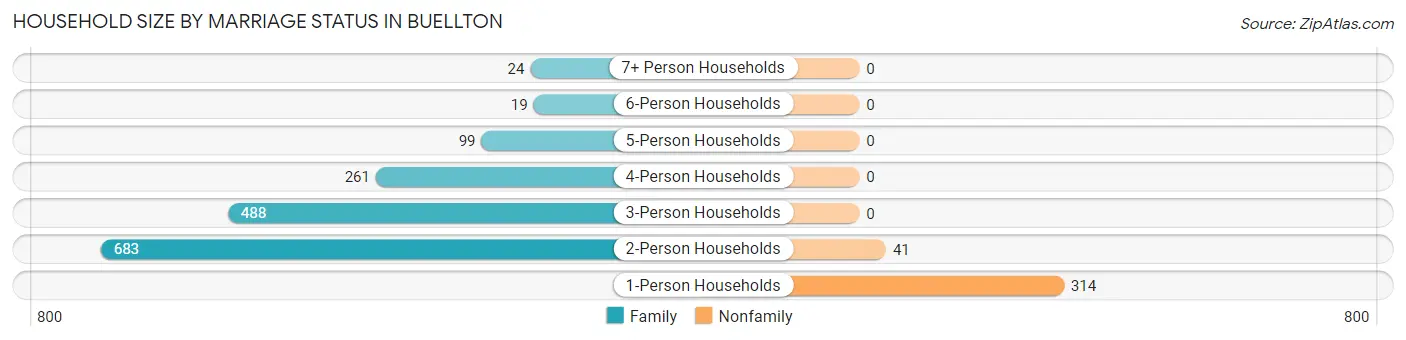
| Household Size | Family Households | Nonfamily Households |
| 1-Person Households | - | 314 (16.3%) |
| 2-Person Households | 683 (35.4%) | 41 (2.1%) |
| 3-Person Households | 488 (25.3%) | 0 (0.0%) |
| 4-Person Households | 261 (13.5%) | 0 (0.0%) |
| 5-Person Households | 99 (5.1%) | 0 (0.0%) |
| 6-Person Households | 19 (1.0%) | 0 (0.0%) |
| 7+ Person Households | 24 (1.2%) | 0 (0.0%) |
| Total | 1,574 (81.6%) | 355 (18.4%) |
Female Fertility in Buellton
Fertility by Age in Buellton
Average fertility rate in Buellton is 96.0 births per 1,000 women. Women in the age bracket of 20 to 34 years have the highest fertility rate with 197.0 births per 1,000 women. Women in the age bracket of 20 to 34 years acount for 86.0% of all women with births.
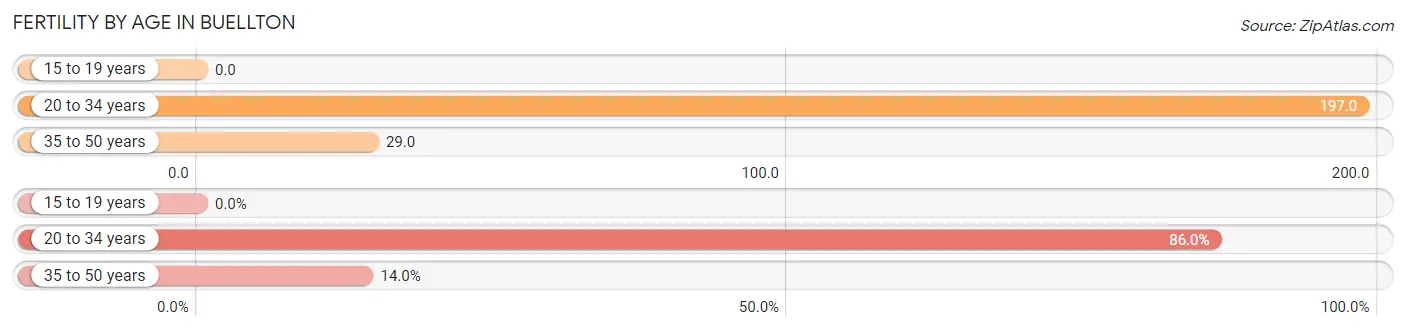
| Age Bracket | Women with Births | Births / 1,000 Women |
| 15 to 19 years | 0 (0.0%) | 0.0 |
| 20 to 34 years | 98 (86.0%) | 197.0 |
| 35 to 50 years | 16 (14.0%) | 29.0 |
| Total | 114 (100.0%) | 96.0 |
Fertility by Age by Marriage Status in Buellton
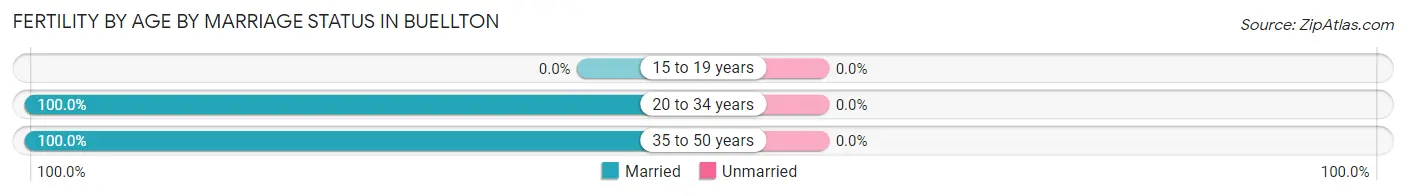
| Age Bracket | Married | Unmarried |
| 15 to 19 years | 0 (0.0%) | 0 (0.0%) |
| 20 to 34 years | 98 (100.0%) | 0 (0.0%) |
| 35 to 50 years | 16 (100.0%) | 0 (0.0%) |
| Total | 114 (100.0%) | 0 (0.0%) |
Fertility by Education in Buellton
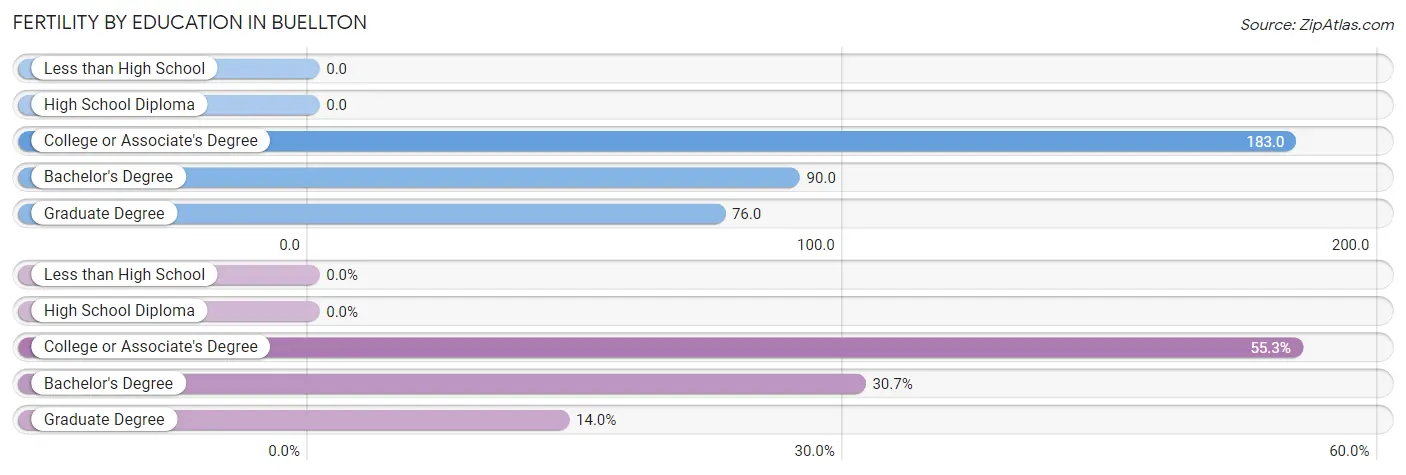
| Educational Attainment | Women with Births | Births / 1,000 Women |
| Less than High School | 0 (0.0%) | 0.0 |
| High School Diploma | 0 (0.0%) | 0.0 |
| College or Associate's Degree | 63 (55.3%) | 183.0 |
| Bachelor's Degree | 35 (30.7%) | 90.0 |
| Graduate Degree | 16 (14.0%) | 76.0 |
| Total | 114 (100.0%) | 96.0 |
Fertility by Education by Marriage Status in Buellton
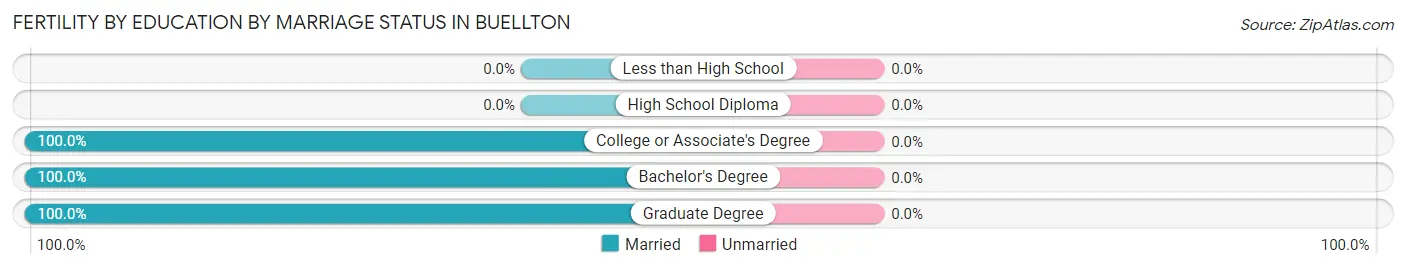
| Educational Attainment | Married | Unmarried |
| Less than High School | 0 (0.0%) | 0 (0.0%) |
| High School Diploma | 0 (0.0%) | 0 (0.0%) |
| College or Associate's Degree | 63 (100.0%) | 0 (0.0%) |
| Bachelor's Degree | 35 (100.0%) | 0 (0.0%) |
| Graduate Degree | 16 (100.0%) | 0 (0.0%) |
| Total | 114 (100.0%) | 0 (0.0%) |
Employment Characteristics in Buellton
Employment by Class of Employer in Buellton
Among the 3,035 employed individuals in Buellton, private company employees (1,650 | 54.4%), local government employees (536 | 17.7%), and self-employed (not incorporated) (252 | 8.3%) make up the most common classes of employment.
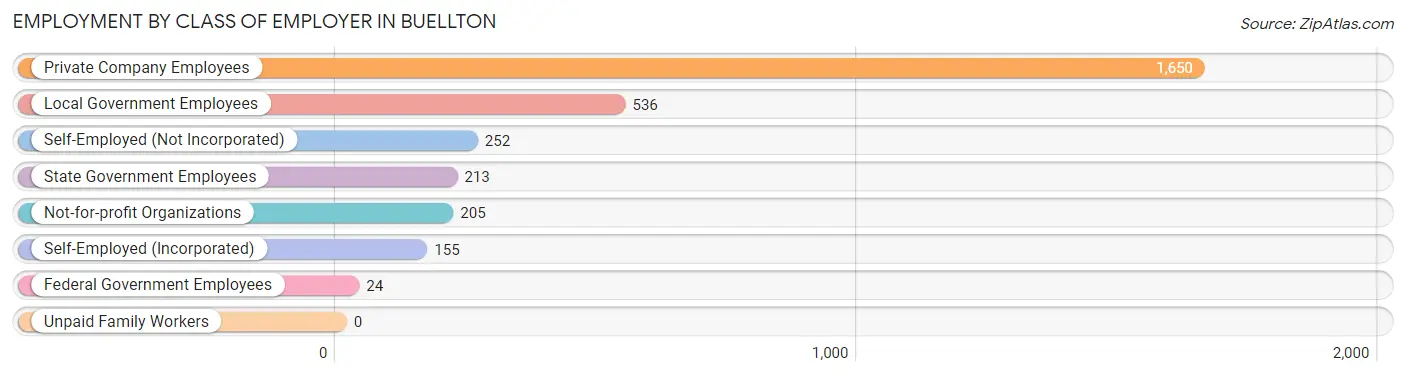
| Employer Class | # Employees | % Employees |
| Private Company Employees | 1,650 | 54.4% |
| Self-Employed (Incorporated) | 155 | 5.1% |
| Self-Employed (Not Incorporated) | 252 | 8.3% |
| Not-for-profit Organizations | 205 | 6.8% |
| Local Government Employees | 536 | 17.7% |
| State Government Employees | 213 | 7.0% |
| Federal Government Employees | 24 | 0.8% |
| Unpaid Family Workers | 0 | 0.0% |
| Total | 3,035 | 100.0% |
Employment Status by Age in Buellton
According to the labor force statistics for Buellton, out of the total population over 16 years of age (4,058), 77.0% or 3,125 individuals are in the labor force, with 2.9% or 91 of them unemployed. The age group with the highest labor force participation rate is 25 to 29 years, with 100.0% or 198 individuals in the labor force. Within the labor force, the 20 to 24 years age range has the highest percentage of unemployed individuals, with 16.5% or 16 of them being unemployed.
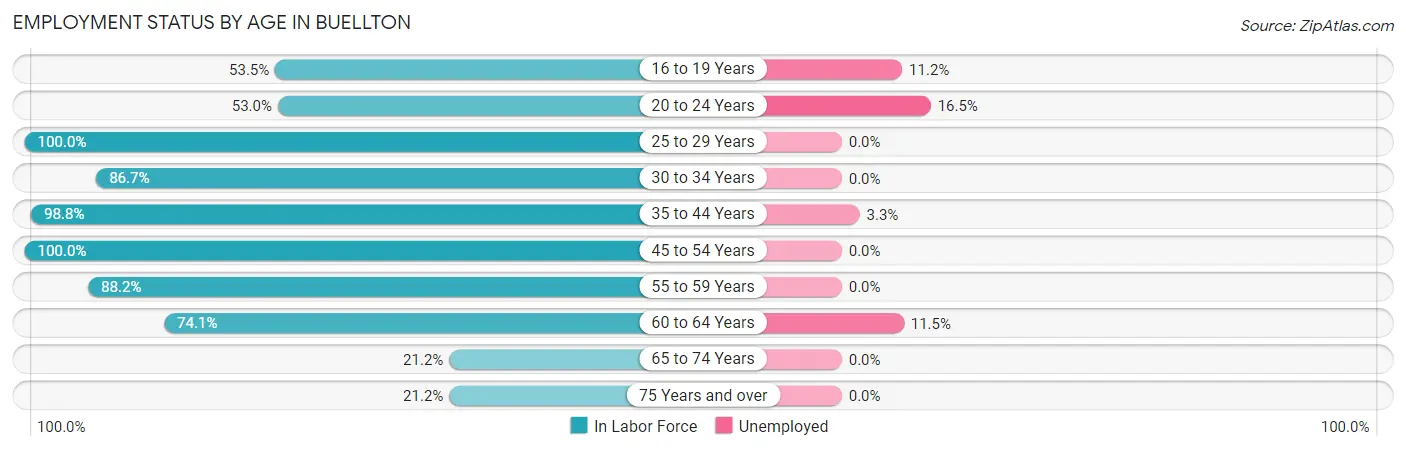
| Age Bracket | In Labor Force | Unemployed |
| 16 to 19 Years | 107 (53.5%) | 12 (11.2%) |
| 20 to 24 Years | 97 (53.0%) | 16 (16.5%) |
| 25 to 29 Years | 198 (100.0%) | 0 (0.0%) |
| 30 to 34 Years | 377 (86.7%) | 0 (0.0%) |
| 35 to 44 Years | 1,014 (98.8%) | 33 (3.3%) |
| 45 to 54 Years | 485 (100.0%) | 0 (0.0%) |
| 55 to 59 Years | 458 (88.2%) | 0 (0.0%) |
| 60 to 64 Years | 243 (74.1%) | 28 (11.5%) |
| 65 to 74 Years | 55 (21.2%) | 0 (0.0%) |
| 75 Years and over | 90 (21.2%) | 0 (0.0%) |
| Total | 3,125 (77.0%) | 91 (2.9%) |
Employment Status by Educational Attainment in Buellton
According to labor force statistics for Buellton, 92.8% of individuals (2,776) out of the total population between 25 and 64 years of age (2,991) are in the labor force, with 2.2% or 61 of them being unemployed. The group with the highest labor force participation rate are those with the educational attainment of high school diploma, with 97.8% or 318 individuals in the labor force. Within the labor force, individuals with bachelor's degree or higher education have the highest percentage of unemployment, with 4.0% or 49 of them being unemployed.
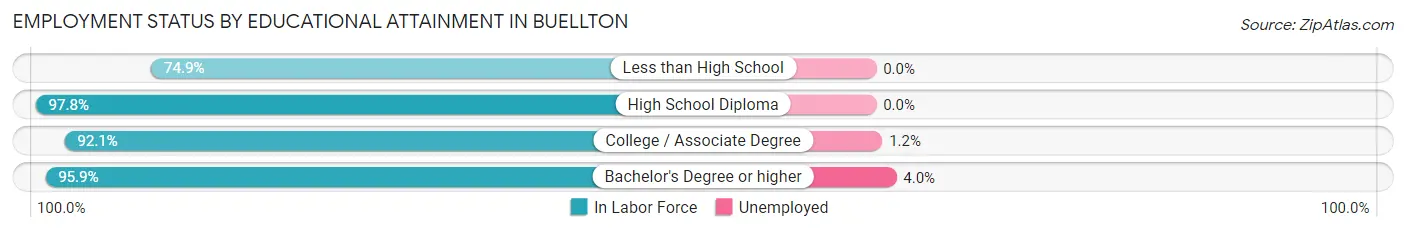
| Educational Attainment | In Labor Force | Unemployed |
| Less than High School | 200 (74.9%) | 0 (0.0%) |
| High School Diploma | 318 (97.8%) | 0 (0.0%) |
| College / Associate Degree | 1,032 (92.1%) | 13 (1.2%) |
| Bachelor's Degree or higher | 1,226 (95.9%) | 51 (4.0%) |
| Total | 2,776 (92.8%) | 66 (2.2%) |
Employment Occupations by Sex in Buellton
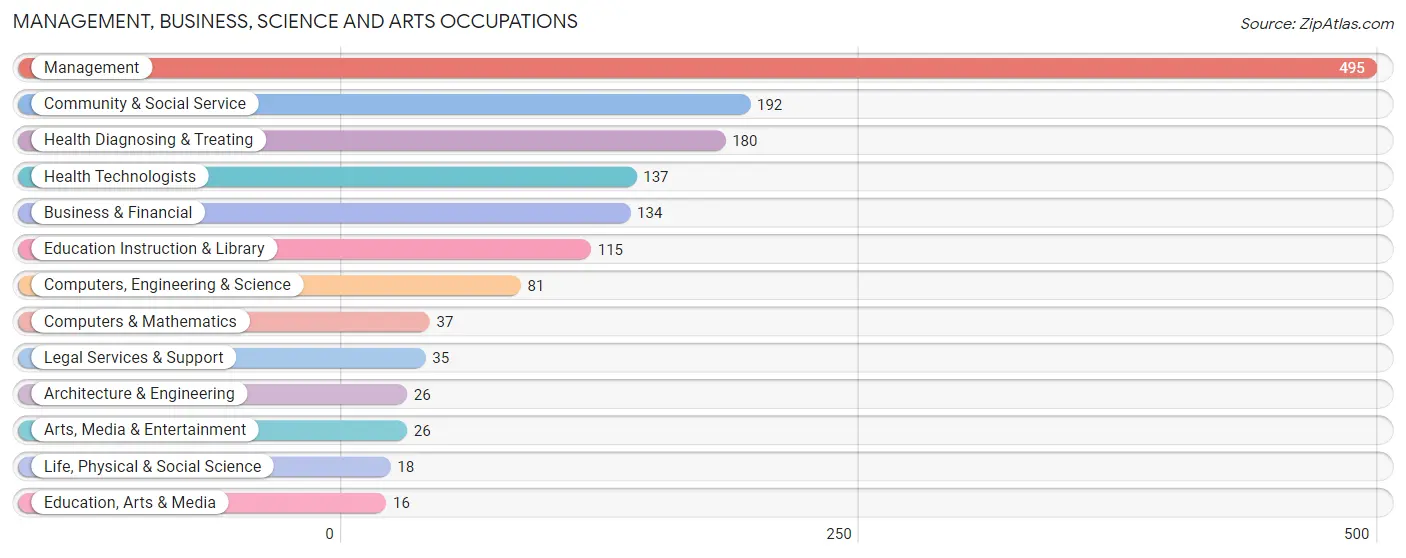
Management, Business, Science and Arts Occupations
The most common Management, Business, Science and Arts occupations in Buellton are Management (495 | 16.4%), Community & Social Service (192 | 6.4%), Health Diagnosing & Treating (180 | 5.9%), Health Technologists (137 | 4.5%), and Business & Financial (134 | 4.4%).
Management, Business, Science and Arts Occupations by Sex
Within the Management, Business, Science and Arts occupations in Buellton, the most male-oriented occupations are Architecture & Engineering (100.0%), Life, Physical & Social Science (100.0%), and Arts, Media & Entertainment (100.0%), while the most female-oriented occupations are Education, Arts & Media (100.0%), Education Instruction & Library (72.2%), and Business & Financial (67.2%).
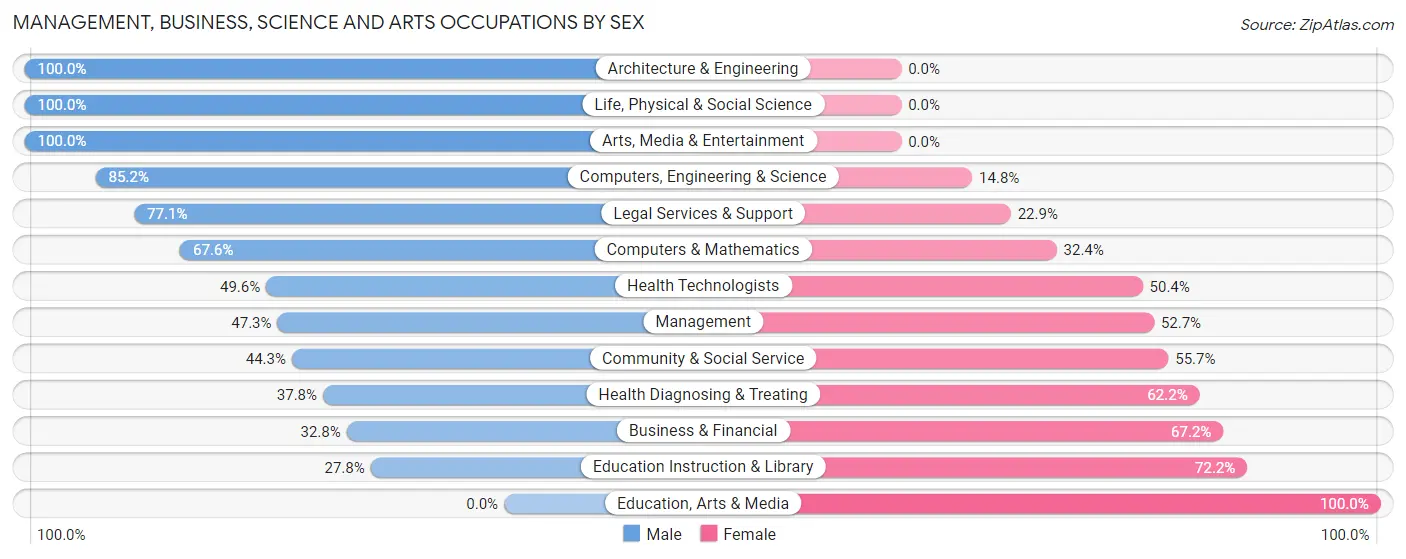
| Occupation | Male | Female |
| Management | 234 (47.3%) | 261 (52.7%) |
| Business & Financial | 44 (32.8%) | 90 (67.2%) |
| Computers, Engineering & Science | 69 (85.2%) | 12 (14.8%) |
| Computers & Mathematics | 25 (67.6%) | 12 (32.4%) |
| Architecture & Engineering | 26 (100.0%) | 0 (0.0%) |
| Life, Physical & Social Science | 18 (100.0%) | 0 (0.0%) |
| Community & Social Service | 85 (44.3%) | 107 (55.7%) |
| Education, Arts & Media | 0 (0.0%) | 16 (100.0%) |
| Legal Services & Support | 27 (77.1%) | 8 (22.9%) |
| Education Instruction & Library | 32 (27.8%) | 83 (72.2%) |
| Arts, Media & Entertainment | 26 (100.0%) | 0 (0.0%) |
| Health Diagnosing & Treating | 68 (37.8%) | 112 (62.2%) |
| Health Technologists | 68 (49.6%) | 69 (50.4%) |
| Total (Category) | 500 (46.2%) | 582 (53.8%) |
| Total (Overall) | 1,558 (51.5%) | 1,466 (48.5%) |
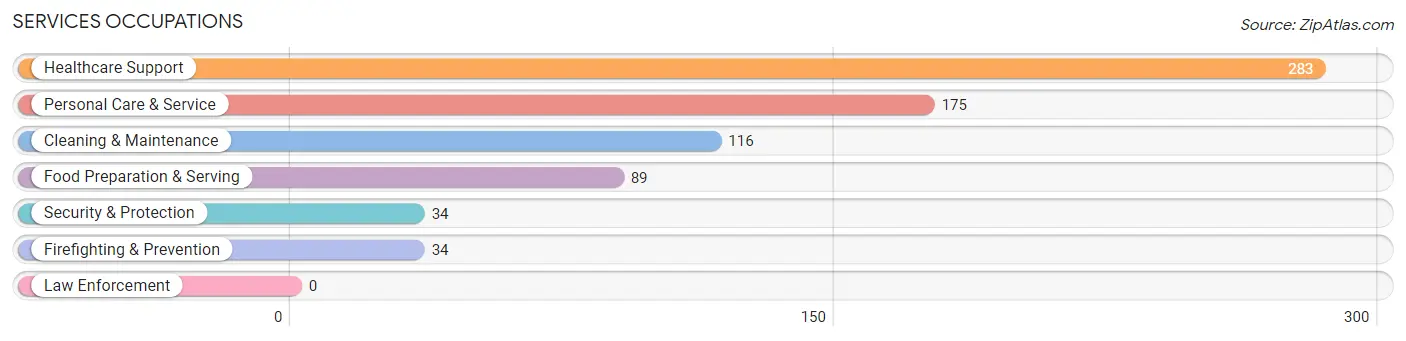
Services Occupations
The most common Services occupations in Buellton are Healthcare Support (283 | 9.4%), Personal Care & Service (175 | 5.8%), Cleaning & Maintenance (116 | 3.8%), Food Preparation & Serving (89 | 2.9%), and Security & Protection (34 | 1.1%).
Services Occupations by Sex
Within the Services occupations in Buellton, the most male-oriented occupations are Security & Protection (100.0%), Firefighting & Prevention (100.0%), and Food Preparation & Serving (87.6%), while the most female-oriented occupations are Personal Care & Service (78.3%), Cleaning & Maintenance (54.3%), and Healthcare Support (31.1%).
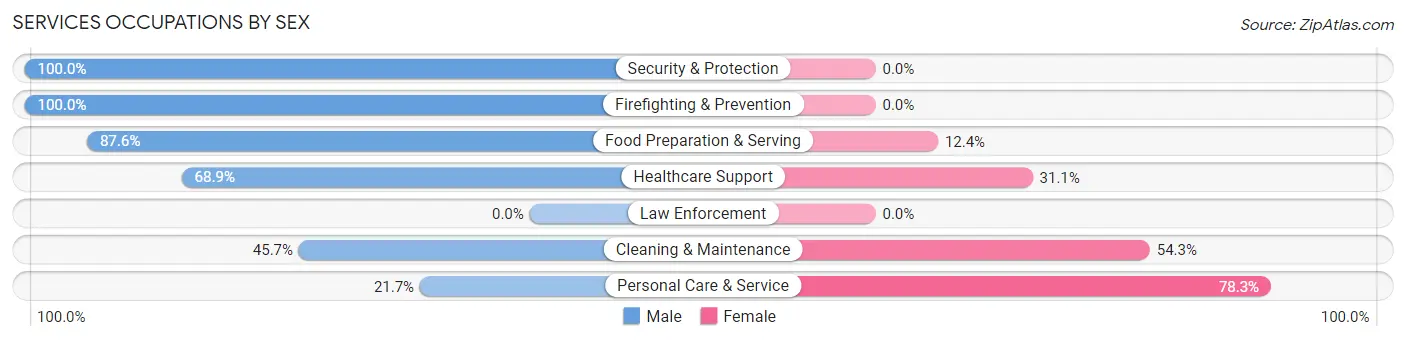
| Occupation | Male | Female |
| Healthcare Support | 195 (68.9%) | 88 (31.1%) |
| Security & Protection | 34 (100.0%) | 0 (0.0%) |
| Firefighting & Prevention | 34 (100.0%) | 0 (0.0%) |
| Law Enforcement | 0 (0.0%) | 0 (0.0%) |
| Food Preparation & Serving | 78 (87.6%) | 11 (12.4%) |
| Cleaning & Maintenance | 53 (45.7%) | 63 (54.3%) |
| Personal Care & Service | 38 (21.7%) | 137 (78.3%) |
| Total (Category) | 398 (57.1%) | 299 (42.9%) |
| Total (Overall) | 1,558 (51.5%) | 1,466 (48.5%) |
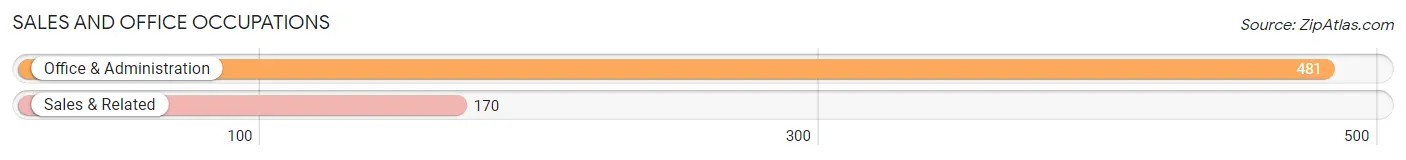
Sales and Office Occupations
The most common Sales and Office occupations in Buellton are Office & Administration (481 | 15.9%), and Sales & Related (170 | 5.6%).
Sales and Office Occupations by Sex
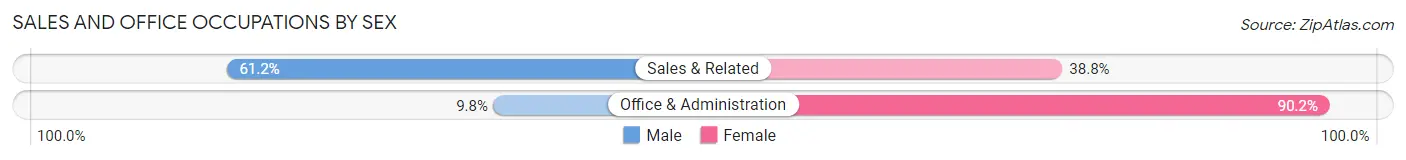
| Occupation | Male | Female |
| Sales & Related | 104 (61.2%) | 66 (38.8%) |
| Office & Administration | 47 (9.8%) | 434 (90.2%) |
| Total (Category) | 151 (23.2%) | 500 (76.8%) |
| Total (Overall) | 1,558 (51.5%) | 1,466 (48.5%) |
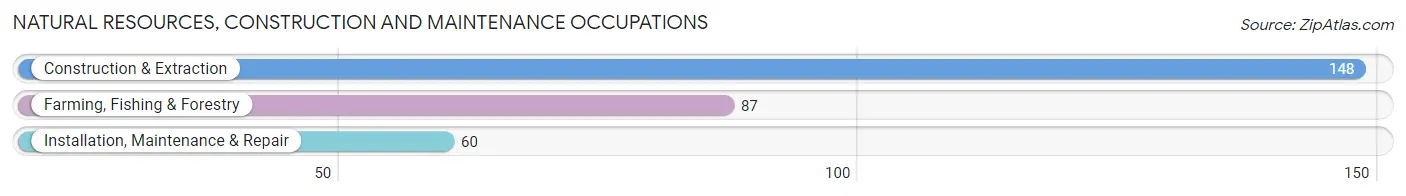
Natural Resources, Construction and Maintenance Occupations
The most common Natural Resources, Construction and Maintenance occupations in Buellton are Construction & Extraction (148 | 4.9%), Farming, Fishing & Forestry (87 | 2.9%), and Installation, Maintenance & Repair (60 | 2.0%).
Natural Resources, Construction and Maintenance Occupations by Sex
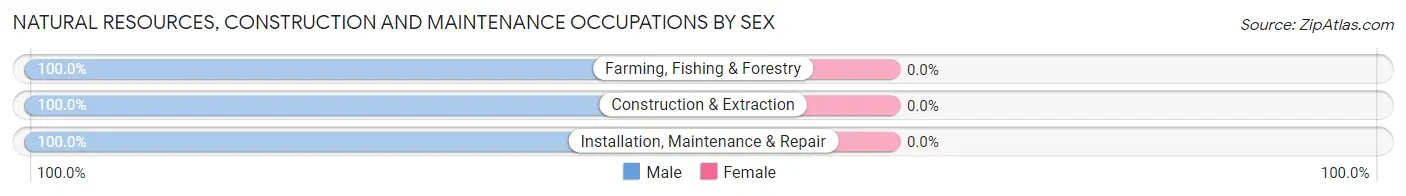
| Occupation | Male | Female |
| Farming, Fishing & Forestry | 87 (100.0%) | 0 (0.0%) |
| Construction & Extraction | 148 (100.0%) | 0 (0.0%) |
| Installation, Maintenance & Repair | 60 (100.0%) | 0 (0.0%) |
| Total (Category) | 295 (100.0%) | 0 (0.0%) |
| Total (Overall) | 1,558 (51.5%) | 1,466 (48.5%) |
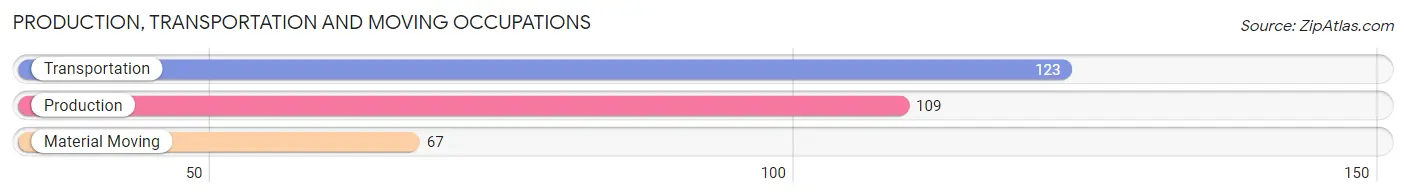
Production, Transportation and Moving Occupations
The most common Production, Transportation and Moving occupations in Buellton are Transportation (123 | 4.1%), Production (109 | 3.6%), and Material Moving (67 | 2.2%).
Production, Transportation and Moving Occupations by Sex
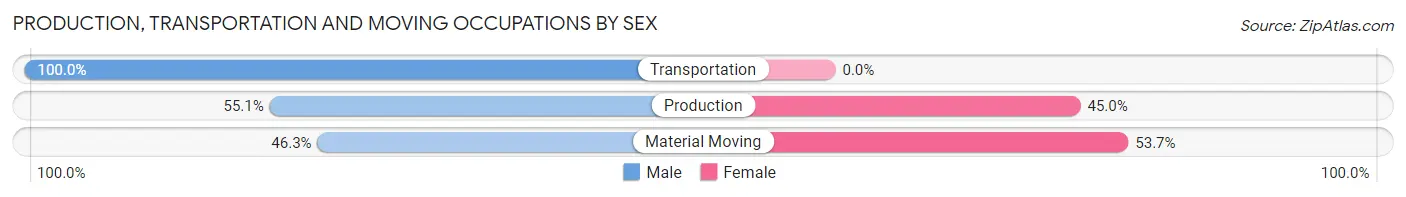
| Occupation | Male | Female |
| Production | 60 (55.0%) | 49 (45.0%) |
| Transportation | 123 (100.0%) | 0 (0.0%) |
| Material Moving | 31 (46.3%) | 36 (53.7%) |
| Total (Category) | 214 (71.6%) | 85 (28.4%) |
| Total (Overall) | 1,558 (51.5%) | 1,466 (48.5%) |
Employment Industries by Sex in Buellton
Employment Industries in Buellton
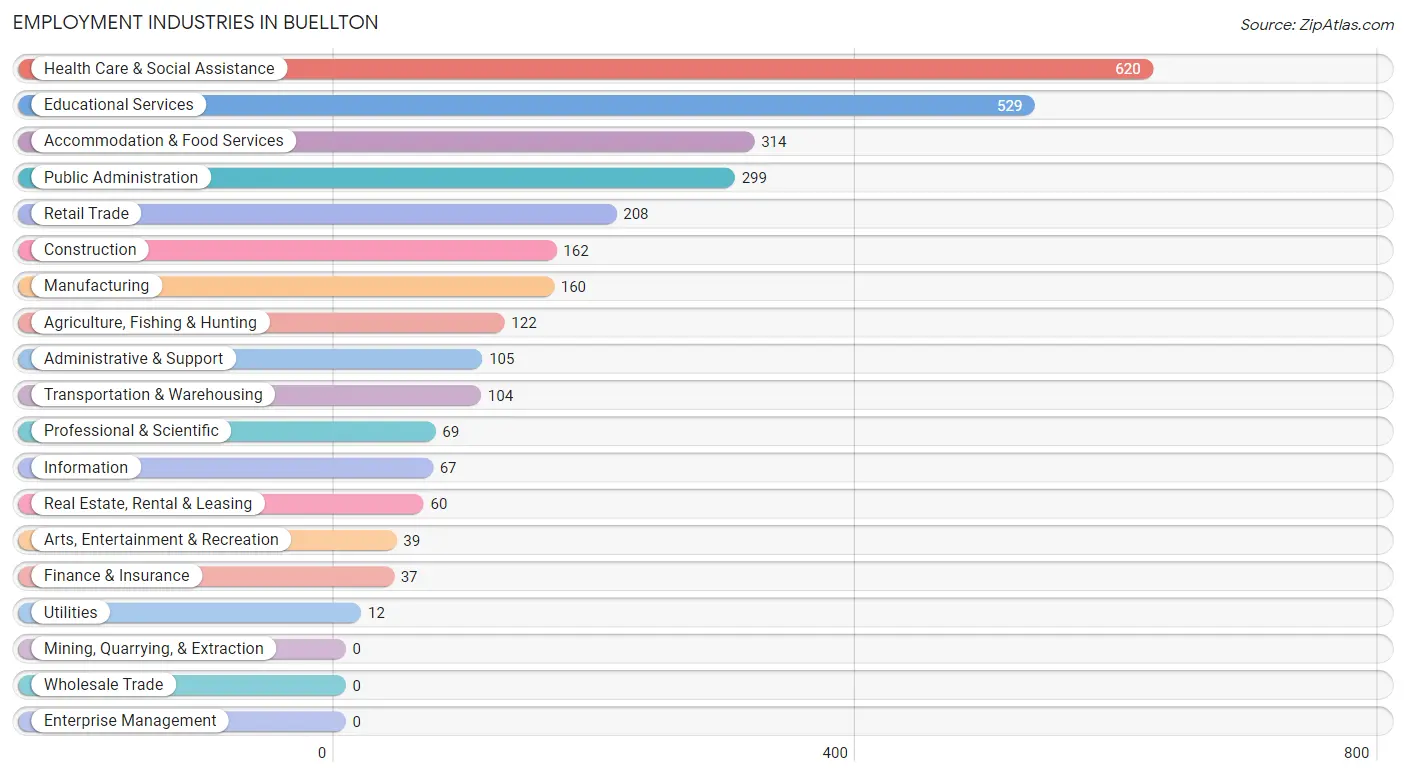
The major employment industries in Buellton include Health Care & Social Assistance (620 | 20.5%), Educational Services (529 | 17.5%), Accommodation & Food Services (314 | 10.4%), Public Administration (299 | 9.9%), and Retail Trade (208 | 6.9%).
Employment Industries by Sex in Buellton
The Buellton industries that see more men than women are Agriculture, Fishing & Hunting (100.0%), Construction (100.0%), and Utilities (100.0%), whereas the industries that tend to have a higher number of women are Accommodation & Food Services (69.4%), Educational Services (66.2%), and Public Administration (62.2%).
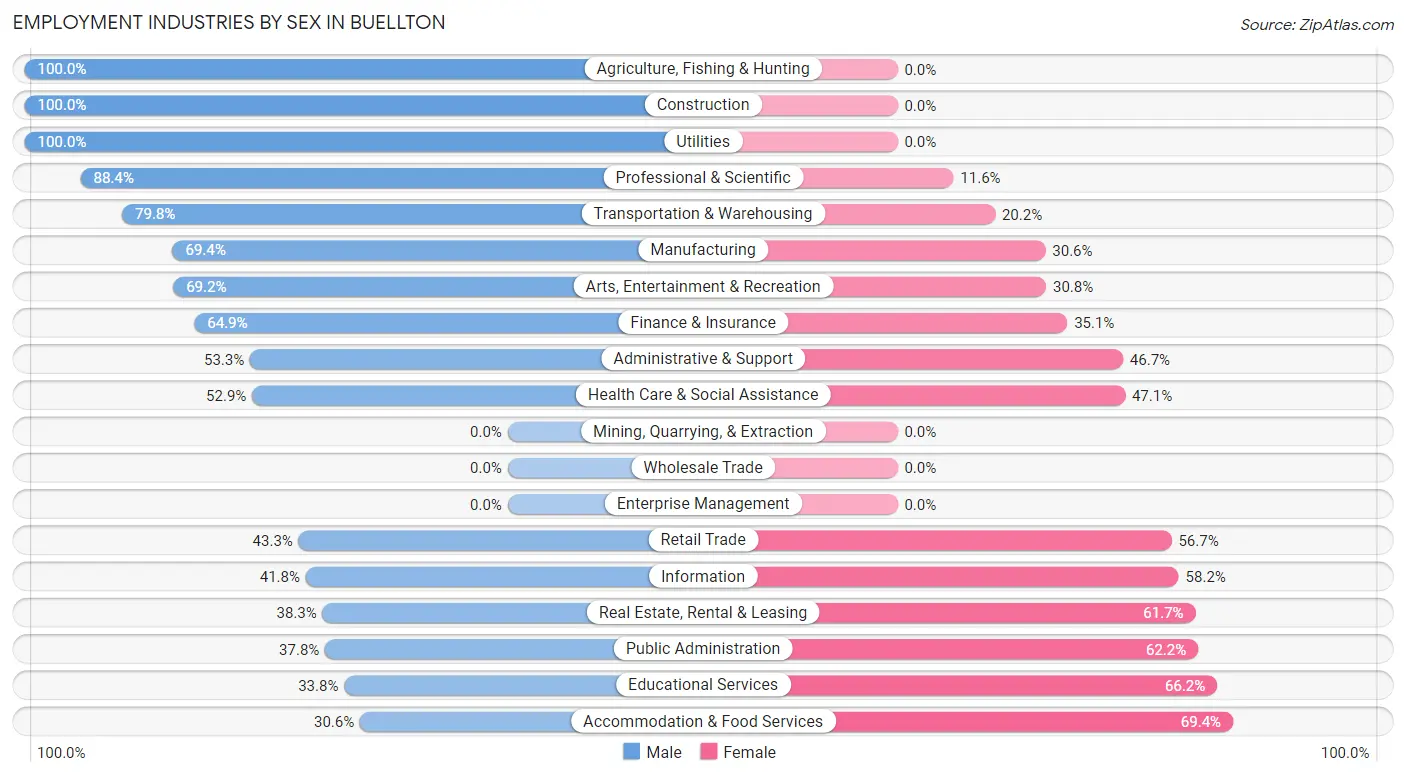
| Industry | Male | Female |
| Agriculture, Fishing & Hunting | 122 (100.0%) | 0 (0.0%) |
| Mining, Quarrying, & Extraction | 0 (0.0%) | 0 (0.0%) |
| Construction | 162 (100.0%) | 0 (0.0%) |
| Manufacturing | 111 (69.4%) | 49 (30.6%) |
| Wholesale Trade | 0 (0.0%) | 0 (0.0%) |
| Retail Trade | 90 (43.3%) | 118 (56.7%) |
| Transportation & Warehousing | 83 (79.8%) | 21 (20.2%) |
| Utilities | 12 (100.0%) | 0 (0.0%) |
| Information | 28 (41.8%) | 39 (58.2%) |
| Finance & Insurance | 24 (64.9%) | 13 (35.1%) |
| Real Estate, Rental & Leasing | 23 (38.3%) | 37 (61.7%) |
| Professional & Scientific | 61 (88.4%) | 8 (11.6%) |
| Enterprise Management | 0 (0.0%) | 0 (0.0%) |
| Administrative & Support | 56 (53.3%) | 49 (46.7%) |
| Educational Services | 179 (33.8%) | 350 (66.2%) |
| Health Care & Social Assistance | 328 (52.9%) | 292 (47.1%) |
| Arts, Entertainment & Recreation | 27 (69.2%) | 12 (30.8%) |
| Accommodation & Food Services | 96 (30.6%) | 218 (69.4%) |
| Public Administration | 113 (37.8%) | 186 (62.2%) |
| Total | 1,558 (51.5%) | 1,466 (48.5%) |
Education in Buellton
School Enrollment in Buellton
The most common levels of schooling among the 1,021 students in Buellton are middle school (249 | 24.4%), elementary school (238 | 23.3%), and high school (226 | 22.1%).
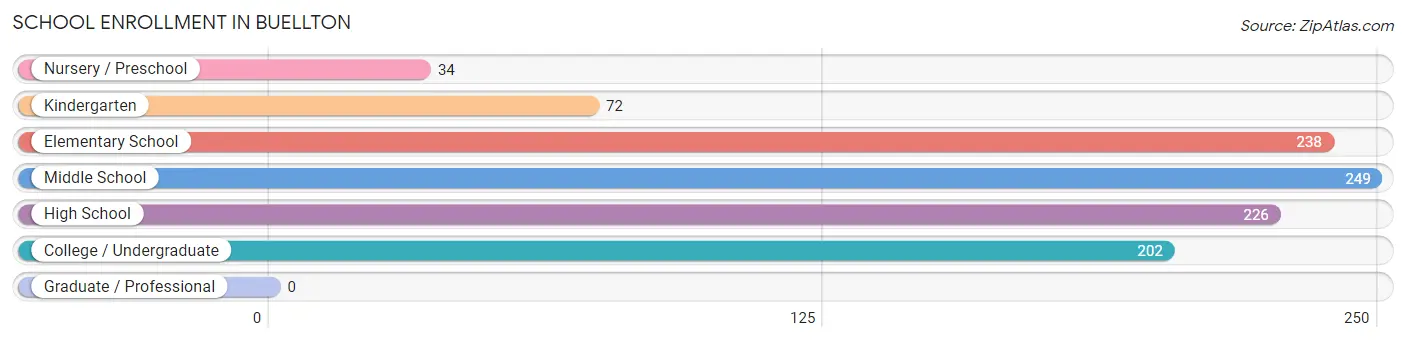
| School Level | # Students | % Students |
| Nursery / Preschool | 34 | 3.3% |
| Kindergarten | 72 | 7.0% |
| Elementary School | 238 | 23.3% |
| Middle School | 249 | 24.4% |
| High School | 226 | 22.1% |
| College / Undergraduate | 202 | 19.8% |
| Graduate / Professional | 0 | 0.0% |
| Total | 1,021 | 100.0% |
School Enrollment by Age by Funding Source in Buellton
Out of a total of 1,021 students who are enrolled in schools in Buellton, 288 (28.2%) attend a private institution, while the remaining 733 (71.8%) are enrolled in public schools. The age group of 20 to 24 year olds has the highest likelihood of being enrolled in private schools, with 60 (56.6% in the age bracket) enrolled. Conversely, the age group of 3 to 4 year olds has the lowest likelihood of being enrolled in a private school, with 34 (100.0% in the age bracket) attending a public institution.
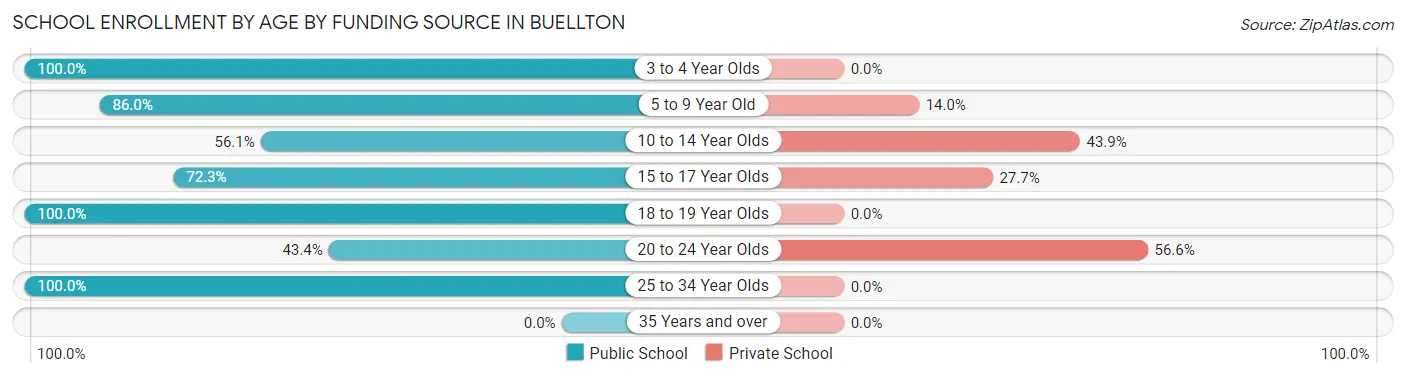
| Age Bracket | Public School | Private School |
| 3 to 4 Year Olds | 34 (100.0%) | 0 (0.0%) |
| 5 to 9 Year Old | 197 (86.0%) | 32 (14.0%) |
| 10 to 14 Year Olds | 185 (56.1%) | 145 (43.9%) |
| 15 to 17 Year Olds | 133 (72.3%) | 51 (27.7%) |
| 18 to 19 Year Olds | 96 (100.0%) | 0 (0.0%) |
| 20 to 24 Year Olds | 46 (43.4%) | 60 (56.6%) |
| 25 to 34 Year Olds | 42 (100.0%) | 0 (0.0%) |
| 35 Years and over | 0 (0.0%) | 0 (0.0%) |
| Total | 733 (71.8%) | 288 (28.2%) |
Educational Attainment by Field of Study in Buellton
Business (274 | 17.5%), liberal arts & history (213 | 13.6%), physical & health sciences (165 | 10.5%), social sciences (154 | 9.8%), and science & technology (147 | 9.4%) are the most common fields of study among 1,566 individuals in Buellton who have obtained a bachelor's degree or higher.
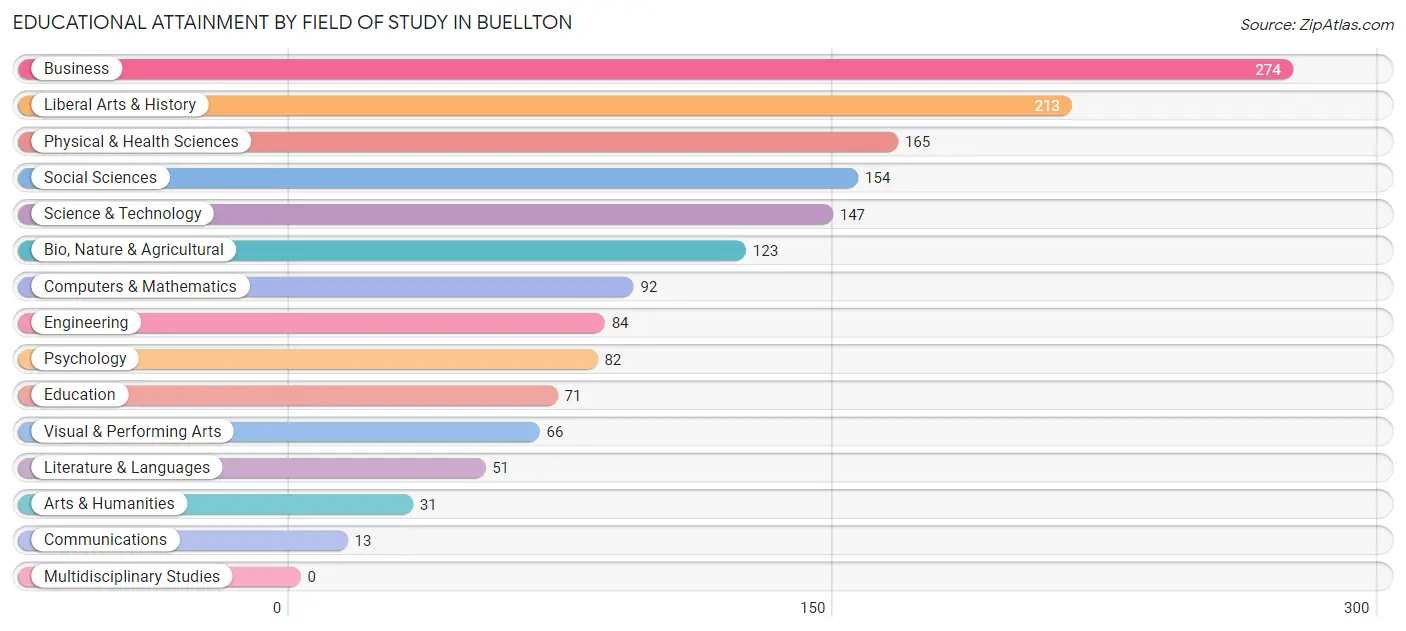
| Field of Study | # Graduates | % Graduates |
| Computers & Mathematics | 92 | 5.9% |
| Bio, Nature & Agricultural | 123 | 7.9% |
| Physical & Health Sciences | 165 | 10.5% |
| Psychology | 82 | 5.2% |
| Social Sciences | 154 | 9.8% |
| Engineering | 84 | 5.4% |
| Multidisciplinary Studies | 0 | 0.0% |
| Science & Technology | 147 | 9.4% |
| Business | 274 | 17.5% |
| Education | 71 | 4.5% |
| Literature & Languages | 51 | 3.3% |
| Liberal Arts & History | 213 | 13.6% |
| Visual & Performing Arts | 66 | 4.2% |
| Communications | 13 | 0.8% |
| Arts & Humanities | 31 | 2.0% |
| Total | 1,566 | 100.0% |
Transportation & Commute in Buellton
Vehicle Availability by Sex in Buellton
The most prevalent vehicle ownership categories in Buellton are males with 2 vehicles (631, accounting for 40.2%) and females with 2 vehicles (551, making up 43.0%).
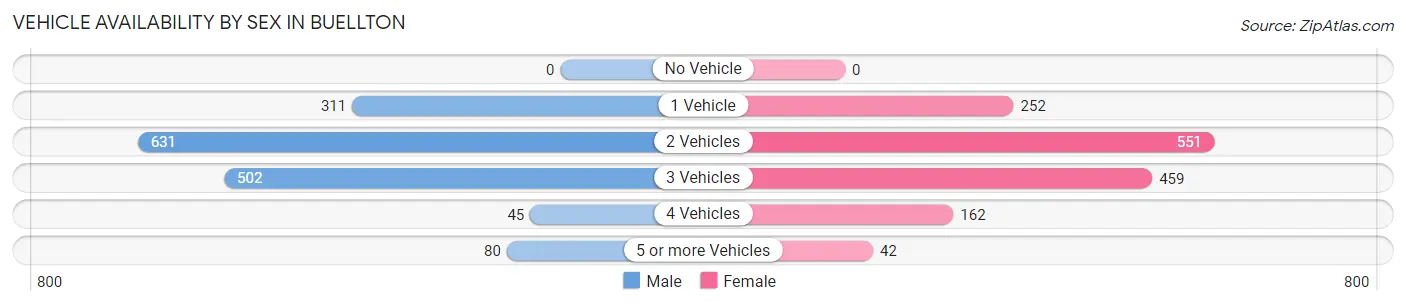
| Vehicles Available | Male | Female |
| No Vehicle | 0 (0.0%) | 0 (0.0%) |
| 1 Vehicle | 311 (19.8%) | 252 (17.2%) |
| 2 Vehicles | 631 (40.2%) | 551 (37.6%) |
| 3 Vehicles | 502 (32.0%) | 459 (31.3%) |
| 4 Vehicles | 45 (2.9%) | 162 (11.1%) |
| 5 or more Vehicles | 80 (5.1%) | 42 (2.9%) |
| Total | 1,569 (100.0%) | 1,466 (100.0%) |
Commute Time in Buellton
The most frequently occuring commute durations in Buellton are 45 to 59 minutes (870 commuters, 32.8%), 10 to 14 minutes (309 commuters, 11.6%), and 15 to 19 minutes (253 commuters, 9.5%).
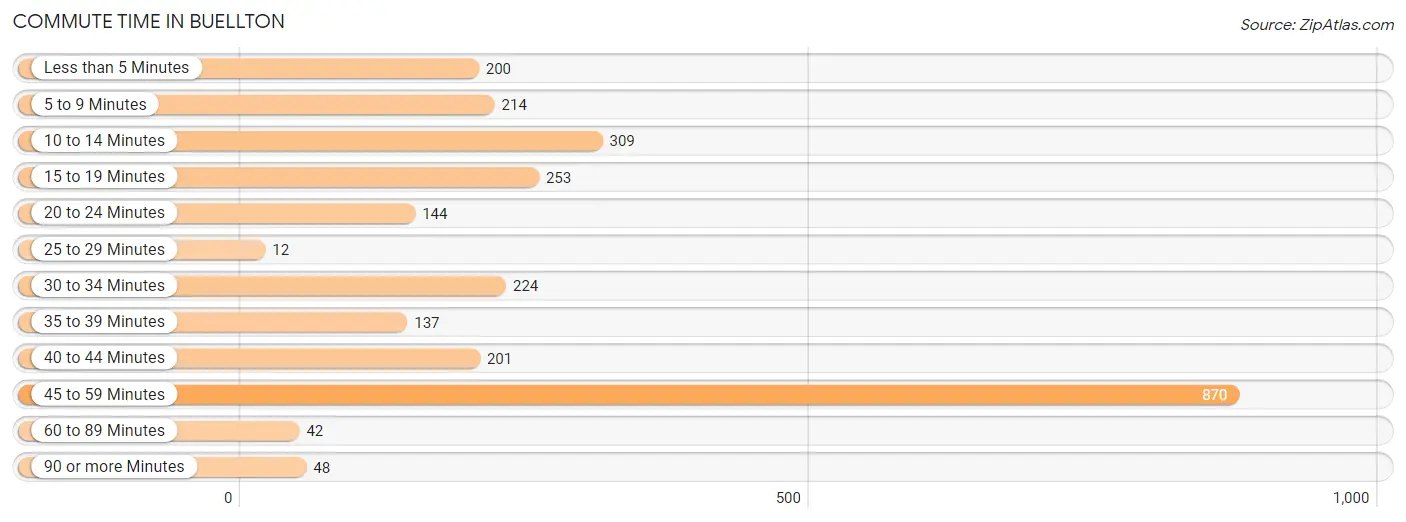
| Commute Time | # Commuters | % Commuters |
| Less than 5 Minutes | 200 | 7.5% |
| 5 to 9 Minutes | 214 | 8.1% |
| 10 to 14 Minutes | 309 | 11.6% |
| 15 to 19 Minutes | 253 | 9.5% |
| 20 to 24 Minutes | 144 | 5.4% |
| 25 to 29 Minutes | 12 | 0.4% |
| 30 to 34 Minutes | 224 | 8.4% |
| 35 to 39 Minutes | 137 | 5.2% |
| 40 to 44 Minutes | 201 | 7.6% |
| 45 to 59 Minutes | 870 | 32.8% |
| 60 to 89 Minutes | 42 | 1.6% |
| 90 or more Minutes | 48 | 1.8% |
Commute Time by Sex in Buellton
The most common commute times in Buellton are 45 to 59 minutes (466 commuters, 32.4%) for males and 45 to 59 minutes (404 commuters, 33.2%) for females.
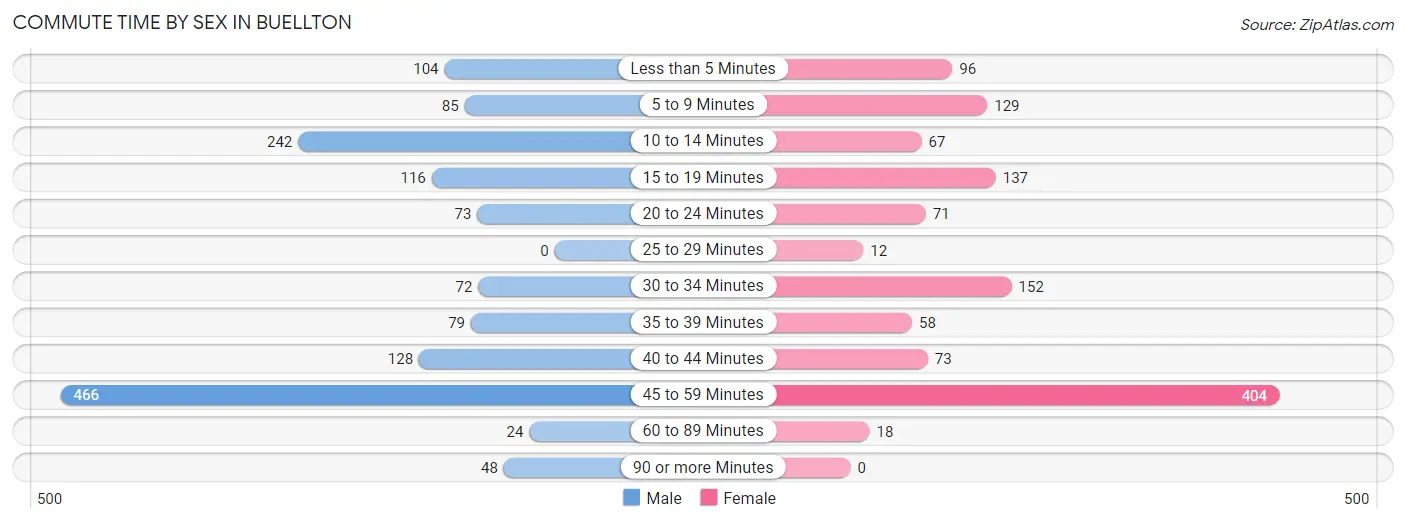
| Commute Time | Male | Female |
| Less than 5 Minutes | 104 (7.2%) | 96 (7.9%) |
| 5 to 9 Minutes | 85 (5.9%) | 129 (10.6%) |
| 10 to 14 Minutes | 242 (16.8%) | 67 (5.5%) |
| 15 to 19 Minutes | 116 (8.1%) | 137 (11.3%) |
| 20 to 24 Minutes | 73 (5.1%) | 71 (5.8%) |
| 25 to 29 Minutes | 0 (0.0%) | 12 (1.0%) |
| 30 to 34 Minutes | 72 (5.0%) | 152 (12.5%) |
| 35 to 39 Minutes | 79 (5.5%) | 58 (4.8%) |
| 40 to 44 Minutes | 128 (8.9%) | 73 (6.0%) |
| 45 to 59 Minutes | 466 (32.4%) | 404 (33.2%) |
| 60 to 89 Minutes | 24 (1.7%) | 18 (1.5%) |
| 90 or more Minutes | 48 (3.3%) | 0 (0.0%) |
Time of Departure to Work by Sex in Buellton
The most frequent times of departure to work in Buellton are 6:00 AM to 6:29 AM (321, 22.3%) for males and 7:00 AM to 7:29 AM (325, 26.7%) for females.
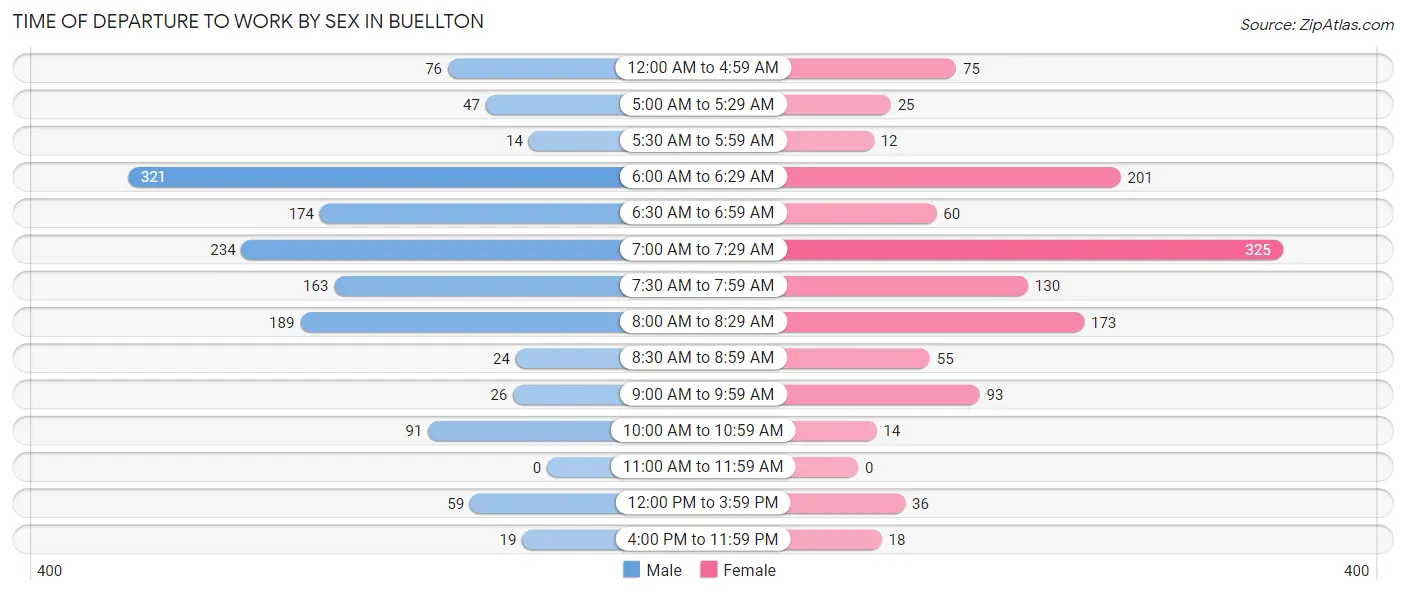
| Time of Departure | Male | Female |
| 12:00 AM to 4:59 AM | 76 (5.3%) | 75 (6.2%) |
| 5:00 AM to 5:29 AM | 47 (3.3%) | 25 (2.1%) |
| 5:30 AM to 5:59 AM | 14 (1.0%) | 12 (1.0%) |
| 6:00 AM to 6:29 AM | 321 (22.3%) | 201 (16.5%) |
| 6:30 AM to 6:59 AM | 174 (12.1%) | 60 (4.9%) |
| 7:00 AM to 7:29 AM | 234 (16.3%) | 325 (26.7%) |
| 7:30 AM to 7:59 AM | 163 (11.3%) | 130 (10.7%) |
| 8:00 AM to 8:29 AM | 189 (13.2%) | 173 (14.2%) |
| 8:30 AM to 8:59 AM | 24 (1.7%) | 55 (4.5%) |
| 9:00 AM to 9:59 AM | 26 (1.8%) | 93 (7.6%) |
| 10:00 AM to 10:59 AM | 91 (6.3%) | 14 (1.1%) |
| 11:00 AM to 11:59 AM | 0 (0.0%) | 0 (0.0%) |
| 12:00 PM to 3:59 PM | 59 (4.1%) | 36 (3.0%) |
| 4:00 PM to 11:59 PM | 19 (1.3%) | 18 (1.5%) |
| Total | 1,437 (100.0%) | 1,217 (100.0%) |
Housing Occupancy in Buellton
Occupancy by Ownership in Buellton
Of the total 1,929 dwellings in Buellton, owner-occupied units account for 1,235 (64.0%), while renter-occupied units make up 694 (36.0%).
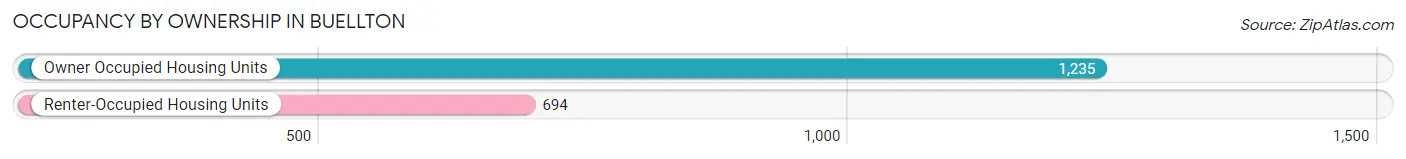
| Occupancy | # Housing Units | % Housing Units |
| Owner Occupied Housing Units | 1,235 | 64.0% |
| Renter-Occupied Housing Units | 694 | 36.0% |
| Total Occupied Housing Units | 1,929 | 100.0% |
Occupancy by Household Size in Buellton
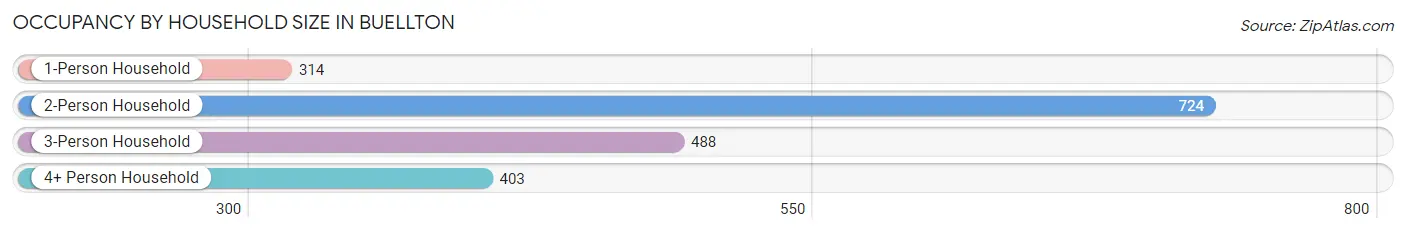
| Household Size | # Housing Units | % Housing Units |
| 1-Person Household | 314 | 16.3% |
| 2-Person Household | 724 | 37.5% |
| 3-Person Household | 488 | 25.3% |
| 4+ Person Household | 403 | 20.9% |
| Total Housing Units | 1,929 | 100.0% |
Occupancy by Ownership by Household Size in Buellton
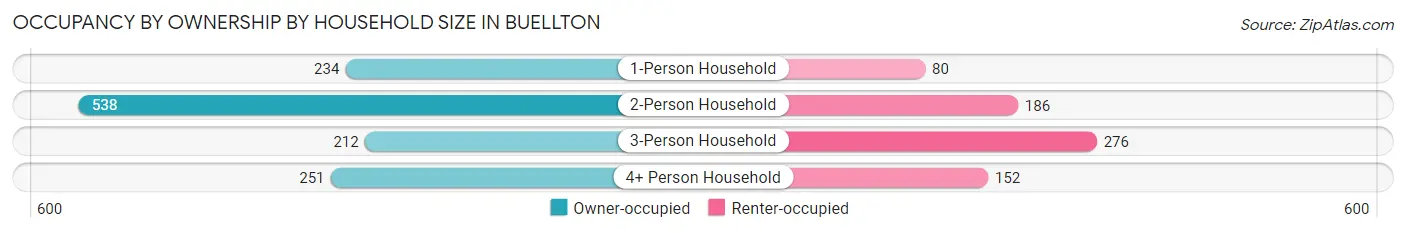
| Household Size | Owner-occupied | Renter-occupied |
| 1-Person Household | 234 (74.5%) | 80 (25.5%) |
| 2-Person Household | 538 (74.3%) | 186 (25.7%) |
| 3-Person Household | 212 (43.4%) | 276 (56.6%) |
| 4+ Person Household | 251 (62.3%) | 152 (37.7%) |
| Total Housing Units | 1,235 (64.0%) | 694 (36.0%) |
Occupancy by Educational Attainment in Buellton
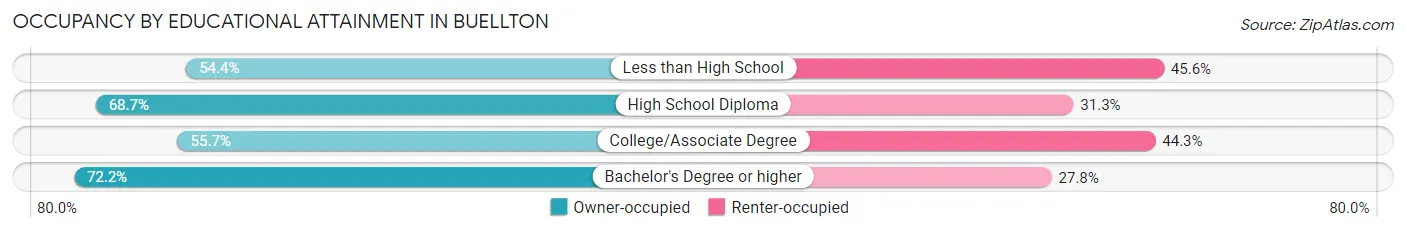
| Household Size | Owner-occupied | Renter-occupied |
| Less than High School | 81 (54.4%) | 68 (45.6%) |
| High School Diploma | 167 (68.7%) | 76 (31.3%) |
| College/Associate Degree | 414 (55.7%) | 329 (44.3%) |
| Bachelor's Degree or higher | 573 (72.2%) | 221 (27.8%) |
Occupancy by Age of Householder in Buellton
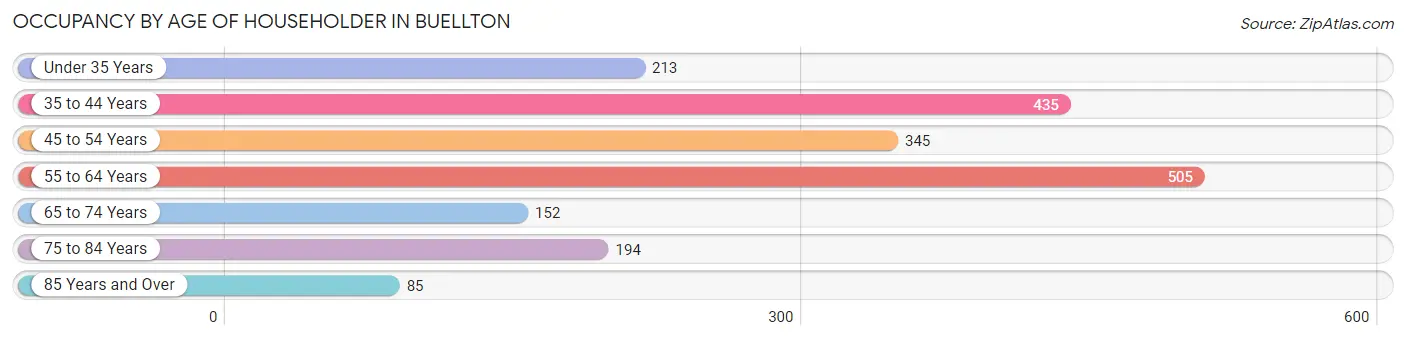
| Age Bracket | # Households | % Households |
| Under 35 Years | 213 | 11.0% |
| 35 to 44 Years | 435 | 22.6% |
| 45 to 54 Years | 345 | 17.9% |
| 55 to 64 Years | 505 | 26.2% |
| 65 to 74 Years | 152 | 7.9% |
| 75 to 84 Years | 194 | 10.1% |
| 85 Years and Over | 85 | 4.4% |
| Total | 1,929 | 100.0% |
Housing Finances in Buellton
Median Income by Occupancy in Buellton
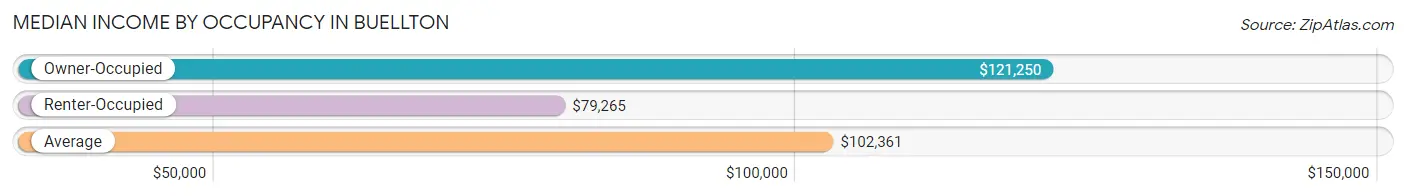
| Occupancy Type | # Households | Median Income |
| Owner-Occupied | 1,235 (64.0%) | $121,250 |
| Renter-Occupied | 694 (36.0%) | $79,265 |
| Average | 1,929 (100.0%) | $102,361 |
Occupancy by Householder Income Bracket in Buellton
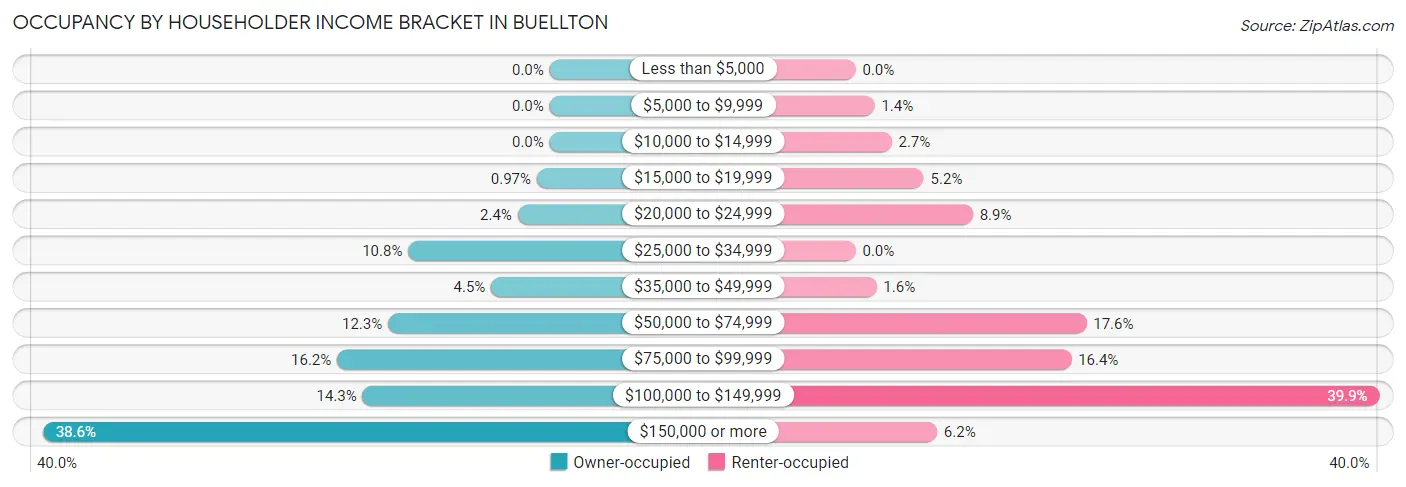
| Income Bracket | Owner-occupied | Renter-occupied |
| Less than $5,000 | 0 (0.0%) | 0 (0.0%) |
| $5,000 to $9,999 | 0 (0.0%) | 10 (1.4%) |
| $10,000 to $14,999 | 0 (0.0%) | 19 (2.7%) |
| $15,000 to $19,999 | 12 (1.0%) | 36 (5.2%) |
| $20,000 to $24,999 | 30 (2.4%) | 62 (8.9%) |
| $25,000 to $34,999 | 133 (10.8%) | 0 (0.0%) |
| $35,000 to $49,999 | 55 (4.4%) | 11 (1.6%) |
| $50,000 to $74,999 | 152 (12.3%) | 122 (17.6%) |
| $75,000 to $99,999 | 200 (16.2%) | 114 (16.4%) |
| $100,000 to $149,999 | 176 (14.2%) | 277 (39.9%) |
| $150,000 or more | 477 (38.6%) | 43 (6.2%) |
| Total | 1,235 (100.0%) | 694 (100.0%) |
Monthly Housing Cost Tiers in Buellton
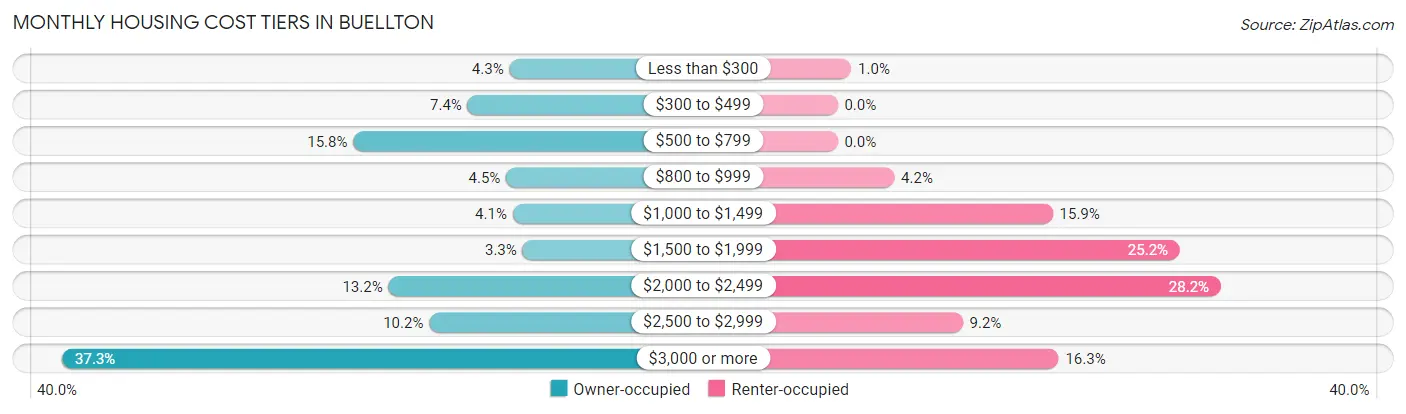
| Monthly Cost | Owner-occupied | Renter-occupied |
| Less than $300 | 53 (4.3%) | 7 (1.0%) |
| $300 to $499 | 91 (7.4%) | 0 (0.0%) |
| $500 to $799 | 195 (15.8%) | 0 (0.0%) |
| $800 to $999 | 56 (4.5%) | 29 (4.2%) |
| $1,000 to $1,499 | 50 (4.1%) | 110 (15.9%) |
| $1,500 to $1,999 | 41 (3.3%) | 175 (25.2%) |
| $2,000 to $2,499 | 163 (13.2%) | 196 (28.2%) |
| $2,500 to $2,999 | 126 (10.2%) | 64 (9.2%) |
| $3,000 or more | 460 (37.2%) | 113 (16.3%) |
| Total | 1,235 (100.0%) | 694 (100.0%) |
Physical Housing Characteristics in Buellton
Housing Structures in Buellton
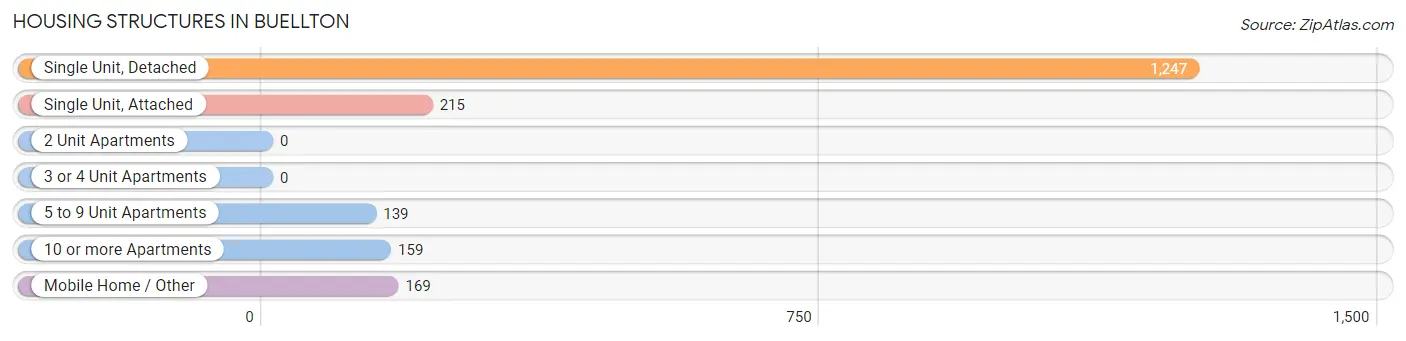
| Structure Type | # Housing Units | % Housing Units |
| Single Unit, Detached | 1,247 | 64.6% |
| Single Unit, Attached | 215 | 11.2% |
| 2 Unit Apartments | 0 | 0.0% |
| 3 or 4 Unit Apartments | 0 | 0.0% |
| 5 to 9 Unit Apartments | 139 | 7.2% |
| 10 or more Apartments | 159 | 8.2% |
| Mobile Home / Other | 169 | 8.8% |
| Total | 1,929 | 100.0% |
Housing Structures by Occupancy in Buellton
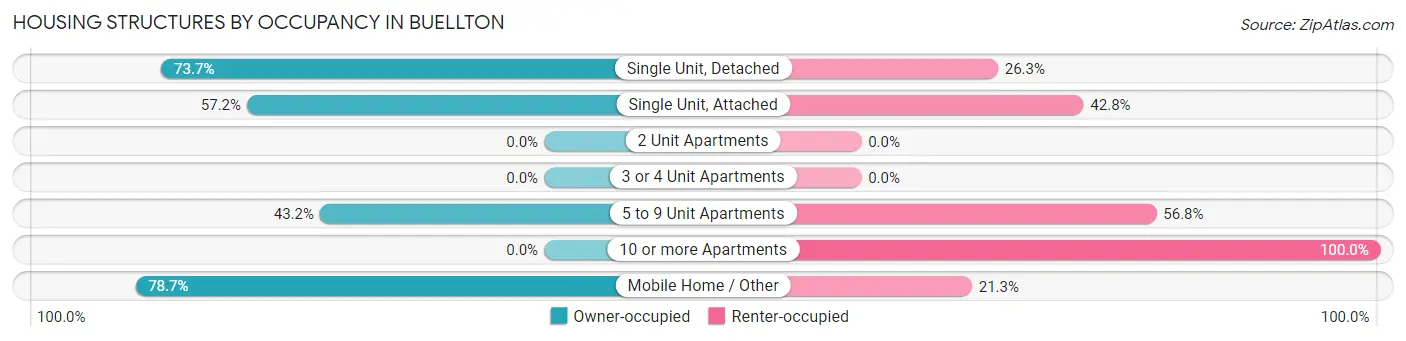
| Structure Type | Owner-occupied | Renter-occupied |
| Single Unit, Detached | 919 (73.7%) | 328 (26.3%) |
| Single Unit, Attached | 123 (57.2%) | 92 (42.8%) |
| 2 Unit Apartments | 0 (0.0%) | 0 (0.0%) |
| 3 or 4 Unit Apartments | 0 (0.0%) | 0 (0.0%) |
| 5 to 9 Unit Apartments | 60 (43.2%) | 79 (56.8%) |
| 10 or more Apartments | 0 (0.0%) | 159 (100.0%) |
| Mobile Home / Other | 133 (78.7%) | 36 (21.3%) |
| Total | 1,235 (64.0%) | 694 (36.0%) |
Housing Structures by Number of Rooms in Buellton
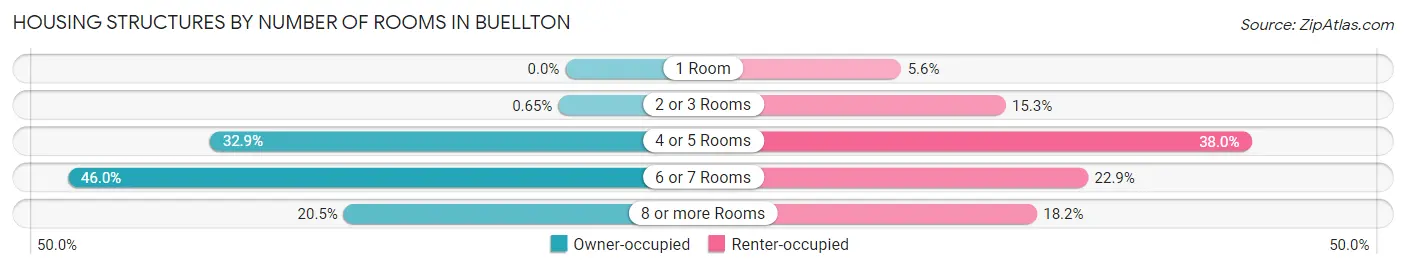
| Number of Rooms | Owner-occupied | Renter-occupied |
| 1 Room | 0 (0.0%) | 39 (5.6%) |
| 2 or 3 Rooms | 8 (0.6%) | 106 (15.3%) |
| 4 or 5 Rooms | 406 (32.9%) | 264 (38.0%) |
| 6 or 7 Rooms | 568 (46.0%) | 159 (22.9%) |
| 8 or more Rooms | 253 (20.5%) | 126 (18.2%) |
| Total | 1,235 (100.0%) | 694 (100.0%) |
Housing Structure by Heating Type in Buellton
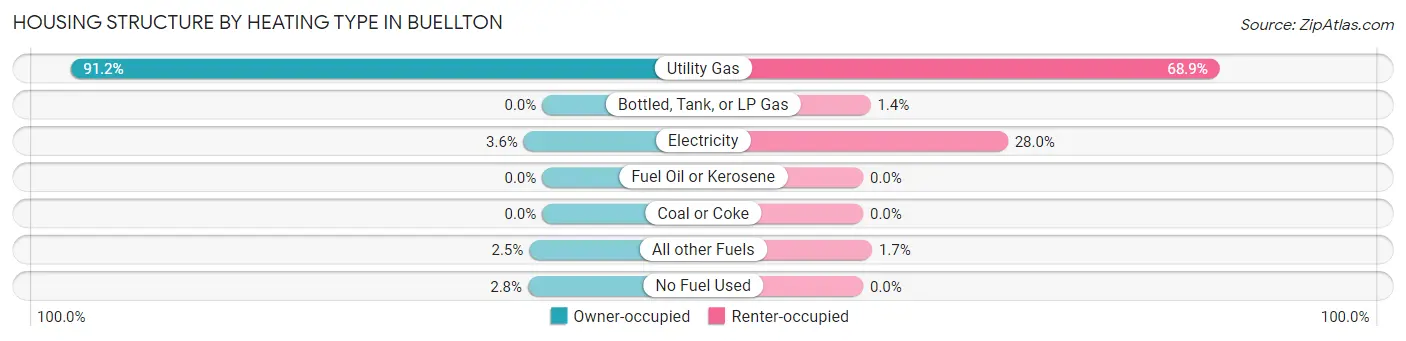
| Heating Type | Owner-occupied | Renter-occupied |
| Utility Gas | 1,126 (91.2%) | 478 (68.9%) |
| Bottled, Tank, or LP Gas | 0 (0.0%) | 10 (1.4%) |
| Electricity | 44 (3.6%) | 194 (28.0%) |
| Fuel Oil or Kerosene | 0 (0.0%) | 0 (0.0%) |
| Coal or Coke | 0 (0.0%) | 0 (0.0%) |
| All other Fuels | 31 (2.5%) | 12 (1.7%) |
| No Fuel Used | 34 (2.8%) | 0 (0.0%) |
| Total | 1,235 (100.0%) | 694 (100.0%) |
Household Vehicle Usage in Buellton
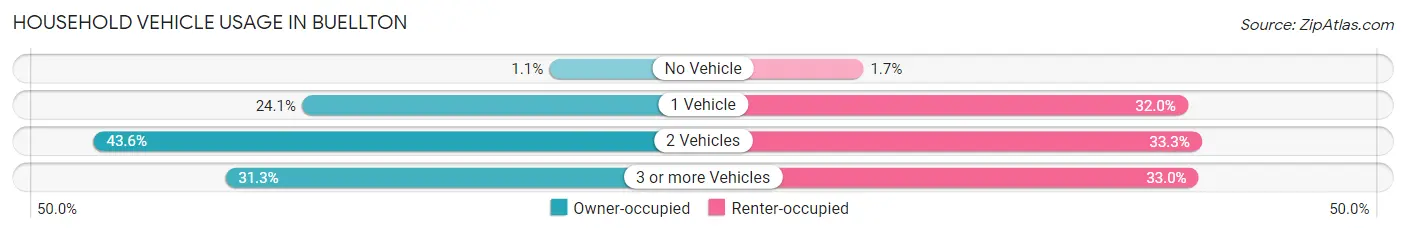
| Vehicles per Household | Owner-occupied | Renter-occupied |
| No Vehicle | 13 (1.1%) | 12 (1.7%) |
| 1 Vehicle | 298 (24.1%) | 222 (32.0%) |
| 2 Vehicles | 538 (43.6%) | 231 (33.3%) |
| 3 or more Vehicles | 386 (31.3%) | 229 (33.0%) |
| Total | 1,235 (100.0%) | 694 (100.0%) |
Real Estate & Mortgages in Buellton
Real Estate and Mortgage Overview in Buellton
| Characteristic | Without Mortgage | With Mortgage |
| Housing Units | 369 | 866 |
| Median Property Value | $709,800 | $692,100 |
| Median Household Income | $54,896 | $418 |
| Monthly Housing Costs | $621 | $460 |
| Real Estate Taxes | $3,216 | $101 |
Property Value by Mortgage Status in Buellton
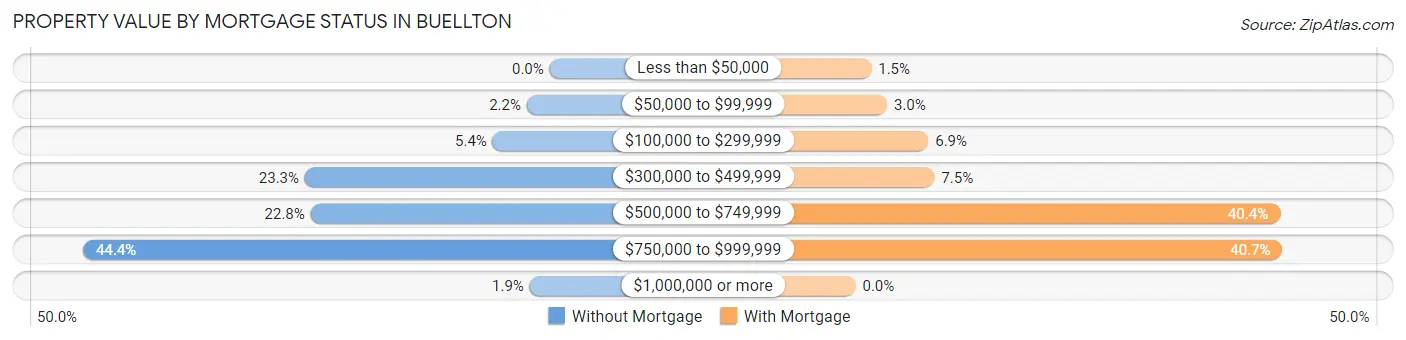
| Property Value | Without Mortgage | With Mortgage |
| Less than $50,000 | 0 (0.0%) | 13 (1.5%) |
| $50,000 to $99,999 | 8 (2.2%) | 26 (3.0%) |
| $100,000 to $299,999 | 20 (5.4%) | 60 (6.9%) |
| $300,000 to $499,999 | 86 (23.3%) | 65 (7.5%) |
| $500,000 to $749,999 | 84 (22.8%) | 350 (40.4%) |
| $750,000 to $999,999 | 164 (44.4%) | 352 (40.6%) |
| $1,000,000 or more | 7 (1.9%) | 0 (0.0%) |
| Total | 369 (100.0%) | 866 (100.0%) |
Household Income by Mortgage Status in Buellton
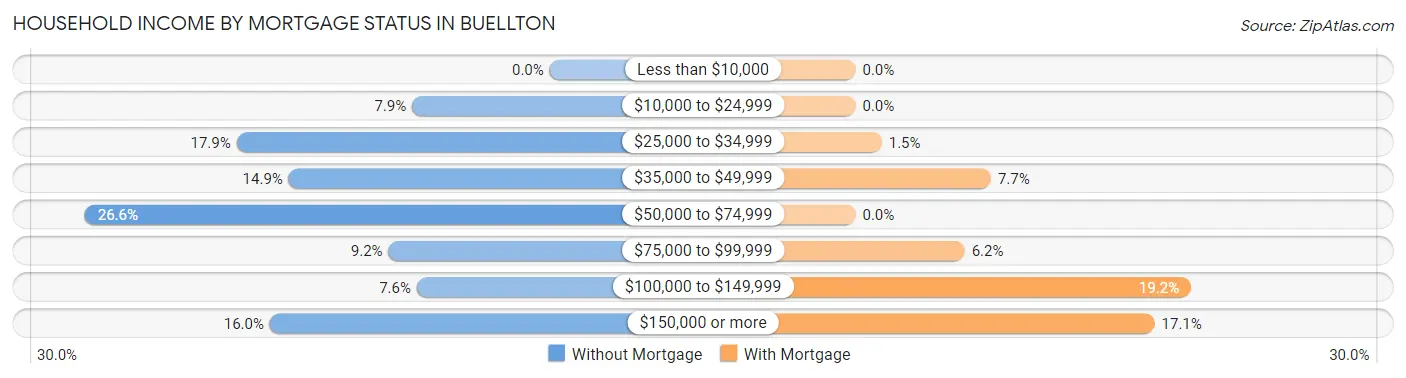
| Household Income | Without Mortgage | With Mortgage |
| Less than $10,000 | 0 (0.0%) | 0 (0.0%) |
| $10,000 to $24,999 | 29 (7.9%) | 0 (0.0%) |
| $25,000 to $34,999 | 66 (17.9%) | 13 (1.5%) |
| $35,000 to $49,999 | 55 (14.9%) | 67 (7.7%) |
| $50,000 to $74,999 | 98 (26.6%) | 0 (0.0%) |
| $75,000 to $99,999 | 34 (9.2%) | 54 (6.2%) |
| $100,000 to $149,999 | 28 (7.6%) | 166 (19.2%) |
| $150,000 or more | 59 (16.0%) | 148 (17.1%) |
| Total | 369 (100.0%) | 866 (100.0%) |
Property Value to Household Income Ratio in Buellton
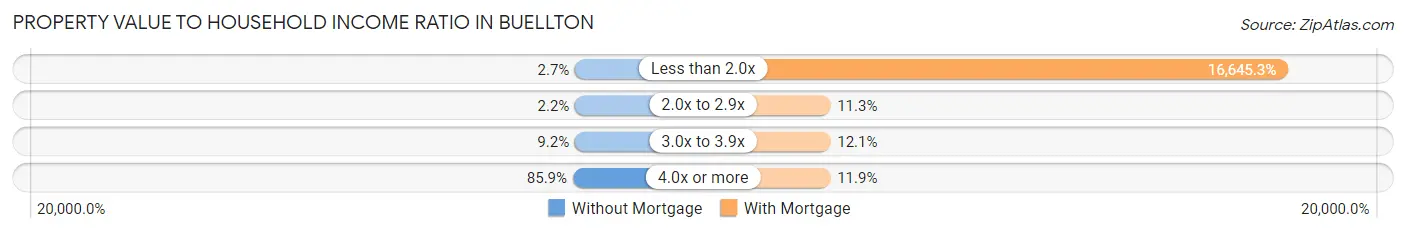
| Value-to-Income Ratio | Without Mortgage | With Mortgage |
| Less than 2.0x | 10 (2.7%) | 144,148 (16,645.3%) |
| 2.0x to 2.9x | 8 (2.2%) | 98 (11.3%) |
| 3.0x to 3.9x | 34 (9.2%) | 105 (12.1%) |
| 4.0x or more | 317 (85.9%) | 103 (11.9%) |
| Total | 369 (100.0%) | 866 (100.0%) |
Real Estate Taxes by Mortgage Status in Buellton
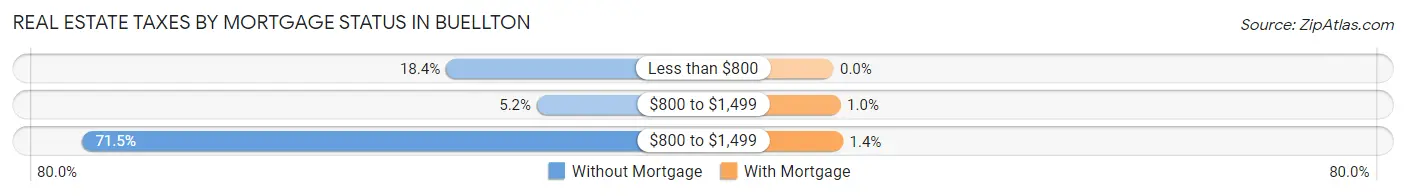
| Property Taxes | Without Mortgage | With Mortgage |
| Less than $800 | 68 (18.4%) | 0 (0.0%) |
| $800 to $1,499 | 19 (5.1%) | 9 (1.0%) |
| $800 to $1,499 | 264 (71.5%) | 12 (1.4%) |
| Total | 369 (100.0%) | 866 (100.0%) |
Health & Disability in Buellton
Health Insurance Coverage by Age in Buellton
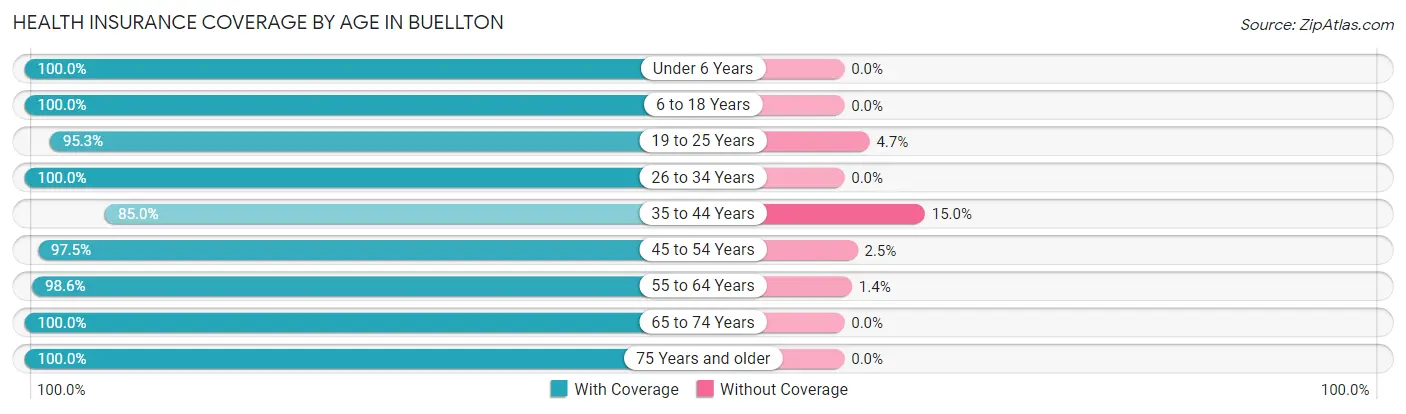
| Age Bracket | With Coverage | Without Coverage |
| Under 6 Years | 484 (100.0%) | 0 (0.0%) |
| 6 to 18 Years | 755 (100.0%) | 0 (0.0%) |
| 19 to 25 Years | 284 (95.3%) | 14 (4.7%) |
| 26 to 34 Years | 561 (100.0%) | 0 (0.0%) |
| 35 to 44 Years | 872 (85.0%) | 154 (15.0%) |
| 45 to 54 Years | 473 (97.5%) | 12 (2.5%) |
| 55 to 64 Years | 835 (98.6%) | 12 (1.4%) |
| 65 to 74 Years | 260 (100.0%) | 0 (0.0%) |
| 75 Years and older | 424 (100.0%) | 0 (0.0%) |
| Total | 4,948 (96.3%) | 192 (3.7%) |
Health Insurance Coverage by Citizenship Status in Buellton
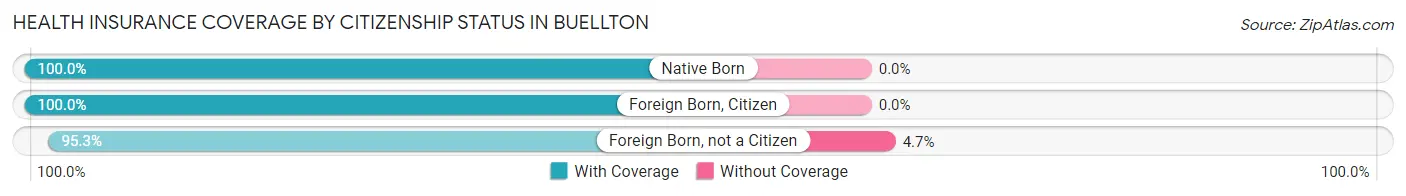
| Citizenship Status | With Coverage | Without Coverage |
| Native Born | 484 (100.0%) | 0 (0.0%) |
| Foreign Born, Citizen | 755 (100.0%) | 0 (0.0%) |
| Foreign Born, not a Citizen | 284 (95.3%) | 14 (4.7%) |
Health Insurance Coverage by Household Income in Buellton
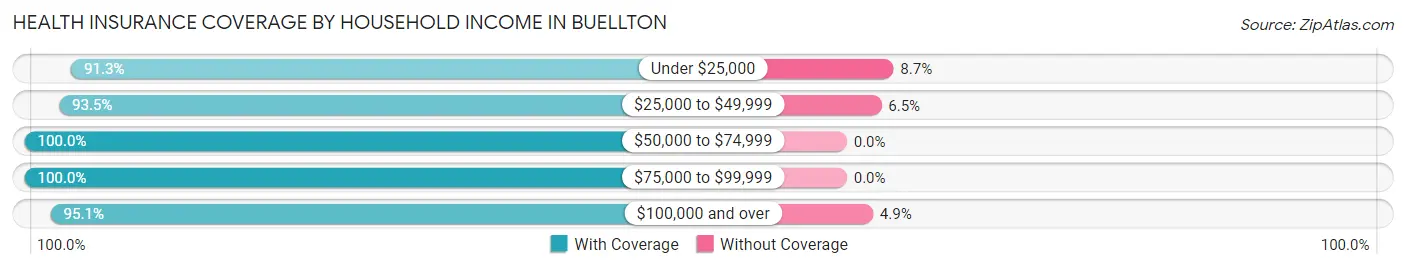
| Household Income | With Coverage | Without Coverage |
| Under $25,000 | 251 (91.3%) | 24 (8.7%) |
| $25,000 to $49,999 | 289 (93.5%) | 20 (6.5%) |
| $50,000 to $74,999 | 727 (100.0%) | 0 (0.0%) |
| $75,000 to $99,999 | 802 (100.0%) | 0 (0.0%) |
| $100,000 and over | 2,879 (95.1%) | 148 (4.9%) |
Public vs Private Health Insurance Coverage by Age in Buellton
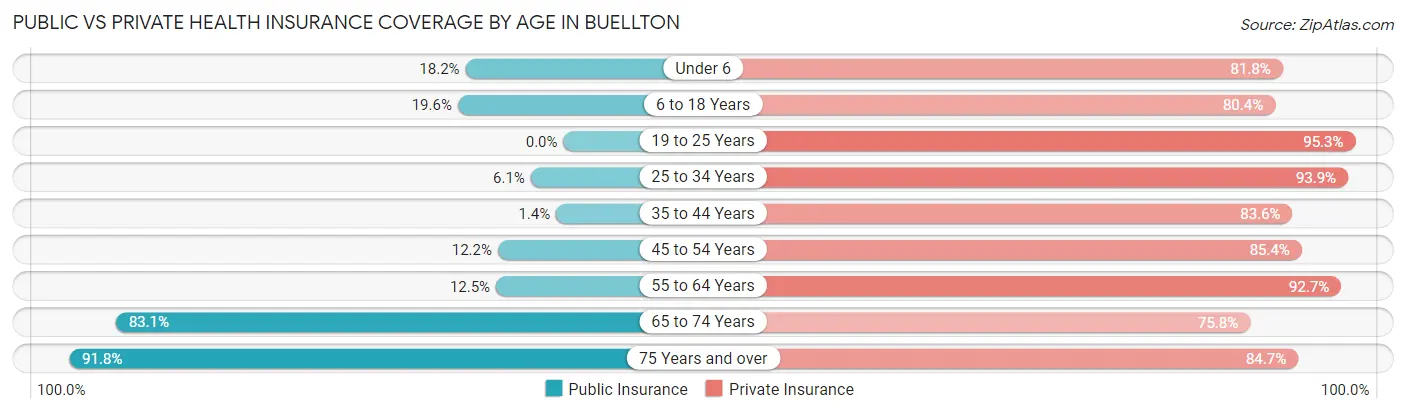
| Age Bracket | Public Insurance | Private Insurance |
| Under 6 | 88 (18.2%) | 396 (81.8%) |
| 6 to 18 Years | 148 (19.6%) | 607 (80.4%) |
| 19 to 25 Years | 0 (0.0%) | 284 (95.3%) |
| 25 to 34 Years | 34 (6.1%) | 527 (93.9%) |
| 35 to 44 Years | 14 (1.4%) | 858 (83.6%) |
| 45 to 54 Years | 59 (12.2%) | 414 (85.4%) |
| 55 to 64 Years | 106 (12.5%) | 785 (92.7%) |
| 65 to 74 Years | 216 (83.1%) | 197 (75.8%) |
| 75 Years and over | 389 (91.7%) | 359 (84.7%) |
| Total | 1,054 (20.5%) | 4,427 (86.1%) |
Disability Status by Sex by Age in Buellton
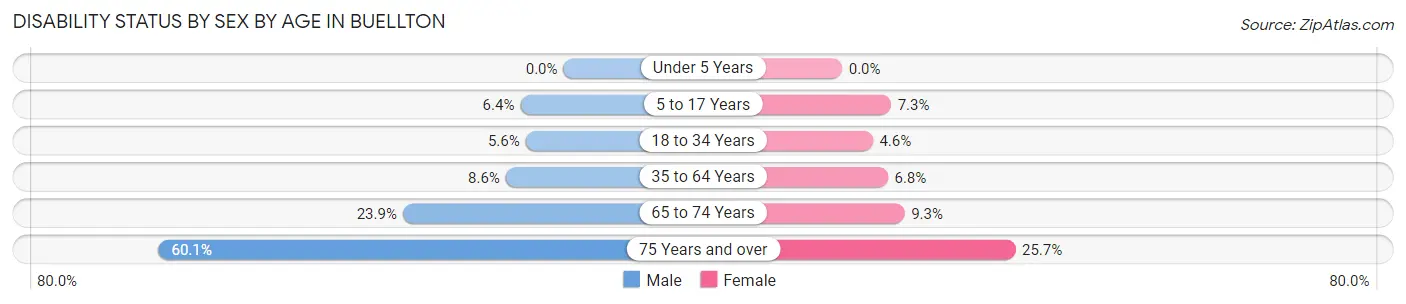
| Age Bracket | Male | Female |
| Under 5 Years | 0 (0.0%) | 0 (0.0%) |
| 5 to 17 Years | 22 (6.4%) | 29 (7.3%) |
| 18 to 34 Years | 21 (5.6%) | 24 (4.5%) |
| 35 to 64 Years | 106 (8.6%) | 76 (6.8%) |
| 65 to 74 Years | 26 (23.8%) | 14 (9.3%) |
| 75 Years and over | 110 (60.1%) | 62 (25.7%) |
Disability Class by Sex by Age in Buellton
Disability Class: Hearing Difficulty
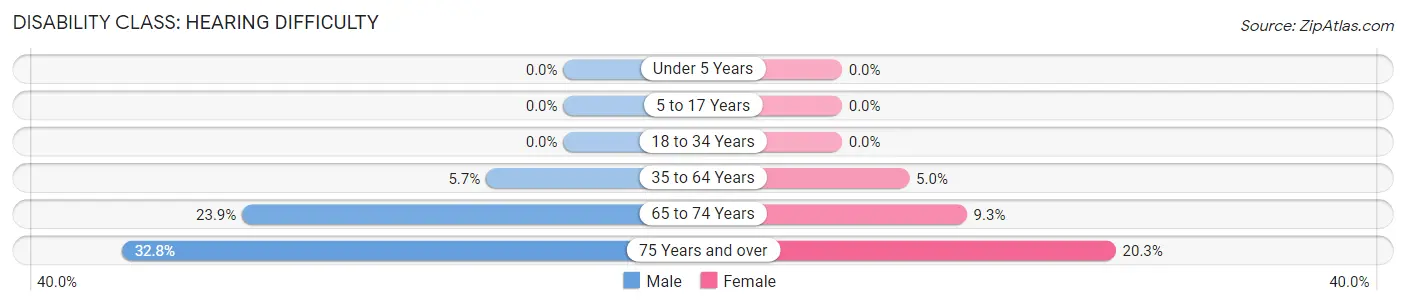
| Age Bracket | Male | Female |
| Under 5 Years | 0 (0.0%) | 0 (0.0%) |
| 5 to 17 Years | 0 (0.0%) | 0 (0.0%) |
| 18 to 34 Years | 0 (0.0%) | 0 (0.0%) |
| 35 to 64 Years | 71 (5.7%) | 56 (5.0%) |
| 65 to 74 Years | 26 (23.8%) | 14 (9.3%) |
| 75 Years and over | 60 (32.8%) | 49 (20.3%) |
Disability Class: Vision Difficulty
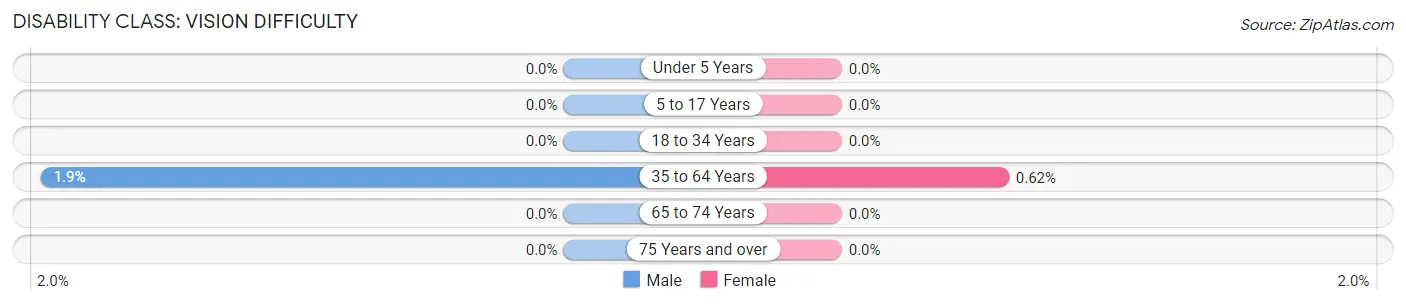
| Age Bracket | Male | Female |
| Under 5 Years | 0 (0.0%) | 0 (0.0%) |
| 5 to 17 Years | 0 (0.0%) | 0 (0.0%) |
| 18 to 34 Years | 0 (0.0%) | 0 (0.0%) |
| 35 to 64 Years | 24 (1.9%) | 7 (0.6%) |
| 65 to 74 Years | 0 (0.0%) | 0 (0.0%) |
| 75 Years and over | 0 (0.0%) | 0 (0.0%) |
Disability Class: Cognitive Difficulty
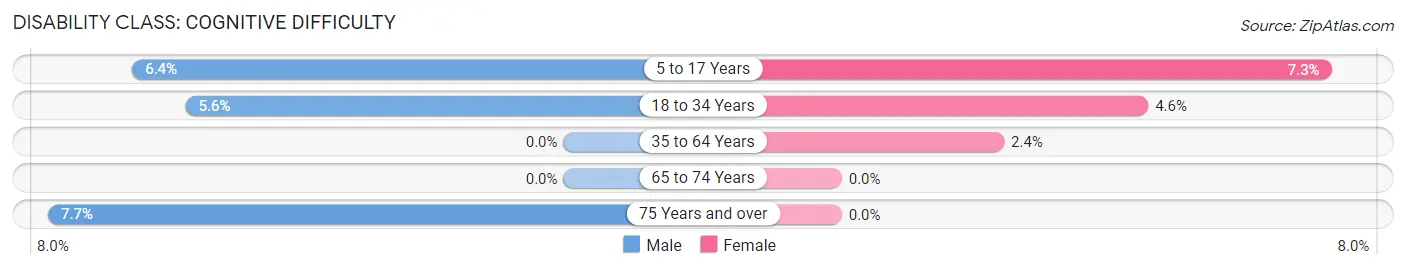
| Age Bracket | Male | Female |
| 5 to 17 Years | 22 (6.4%) | 29 (7.3%) |
| 18 to 34 Years | 21 (5.6%) | 24 (4.5%) |
| 35 to 64 Years | 0 (0.0%) | 27 (2.4%) |
| 65 to 74 Years | 0 (0.0%) | 0 (0.0%) |
| 75 Years and over | 14 (7.6%) | 0 (0.0%) |
Disability Class: Ambulatory Difficulty
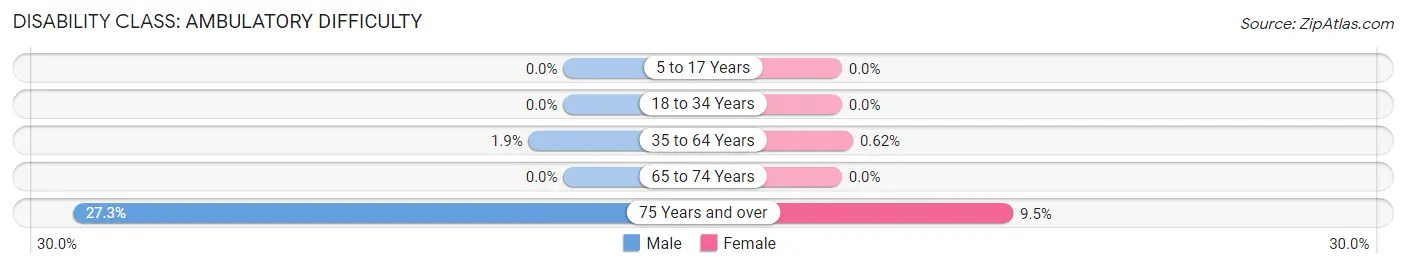
| Age Bracket | Male | Female |
| 5 to 17 Years | 0 (0.0%) | 0 (0.0%) |
| 18 to 34 Years | 0 (0.0%) | 0 (0.0%) |
| 35 to 64 Years | 24 (1.9%) | 7 (0.6%) |
| 65 to 74 Years | 0 (0.0%) | 0 (0.0%) |
| 75 Years and over | 50 (27.3%) | 23 (9.5%) |
Disability Class: Self-Care Difficulty
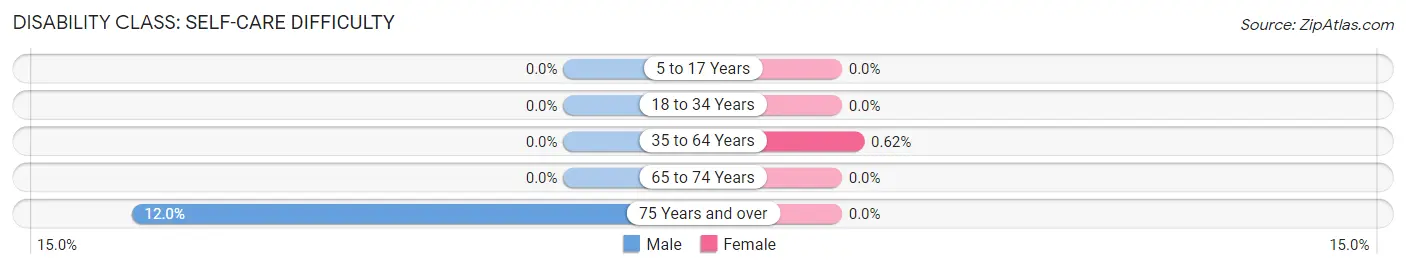
| Age Bracket | Male | Female |
| 5 to 17 Years | 0 (0.0%) | 0 (0.0%) |
| 18 to 34 Years | 0 (0.0%) | 0 (0.0%) |
| 35 to 64 Years | 0 (0.0%) | 7 (0.6%) |
| 65 to 74 Years | 0 (0.0%) | 0 (0.0%) |
| 75 Years and over | 22 (12.0%) | 0 (0.0%) |
Technology Access in Buellton
Computing Device Access in Buellton
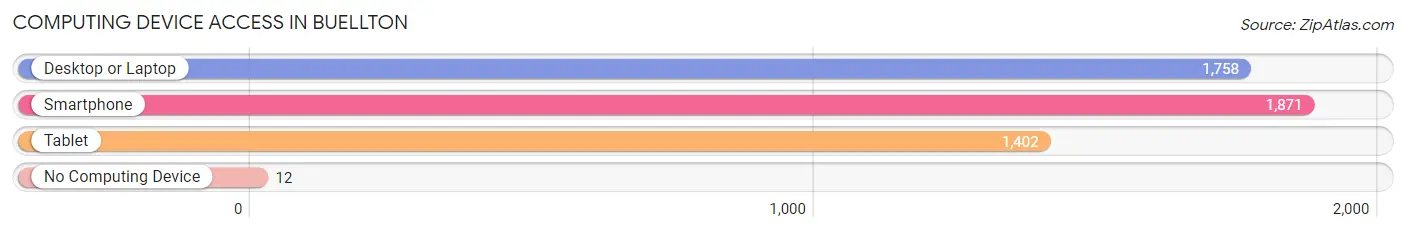
| Device Type | # Households | % Households |
| Desktop or Laptop | 1,758 | 91.1% |
| Smartphone | 1,871 | 97.0% |
| Tablet | 1,402 | 72.7% |
| No Computing Device | 12 | 0.6% |
| Total | 1,929 | 100.0% |
Internet Access in Buellton
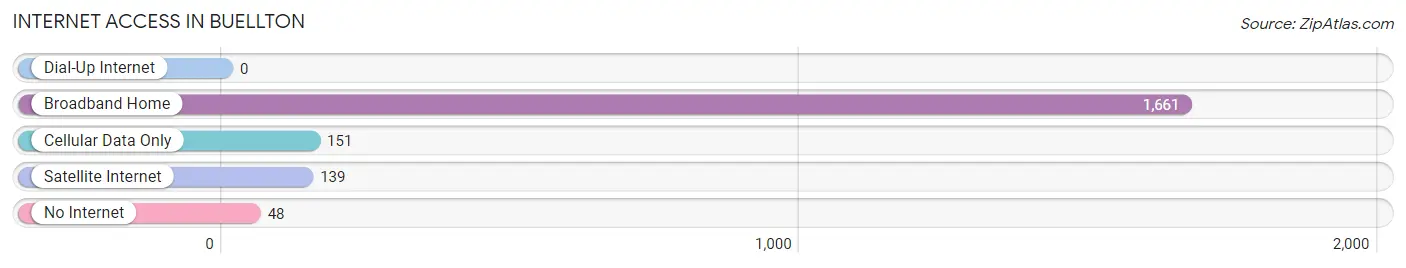
| Internet Type | # Households | % Households |
| Dial-Up Internet | 0 | 0.0% |
| Broadband Home | 1,661 | 86.1% |
| Cellular Data Only | 151 | 7.8% |
| Satellite Internet | 139 | 7.2% |
| No Internet | 48 | 2.5% |
| Total | 1,929 | 100.0% |
Buellton Summary
Buellton is a small city located in Santa Barbara County, California, United States. It is situated in the Santa Ynez Valley, about 8 miles (13 km) north of Santa Barbara and about 60 miles (97 km) northwest of Los Angeles. The population was 4,828 at the 2010 census.
History
The area around Buellton was originally inhabited by the Chumash people, who lived in the area for thousands of years. The first European settlers arrived in the area in the late 19th century, and the town was officially founded in 1876. The town was named after William Buell, who was one of the first settlers in the area.
In the early 20th century, Buellton became a popular stop for travelers on the old El Camino Real, which ran from Los Angeles to San Francisco. The town was also known for its hot springs, which were a popular destination for tourists.
In the 1950s, Buellton began to grow rapidly as the nearby cities of Santa Barbara and Los Angeles began to expand. The town was incorporated in 1961, and has since become a popular destination for tourists and wine enthusiasts.
Geography
Buellton is located in the Santa Ynez Valley, about 8 miles (13 km) north of Santa Barbara and about 60 miles (97 km) northwest of Los Angeles. The city is situated at an elevation of about 500 feet (152 m).
The city covers an area of about 2.5 square miles (6.5 km2), and is bordered by the cities of Solvang to the north, Santa Ynez to the east, and Los Olivos to the south. The Santa Ynez River runs through the city.
Economy
Buellton is a popular tourist destination, and the city’s economy is largely based on tourism. The city is home to several wineries, and is a popular destination for wine enthusiasts. The city is also home to several restaurants, hotels, and other tourist attractions.
The city is also home to several manufacturing and technology companies, including the Buellton-based company, Buellton Technologies.
Demographics
As of the 2010 census, there were 4,828 people, 1,845 households, and 1,220 families residing in the city. The population density was 1,919.3 people per square mile (739.3/km2). There were 1,945 housing units at an average density of 772.3 per square mile (297.7/km2).
The racial makeup of the city was 79.2% White, 0.7% African American, 0.7% Native American, 1.2% Asian, 0.1% Pacific Islander, 15.2% from other races, and 3.0% from two or more races. Hispanic or Latino of any race were 33.2% of the population.
The median income for a household in the city was $50,945, and the median income for a family was $60,945. Males had a median income of $41,945 versus $31,945 for females. The per capita income for the city was $25,945. About 8.2% of families and 11.2% of the population were below the poverty line, including 15.2% of those under age 18 and 6.2% of those age 65 or over.
Common Questions
What is Per Capita Income in Buellton?
Per Capita income in Buellton is $47,903.
What is the Median Family Income in Buellton?
Median Family Income in Buellton is $126,447.
What is the Median Household income in Buellton?
Median Household Income in Buellton is $102,361.
What is Income or Wage Gap in Buellton?
Income or Wage Gap in Buellton is 30.0%.
Women in Buellton earn 70.0 cents for every dollar earned by a man.
What is Inequality or Gini Index in Buellton?
Inequality or Gini Index in Buellton is 0.39.
What is the Total Population of Buellton?
Total Population of Buellton is 5,151.
What is the Total Male Population of Buellton?
Total Male Population of Buellton is 2,387.
What is the Total Female Population of Buellton?
Total Female Population of Buellton is 2,764.
What is the Ratio of Males per 100 Females in Buellton?
There are 86.36 Males per 100 Females in Buellton.
What is the Ratio of Females per 100 Males in Buellton?
There are 115.79 Females per 100 Males in Buellton.
What is the Median Population Age in Buellton?
Median Population Age in Buellton is 37.9 Years.
What is the Average Family Size in Buellton
Average Family Size in Buellton is 3.0 People.
What is the Average Household Size in Buellton
Average Household Size in Buellton is 2.7 People.
How Large is the Labor Force in Buellton?
There are 3,125 People in the Labor Forcein in Buellton.
What is the Percentage of People in the Labor Force in Buellton?
77.0% of People are in the Labor Force in Buellton.
What is the Unemployment Rate in Buellton?
Unemployment Rate in Buellton is 2.9%.