Brookdale, CA Map & Demographics
Brookdale Map
Brookdale Overview
$69,525
PER CAPITA INCOME
$159,848
AVG FAMILY INCOME
$85,294
AVG HOUSEHOLD INCOME
0.43
INEQUALITY / GINI INDEX
1,128
TOTAL POPULATION
646
MALE POPULATION
482
FEMALE POPULATION
134.02
MALES / 100 FEMALES
74.61
FEMALES / 100 MALES
50.9
MEDIAN AGE
2.9
AVG FAMILY SIZE
1.9
AVG HOUSEHOLD SIZE
700
LABOR FORCE [ PEOPLE ]
69.0%
PERCENT IN LABOR FORCE
3.4%
UNEMPLOYMENT RATE
Brookdale Zip Codes
Brookdale Area Codes
Income in Brookdale
Income Overview in Brookdale
Per Capita Income in Brookdale is $69,525, while median incomes of families and households are $159,848 and $85,294 respectively.
| Characteristic | Number | Measure |
| Per Capita Income | 1,128 | $69,525 |
| Median Family Income | 198 | $159,848 |
| Mean Family Income | 198 | $177,447 |
| Median Household Income | 606 | $85,294 |
| Mean Household Income | 606 | $133,730 |
| Income Deficit | 198 | $0 |
| Wage / Income Gap (%) | 1,128 | 0.00% |
| Wage / Income Gap ($) | 1,128 | 100.00¢ per $1 |
| Gini / Inequality Index | 1,128 | 0.43 |
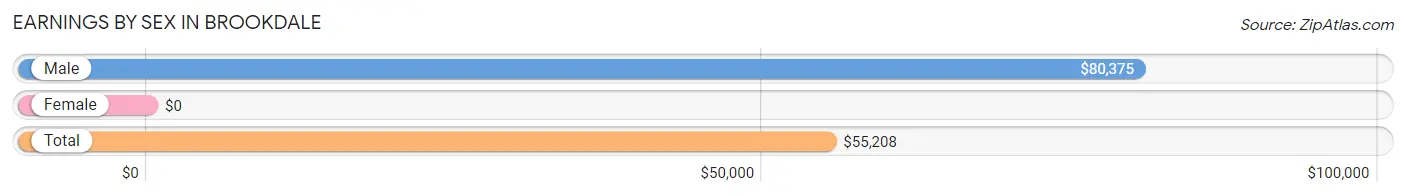
Earnings by Sex in Brookdale
| Sex | Number | Average Earnings |
| Male | 460 (66.0%) | $80,375 |
| Female | 237 (34.0%) | $0 |
| Total | 697 (100.0%) | $55,208 |
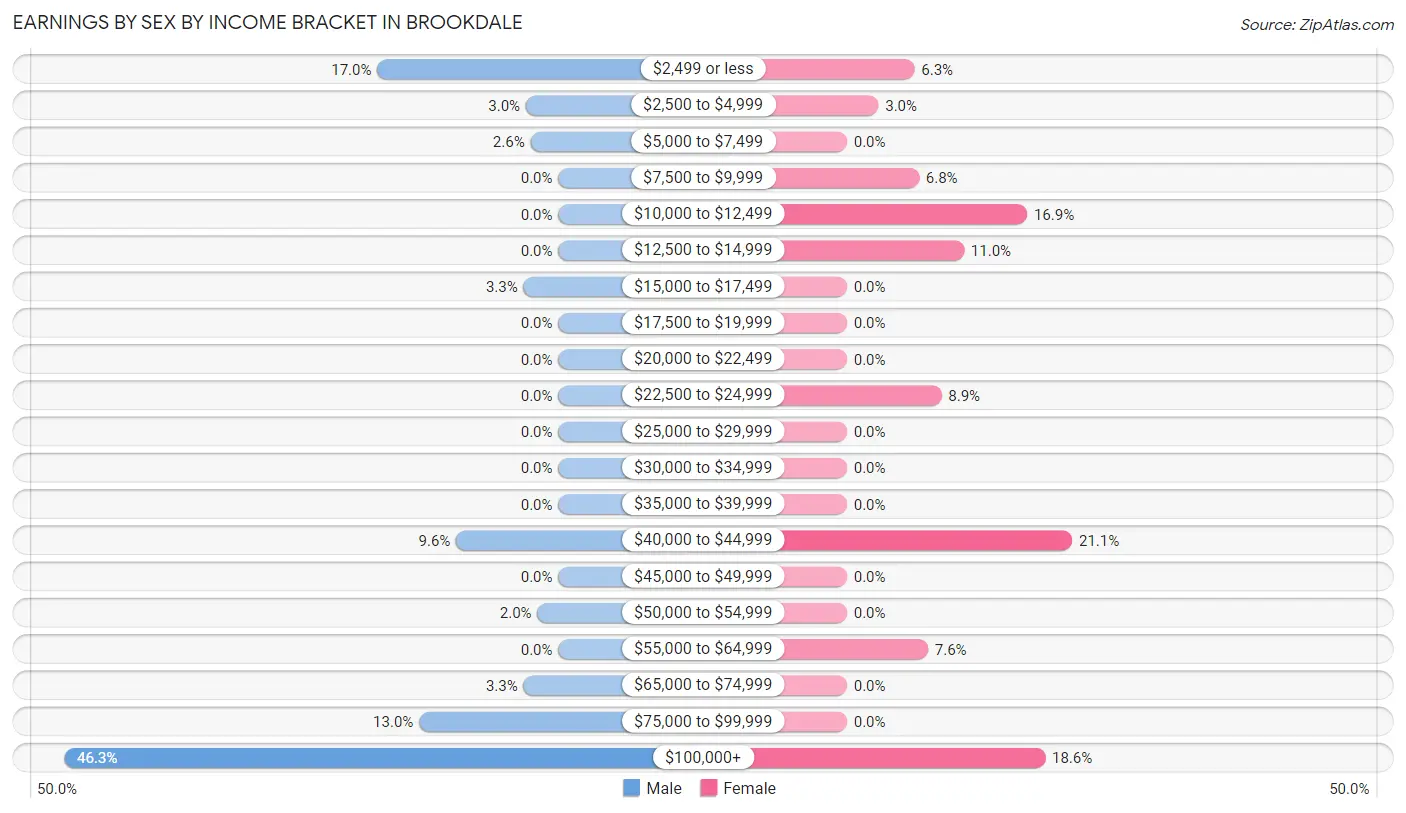
Earnings by Sex by Income Bracket in Brookdale
The most common earnings brackets in Brookdale are $100,000+ for men (213 | 46.3%) and $40,000 to $44,999 for women (50 | 21.1%).
| Income | Male | Female |
| $2,499 or less | 78 (17.0%) | 15 (6.3%) |
| $2,500 to $4,999 | 14 (3.0%) | 7 (2.9%) |
| $5,000 to $7,499 | 12 (2.6%) | 0 (0.0%) |
| $7,500 to $9,999 | 0 (0.0%) | 16 (6.8%) |
| $10,000 to $12,499 | 0 (0.0%) | 40 (16.9%) |
| $12,500 to $14,999 | 0 (0.0%) | 26 (11.0%) |
| $15,000 to $17,499 | 15 (3.3%) | 0 (0.0%) |
| $17,500 to $19,999 | 0 (0.0%) | 0 (0.0%) |
| $20,000 to $22,499 | 0 (0.0%) | 0 (0.0%) |
| $22,500 to $24,999 | 0 (0.0%) | 21 (8.9%) |
| $25,000 to $29,999 | 0 (0.0%) | 0 (0.0%) |
| $30,000 to $34,999 | 0 (0.0%) | 0 (0.0%) |
| $35,000 to $39,999 | 0 (0.0%) | 0 (0.0%) |
| $40,000 to $44,999 | 44 (9.6%) | 50 (21.1%) |
| $45,000 to $49,999 | 0 (0.0%) | 0 (0.0%) |
| $50,000 to $54,999 | 9 (2.0%) | 0 (0.0%) |
| $55,000 to $64,999 | 0 (0.0%) | 18 (7.6%) |
| $65,000 to $74,999 | 15 (3.3%) | 0 (0.0%) |
| $75,000 to $99,999 | 60 (13.0%) | 0 (0.0%) |
| $100,000+ | 213 (46.3%) | 44 (18.6%) |
| Total | 460 (100.0%) | 237 (100.0%) |
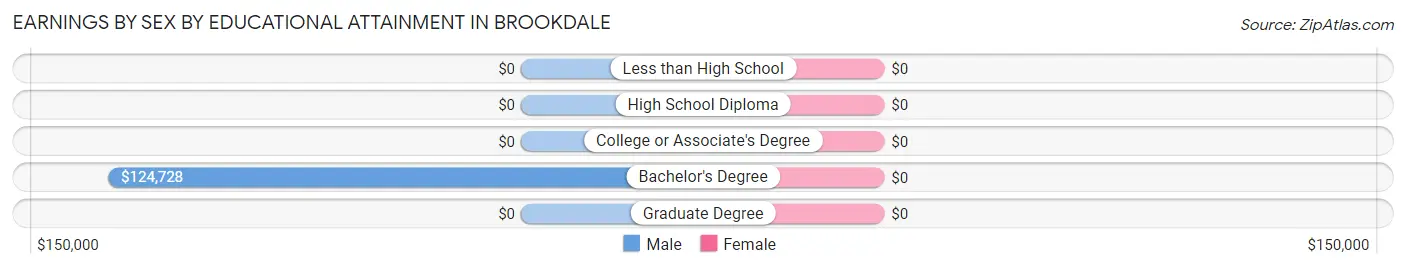
Earnings by Sex by Educational Attainment in Brookdale
| Educational Attainment | Male Income | Female Income |
| Less than High School | - | - |
| High School Diploma | - | - |
| College or Associate's Degree | - | - |
| Bachelor's Degree | $124,728 | $0 |
| Graduate Degree | - | - |
| Total | $116,618 | $41,985 |
Family Income in Brookdale
Family Income Brackets in Brookdale
According to the Brookdale family income data, there are 86 families falling into the $200,000+ income range, which is the most common income bracket and makes up 43.4% of all families.
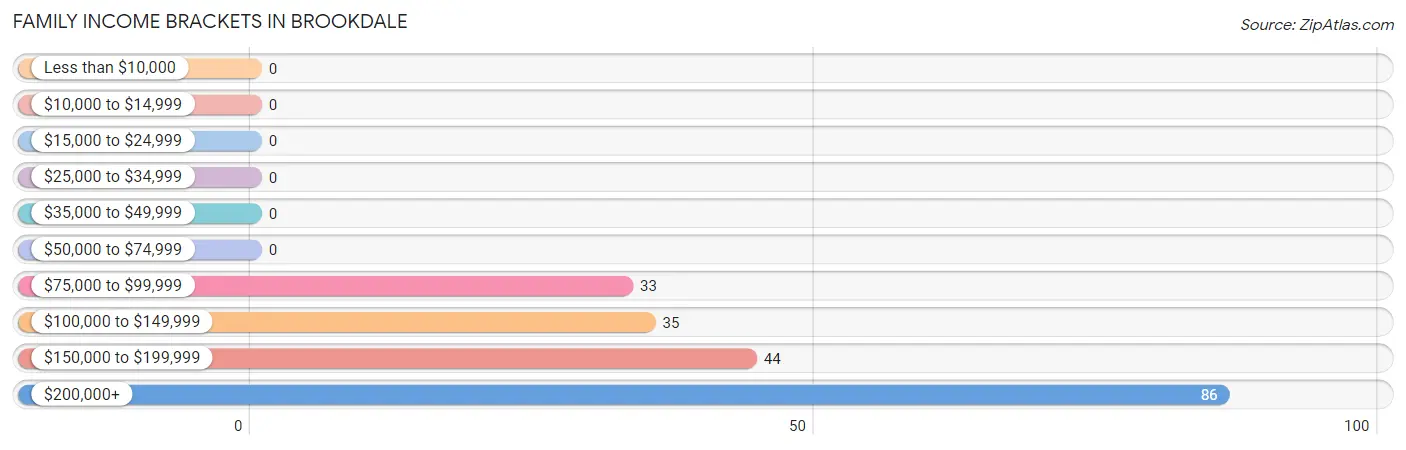
| Income Bracket | # Families | % Families |
| Less than $10,000 | 0 | 0.0% |
| $10,000 to $14,999 | 0 | 0.0% |
| $15,000 to $24,999 | 0 | 0.0% |
| $25,000 to $34,999 | 0 | 0.0% |
| $35,000 to $49,999 | 0 | 0.0% |
| $50,000 to $74,999 | 0 | 0.0% |
| $75,000 to $99,999 | 33 | 16.7% |
| $100,000 to $149,999 | 35 | 17.7% |
| $150,000 to $199,999 | 44 | 22.2% |
| $200,000+ | 86 | 43.4% |
Family Income by Famaliy Size in Brookdale
2-person families (111 | 56.1%) account for the highest median family income in Brookdale with $159,205 per family, while 2-person families (111 | 56.1%) have the highest median income of $79,602 per family member.
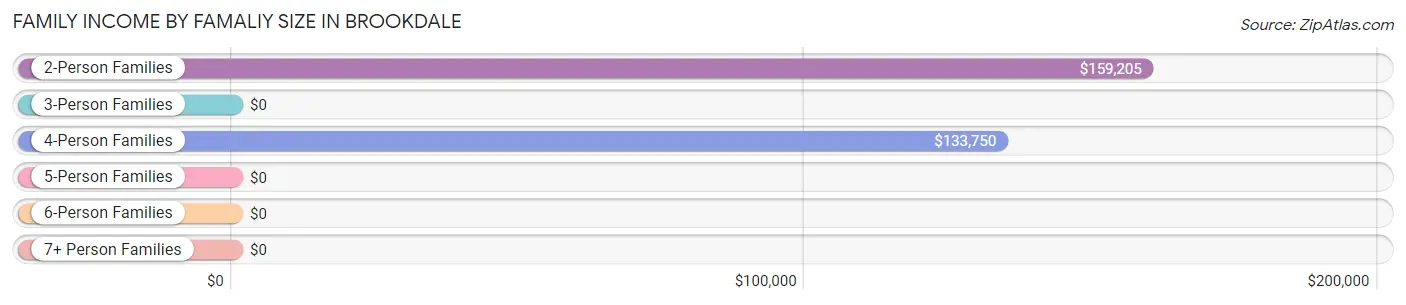
| Income Bracket | # Families | Median Income |
| 2-Person Families | 111 (56.1%) | $159,205 |
| 3-Person Families | 34 (17.2%) | $0 |
| 4-Person Families | 46 (23.2%) | $133,750 |
| 5-Person Families | 0 (0.0%) | $0 |
| 6-Person Families | 0 (0.0%) | $0 |
| 7+ Person Families | 7 (3.5%) | $0 |
| Total | 198 (100.0%) | $159,848 |
Family Income by Number of Earners in Brookdale
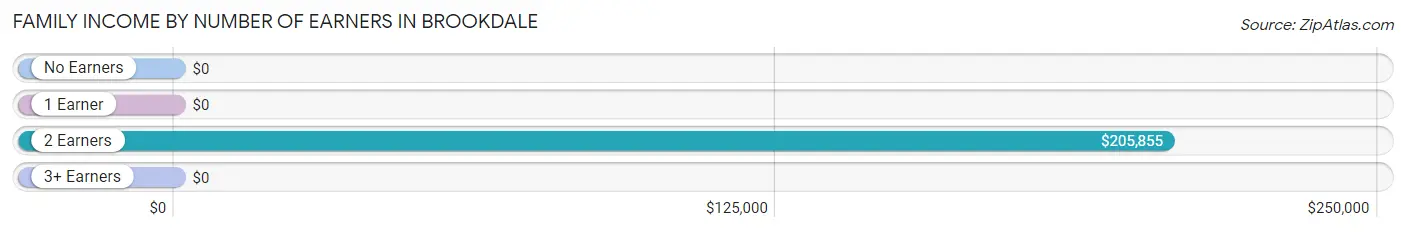
| Number of Earners | # Families | Median Income |
| No Earners | 0 (0.0%) | $0 |
| 1 Earner | 39 (19.7%) | $0 |
| 2 Earners | 159 (80.3%) | $205,855 |
| 3+ Earners | 0 (0.0%) | $0 |
| Total | 198 (100.0%) | $159,848 |
Household Income in Brookdale
Household Income Brackets in Brookdale
With 164 households falling in the category, the $200,000+ income range is the most frequent in Brookdale, accounting for 27.1% of all households.
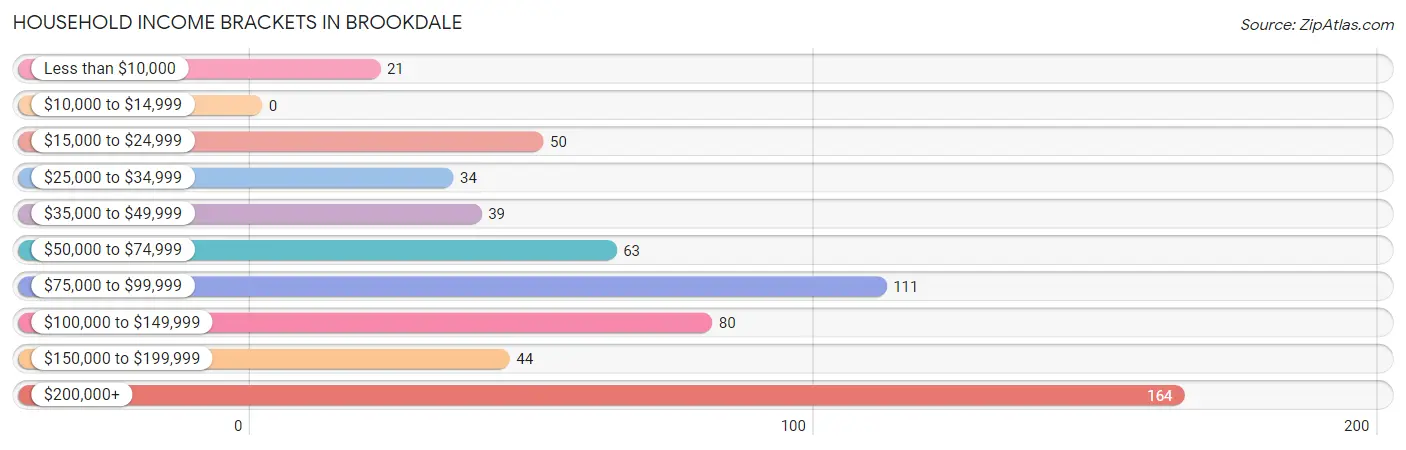
| Income Bracket | # Households | % Households |
| Less than $10,000 | 21 | 3.5% |
| $10,000 to $14,999 | 0 | 0.0% |
| $15,000 to $24,999 | 50 | 8.3% |
| $25,000 to $34,999 | 34 | 5.6% |
| $35,000 to $49,999 | 39 | 6.4% |
| $50,000 to $74,999 | 63 | 10.4% |
| $75,000 to $99,999 | 111 | 18.3% |
| $100,000 to $149,999 | 80 | 13.2% |
| $150,000 to $199,999 | 44 | 7.3% |
| $200,000+ | 164 | 27.1% |
Household Income by Householder Age in Brookdale
The median household income in Brookdale is $85,294, with the highest median household income of $206,645 found in the 45 to 64 years age bracket for the primary householder. A total of 289 households (47.7%) fall into this category. Meanwhile, the 15 to 24 years age bracket for the primary householder has the lowest median household income of $0, with 78 households (12.9%) in this group.
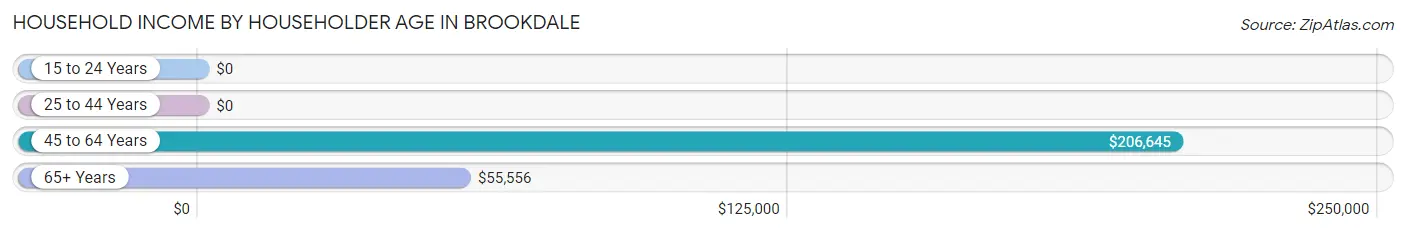
| Income Bracket | # Households | Median Income |
| 15 to 24 Years | 78 (12.9%) | $0 |
| 25 to 44 Years | 83 (13.7%) | $0 |
| 45 to 64 Years | 289 (47.7%) | $206,645 |
| 65+ Years | 156 (25.7%) | $55,556 |
| Total | 606 (100.0%) | $85,294 |
Poverty in Brookdale
Income Below Poverty by Sex and Age in Brookdale
With 16.4% poverty level for males and 7.7% for females among the residents of Brookdale, 18 to 24 year old males and 55 to 64 year old females are the most vulnerable to poverty, with 78 males (100.0%) and 21 females (46.7%) in their respective age groups living below the poverty level.
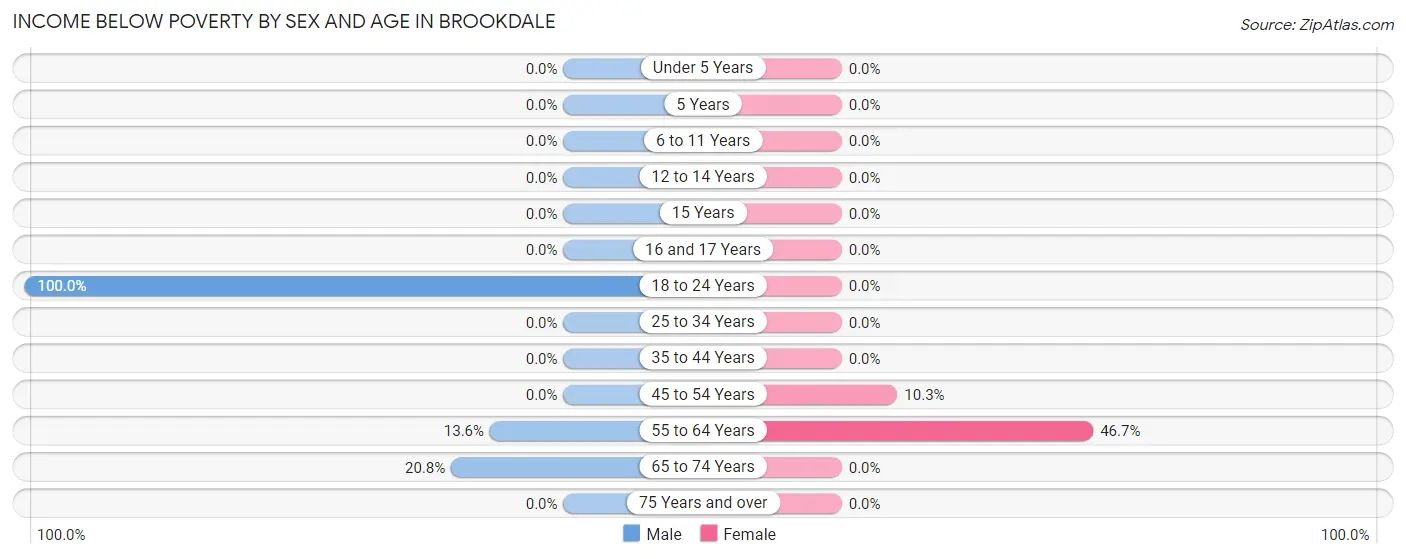
| Age Bracket | Male | Female |
| Under 5 Years | 0 (0.0%) | 0 (0.0%) |
| 5 Years | 0 (0.0%) | 0 (0.0%) |
| 6 to 11 Years | 0 (0.0%) | 0 (0.0%) |
| 12 to 14 Years | 0 (0.0%) | 0 (0.0%) |
| 15 Years | 0 (0.0%) | 0 (0.0%) |
| 16 and 17 Years | 0 (0.0%) | 0 (0.0%) |
| 18 to 24 Years | 78 (100.0%) | 0 (0.0%) |
| 25 to 34 Years | 0 (0.0%) | 0 (0.0%) |
| 35 to 44 Years | 0 (0.0%) | 0 (0.0%) |
| 45 to 54 Years | 0 (0.0%) | 16 (10.3%) |
| 55 to 64 Years | 18 (13.6%) | 21 (46.7%) |
| 65 to 74 Years | 10 (20.8%) | 0 (0.0%) |
| 75 Years and over | 0 (0.0%) | 0 (0.0%) |
| Total | 106 (16.4%) | 37 (7.7%) |
Income Above Poverty by Sex and Age in Brookdale
According to the poverty statistics in Brookdale, males aged under 5 years and females aged under 5 years are the age groups that are most secure financially, with 100.0% of males and 100.0% of females in these age groups living above the poverty line.
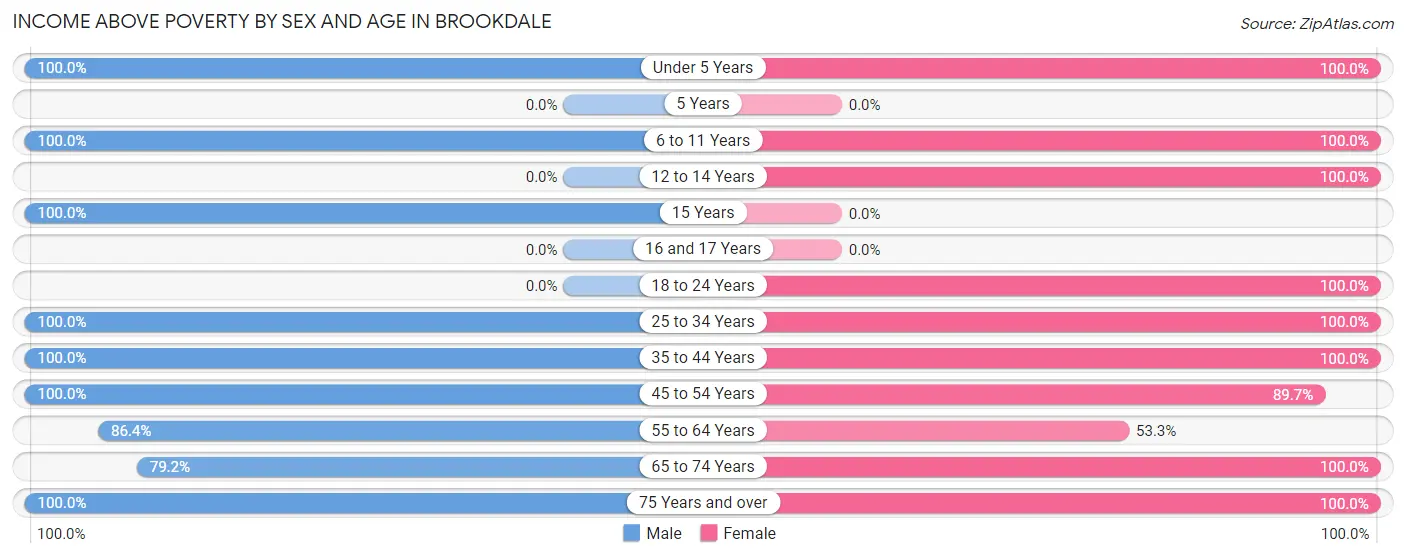
| Age Bracket | Male | Female |
| Under 5 Years | 24 (100.0%) | 14 (100.0%) |
| 5 Years | 0 (0.0%) | 0 (0.0%) |
| 6 to 11 Years | 20 (100.0%) | 37 (100.0%) |
| 12 to 14 Years | 0 (0.0%) | 8 (100.0%) |
| 15 Years | 10 (100.0%) | 0 (0.0%) |
| 16 and 17 Years | 0 (0.0%) | 0 (0.0%) |
| 18 to 24 Years | 0 (0.0%) | 40 (100.0%) |
| 25 to 34 Years | 38 (100.0%) | 22 (100.0%) |
| 35 to 44 Years | 123 (100.0%) | 18 (100.0%) |
| 45 to 54 Years | 135 (100.0%) | 139 (89.7%) |
| 55 to 64 Years | 114 (86.4%) | 24 (53.3%) |
| 65 to 74 Years | 38 (79.2%) | 127 (100.0%) |
| 75 Years and over | 38 (100.0%) | 16 (100.0%) |
| Total | 540 (83.6%) | 445 (92.3%) |
Income Below Poverty Among Married-Couple Families in Brookdale
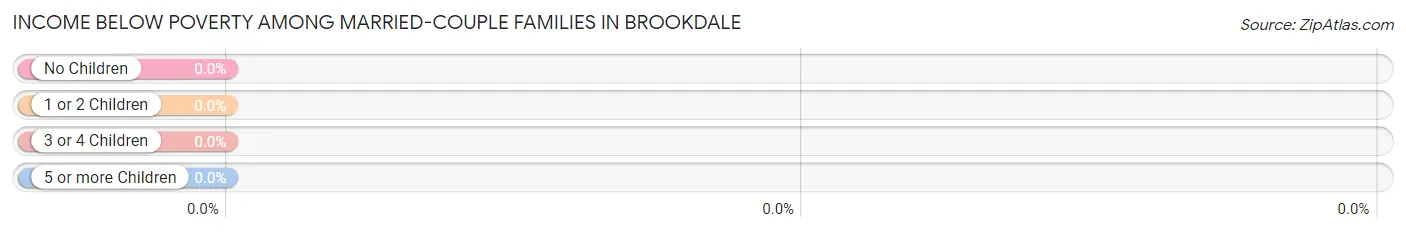
| Children | Above Poverty | Below Poverty |
| No Children | 129 (100.0%) | 0 (0.0%) |
| 1 or 2 Children | 46 (100.0%) | 0 (0.0%) |
| 3 or 4 Children | 7 (100.0%) | 0 (0.0%) |
| 5 or more Children | 0 (0.0%) | 0 (0.0%) |
| Total | 182 (100.0%) | 0 (0.0%) |
Income Below Poverty Among Single-Parent Households in Brookdale
| Children | Single Father | Single Mother |
| No Children | 0 (0.0%) | 0 (0.0%) |
| 1 or 2 Children | 0 (0.0%) | 0 (0.0%) |
| 3 or 4 Children | 0 (0.0%) | 0 (0.0%) |
| 5 or more Children | 0 (0.0%) | 0 (0.0%) |
| Total | 0 (0.0%) | 0 (0.0%) |
Income Below Poverty Among Married-Couple vs Single-Parent Households in Brookdale
| Children | Married-Couple Families | Single-Parent Households |
| No Children | 0 (0.0%) | 0 (0.0%) |
| 1 or 2 Children | 0 (0.0%) | 0 (0.0%) |
| 3 or 4 Children | 0 (0.0%) | 0 (0.0%) |
| 5 or more Children | 0 (0.0%) | 0 (0.0%) |
| Total | 0 (0.0%) | 0 (0.0%) |
Race in Brookdale
The most populous races in Brookdale are White / Caucasian (940 | 83.3%), Two or more Races (122 | 10.8%), and Hispanic or Latino (78 | 6.9%).
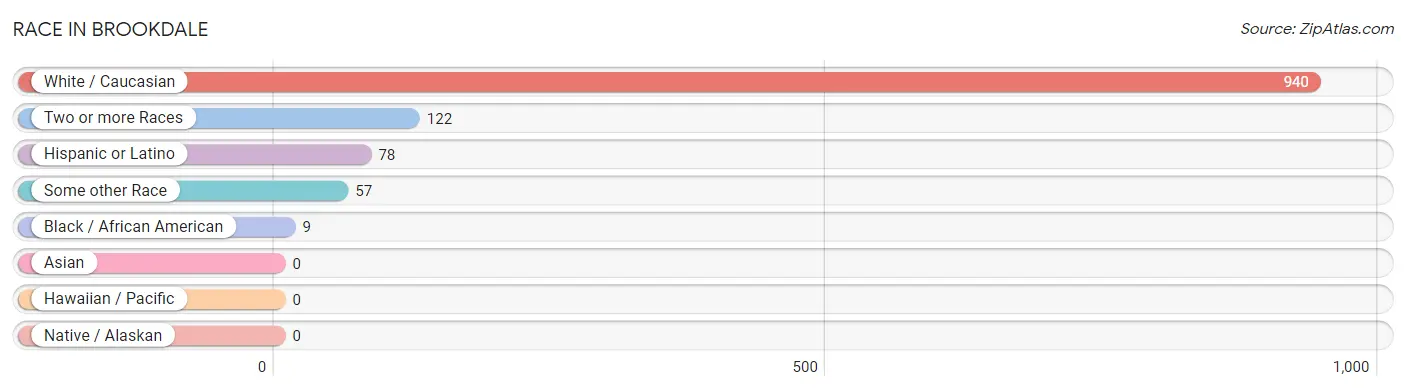
| Race | # Population | % Population |
| Asian | 0 | 0.0% |
| Black / African American | 9 | 0.8% |
| Hawaiian / Pacific | 0 | 0.0% |
| Hispanic or Latino | 78 | 6.9% |
| Native / Alaskan | 0 | 0.0% |
| White / Caucasian | 940 | 83.3% |
| Two or more Races | 122 | 10.8% |
| Some other Race | 57 | 5.1% |
| Total | 1,128 | 100.0% |
Ancestry in Brookdale
The most populous ancestries reported in Brookdale are English (303 | 26.9%), Irish (233 | 20.7%), Italian (82 | 7.3%), Swedish (81 | 7.2%), and German (80 | 7.1%), together accounting for 69.1% of all Brookdale residents.
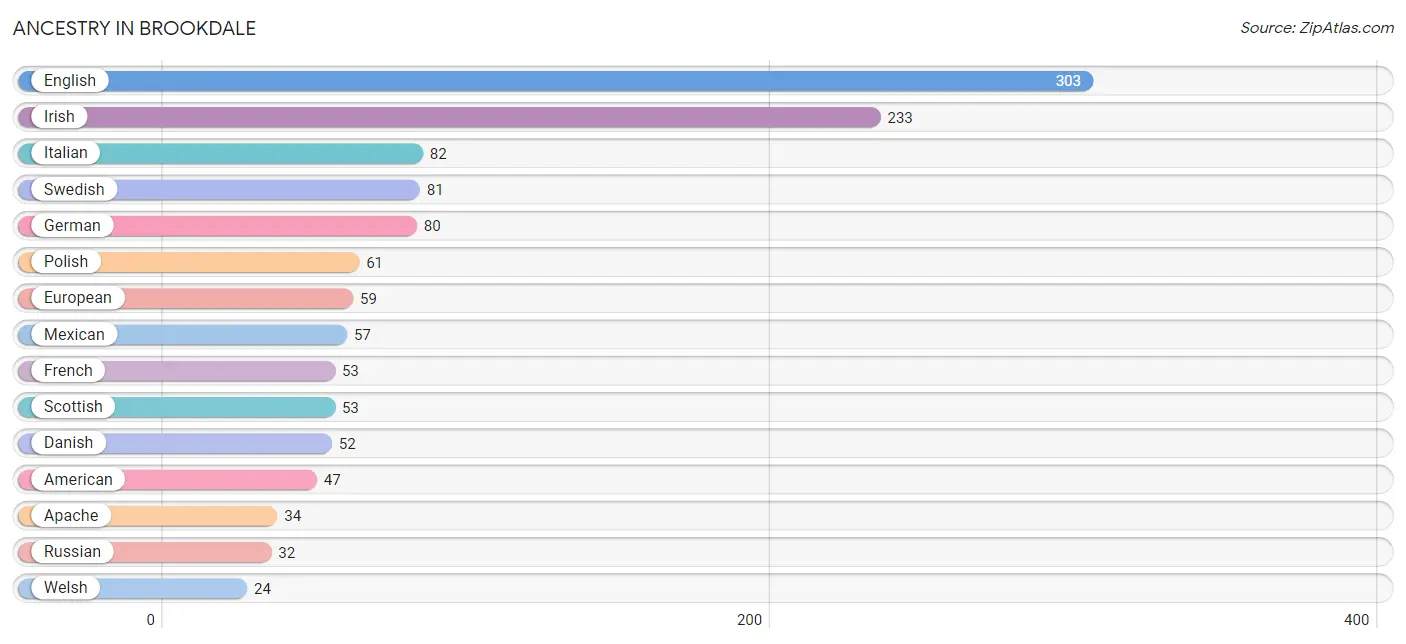
| Ancestry | # Population | % Population |
| American | 47 | 4.2% |
| Apache | 34 | 3.0% |
| Comanche | 16 | 1.4% |
| Czechoslovakian | 14 | 1.2% |
| Danish | 52 | 4.6% |
| Eastern European | 8 | 0.7% |
| English | 303 | 26.9% |
| European | 59 | 5.2% |
| French | 53 | 4.7% |
| German | 80 | 7.1% |
| Irish | 233 | 20.7% |
| Italian | 82 | 7.3% |
| Lithuanian | 12 | 1.1% |
| Mexican | 57 | 5.1% |
| Northern European | 7 | 0.6% |
| Norwegian | 18 | 1.6% |
| Polish | 61 | 5.4% |
| Russian | 32 | 2.8% |
| Scotch-Irish | 10 | 0.9% |
| Scottish | 53 | 4.7% |
| Spaniard | 21 | 1.9% |
| Swedish | 81 | 7.2% |
| Ukrainian | 12 | 1.1% |
| Welsh | 24 | 2.1% | View All 24 Rows |
Immigrants in Brookdale

| Immigration Origin | # Population | % Population | View All 0 Rows |
Sex and Age in Brookdale
Sex and Age in Brookdale
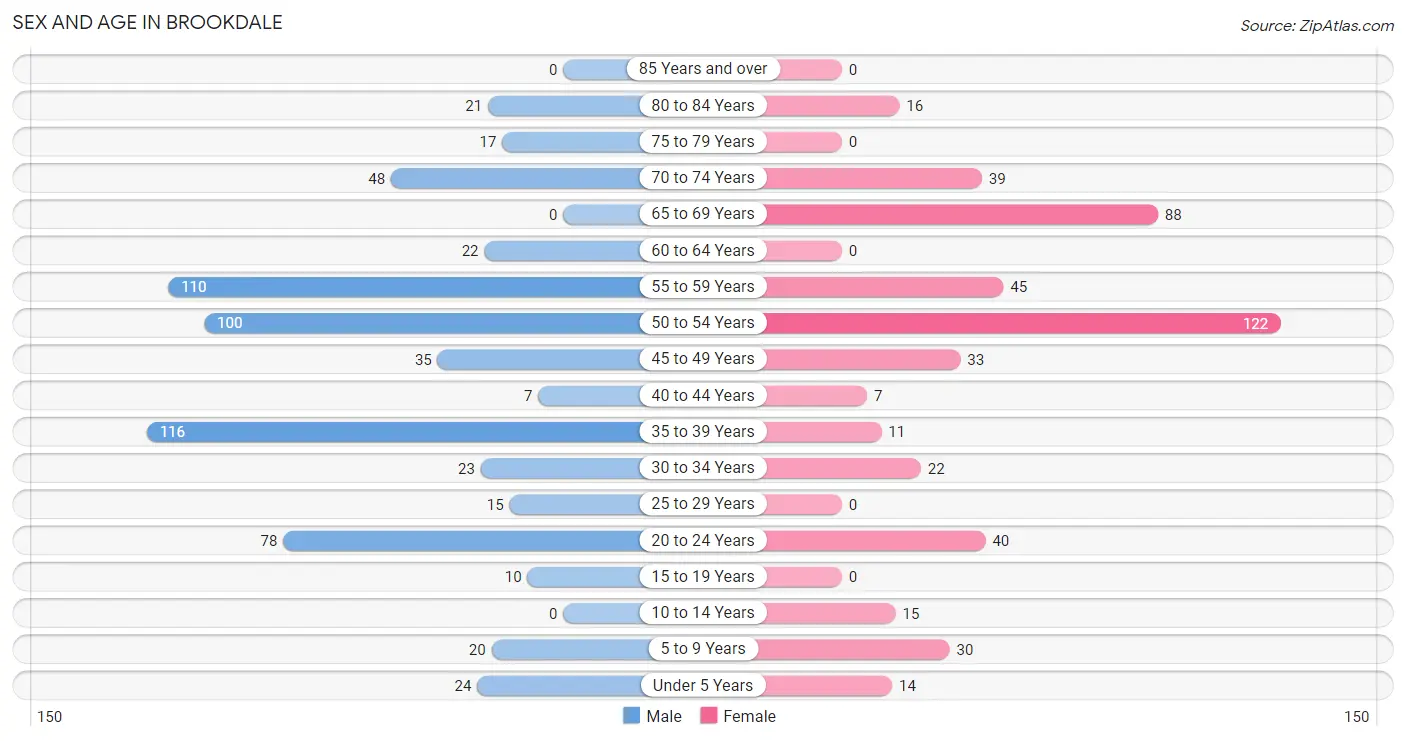
The most populous age groups in Brookdale are 35 to 39 Years (116 | 18.0%) for men and 50 to 54 Years (122 | 25.3%) for women.
| Age Bracket | Male | Female |
| Under 5 Years | 24 (3.7%) | 14 (2.9%) |
| 5 to 9 Years | 20 (3.1%) | 30 (6.2%) |
| 10 to 14 Years | 0 (0.0%) | 15 (3.1%) |
| 15 to 19 Years | 10 (1.5%) | 0 (0.0%) |
| 20 to 24 Years | 78 (12.1%) | 40 (8.3%) |
| 25 to 29 Years | 15 (2.3%) | 0 (0.0%) |
| 30 to 34 Years | 23 (3.6%) | 22 (4.6%) |
| 35 to 39 Years | 116 (18.0%) | 11 (2.3%) |
| 40 to 44 Years | 7 (1.1%) | 7 (1.5%) |
| 45 to 49 Years | 35 (5.4%) | 33 (6.9%) |
| 50 to 54 Years | 100 (15.5%) | 122 (25.3%) |
| 55 to 59 Years | 110 (17.0%) | 45 (9.3%) |
| 60 to 64 Years | 22 (3.4%) | 0 (0.0%) |
| 65 to 69 Years | 0 (0.0%) | 88 (18.3%) |
| 70 to 74 Years | 48 (7.4%) | 39 (8.1%) |
| 75 to 79 Years | 17 (2.6%) | 0 (0.0%) |
| 80 to 84 Years | 21 (3.3%) | 16 (3.3%) |
| 85 Years and over | 0 (0.0%) | 0 (0.0%) |
| Total | 646 (100.0%) | 482 (100.0%) |
Families and Households in Brookdale
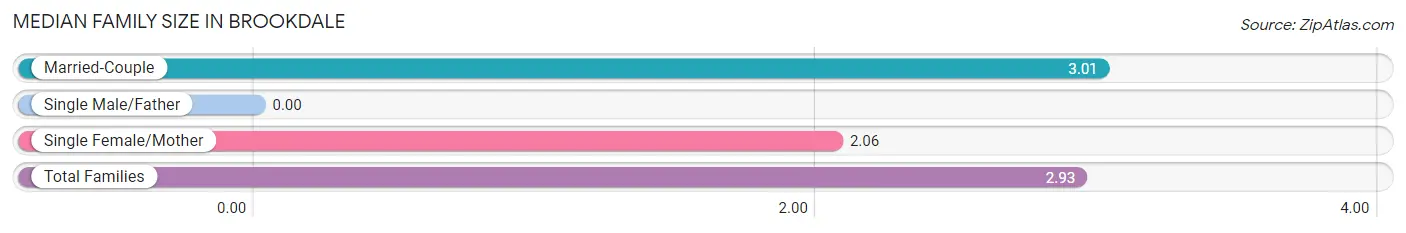
Median Family Size in Brookdale
| Family Type | # Families | Family Size |
| Married-Couple | 182 (91.9%) | 3.01 |
| Single Male/Father | 0 (0.0%) | - |
| Single Female/Mother | 16 (8.1%) | 2.06 |
| Total Families | 198 (100.0%) | 2.93 |
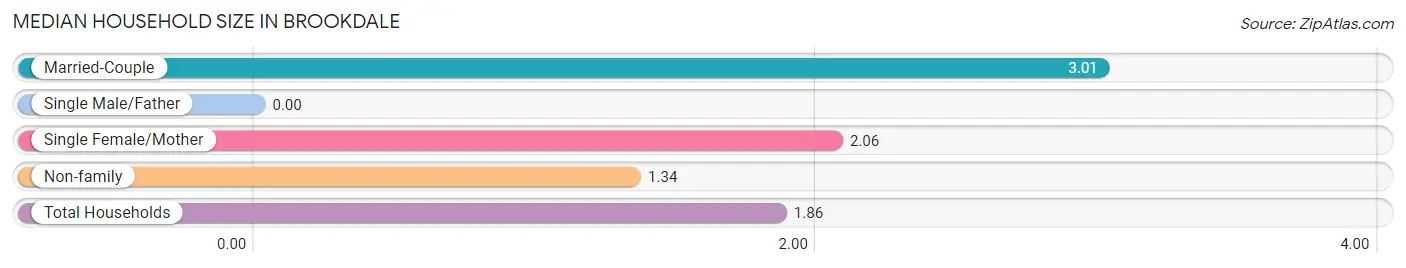
Median Household Size in Brookdale
| Household Type | # Households | Household Size |
| Married-Couple | 182 (30.0%) | 3.01 |
| Single Male/Father | 0 (0.0%) | - |
| Single Female/Mother | 16 (2.6%) | 2.06 |
| Non-family | 408 (67.3%) | 1.34 |
| Total Households | 606 (100.0%) | 1.86 |
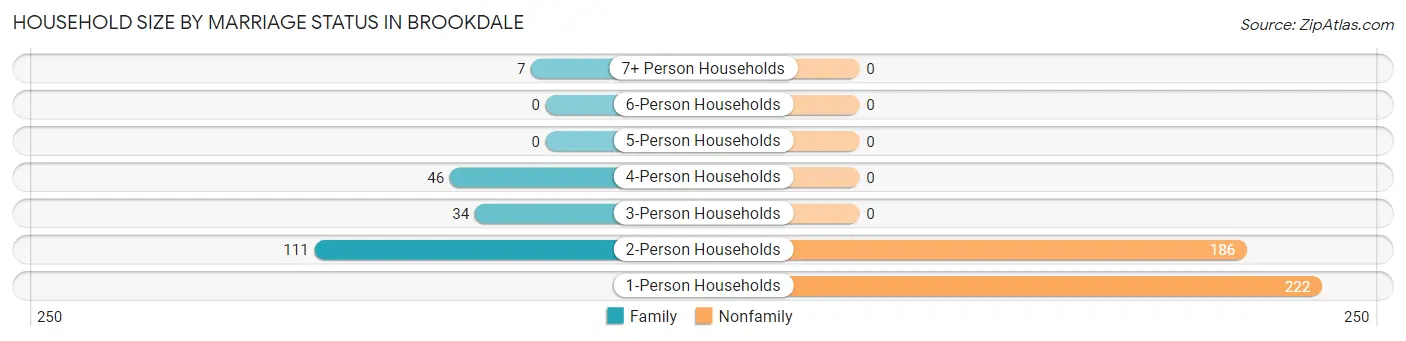
Household Size by Marriage Status in Brookdale
Out of a total of 606 households in Brookdale, 198 (32.7%) are family households, while 408 (67.3%) are nonfamily households. The most numerous type of family households are 2-person households, comprising 111, and the most common type of nonfamily households are 1-person households, comprising 222.
| Household Size | Family Households | Nonfamily Households |
| 1-Person Households | - | 222 (36.6%) |
| 2-Person Households | 111 (18.3%) | 186 (30.7%) |
| 3-Person Households | 34 (5.6%) | 0 (0.0%) |
| 4-Person Households | 46 (7.6%) | 0 (0.0%) |
| 5-Person Households | 0 (0.0%) | 0 (0.0%) |
| 6-Person Households | 0 (0.0%) | 0 (0.0%) |
| 7+ Person Households | 7 (1.2%) | 0 (0.0%) |
| Total | 198 (32.7%) | 408 (67.3%) |
Female Fertility in Brookdale
Fertility by Age in Brookdale
Average fertility rate in Brookdale is 149.0 births per 1,000 women. Women in the age bracket of 20 to 34 years have the highest fertility rate with 355.0 births per 1,000 women. Women in the age bracket of 20 to 34 years acount for 100.0% of all women with births.
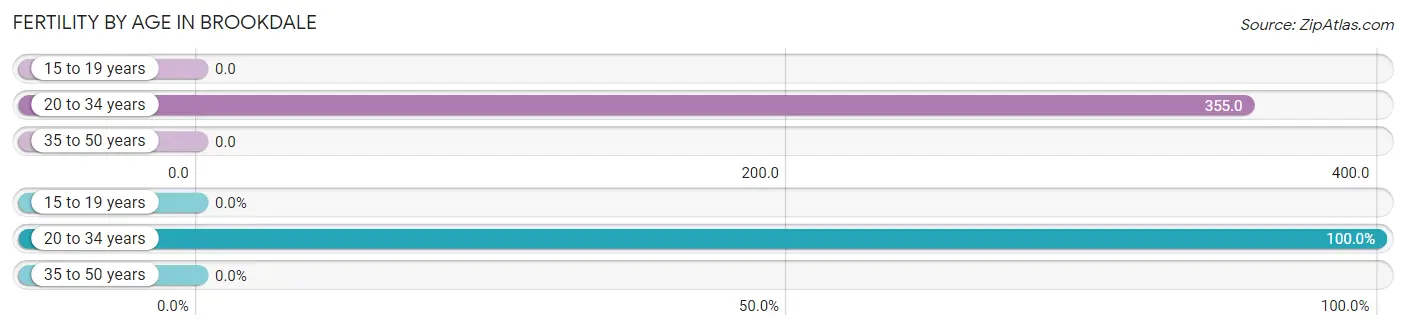
| Age Bracket | Women with Births | Births / 1,000 Women |
| 15 to 19 years | 0 (0.0%) | 0.0 |
| 20 to 34 years | 22 (100.0%) | 355.0 |
| 35 to 50 years | 0 (0.0%) | 0.0 |
| Total | 22 (100.0%) | 149.0 |
Fertility by Age by Marriage Status in Brookdale
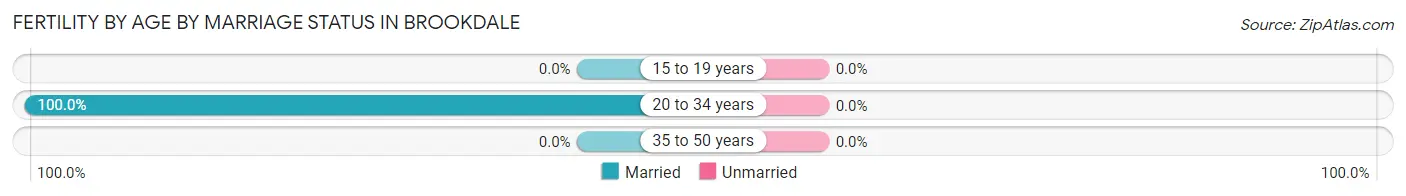
| Age Bracket | Married | Unmarried |
| 15 to 19 years | 0 (0.0%) | 0 (0.0%) |
| 20 to 34 years | 22 (100.0%) | 0 (0.0%) |
| 35 to 50 years | 0 (0.0%) | 0 (0.0%) |
| Total | 22 (100.0%) | 0 (0.0%) |
Fertility by Education in Brookdale
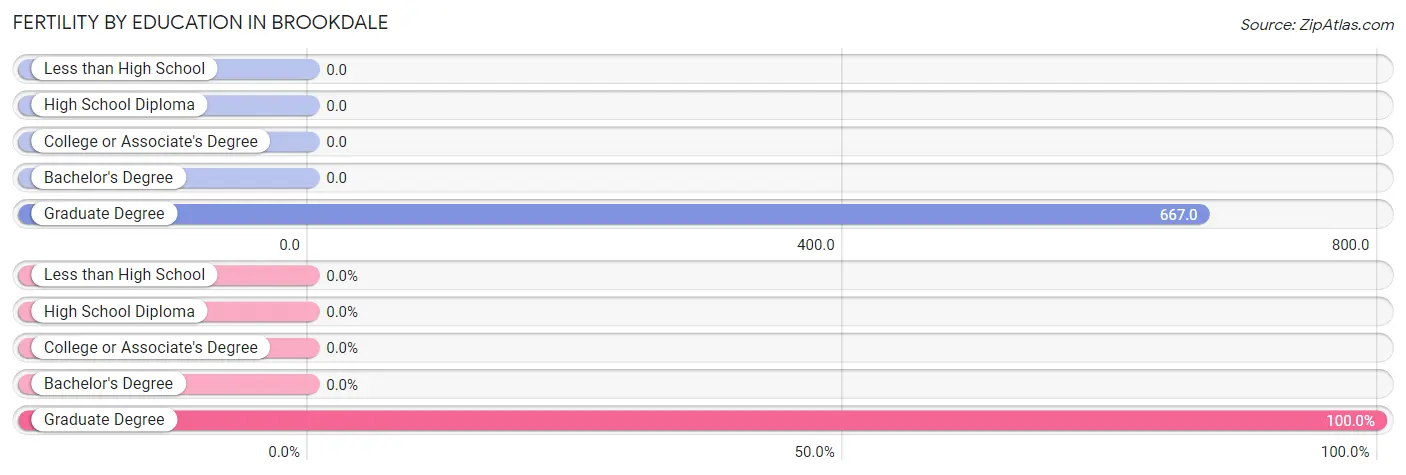
| Educational Attainment | Women with Births | Births / 1,000 Women |
| Less than High School | 0 (0.0%) | 0.0 |
| High School Diploma | 0 (0.0%) | 0.0 |
| College or Associate's Degree | 0 (0.0%) | 0.0 |
| Bachelor's Degree | 0 (0.0%) | 0.0 |
| Graduate Degree | 22 (100.0%) | 667.0 |
| Total | 22 (100.0%) | 149.0 |
Fertility by Education by Marriage Status in Brookdale
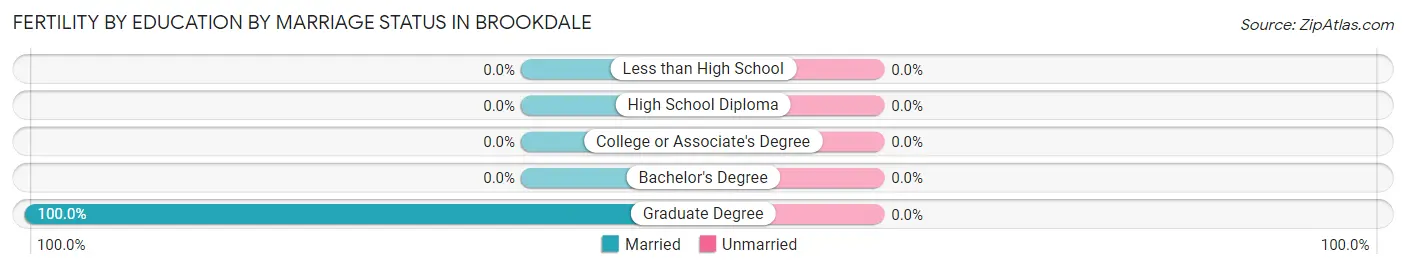
| Educational Attainment | Married | Unmarried |
| Less than High School | 0 (0.0%) | 0 (0.0%) |
| High School Diploma | 0 (0.0%) | 0 (0.0%) |
| College or Associate's Degree | 0 (0.0%) | 0 (0.0%) |
| Bachelor's Degree | 0 (0.0%) | 0 (0.0%) |
| Graduate Degree | 22 (100.0%) | 0 (0.0%) |
| Total | 22 (100.0%) | 0 (0.0%) |
Employment Characteristics in Brookdale
Employment by Class of Employer in Brookdale
Among the 676 employed individuals in Brookdale, private company employees (317 | 46.9%), local government employees (106 | 15.7%), and not-for-profit organizations (100 | 14.8%) make up the most common classes of employment.
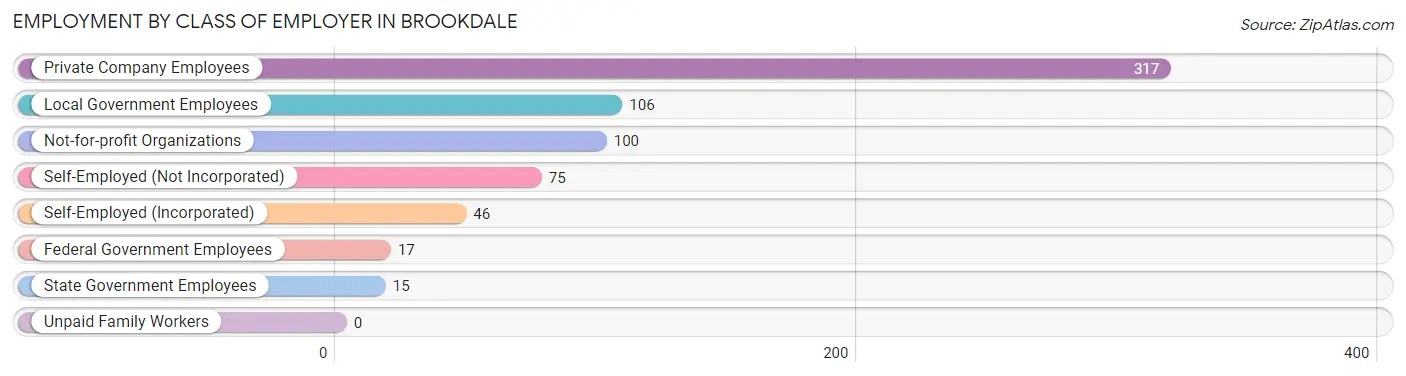
| Employer Class | # Employees | % Employees |
| Private Company Employees | 317 | 46.9% |
| Self-Employed (Incorporated) | 46 | 6.8% |
| Self-Employed (Not Incorporated) | 75 | 11.1% |
| Not-for-profit Organizations | 100 | 14.8% |
| Local Government Employees | 106 | 15.7% |
| State Government Employees | 15 | 2.2% |
| Federal Government Employees | 17 | 2.5% |
| Unpaid Family Workers | 0 | 0.0% |
| Total | 676 | 100.0% |
Employment Status by Age in Brookdale
According to the labor force statistics for Brookdale, out of the total population over 16 years of age (1,015), 69.0% or 700 individuals are in the labor force, with 3.4% or 24 of them unemployed. The age group with the highest labor force participation rate is 20 to 24 years, with 100.0% or 118 individuals in the labor force. Within the labor force, the 65 to 74 years age range has the highest percentage of unemployed individuals, with 14.0% or 12 of them being unemployed.
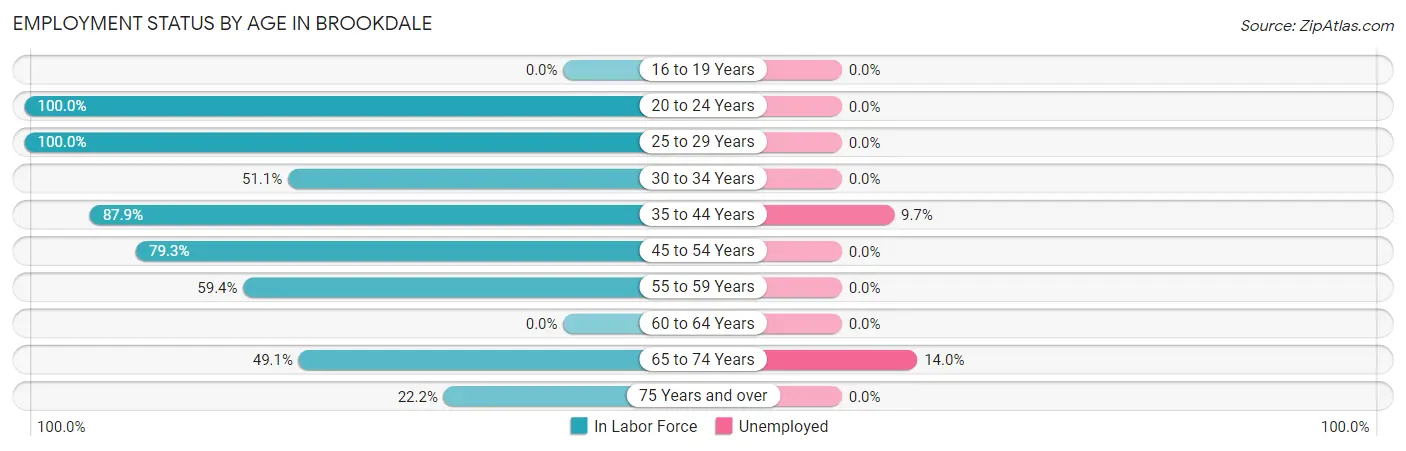
| Age Bracket | In Labor Force | Unemployed |
| 16 to 19 Years | 0 (0.0%) | 0 (0.0%) |
| 20 to 24 Years | 118 (100.0%) | 0 (0.0%) |
| 25 to 29 Years | 15 (100.0%) | 0 (0.0%) |
| 30 to 34 Years | 23 (51.1%) | 0 (0.0%) |
| 35 to 44 Years | 124 (87.9%) | 12 (9.7%) |
| 45 to 54 Years | 230 (79.3%) | 0 (0.0%) |
| 55 to 59 Years | 92 (59.4%) | 0 (0.0%) |
| 60 to 64 Years | 0 (0.0%) | 0 (0.0%) |
| 65 to 74 Years | 86 (49.1%) | 12 (14.0%) |
| 75 Years and over | 12 (22.2%) | 0 (0.0%) |
| Total | 700 (69.0%) | 24 (3.4%) |
Employment Status by Educational Attainment in Brookdale
According to labor force statistics for Brookdale, 72.5% of individuals (484) out of the total population between 25 and 64 years of age (668) are in the labor force, with 2.5% or 12 of them being unemployed. The group with the highest labor force participation rate are those with the educational attainment of less than high school, with 100.0% or 48 individuals in the labor force. Within the labor force, individuals with bachelor's degree or higher education have the highest percentage of unemployment, with 4.6% or 12 of them being unemployed.
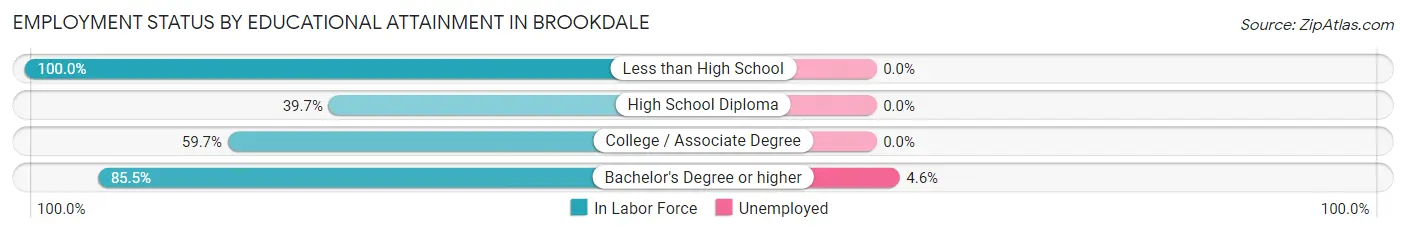
| Educational Attainment | In Labor Force | Unemployed |
| Less than High School | 48 (100.0%) | 0 (0.0%) |
| High School Diploma | 25 (39.7%) | 0 (0.0%) |
| College / Associate Degree | 151 (59.7%) | 0 (0.0%) |
| Bachelor's Degree or higher | 260 (85.5%) | 14 (4.6%) |
| Total | 484 (72.5%) | 17 (2.5%) |
Employment Occupations by Sex in Brookdale
Management, Business, Science and Arts Occupations
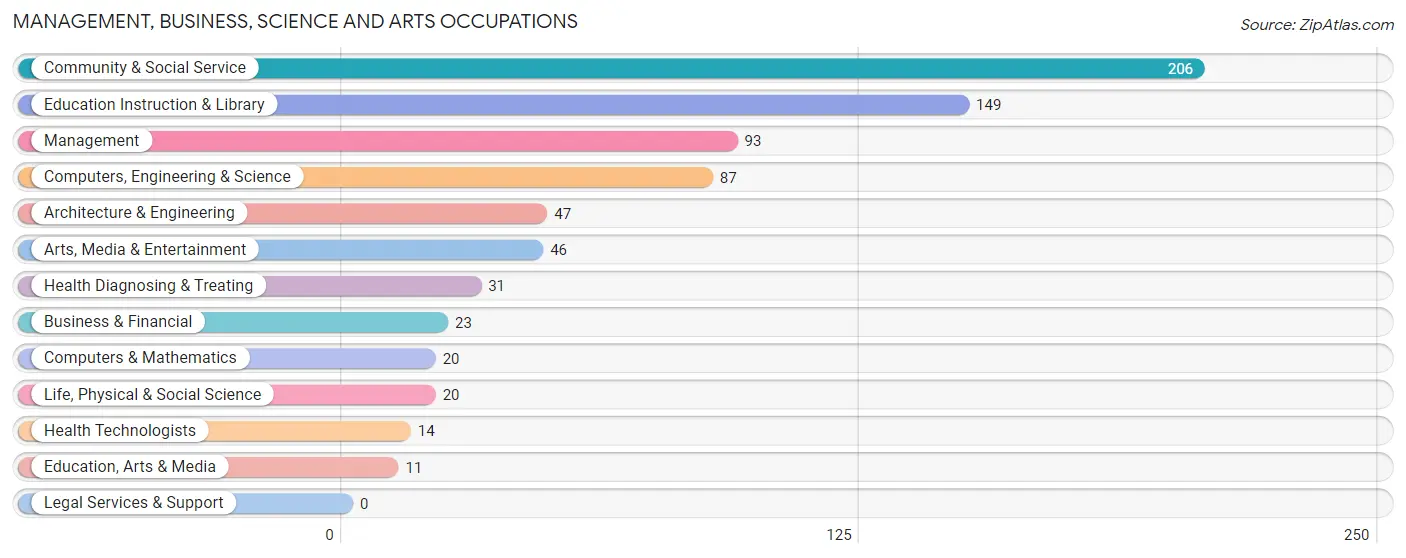
The most common Management, Business, Science and Arts occupations in Brookdale are Community & Social Service (206 | 30.5%), Education Instruction & Library (149 | 22.0%), Management (93 | 13.8%), Computers, Engineering & Science (87 | 12.9%), and Architecture & Engineering (47 | 7.0%).
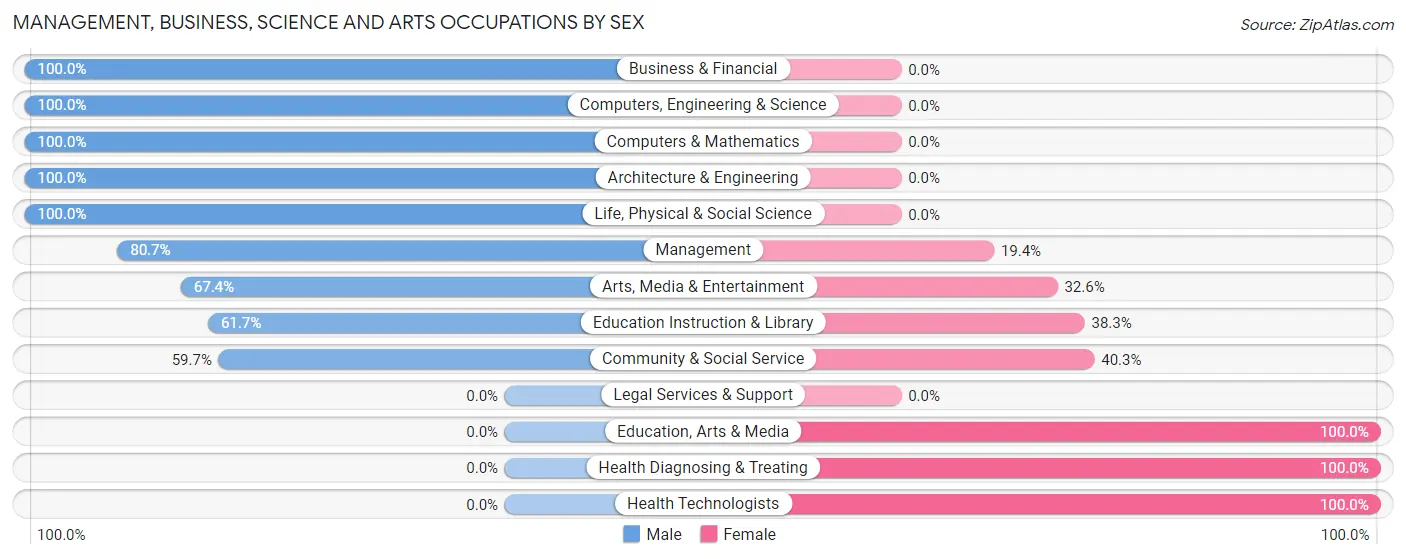
Management, Business, Science and Arts Occupations by Sex
Within the Management, Business, Science and Arts occupations in Brookdale, the most male-oriented occupations are Business & Financial (100.0%), Computers, Engineering & Science (100.0%), and Computers & Mathematics (100.0%), while the most female-oriented occupations are Education, Arts & Media (100.0%), Health Diagnosing & Treating (100.0%), and Health Technologists (100.0%).
| Occupation | Male | Female |
| Management | 75 (80.6%) | 18 (19.4%) |
| Business & Financial | 23 (100.0%) | 0 (0.0%) |
| Computers, Engineering & Science | 87 (100.0%) | 0 (0.0%) |
| Computers & Mathematics | 20 (100.0%) | 0 (0.0%) |
| Architecture & Engineering | 47 (100.0%) | 0 (0.0%) |
| Life, Physical & Social Science | 20 (100.0%) | 0 (0.0%) |
| Community & Social Service | 123 (59.7%) | 83 (40.3%) |
| Education, Arts & Media | 0 (0.0%) | 11 (100.0%) |
| Legal Services & Support | 0 (0.0%) | 0 (0.0%) |
| Education Instruction & Library | 92 (61.7%) | 57 (38.3%) |
| Arts, Media & Entertainment | 31 (67.4%) | 15 (32.6%) |
| Health Diagnosing & Treating | 0 (0.0%) | 31 (100.0%) |
| Health Technologists | 0 (0.0%) | 14 (100.0%) |
| Total (Category) | 308 (70.0%) | 132 (30.0%) |
| Total (Overall) | 439 (64.9%) | 237 (35.1%) |
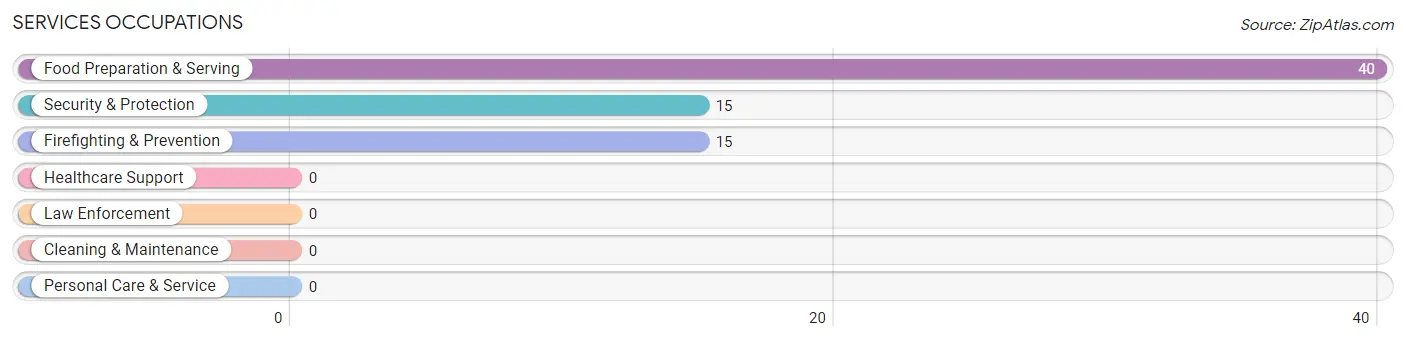
Services Occupations
The most common Services occupations in Brookdale are Food Preparation & Serving (40 | 5.9%), Security & Protection (15 | 2.2%), and Firefighting & Prevention (15 | 2.2%).
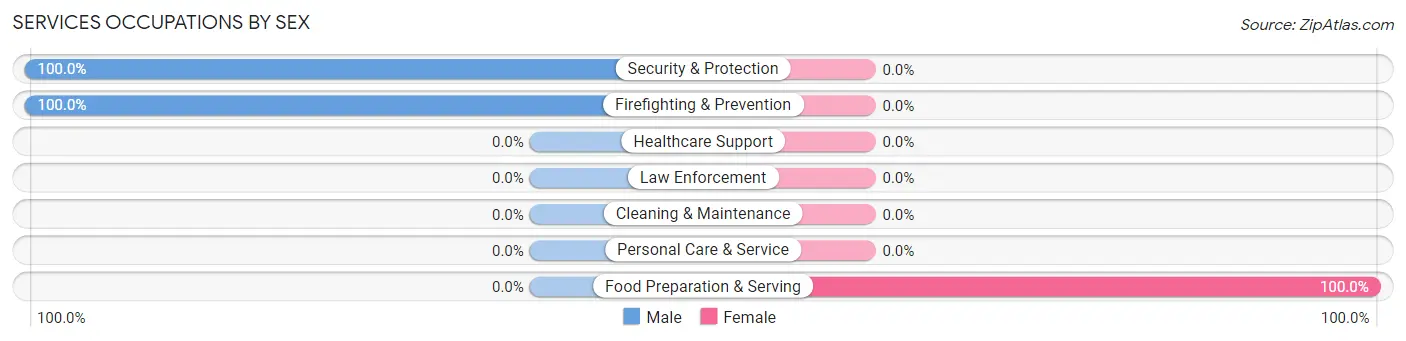
Services Occupations by Sex
| Occupation | Male | Female |
| Healthcare Support | 0 (0.0%) | 0 (0.0%) |
| Security & Protection | 15 (100.0%) | 0 (0.0%) |
| Firefighting & Prevention | 15 (100.0%) | 0 (0.0%) |
| Law Enforcement | 0 (0.0%) | 0 (0.0%) |
| Food Preparation & Serving | 0 (0.0%) | 40 (100.0%) |
| Cleaning & Maintenance | 0 (0.0%) | 0 (0.0%) |
| Personal Care & Service | 0 (0.0%) | 0 (0.0%) |
| Total (Category) | 15 (27.3%) | 40 (72.7%) |
| Total (Overall) | 439 (64.9%) | 237 (35.1%) |
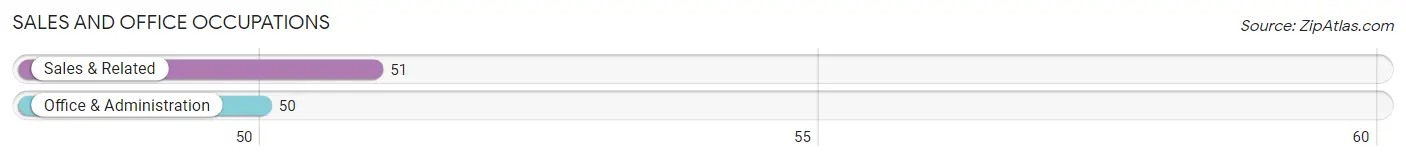
Sales and Office Occupations
The most common Sales and Office occupations in Brookdale are Sales & Related (51 | 7.5%), and Office & Administration (50 | 7.4%).
Sales and Office Occupations by Sex
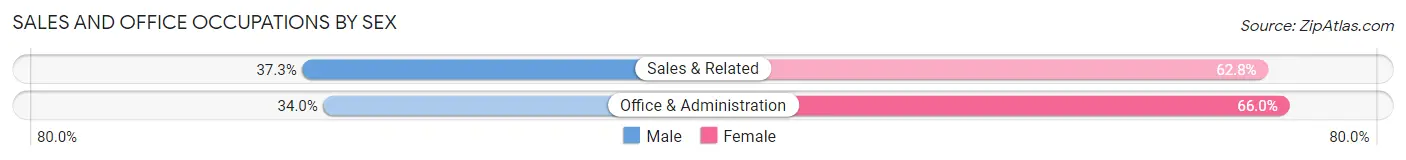
| Occupation | Male | Female |
| Sales & Related | 19 (37.2%) | 32 (62.7%) |
| Office & Administration | 17 (34.0%) | 33 (66.0%) |
| Total (Category) | 36 (35.6%) | 65 (64.4%) |
| Total (Overall) | 439 (64.9%) | 237 (35.1%) |
Natural Resources, Construction and Maintenance Occupations
The most common Natural Resources, Construction and Maintenance occupations in Brookdale are , and Installation, Maintenance & Repair (40 | 5.9%).
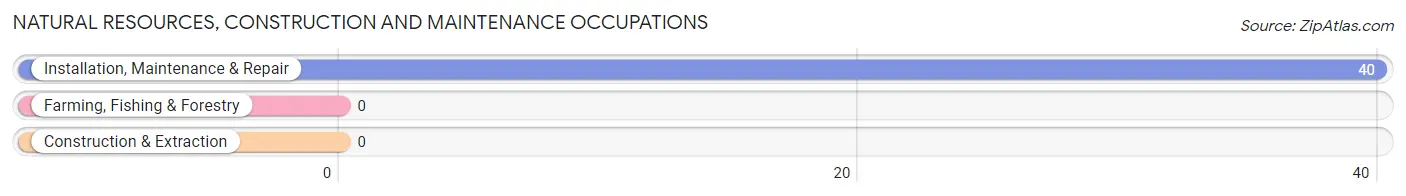
Natural Resources, Construction and Maintenance Occupations by Sex
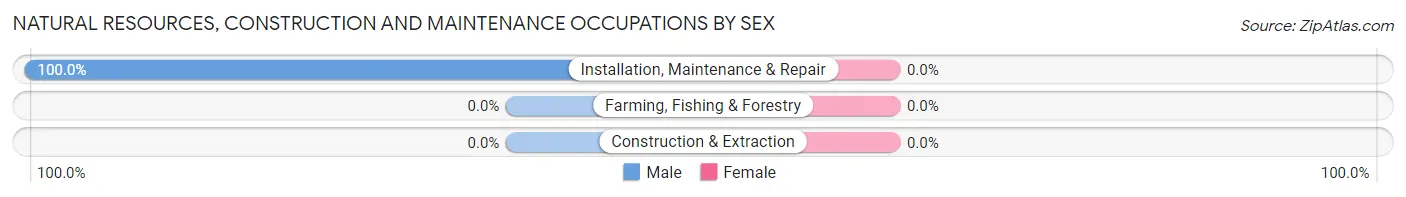
| Occupation | Male | Female |
| Farming, Fishing & Forestry | 0 (0.0%) | 0 (0.0%) |
| Construction & Extraction | 0 (0.0%) | 0 (0.0%) |
| Installation, Maintenance & Repair | 40 (100.0%) | 0 (0.0%) |
| Total (Category) | 40 (100.0%) | 0 (0.0%) |
| Total (Overall) | 439 (64.9%) | 237 (35.1%) |
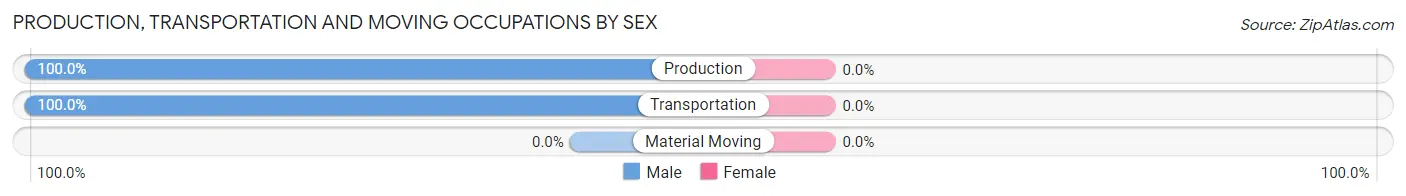
Production, Transportation and Moving Occupations
The most common Production, Transportation and Moving occupations in Brookdale are Production (25 | 3.7%), and Transportation (15 | 2.2%).
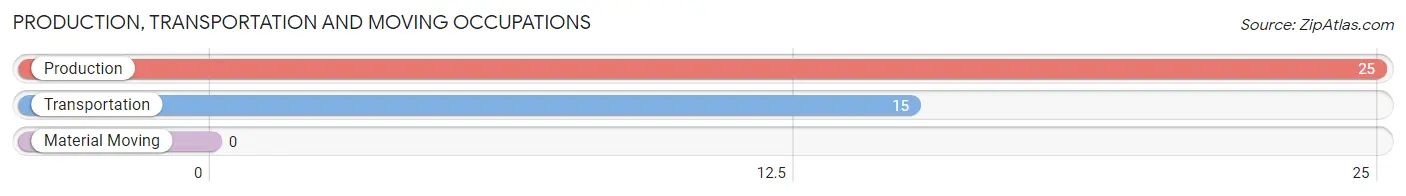
Production, Transportation and Moving Occupations by Sex
| Occupation | Male | Female |
| Production | 25 (100.0%) | 0 (0.0%) |
| Transportation | 15 (100.0%) | 0 (0.0%) |
| Material Moving | 0 (0.0%) | 0 (0.0%) |
| Total (Category) | 40 (100.0%) | 0 (0.0%) |
| Total (Overall) | 439 (64.9%) | 237 (35.1%) |
Employment Industries by Sex in Brookdale
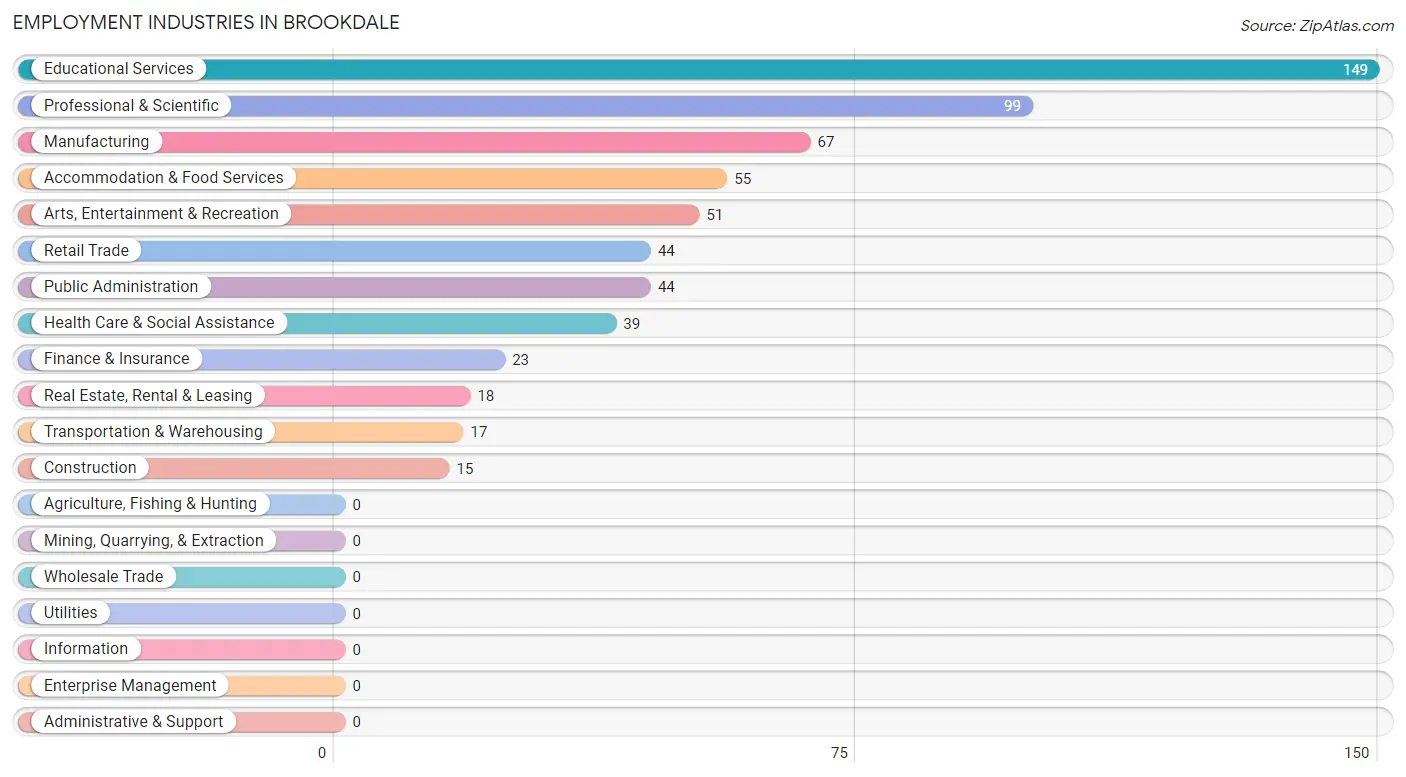
Employment Industries in Brookdale
The major employment industries in Brookdale include Educational Services (149 | 22.0%), Professional & Scientific (99 | 14.6%), Manufacturing (67 | 9.9%), Accommodation & Food Services (55 | 8.1%), and Arts, Entertainment & Recreation (51 | 7.5%).
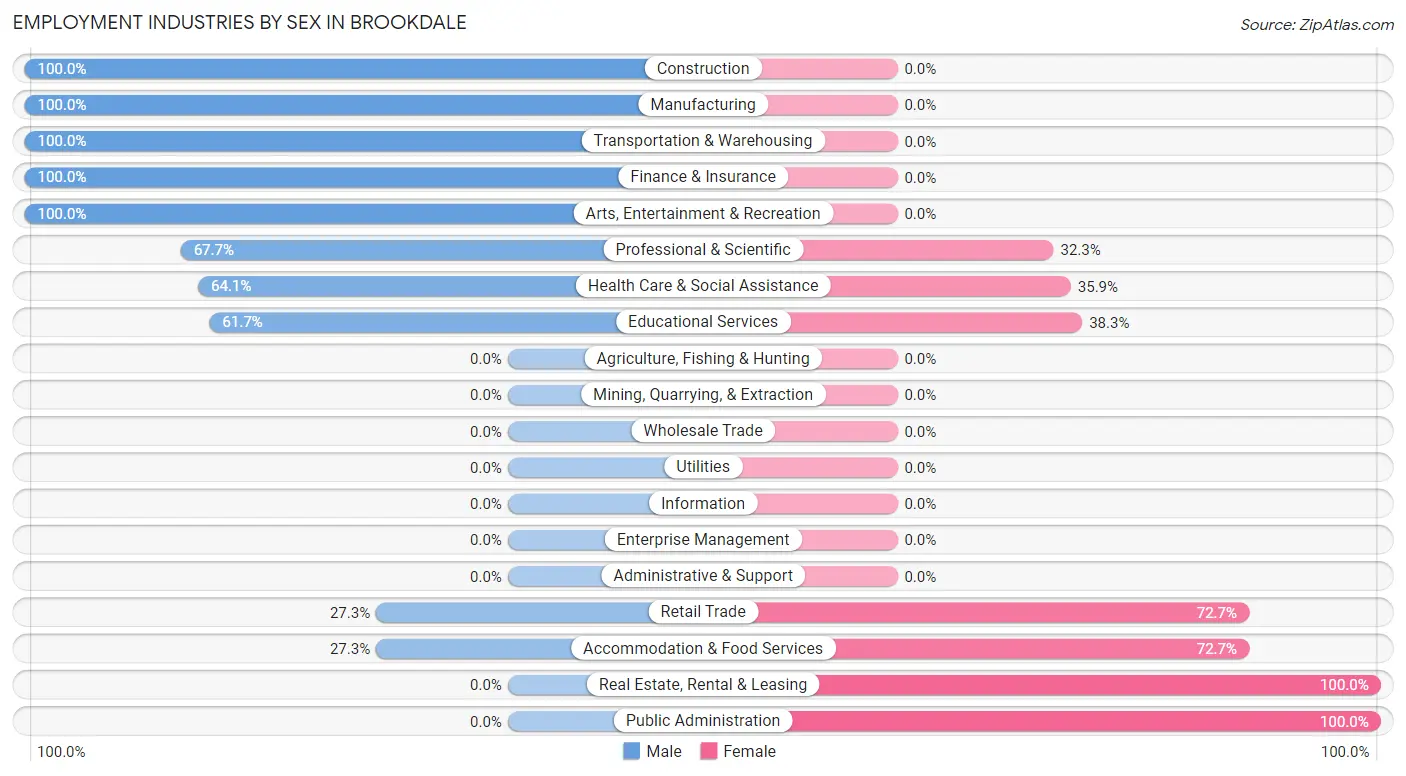
Employment Industries by Sex in Brookdale
The Brookdale industries that see more men than women are Construction (100.0%), Manufacturing (100.0%), and Transportation & Warehousing (100.0%), whereas the industries that tend to have a higher number of women are Real Estate, Rental & Leasing (100.0%), Public Administration (100.0%), and Retail Trade (72.7%).
| Industry | Male | Female |
| Agriculture, Fishing & Hunting | 0 (0.0%) | 0 (0.0%) |
| Mining, Quarrying, & Extraction | 0 (0.0%) | 0 (0.0%) |
| Construction | 15 (100.0%) | 0 (0.0%) |
| Manufacturing | 67 (100.0%) | 0 (0.0%) |
| Wholesale Trade | 0 (0.0%) | 0 (0.0%) |
| Retail Trade | 12 (27.3%) | 32 (72.7%) |
| Transportation & Warehousing | 17 (100.0%) | 0 (0.0%) |
| Utilities | 0 (0.0%) | 0 (0.0%) |
| Information | 0 (0.0%) | 0 (0.0%) |
| Finance & Insurance | 23 (100.0%) | 0 (0.0%) |
| Real Estate, Rental & Leasing | 0 (0.0%) | 18 (100.0%) |
| Professional & Scientific | 67 (67.7%) | 32 (32.3%) |
| Enterprise Management | 0 (0.0%) | 0 (0.0%) |
| Administrative & Support | 0 (0.0%) | 0 (0.0%) |
| Educational Services | 92 (61.7%) | 57 (38.3%) |
| Health Care & Social Assistance | 25 (64.1%) | 14 (35.9%) |
| Arts, Entertainment & Recreation | 51 (100.0%) | 0 (0.0%) |
| Accommodation & Food Services | 15 (27.3%) | 40 (72.7%) |
| Public Administration | 0 (0.0%) | 44 (100.0%) |
| Total | 439 (64.9%) | 237 (35.1%) |
Education in Brookdale
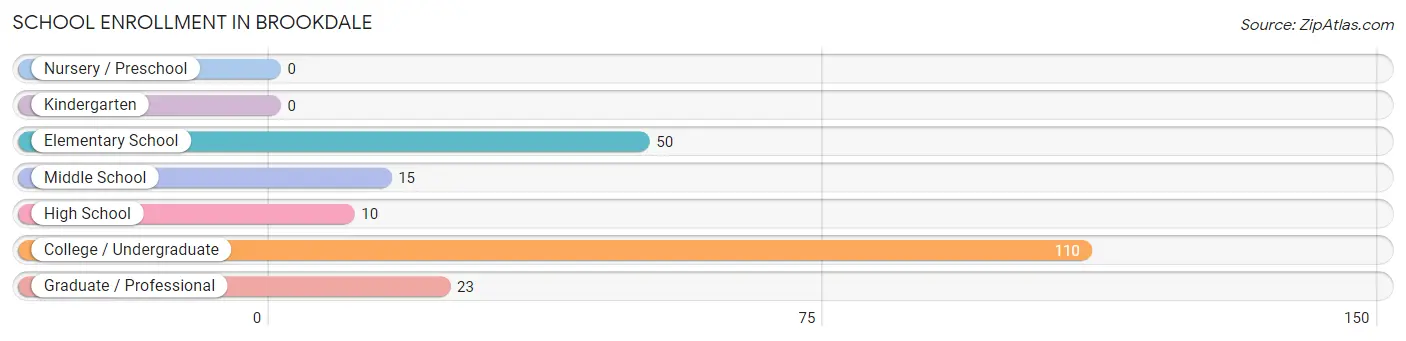
School Enrollment in Brookdale
The most common levels of schooling among the 208 students in Brookdale are college / undergraduate (110 | 52.9%), elementary school (50 | 24.0%), and graduate / professional (23 | 11.1%).
| School Level | # Students | % Students |
| Nursery / Preschool | 0 | 0.0% |
| Kindergarten | 0 | 0.0% |
| Elementary School | 50 | 24.0% |
| Middle School | 15 | 7.2% |
| High School | 10 | 4.8% |
| College / Undergraduate | 110 | 52.9% |
| Graduate / Professional | 23 | 11.1% |
| Total | 208 | 100.0% |
School Enrollment by Age by Funding Source in Brookdale
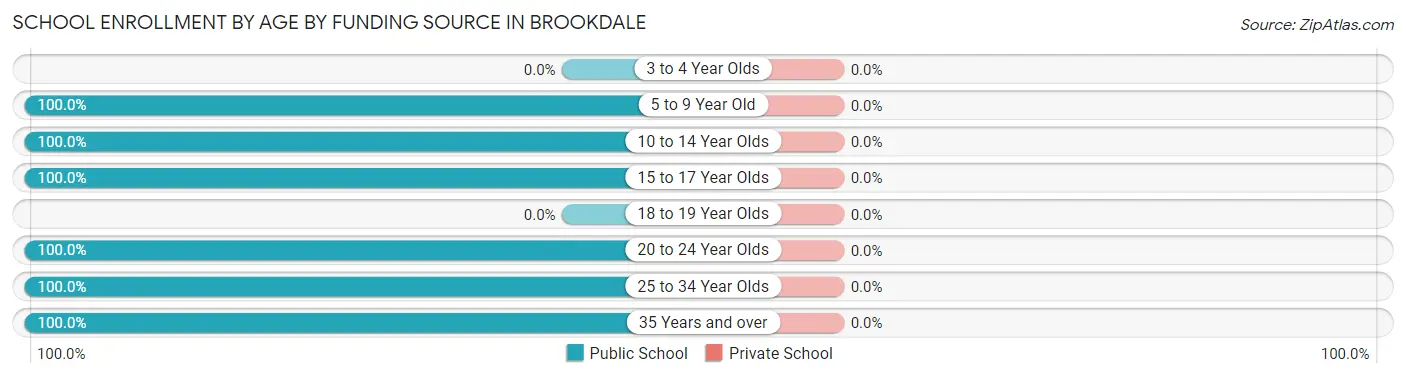
| Age Bracket | Public School | Private School |
| 3 to 4 Year Olds | 0 (0.0%) | 0 (0.0%) |
| 5 to 9 Year Old | 50 (100.0%) | 0 (0.0%) |
| 10 to 14 Year Olds | 15 (100.0%) | 0 (0.0%) |
| 15 to 17 Year Olds | 10 (100.0%) | 0 (0.0%) |
| 18 to 19 Year Olds | 0 (0.0%) | 0 (0.0%) |
| 20 to 24 Year Olds | 78 (100.0%) | 0 (0.0%) |
| 25 to 34 Year Olds | 38 (100.0%) | 0 (0.0%) |
| 35 Years and over | 17 (100.0%) | 0 (0.0%) |
| Total | 208 (100.0%) | 0 (0.0%) |
Educational Attainment by Field of Study in Brookdale
Psychology (97 | 20.7%), business (64 | 13.7%), computers & mathematics (61 | 13.0%), social sciences (50 | 10.7%), and literature & languages (49 | 10.5%) are the most common fields of study among 468 individuals in Brookdale who have obtained a bachelor's degree or higher.
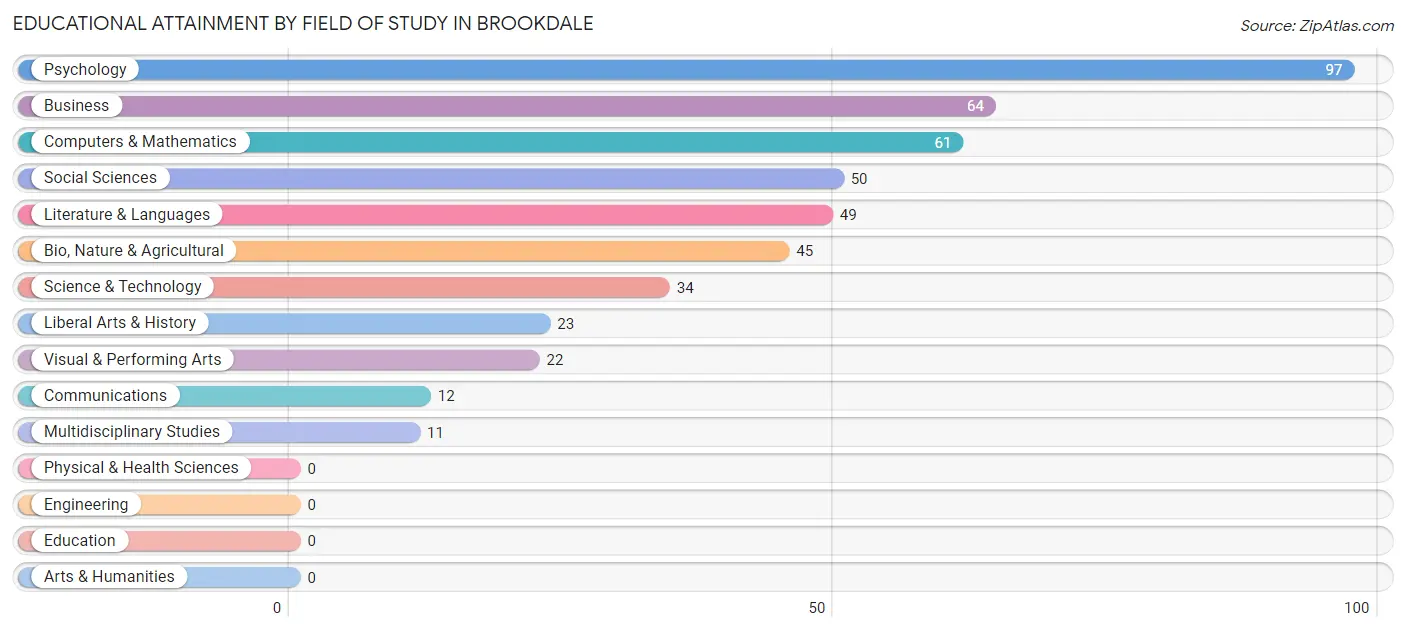
| Field of Study | # Graduates | % Graduates |
| Computers & Mathematics | 61 | 13.0% |
| Bio, Nature & Agricultural | 45 | 9.6% |
| Physical & Health Sciences | 0 | 0.0% |
| Psychology | 97 | 20.7% |
| Social Sciences | 50 | 10.7% |
| Engineering | 0 | 0.0% |
| Multidisciplinary Studies | 11 | 2.4% |
| Science & Technology | 34 | 7.3% |
| Business | 64 | 13.7% |
| Education | 0 | 0.0% |
| Literature & Languages | 49 | 10.5% |
| Liberal Arts & History | 23 | 4.9% |
| Visual & Performing Arts | 22 | 4.7% |
| Communications | 12 | 2.6% |
| Arts & Humanities | 0 | 0.0% |
| Total | 468 | 100.0% |
Transportation & Commute in Brookdale
Vehicle Availability by Sex in Brookdale
The most prevalent vehicle ownership categories in Brookdale are males with 2 vehicles (211, accounting for 48.1%) and females with 2 vehicles (94, making up 89.0%).
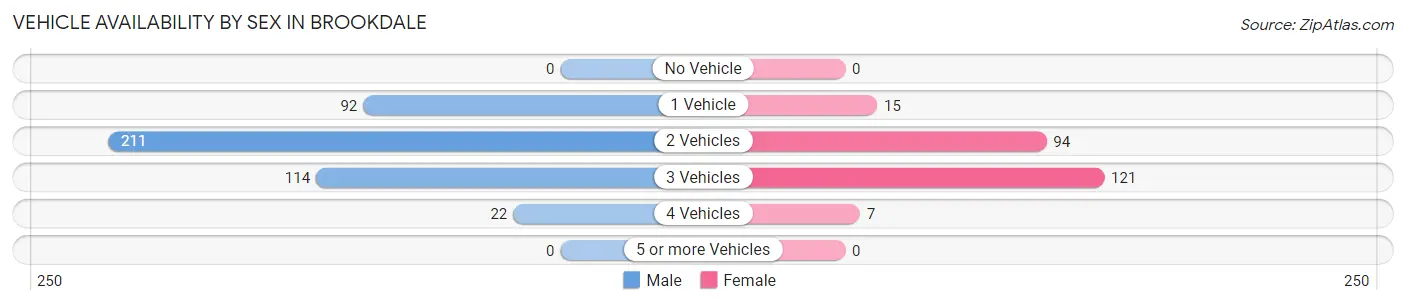
| Vehicles Available | Male | Female |
| No Vehicle | 0 (0.0%) | 0 (0.0%) |
| 1 Vehicle | 92 (21.0%) | 15 (6.3%) |
| 2 Vehicles | 211 (48.1%) | 94 (39.7%) |
| 3 Vehicles | 114 (26.0%) | 121 (51.0%) |
| 4 Vehicles | 22 (5.0%) | 7 (2.9%) |
| 5 or more Vehicles | 0 (0.0%) | 0 (0.0%) |
| Total | 439 (100.0%) | 237 (100.0%) |
Commute Time in Brookdale
The most frequently occuring commute durations in Brookdale are 60 to 89 minutes (129 commuters, 27.2%), 30 to 34 minutes (86 commuters, 18.1%), and 15 to 19 minutes (62 commuters, 13.1%).
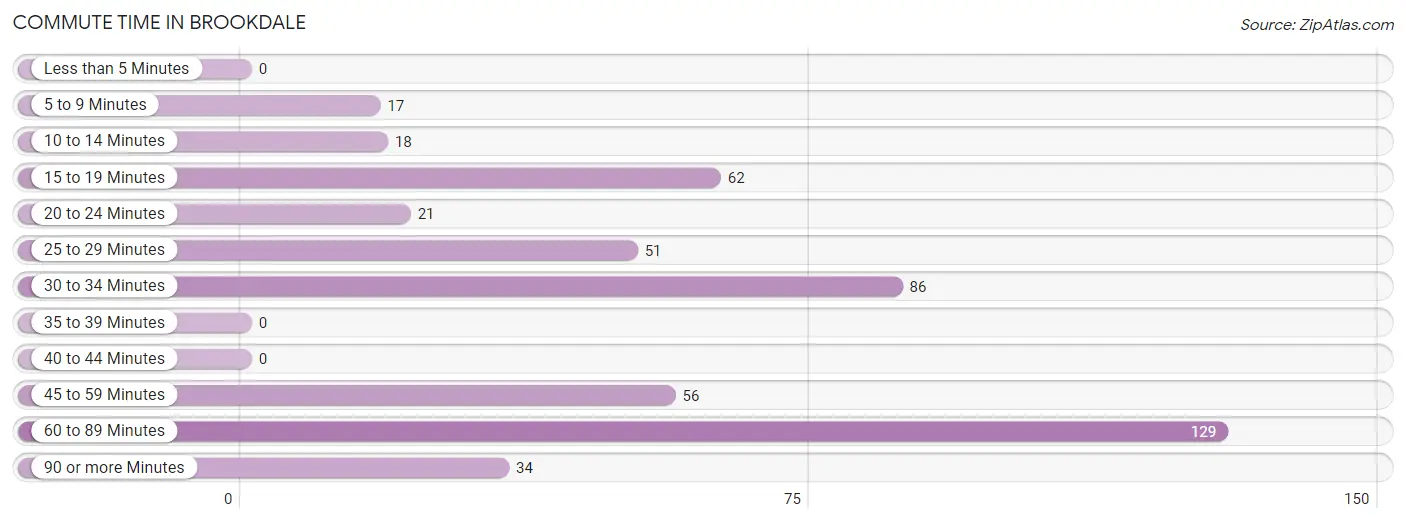
| Commute Time | # Commuters | % Commuters |
| Less than 5 Minutes | 0 | 0.0% |
| 5 to 9 Minutes | 17 | 3.6% |
| 10 to 14 Minutes | 18 | 3.8% |
| 15 to 19 Minutes | 62 | 13.1% |
| 20 to 24 Minutes | 21 | 4.4% |
| 25 to 29 Minutes | 51 | 10.8% |
| 30 to 34 Minutes | 86 | 18.1% |
| 35 to 39 Minutes | 0 | 0.0% |
| 40 to 44 Minutes | 0 | 0.0% |
| 45 to 59 Minutes | 56 | 11.8% |
| 60 to 89 Minutes | 129 | 27.2% |
| 90 or more Minutes | 34 | 7.2% |
Commute Time by Sex in Brookdale
The most common commute times in Brookdale are 60 to 89 minutes (82 commuters, 29.4%) for males and 15 to 19 minutes (47 commuters, 24.1%) for females.
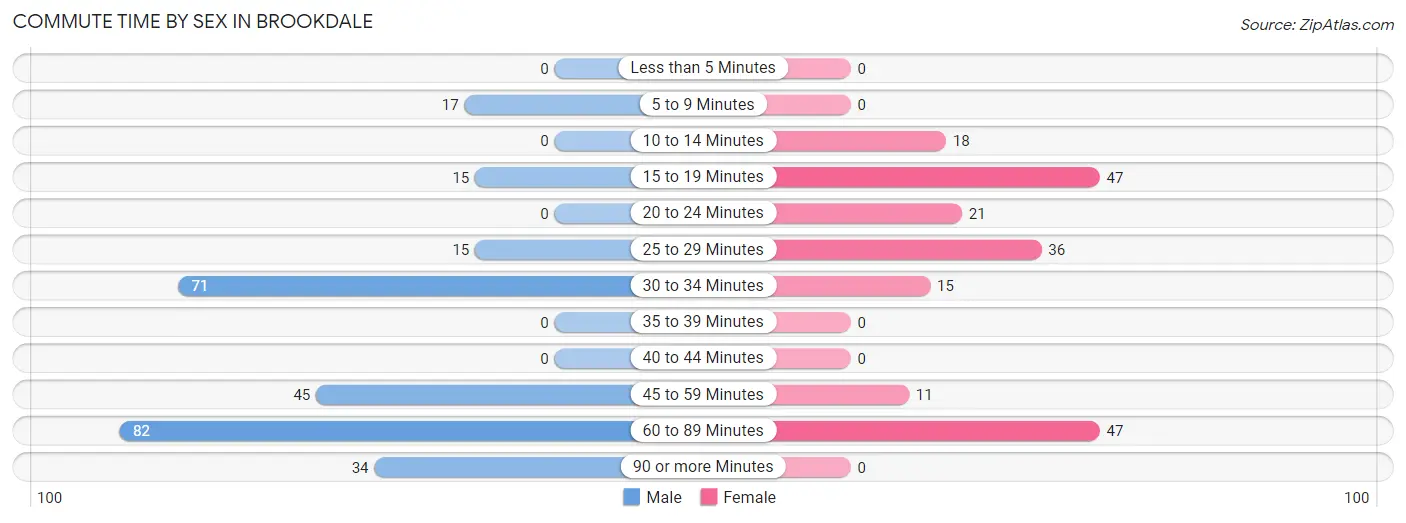
| Commute Time | Male | Female |
| Less than 5 Minutes | 0 (0.0%) | 0 (0.0%) |
| 5 to 9 Minutes | 17 (6.1%) | 0 (0.0%) |
| 10 to 14 Minutes | 0 (0.0%) | 18 (9.2%) |
| 15 to 19 Minutes | 15 (5.4%) | 47 (24.1%) |
| 20 to 24 Minutes | 0 (0.0%) | 21 (10.8%) |
| 25 to 29 Minutes | 15 (5.4%) | 36 (18.5%) |
| 30 to 34 Minutes | 71 (25.5%) | 15 (7.7%) |
| 35 to 39 Minutes | 0 (0.0%) | 0 (0.0%) |
| 40 to 44 Minutes | 0 (0.0%) | 0 (0.0%) |
| 45 to 59 Minutes | 45 (16.1%) | 11 (5.6%) |
| 60 to 89 Minutes | 82 (29.4%) | 47 (24.1%) |
| 90 or more Minutes | 34 (12.2%) | 0 (0.0%) |
Time of Departure to Work by Sex in Brookdale
The most frequent times of departure to work in Brookdale are 7:00 AM to 7:29 AM (100, 35.8%) for males and 12:00 PM to 3:59 PM (61, 31.3%) for females.
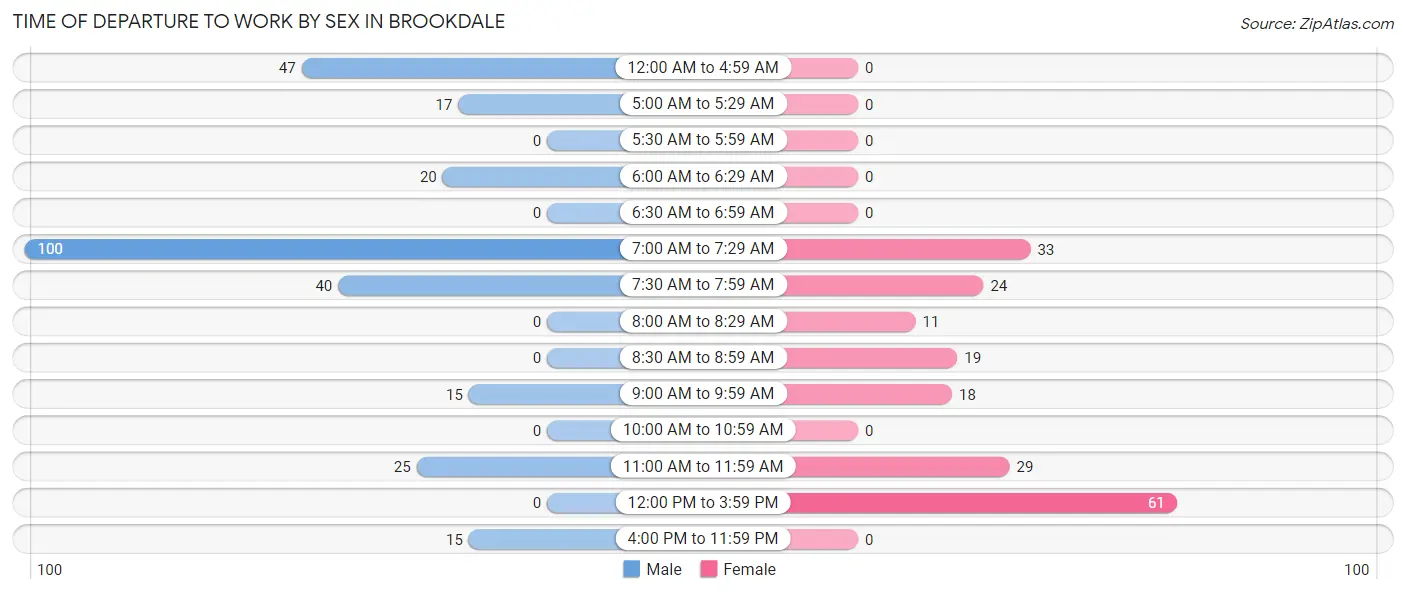
| Time of Departure | Male | Female |
| 12:00 AM to 4:59 AM | 47 (16.9%) | 0 (0.0%) |
| 5:00 AM to 5:29 AM | 17 (6.1%) | 0 (0.0%) |
| 5:30 AM to 5:59 AM | 0 (0.0%) | 0 (0.0%) |
| 6:00 AM to 6:29 AM | 20 (7.2%) | 0 (0.0%) |
| 6:30 AM to 6:59 AM | 0 (0.0%) | 0 (0.0%) |
| 7:00 AM to 7:29 AM | 100 (35.8%) | 33 (16.9%) |
| 7:30 AM to 7:59 AM | 40 (14.3%) | 24 (12.3%) |
| 8:00 AM to 8:29 AM | 0 (0.0%) | 11 (5.6%) |
| 8:30 AM to 8:59 AM | 0 (0.0%) | 19 (9.7%) |
| 9:00 AM to 9:59 AM | 15 (5.4%) | 18 (9.2%) |
| 10:00 AM to 10:59 AM | 0 (0.0%) | 0 (0.0%) |
| 11:00 AM to 11:59 AM | 25 (9.0%) | 29 (14.9%) |
| 12:00 PM to 3:59 PM | 0 (0.0%) | 61 (31.3%) |
| 4:00 PM to 11:59 PM | 15 (5.4%) | 0 (0.0%) |
| Total | 279 (100.0%) | 195 (100.0%) |
Housing Occupancy in Brookdale
Occupancy by Ownership in Brookdale
Of the total 606 dwellings in Brookdale, owner-occupied units account for 369 (60.9%), while renter-occupied units make up 237 (39.1%).
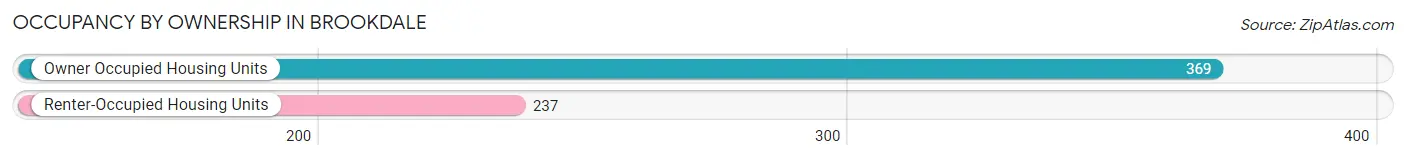
| Occupancy | # Housing Units | % Housing Units |
| Owner Occupied Housing Units | 369 | 60.9% |
| Renter-Occupied Housing Units | 237 | 39.1% |
| Total Occupied Housing Units | 606 | 100.0% |
Occupancy by Household Size in Brookdale
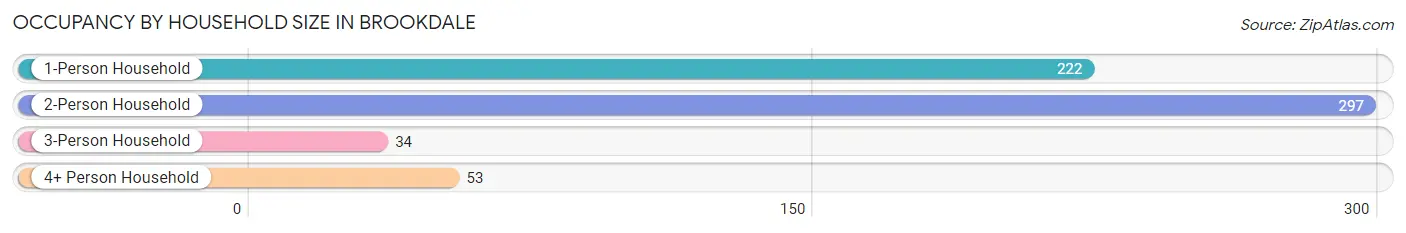
| Household Size | # Housing Units | % Housing Units |
| 1-Person Household | 222 | 36.6% |
| 2-Person Household | 297 | 49.0% |
| 3-Person Household | 34 | 5.6% |
| 4+ Person Household | 53 | 8.7% |
| Total Housing Units | 606 | 100.0% |
Occupancy by Ownership by Household Size in Brookdale
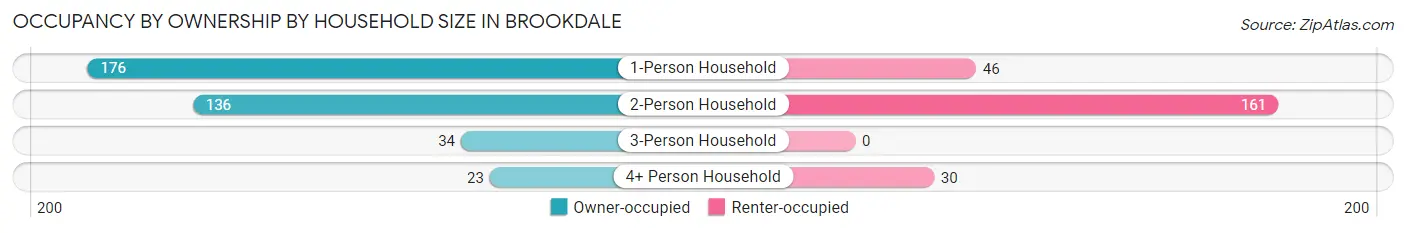
| Household Size | Owner-occupied | Renter-occupied |
| 1-Person Household | 176 (79.3%) | 46 (20.7%) |
| 2-Person Household | 136 (45.8%) | 161 (54.2%) |
| 3-Person Household | 34 (100.0%) | 0 (0.0%) |
| 4+ Person Household | 23 (43.4%) | 30 (56.6%) |
| Total Housing Units | 369 (60.9%) | 237 (39.1%) |
Occupancy by Educational Attainment in Brookdale
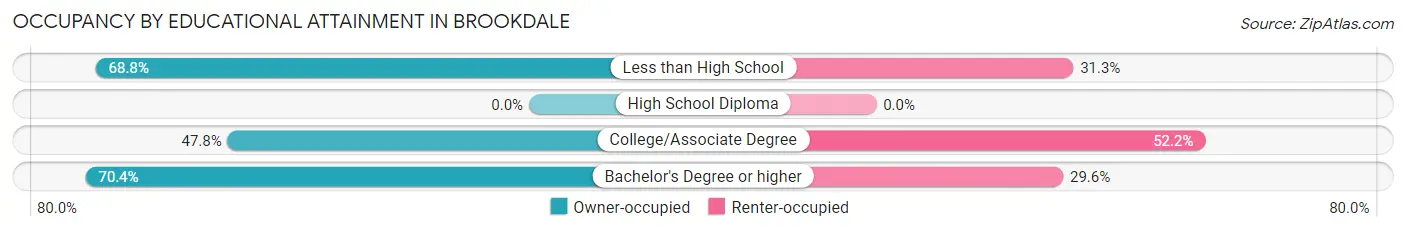
| Household Size | Owner-occupied | Renter-occupied |
| Less than High School | 33 (68.8%) | 15 (31.2%) |
| High School Diploma | 0 (0.0%) | 0 (0.0%) |
| College/Associate Degree | 120 (47.8%) | 131 (52.2%) |
| Bachelor's Degree or higher | 216 (70.4%) | 91 (29.6%) |
Occupancy by Age of Householder in Brookdale
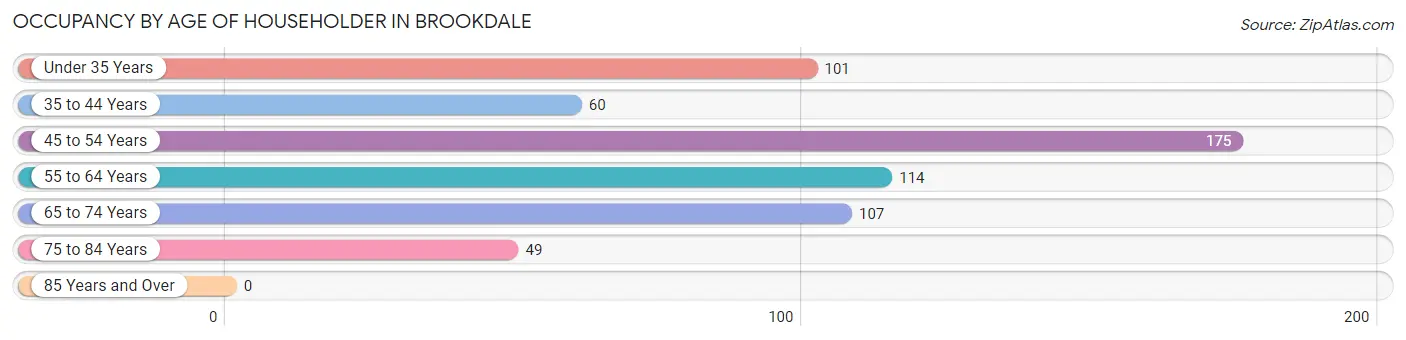
| Age Bracket | # Households | % Households |
| Under 35 Years | 101 | 16.7% |
| 35 to 44 Years | 60 | 9.9% |
| 45 to 54 Years | 175 | 28.9% |
| 55 to 64 Years | 114 | 18.8% |
| 65 to 74 Years | 107 | 17.7% |
| 75 to 84 Years | 49 | 8.1% |
| 85 Years and Over | 0 | 0.0% |
| Total | 606 | 100.0% |
Housing Finances in Brookdale
Median Income by Occupancy in Brookdale
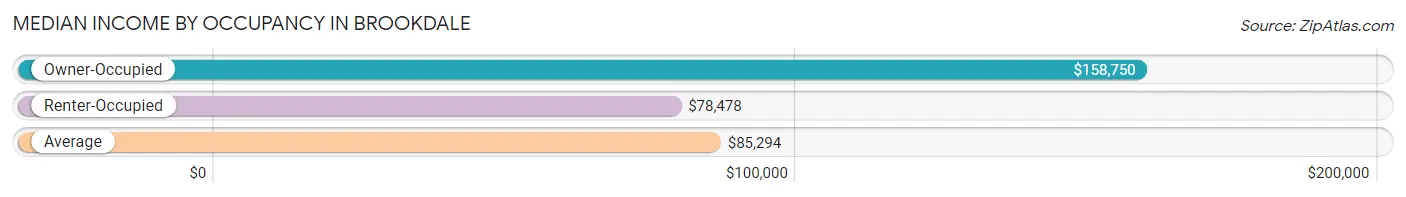
| Occupancy Type | # Households | Median Income |
| Owner-Occupied | 369 (60.9%) | $158,750 |
| Renter-Occupied | 237 (39.1%) | $78,478 |
| Average | 606 (100.0%) | $85,294 |
Occupancy by Householder Income Bracket in Brookdale
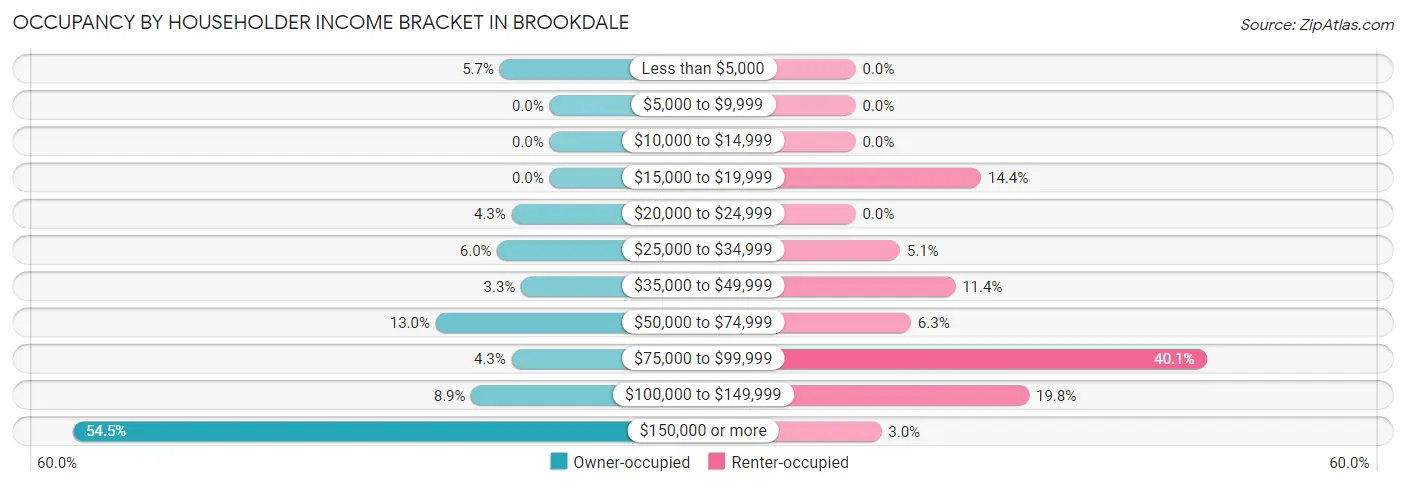
| Income Bracket | Owner-occupied | Renter-occupied |
| Less than $5,000 | 21 (5.7%) | 0 (0.0%) |
| $5,000 to $9,999 | 0 (0.0%) | 0 (0.0%) |
| $10,000 to $14,999 | 0 (0.0%) | 0 (0.0%) |
| $15,000 to $19,999 | 0 (0.0%) | 34 (14.3%) |
| $20,000 to $24,999 | 16 (4.3%) | 0 (0.0%) |
| $25,000 to $34,999 | 22 (6.0%) | 12 (5.1%) |
| $35,000 to $49,999 | 12 (3.3%) | 27 (11.4%) |
| $50,000 to $74,999 | 48 (13.0%) | 15 (6.3%) |
| $75,000 to $99,999 | 16 (4.3%) | 95 (40.1%) |
| $100,000 to $149,999 | 33 (8.9%) | 47 (19.8%) |
| $150,000 or more | 201 (54.5%) | 7 (2.9%) |
| Total | 369 (100.0%) | 237 (100.0%) |
Monthly Housing Cost Tiers in Brookdale
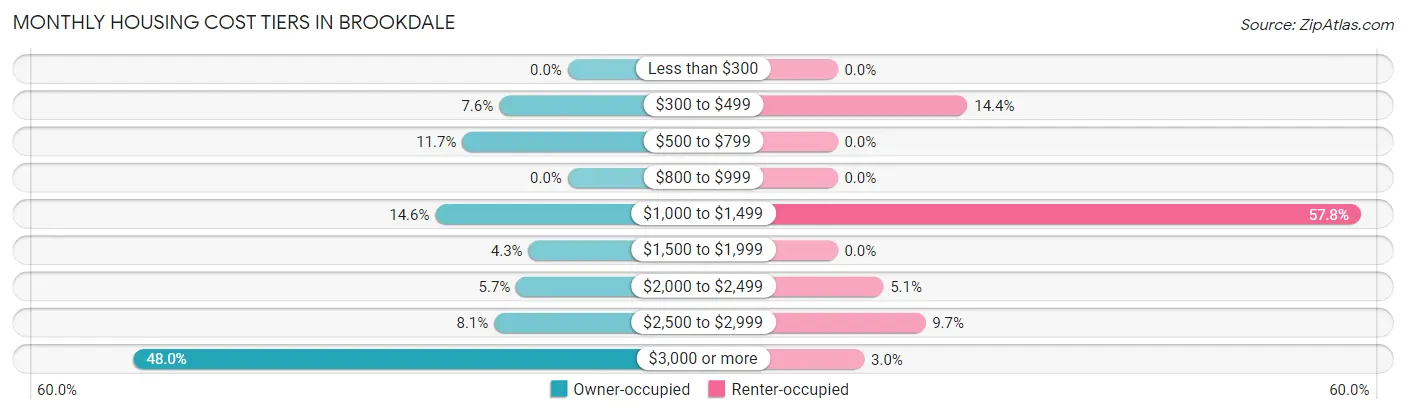
| Monthly Cost | Owner-occupied | Renter-occupied |
| Less than $300 | 0 (0.0%) | 0 (0.0%) |
| $300 to $499 | 28 (7.6%) | 34 (14.3%) |
| $500 to $799 | 43 (11.7%) | 0 (0.0%) |
| $800 to $999 | 0 (0.0%) | 0 (0.0%) |
| $1,000 to $1,499 | 54 (14.6%) | 137 (57.8%) |
| $1,500 to $1,999 | 16 (4.3%) | 0 (0.0%) |
| $2,000 to $2,499 | 21 (5.7%) | 12 (5.1%) |
| $2,500 to $2,999 | 30 (8.1%) | 23 (9.7%) |
| $3,000 or more | 177 (48.0%) | 7 (2.9%) |
| Total | 369 (100.0%) | 237 (100.0%) |
Physical Housing Characteristics in Brookdale
Housing Structures in Brookdale
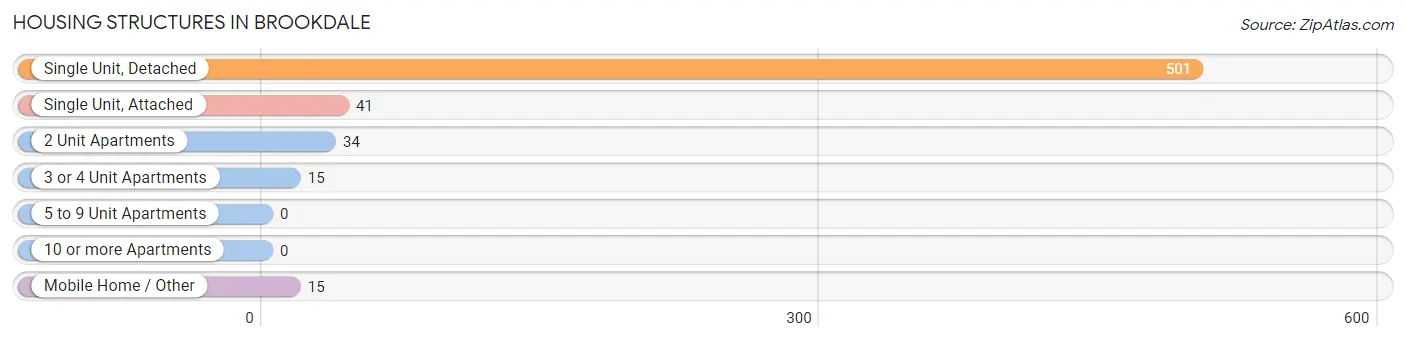
| Structure Type | # Housing Units | % Housing Units |
| Single Unit, Detached | 501 | 82.7% |
| Single Unit, Attached | 41 | 6.8% |
| 2 Unit Apartments | 34 | 5.6% |
| 3 or 4 Unit Apartments | 15 | 2.5% |
| 5 to 9 Unit Apartments | 0 | 0.0% |
| 10 or more Apartments | 0 | 0.0% |
| Mobile Home / Other | 15 | 2.5% |
| Total | 606 | 100.0% |
Housing Structures by Occupancy in Brookdale
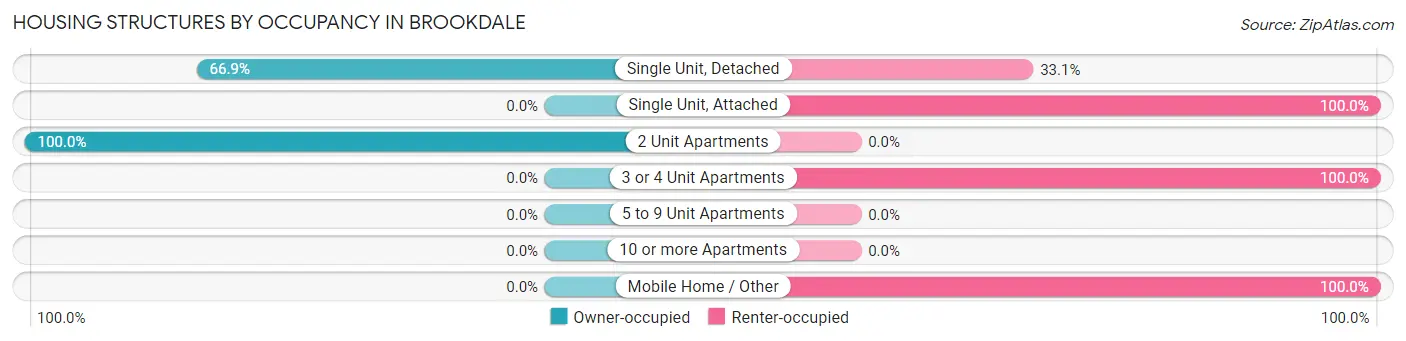
| Structure Type | Owner-occupied | Renter-occupied |
| Single Unit, Detached | 335 (66.9%) | 166 (33.1%) |
| Single Unit, Attached | 0 (0.0%) | 41 (100.0%) |
| 2 Unit Apartments | 34 (100.0%) | 0 (0.0%) |
| 3 or 4 Unit Apartments | 0 (0.0%) | 15 (100.0%) |
| 5 to 9 Unit Apartments | 0 (0.0%) | 0 (0.0%) |
| 10 or more Apartments | 0 (0.0%) | 0 (0.0%) |
| Mobile Home / Other | 0 (0.0%) | 15 (100.0%) |
| Total | 369 (60.9%) | 237 (39.1%) |
Housing Structures by Number of Rooms in Brookdale
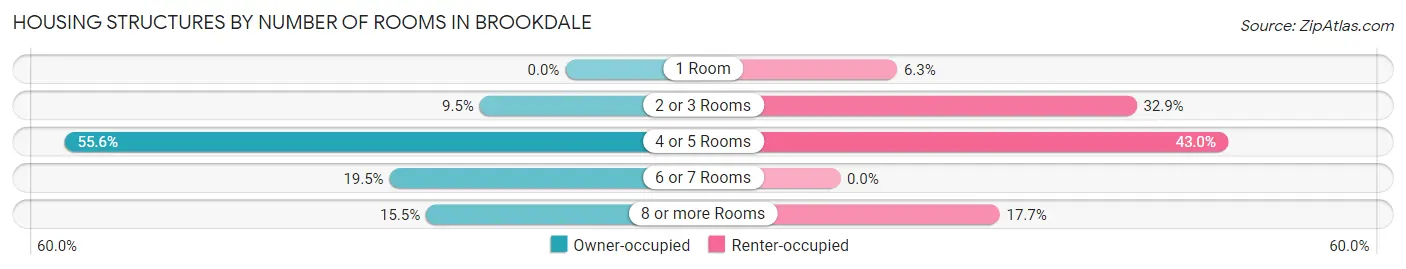
| Number of Rooms | Owner-occupied | Renter-occupied |
| 1 Room | 0 (0.0%) | 15 (6.3%) |
| 2 or 3 Rooms | 35 (9.5%) | 78 (32.9%) |
| 4 or 5 Rooms | 205 (55.6%) | 102 (43.0%) |
| 6 or 7 Rooms | 72 (19.5%) | 0 (0.0%) |
| 8 or more Rooms | 57 (15.4%) | 42 (17.7%) |
| Total | 369 (100.0%) | 237 (100.0%) |
Housing Structure by Heating Type in Brookdale
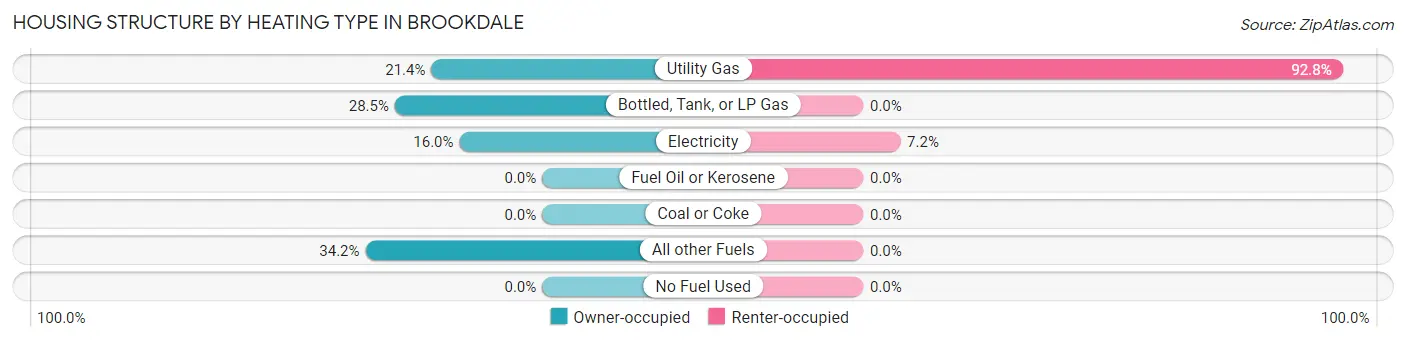
| Heating Type | Owner-occupied | Renter-occupied |
| Utility Gas | 79 (21.4%) | 220 (92.8%) |
| Bottled, Tank, or LP Gas | 105 (28.5%) | 0 (0.0%) |
| Electricity | 59 (16.0%) | 17 (7.2%) |
| Fuel Oil or Kerosene | 0 (0.0%) | 0 (0.0%) |
| Coal or Coke | 0 (0.0%) | 0 (0.0%) |
| All other Fuels | 126 (34.2%) | 0 (0.0%) |
| No Fuel Used | 0 (0.0%) | 0 (0.0%) |
| Total | 369 (100.0%) | 237 (100.0%) |
Household Vehicle Usage in Brookdale
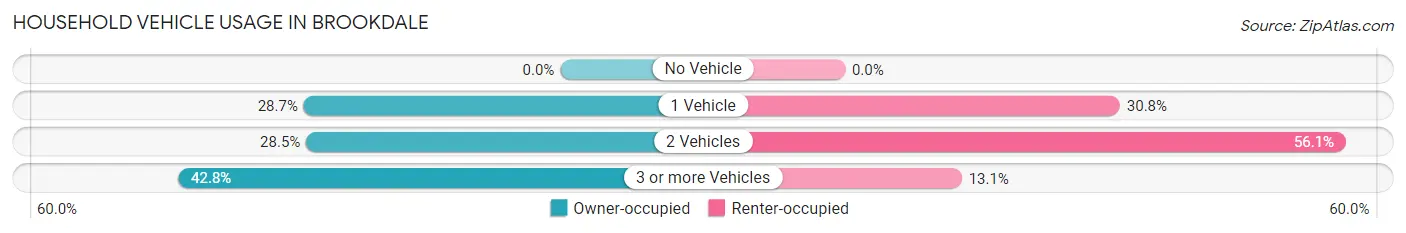
| Vehicles per Household | Owner-occupied | Renter-occupied |
| No Vehicle | 0 (0.0%) | 0 (0.0%) |
| 1 Vehicle | 106 (28.7%) | 73 (30.8%) |
| 2 Vehicles | 105 (28.5%) | 133 (56.1%) |
| 3 or more Vehicles | 158 (42.8%) | 31 (13.1%) |
| Total | 369 (100.0%) | 237 (100.0%) |
Real Estate & Mortgages in Brookdale
Real Estate and Mortgage Overview in Brookdale
| Characteristic | Without Mortgage | With Mortgage |
| Housing Units | 125 | 244 |
| Median Property Value | $803,600 | $826,300 |
| Median Household Income | - | - |
| Monthly Housing Costs | $660 | $177 |
| Real Estate Taxes | $4,469 | $0 |
Property Value by Mortgage Status in Brookdale
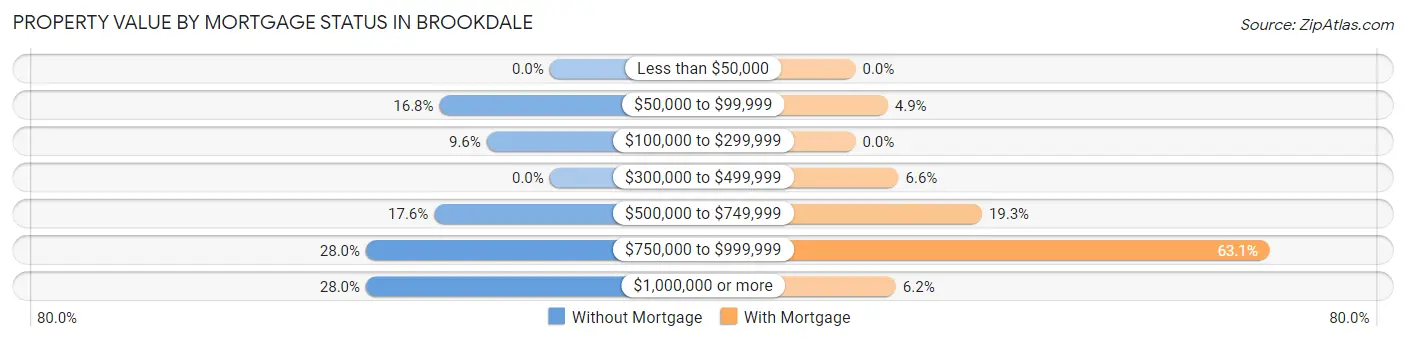
| Property Value | Without Mortgage | With Mortgage |
| Less than $50,000 | 0 (0.0%) | 0 (0.0%) |
| $50,000 to $99,999 | 21 (16.8%) | 12 (4.9%) |
| $100,000 to $299,999 | 12 (9.6%) | 0 (0.0%) |
| $300,000 to $499,999 | 0 (0.0%) | 16 (6.6%) |
| $500,000 to $749,999 | 22 (17.6%) | 47 (19.3%) |
| $750,000 to $999,999 | 35 (28.0%) | 154 (63.1%) |
| $1,000,000 or more | 35 (28.0%) | 15 (6.1%) |
| Total | 125 (100.0%) | 244 (100.0%) |
Household Income by Mortgage Status in Brookdale
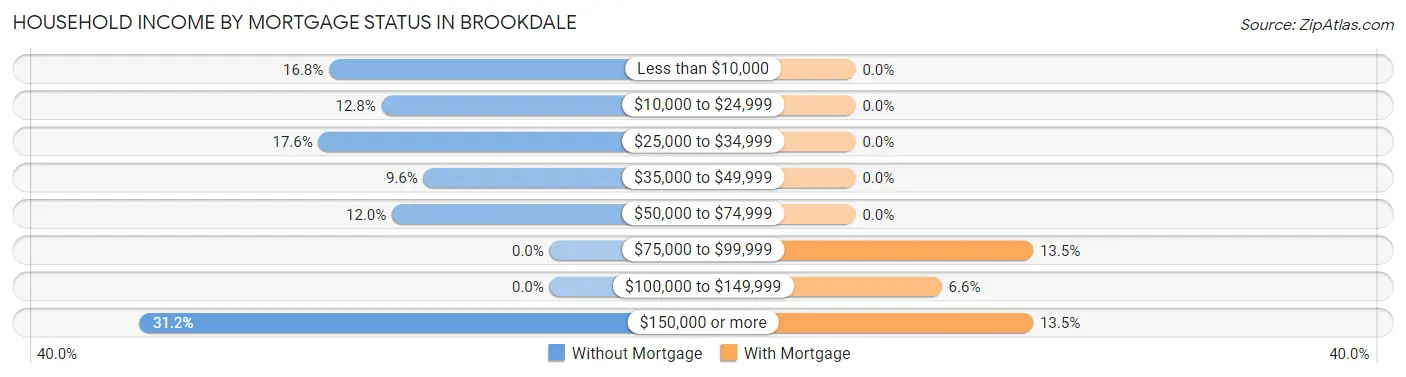
| Household Income | Without Mortgage | With Mortgage |
| Less than $10,000 | 21 (16.8%) | 0 (0.0%) |
| $10,000 to $24,999 | 16 (12.8%) | 0 (0.0%) |
| $25,000 to $34,999 | 22 (17.6%) | 0 (0.0%) |
| $35,000 to $49,999 | 12 (9.6%) | 0 (0.0%) |
| $50,000 to $74,999 | 15 (12.0%) | 0 (0.0%) |
| $75,000 to $99,999 | 0 (0.0%) | 33 (13.5%) |
| $100,000 to $149,999 | 0 (0.0%) | 16 (6.6%) |
| $150,000 or more | 39 (31.2%) | 33 (13.5%) |
| Total | 125 (100.0%) | 244 (100.0%) |
Property Value to Household Income Ratio in Brookdale
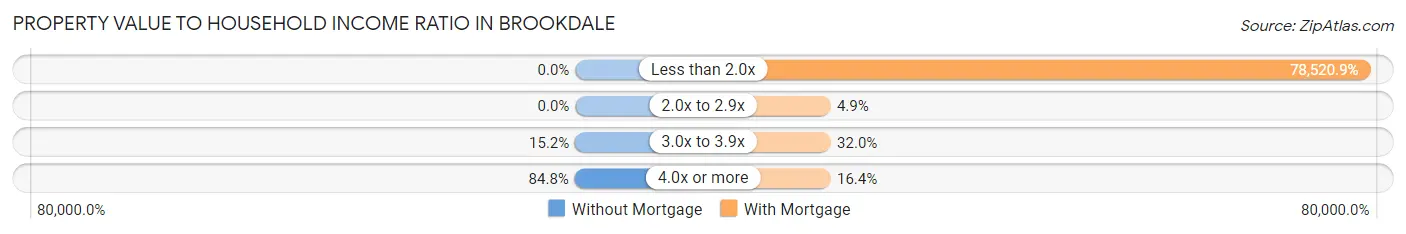
| Value-to-Income Ratio | Without Mortgage | With Mortgage |
| Less than 2.0x | 0 (0.0%) | 191,591 (78,520.9%) |
| 2.0x to 2.9x | 0 (0.0%) | 12 (4.9%) |
| 3.0x to 3.9x | 19 (15.2%) | 78 (32.0%) |
| 4.0x or more | 106 (84.8%) | 40 (16.4%) |
| Total | 125 (100.0%) | 244 (100.0%) |
Real Estate Taxes by Mortgage Status in Brookdale
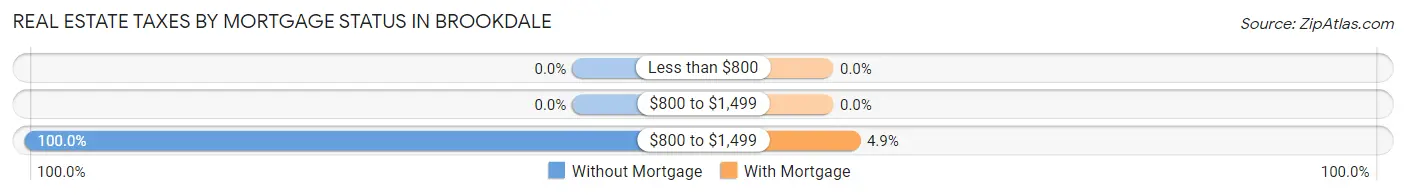
| Property Taxes | Without Mortgage | With Mortgage |
| Less than $800 | 0 (0.0%) | 0 (0.0%) |
| $800 to $1,499 | 0 (0.0%) | 0 (0.0%) |
| $800 to $1,499 | 125 (100.0%) | 12 (4.9%) |
| Total | 125 (100.0%) | 244 (100.0%) |
Health & Disability in Brookdale
Health Insurance Coverage by Age in Brookdale
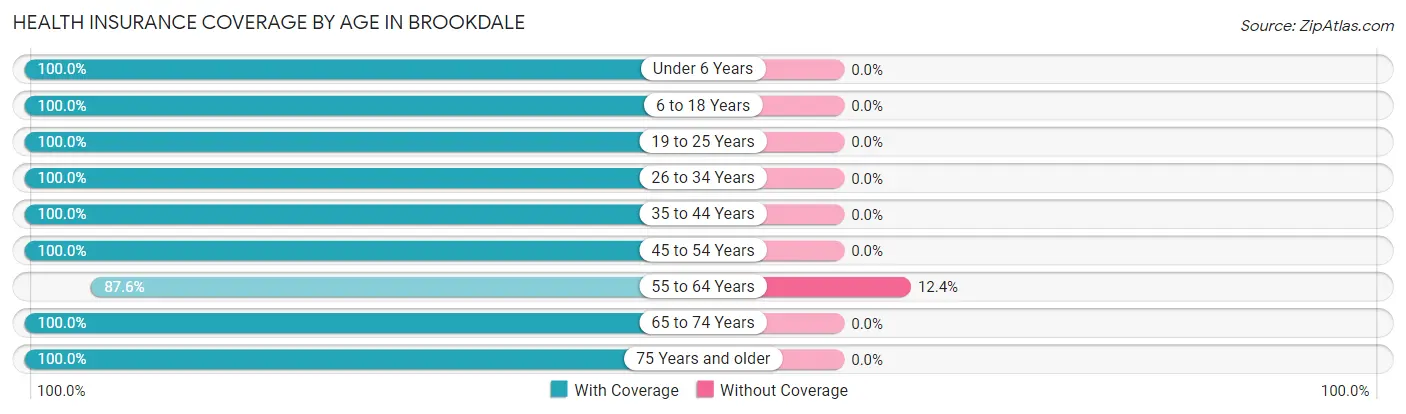
| Age Bracket | With Coverage | Without Coverage |
| Under 6 Years | 38 (100.0%) | 0 (0.0%) |
| 6 to 18 Years | 75 (100.0%) | 0 (0.0%) |
| 19 to 25 Years | 118 (100.0%) | 0 (0.0%) |
| 26 to 34 Years | 60 (100.0%) | 0 (0.0%) |
| 35 to 44 Years | 141 (100.0%) | 0 (0.0%) |
| 45 to 54 Years | 290 (100.0%) | 0 (0.0%) |
| 55 to 64 Years | 155 (87.6%) | 22 (12.4%) |
| 65 to 74 Years | 175 (100.0%) | 0 (0.0%) |
| 75 Years and older | 54 (100.0%) | 0 (0.0%) |
| Total | 1,106 (98.1%) | 22 (1.9%) |
Health Insurance Coverage by Citizenship Status in Brookdale
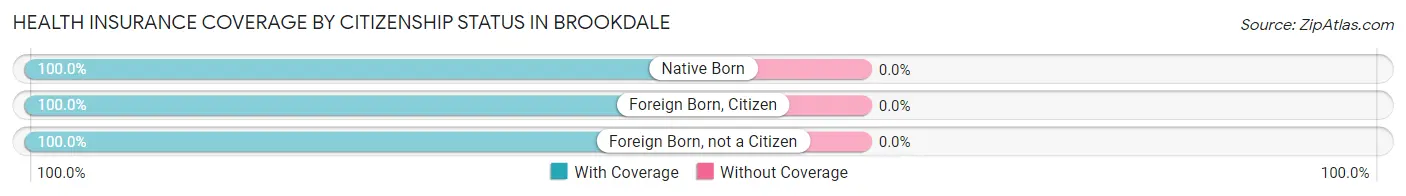
| Citizenship Status | With Coverage | Without Coverage |
| Native Born | 38 (100.0%) | 0 (0.0%) |
| Foreign Born, Citizen | 75 (100.0%) | 0 (0.0%) |
| Foreign Born, not a Citizen | 118 (100.0%) | 0 (0.0%) |
Health Insurance Coverage by Household Income in Brookdale
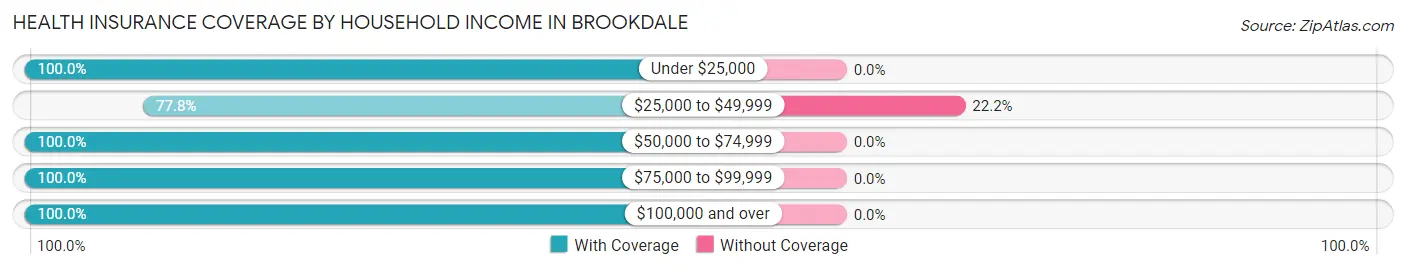
| Household Income | With Coverage | Without Coverage |
| Under $25,000 | 89 (100.0%) | 0 (0.0%) |
| $25,000 to $49,999 | 77 (77.8%) | 22 (22.2%) |
| $50,000 to $74,999 | 77 (100.0%) | 0 (0.0%) |
| $75,000 to $99,999 | 185 (100.0%) | 0 (0.0%) |
| $100,000 and over | 678 (100.0%) | 0 (0.0%) |
Public vs Private Health Insurance Coverage by Age in Brookdale
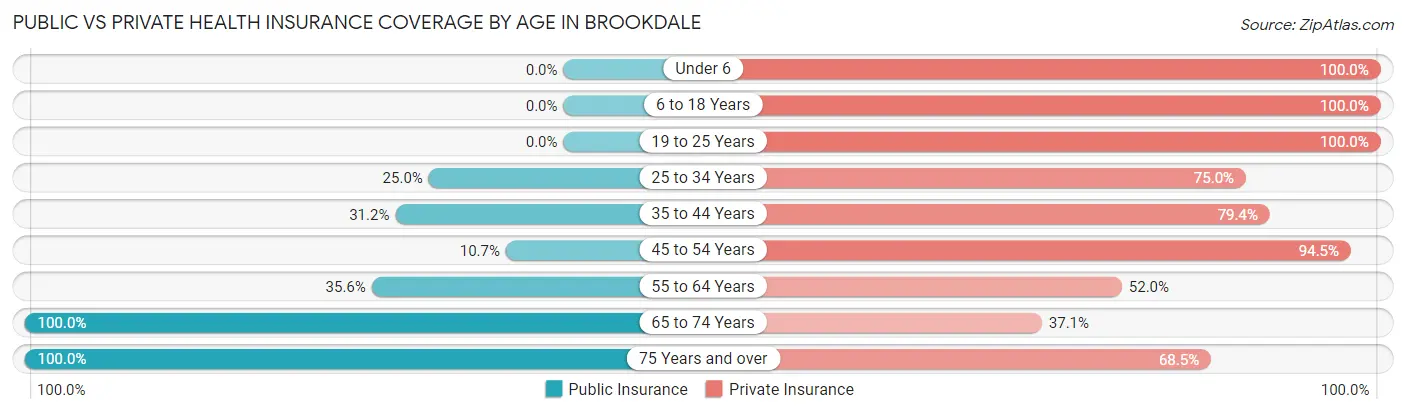
| Age Bracket | Public Insurance | Private Insurance |
| Under 6 | 0 (0.0%) | 38 (100.0%) |
| 6 to 18 Years | 0 (0.0%) | 75 (100.0%) |
| 19 to 25 Years | 0 (0.0%) | 118 (100.0%) |
| 25 to 34 Years | 15 (25.0%) | 45 (75.0%) |
| 35 to 44 Years | 44 (31.2%) | 112 (79.4%) |
| 45 to 54 Years | 31 (10.7%) | 274 (94.5%) |
| 55 to 64 Years | 63 (35.6%) | 92 (52.0%) |
| 65 to 74 Years | 175 (100.0%) | 65 (37.1%) |
| 75 Years and over | 54 (100.0%) | 37 (68.5%) |
| Total | 382 (33.9%) | 856 (75.9%) |
Disability Status by Sex by Age in Brookdale
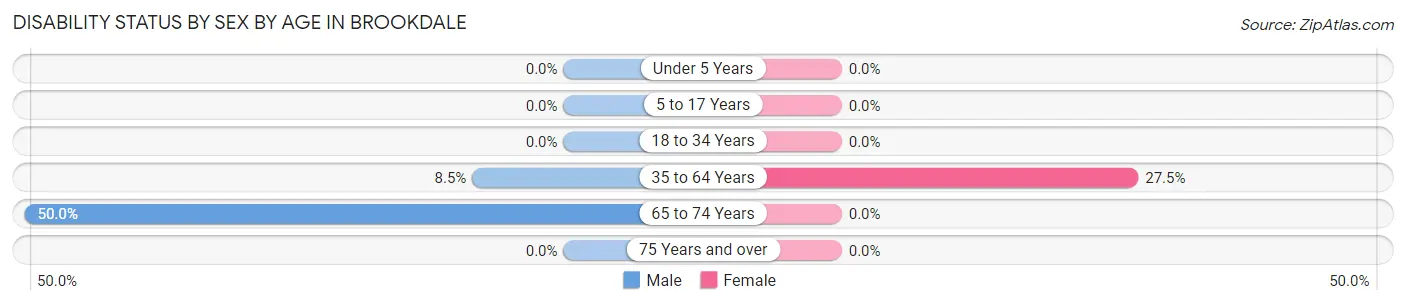
| Age Bracket | Male | Female |
| Under 5 Years | 0 (0.0%) | 0 (0.0%) |
| 5 to 17 Years | 0 (0.0%) | 0 (0.0%) |
| 18 to 34 Years | 0 (0.0%) | 0 (0.0%) |
| 35 to 64 Years | 33 (8.5%) | 60 (27.5%) |
| 65 to 74 Years | 24 (50.0%) | 0 (0.0%) |
| 75 Years and over | 0 (0.0%) | 0 (0.0%) |
Disability Class by Sex by Age in Brookdale
Disability Class: Hearing Difficulty
| Age Bracket | Male | Female |
| Under 5 Years | 0 (0.0%) | 0 (0.0%) |
| 5 to 17 Years | 0 (0.0%) | 0 (0.0%) |
| 18 to 34 Years | 0 (0.0%) | 0 (0.0%) |
| 35 to 64 Years | 0 (0.0%) | 0 (0.0%) |
| 65 to 74 Years | 0 (0.0%) | 0 (0.0%) |
| 75 Years and over | 0 (0.0%) | 0 (0.0%) |
Disability Class: Vision Difficulty
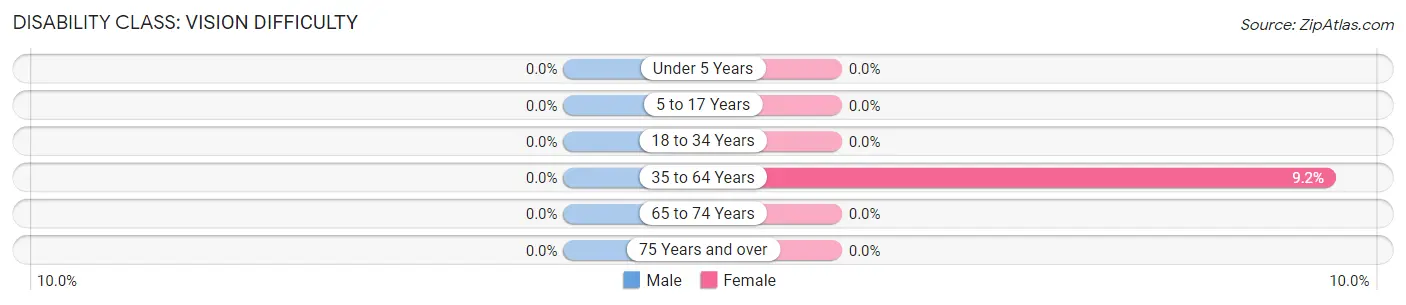
| Age Bracket | Male | Female |
| Under 5 Years | 0 (0.0%) | 0 (0.0%) |
| 5 to 17 Years | 0 (0.0%) | 0 (0.0%) |
| 18 to 34 Years | 0 (0.0%) | 0 (0.0%) |
| 35 to 64 Years | 0 (0.0%) | 20 (9.2%) |
| 65 to 74 Years | 0 (0.0%) | 0 (0.0%) |
| 75 Years and over | 0 (0.0%) | 0 (0.0%) |
Disability Class: Cognitive Difficulty
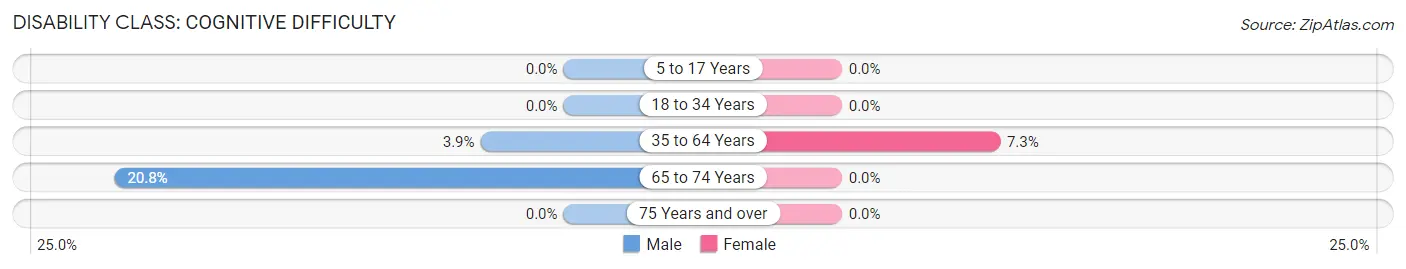
| Age Bracket | Male | Female |
| 5 to 17 Years | 0 (0.0%) | 0 (0.0%) |
| 18 to 34 Years | 0 (0.0%) | 0 (0.0%) |
| 35 to 64 Years | 15 (3.8%) | 16 (7.3%) |
| 65 to 74 Years | 10 (20.8%) | 0 (0.0%) |
| 75 Years and over | 0 (0.0%) | 0 (0.0%) |
Disability Class: Ambulatory Difficulty
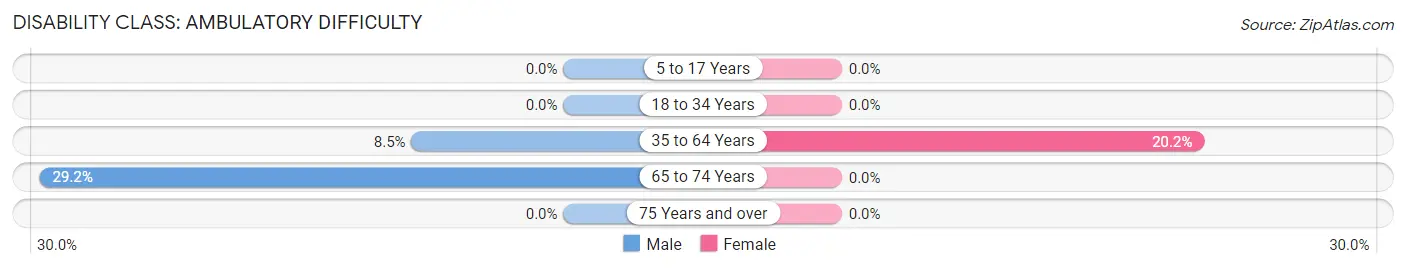
| Age Bracket | Male | Female |
| 5 to 17 Years | 0 (0.0%) | 0 (0.0%) |
| 18 to 34 Years | 0 (0.0%) | 0 (0.0%) |
| 35 to 64 Years | 33 (8.5%) | 44 (20.2%) |
| 65 to 74 Years | 14 (29.2%) | 0 (0.0%) |
| 75 Years and over | 0 (0.0%) | 0 (0.0%) |
Disability Class: Self-Care Difficulty
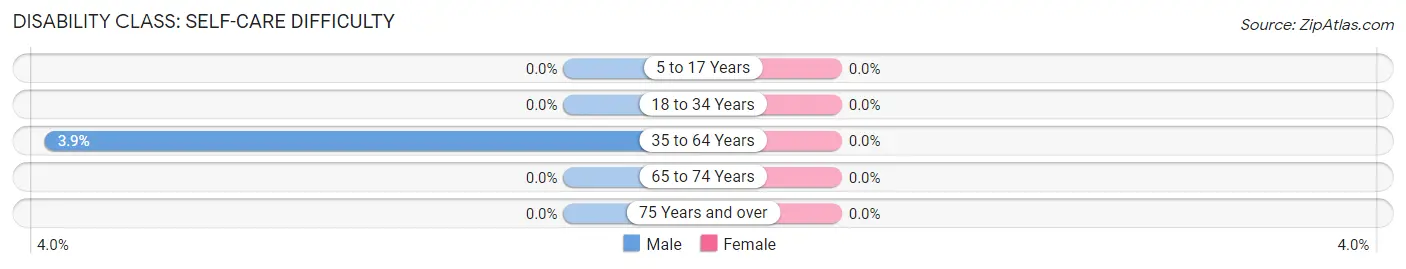
| Age Bracket | Male | Female |
| 5 to 17 Years | 0 (0.0%) | 0 (0.0%) |
| 18 to 34 Years | 0 (0.0%) | 0 (0.0%) |
| 35 to 64 Years | 15 (3.8%) | 0 (0.0%) |
| 65 to 74 Years | 0 (0.0%) | 0 (0.0%) |
| 75 Years and over | 0 (0.0%) | 0 (0.0%) |
Technology Access in Brookdale
Computing Device Access in Brookdale
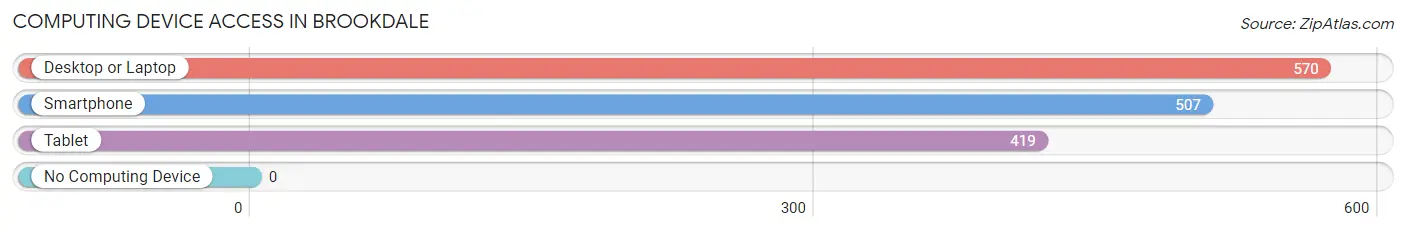
| Device Type | # Households | % Households |
| Desktop or Laptop | 570 | 94.1% |
| Smartphone | 507 | 83.7% |
| Tablet | 419 | 69.1% |
| No Computing Device | 0 | 0.0% |
| Total | 606 | 100.0% |
Internet Access in Brookdale
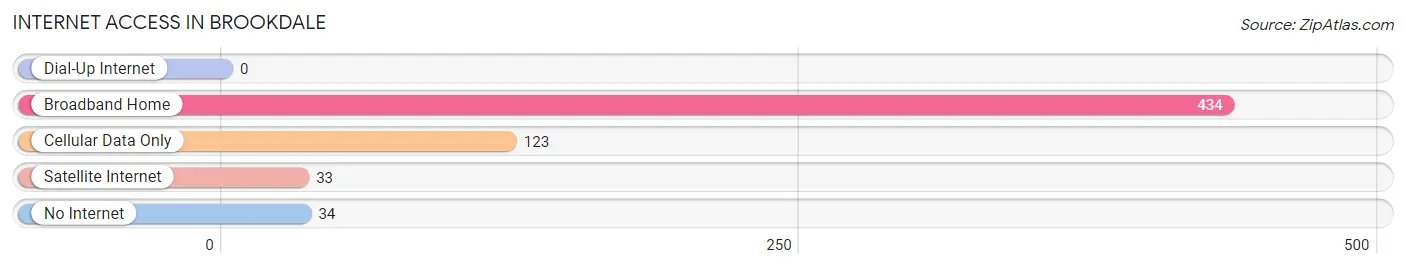
| Internet Type | # Households | % Households |
| Dial-Up Internet | 0 | 0.0% |
| Broadband Home | 434 | 71.6% |
| Cellular Data Only | 123 | 20.3% |
| Satellite Internet | 33 | 5.4% |
| No Internet | 34 | 5.6% |
| Total | 606 | 100.0% |
Brookdale Summary
Brookdale, California is a small unincorporated community located in Santa Cruz County, California. It is situated in the Santa Cruz Mountains, approximately 8 miles (13 km) northwest of the city of Santa Cruz. The population of Brookdale was estimated to be 1,845 in 2019.
History
The area now known as Brookdale was originally inhabited by the Ohlone people, who lived in the area for thousands of years before the arrival of Europeans. The first Europeans to settle in the area were the Spanish, who established the Mission Santa Cruz in 1791. The mission was abandoned in 1834, and the area was subsequently settled by American settlers.
The first post office in the area was established in 1867, and the town was officially named Brookdale in 1872. The name was chosen to honor the local brook that ran through the area.
Geography
Brookdale is located in the Santa Cruz Mountains, approximately 8 miles (13 km) northwest of the city of Santa Cruz. The town is situated at an elevation of 1,000 feet (305 m) above sea level. The area is characterized by rolling hills and redwood forests.
The climate in Brookdale is mild and temperate, with warm summers and cool winters. The average annual temperature is 57°F (14°C), and the average annual precipitation is 33 inches (84 cm).
Economy
The economy of Brookdale is largely based on agriculture and tourism. The town is home to several wineries, and the local vineyards produce a variety of wines, including chardonnay, pinot noir, and zinfandel.
The town is also a popular tourist destination, and is home to several attractions, including the Brookdale Lodge, a historic hotel and restaurant, and the Brookdale Fruit Barn, a roadside stand that sells local produce.
Demographics
As of 2019, the population of Brookdale was estimated to be 1,845. The racial makeup of the town was 79.3% White, 0.7% African American, 0.3% Native American, 0.7% Asian, 0.1% Pacific Islander, and 17.9% from other races. The median household income was $68,750, and the median age was 44.5 years.
Conclusion
Brookdale, California is a small unincorporated community located in Santa Cruz County, California. It is situated in the Santa Cruz Mountains, approximately 8 miles (13 km) northwest of the city of Santa Cruz. The population of Brookdale was estimated to be 1,845 in 2019. The economy of Brookdale is largely based on agriculture and tourism, and the town is home to several wineries and attractions. The racial makeup of the town was 79.3% White, 0.7% African American, 0.3% Native American, 0.7% Asian, 0.1% Pacific Islander, and 17.9% from other races. The median household income was $68,750, and the median age was 44.5 years.
Common Questions
What is Per Capita Income in Brookdale?
Per Capita income in Brookdale is $69,525.
What is the Median Family Income in Brookdale?
Median Family Income in Brookdale is $159,848.
What is the Median Household income in Brookdale?
Median Household Income in Brookdale is $85,294.
What is Inequality or Gini Index in Brookdale?
Inequality or Gini Index in Brookdale is 0.43.
What is the Total Population of Brookdale?
Total Population of Brookdale is 1,128.
What is the Total Male Population of Brookdale?
Total Male Population of Brookdale is 646.
What is the Total Female Population of Brookdale?
Total Female Population of Brookdale is 482.
What is the Ratio of Males per 100 Females in Brookdale?
There are 134.02 Males per 100 Females in Brookdale.
What is the Ratio of Females per 100 Males in Brookdale?
There are 74.61 Females per 100 Males in Brookdale.
What is the Median Population Age in Brookdale?
Median Population Age in Brookdale is 50.9 Years.
What is the Average Family Size in Brookdale
Average Family Size in Brookdale is 2.9 People.
What is the Average Household Size in Brookdale
Average Household Size in Brookdale is 1.9 People.
How Large is the Labor Force in Brookdale?
There are 700 People in the Labor Forcein in Brookdale.
What is the Percentage of People in the Labor Force in Brookdale?
69.0% of People are in the Labor Force in Brookdale.
What is the Unemployment Rate in Brookdale?
Unemployment Rate in Brookdale is 3.4%.