Bradley, CA Map & Demographics
Bradley Map
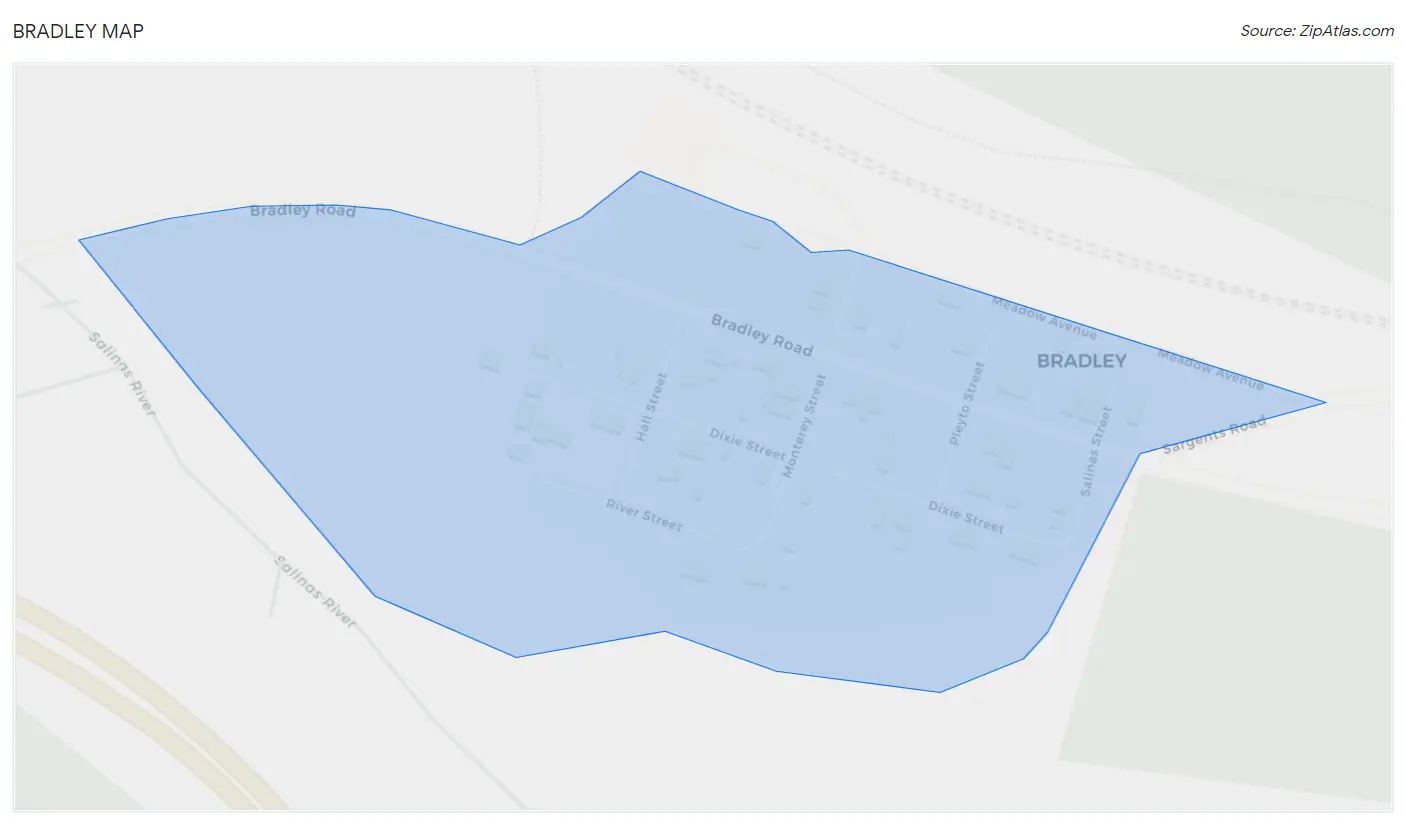
Bradley Overview
$16,028
PER CAPITA INCOME
$41,964
AVG FAMILY INCOME
$41,964
AVG HOUSEHOLD INCOME
0.15
INEQUALITY / GINI INDEX
85
TOTAL POPULATION
32
MALE POPULATION
53
FEMALE POPULATION
60.38
MALES / 100 FEMALES
165.62
FEMALES / 100 MALES
37.6
MEDIAN AGE
2.9
AVG FAMILY SIZE
2.9
AVG HOUSEHOLD SIZE
28
LABOR FORCE [ PEOPLE ]
43.8%
PERCENT IN LABOR FORCE
Bradley Zip Codes
Bradley Area Codes
Income in Bradley
Income Overview in Bradley
Per Capita Income in Bradley is $16,028, while median incomes of families and households are $41,964 and $41,964 respectively.
| Characteristic | Number | Measure |
| Per Capita Income | 85 | $16,028 |
| Median Family Income | 29 | $41,964 |
| Mean Family Income | 29 | $49,179 |
| Median Household Income | 29 | $41,964 |
| Mean Household Income | 29 | $49,179 |
| Income Deficit | 29 | $0 |
| Wage / Income Gap (%) | 85 | 0.00% |
| Wage / Income Gap ($) | 85 | 100.00¢ per $1 |
| Gini / Inequality Index | 85 | 0.15 |
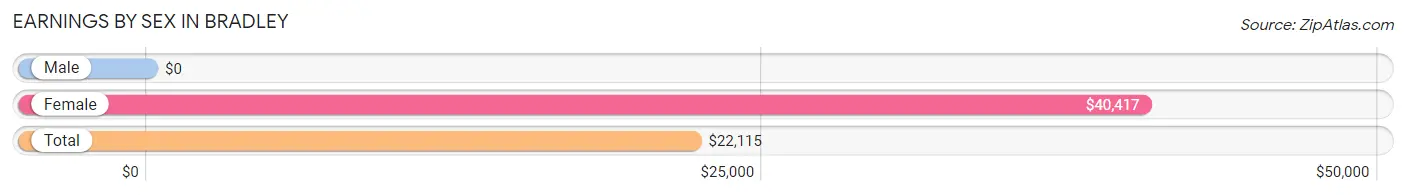
Earnings by Sex in Bradley
| Sex | Number | Average Earnings |
| Male | 13 (46.4%) | $0 |
| Female | 15 (53.6%) | $40,417 |
| Total | 28 (100.0%) | $22,115 |
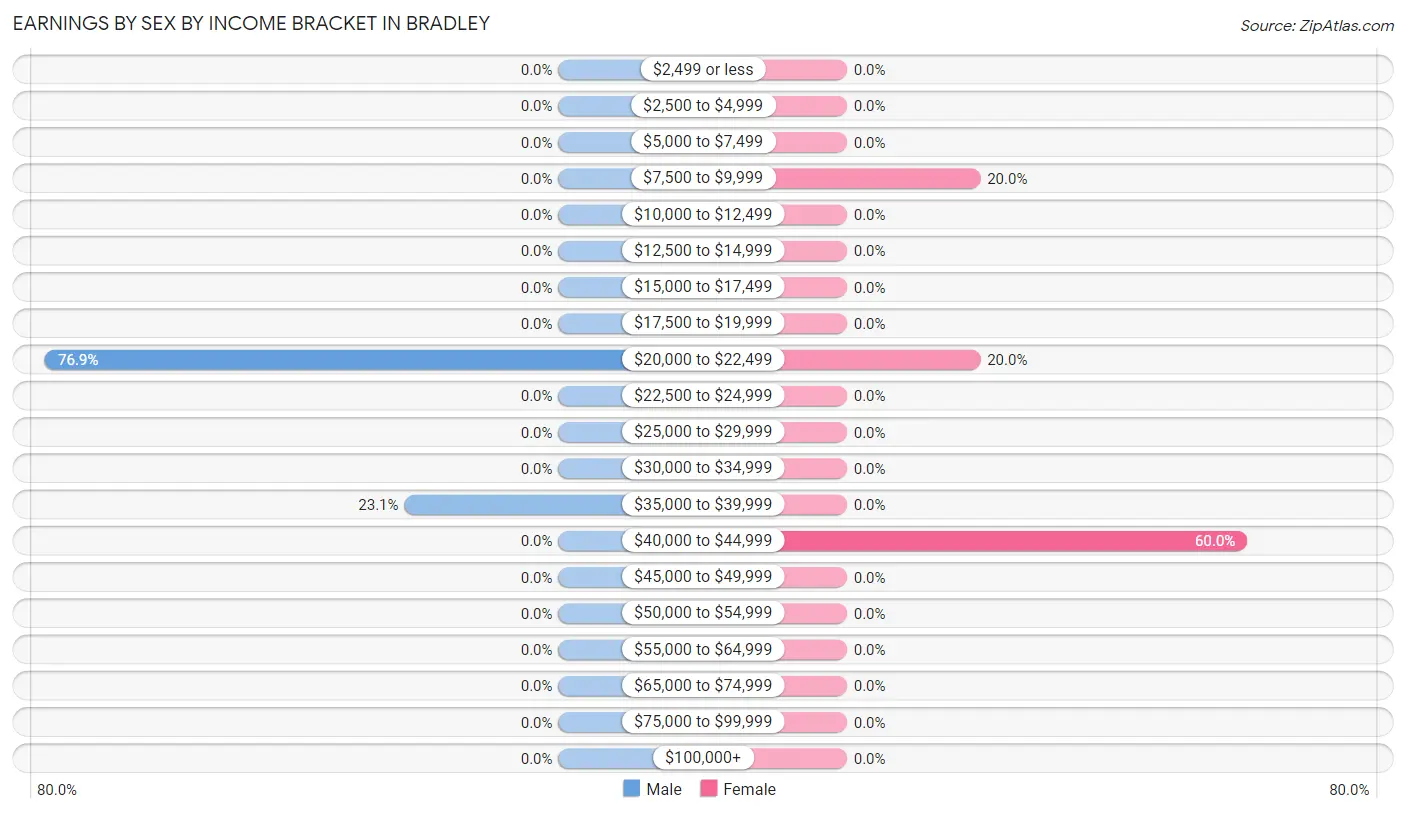
Earnings by Sex by Income Bracket in Bradley
The most common earnings brackets in Bradley are $20,000 to $22,499 for men (10 | 76.9%) and $40,000 to $44,999 for women (9 | 60.0%).
| Income | Male | Female |
| $2,499 or less | 0 (0.0%) | 0 (0.0%) |
| $2,500 to $4,999 | 0 (0.0%) | 0 (0.0%) |
| $5,000 to $7,499 | 0 (0.0%) | 0 (0.0%) |
| $7,500 to $9,999 | 0 (0.0%) | 3 (20.0%) |
| $10,000 to $12,499 | 0 (0.0%) | 0 (0.0%) |
| $12,500 to $14,999 | 0 (0.0%) | 0 (0.0%) |
| $15,000 to $17,499 | 0 (0.0%) | 0 (0.0%) |
| $17,500 to $19,999 | 0 (0.0%) | 0 (0.0%) |
| $20,000 to $22,499 | 10 (76.9%) | 3 (20.0%) |
| $22,500 to $24,999 | 0 (0.0%) | 0 (0.0%) |
| $25,000 to $29,999 | 0 (0.0%) | 0 (0.0%) |
| $30,000 to $34,999 | 0 (0.0%) | 0 (0.0%) |
| $35,000 to $39,999 | 3 (23.1%) | 0 (0.0%) |
| $40,000 to $44,999 | 0 (0.0%) | 9 (60.0%) |
| $45,000 to $49,999 | 0 (0.0%) | 0 (0.0%) |
| $50,000 to $54,999 | 0 (0.0%) | 0 (0.0%) |
| $55,000 to $64,999 | 0 (0.0%) | 0 (0.0%) |
| $65,000 to $74,999 | 0 (0.0%) | 0 (0.0%) |
| $75,000 to $99,999 | 0 (0.0%) | 0 (0.0%) |
| $100,000+ | 0 (0.0%) | 0 (0.0%) |
| Total | 13 (100.0%) | 15 (100.0%) |
Earnings by Sex by Educational Attainment in Bradley
| Educational Attainment | Male Income | Female Income |
| Less than High School | - | - |
| High School Diploma | - | - |
| College or Associate's Degree | - | - |
| Bachelor's Degree | - | - |
| Graduate Degree | - | - |
| Total | - | - |
Family Income in Bradley
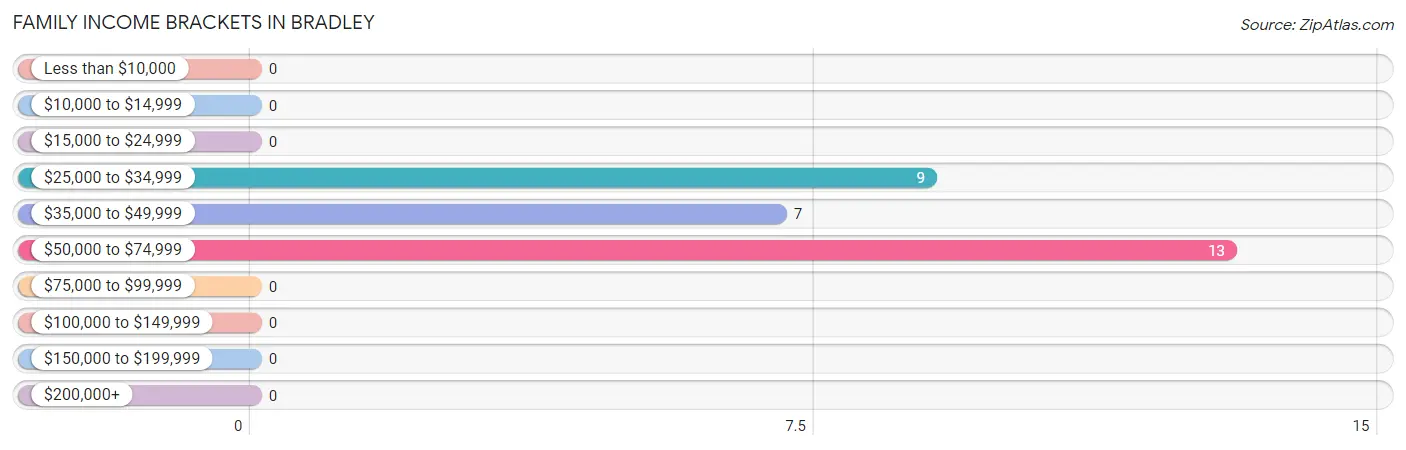
Family Income Brackets in Bradley
According to the Bradley family income data, there are 13 families falling into the $50,000 to $74,999 income range, which is the most common income bracket and makes up 44.8% of all families.
| Income Bracket | # Families | % Families |
| Less than $10,000 | 0 | 0.0% |
| $10,000 to $14,999 | 0 | 0.0% |
| $15,000 to $24,999 | 0 | 0.0% |
| $25,000 to $34,999 | 9 | 31.0% |
| $35,000 to $49,999 | 7 | 24.1% |
| $50,000 to $74,999 | 13 | 44.8% |
| $75,000 to $99,999 | 0 | 0.0% |
| $100,000 to $149,999 | 0 | 0.0% |
| $150,000 to $199,999 | 0 | 0.0% |
| $200,000+ | 0 | 0.0% |
Family Income by Famaliy Size in Bradley
| Income Bracket | # Families | Median Income |
| 2-Person Families | 16 (55.2%) | $0 |
| 3-Person Families | 0 (0.0%) | $0 |
| 4-Person Families | 13 (44.8%) | $0 |
| 5-Person Families | 0 (0.0%) | $0 |
| 6-Person Families | 0 (0.0%) | $0 |
| 7+ Person Families | 0 (0.0%) | $0 |
| Total | 29 (100.0%) | $41,964 |
Family Income by Number of Earners in Bradley
| Number of Earners | # Families | Median Income |
| No Earners | 16 (55.2%) | $0 |
| 1 Earner | 0 (0.0%) | $0 |
| 2 Earners | 10 (34.5%) | $0 |
| 3+ Earners | 3 (10.3%) | $0 |
| Total | 29 (100.0%) | $41,964 |
Household Income in Bradley
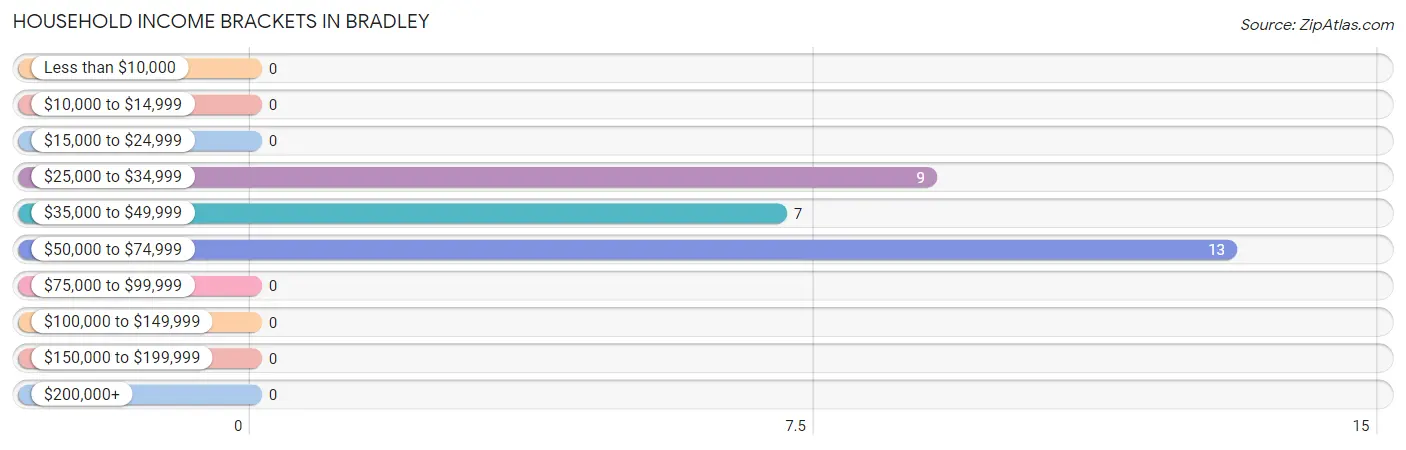
Household Income Brackets in Bradley
With 13 households falling in the category, the $50,000 to $74,999 income range is the most frequent in Bradley, accounting for 44.8% of all households.
| Income Bracket | # Households | % Households |
| Less than $10,000 | 0 | 0.0% |
| $10,000 to $14,999 | 0 | 0.0% |
| $15,000 to $24,999 | 0 | 0.0% |
| $25,000 to $34,999 | 9 | 31.0% |
| $35,000 to $49,999 | 7 | 24.1% |
| $50,000 to $74,999 | 13 | 44.8% |
| $75,000 to $99,999 | 0 | 0.0% |
| $100,000 to $149,999 | 0 | 0.0% |
| $150,000 to $199,999 | 0 | 0.0% |
| $200,000+ | 0 | 0.0% |
Household Income by Householder Age in Bradley
| Income Bracket | # Households | Median Income |
| 15 to 24 Years | 0 (0.0%) | $0 |
| 25 to 44 Years | 10 (34.5%) | $0 |
| 45 to 64 Years | 3 (10.3%) | $0 |
| 65+ Years | 16 (55.2%) | $0 |
| Total | 29 (100.0%) | $41,964 |
Poverty in Bradley
Income Below Poverty by Sex and Age in Bradley
| Age Bracket | Male | Female |
| Under 5 Years | 0 (0.0%) | 0 (0.0%) |
| 5 Years | 0 (0.0%) | 0 (0.0%) |
| 6 to 11 Years | 0 (0.0%) | 0 (0.0%) |
| 12 to 14 Years | 0 (0.0%) | 0 (0.0%) |
| 15 Years | 0 (0.0%) | 0 (0.0%) |
| 16 and 17 Years | 0 (0.0%) | 0 (0.0%) |
| 18 to 24 Years | 0 (0.0%) | 0 (0.0%) |
| 25 to 34 Years | 0 (0.0%) | 0 (0.0%) |
| 35 to 44 Years | 0 (0.0%) | 0 (0.0%) |
| 45 to 54 Years | 0 (0.0%) | 0 (0.0%) |
| 55 to 64 Years | 0 (0.0%) | 0 (0.0%) |
| 65 to 74 Years | 0 (0.0%) | 0 (0.0%) |
| 75 Years and over | 0 (0.0%) | 0 (0.0%) |
| Total | 0 (0.0%) | 0 (0.0%) |
Income Above Poverty by Sex and Age in Bradley
According to the poverty statistics in Bradley, males aged 6 to 11 years and females aged 6 to 11 years are the age groups that are most secure financially, with 100.0% of males and 100.0% of females in these age groups living above the poverty line.
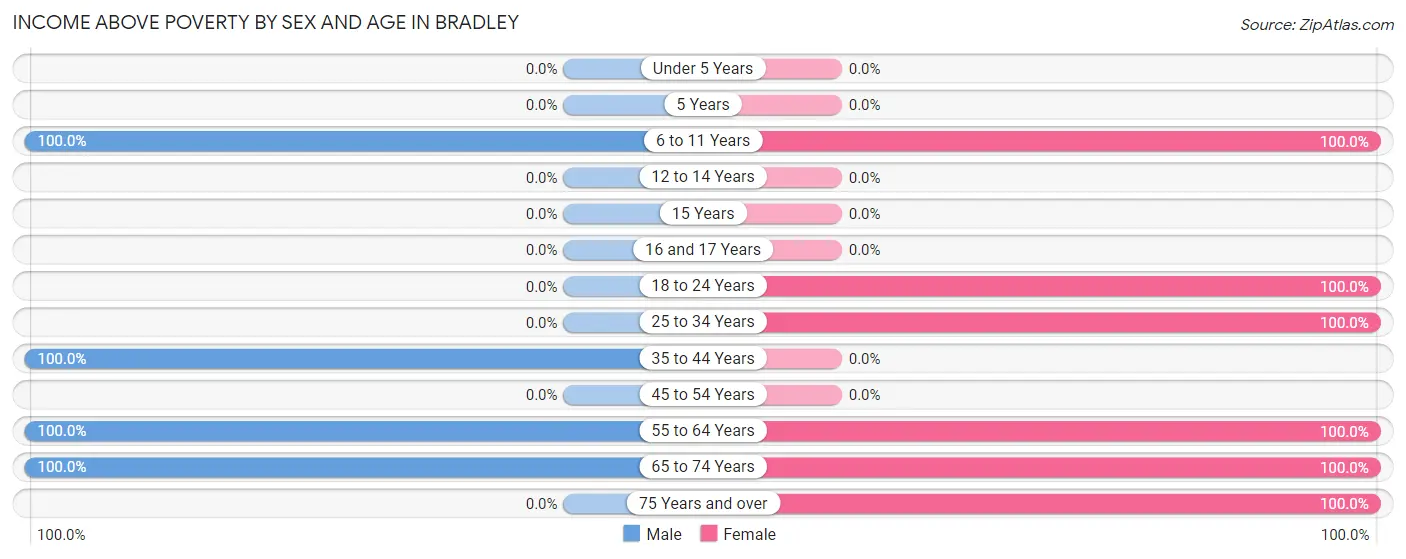
| Age Bracket | Male | Female |
| Under 5 Years | 0 (0.0%) | 0 (0.0%) |
| 5 Years | 0 (0.0%) | 0 (0.0%) |
| 6 to 11 Years | 11 (100.0%) | 10 (100.0%) |
| 12 to 14 Years | 0 (0.0%) | 0 (0.0%) |
| 15 Years | 0 (0.0%) | 0 (0.0%) |
| 16 and 17 Years | 0 (0.0%) | 0 (0.0%) |
| 18 to 24 Years | 0 (0.0%) | 7 (100.0%) |
| 25 to 34 Years | 0 (0.0%) | 9 (100.0%) |
| 35 to 44 Years | 10 (100.0%) | 0 (0.0%) |
| 45 to 54 Years | 0 (0.0%) | 0 (0.0%) |
| 55 to 64 Years | 3 (100.0%) | 11 (100.0%) |
| 65 to 74 Years | 8 (100.0%) | 9 (100.0%) |
| 75 Years and over | 0 (0.0%) | 7 (100.0%) |
| Total | 32 (100.0%) | 53 (100.0%) |
Income Below Poverty Among Married-Couple Families in Bradley
| Children | Above Poverty | Below Poverty |
| No Children | 12 (100.0%) | 0 (0.0%) |
| 1 or 2 Children | 10 (100.0%) | 0 (0.0%) |
| 3 or 4 Children | 0 (0.0%) | 0 (0.0%) |
| 5 or more Children | 0 (0.0%) | 0 (0.0%) |
| Total | 22 (100.0%) | 0 (0.0%) |
Income Below Poverty Among Single-Parent Households in Bradley
| Children | Single Father | Single Mother |
| No Children | 0 (0.0%) | 0 (0.0%) |
| 1 or 2 Children | 0 (0.0%) | 0 (0.0%) |
| 3 or 4 Children | 0 (0.0%) | 0 (0.0%) |
| 5 or more Children | 0 (0.0%) | 0 (0.0%) |
| Total | 0 (0.0%) | 0 (0.0%) |
Income Below Poverty Among Married-Couple vs Single-Parent Households in Bradley
| Children | Married-Couple Families | Single-Parent Households |
| No Children | 0 (0.0%) | 0 (0.0%) |
| 1 or 2 Children | 0 (0.0%) | 0 (0.0%) |
| 3 or 4 Children | 0 (0.0%) | 0 (0.0%) |
| 5 or more Children | 0 (0.0%) | 0 (0.0%) |
| Total | 0 (0.0%) | 0 (0.0%) |
Race in Bradley
The most populous races in Bradley are White / Caucasian (54 | 63.5%), Hispanic or Latino (31 | 36.5%), and Two or more Races (31 | 36.5%).
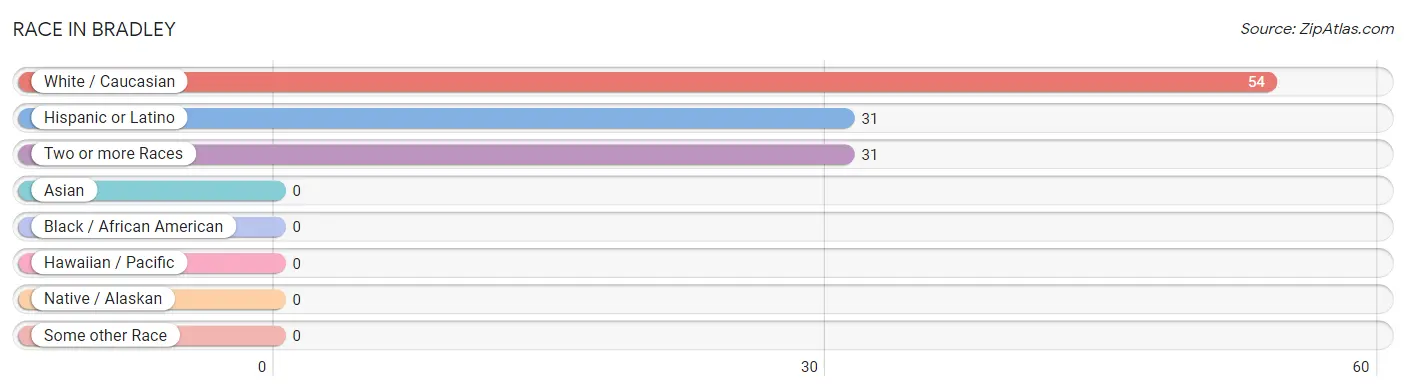
| Race | # Population | % Population |
| Asian | 0 | 0.0% |
| Black / African American | 0 | 0.0% |
| Hawaiian / Pacific | 0 | 0.0% |
| Hispanic or Latino | 31 | 36.5% |
| Native / Alaskan | 0 | 0.0% |
| White / Caucasian | 54 | 63.5% |
| Two or more Races | 31 | 36.5% |
| Some other Race | 0 | 0.0% |
| Total | 85 | 100.0% |
Ancestry in Bradley
The most populous ancestries reported in Bradley are Spanish (21 | 24.7%), Dutch (18 | 21.2%), English (15 | 17.6%), European (10 | 11.8%), and Irish (10 | 11.8%), together accounting for 87.1% of all Bradley residents.
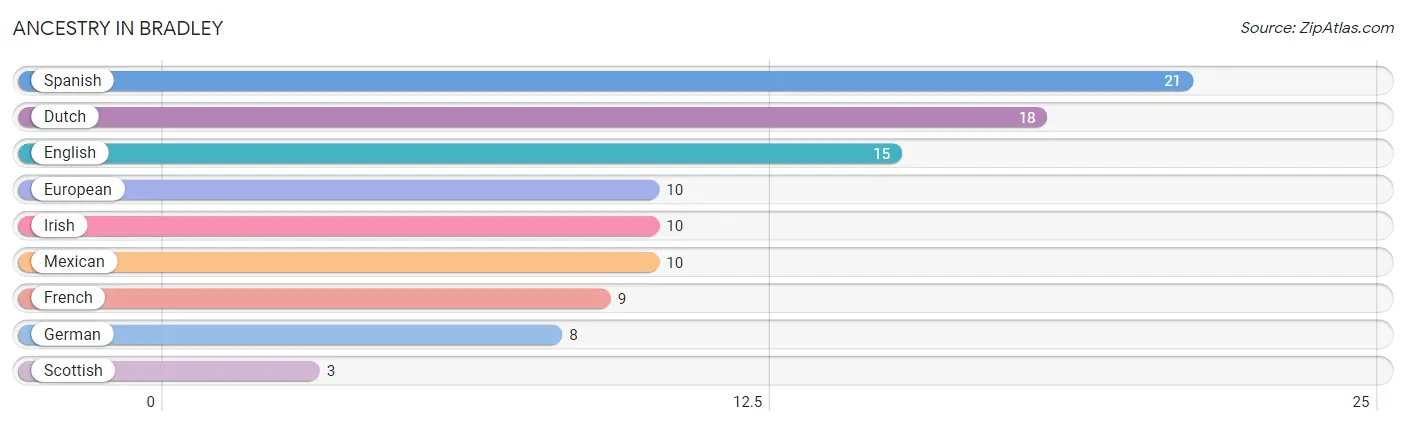
| Ancestry | # Population | % Population |
| Dutch | 18 | 21.2% |
| English | 15 | 17.6% |
| European | 10 | 11.8% |
| French | 9 | 10.6% |
| German | 8 | 9.4% |
| Irish | 10 | 11.8% |
| Mexican | 10 | 11.8% |
| Scottish | 3 | 3.5% |
| Spanish | 21 | 24.7% | View All 9 Rows |
Immigrants in Bradley

| Immigration Origin | # Population | % Population | View All 0 Rows |
Sex and Age in Bradley
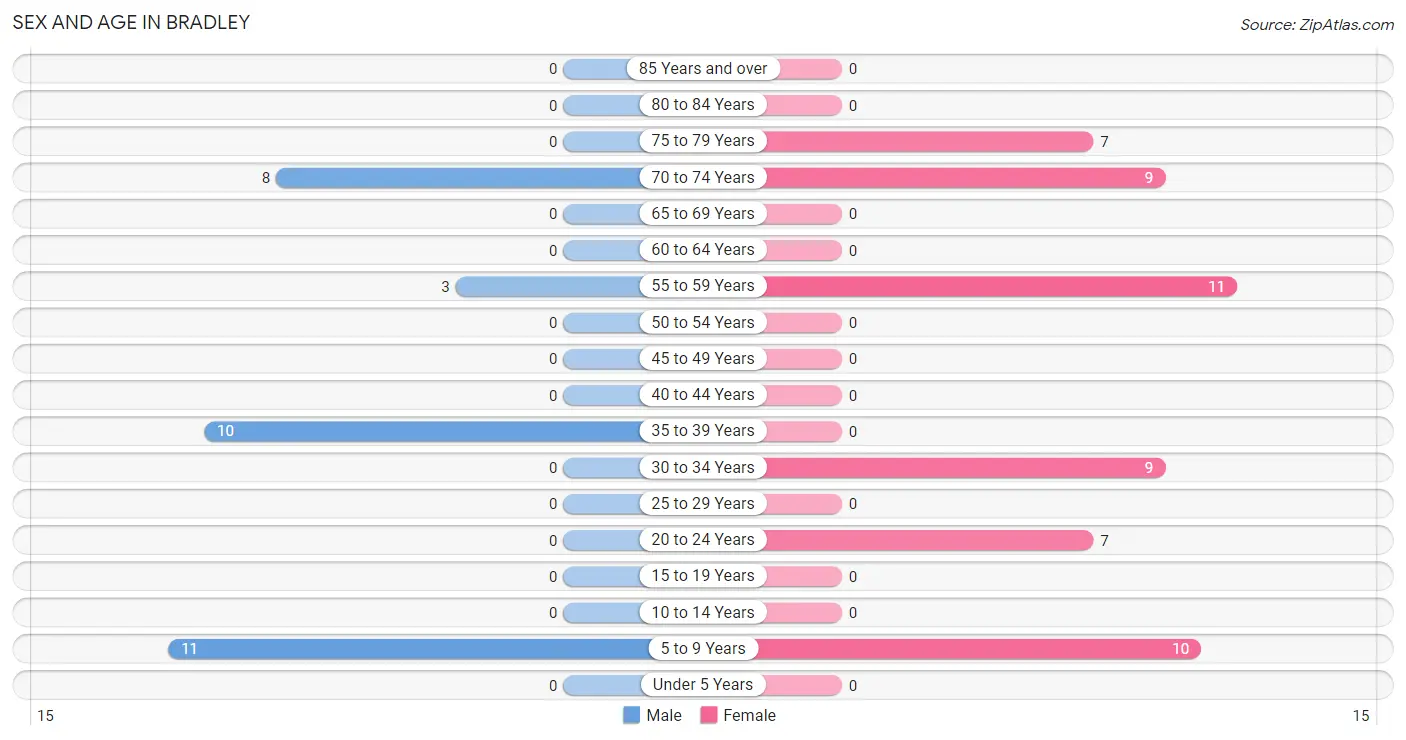
Sex and Age in Bradley
The most populous age groups in Bradley are 5 to 9 Years (11 | 34.4%) for men and 55 to 59 Years (11 | 20.7%) for women.
| Age Bracket | Male | Female |
| Under 5 Years | 0 (0.0%) | 0 (0.0%) |
| 5 to 9 Years | 11 (34.4%) | 10 (18.9%) |
| 10 to 14 Years | 0 (0.0%) | 0 (0.0%) |
| 15 to 19 Years | 0 (0.0%) | 0 (0.0%) |
| 20 to 24 Years | 0 (0.0%) | 7 (13.2%) |
| 25 to 29 Years | 0 (0.0%) | 0 (0.0%) |
| 30 to 34 Years | 0 (0.0%) | 9 (17.0%) |
| 35 to 39 Years | 10 (31.2%) | 0 (0.0%) |
| 40 to 44 Years | 0 (0.0%) | 0 (0.0%) |
| 45 to 49 Years | 0 (0.0%) | 0 (0.0%) |
| 50 to 54 Years | 0 (0.0%) | 0 (0.0%) |
| 55 to 59 Years | 3 (9.4%) | 11 (20.7%) |
| 60 to 64 Years | 0 (0.0%) | 0 (0.0%) |
| 65 to 69 Years | 0 (0.0%) | 0 (0.0%) |
| 70 to 74 Years | 8 (25.0%) | 9 (17.0%) |
| 75 to 79 Years | 0 (0.0%) | 7 (13.2%) |
| 80 to 84 Years | 0 (0.0%) | 0 (0.0%) |
| 85 Years and over | 0 (0.0%) | 0 (0.0%) |
| Total | 32 (100.0%) | 53 (100.0%) |
Families and Households in Bradley
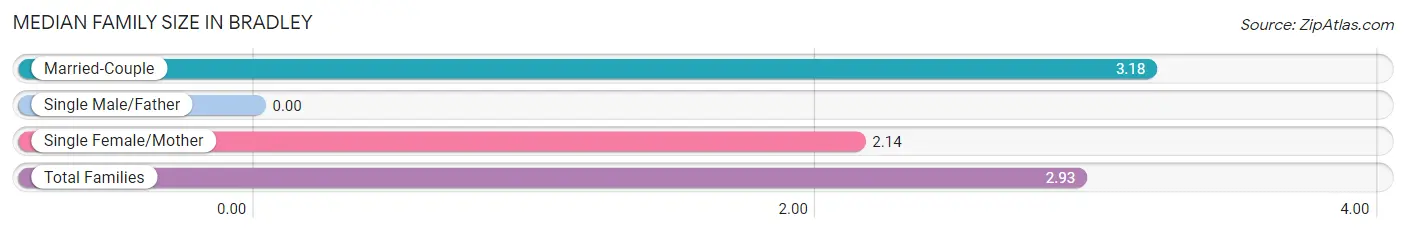
Median Family Size in Bradley
| Family Type | # Families | Family Size |
| Married-Couple | 22 (75.9%) | 3.18 |
| Single Male/Father | 0 (0.0%) | - |
| Single Female/Mother | 7 (24.1%) | 2.14 |
| Total Families | 29 (100.0%) | 2.93 |
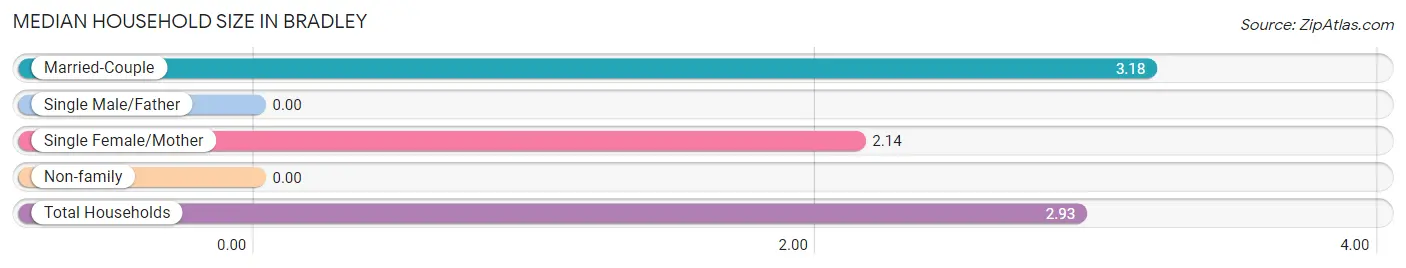
Median Household Size in Bradley
| Household Type | # Households | Household Size |
| Married-Couple | 22 (75.9%) | 3.18 |
| Single Male/Father | 0 (0.0%) | - |
| Single Female/Mother | 7 (24.1%) | 2.14 |
| Non-family | 0 (0.0%) | - |
| Total Households | 29 (100.0%) | 2.93 |
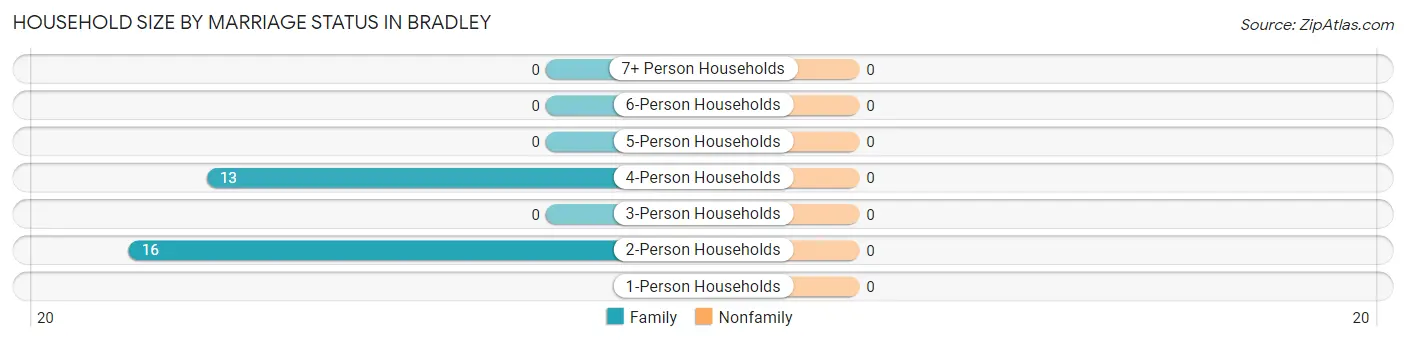
Household Size by Marriage Status in Bradley
| Household Size | Family Households | Nonfamily Households |
| 1-Person Households | - | 0 (0.0%) |
| 2-Person Households | 16 (55.2%) | 0 (0.0%) |
| 3-Person Households | 0 (0.0%) | 0 (0.0%) |
| 4-Person Households | 13 (44.8%) | 0 (0.0%) |
| 5-Person Households | 0 (0.0%) | 0 (0.0%) |
| 6-Person Households | 0 (0.0%) | 0 (0.0%) |
| 7+ Person Households | 0 (0.0%) | 0 (0.0%) |
| Total | 29 (100.0%) | 0 (0.0%) |
Female Fertility in Bradley
Fertility by Age in Bradley
| Age Bracket | Women with Births | Births / 1,000 Women |
| 15 to 19 years | 0 (0.0%) | 0.0 |
| 20 to 34 years | 0 (0.0%) | 0.0 |
| 35 to 50 years | 0 (0.0%) | 0.0 |
| Total | 0 (0.0%) | 0.0 |
Fertility by Age by Marriage Status in Bradley
| Age Bracket | Married | Unmarried |
| 15 to 19 years | 0 (0.0%) | 0 (0.0%) |
| 20 to 34 years | 0 (0.0%) | 0 (0.0%) |
| 35 to 50 years | 0 (0.0%) | 0 (0.0%) |
| Total | 0 (0.0%) | 0 (0.0%) |
Fertility by Education in Bradley
| Educational Attainment | Women with Births | Births / 1,000 Women |
| Less than High School | 0 (0.0%) | 0.0 |
| High School Diploma | 0 (0.0%) | 0.0 |
| College or Associate's Degree | 0 (0.0%) | 0.0 |
| Bachelor's Degree | 0 (0.0%) | 0.0 |
| Graduate Degree | 0 (0.0%) | 0.0 |
| Total | 0 (0.0%) | 0.0 |
Fertility by Education by Marriage Status in Bradley
| Educational Attainment | Married | Unmarried |
| Less than High School | 0 (0.0%) | 0 (0.0%) |
| High School Diploma | 0 (0.0%) | 0 (0.0%) |
| College or Associate's Degree | 0 (0.0%) | 0 (0.0%) |
| Bachelor's Degree | 0 (0.0%) | 0 (0.0%) |
| Graduate Degree | 0 (0.0%) | 0 (0.0%) |
| Total | 0 (0.0%) | 0 (0.0%) |
Employment Characteristics in Bradley
Employment by Class of Employer in Bradley
Among the 28 employed individuals in Bradley, private company employees (25 | 89.3%), and self-employed (not incorporated) (3 | 10.7%) make up the most common classes of employment.
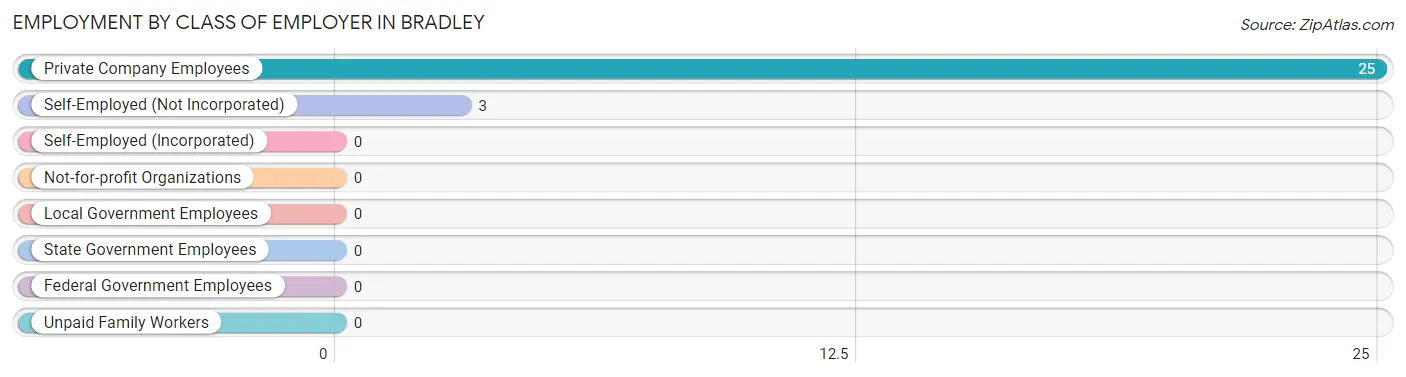
| Employer Class | # Employees | % Employees |
| Private Company Employees | 25 | 89.3% |
| Self-Employed (Incorporated) | 0 | 0.0% |
| Self-Employed (Not Incorporated) | 3 | 10.7% |
| Not-for-profit Organizations | 0 | 0.0% |
| Local Government Employees | 0 | 0.0% |
| State Government Employees | 0 | 0.0% |
| Federal Government Employees | 0 | 0.0% |
| Unpaid Family Workers | 0 | 0.0% |
| Total | 28 | 100.0% |
Employment Status by Age in Bradley
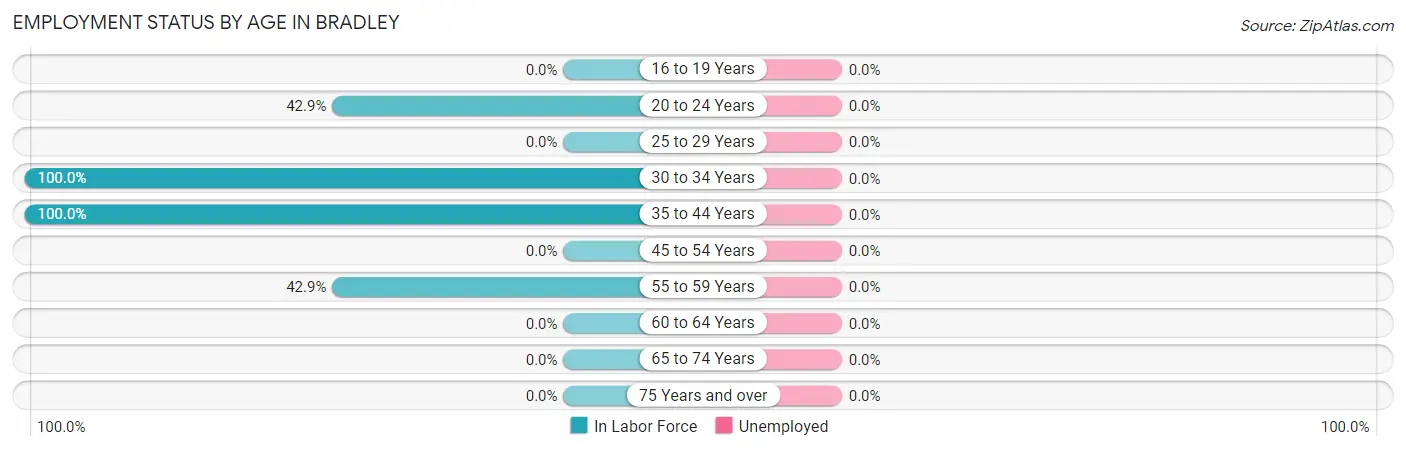
| Age Bracket | In Labor Force | Unemployed |
| 16 to 19 Years | 0 (0.0%) | 0 (0.0%) |
| 20 to 24 Years | 3 (42.9%) | 0 (0.0%) |
| 25 to 29 Years | 0 (0.0%) | 0 (0.0%) |
| 30 to 34 Years | 9 (100.0%) | 0 (0.0%) |
| 35 to 44 Years | 10 (100.0%) | 0 (0.0%) |
| 45 to 54 Years | 0 (0.0%) | 0 (0.0%) |
| 55 to 59 Years | 6 (42.9%) | 0 (0.0%) |
| 60 to 64 Years | 0 (0.0%) | 0 (0.0%) |
| 65 to 74 Years | 0 (0.0%) | 0 (0.0%) |
| 75 Years and over | 0 (0.0%) | 0 (0.0%) |
| Total | 28 (43.8%) | 0 (0.0%) |
Employment Status by Educational Attainment in Bradley
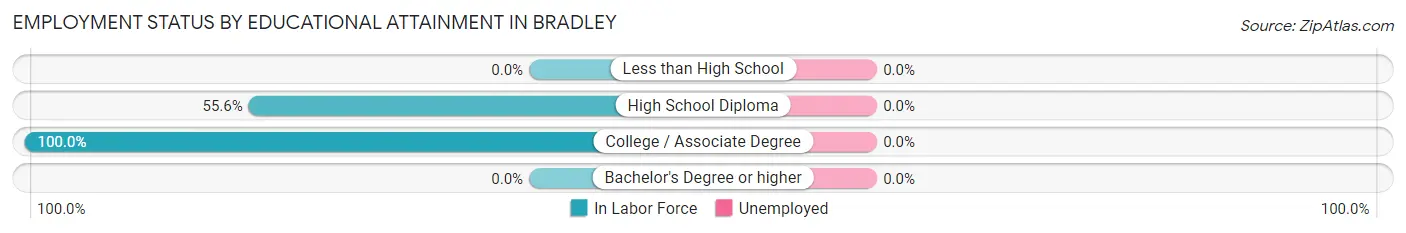
| Educational Attainment | In Labor Force | Unemployed |
| Less than High School | 0 (0.0%) | 0 (0.0%) |
| High School Diploma | 10 (55.6%) | 0 (0.0%) |
| College / Associate Degree | 15 (100.0%) | 0 (0.0%) |
| Bachelor's Degree or higher | 0 (0.0%) | 0 (0.0%) |
| Total | 25 (75.8%) | 0 (0.0%) |
Employment Occupations by Sex in Bradley
Management, Business, Science and Arts Occupations
The most common Management, Business, Science and Arts occupations in Bradley are Business & Financial (3 | 10.7%), Computers, Engineering & Science (3 | 10.7%), and Computers & Mathematics (3 | 10.7%).
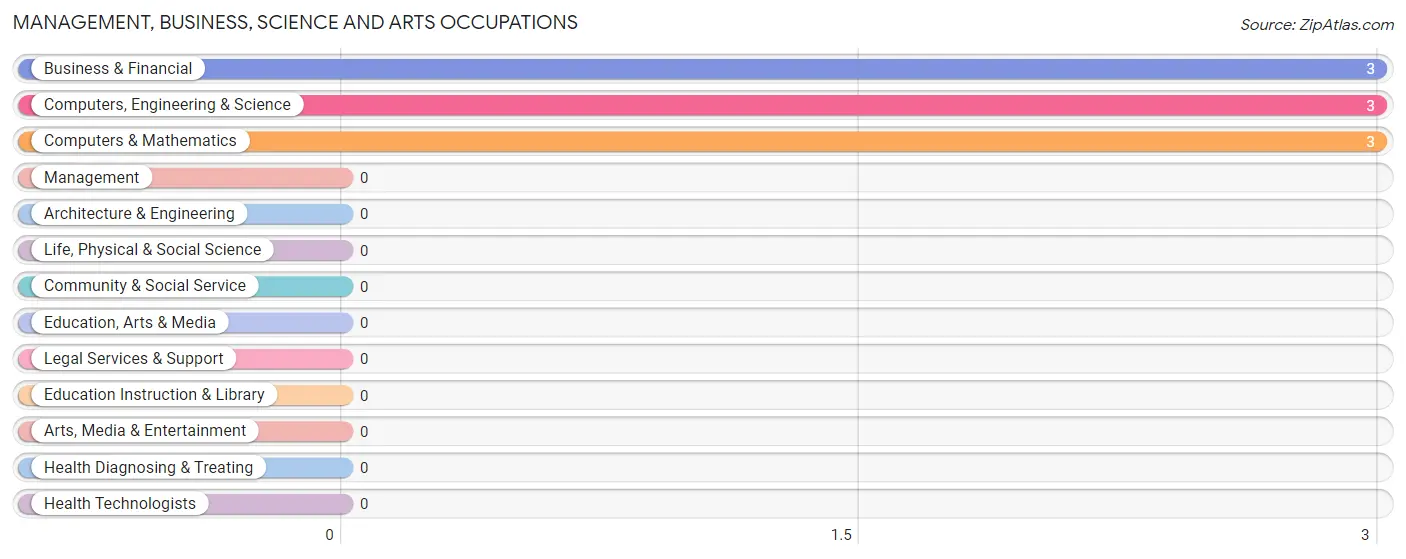
Management, Business, Science and Arts Occupations by Sex
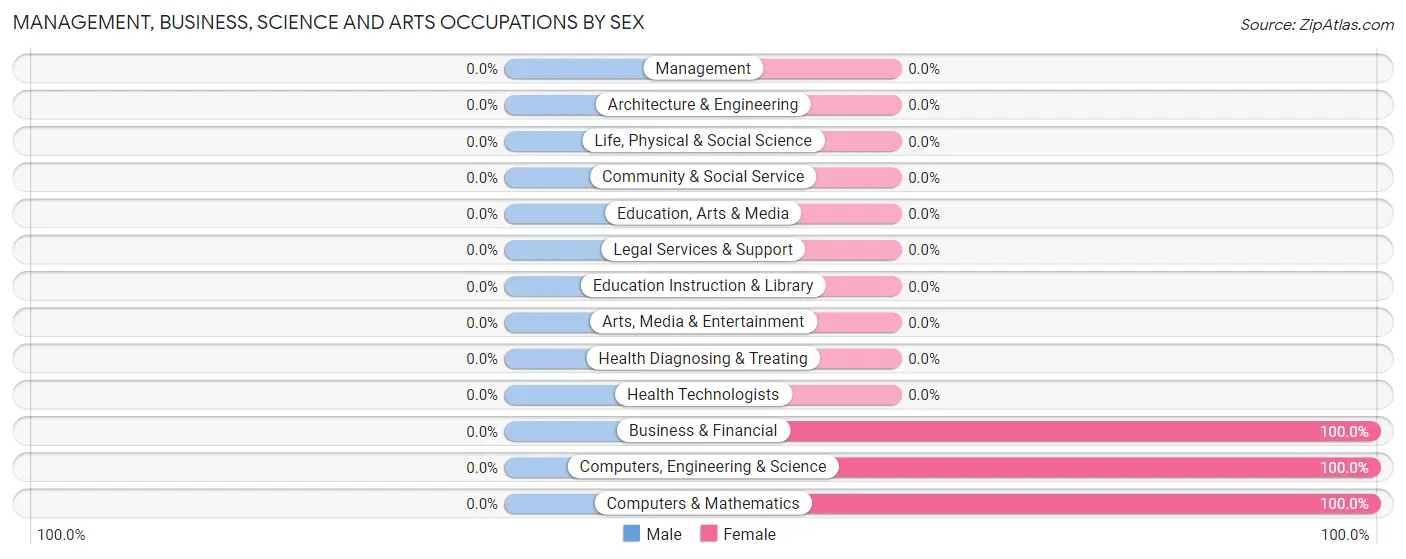
| Occupation | Male | Female |
| Management | 0 (0.0%) | 0 (0.0%) |
| Business & Financial | 0 (0.0%) | 3 (100.0%) |
| Computers, Engineering & Science | 0 (0.0%) | 3 (100.0%) |
| Computers & Mathematics | 0 (0.0%) | 3 (100.0%) |
| Architecture & Engineering | 0 (0.0%) | 0 (0.0%) |
| Life, Physical & Social Science | 0 (0.0%) | 0 (0.0%) |
| Community & Social Service | 0 (0.0%) | 0 (0.0%) |
| Education, Arts & Media | 0 (0.0%) | 0 (0.0%) |
| Legal Services & Support | 0 (0.0%) | 0 (0.0%) |
| Education Instruction & Library | 0 (0.0%) | 0 (0.0%) |
| Arts, Media & Entertainment | 0 (0.0%) | 0 (0.0%) |
| Health Diagnosing & Treating | 0 (0.0%) | 0 (0.0%) |
| Health Technologists | 0 (0.0%) | 0 (0.0%) |
| Total (Category) | 0 (0.0%) | 6 (100.0%) |
| Total (Overall) | 13 (46.4%) | 15 (53.6%) |
Services Occupations
The most common Services occupations in Bradley are , and Food Preparation & Serving (9 | 32.1%).
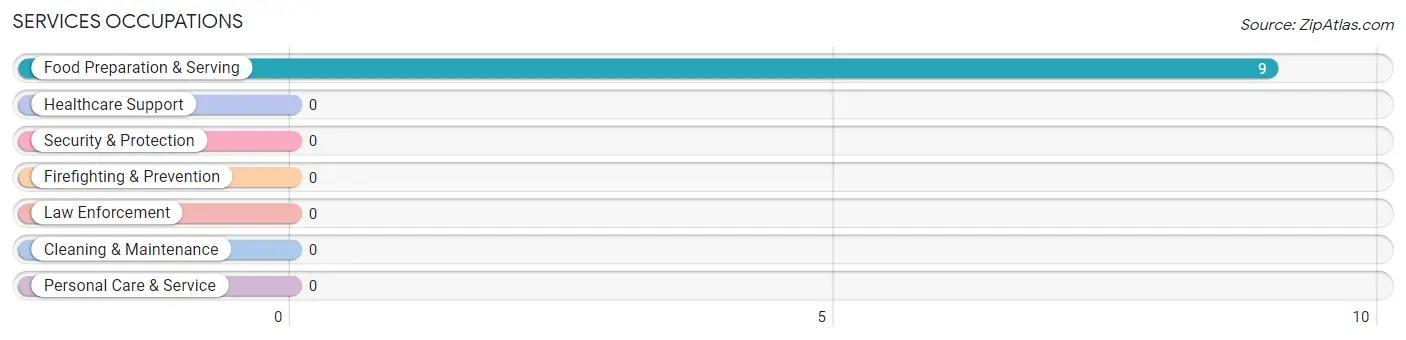
Services Occupations by Sex
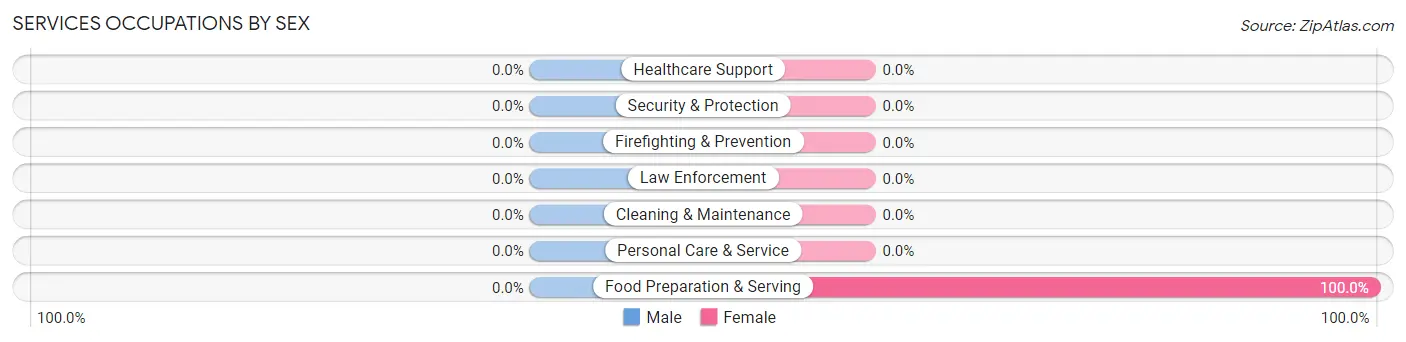
| Occupation | Male | Female |
| Healthcare Support | 0 (0.0%) | 0 (0.0%) |
| Security & Protection | 0 (0.0%) | 0 (0.0%) |
| Firefighting & Prevention | 0 (0.0%) | 0 (0.0%) |
| Law Enforcement | 0 (0.0%) | 0 (0.0%) |
| Food Preparation & Serving | 0 (0.0%) | 9 (100.0%) |
| Cleaning & Maintenance | 0 (0.0%) | 0 (0.0%) |
| Personal Care & Service | 0 (0.0%) | 0 (0.0%) |
| Total (Category) | 0 (0.0%) | 9 (100.0%) |
| Total (Overall) | 13 (46.4%) | 15 (53.6%) |
Sales and Office Occupations
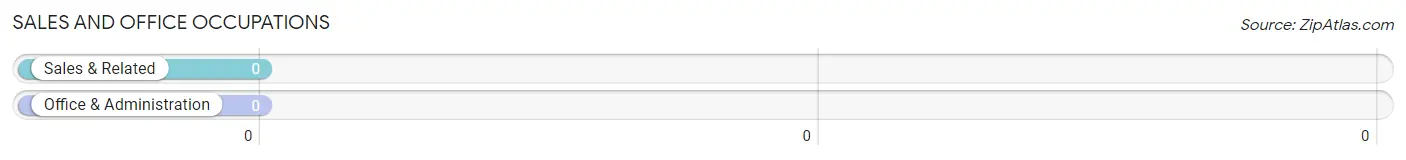
Sales and Office Occupations by Sex
| Occupation | Male | Female |
| Sales & Related | 0 (0.0%) | 0 (0.0%) |
| Office & Administration | 0 (0.0%) | 0 (0.0%) |
| Total (Category) | 0 (0.0%) | 0 (0.0%) |
| Total (Overall) | 13 (46.4%) | 15 (53.6%) |
Natural Resources, Construction and Maintenance Occupations
The most common Natural Resources, Construction and Maintenance occupations in Bradley are , and Construction & Extraction (3 | 10.7%).
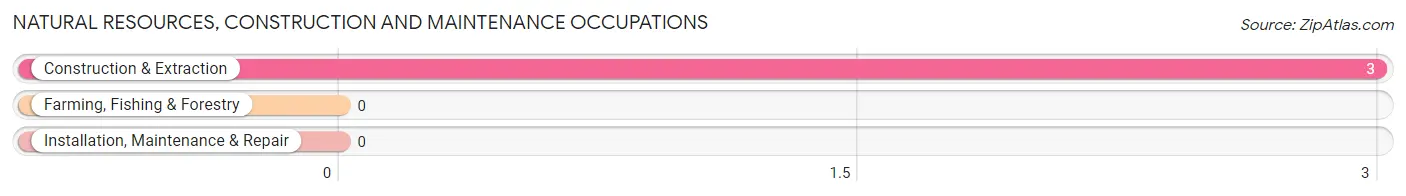
Natural Resources, Construction and Maintenance Occupations by Sex
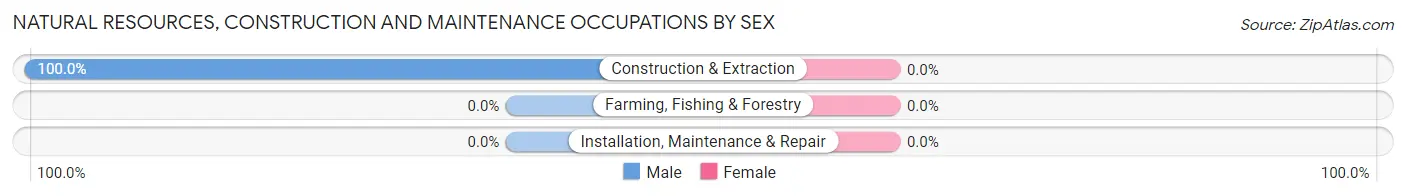
| Occupation | Male | Female |
| Farming, Fishing & Forestry | 0 (0.0%) | 0 (0.0%) |
| Construction & Extraction | 3 (100.0%) | 0 (0.0%) |
| Installation, Maintenance & Repair | 0 (0.0%) | 0 (0.0%) |
| Total (Category) | 3 (100.0%) | 0 (0.0%) |
| Total (Overall) | 13 (46.4%) | 15 (53.6%) |
Production, Transportation and Moving Occupations
The most common Production, Transportation and Moving occupations in Bradley are , and Transportation (10 | 35.7%).
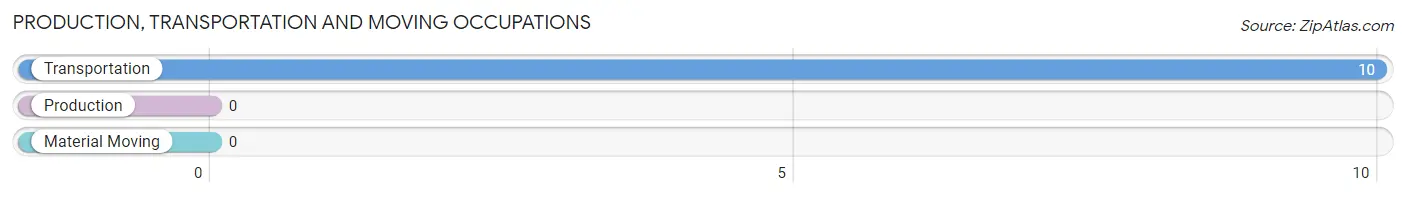
Production, Transportation and Moving Occupations by Sex
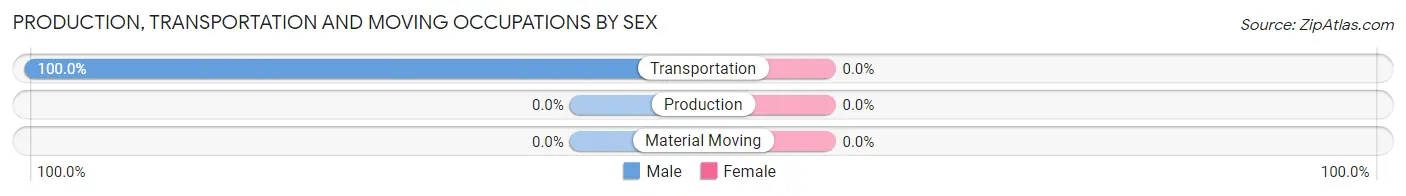
| Occupation | Male | Female |
| Production | 0 (0.0%) | 0 (0.0%) |
| Transportation | 10 (100.0%) | 0 (0.0%) |
| Material Moving | 0 (0.0%) | 0 (0.0%) |
| Total (Category) | 10 (100.0%) | 0 (0.0%) |
| Total (Overall) | 13 (46.4%) | 15 (53.6%) |
Employment Industries by Sex in Bradley
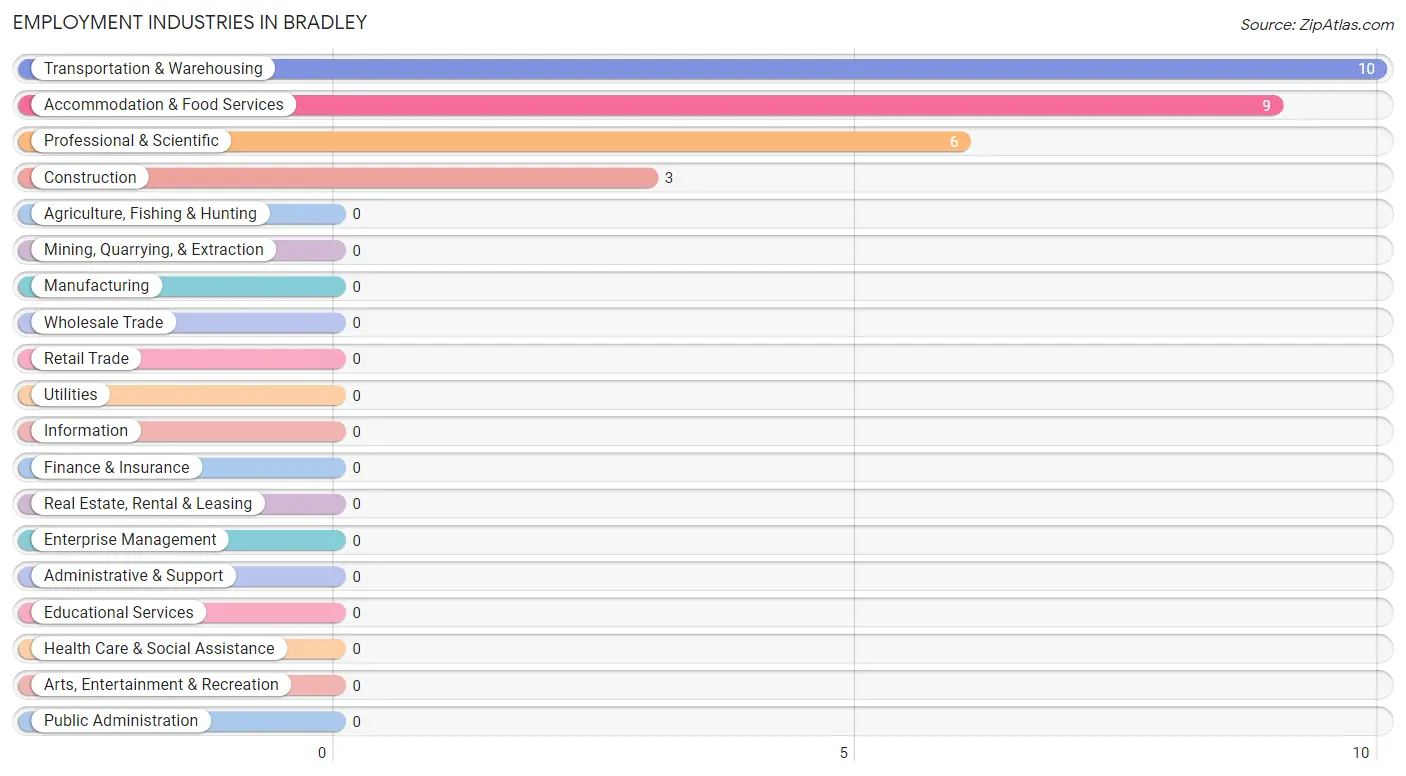
Employment Industries in Bradley
The major employment industries in Bradley include Transportation & Warehousing (10 | 35.7%), Accommodation & Food Services (9 | 32.1%), Professional & Scientific (6 | 21.4%), and Construction (3 | 10.7%).
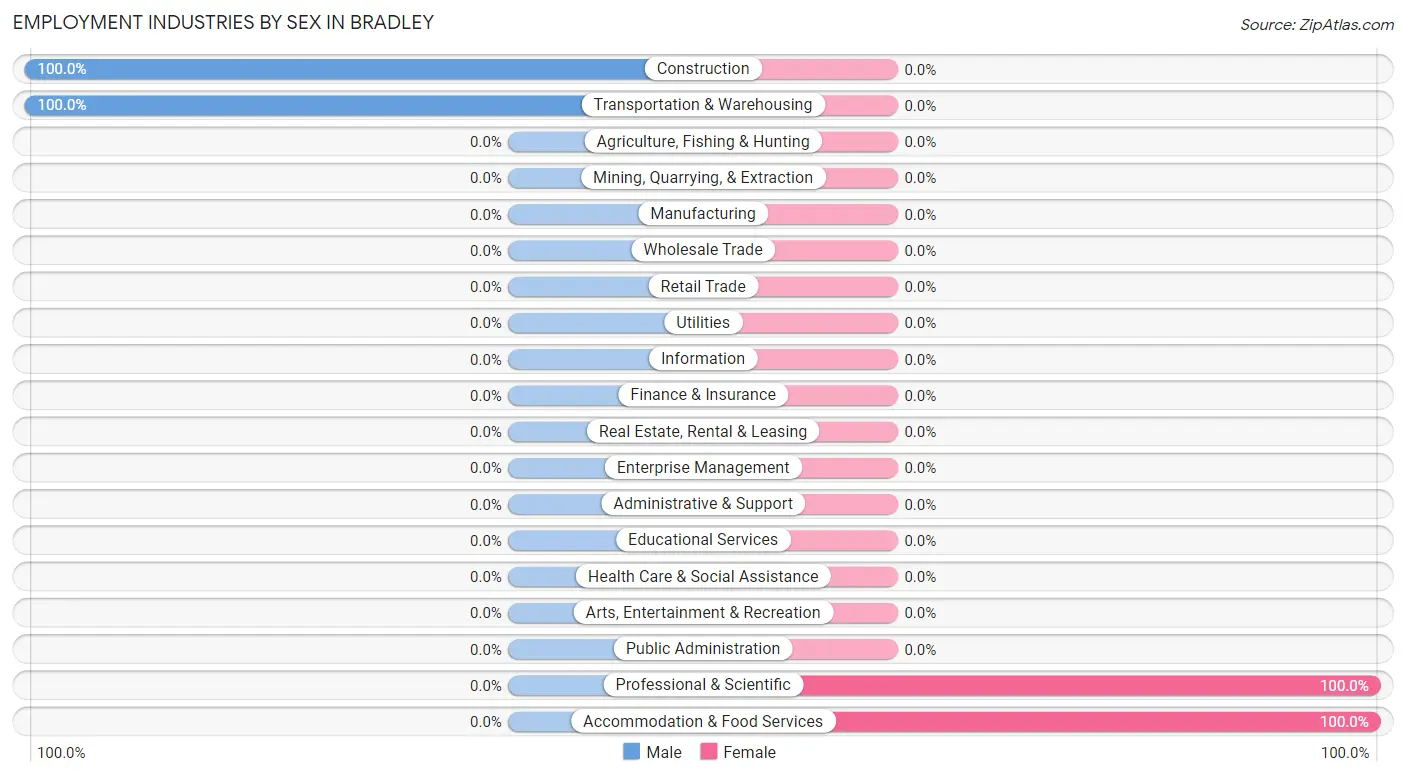
Employment Industries by Sex in Bradley
The Bradley industries that see more men than women are Construction (100.0%), and Transportation & Warehousing (100.0%), whereas the industries that tend to have a higher number of women are Professional & Scientific (100.0%), and Accommodation & Food Services (100.0%).
| Industry | Male | Female |
| Agriculture, Fishing & Hunting | 0 (0.0%) | 0 (0.0%) |
| Mining, Quarrying, & Extraction | 0 (0.0%) | 0 (0.0%) |
| Construction | 3 (100.0%) | 0 (0.0%) |
| Manufacturing | 0 (0.0%) | 0 (0.0%) |
| Wholesale Trade | 0 (0.0%) | 0 (0.0%) |
| Retail Trade | 0 (0.0%) | 0 (0.0%) |
| Transportation & Warehousing | 10 (100.0%) | 0 (0.0%) |
| Utilities | 0 (0.0%) | 0 (0.0%) |
| Information | 0 (0.0%) | 0 (0.0%) |
| Finance & Insurance | 0 (0.0%) | 0 (0.0%) |
| Real Estate, Rental & Leasing | 0 (0.0%) | 0 (0.0%) |
| Professional & Scientific | 0 (0.0%) | 6 (100.0%) |
| Enterprise Management | 0 (0.0%) | 0 (0.0%) |
| Administrative & Support | 0 (0.0%) | 0 (0.0%) |
| Educational Services | 0 (0.0%) | 0 (0.0%) |
| Health Care & Social Assistance | 0 (0.0%) | 0 (0.0%) |
| Arts, Entertainment & Recreation | 0 (0.0%) | 0 (0.0%) |
| Accommodation & Food Services | 0 (0.0%) | 9 (100.0%) |
| Public Administration | 0 (0.0%) | 0 (0.0%) |
| Total | 13 (46.4%) | 15 (53.6%) |
Education in Bradley
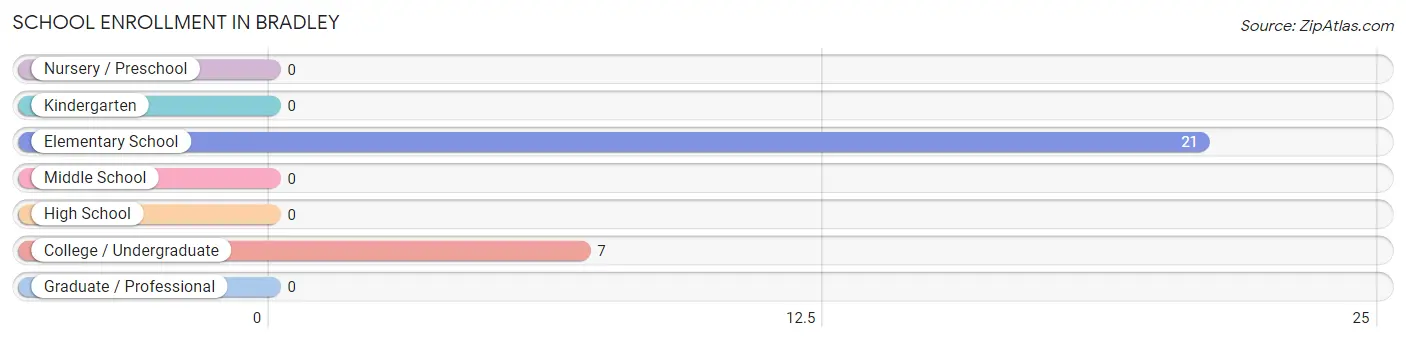
School Enrollment in Bradley
The most common levels of schooling among the 28 students in Bradley are elementary school (21 | 75.0%), and college / undergraduate (7 | 25.0%).
| School Level | # Students | % Students |
| Nursery / Preschool | 0 | 0.0% |
| Kindergarten | 0 | 0.0% |
| Elementary School | 21 | 75.0% |
| Middle School | 0 | 0.0% |
| High School | 0 | 0.0% |
| College / Undergraduate | 7 | 25.0% |
| Graduate / Professional | 0 | 0.0% |
| Total | 28 | 100.0% |
School Enrollment by Age by Funding Source in Bradley
Out of a total of 28 students who are enrolled in schools in Bradley, 10 (35.7%) attend a private institution, while the remaining 18 (64.3%) are enrolled in public schools. The age group of 5 to 9 year old has the highest likelihood of being enrolled in private schools, with 10 (47.6% in the age bracket) enrolled. Conversely, the age group of 20 to 24 year olds has the lowest likelihood of being enrolled in a private school, with 7 (100.0% in the age bracket) attending a public institution.
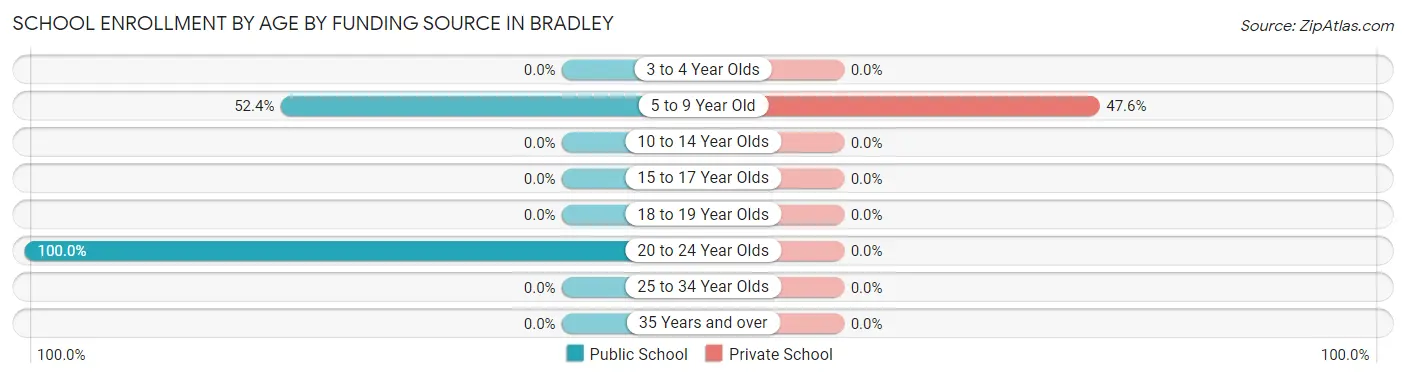
| Age Bracket | Public School | Private School |
| 3 to 4 Year Olds | 0 (0.0%) | 0 (0.0%) |
| 5 to 9 Year Old | 11 (52.4%) | 10 (47.6%) |
| 10 to 14 Year Olds | 0 (0.0%) | 0 (0.0%) |
| 15 to 17 Year Olds | 0 (0.0%) | 0 (0.0%) |
| 18 to 19 Year Olds | 0 (0.0%) | 0 (0.0%) |
| 20 to 24 Year Olds | 7 (100.0%) | 0 (0.0%) |
| 25 to 34 Year Olds | 0 (0.0%) | 0 (0.0%) |
| 35 Years and over | 0 (0.0%) | 0 (0.0%) |
| Total | 18 (64.3%) | 10 (35.7%) |
Educational Attainment by Field of Study in Bradley
| Field of Study | # Graduates | % Graduates |
| Computers & Mathematics | 0 | 0.0% |
| Bio, Nature & Agricultural | 0 | 0.0% |
| Physical & Health Sciences | 0 | 0.0% |
| Psychology | 0 | 0.0% |
| Social Sciences | 0 | 0.0% |
| Engineering | 0 | 0.0% |
| Multidisciplinary Studies | 0 | 0.0% |
| Science & Technology | 0 | 0.0% |
| Business | 0 | 0.0% |
| Education | 0 | 0.0% |
| Literature & Languages | 0 | 0.0% |
| Liberal Arts & History | 0 | 0.0% |
| Visual & Performing Arts | 0 | 0.0% |
| Communications | 0 | 0.0% |
| Arts & Humanities | 0 | 0.0% |
| Total | 0 | 0.0% |
Transportation & Commute in Bradley
Vehicle Availability by Sex in Bradley
The most prevalent vehicle ownership categories in Bradley are males with 2 vehicles (10, accounting for 76.9%) and females with 2 vehicles (9, making up 66.7%).
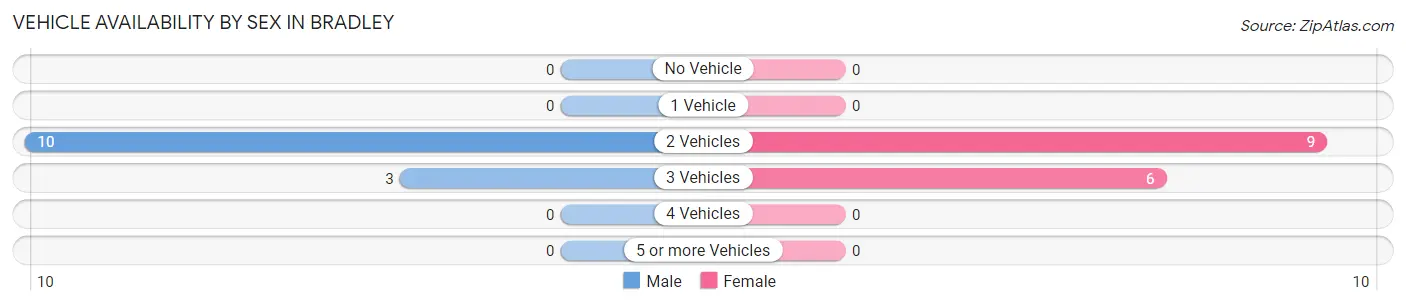
| Vehicles Available | Male | Female |
| No Vehicle | 0 (0.0%) | 0 (0.0%) |
| 1 Vehicle | 0 (0.0%) | 0 (0.0%) |
| 2 Vehicles | 10 (76.9%) | 9 (60.0%) |
| 3 Vehicles | 3 (23.1%) | 6 (40.0%) |
| 4 Vehicles | 0 (0.0%) | 0 (0.0%) |
| 5 or more Vehicles | 0 (0.0%) | 0 (0.0%) |
| Total | 13 (100.0%) | 15 (100.0%) |
Commute Time in Bradley
The most frequently occuring commute durations in Bradley are 20 to 24 minutes (10 commuters, 52.6%), 10 to 14 minutes (3 commuters, 15.8%), and 15 to 19 minutes (3 commuters, 15.8%).
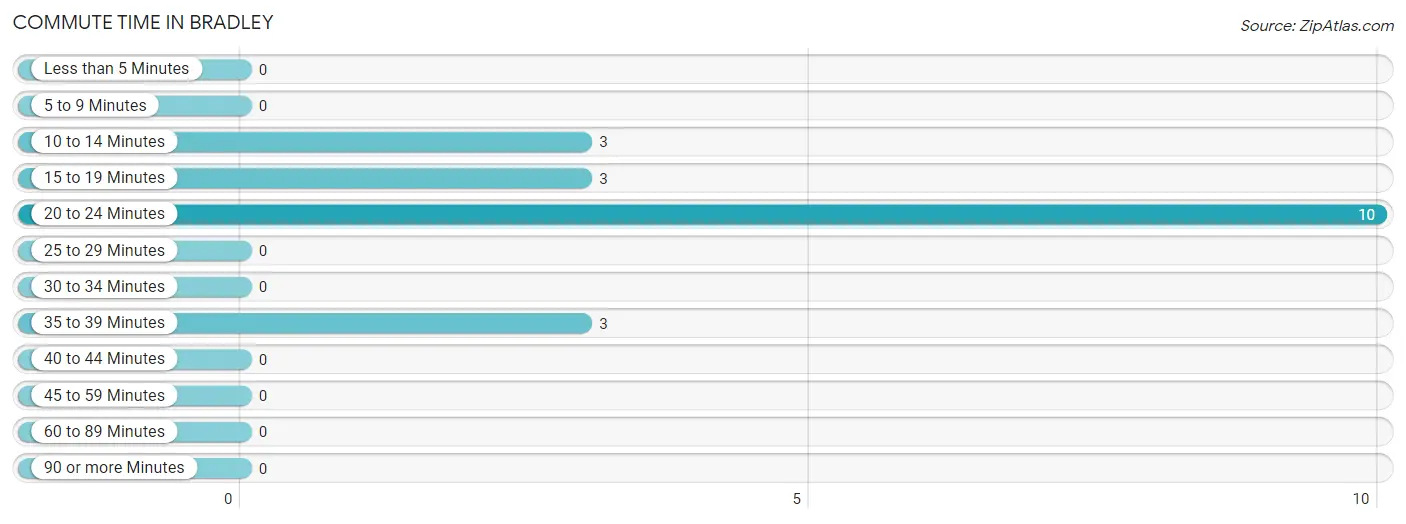
| Commute Time | # Commuters | % Commuters |
| Less than 5 Minutes | 0 | 0.0% |
| 5 to 9 Minutes | 0 | 0.0% |
| 10 to 14 Minutes | 3 | 15.8% |
| 15 to 19 Minutes | 3 | 15.8% |
| 20 to 24 Minutes | 10 | 52.6% |
| 25 to 29 Minutes | 0 | 0.0% |
| 30 to 34 Minutes | 0 | 0.0% |
| 35 to 39 Minutes | 3 | 15.8% |
| 40 to 44 Minutes | 0 | 0.0% |
| 45 to 59 Minutes | 0 | 0.0% |
| 60 to 89 Minutes | 0 | 0.0% |
| 90 or more Minutes | 0 | 0.0% |
Commute Time by Sex in Bradley
The most common commute times in Bradley are 20 to 24 minutes (10 commuters, 76.9%) for males and 10 to 14 minutes (3 commuters, 50.0%) for females.
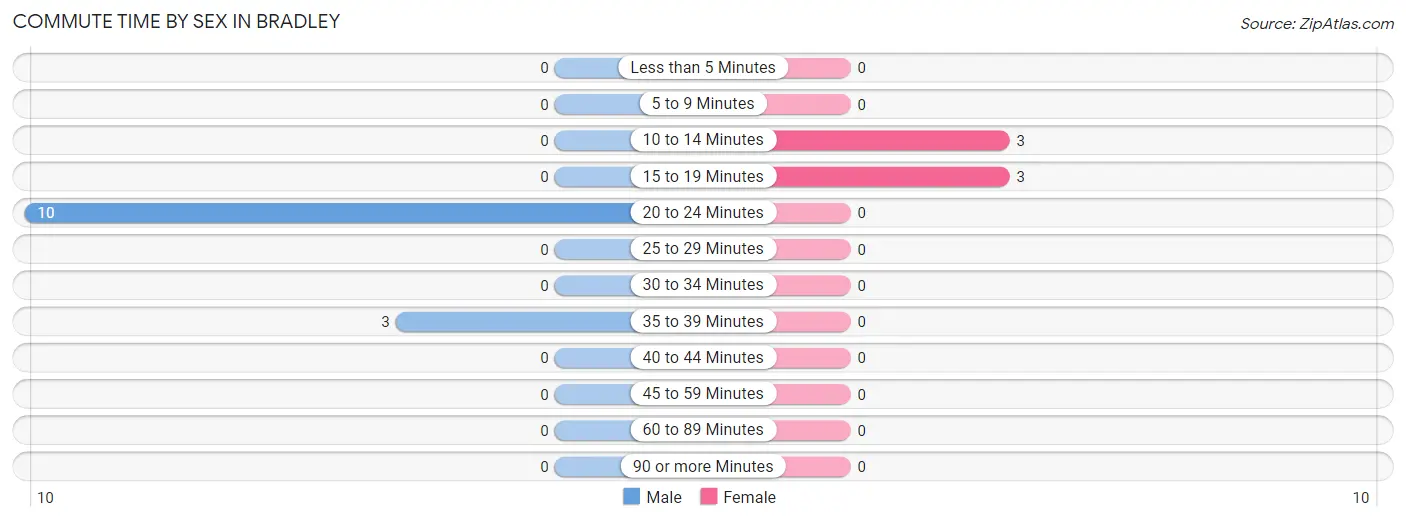
| Commute Time | Male | Female |
| Less than 5 Minutes | 0 (0.0%) | 0 (0.0%) |
| 5 to 9 Minutes | 0 (0.0%) | 0 (0.0%) |
| 10 to 14 Minutes | 0 (0.0%) | 3 (50.0%) |
| 15 to 19 Minutes | 0 (0.0%) | 3 (50.0%) |
| 20 to 24 Minutes | 10 (76.9%) | 0 (0.0%) |
| 25 to 29 Minutes | 0 (0.0%) | 0 (0.0%) |
| 30 to 34 Minutes | 0 (0.0%) | 0 (0.0%) |
| 35 to 39 Minutes | 3 (23.1%) | 0 (0.0%) |
| 40 to 44 Minutes | 0 (0.0%) | 0 (0.0%) |
| 45 to 59 Minutes | 0 (0.0%) | 0 (0.0%) |
| 60 to 89 Minutes | 0 (0.0%) | 0 (0.0%) |
| 90 or more Minutes | 0 (0.0%) | 0 (0.0%) |
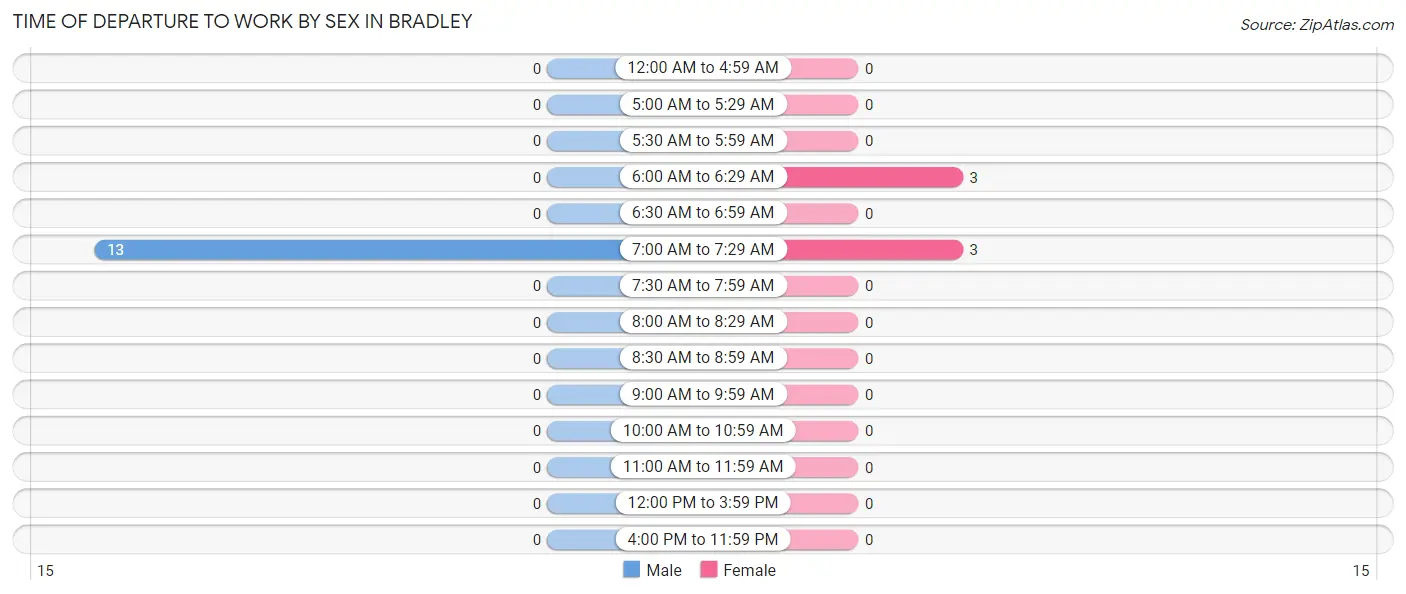
Time of Departure to Work by Sex in Bradley
The most frequent times of departure to work in Bradley are 7:00 AM to 7:29 AM (13, 100.0%) for males and 6:00 AM to 6:29 AM (3, 50.0%) for females.
| Time of Departure | Male | Female |
| 12:00 AM to 4:59 AM | 0 (0.0%) | 0 (0.0%) |
| 5:00 AM to 5:29 AM | 0 (0.0%) | 0 (0.0%) |
| 5:30 AM to 5:59 AM | 0 (0.0%) | 0 (0.0%) |
| 6:00 AM to 6:29 AM | 0 (0.0%) | 3 (50.0%) |
| 6:30 AM to 6:59 AM | 0 (0.0%) | 0 (0.0%) |
| 7:00 AM to 7:29 AM | 13 (100.0%) | 3 (50.0%) |
| 7:30 AM to 7:59 AM | 0 (0.0%) | 0 (0.0%) |
| 8:00 AM to 8:29 AM | 0 (0.0%) | 0 (0.0%) |
| 8:30 AM to 8:59 AM | 0 (0.0%) | 0 (0.0%) |
| 9:00 AM to 9:59 AM | 0 (0.0%) | 0 (0.0%) |
| 10:00 AM to 10:59 AM | 0 (0.0%) | 0 (0.0%) |
| 11:00 AM to 11:59 AM | 0 (0.0%) | 0 (0.0%) |
| 12:00 PM to 3:59 PM | 0 (0.0%) | 0 (0.0%) |
| 4:00 PM to 11:59 PM | 0 (0.0%) | 0 (0.0%) |
| Total | 13 (100.0%) | 6 (100.0%) |
Housing Occupancy in Bradley
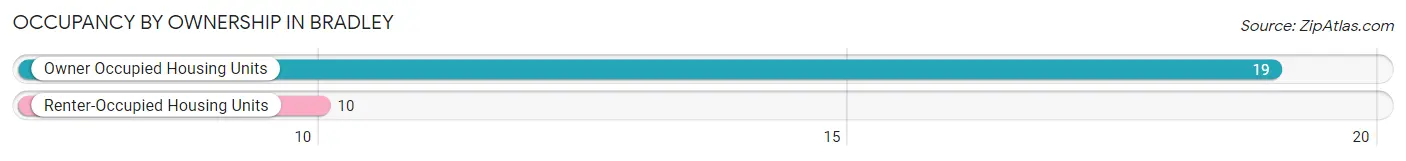
Occupancy by Ownership in Bradley
Of the total 29 dwellings in Bradley, owner-occupied units account for 19 (65.5%), while renter-occupied units make up 10 (34.5%).
| Occupancy | # Housing Units | % Housing Units |
| Owner Occupied Housing Units | 19 | 65.5% |
| Renter-Occupied Housing Units | 10 | 34.5% |
| Total Occupied Housing Units | 29 | 100.0% |
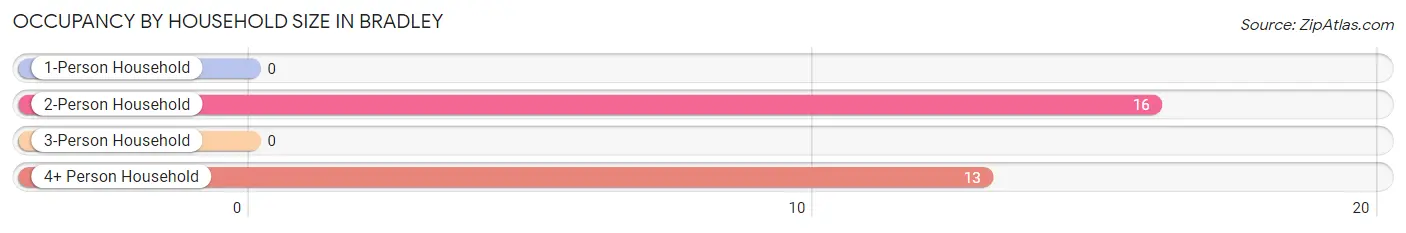
Occupancy by Household Size in Bradley
| Household Size | # Housing Units | % Housing Units |
| 1-Person Household | 0 | 0.0% |
| 2-Person Household | 16 | 55.2% |
| 3-Person Household | 0 | 0.0% |
| 4+ Person Household | 13 | 44.8% |
| Total Housing Units | 29 | 100.0% |
Occupancy by Ownership by Household Size in Bradley
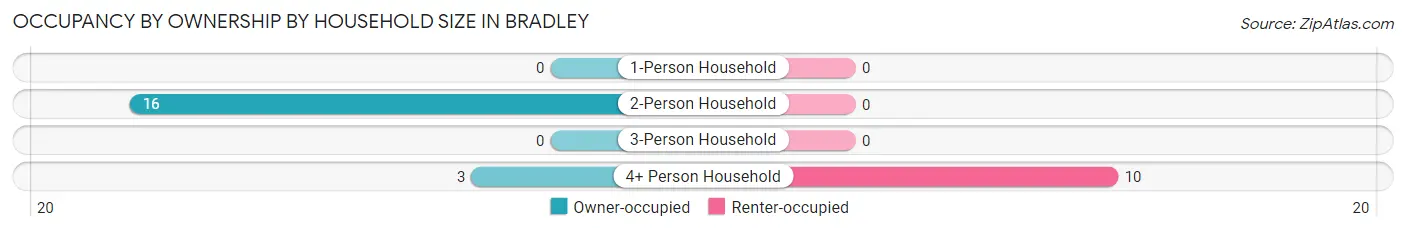
| Household Size | Owner-occupied | Renter-occupied |
| 1-Person Household | 0 (0.0%) | 0 (0.0%) |
| 2-Person Household | 16 (100.0%) | 0 (0.0%) |
| 3-Person Household | 0 (0.0%) | 0 (0.0%) |
| 4+ Person Household | 3 (23.1%) | 10 (76.9%) |
| Total Housing Units | 19 (65.5%) | 10 (34.5%) |
Occupancy by Educational Attainment in Bradley
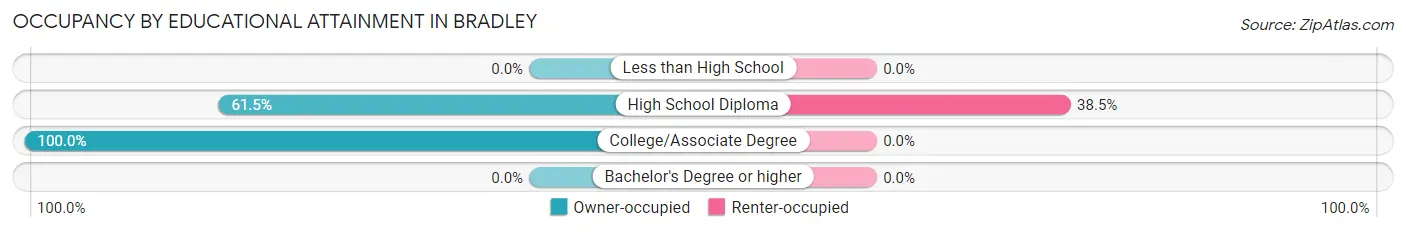
| Household Size | Owner-occupied | Renter-occupied |
| Less than High School | 0 (0.0%) | 0 (0.0%) |
| High School Diploma | 16 (61.5%) | 10 (38.5%) |
| College/Associate Degree | 3 (100.0%) | 0 (0.0%) |
| Bachelor's Degree or higher | 0 (0.0%) | 0 (0.0%) |
Occupancy by Age of Householder in Bradley
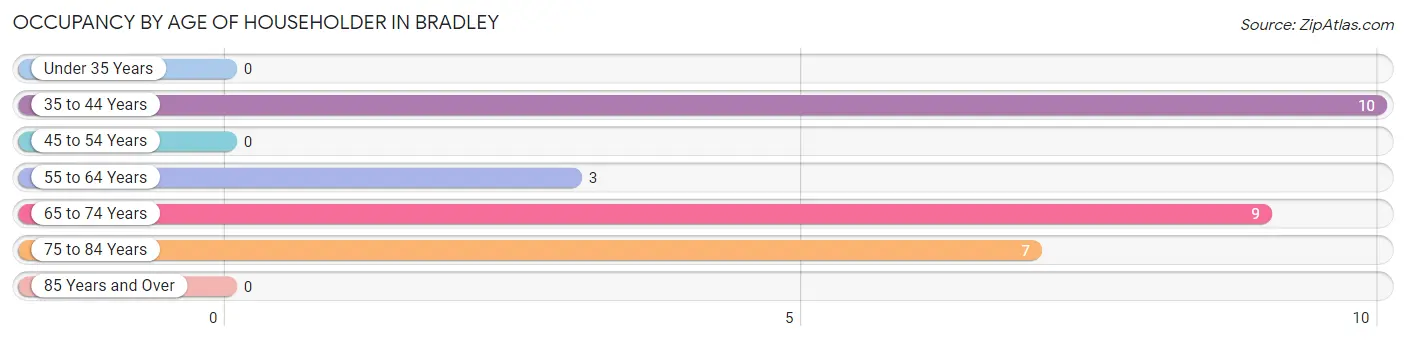
| Age Bracket | # Households | % Households |
| Under 35 Years | 0 | 0.0% |
| 35 to 44 Years | 10 | 34.5% |
| 45 to 54 Years | 0 | 0.0% |
| 55 to 64 Years | 3 | 10.3% |
| 65 to 74 Years | 9 | 31.0% |
| 75 to 84 Years | 7 | 24.1% |
| 85 Years and Over | 0 | 0.0% |
| Total | 29 | 100.0% |
Housing Finances in Bradley
Median Income by Occupancy in Bradley
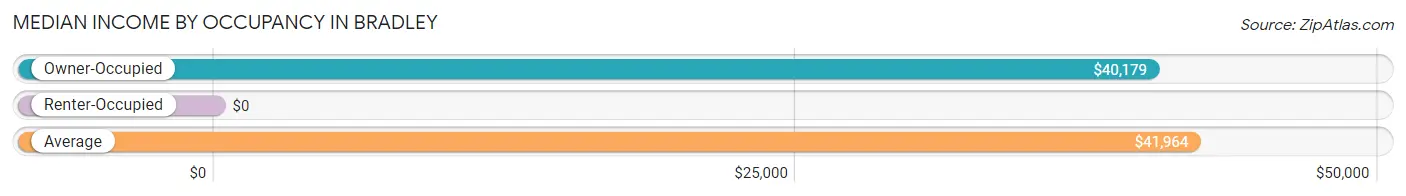
| Occupancy Type | # Households | Median Income |
| Owner-Occupied | 19 (65.5%) | $40,179 |
| Renter-Occupied | 10 (34.5%) | $0 |
| Average | 29 (100.0%) | $41,964 |
Occupancy by Householder Income Bracket in Bradley
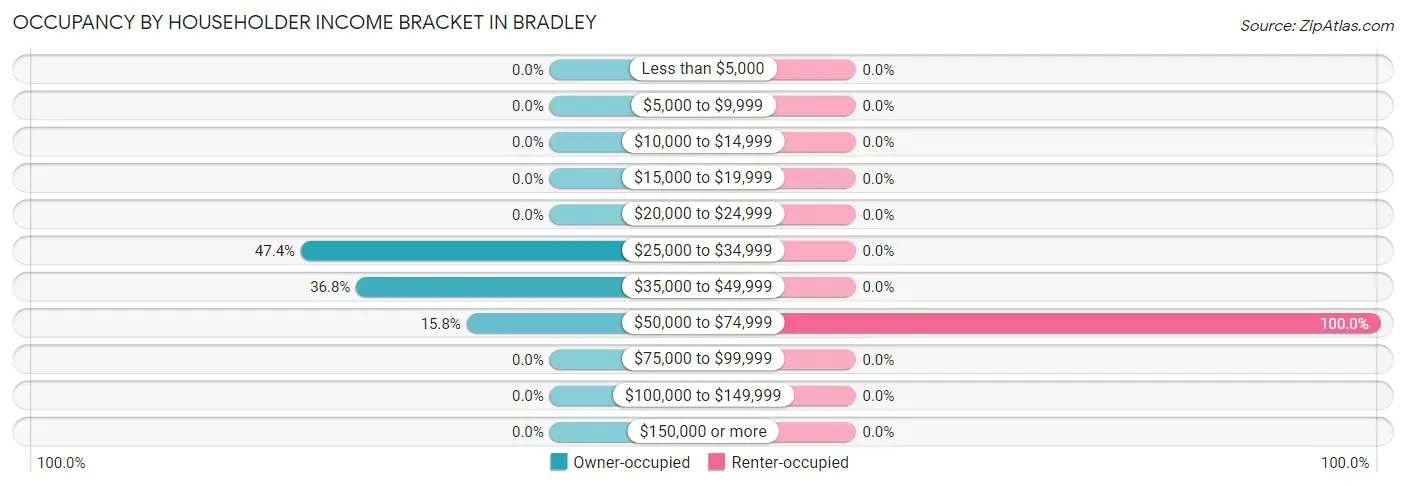
| Income Bracket | Owner-occupied | Renter-occupied |
| Less than $5,000 | 0 (0.0%) | 0 (0.0%) |
| $5,000 to $9,999 | 0 (0.0%) | 0 (0.0%) |
| $10,000 to $14,999 | 0 (0.0%) | 0 (0.0%) |
| $15,000 to $19,999 | 0 (0.0%) | 0 (0.0%) |
| $20,000 to $24,999 | 0 (0.0%) | 0 (0.0%) |
| $25,000 to $34,999 | 9 (47.4%) | 0 (0.0%) |
| $35,000 to $49,999 | 7 (36.8%) | 0 (0.0%) |
| $50,000 to $74,999 | 3 (15.8%) | 10 (100.0%) |
| $75,000 to $99,999 | 0 (0.0%) | 0 (0.0%) |
| $100,000 to $149,999 | 0 (0.0%) | 0 (0.0%) |
| $150,000 or more | 0 (0.0%) | 0 (0.0%) |
| Total | 19 (100.0%) | 10 (100.0%) |
Monthly Housing Cost Tiers in Bradley
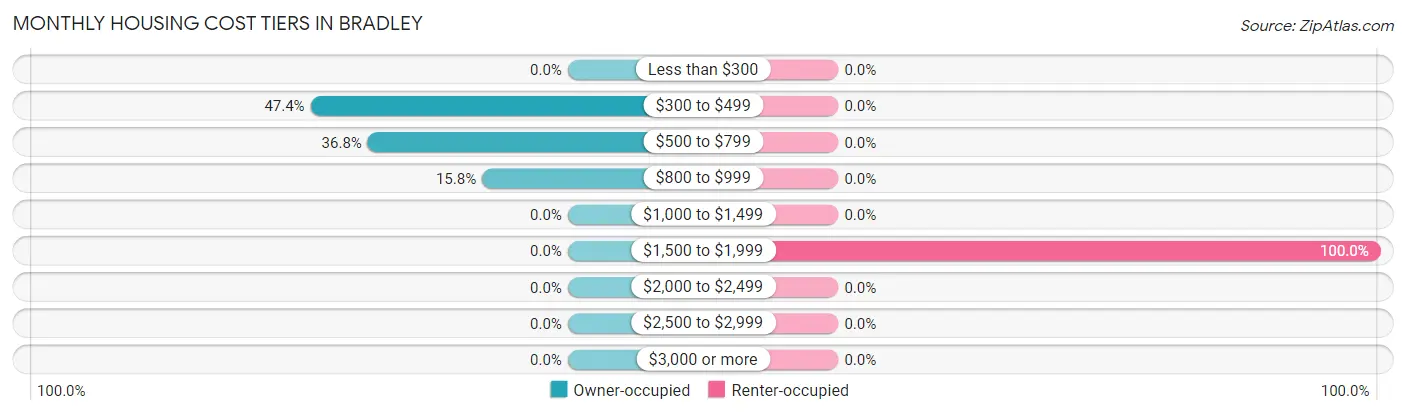
| Monthly Cost | Owner-occupied | Renter-occupied |
| Less than $300 | 0 (0.0%) | 0 (0.0%) |
| $300 to $499 | 9 (47.4%) | 0 (0.0%) |
| $500 to $799 | 7 (36.8%) | 0 (0.0%) |
| $800 to $999 | 3 (15.8%) | 0 (0.0%) |
| $1,000 to $1,499 | 0 (0.0%) | 0 (0.0%) |
| $1,500 to $1,999 | 0 (0.0%) | 10 (100.0%) |
| $2,000 to $2,499 | 0 (0.0%) | 0 (0.0%) |
| $2,500 to $2,999 | 0 (0.0%) | 0 (0.0%) |
| $3,000 or more | 0 (0.0%) | 0 (0.0%) |
| Total | 19 (100.0%) | 10 (100.0%) |
Physical Housing Characteristics in Bradley
Housing Structures in Bradley
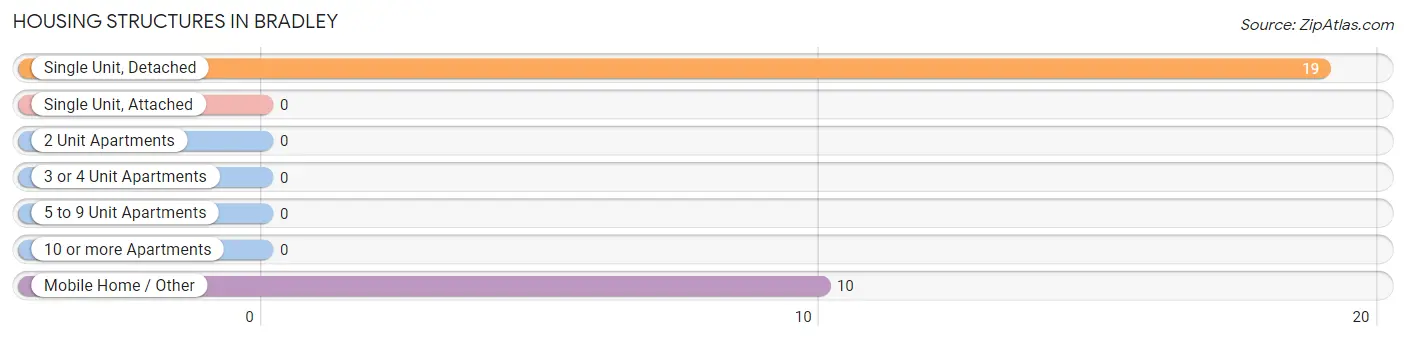
| Structure Type | # Housing Units | % Housing Units |
| Single Unit, Detached | 19 | 65.5% |
| Single Unit, Attached | 0 | 0.0% |
| 2 Unit Apartments | 0 | 0.0% |
| 3 or 4 Unit Apartments | 0 | 0.0% |
| 5 to 9 Unit Apartments | 0 | 0.0% |
| 10 or more Apartments | 0 | 0.0% |
| Mobile Home / Other | 10 | 34.5% |
| Total | 29 | 100.0% |
Housing Structures by Occupancy in Bradley
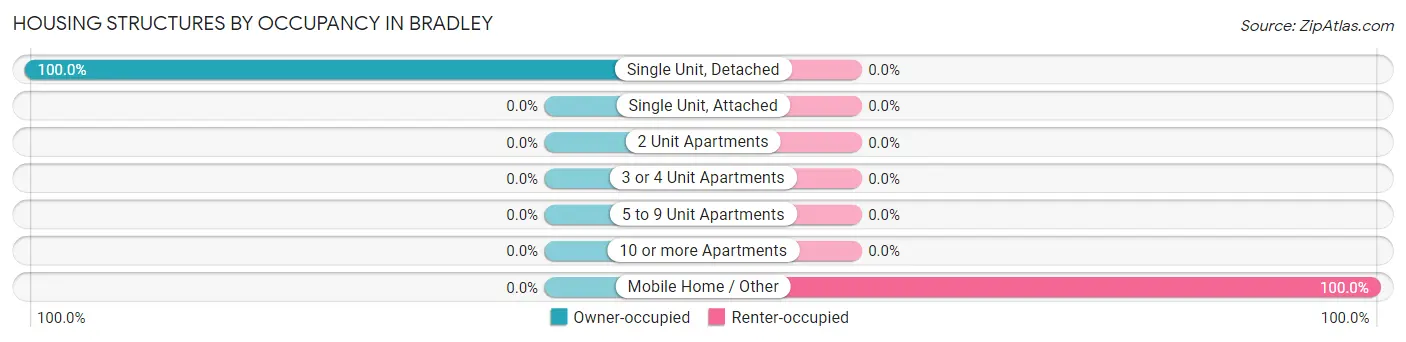
| Structure Type | Owner-occupied | Renter-occupied |
| Single Unit, Detached | 19 (100.0%) | 0 (0.0%) |
| Single Unit, Attached | 0 (0.0%) | 0 (0.0%) |
| 2 Unit Apartments | 0 (0.0%) | 0 (0.0%) |
| 3 or 4 Unit Apartments | 0 (0.0%) | 0 (0.0%) |
| 5 to 9 Unit Apartments | 0 (0.0%) | 0 (0.0%) |
| 10 or more Apartments | 0 (0.0%) | 0 (0.0%) |
| Mobile Home / Other | 0 (0.0%) | 10 (100.0%) |
| Total | 19 (65.5%) | 10 (34.5%) |
Housing Structures by Number of Rooms in Bradley
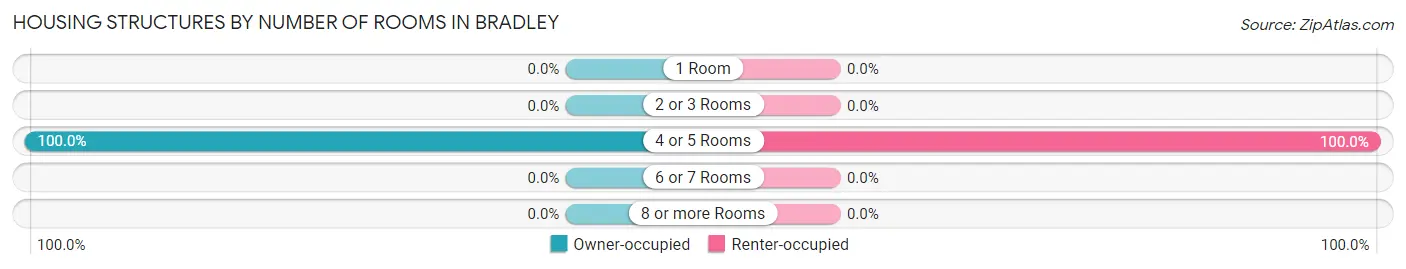
| Number of Rooms | Owner-occupied | Renter-occupied |
| 1 Room | 0 (0.0%) | 0 (0.0%) |
| 2 or 3 Rooms | 0 (0.0%) | 0 (0.0%) |
| 4 or 5 Rooms | 19 (100.0%) | 10 (100.0%) |
| 6 or 7 Rooms | 0 (0.0%) | 0 (0.0%) |
| 8 or more Rooms | 0 (0.0%) | 0 (0.0%) |
| Total | 19 (100.0%) | 10 (100.0%) |
Housing Structure by Heating Type in Bradley
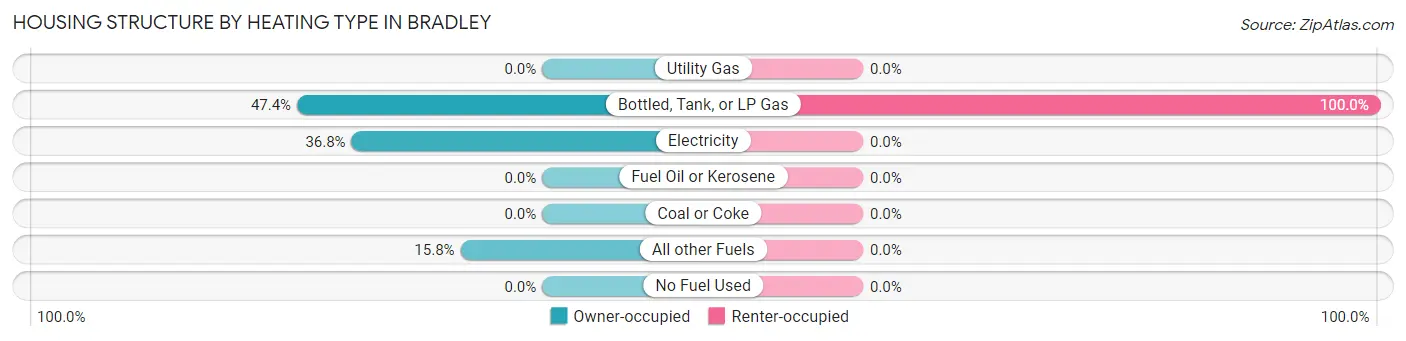
| Heating Type | Owner-occupied | Renter-occupied |
| Utility Gas | 0 (0.0%) | 0 (0.0%) |
| Bottled, Tank, or LP Gas | 9 (47.4%) | 10 (100.0%) |
| Electricity | 7 (36.8%) | 0 (0.0%) |
| Fuel Oil or Kerosene | 0 (0.0%) | 0 (0.0%) |
| Coal or Coke | 0 (0.0%) | 0 (0.0%) |
| All other Fuels | 3 (15.8%) | 0 (0.0%) |
| No Fuel Used | 0 (0.0%) | 0 (0.0%) |
| Total | 19 (100.0%) | 10 (100.0%) |
Household Vehicle Usage in Bradley
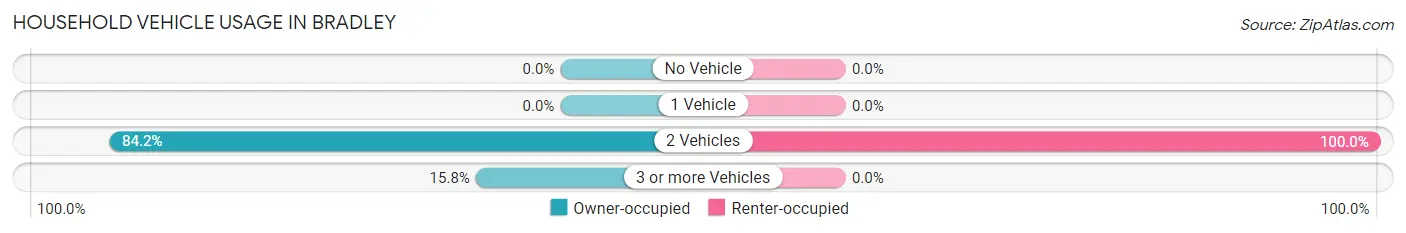
| Vehicles per Household | Owner-occupied | Renter-occupied |
| No Vehicle | 0 (0.0%) | 0 (0.0%) |
| 1 Vehicle | 0 (0.0%) | 0 (0.0%) |
| 2 Vehicles | 16 (84.2%) | 10 (100.0%) |
| 3 or more Vehicles | 3 (15.8%) | 0 (0.0%) |
| Total | 19 (100.0%) | 10 (100.0%) |
Real Estate & Mortgages in Bradley
Real Estate and Mortgage Overview in Bradley
| Characteristic | Without Mortgage | With Mortgage |
| Housing Units | 16 | 3 |
| Median Property Value | - | - |
| Median Household Income | - | - |
| Monthly Housing Costs | - | - |
| Real Estate Taxes | - | - |
Property Value by Mortgage Status in Bradley
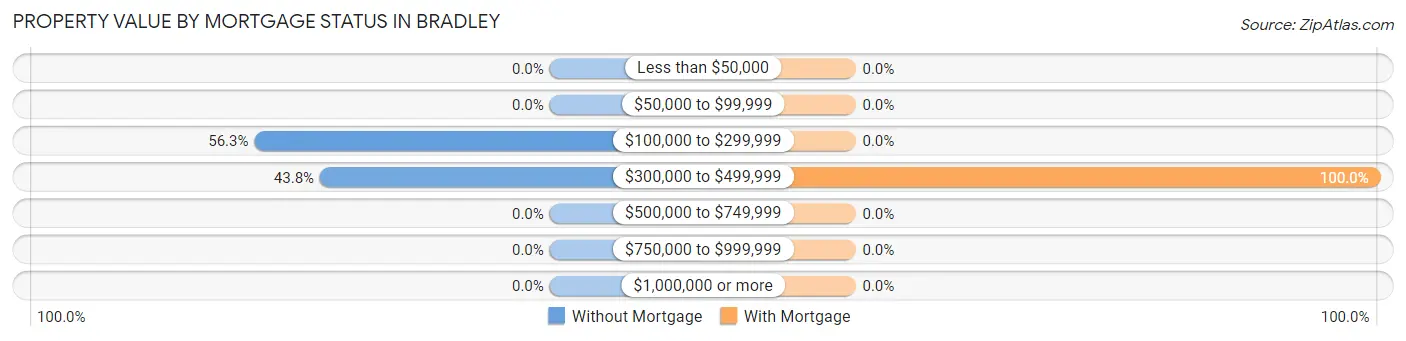
| Property Value | Without Mortgage | With Mortgage |
| Less than $50,000 | 0 (0.0%) | 0 (0.0%) |
| $50,000 to $99,999 | 0 (0.0%) | 0 (0.0%) |
| $100,000 to $299,999 | 9 (56.2%) | 0 (0.0%) |
| $300,000 to $499,999 | 7 (43.8%) | 3 (100.0%) |
| $500,000 to $749,999 | 0 (0.0%) | 0 (0.0%) |
| $750,000 to $999,999 | 0 (0.0%) | 0 (0.0%) |
| $1,000,000 or more | 0 (0.0%) | 0 (0.0%) |
| Total | 16 (100.0%) | 3 (100.0%) |
Household Income by Mortgage Status in Bradley
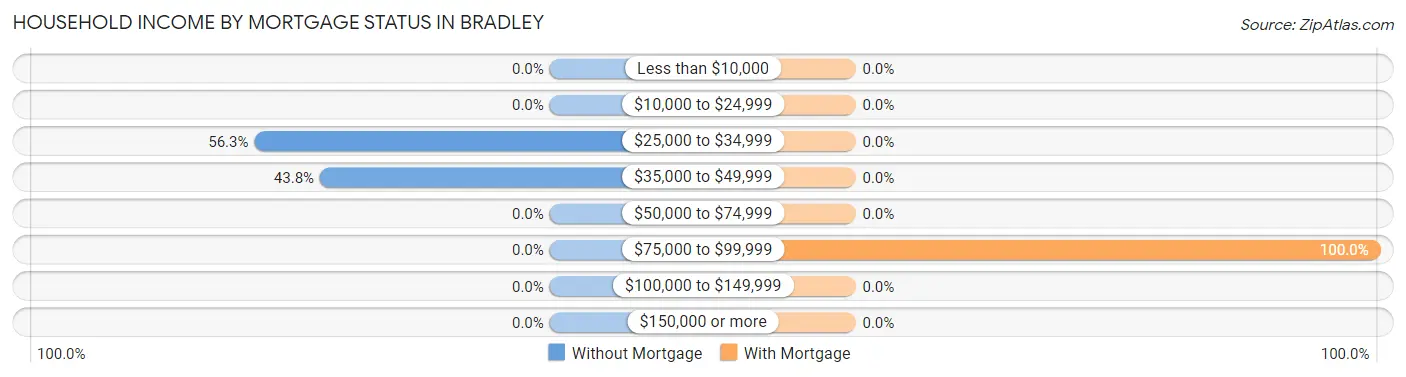
| Household Income | Without Mortgage | With Mortgage |
| Less than $10,000 | 0 (0.0%) | 0 (0.0%) |
| $10,000 to $24,999 | 0 (0.0%) | 0 (0.0%) |
| $25,000 to $34,999 | 9 (56.2%) | 0 (0.0%) |
| $35,000 to $49,999 | 7 (43.8%) | 0 (0.0%) |
| $50,000 to $74,999 | 0 (0.0%) | 0 (0.0%) |
| $75,000 to $99,999 | 0 (0.0%) | 3 (100.0%) |
| $100,000 to $149,999 | 0 (0.0%) | 0 (0.0%) |
| $150,000 or more | 0 (0.0%) | 0 (0.0%) |
| Total | 16 (100.0%) | 3 (100.0%) |
Property Value to Household Income Ratio in Bradley
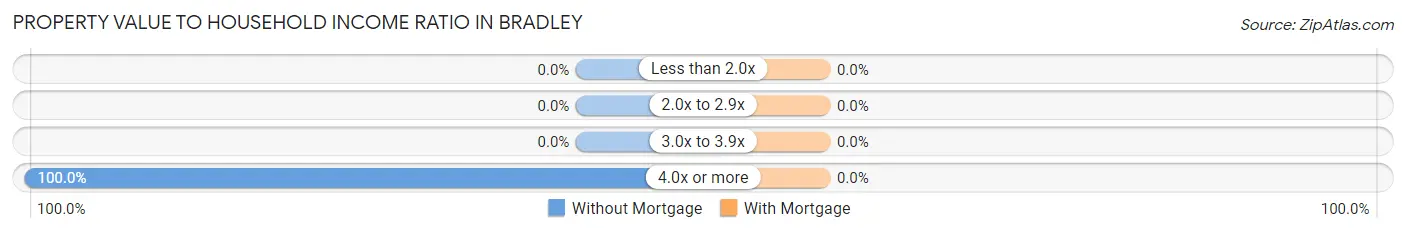
| Value-to-Income Ratio | Without Mortgage | With Mortgage |
| Less than 2.0x | 0 (0.0%) | 0 (0.0%) |
| 2.0x to 2.9x | 0 (0.0%) | 0 (0.0%) |
| 3.0x to 3.9x | 0 (0.0%) | 0 (0.0%) |
| 4.0x or more | 16 (100.0%) | 0 (0.0%) |
| Total | 16 (100.0%) | 3 (100.0%) |
Real Estate Taxes by Mortgage Status in Bradley
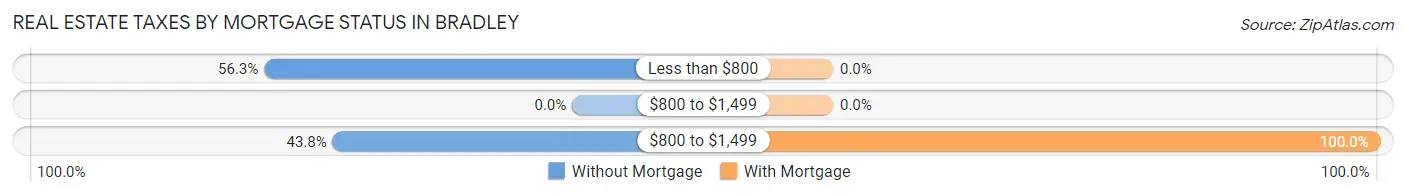
| Property Taxes | Without Mortgage | With Mortgage |
| Less than $800 | 9 (56.2%) | 0 (0.0%) |
| $800 to $1,499 | 0 (0.0%) | 0 (0.0%) |
| $800 to $1,499 | 7 (43.8%) | 3 (100.0%) |
| Total | 16 (100.0%) | 3 (100.0%) |
Health & Disability in Bradley
Health Insurance Coverage by Age in Bradley
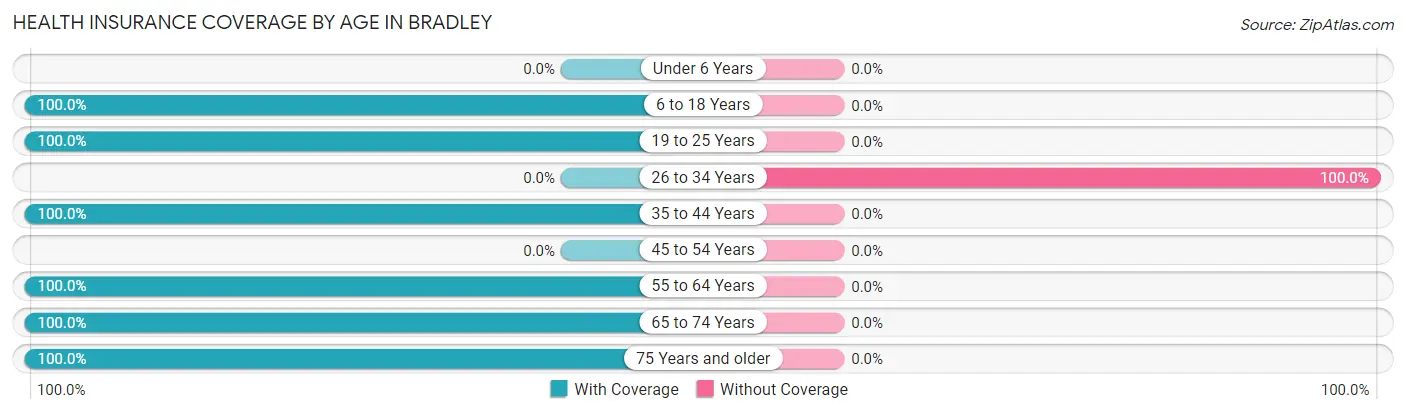
| Age Bracket | With Coverage | Without Coverage |
| Under 6 Years | 0 (0.0%) | 0 (0.0%) |
| 6 to 18 Years | 21 (100.0%) | 0 (0.0%) |
| 19 to 25 Years | 7 (100.0%) | 0 (0.0%) |
| 26 to 34 Years | 0 (0.0%) | 9 (100.0%) |
| 35 to 44 Years | 10 (100.0%) | 0 (0.0%) |
| 45 to 54 Years | 0 (0.0%) | 0 (0.0%) |
| 55 to 64 Years | 14 (100.0%) | 0 (0.0%) |
| 65 to 74 Years | 17 (100.0%) | 0 (0.0%) |
| 75 Years and older | 7 (100.0%) | 0 (0.0%) |
| Total | 76 (89.4%) | 9 (10.6%) |
Health Insurance Coverage by Citizenship Status in Bradley
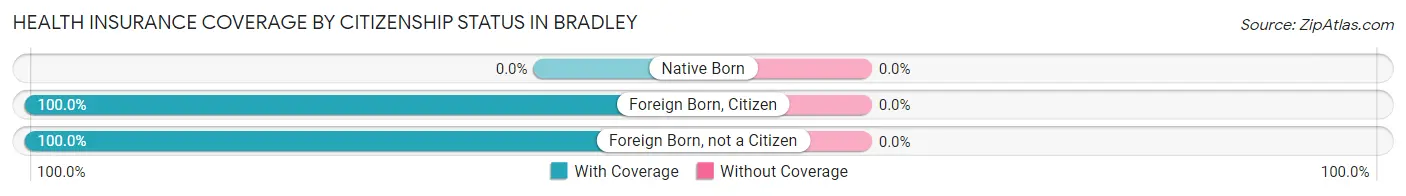
| Citizenship Status | With Coverage | Without Coverage |
| Native Born | 0 (0.0%) | 0 (0.0%) |
| Foreign Born, Citizen | 21 (100.0%) | 0 (0.0%) |
| Foreign Born, not a Citizen | 7 (100.0%) | 0 (0.0%) |
Health Insurance Coverage by Household Income in Bradley
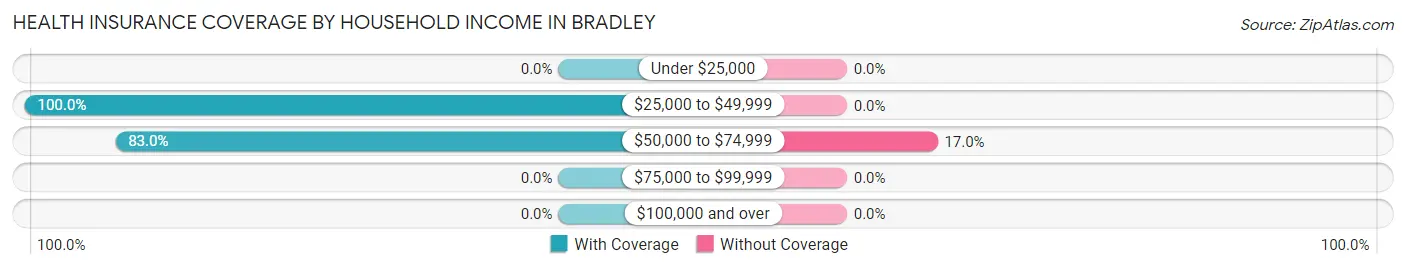
| Household Income | With Coverage | Without Coverage |
| Under $25,000 | 0 (0.0%) | 0 (0.0%) |
| $25,000 to $49,999 | 32 (100.0%) | 0 (0.0%) |
| $50,000 to $74,999 | 44 (83.0%) | 9 (17.0%) |
| $75,000 to $99,999 | 0 (0.0%) | 0 (0.0%) |
| $100,000 and over | 0 (0.0%) | 0 (0.0%) |
Public vs Private Health Insurance Coverage by Age in Bradley
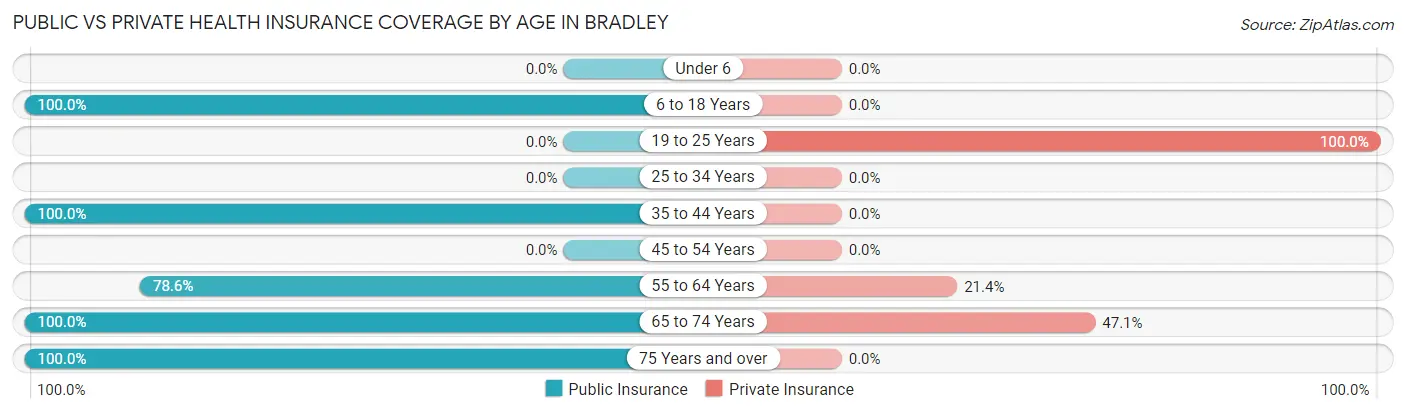
| Age Bracket | Public Insurance | Private Insurance |
| Under 6 | 0 (0.0%) | 0 (0.0%) |
| 6 to 18 Years | 21 (100.0%) | 0 (0.0%) |
| 19 to 25 Years | 0 (0.0%) | 7 (100.0%) |
| 25 to 34 Years | 0 (0.0%) | 0 (0.0%) |
| 35 to 44 Years | 10 (100.0%) | 0 (0.0%) |
| 45 to 54 Years | 0 (0.0%) | 0 (0.0%) |
| 55 to 64 Years | 11 (78.6%) | 3 (21.4%) |
| 65 to 74 Years | 17 (100.0%) | 8 (47.1%) |
| 75 Years and over | 7 (100.0%) | 0 (0.0%) |
| Total | 66 (77.6%) | 18 (21.2%) |
Disability Status by Sex by Age in Bradley
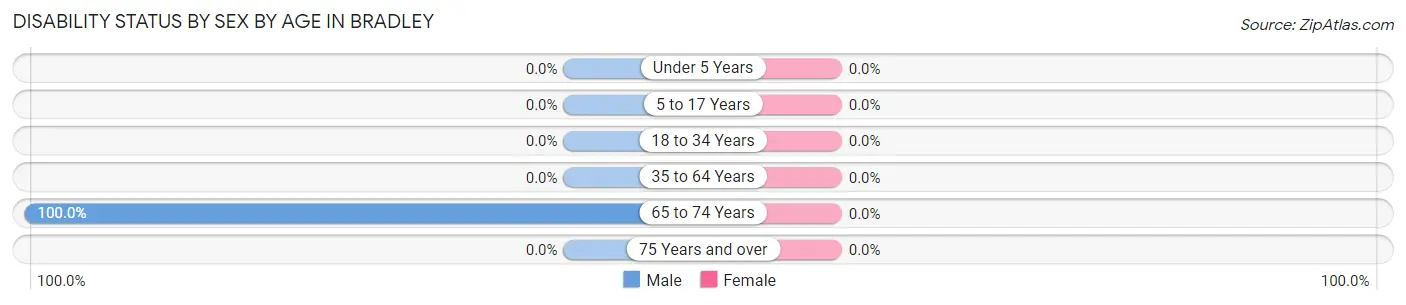
| Age Bracket | Male | Female |
| Under 5 Years | 0 (0.0%) | 0 (0.0%) |
| 5 to 17 Years | 0 (0.0%) | 0 (0.0%) |
| 18 to 34 Years | 0 (0.0%) | 0 (0.0%) |
| 35 to 64 Years | 0 (0.0%) | 0 (0.0%) |
| 65 to 74 Years | 8 (100.0%) | 0 (0.0%) |
| 75 Years and over | 0 (0.0%) | 0 (0.0%) |
Disability Class by Sex by Age in Bradley
Disability Class: Hearing Difficulty
| Age Bracket | Male | Female |
| Under 5 Years | 0 (0.0%) | 0 (0.0%) |
| 5 to 17 Years | 0 (0.0%) | 0 (0.0%) |
| 18 to 34 Years | 0 (0.0%) | 0 (0.0%) |
| 35 to 64 Years | 0 (0.0%) | 0 (0.0%) |
| 65 to 74 Years | 0 (0.0%) | 0 (0.0%) |
| 75 Years and over | 0 (0.0%) | 0 (0.0%) |
Disability Class: Vision Difficulty
| Age Bracket | Male | Female |
| Under 5 Years | 0 (0.0%) | 0 (0.0%) |
| 5 to 17 Years | 0 (0.0%) | 0 (0.0%) |
| 18 to 34 Years | 0 (0.0%) | 0 (0.0%) |
| 35 to 64 Years | 0 (0.0%) | 0 (0.0%) |
| 65 to 74 Years | 0 (0.0%) | 0 (0.0%) |
| 75 Years and over | 0 (0.0%) | 0 (0.0%) |
Disability Class: Cognitive Difficulty
| Age Bracket | Male | Female |
| 5 to 17 Years | 0 (0.0%) | 0 (0.0%) |
| 18 to 34 Years | 0 (0.0%) | 0 (0.0%) |
| 35 to 64 Years | 0 (0.0%) | 0 (0.0%) |
| 65 to 74 Years | 0 (0.0%) | 0 (0.0%) |
| 75 Years and over | 0 (0.0%) | 0 (0.0%) |
Disability Class: Ambulatory Difficulty
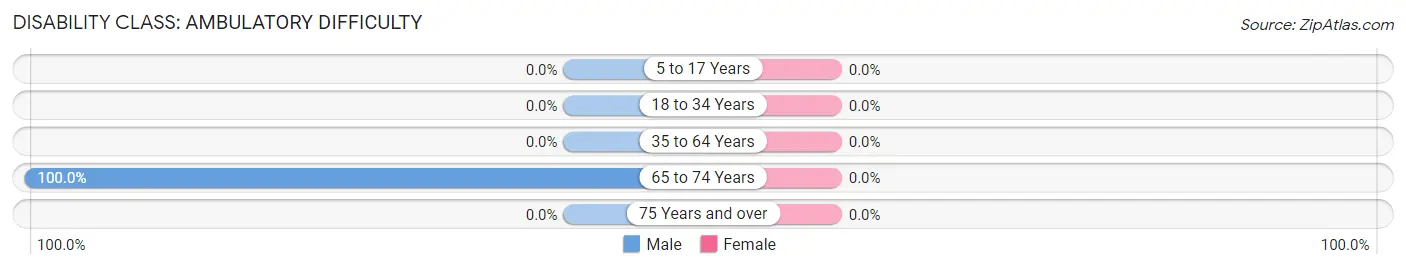
| Age Bracket | Male | Female |
| 5 to 17 Years | 0 (0.0%) | 0 (0.0%) |
| 18 to 34 Years | 0 (0.0%) | 0 (0.0%) |
| 35 to 64 Years | 0 (0.0%) | 0 (0.0%) |
| 65 to 74 Years | 8 (100.0%) | 0 (0.0%) |
| 75 Years and over | 0 (0.0%) | 0 (0.0%) |
Disability Class: Self-Care Difficulty
| Age Bracket | Male | Female |
| 5 to 17 Years | 0 (0.0%) | 0 (0.0%) |
| 18 to 34 Years | 0 (0.0%) | 0 (0.0%) |
| 35 to 64 Years | 0 (0.0%) | 0 (0.0%) |
| 65 to 74 Years | 0 (0.0%) | 0 (0.0%) |
| 75 Years and over | 0 (0.0%) | 0 (0.0%) |
Technology Access in Bradley
Computing Device Access in Bradley
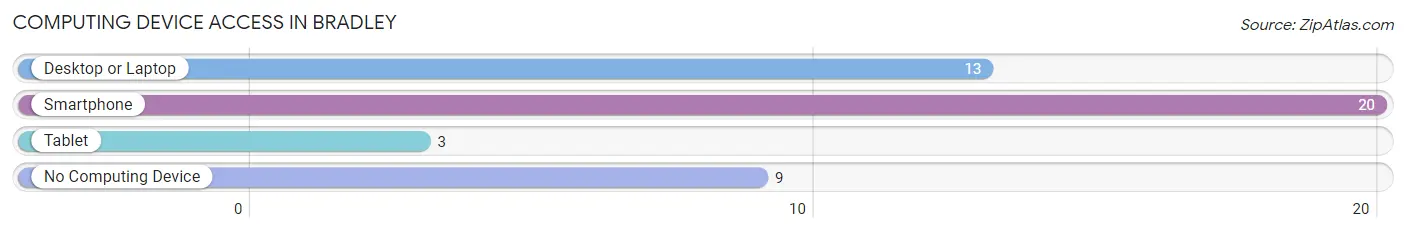
| Device Type | # Households | % Households |
| Desktop or Laptop | 13 | 44.8% |
| Smartphone | 20 | 69.0% |
| Tablet | 3 | 10.3% |
| No Computing Device | 9 | 31.0% |
| Total | 29 | 100.0% |
Internet Access in Bradley
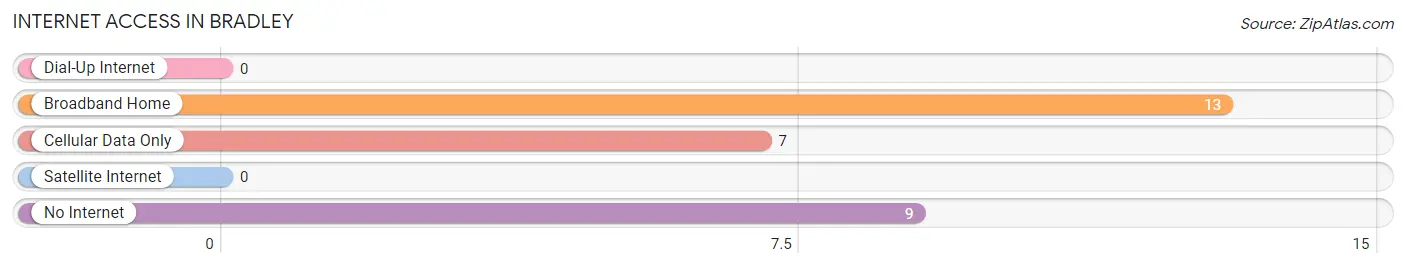
| Internet Type | # Households | % Households |
| Dial-Up Internet | 0 | 0.0% |
| Broadband Home | 13 | 44.8% |
| Cellular Data Only | 7 | 24.1% |
| Satellite Internet | 0 | 0.0% |
| No Internet | 9 | 31.0% |
| Total | 29 | 100.0% |
Bradley Summary
Bradley, California is a small unincorporated community located in Monterey County, California. It is situated in the Salinas Valley, approximately 8 miles east of the city of Salinas. The population of Bradley was estimated to be 1,845 in 2019.
History
Bradley was founded in 1871 by William Bradley, a rancher from the Midwest. He purchased a large tract of land in the Salinas Valley and began to develop it for agricultural purposes. The town was named after him. In the early 1900s, Bradley became a popular destination for tourists, who came to enjoy the mild climate and the scenic beauty of the area.
In the 1920s, Bradley began to experience a period of growth and development. The town was incorporated in 1925 and the first post office was established in 1927. The town also saw the construction of a number of new businesses, including a bank, a hotel, and a movie theater.
Geography
Bradley is located in the Salinas Valley, which is a large agricultural region in central California. The valley is surrounded by the Santa Lucia Mountains to the east and the Gabilan Range to the west. The climate in the area is mild and temperate, with average temperatures ranging from the mid-50s to the mid-70s.
Economy
Bradley’s economy is largely based on agriculture. The town is home to a number of farms and ranches, which produce a variety of crops, including lettuce, broccoli, cauliflower, and strawberries. The town is also home to a number of wineries, which produce a variety of wines.
In addition to agriculture, Bradley is home to a number of businesses, including restaurants, retail stores, and auto repair shops. The town is also home to a number of small manufacturing companies, which produce a variety of products, including furniture, clothing, and electronics.
Demographics
As of 2019, the population of Bradley was estimated to be 1,845. The racial makeup of the town was 79.3% White, 0.7% African American, 0.3% Native American, 0.2% Asian, 0.1% Pacific Islander, 16.2% from other races, and 3.4% from two or more races. The median household income in Bradley was $45,945, and the median age was 37.
Conclusion
Bradley, California is a small unincorporated community located in Monterey County, California. It is situated in the Salinas Valley, approximately 8 miles east of the city of Salinas. The population of Bradley was estimated to be 1,845 in 2019. The town’s economy is largely based on agriculture, and it is home to a number of businesses, including restaurants, retail stores, and auto repair shops. The racial makeup of the town was 79.3% White, 0.7% African American, 0.3% Native American, 0.2% Asian, 0.1% Pacific Islander, 16.2% from other races, and 3.4% from two or more races. The median household income in Bradley was $45,945, and the median age was 37.
Common Questions
What is Per Capita Income in Bradley?
Per Capita income in Bradley is $16,028.
What is the Median Family Income in Bradley?
Median Family Income in Bradley is $41,964.
What is the Median Household income in Bradley?
Median Household Income in Bradley is $41,964.
What is Inequality or Gini Index in Bradley?
Inequality or Gini Index in Bradley is 0.15.
What is the Total Population of Bradley?
Total Population of Bradley is 85.
What is the Total Male Population of Bradley?
Total Male Population of Bradley is 32.
What is the Total Female Population of Bradley?
Total Female Population of Bradley is 53.
What is the Ratio of Males per 100 Females in Bradley?
There are 60.38 Males per 100 Females in Bradley.
What is the Ratio of Females per 100 Males in Bradley?
There are 165.62 Females per 100 Males in Bradley.
What is the Median Population Age in Bradley?
Median Population Age in Bradley is 37.6 Years.
What is the Average Family Size in Bradley
Average Family Size in Bradley is 2.9 People.
What is the Average Household Size in Bradley
Average Household Size in Bradley is 2.9 People.
How Large is the Labor Force in Bradley?
There are 28 People in the Labor Forcein in Bradley.
What is the Percentage of People in the Labor Force in Bradley?
43.8% of People are in the Labor Force in Bradley.