Bodfish, CA Map & Demographics
Bodfish Map
Bodfish Overview
$17,860
PER CAPITA INCOME
$25,590
AVG FAMILY INCOME
$27,215
AVG HOUSEHOLD INCOME
18.4%
WAGE / INCOME GAP [ % ]
81.6¢/ $1
WAGE / INCOME GAP [ $ ]
0.48
INEQUALITY / GINI INDEX
2,320
TOTAL POPULATION
1,122
MALE POPULATION
1,198
FEMALE POPULATION
93.66
MALES / 100 FEMALES
106.77
FEMALES / 100 MALES
41.7
MEDIAN AGE
3.1
AVG FAMILY SIZE
2.6
AVG HOUSEHOLD SIZE
596
LABOR FORCE [ PEOPLE ]
32.2%
PERCENT IN LABOR FORCE
21.2%
UNEMPLOYMENT RATE
Bodfish Zip Codes
Bodfish Area Codes
Income in Bodfish
Income Overview in Bodfish
Per Capita Income in Bodfish is $17,860, while median incomes of families and households are $25,590 and $27,215 respectively.
| Characteristic | Number | Measure |
| Per Capita Income | 2,320 | $17,860 |
| Median Family Income | 635 | $25,590 |
| Mean Family Income | 635 | $49,601 |
| Median Household Income | 897 | $27,215 |
| Mean Household Income | 897 | $45,874 |
| Income Deficit | 635 | $0 |
| Wage / Income Gap (%) | 2,320 | 18.44% |
| Wage / Income Gap ($) | 2,320 | 81.56¢ per $1 |
| Gini / Inequality Index | 2,320 | 0.48 |
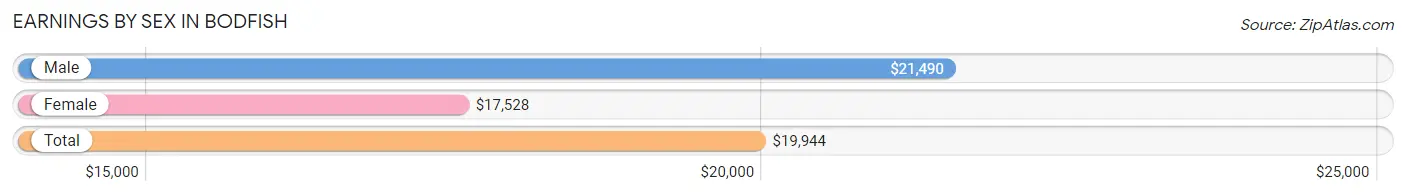
Earnings by Sex in Bodfish
Average Earnings in Bodfish are $19,944, $21,490 for men and $17,528 for women, a difference of 18.4%.
| Sex | Number | Average Earnings |
| Male | 285 (48.6%) | $21,490 |
| Female | 301 (51.4%) | $17,528 |
| Total | 586 (100.0%) | $19,944 |
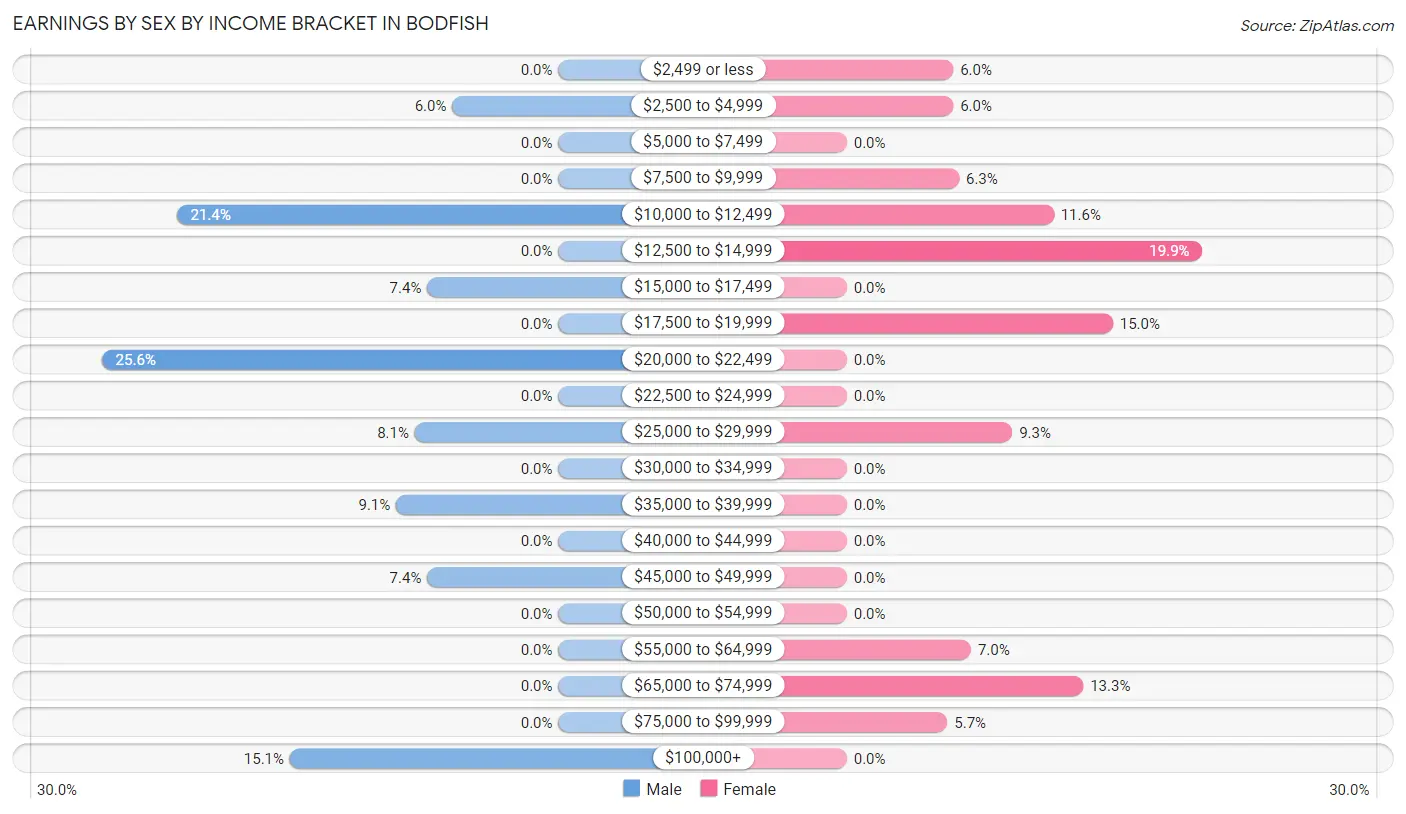
Earnings by Sex by Income Bracket in Bodfish
The most common earnings brackets in Bodfish are $20,000 to $22,499 for men (73 | 25.6%) and $12,500 to $14,999 for women (60 | 19.9%).
| Income | Male | Female |
| $2,499 or less | 0 (0.0%) | 18 (6.0%) |
| $2,500 to $4,999 | 17 (6.0%) | 18 (6.0%) |
| $5,000 to $7,499 | 0 (0.0%) | 0 (0.0%) |
| $7,500 to $9,999 | 0 (0.0%) | 19 (6.3%) |
| $10,000 to $12,499 | 61 (21.4%) | 35 (11.6%) |
| $12,500 to $14,999 | 0 (0.0%) | 60 (19.9%) |
| $15,000 to $17,499 | 21 (7.4%) | 0 (0.0%) |
| $17,500 to $19,999 | 0 (0.0%) | 45 (14.9%) |
| $20,000 to $22,499 | 73 (25.6%) | 0 (0.0%) |
| $22,500 to $24,999 | 0 (0.0%) | 0 (0.0%) |
| $25,000 to $29,999 | 23 (8.1%) | 28 (9.3%) |
| $30,000 to $34,999 | 0 (0.0%) | 0 (0.0%) |
| $35,000 to $39,999 | 26 (9.1%) | 0 (0.0%) |
| $40,000 to $44,999 | 0 (0.0%) | 0 (0.0%) |
| $45,000 to $49,999 | 21 (7.4%) | 0 (0.0%) |
| $50,000 to $54,999 | 0 (0.0%) | 0 (0.0%) |
| $55,000 to $64,999 | 0 (0.0%) | 21 (7.0%) |
| $65,000 to $74,999 | 0 (0.0%) | 40 (13.3%) |
| $75,000 to $99,999 | 0 (0.0%) | 17 (5.7%) |
| $100,000+ | 43 (15.1%) | 0 (0.0%) |
| Total | 285 (100.0%) | 301 (100.0%) |
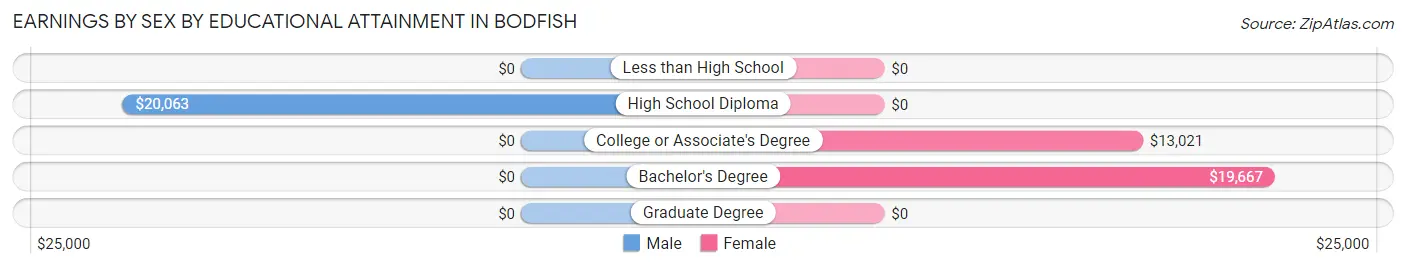
Earnings by Sex by Educational Attainment in Bodfish
Average earnings in Bodfish are $21,490 for men and $17,528 for women, a difference of 18.4%. Men with an educational attainment of high school diploma enjoy the highest average annual earnings of $20,063, while those with high school diploma education earn the least with $20,063. Women with an educational attainment of bachelor's degree earn the most with the average annual earnings of $19,667, while those with college or associate's degree education have the smallest earnings of $13,021.
| Educational Attainment | Male Income | Female Income |
| Less than High School | - | - |
| High School Diploma | $20,063 | $0 |
| College or Associate's Degree | - | - |
| Bachelor's Degree | - | - |
| Graduate Degree | - | - |
| Total | $21,490 | $17,528 |
Family Income in Bodfish
Family Income Brackets in Bodfish
According to the Bodfish family income data, there are 177 families falling into the $15,000 to $24,999 income range, which is the most common income bracket and makes up 27.9% of all families.
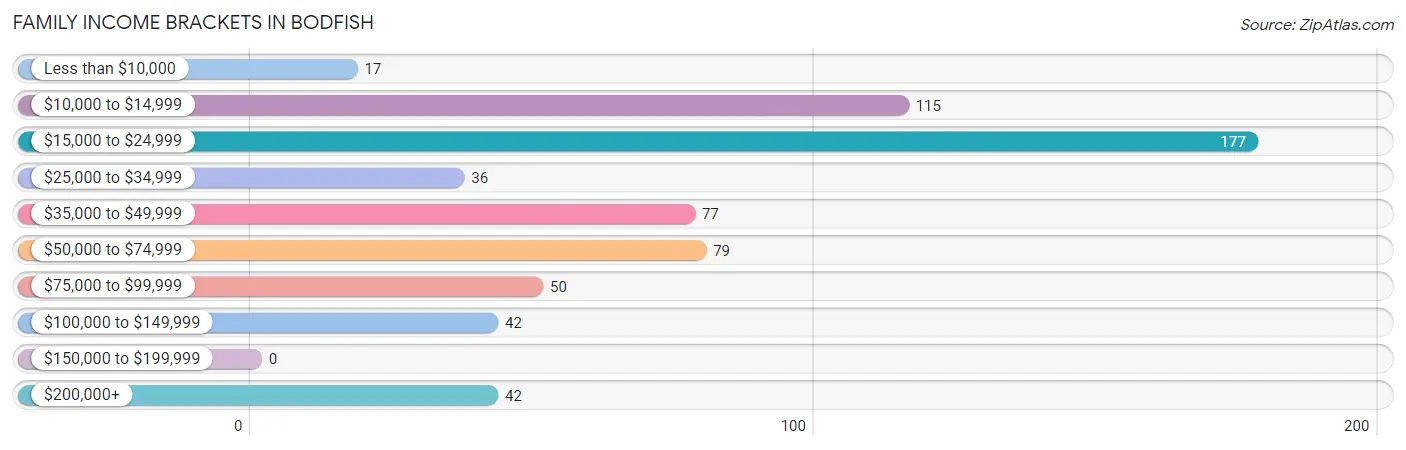
| Income Bracket | # Families | % Families |
| Less than $10,000 | 17 | 2.7% |
| $10,000 to $14,999 | 115 | 18.1% |
| $15,000 to $24,999 | 177 | 27.9% |
| $25,000 to $34,999 | 36 | 5.7% |
| $35,000 to $49,999 | 77 | 12.1% |
| $50,000 to $74,999 | 79 | 12.4% |
| $75,000 to $99,999 | 50 | 7.9% |
| $100,000 to $149,999 | 42 | 6.6% |
| $150,000 to $199,999 | 0 | 0.0% |
| $200,000+ | 42 | 6.6% |
Family Income by Famaliy Size in Bodfish
2-person families (344 | 54.2%) account for the highest median family income in Bodfish with $37,042 per family, while 2-person families (344 | 54.2%) have the highest median income of $18,521 per family member.
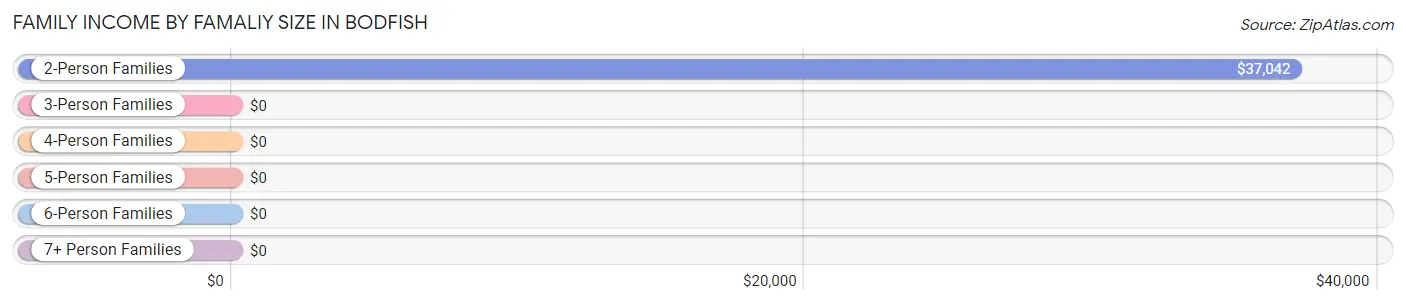
| Income Bracket | # Families | Median Income |
| 2-Person Families | 344 (54.2%) | $37,042 |
| 3-Person Families | 77 (12.1%) | $0 |
| 4-Person Families | 87 (13.7%) | $0 |
| 5-Person Families | 66 (10.4%) | $0 |
| 6-Person Families | 61 (9.6%) | $0 |
| 7+ Person Families | 0 (0.0%) | $0 |
| Total | 635 (100.0%) | $25,590 |
Family Income by Number of Earners in Bodfish
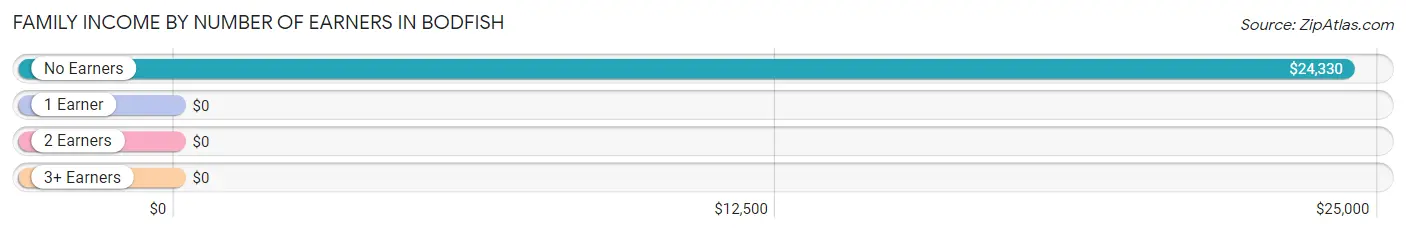
| Number of Earners | # Families | Median Income |
| No Earners | 270 (42.5%) | $24,330 |
| 1 Earner | 217 (34.2%) | $0 |
| 2 Earners | 148 (23.3%) | $0 |
| 3+ Earners | 0 (0.0%) | $0 |
| Total | 635 (100.0%) | $25,590 |
Household Income in Bodfish
Household Income Brackets in Bodfish
With 177 households falling in the category, the $15,000 to $24,999 income range is the most frequent in Bodfish, accounting for 19.7% of all households.
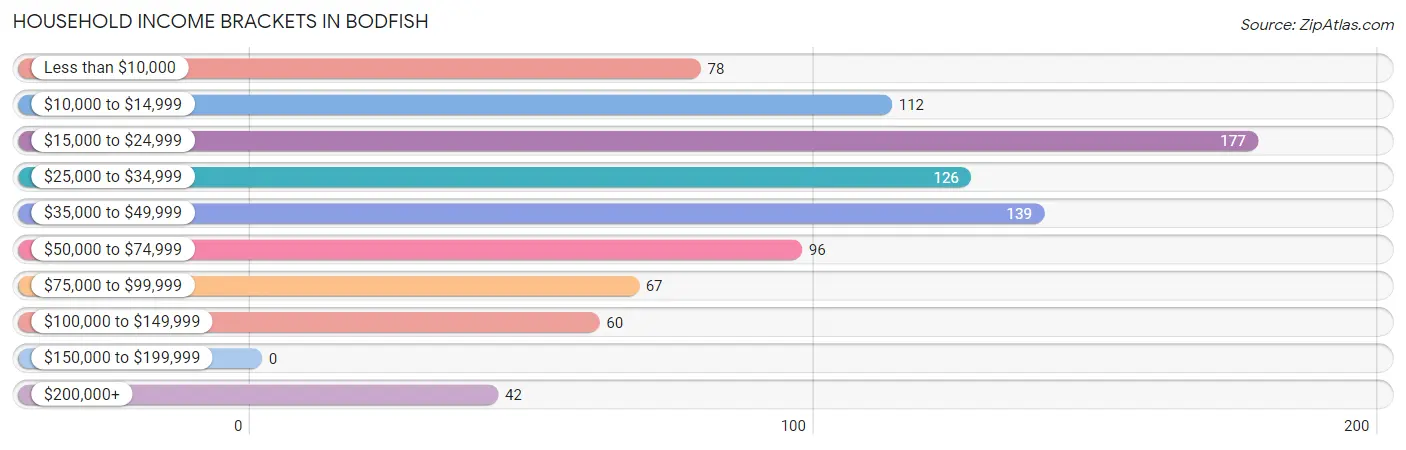
| Income Bracket | # Households | % Households |
| Less than $10,000 | 78 | 8.7% |
| $10,000 to $14,999 | 112 | 12.5% |
| $15,000 to $24,999 | 177 | 19.7% |
| $25,000 to $34,999 | 126 | 14.0% |
| $35,000 to $49,999 | 139 | 15.5% |
| $50,000 to $74,999 | 96 | 10.7% |
| $75,000 to $99,999 | 67 | 7.5% |
| $100,000 to $149,999 | 60 | 6.7% |
| $150,000 to $199,999 | 0 | 0.0% |
| $200,000+ | 42 | 4.7% |
Household Income by Householder Age in Bodfish
The median household income in Bodfish is $27,215, with the highest median household income of $26,895 found in the 65+ years age bracket for the primary householder. A total of 365 households (40.7%) fall into this category.
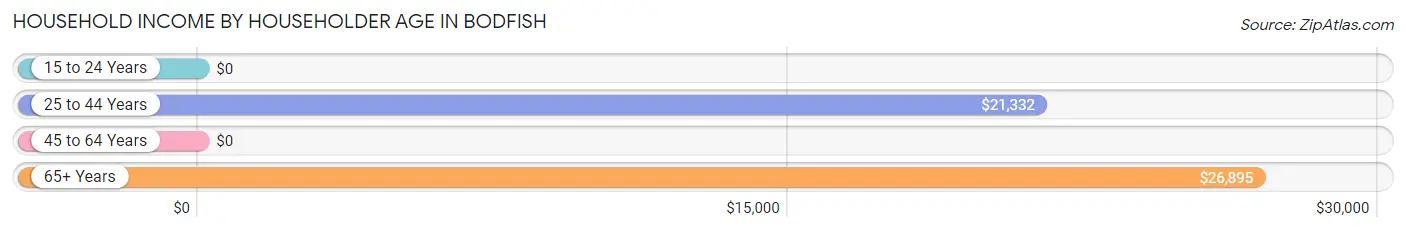
| Income Bracket | # Households | Median Income |
| 15 to 24 Years | 0 (0.0%) | $0 |
| 25 to 44 Years | 299 (33.3%) | $21,332 |
| 45 to 64 Years | 233 (26.0%) | $0 |
| 65+ Years | 365 (40.7%) | $26,895 |
| Total | 897 (100.0%) | $27,215 |
Poverty in Bodfish
Income Below Poverty by Sex and Age in Bodfish
With 54.2% poverty level for males and 48.3% for females among the residents of Bodfish, 12 to 14 year old males and 12 to 14 year old females are the most vulnerable to poverty, with 215 males (100.0%) and 43 females (100.0%) in their respective age groups living below the poverty level.
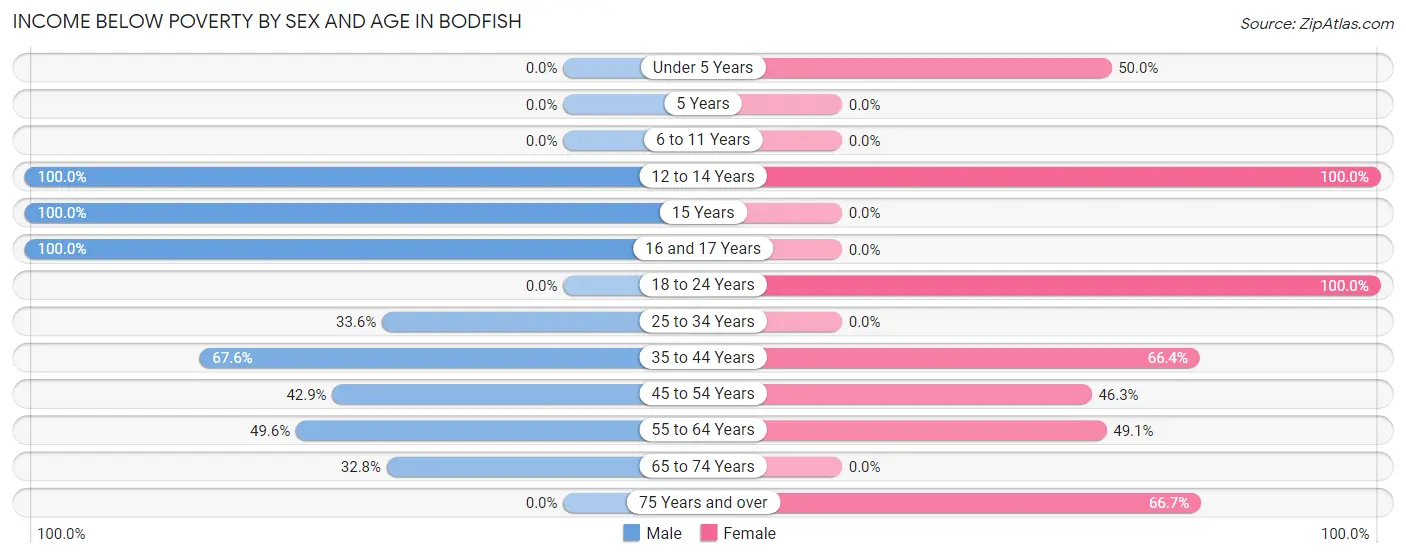
| Age Bracket | Male | Female |
| Under 5 Years | 0 (0.0%) | 61 (50.0%) |
| 5 Years | 0 (0.0%) | 0 (0.0%) |
| 6 to 11 Years | 0 (0.0%) | 0 (0.0%) |
| 12 to 14 Years | 215 (100.0%) | 43 (100.0%) |
| 15 Years | 44 (100.0%) | 0 (0.0%) |
| 16 and 17 Years | 65 (100.0%) | 0 (0.0%) |
| 18 to 24 Years | 0 (0.0%) | 48 (100.0%) |
| 25 to 34 Years | 36 (33.6%) | 0 (0.0%) |
| 35 to 44 Years | 102 (67.5%) | 198 (66.4%) |
| 45 to 54 Years | 45 (42.9%) | 38 (46.3%) |
| 55 to 64 Years | 63 (49.6%) | 109 (49.1%) |
| 65 to 74 Years | 38 (32.8%) | 0 (0.0%) |
| 75 Years and over | 0 (0.0%) | 82 (66.7%) |
| Total | 608 (54.2%) | 579 (48.3%) |
Income Above Poverty by Sex and Age in Bodfish
According to the poverty statistics in Bodfish, males aged 6 to 11 years and females aged 25 to 34 years are the age groups that are most secure financially, with 100.0% of males and 100.0% of females in these age groups living above the poverty line.
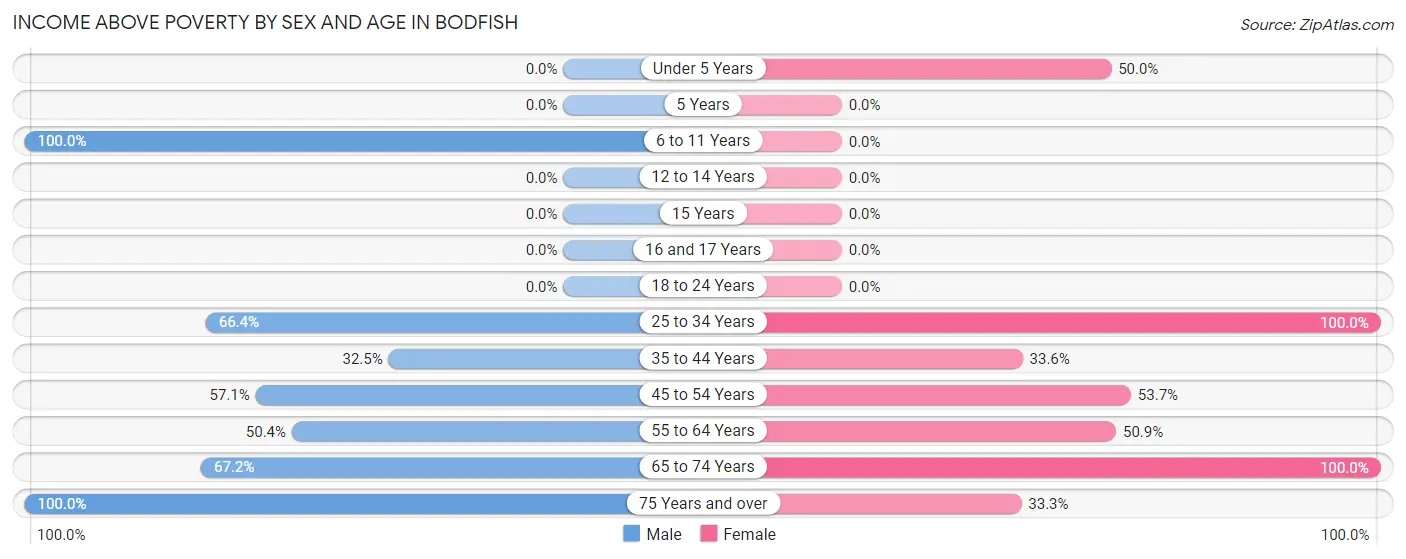
| Age Bracket | Male | Female |
| Under 5 Years | 0 (0.0%) | 61 (50.0%) |
| 5 Years | 0 (0.0%) | 0 (0.0%) |
| 6 to 11 Years | 46 (100.0%) | 0 (0.0%) |
| 12 to 14 Years | 0 (0.0%) | 0 (0.0%) |
| 15 Years | 0 (0.0%) | 0 (0.0%) |
| 16 and 17 Years | 0 (0.0%) | 0 (0.0%) |
| 18 to 24 Years | 0 (0.0%) | 0 (0.0%) |
| 25 to 34 Years | 71 (66.4%) | 87 (100.0%) |
| 35 to 44 Years | 49 (32.5%) | 100 (33.6%) |
| 45 to 54 Years | 60 (57.1%) | 44 (53.7%) |
| 55 to 64 Years | 64 (50.4%) | 113 (50.9%) |
| 65 to 74 Years | 78 (67.2%) | 173 (100.0%) |
| 75 Years and over | 146 (100.0%) | 41 (33.3%) |
| Total | 514 (45.8%) | 619 (51.7%) |
Income Below Poverty Among Married-Couple Families in Bodfish
The poverty statistics for married-couple families in Bodfish show that 36.1% or 182 of the total 504 families live below the poverty line. Families with 3 or 4 children have the highest poverty rate of 100.0%, comprising of 61 families. On the other hand, families with no children have the lowest poverty rate of 7.7%, which includes 21 families.
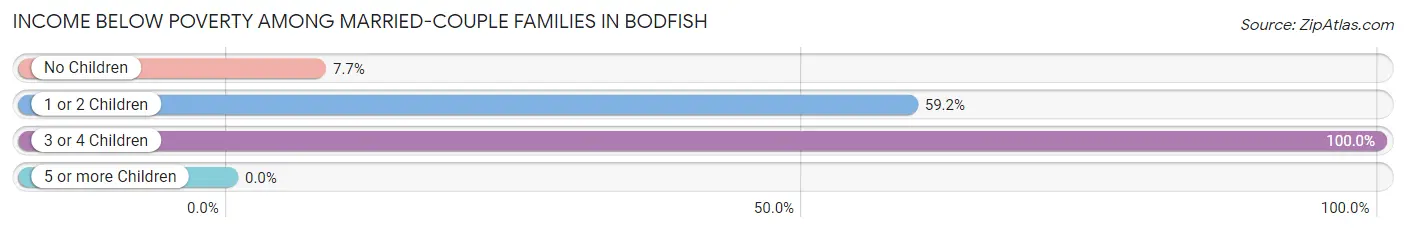
| Children | Above Poverty | Below Poverty |
| No Children | 253 (92.3%) | 21 (7.7%) |
| 1 or 2 Children | 69 (40.8%) | 100 (59.2%) |
| 3 or 4 Children | 0 (0.0%) | 61 (100.0%) |
| 5 or more Children | 0 (0.0%) | 0 (0.0%) |
| Total | 322 (63.9%) | 182 (36.1%) |
Income Below Poverty Among Single-Parent Households in Bodfish
According to the poverty data in Bodfish, 22.1% or 17 single-father households and 72.2% or 39 single-mother households are living below the poverty line. Among single-father households, those with no children have the highest poverty rate, with 17 households (22.1%) experiencing poverty. Likewise, among single-mother households, those with 3 or 4 children have the highest poverty rate, with 39 households (100.0%) falling below the poverty line.
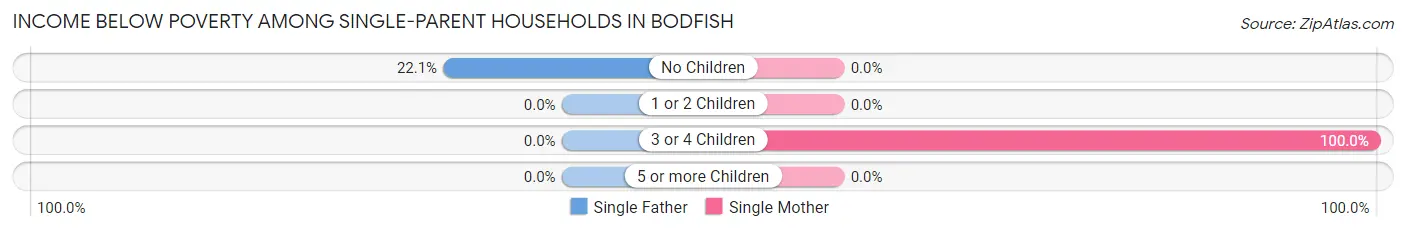
| Children | Single Father | Single Mother |
| No Children | 17 (22.1%) | 0 (0.0%) |
| 1 or 2 Children | 0 (0.0%) | 0 (0.0%) |
| 3 or 4 Children | 0 (0.0%) | 39 (100.0%) |
| 5 or more Children | 0 (0.0%) | 0 (0.0%) |
| Total | 17 (22.1%) | 39 (72.2%) |
Income Below Poverty Among Married-Couple vs Single-Parent Households in Bodfish
The poverty data for Bodfish shows that 182 of the married-couple family households (36.1%) and 56 of the single-parent households (42.7%) are living below the poverty level. Within the married-couple family households, those with 3 or 4 children have the highest poverty rate, with 61 households (100.0%) falling below the poverty line. Among the single-parent households, those with 3 or 4 children have the highest poverty rate, with 39 household (100.0%) living below poverty.
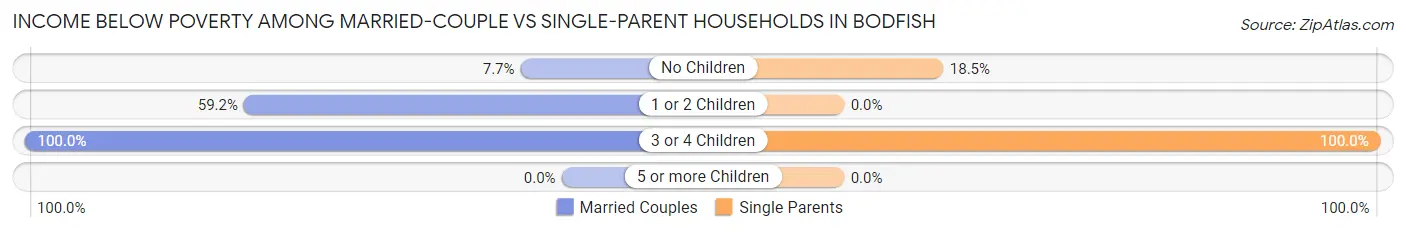
| Children | Married-Couple Families | Single-Parent Households |
| No Children | 21 (7.7%) | 17 (18.5%) |
| 1 or 2 Children | 100 (59.2%) | 0 (0.0%) |
| 3 or 4 Children | 61 (100.0%) | 39 (100.0%) |
| 5 or more Children | 0 (0.0%) | 0 (0.0%) |
| Total | 182 (36.1%) | 56 (42.7%) |
Race in Bodfish
The most populous races in Bodfish are White / Caucasian (1,861 | 80.2%), Hispanic or Latino (313 | 13.5%), and Two or more Races (223 | 9.6%).
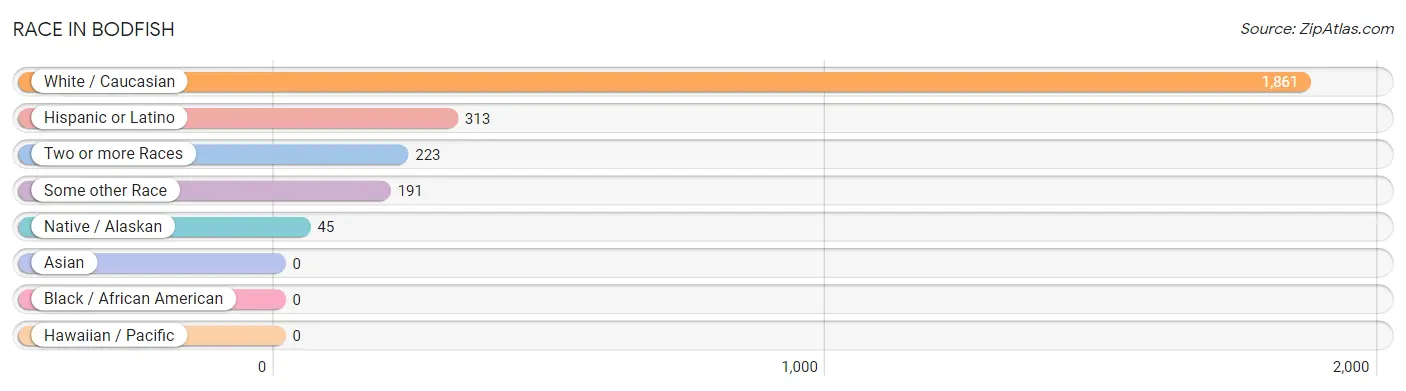
| Race | # Population | % Population |
| Asian | 0 | 0.0% |
| Black / African American | 0 | 0.0% |
| Hawaiian / Pacific | 0 | 0.0% |
| Hispanic or Latino | 313 | 13.5% |
| Native / Alaskan | 45 | 1.9% |
| White / Caucasian | 1,861 | 80.2% |
| Two or more Races | 223 | 9.6% |
| Some other Race | 191 | 8.2% |
| Total | 2,320 | 100.0% |
Ancestry in Bodfish
The most populous ancestries reported in Bodfish are English (542 | 23.4%), American (504 | 21.7%), German (265 | 11.4%), Mexican (219 | 9.4%), and Dutch (100 | 4.3%), together accounting for 70.3% of all Bodfish residents.
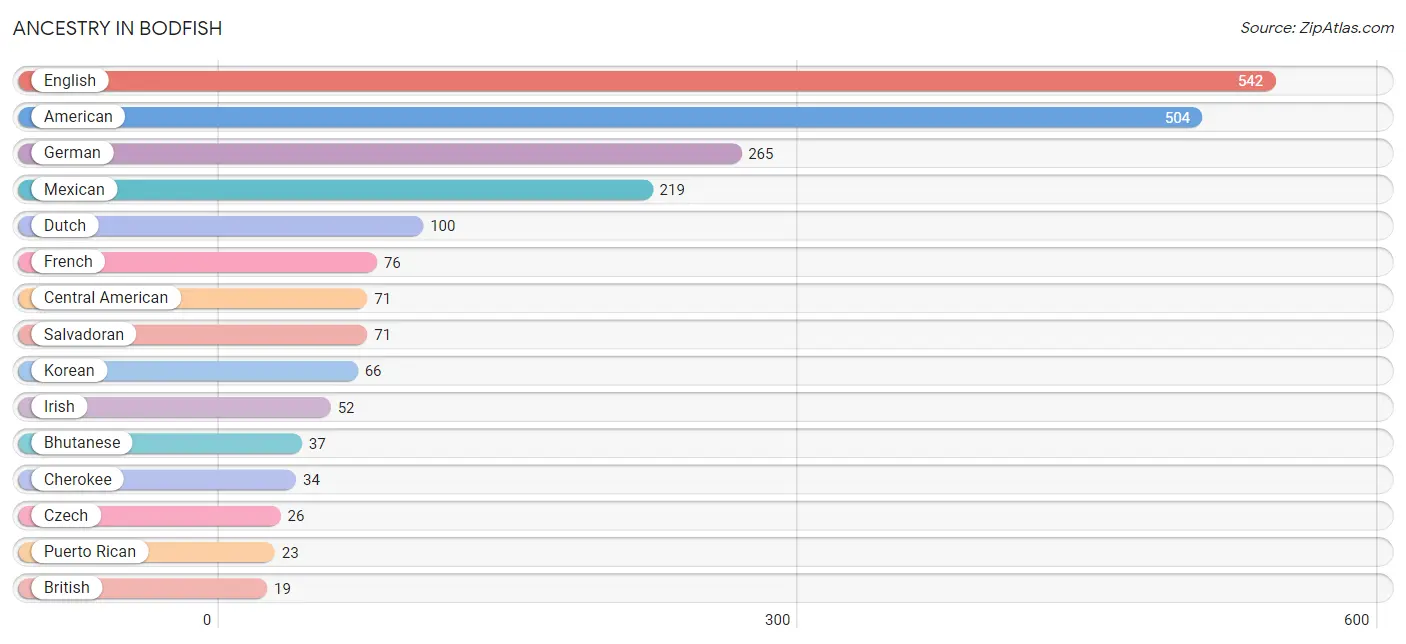
| Ancestry | # Population | % Population |
| American | 504 | 21.7% |
| Bhutanese | 37 | 1.6% |
| British | 19 | 0.8% |
| Central American | 71 | 3.1% |
| Cherokee | 34 | 1.5% |
| Czech | 26 | 1.1% |
| Dutch | 100 | 4.3% |
| English | 542 | 23.4% |
| French | 76 | 3.3% |
| German | 265 | 11.4% |
| Irish | 52 | 2.2% |
| Italian | 18 | 0.8% |
| Korean | 66 | 2.8% |
| Mexican | 219 | 9.4% |
| Polish | 18 | 0.8% |
| Puerto Rican | 23 | 1.0% |
| Russian | 10 | 0.4% |
| Salvadoran | 71 | 3.1% |
| Scottish | 15 | 0.6% |
| Swedish | 11 | 0.5% | View All 20 Rows |
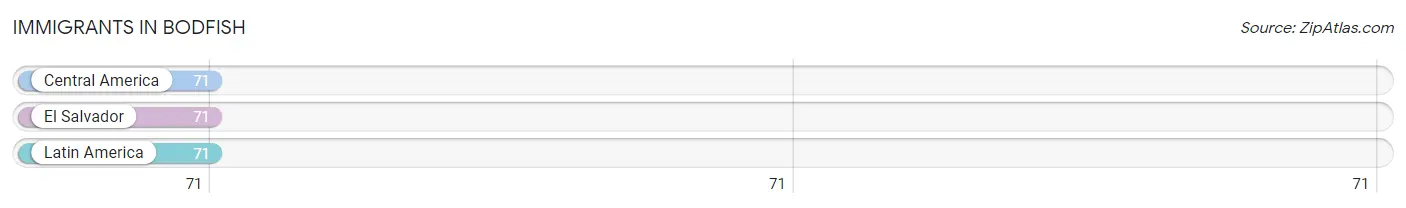
Immigrants in Bodfish
The most numerous immigrant groups reported in Bodfish came from Central America (71 | 3.1%), El Salvador (71 | 3.1%), and Latin America (71 | 3.1%), together accounting for 9.2% of all Bodfish residents.
| Immigration Origin | # Population | % Population |
| Central America | 71 | 3.1% |
| El Salvador | 71 | 3.1% |
| Latin America | 71 | 3.1% | View All 3 Rows |
Sex and Age in Bodfish
Sex and Age in Bodfish
The most populous age groups in Bodfish are 10 to 14 Years (215 | 19.2%) for men and 35 to 39 Years (172 | 14.4%) for women.
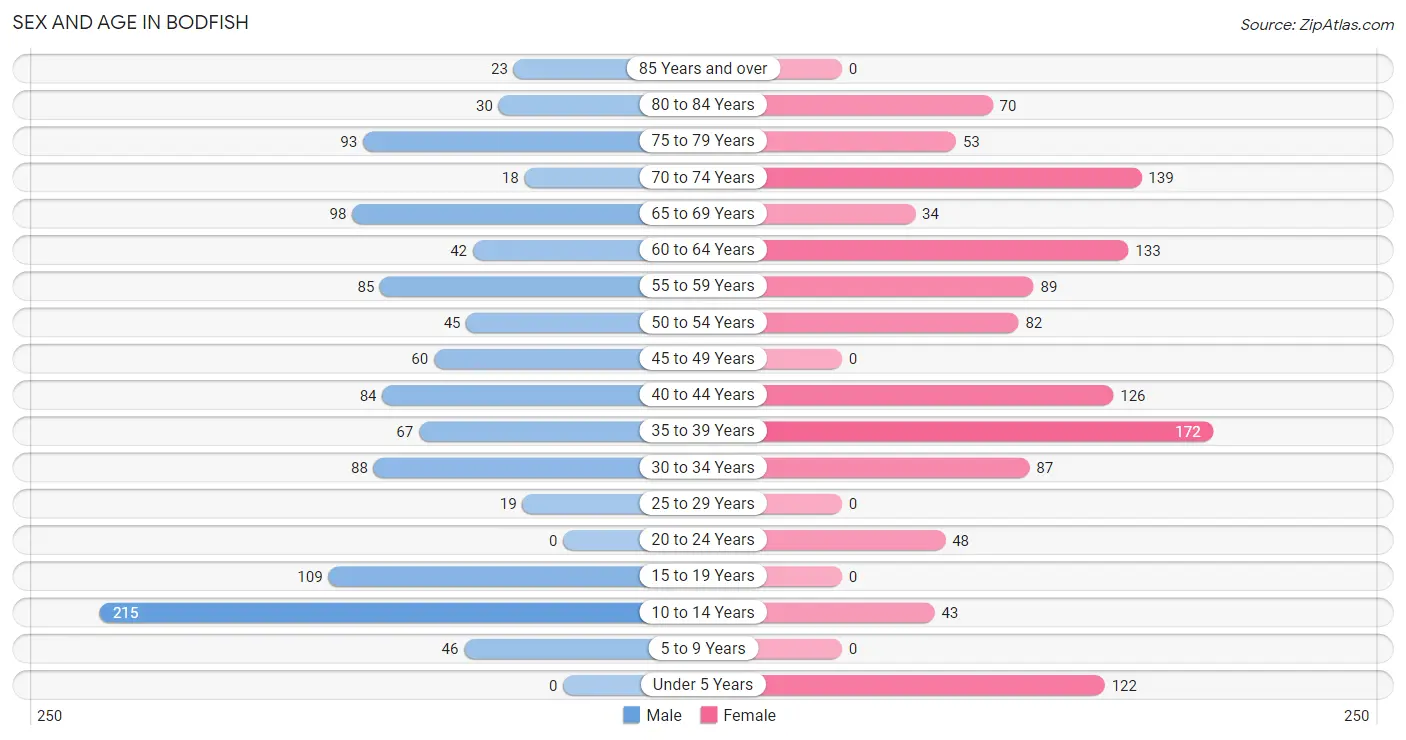
| Age Bracket | Male | Female |
| Under 5 Years | 0 (0.0%) | 122 (10.2%) |
| 5 to 9 Years | 46 (4.1%) | 0 (0.0%) |
| 10 to 14 Years | 215 (19.2%) | 43 (3.6%) |
| 15 to 19 Years | 109 (9.7%) | 0 (0.0%) |
| 20 to 24 Years | 0 (0.0%) | 48 (4.0%) |
| 25 to 29 Years | 19 (1.7%) | 0 (0.0%) |
| 30 to 34 Years | 88 (7.8%) | 87 (7.3%) |
| 35 to 39 Years | 67 (6.0%) | 172 (14.4%) |
| 40 to 44 Years | 84 (7.5%) | 126 (10.5%) |
| 45 to 49 Years | 60 (5.3%) | 0 (0.0%) |
| 50 to 54 Years | 45 (4.0%) | 82 (6.8%) |
| 55 to 59 Years | 85 (7.6%) | 89 (7.4%) |
| 60 to 64 Years | 42 (3.7%) | 133 (11.1%) |
| 65 to 69 Years | 98 (8.7%) | 34 (2.8%) |
| 70 to 74 Years | 18 (1.6%) | 139 (11.6%) |
| 75 to 79 Years | 93 (8.3%) | 53 (4.4%) |
| 80 to 84 Years | 30 (2.7%) | 70 (5.8%) |
| 85 Years and over | 23 (2.1%) | 0 (0.0%) |
| Total | 1,122 (100.0%) | 1,198 (100.0%) |
Families and Households in Bodfish
Median Family Size in Bodfish
The median family size in Bodfish is 3.09 persons per family, with single female/mother families (54 | 8.5%) accounting for the largest median family size of 4.59 persons per family. On the other hand, single male/father families (77 | 12.1%) represent the smallest median family size with 2.00 persons per family.
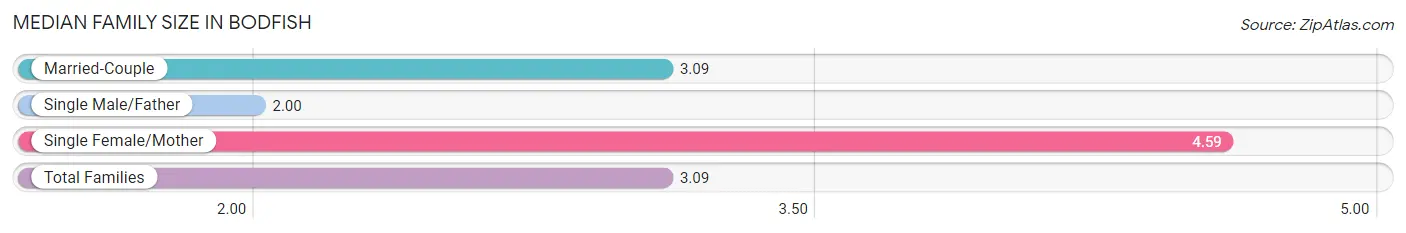
| Family Type | # Families | Family Size |
| Married-Couple | 504 (79.4%) | 3.09 |
| Single Male/Father | 77 (12.1%) | 2.00 |
| Single Female/Mother | 54 (8.5%) | 4.59 |
| Total Families | 635 (100.0%) | 3.09 |
Median Household Size in Bodfish
The median household size in Bodfish is 2.59 persons per household, with single female/mother households (54 | 6.0%) accounting for the largest median household size of 5.35 persons per household. non-family households (262 | 29.2%) represent the smallest median household size with 1.22 persons per household.
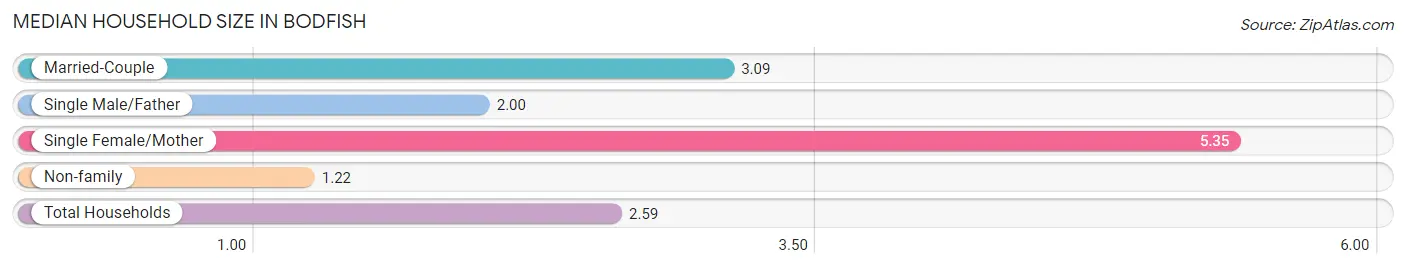
| Household Type | # Households | Household Size |
| Married-Couple | 504 (56.2%) | 3.09 |
| Single Male/Father | 77 (8.6%) | 2.00 |
| Single Female/Mother | 54 (6.0%) | 5.35 |
| Non-family | 262 (29.2%) | 1.22 |
| Total Households | 897 (100.0%) | 2.59 |
Household Size by Marriage Status in Bodfish
Out of a total of 897 households in Bodfish, 635 (70.8%) are family households, while 262 (29.2%) are nonfamily households. The most numerous type of family households are 2-person households, comprising 344, and the most common type of nonfamily households are 1-person households, comprising 228.
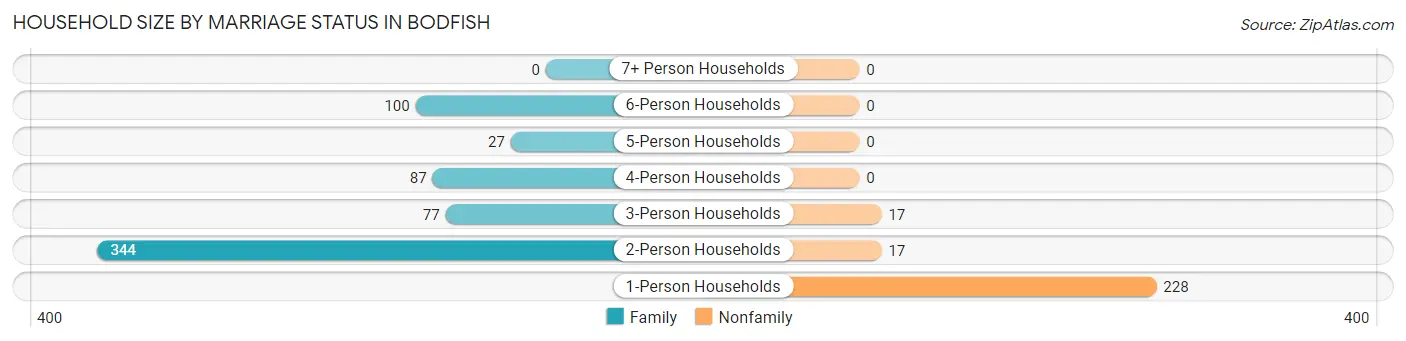
| Household Size | Family Households | Nonfamily Households |
| 1-Person Households | - | 228 (25.4%) |
| 2-Person Households | 344 (38.4%) | 17 (1.9%) |
| 3-Person Households | 77 (8.6%) | 17 (1.9%) |
| 4-Person Households | 87 (9.7%) | 0 (0.0%) |
| 5-Person Households | 27 (3.0%) | 0 (0.0%) |
| 6-Person Households | 100 (11.2%) | 0 (0.0%) |
| 7+ Person Households | 0 (0.0%) | 0 (0.0%) |
| Total | 635 (70.8%) | 262 (29.2%) |
Female Fertility in Bodfish
Fertility by Age in Bodfish
| Age Bracket | Women with Births | Births / 1,000 Women |
| 15 to 19 years | 0 (0.0%) | 0.0 |
| 20 to 34 years | 0 (0.0%) | 0.0 |
| 35 to 50 years | 0 (0.0%) | 0.0 |
| Total | 0 (0.0%) | 0.0 |
Fertility by Age by Marriage Status in Bodfish
| Age Bracket | Married | Unmarried |
| 15 to 19 years | 0 (0.0%) | 0 (0.0%) |
| 20 to 34 years | 0 (0.0%) | 0 (0.0%) |
| 35 to 50 years | 0 (0.0%) | 0 (0.0%) |
| Total | 0 (0.0%) | 0 (0.0%) |
Fertility by Education in Bodfish
| Educational Attainment | Women with Births | Births / 1,000 Women |
| Less than High School | 0 (0.0%) | 0.0 |
| High School Diploma | 0 (0.0%) | 0.0 |
| College or Associate's Degree | 0 (0.0%) | 0.0 |
| Bachelor's Degree | 0 (0.0%) | 0.0 |
| Graduate Degree | 0 (0.0%) | 0.0 |
| Total | 0 (0.0%) | 0.0 |
Fertility by Education by Marriage Status in Bodfish
| Educational Attainment | Married | Unmarried |
| Less than High School | 0 (0.0%) | 0 (0.0%) |
| High School Diploma | 0 (0.0%) | 0 (0.0%) |
| College or Associate's Degree | 0 (0.0%) | 0 (0.0%) |
| Bachelor's Degree | 0 (0.0%) | 0 (0.0%) |
| Graduate Degree | 0 (0.0%) | 0 (0.0%) |
| Total | 0 (0.0%) | 0 (0.0%) |
Employment Characteristics in Bodfish
Employment by Class of Employer in Bodfish
Among the 469 employed individuals in Bodfish, private company employees (268 | 57.1%), local government employees (114 | 24.3%), and state government employees (35 | 7.5%) make up the most common classes of employment.
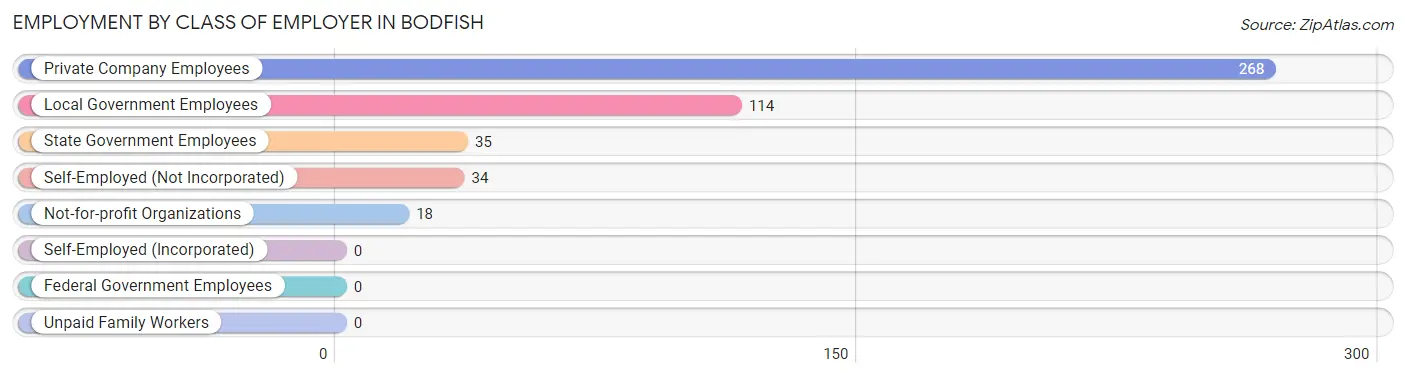
| Employer Class | # Employees | % Employees |
| Private Company Employees | 268 | 57.1% |
| Self-Employed (Incorporated) | 0 | 0.0% |
| Self-Employed (Not Incorporated) | 34 | 7.2% |
| Not-for-profit Organizations | 18 | 3.8% |
| Local Government Employees | 114 | 24.3% |
| State Government Employees | 35 | 7.5% |
| Federal Government Employees | 0 | 0.0% |
| Unpaid Family Workers | 0 | 0.0% |
| Total | 469 | 100.0% |
Employment Status by Age in Bodfish
According to the labor force statistics for Bodfish, out of the total population over 16 years of age (1,850), 32.2% or 596 individuals are in the labor force, with 21.2% or 126 of them unemployed. The age group with the highest labor force participation rate is 25 to 29 years, with 100.0% or 19 individuals in the labor force. Within the labor force, the 25 to 29 years age range has the highest percentage of unemployed individuals, with 100.0% or 19 of them being unemployed.
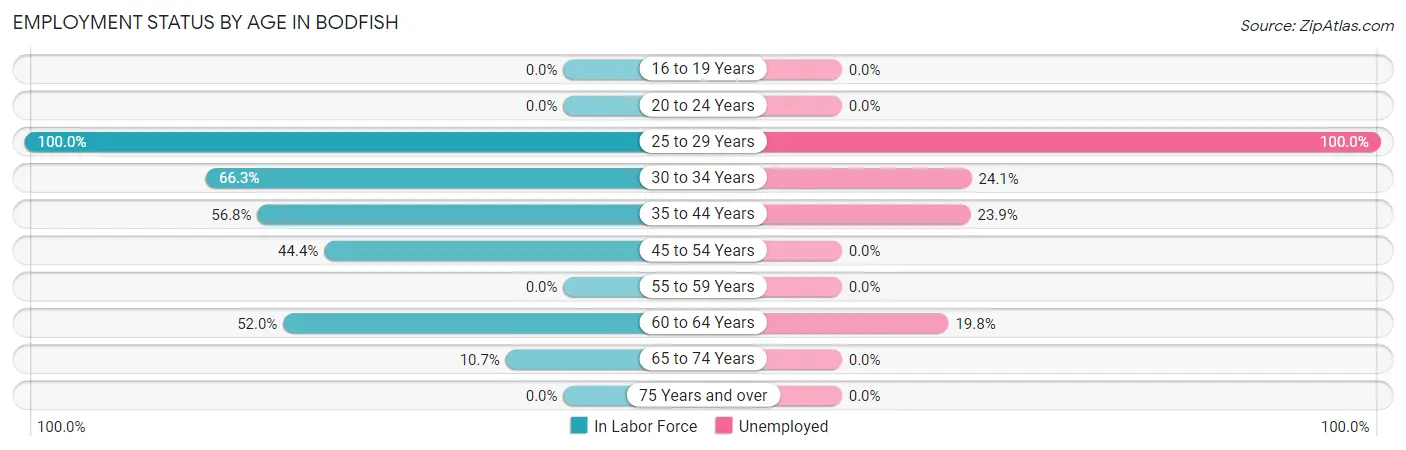
| Age Bracket | In Labor Force | Unemployed |
| 16 to 19 Years | 0 (0.0%) | 0 (0.0%) |
| 20 to 24 Years | 0 (0.0%) | 0 (0.0%) |
| 25 to 29 Years | 19 (100.0%) | 19 (100.0%) |
| 30 to 34 Years | 116 (66.3%) | 28 (24.1%) |
| 35 to 44 Years | 255 (56.8%) | 61 (23.9%) |
| 45 to 54 Years | 83 (44.4%) | 0 (0.0%) |
| 55 to 59 Years | 0 (0.0%) | 0 (0.0%) |
| 60 to 64 Years | 91 (52.0%) | 18 (19.8%) |
| 65 to 74 Years | 31 (10.7%) | 0 (0.0%) |
| 75 Years and over | 0 (0.0%) | 0 (0.0%) |
| Total | 596 (32.2%) | 126 (21.2%) |
Employment Status by Educational Attainment in Bodfish
According to labor force statistics for Bodfish, 47.8% of individuals (564) out of the total population between 25 and 64 years of age (1,179) are in the labor force, with 22.3% or 126 of them being unemployed. The group with the highest labor force participation rate are those with the educational attainment of bachelor's degree or higher, with 69.7% or 140 individuals in the labor force. Within the labor force, individuals with less than high school education have the highest percentage of unemployment, with 57.1% or 28 of them being unemployed.
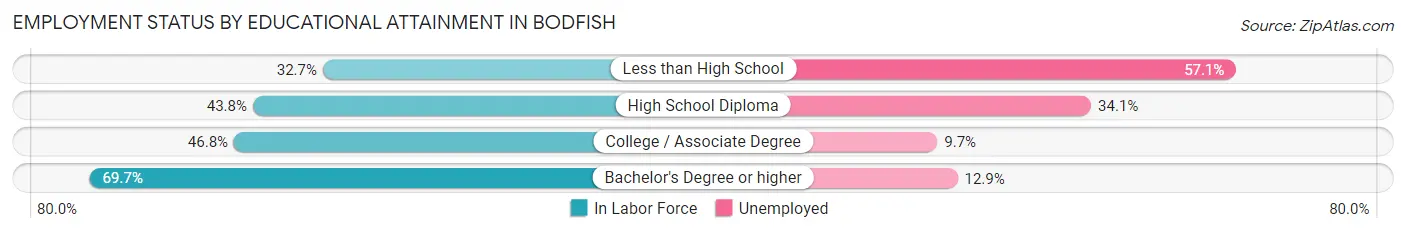
| Educational Attainment | In Labor Force | Unemployed |
| Less than High School | 49 (32.7%) | 86 (57.1%) |
| High School Diploma | 179 (43.8%) | 139 (34.1%) |
| College / Associate Degree | 196 (46.8%) | 41 (9.7%) |
| Bachelor's Degree or higher | 140 (69.7%) | 26 (12.9%) |
| Total | 564 (47.8%) | 263 (22.3%) |
Employment Occupations by Sex in Bodfish
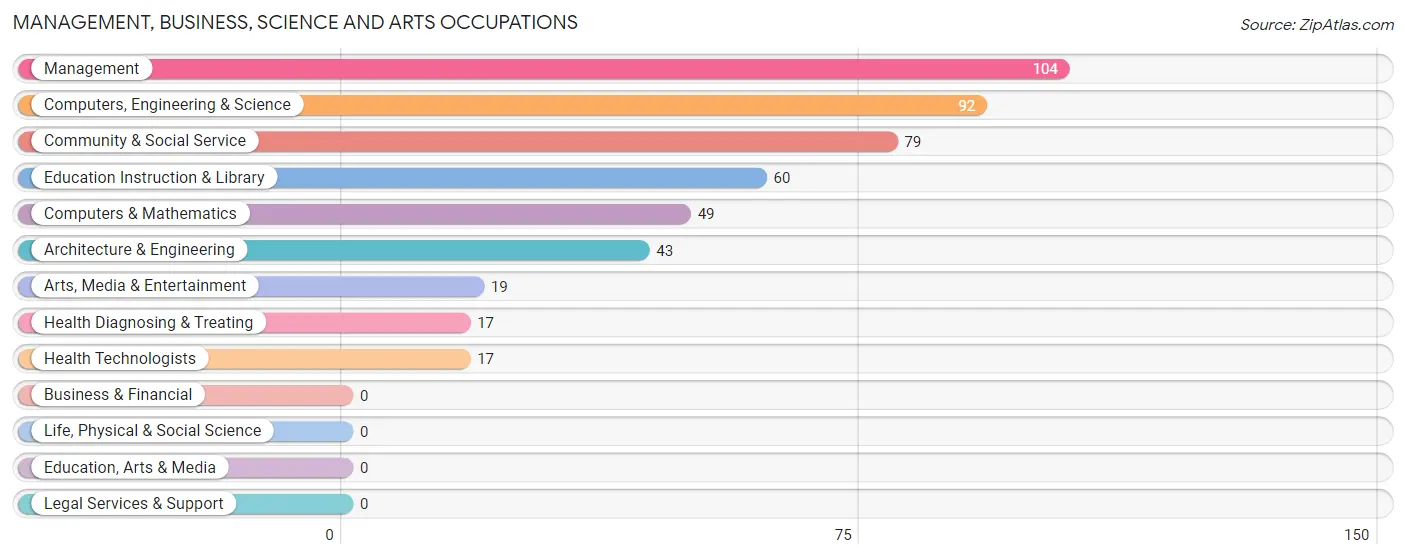
Management, Business, Science and Arts Occupations
The most common Management, Business, Science and Arts occupations in Bodfish are Management (104 | 22.2%), Computers, Engineering & Science (92 | 19.6%), Community & Social Service (79 | 16.8%), Education Instruction & Library (60 | 12.8%), and Computers & Mathematics (49 | 10.4%).
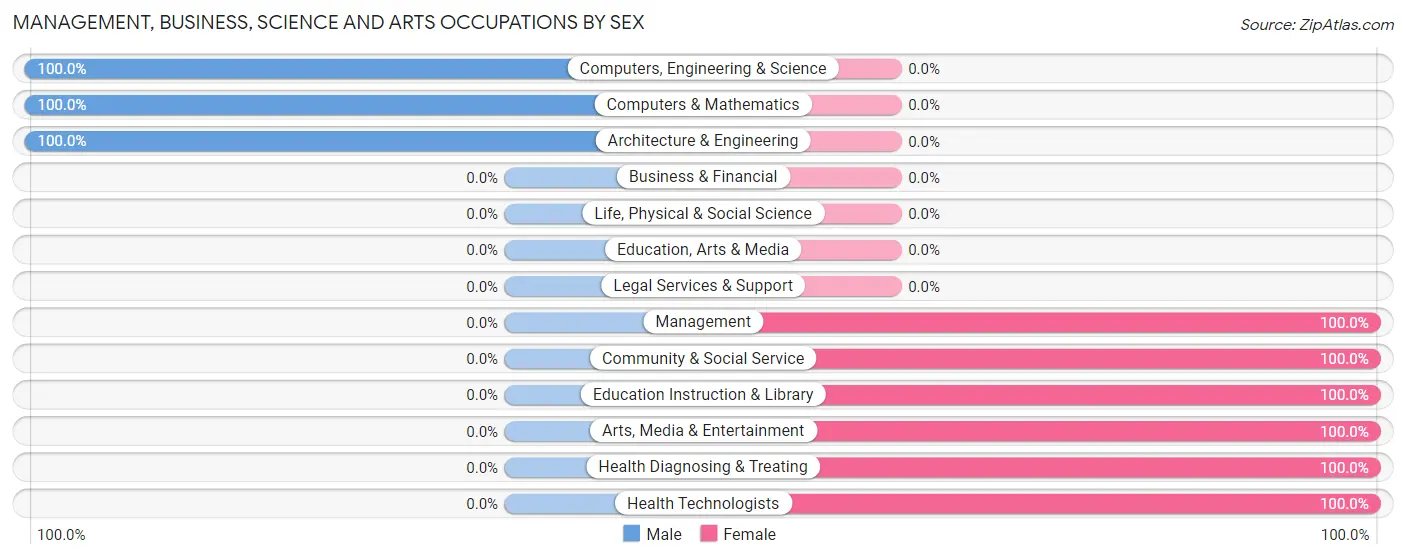
Management, Business, Science and Arts Occupations by Sex
Within the Management, Business, Science and Arts occupations in Bodfish, the most male-oriented occupations are Computers, Engineering & Science (100.0%), Computers & Mathematics (100.0%), and Architecture & Engineering (100.0%), while the most female-oriented occupations are Management (100.0%), Community & Social Service (100.0%), and Education Instruction & Library (100.0%).
| Occupation | Male | Female |
| Management | 0 (0.0%) | 104 (100.0%) |
| Business & Financial | 0 (0.0%) | 0 (0.0%) |
| Computers, Engineering & Science | 92 (100.0%) | 0 (0.0%) |
| Computers & Mathematics | 49 (100.0%) | 0 (0.0%) |
| Architecture & Engineering | 43 (100.0%) | 0 (0.0%) |
| Life, Physical & Social Science | 0 (0.0%) | 0 (0.0%) |
| Community & Social Service | 0 (0.0%) | 79 (100.0%) |
| Education, Arts & Media | 0 (0.0%) | 0 (0.0%) |
| Legal Services & Support | 0 (0.0%) | 0 (0.0%) |
| Education Instruction & Library | 0 (0.0%) | 60 (100.0%) |
| Arts, Media & Entertainment | 0 (0.0%) | 19 (100.0%) |
| Health Diagnosing & Treating | 0 (0.0%) | 17 (100.0%) |
| Health Technologists | 0 (0.0%) | 17 (100.0%) |
| Total (Category) | 92 (31.5%) | 200 (68.5%) |
| Total (Overall) | 186 (39.7%) | 283 (60.3%) |
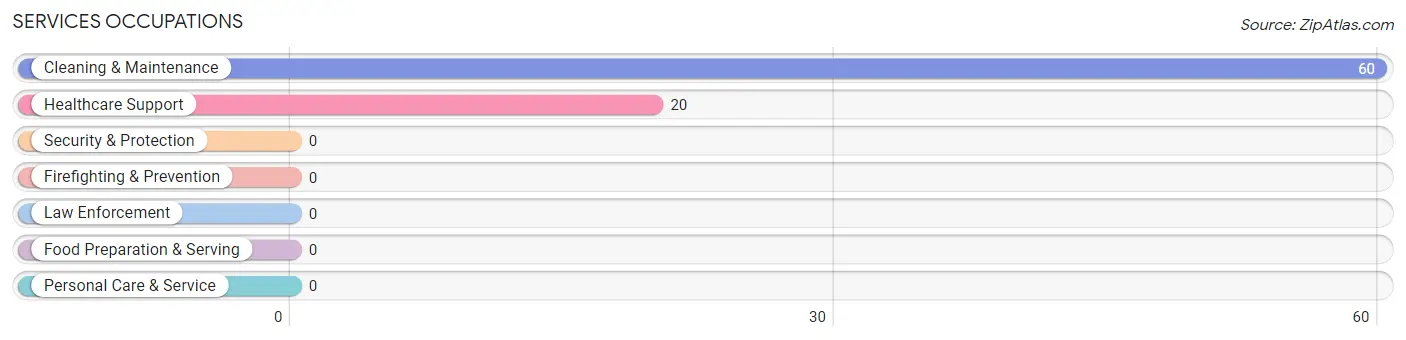
Services Occupations
The most common Services occupations in Bodfish are Cleaning & Maintenance (60 | 12.8%), and Healthcare Support (20 | 4.3%).
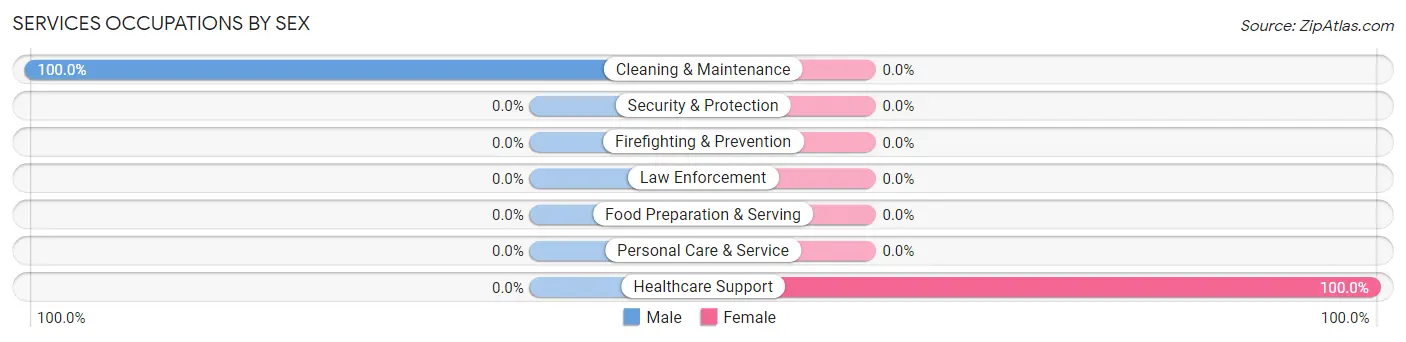
Services Occupations by Sex
| Occupation | Male | Female |
| Healthcare Support | 0 (0.0%) | 20 (100.0%) |
| Security & Protection | 0 (0.0%) | 0 (0.0%) |
| Firefighting & Prevention | 0 (0.0%) | 0 (0.0%) |
| Law Enforcement | 0 (0.0%) | 0 (0.0%) |
| Food Preparation & Serving | 0 (0.0%) | 0 (0.0%) |
| Cleaning & Maintenance | 60 (100.0%) | 0 (0.0%) |
| Personal Care & Service | 0 (0.0%) | 0 (0.0%) |
| Total (Category) | 60 (75.0%) | 20 (25.0%) |
| Total (Overall) | 186 (39.7%) | 283 (60.3%) |
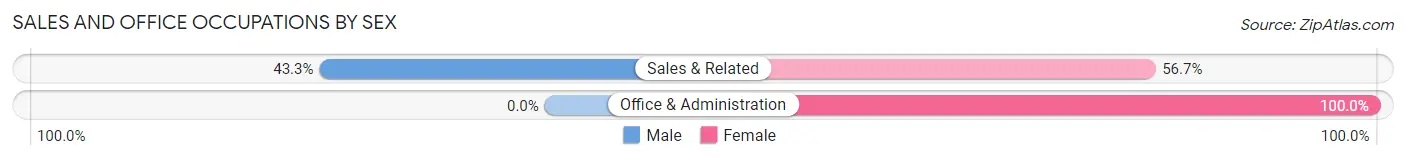
Sales and Office Occupations
The most common Sales and Office occupations in Bodfish are Sales & Related (30 | 6.4%), and Office & Administration (28 | 6.0%).
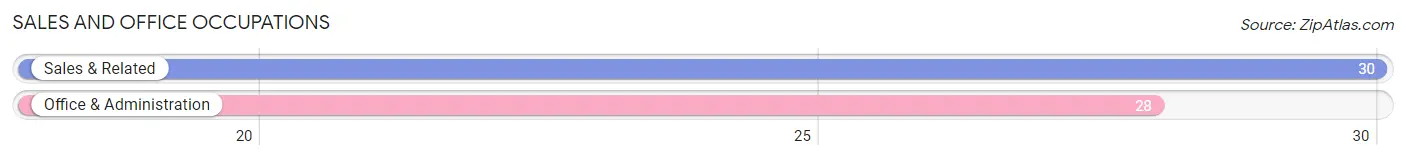
Sales and Office Occupations by Sex
| Occupation | Male | Female |
| Sales & Related | 13 (43.3%) | 17 (56.7%) |
| Office & Administration | 0 (0.0%) | 28 (100.0%) |
| Total (Category) | 13 (22.4%) | 45 (77.6%) |
| Total (Overall) | 186 (39.7%) | 283 (60.3%) |
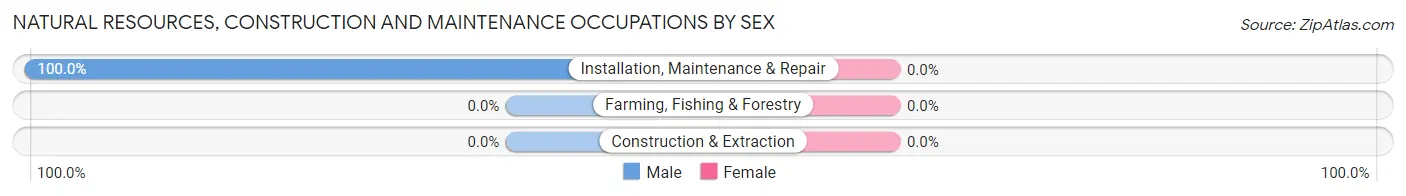
Natural Resources, Construction and Maintenance Occupations
The most common Natural Resources, Construction and Maintenance occupations in Bodfish are , and Installation, Maintenance & Repair (21 | 4.5%).
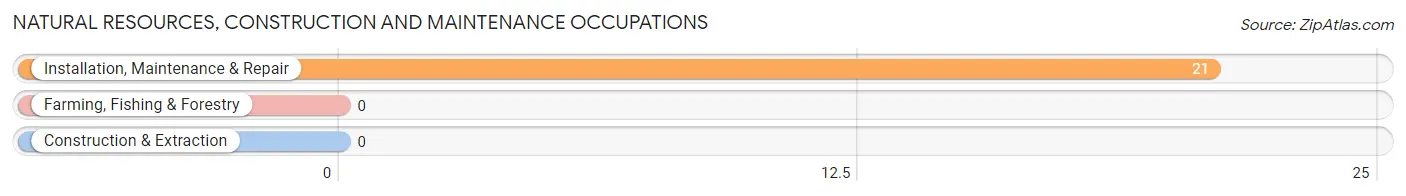
Natural Resources, Construction and Maintenance Occupations by Sex
| Occupation | Male | Female |
| Farming, Fishing & Forestry | 0 (0.0%) | 0 (0.0%) |
| Construction & Extraction | 0 (0.0%) | 0 (0.0%) |
| Installation, Maintenance & Repair | 21 (100.0%) | 0 (0.0%) |
| Total (Category) | 21 (100.0%) | 0 (0.0%) |
| Total (Overall) | 186 (39.7%) | 283 (60.3%) |
Production, Transportation and Moving Occupations
The most common Production, Transportation and Moving occupations in Bodfish are , and Material Moving (18 | 3.8%).
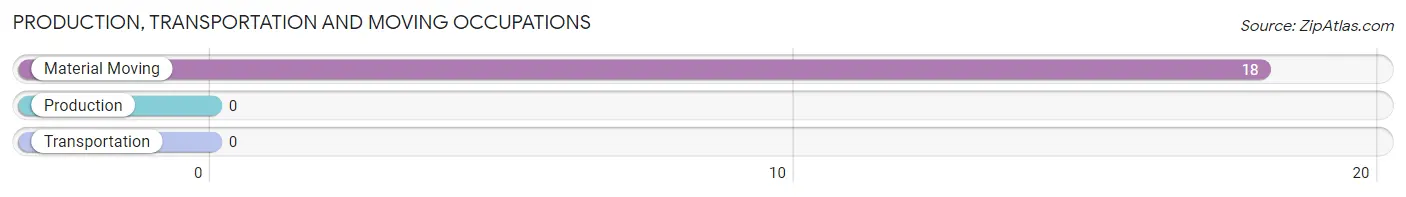
Production, Transportation and Moving Occupations by Sex
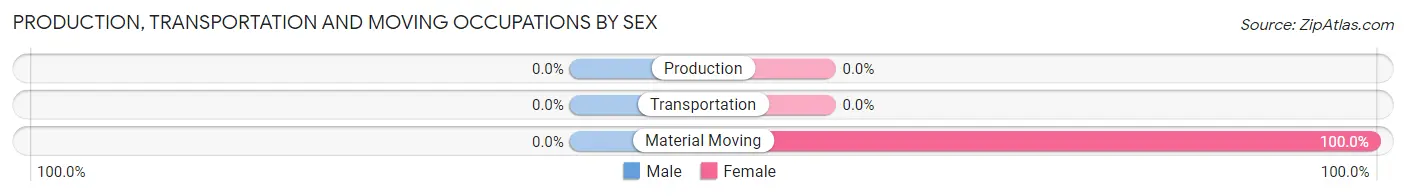
| Occupation | Male | Female |
| Production | 0 (0.0%) | 0 (0.0%) |
| Transportation | 0 (0.0%) | 0 (0.0%) |
| Material Moving | 0 (0.0%) | 18 (100.0%) |
| Total (Category) | 0 (0.0%) | 18 (100.0%) |
| Total (Overall) | 186 (39.7%) | 283 (60.3%) |
Employment Industries by Sex in Bodfish
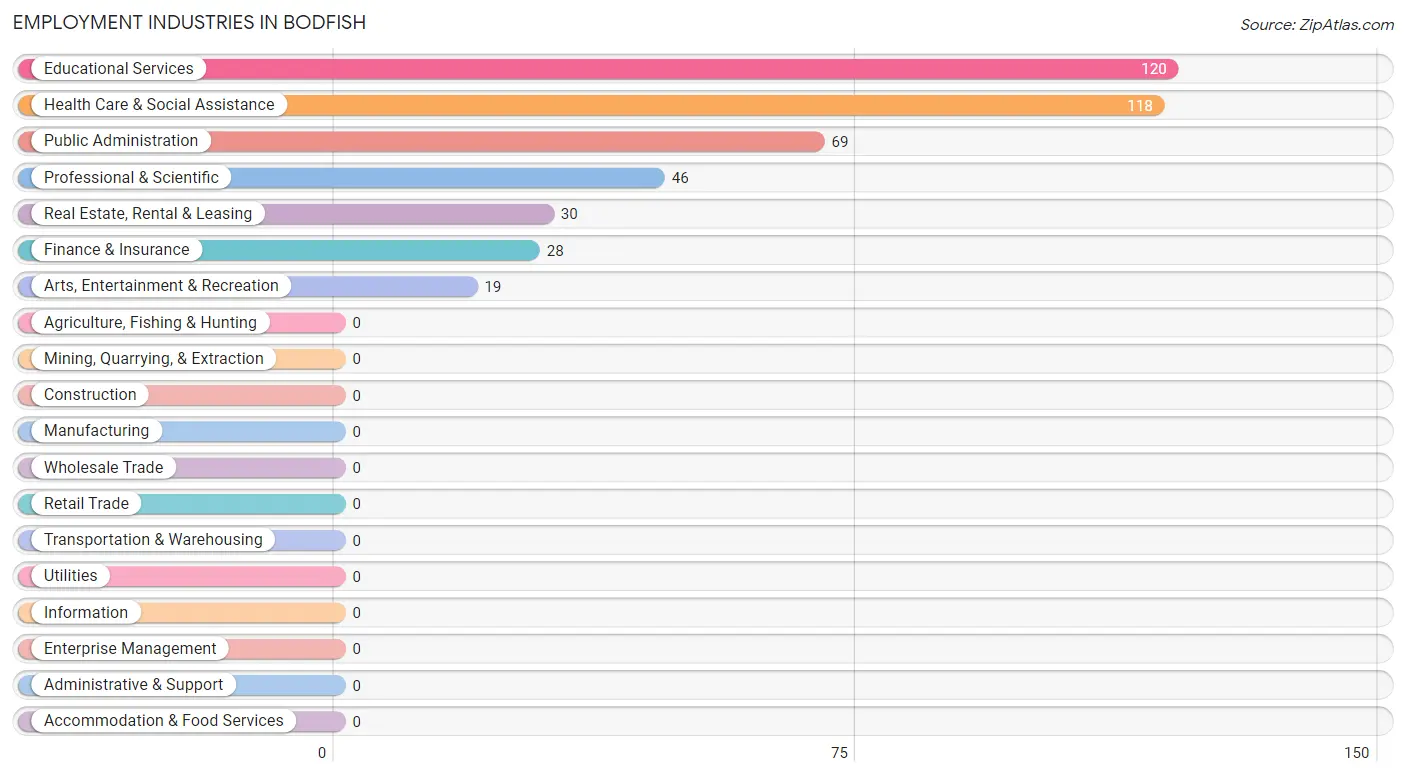
Employment Industries in Bodfish
The major employment industries in Bodfish include Educational Services (120 | 25.6%), Health Care & Social Assistance (118 | 25.2%), Public Administration (69 | 14.7%), Professional & Scientific (46 | 9.8%), and Real Estate, Rental & Leasing (30 | 6.4%).
Employment Industries by Sex in Bodfish
The Bodfish industries that see more men than women are Public Administration (100.0%), Health Care & Social Assistance (50.8%), and Professional & Scientific (50.0%), whereas the industries that tend to have a higher number of women are Finance & Insurance (100.0%), Educational Services (100.0%), and Arts, Entertainment & Recreation (100.0%).
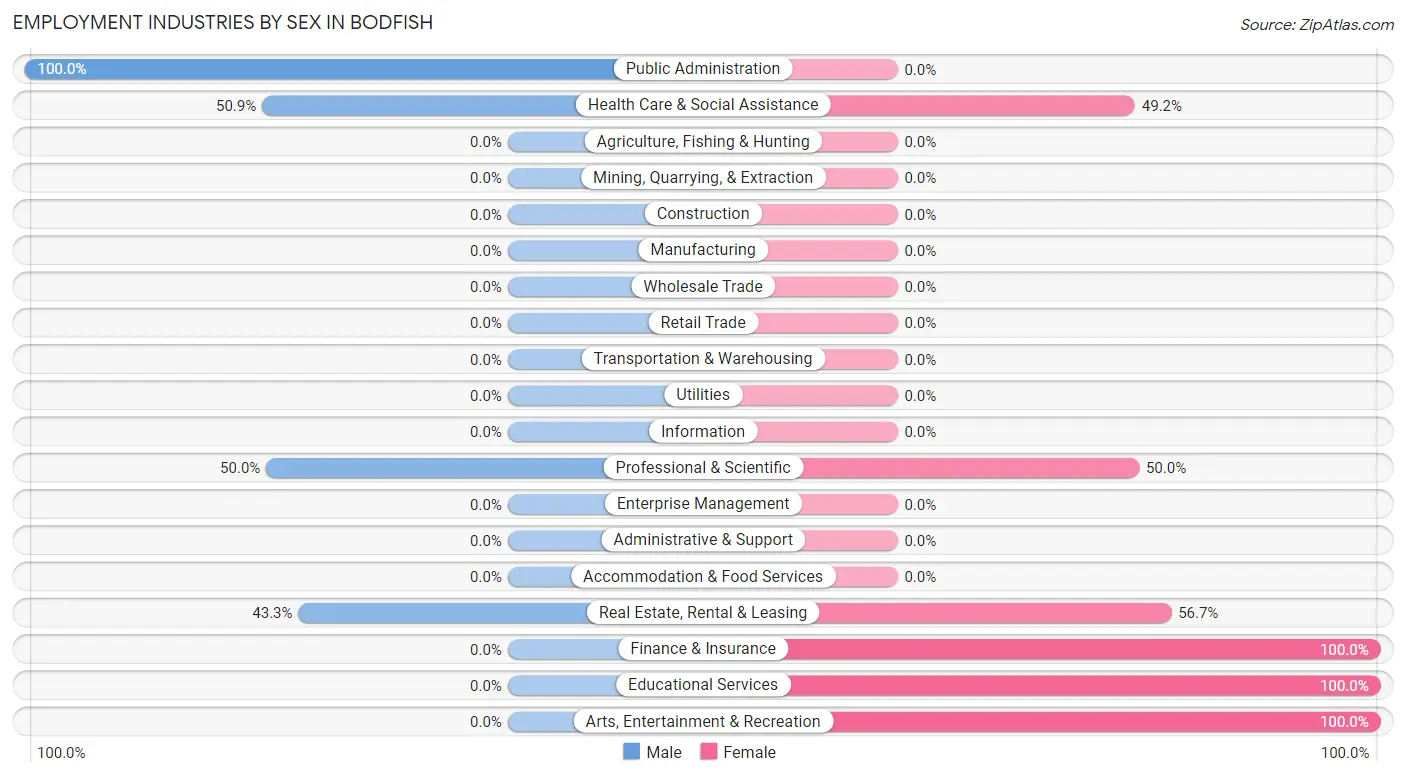
| Industry | Male | Female |
| Agriculture, Fishing & Hunting | 0 (0.0%) | 0 (0.0%) |
| Mining, Quarrying, & Extraction | 0 (0.0%) | 0 (0.0%) |
| Construction | 0 (0.0%) | 0 (0.0%) |
| Manufacturing | 0 (0.0%) | 0 (0.0%) |
| Wholesale Trade | 0 (0.0%) | 0 (0.0%) |
| Retail Trade | 0 (0.0%) | 0 (0.0%) |
| Transportation & Warehousing | 0 (0.0%) | 0 (0.0%) |
| Utilities | 0 (0.0%) | 0 (0.0%) |
| Information | 0 (0.0%) | 0 (0.0%) |
| Finance & Insurance | 0 (0.0%) | 28 (100.0%) |
| Real Estate, Rental & Leasing | 13 (43.3%) | 17 (56.7%) |
| Professional & Scientific | 23 (50.0%) | 23 (50.0%) |
| Enterprise Management | 0 (0.0%) | 0 (0.0%) |
| Administrative & Support | 0 (0.0%) | 0 (0.0%) |
| Educational Services | 0 (0.0%) | 120 (100.0%) |
| Health Care & Social Assistance | 60 (50.8%) | 58 (49.1%) |
| Arts, Entertainment & Recreation | 0 (0.0%) | 19 (100.0%) |
| Accommodation & Food Services | 0 (0.0%) | 0 (0.0%) |
| Public Administration | 69 (100.0%) | 0 (0.0%) |
| Total | 186 (39.7%) | 283 (60.3%) |
Education in Bodfish
School Enrollment in Bodfish
The most common levels of schooling among the 469 students in Bodfish are middle school (212 | 45.2%), high school (109 | 23.2%), and elementary school (92 | 19.6%).
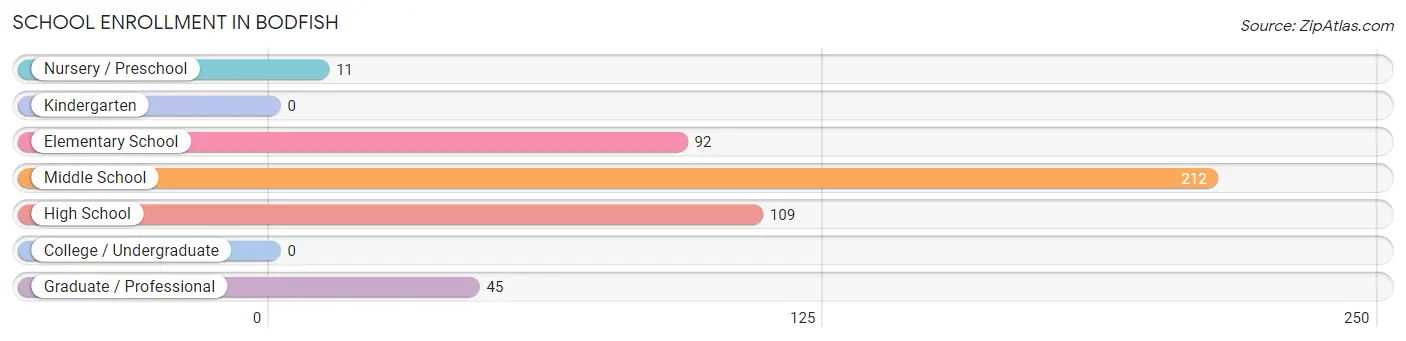
| School Level | # Students | % Students |
| Nursery / Preschool | 11 | 2.4% |
| Kindergarten | 0 | 0.0% |
| Elementary School | 92 | 19.6% |
| Middle School | 212 | 45.2% |
| High School | 109 | 23.2% |
| College / Undergraduate | 0 | 0.0% |
| Graduate / Professional | 45 | 9.6% |
| Total | 469 | 100.0% |
School Enrollment by Age by Funding Source in Bodfish
Out of a total of 469 students who are enrolled in schools in Bodfish, 207 (44.1%) attend a private institution, while the remaining 262 (55.9%) are enrolled in public schools. The age group of 35 years and over has the highest likelihood of being enrolled in private schools, with 45 (100.0% in the age bracket) enrolled. Conversely, the age group of 3 to 4 year olds has the lowest likelihood of being enrolled in a private school, with 11 (100.0% in the age bracket) attending a public institution.
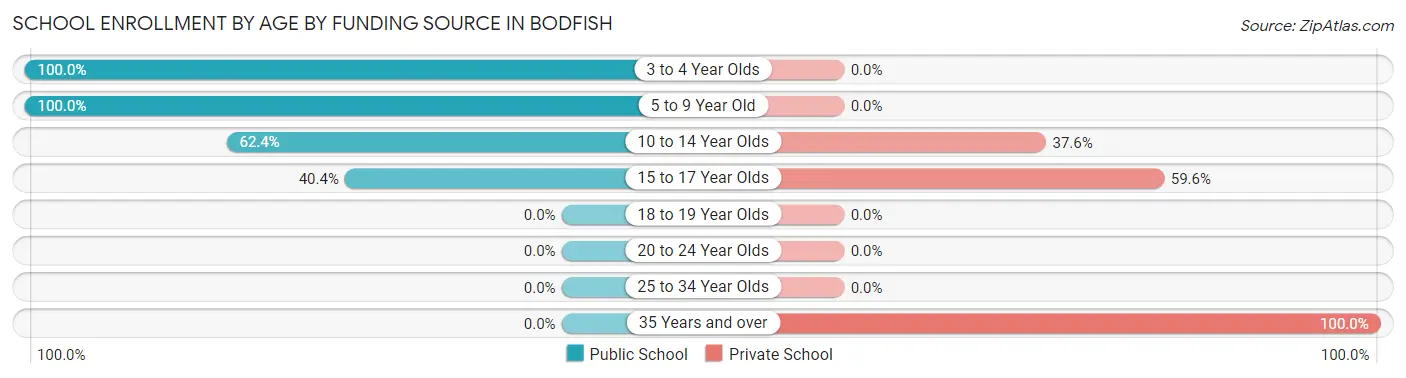
| Age Bracket | Public School | Private School |
| 3 to 4 Year Olds | 11 (100.0%) | 0 (0.0%) |
| 5 to 9 Year Old | 46 (100.0%) | 0 (0.0%) |
| 10 to 14 Year Olds | 161 (62.4%) | 97 (37.6%) |
| 15 to 17 Year Olds | 44 (40.4%) | 65 (59.6%) |
| 18 to 19 Year Olds | 0 (0.0%) | 0 (0.0%) |
| 20 to 24 Year Olds | 0 (0.0%) | 0 (0.0%) |
| 25 to 34 Year Olds | 0 (0.0%) | 0 (0.0%) |
| 35 Years and over | 0 (0.0%) | 45 (100.0%) |
| Total | 262 (55.9%) | 207 (44.1%) |
Educational Attainment by Field of Study in Bodfish
Psychology (61 | 22.0%), liberal arts & history (60 | 21.7%), education (45 | 16.3%), arts & humanities (42 | 15.2%), and business (31 | 11.2%) are the most common fields of study among 277 individuals in Bodfish who have obtained a bachelor's degree or higher.
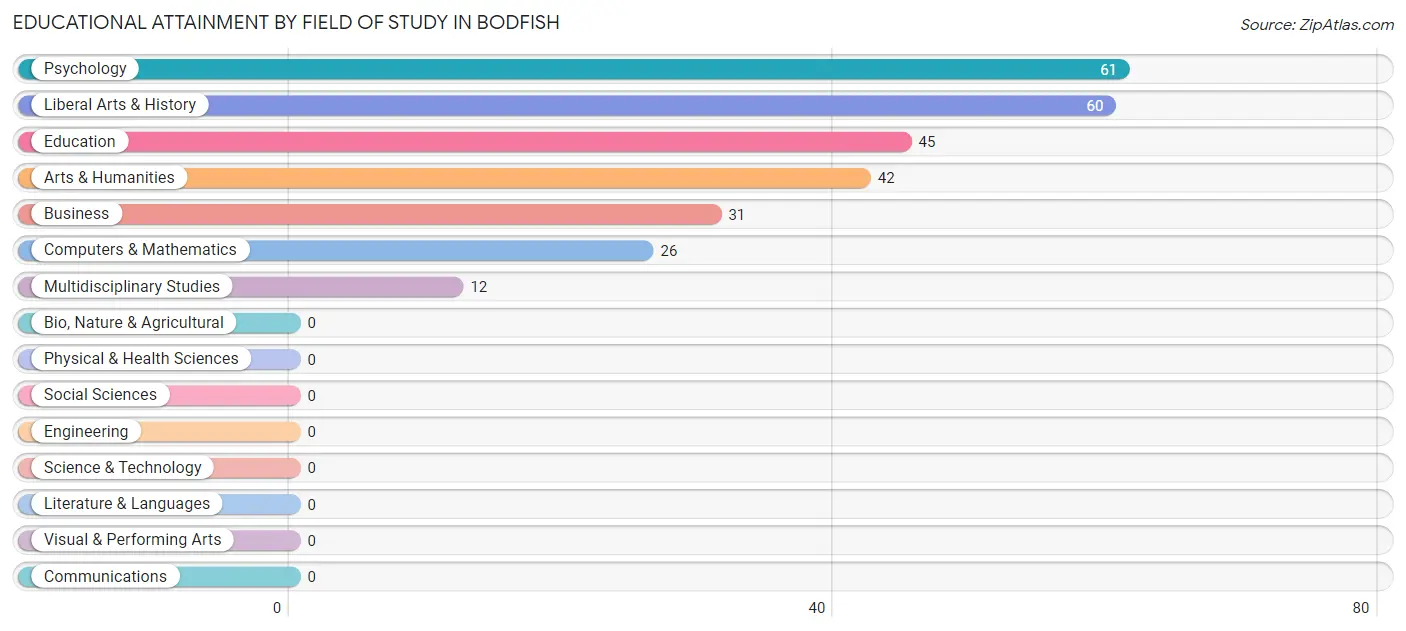
| Field of Study | # Graduates | % Graduates |
| Computers & Mathematics | 26 | 9.4% |
| Bio, Nature & Agricultural | 0 | 0.0% |
| Physical & Health Sciences | 0 | 0.0% |
| Psychology | 61 | 22.0% |
| Social Sciences | 0 | 0.0% |
| Engineering | 0 | 0.0% |
| Multidisciplinary Studies | 12 | 4.3% |
| Science & Technology | 0 | 0.0% |
| Business | 31 | 11.2% |
| Education | 45 | 16.3% |
| Literature & Languages | 0 | 0.0% |
| Liberal Arts & History | 60 | 21.7% |
| Visual & Performing Arts | 0 | 0.0% |
| Communications | 0 | 0.0% |
| Arts & Humanities | 42 | 15.2% |
| Total | 277 | 100.0% |
Transportation & Commute in Bodfish
Vehicle Availability by Sex in Bodfish
The most prevalent vehicle ownership categories in Bodfish are males with 1 vehicle (83, accounting for 44.6%) and females with 1 vehicle (116, making up 29.3%).
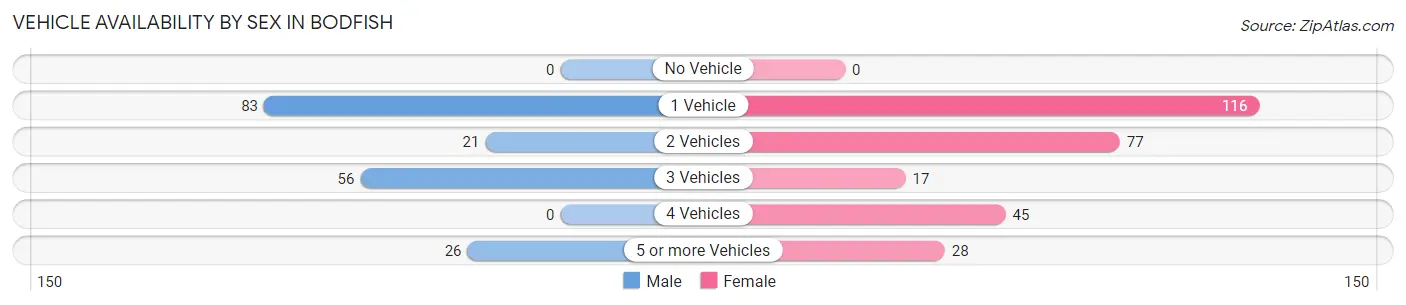
| Vehicles Available | Male | Female |
| No Vehicle | 0 (0.0%) | 0 (0.0%) |
| 1 Vehicle | 83 (44.6%) | 116 (41.0%) |
| 2 Vehicles | 21 (11.3%) | 77 (27.2%) |
| 3 Vehicles | 56 (30.1%) | 17 (6.0%) |
| 4 Vehicles | 0 (0.0%) | 45 (15.9%) |
| 5 or more Vehicles | 26 (14.0%) | 28 (9.9%) |
| Total | 186 (100.0%) | 283 (100.0%) |
Commute Time in Bodfish
The most frequently occuring commute durations in Bodfish are 10 to 14 minutes (166 commuters, 36.7%), 25 to 29 minutes (81 commuters, 17.9%), and 5 to 9 minutes (64 commuters, 14.2%).
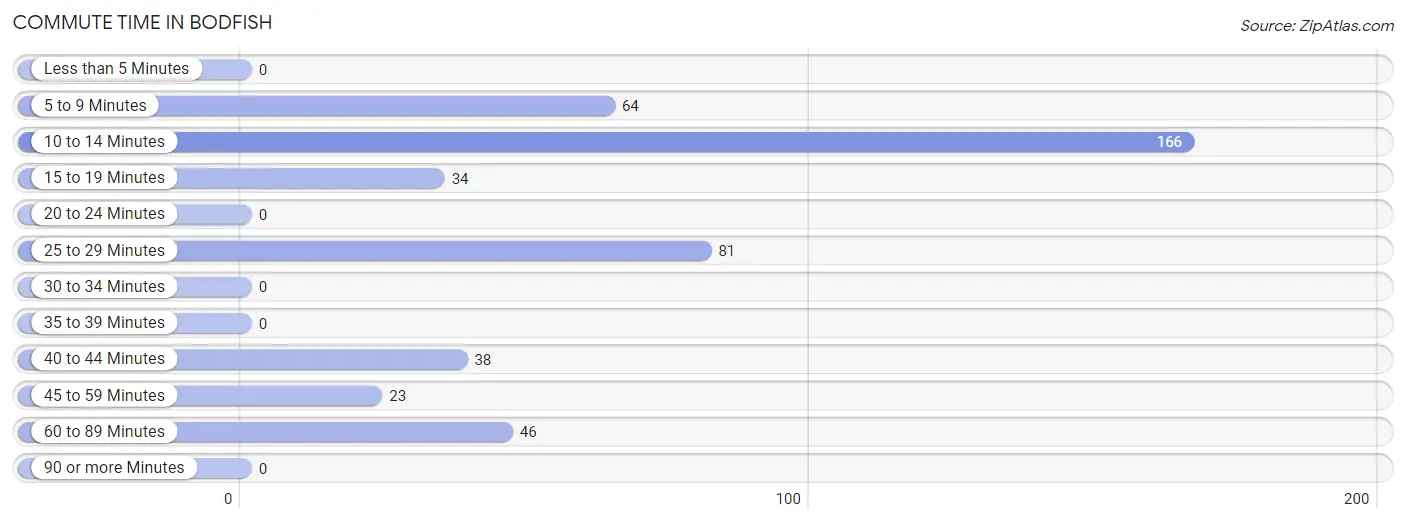
| Commute Time | # Commuters | % Commuters |
| Less than 5 Minutes | 0 | 0.0% |
| 5 to 9 Minutes | 64 | 14.2% |
| 10 to 14 Minutes | 166 | 36.7% |
| 15 to 19 Minutes | 34 | 7.5% |
| 20 to 24 Minutes | 0 | 0.0% |
| 25 to 29 Minutes | 81 | 17.9% |
| 30 to 34 Minutes | 0 | 0.0% |
| 35 to 39 Minutes | 0 | 0.0% |
| 40 to 44 Minutes | 38 | 8.4% |
| 45 to 59 Minutes | 23 | 5.1% |
| 60 to 89 Minutes | 46 | 10.2% |
| 90 or more Minutes | 0 | 0.0% |
Commute Time by Sex in Bodfish
The most common commute times in Bodfish are 25 to 29 minutes (66 commuters, 35.5%) for males and 10 to 14 minutes (106 commuters, 39.9%) for females.
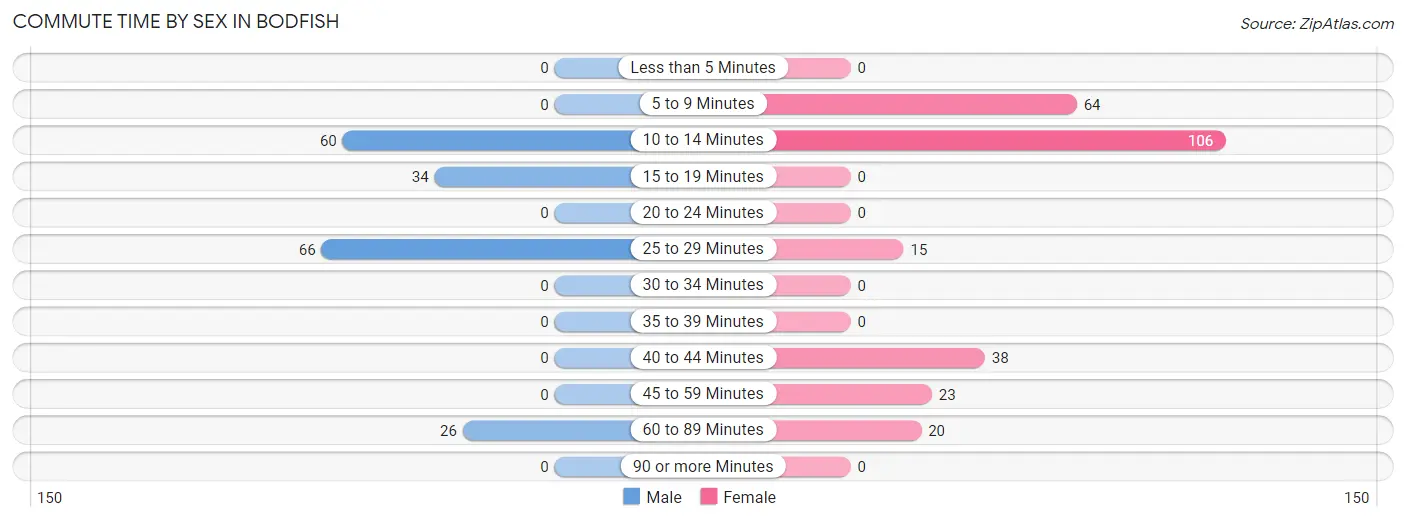
| Commute Time | Male | Female |
| Less than 5 Minutes | 0 (0.0%) | 0 (0.0%) |
| 5 to 9 Minutes | 0 (0.0%) | 64 (24.1%) |
| 10 to 14 Minutes | 60 (32.3%) | 106 (39.9%) |
| 15 to 19 Minutes | 34 (18.3%) | 0 (0.0%) |
| 20 to 24 Minutes | 0 (0.0%) | 0 (0.0%) |
| 25 to 29 Minutes | 66 (35.5%) | 15 (5.6%) |
| 30 to 34 Minutes | 0 (0.0%) | 0 (0.0%) |
| 35 to 39 Minutes | 0 (0.0%) | 0 (0.0%) |
| 40 to 44 Minutes | 0 (0.0%) | 38 (14.3%) |
| 45 to 59 Minutes | 0 (0.0%) | 23 (8.6%) |
| 60 to 89 Minutes | 26 (14.0%) | 20 (7.5%) |
| 90 or more Minutes | 0 (0.0%) | 0 (0.0%) |
Time of Departure to Work by Sex in Bodfish
The most frequent times of departure to work in Bodfish are 7:00 AM to 7:29 AM (66, 35.5%) for males and 6:30 AM to 6:59 AM (88, 33.1%) for females.
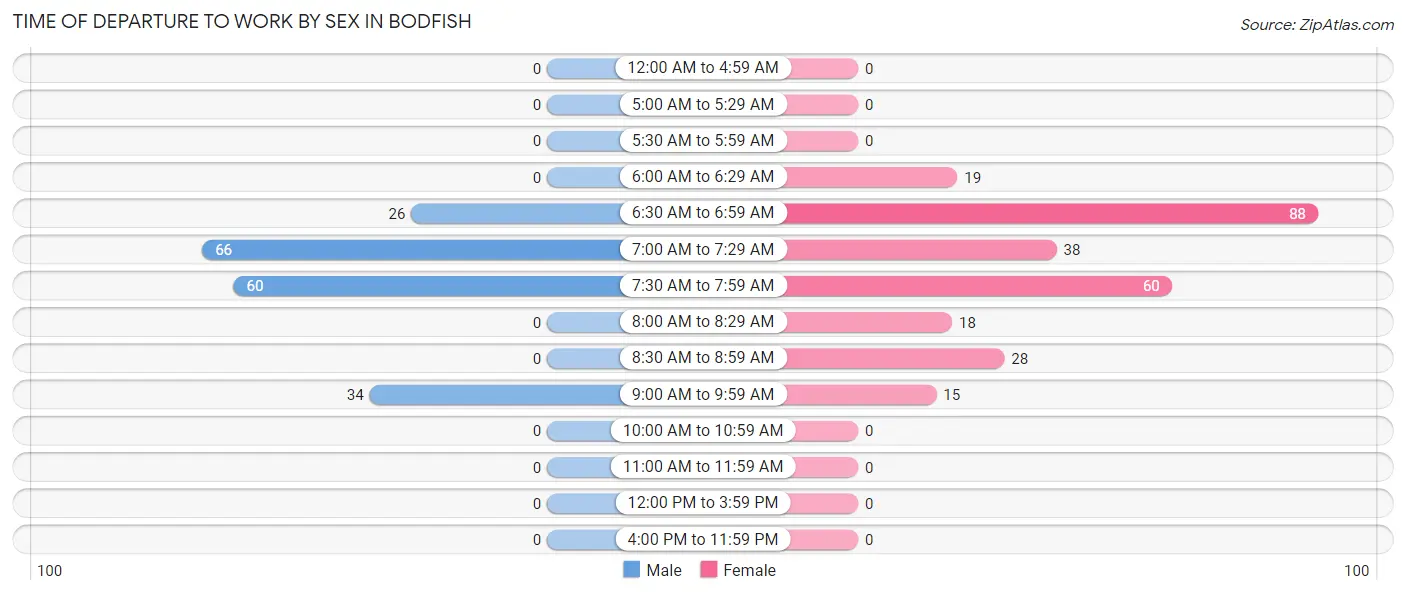
| Time of Departure | Male | Female |
| 12:00 AM to 4:59 AM | 0 (0.0%) | 0 (0.0%) |
| 5:00 AM to 5:29 AM | 0 (0.0%) | 0 (0.0%) |
| 5:30 AM to 5:59 AM | 0 (0.0%) | 0 (0.0%) |
| 6:00 AM to 6:29 AM | 0 (0.0%) | 19 (7.1%) |
| 6:30 AM to 6:59 AM | 26 (14.0%) | 88 (33.1%) |
| 7:00 AM to 7:29 AM | 66 (35.5%) | 38 (14.3%) |
| 7:30 AM to 7:59 AM | 60 (32.3%) | 60 (22.6%) |
| 8:00 AM to 8:29 AM | 0 (0.0%) | 18 (6.8%) |
| 8:30 AM to 8:59 AM | 0 (0.0%) | 28 (10.5%) |
| 9:00 AM to 9:59 AM | 34 (18.3%) | 15 (5.6%) |
| 10:00 AM to 10:59 AM | 0 (0.0%) | 0 (0.0%) |
| 11:00 AM to 11:59 AM | 0 (0.0%) | 0 (0.0%) |
| 12:00 PM to 3:59 PM | 0 (0.0%) | 0 (0.0%) |
| 4:00 PM to 11:59 PM | 0 (0.0%) | 0 (0.0%) |
| Total | 186 (100.0%) | 266 (100.0%) |
Housing Occupancy in Bodfish
Occupancy by Ownership in Bodfish
Of the total 897 dwellings in Bodfish, owner-occupied units account for 536 (59.8%), while renter-occupied units make up 361 (40.3%).
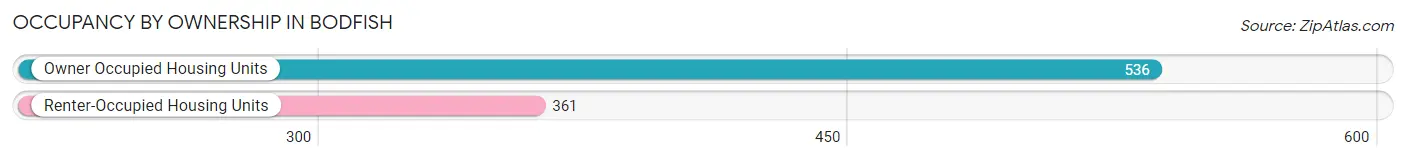
| Occupancy | # Housing Units | % Housing Units |
| Owner Occupied Housing Units | 536 | 59.8% |
| Renter-Occupied Housing Units | 361 | 40.3% |
| Total Occupied Housing Units | 897 | 100.0% |
Occupancy by Household Size in Bodfish
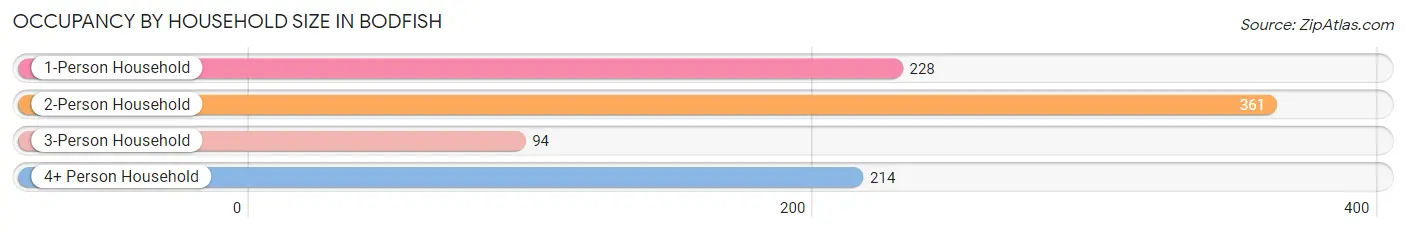
| Household Size | # Housing Units | % Housing Units |
| 1-Person Household | 228 | 25.4% |
| 2-Person Household | 361 | 40.3% |
| 3-Person Household | 94 | 10.5% |
| 4+ Person Household | 214 | 23.9% |
| Total Housing Units | 897 | 100.0% |
Occupancy by Ownership by Household Size in Bodfish
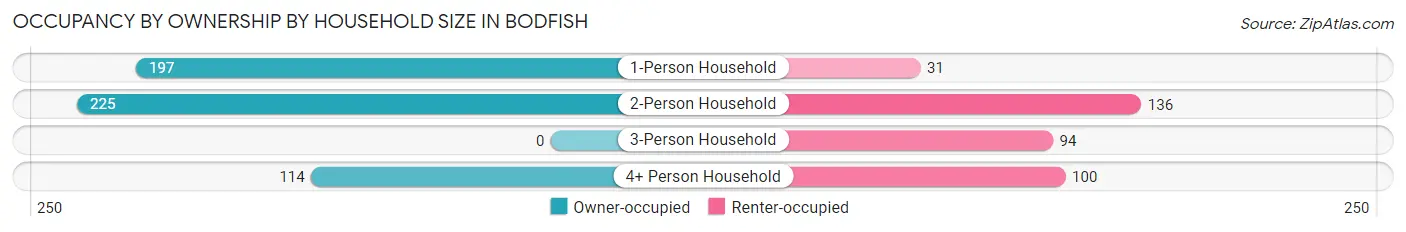
| Household Size | Owner-occupied | Renter-occupied |
| 1-Person Household | 197 (86.4%) | 31 (13.6%) |
| 2-Person Household | 225 (62.3%) | 136 (37.7%) |
| 3-Person Household | 0 (0.0%) | 94 (100.0%) |
| 4+ Person Household | 114 (53.3%) | 100 (46.7%) |
| Total Housing Units | 536 (59.8%) | 361 (40.3%) |
Occupancy by Educational Attainment in Bodfish
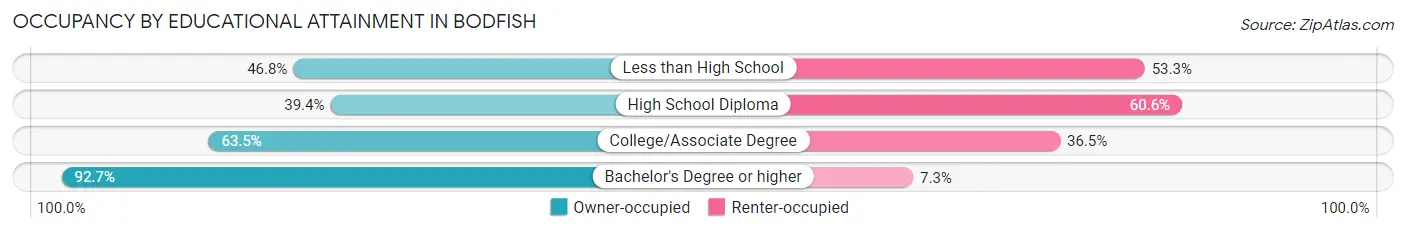
| Household Size | Owner-occupied | Renter-occupied |
| Less than High School | 72 (46.8%) | 82 (53.2%) |
| High School Diploma | 104 (39.4%) | 160 (60.6%) |
| College/Associate Degree | 183 (63.5%) | 105 (36.5%) |
| Bachelor's Degree or higher | 177 (92.7%) | 14 (7.3%) |
Occupancy by Age of Householder in Bodfish
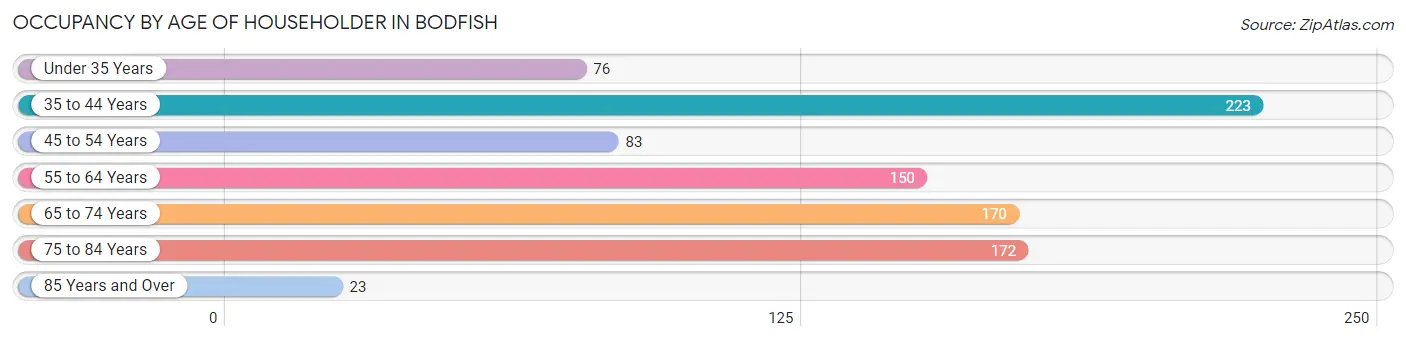
| Age Bracket | # Households | % Households |
| Under 35 Years | 76 | 8.5% |
| 35 to 44 Years | 223 | 24.9% |
| 45 to 54 Years | 83 | 9.2% |
| 55 to 64 Years | 150 | 16.7% |
| 65 to 74 Years | 170 | 19.0% |
| 75 to 84 Years | 172 | 19.2% |
| 85 Years and Over | 23 | 2.6% |
| Total | 897 | 100.0% |
Housing Finances in Bodfish
Median Income by Occupancy in Bodfish
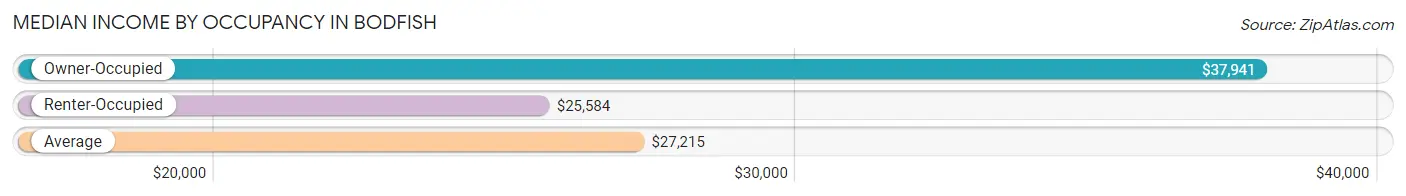
| Occupancy Type | # Households | Median Income |
| Owner-Occupied | 536 (59.8%) | $37,941 |
| Renter-Occupied | 361 (40.3%) | $25,584 |
| Average | 897 (100.0%) | $27,215 |
Occupancy by Householder Income Bracket in Bodfish
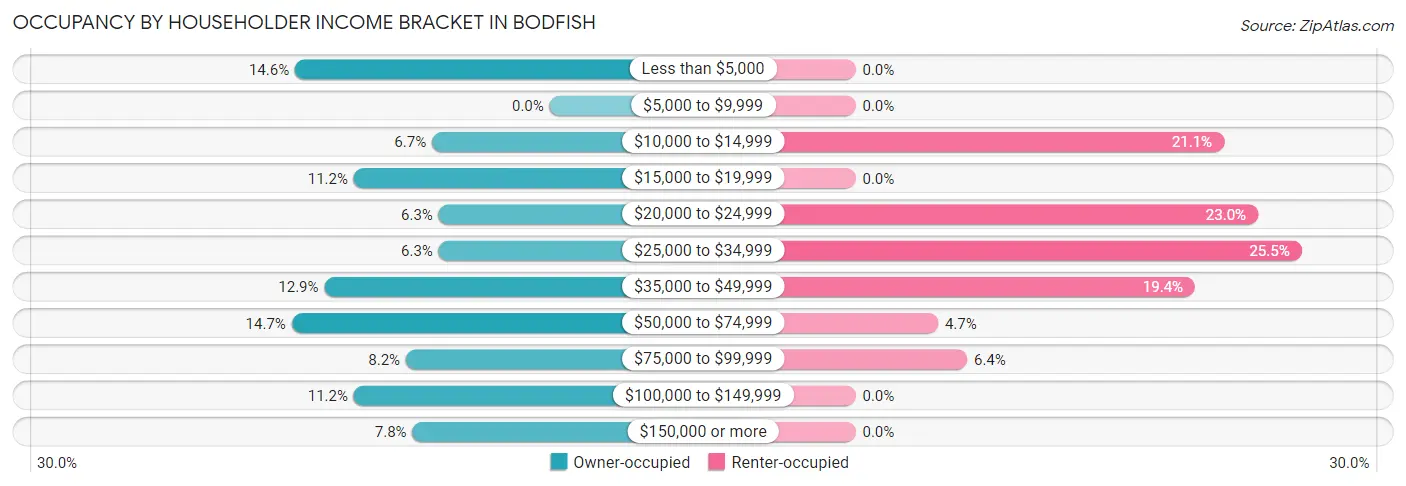
| Income Bracket | Owner-occupied | Renter-occupied |
| Less than $5,000 | 78 (14.5%) | 0 (0.0%) |
| $5,000 to $9,999 | 0 (0.0%) | 0 (0.0%) |
| $10,000 to $14,999 | 36 (6.7%) | 76 (21.0%) |
| $15,000 to $19,999 | 60 (11.2%) | 0 (0.0%) |
| $20,000 to $24,999 | 34 (6.3%) | 83 (23.0%) |
| $25,000 to $34,999 | 34 (6.3%) | 92 (25.5%) |
| $35,000 to $49,999 | 69 (12.9%) | 70 (19.4%) |
| $50,000 to $74,999 | 79 (14.7%) | 17 (4.7%) |
| $75,000 to $99,999 | 44 (8.2%) | 23 (6.4%) |
| $100,000 to $149,999 | 60 (11.2%) | 0 (0.0%) |
| $150,000 or more | 42 (7.8%) | 0 (0.0%) |
| Total | 536 (100.0%) | 361 (100.0%) |
Monthly Housing Cost Tiers in Bodfish
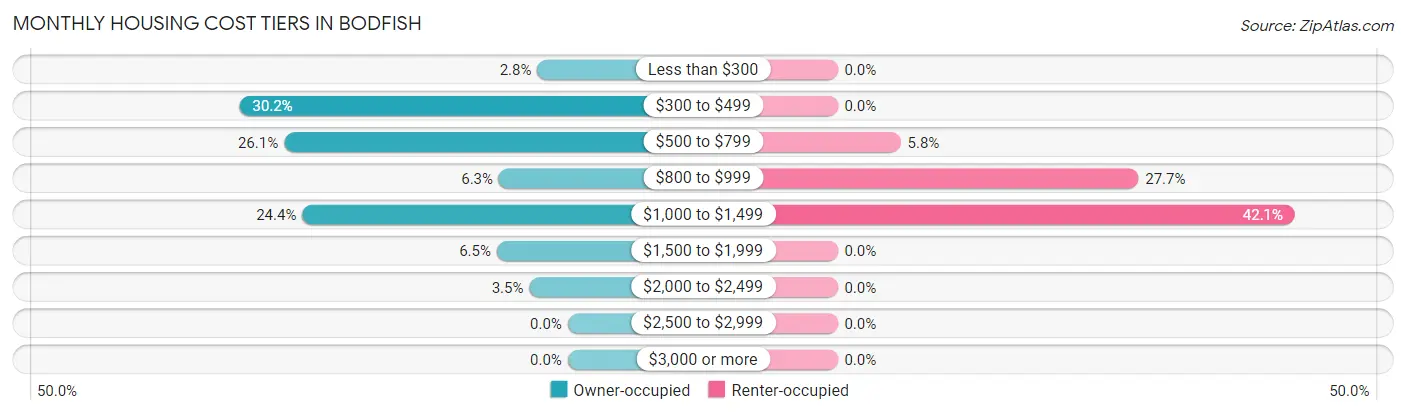
| Monthly Cost | Owner-occupied | Renter-occupied |
| Less than $300 | 15 (2.8%) | 0 (0.0%) |
| $300 to $499 | 162 (30.2%) | 0 (0.0%) |
| $500 to $799 | 140 (26.1%) | 21 (5.8%) |
| $800 to $999 | 34 (6.3%) | 100 (27.7%) |
| $1,000 to $1,499 | 131 (24.4%) | 152 (42.1%) |
| $1,500 to $1,999 | 35 (6.5%) | 0 (0.0%) |
| $2,000 to $2,499 | 19 (3.5%) | 0 (0.0%) |
| $2,500 to $2,999 | 0 (0.0%) | 0 (0.0%) |
| $3,000 or more | 0 (0.0%) | 0 (0.0%) |
| Total | 536 (100.0%) | 361 (100.0%) |
Physical Housing Characteristics in Bodfish
Housing Structures in Bodfish
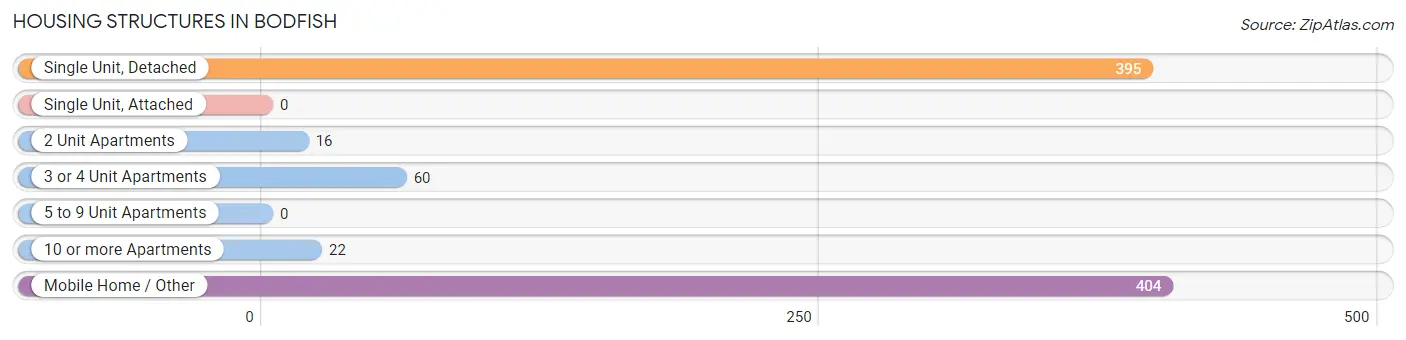
| Structure Type | # Housing Units | % Housing Units |
| Single Unit, Detached | 395 | 44.0% |
| Single Unit, Attached | 0 | 0.0% |
| 2 Unit Apartments | 16 | 1.8% |
| 3 or 4 Unit Apartments | 60 | 6.7% |
| 5 to 9 Unit Apartments | 0 | 0.0% |
| 10 or more Apartments | 22 | 2.5% |
| Mobile Home / Other | 404 | 45.0% |
| Total | 897 | 100.0% |
Housing Structures by Occupancy in Bodfish
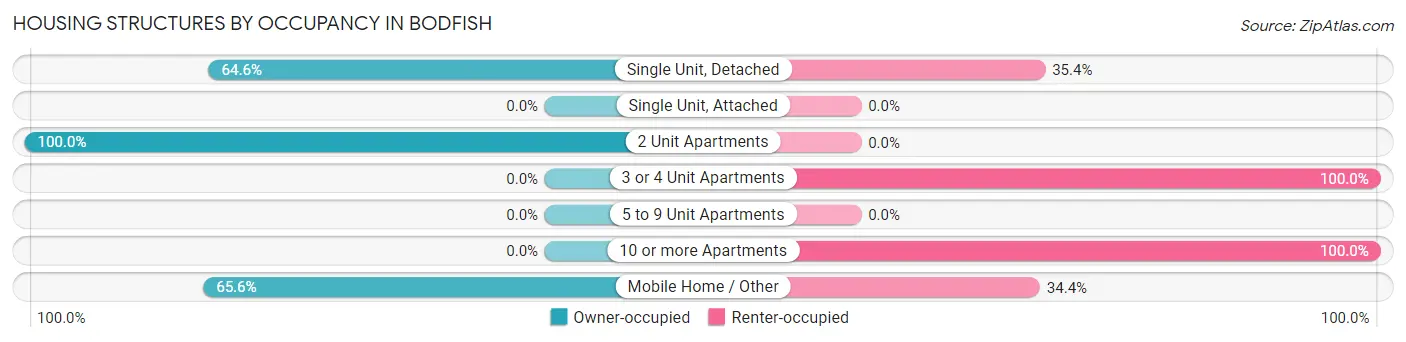
| Structure Type | Owner-occupied | Renter-occupied |
| Single Unit, Detached | 255 (64.6%) | 140 (35.4%) |
| Single Unit, Attached | 0 (0.0%) | 0 (0.0%) |
| 2 Unit Apartments | 16 (100.0%) | 0 (0.0%) |
| 3 or 4 Unit Apartments | 0 (0.0%) | 60 (100.0%) |
| 5 to 9 Unit Apartments | 0 (0.0%) | 0 (0.0%) |
| 10 or more Apartments | 0 (0.0%) | 22 (100.0%) |
| Mobile Home / Other | 265 (65.6%) | 139 (34.4%) |
| Total | 536 (59.8%) | 361 (40.3%) |
Housing Structures by Number of Rooms in Bodfish
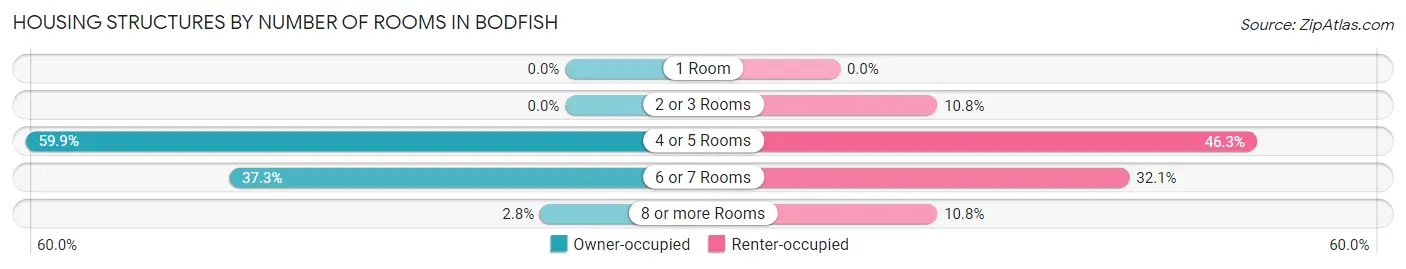
| Number of Rooms | Owner-occupied | Renter-occupied |
| 1 Room | 0 (0.0%) | 0 (0.0%) |
| 2 or 3 Rooms | 0 (0.0%) | 39 (10.8%) |
| 4 or 5 Rooms | 321 (59.9%) | 167 (46.3%) |
| 6 or 7 Rooms | 200 (37.3%) | 116 (32.1%) |
| 8 or more Rooms | 15 (2.8%) | 39 (10.8%) |
| Total | 536 (100.0%) | 361 (100.0%) |
Housing Structure by Heating Type in Bodfish
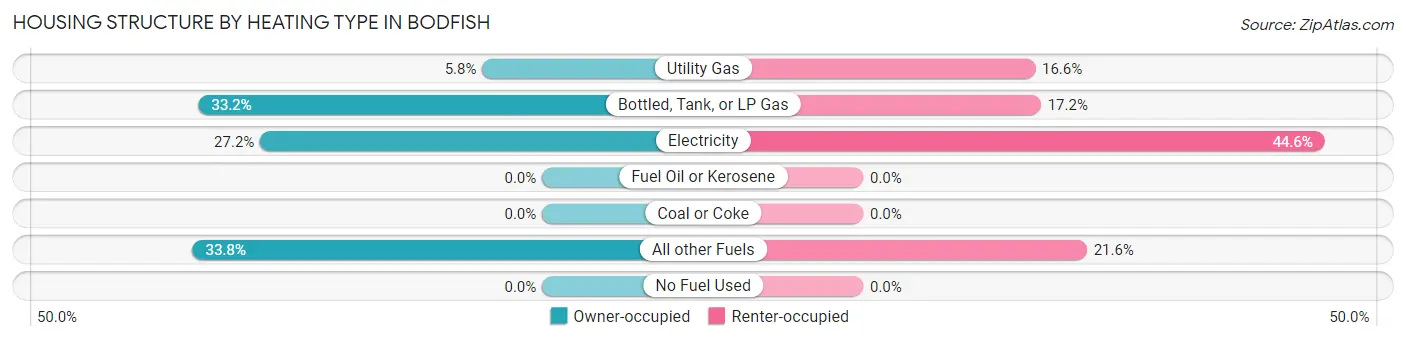
| Heating Type | Owner-occupied | Renter-occupied |
| Utility Gas | 31 (5.8%) | 60 (16.6%) |
| Bottled, Tank, or LP Gas | 178 (33.2%) | 62 (17.2%) |
| Electricity | 146 (27.2%) | 161 (44.6%) |
| Fuel Oil or Kerosene | 0 (0.0%) | 0 (0.0%) |
| Coal or Coke | 0 (0.0%) | 0 (0.0%) |
| All other Fuels | 181 (33.8%) | 78 (21.6%) |
| No Fuel Used | 0 (0.0%) | 0 (0.0%) |
| Total | 536 (100.0%) | 361 (100.0%) |
Household Vehicle Usage in Bodfish
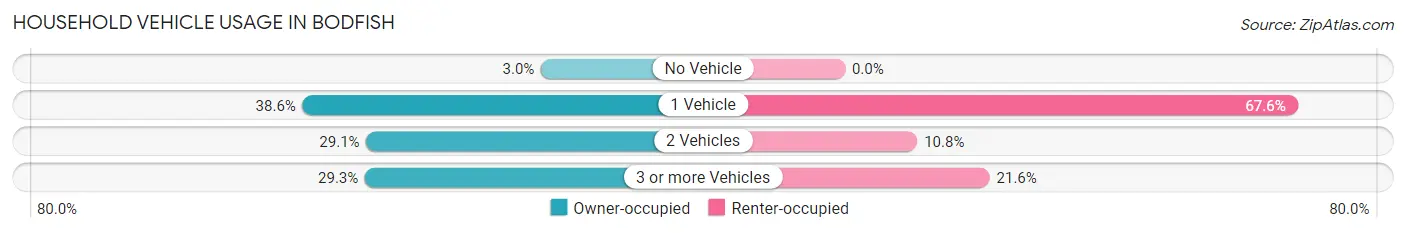
| Vehicles per Household | Owner-occupied | Renter-occupied |
| No Vehicle | 16 (3.0%) | 0 (0.0%) |
| 1 Vehicle | 207 (38.6%) | 244 (67.6%) |
| 2 Vehicles | 156 (29.1%) | 39 (10.8%) |
| 3 or more Vehicles | 157 (29.3%) | 78 (21.6%) |
| Total | 536 (100.0%) | 361 (100.0%) |
Real Estate & Mortgages in Bodfish
Real Estate and Mortgage Overview in Bodfish
| Characteristic | Without Mortgage | With Mortgage |
| Housing Units | 368 | 168 |
| Median Property Value | $105,300 | $181,000 |
| Median Household Income | $30,417 | $42 |
| Monthly Housing Costs | $509 | $0 |
| Real Estate Taxes | $904 | $0 |
Property Value by Mortgage Status in Bodfish
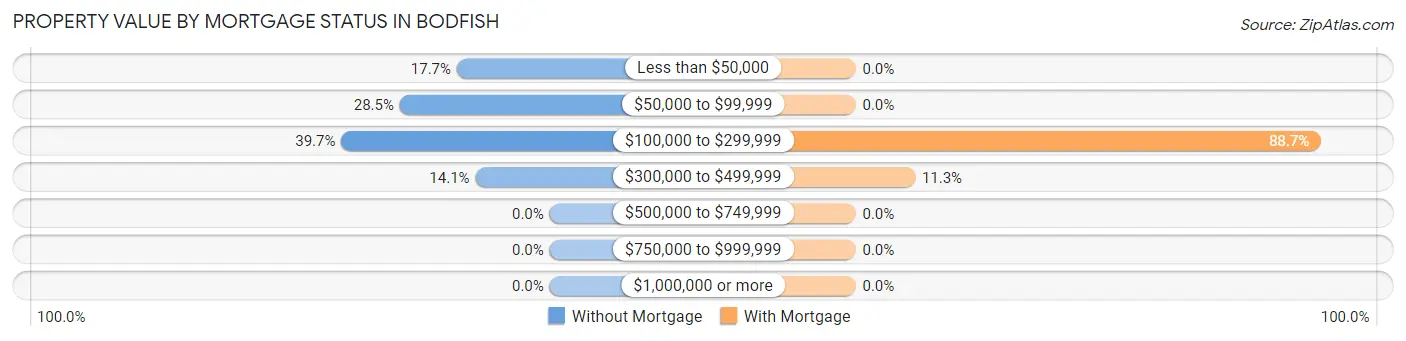
| Property Value | Without Mortgage | With Mortgage |
| Less than $50,000 | 65 (17.7%) | 0 (0.0%) |
| $50,000 to $99,999 | 105 (28.5%) | 0 (0.0%) |
| $100,000 to $299,999 | 146 (39.7%) | 149 (88.7%) |
| $300,000 to $499,999 | 52 (14.1%) | 19 (11.3%) |
| $500,000 to $749,999 | 0 (0.0%) | 0 (0.0%) |
| $750,000 to $999,999 | 0 (0.0%) | 0 (0.0%) |
| $1,000,000 or more | 0 (0.0%) | 0 (0.0%) |
| Total | 368 (100.0%) | 168 (100.0%) |
Household Income by Mortgage Status in Bodfish
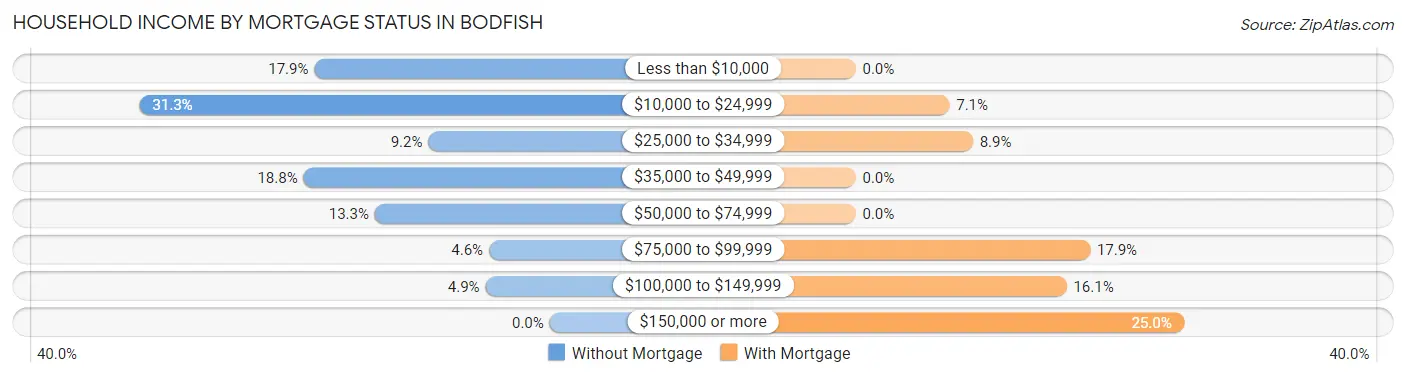
| Household Income | Without Mortgage | With Mortgage |
| Less than $10,000 | 66 (17.9%) | 0 (0.0%) |
| $10,000 to $24,999 | 115 (31.2%) | 12 (7.1%) |
| $25,000 to $34,999 | 34 (9.2%) | 15 (8.9%) |
| $35,000 to $49,999 | 69 (18.8%) | 0 (0.0%) |
| $50,000 to $74,999 | 49 (13.3%) | 0 (0.0%) |
| $75,000 to $99,999 | 17 (4.6%) | 30 (17.9%) |
| $100,000 to $149,999 | 18 (4.9%) | 27 (16.1%) |
| $150,000 or more | 0 (0.0%) | 42 (25.0%) |
| Total | 368 (100.0%) | 168 (100.0%) |
Property Value to Household Income Ratio in Bodfish
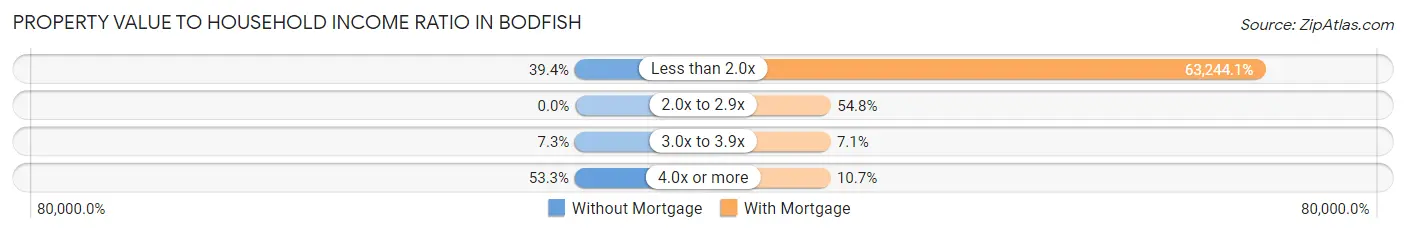
| Value-to-Income Ratio | Without Mortgage | With Mortgage |
| Less than 2.0x | 145 (39.4%) | 106,250 (63,244.1%) |
| 2.0x to 2.9x | 0 (0.0%) | 92 (54.8%) |
| 3.0x to 3.9x | 27 (7.3%) | 12 (7.1%) |
| 4.0x or more | 196 (53.3%) | 18 (10.7%) |
| Total | 368 (100.0%) | 168 (100.0%) |
Real Estate Taxes by Mortgage Status in Bodfish
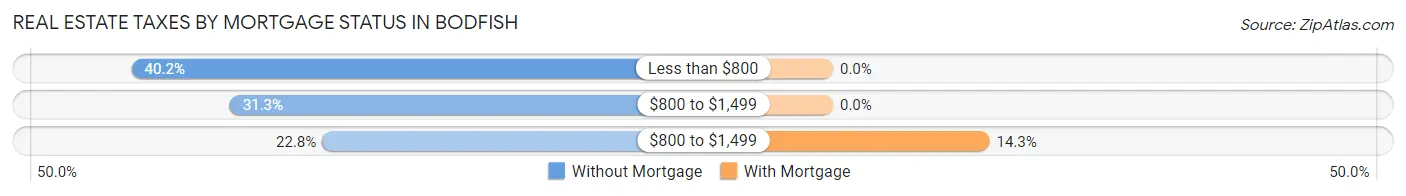
| Property Taxes | Without Mortgage | With Mortgage |
| Less than $800 | 148 (40.2%) | 0 (0.0%) |
| $800 to $1,499 | 115 (31.2%) | 0 (0.0%) |
| $800 to $1,499 | 84 (22.8%) | 24 (14.3%) |
| Total | 368 (100.0%) | 168 (100.0%) |
Health & Disability in Bodfish
Health Insurance Coverage by Age in Bodfish
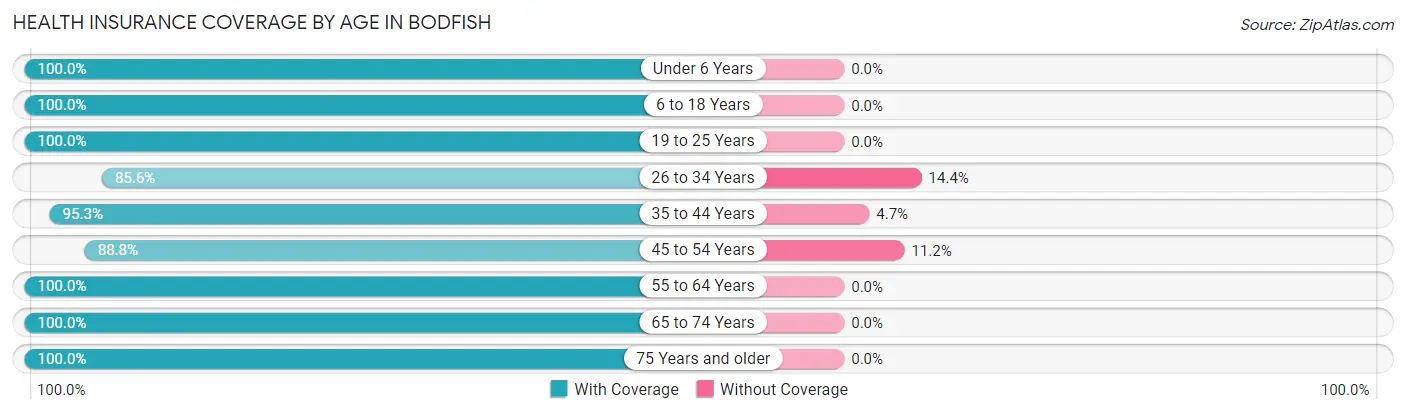
| Age Bracket | With Coverage | Without Coverage |
| Under 6 Years | 122 (100.0%) | 0 (0.0%) |
| 6 to 18 Years | 413 (100.0%) | 0 (0.0%) |
| 19 to 25 Years | 48 (100.0%) | 0 (0.0%) |
| 26 to 34 Years | 166 (85.6%) | 28 (14.4%) |
| 35 to 44 Years | 428 (95.3%) | 21 (4.7%) |
| 45 to 54 Years | 166 (88.8%) | 21 (11.2%) |
| 55 to 64 Years | 349 (100.0%) | 0 (0.0%) |
| 65 to 74 Years | 289 (100.0%) | 0 (0.0%) |
| 75 Years and older | 269 (100.0%) | 0 (0.0%) |
| Total | 2,250 (97.0%) | 70 (3.0%) |
Health Insurance Coverage by Citizenship Status in Bodfish
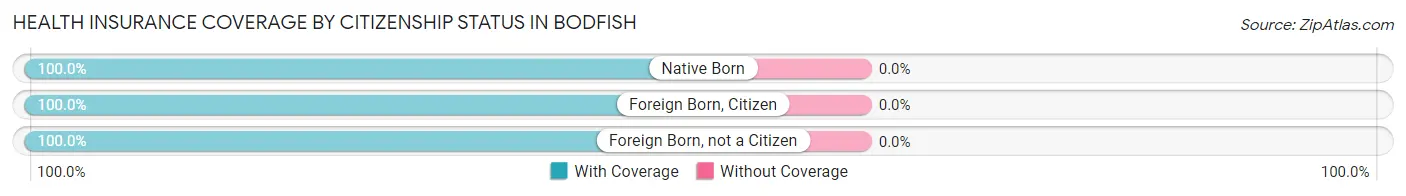
| Citizenship Status | With Coverage | Without Coverage |
| Native Born | 122 (100.0%) | 0 (0.0%) |
| Foreign Born, Citizen | 413 (100.0%) | 0 (0.0%) |
| Foreign Born, not a Citizen | 48 (100.0%) | 0 (0.0%) |
Health Insurance Coverage by Household Income in Bodfish
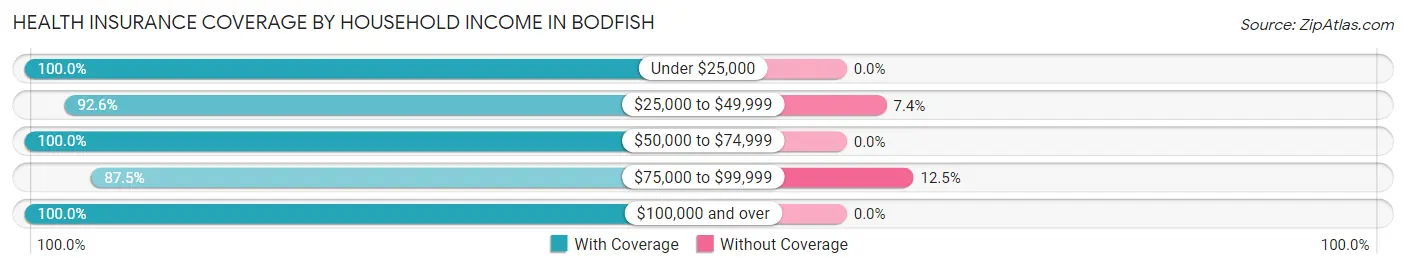
| Household Income | With Coverage | Without Coverage |
| Under $25,000 | 1,014 (100.0%) | 0 (0.0%) |
| $25,000 to $49,999 | 610 (92.6%) | 49 (7.4%) |
| $50,000 to $74,999 | 196 (100.0%) | 0 (0.0%) |
| $75,000 to $99,999 | 147 (87.5%) | 21 (12.5%) |
| $100,000 and over | 283 (100.0%) | 0 (0.0%) |
Public vs Private Health Insurance Coverage by Age in Bodfish
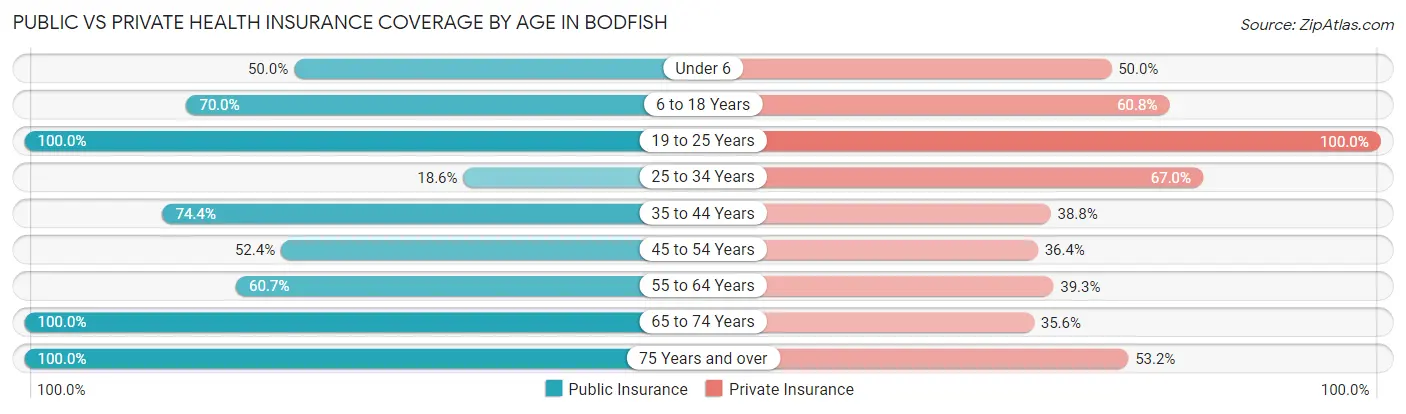
| Age Bracket | Public Insurance | Private Insurance |
| Under 6 | 61 (50.0%) | 61 (50.0%) |
| 6 to 18 Years | 289 (70.0%) | 251 (60.8%) |
| 19 to 25 Years | 48 (100.0%) | 48 (100.0%) |
| 25 to 34 Years | 36 (18.6%) | 130 (67.0%) |
| 35 to 44 Years | 334 (74.4%) | 174 (38.8%) |
| 45 to 54 Years | 98 (52.4%) | 68 (36.4%) |
| 55 to 64 Years | 212 (60.7%) | 137 (39.3%) |
| 65 to 74 Years | 289 (100.0%) | 103 (35.6%) |
| 75 Years and over | 269 (100.0%) | 143 (53.2%) |
| Total | 1,636 (70.5%) | 1,115 (48.1%) |
Disability Status by Sex by Age in Bodfish
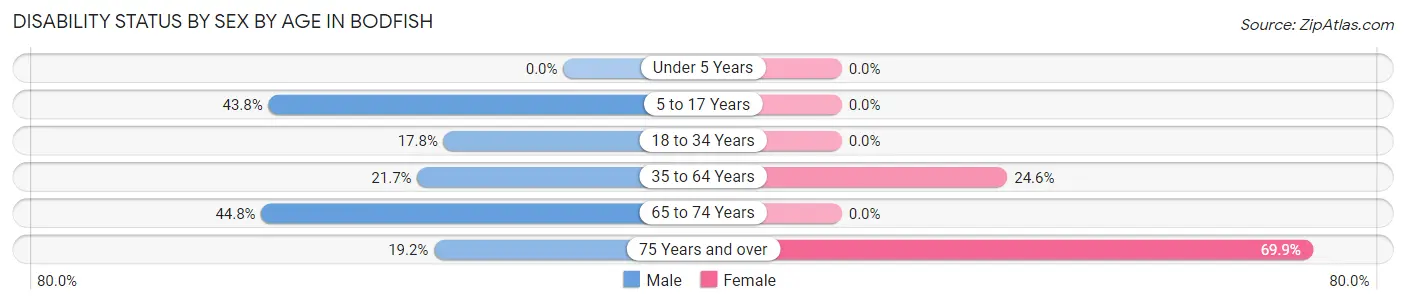
| Age Bracket | Male | Female |
| Under 5 Years | 0 (0.0%) | 0 (0.0%) |
| 5 to 17 Years | 162 (43.8%) | 0 (0.0%) |
| 18 to 34 Years | 19 (17.8%) | 0 (0.0%) |
| 35 to 64 Years | 83 (21.7%) | 148 (24.6%) |
| 65 to 74 Years | 52 (44.8%) | 0 (0.0%) |
| 75 Years and over | 28 (19.2%) | 86 (69.9%) |
Disability Class by Sex by Age in Bodfish
Disability Class: Hearing Difficulty
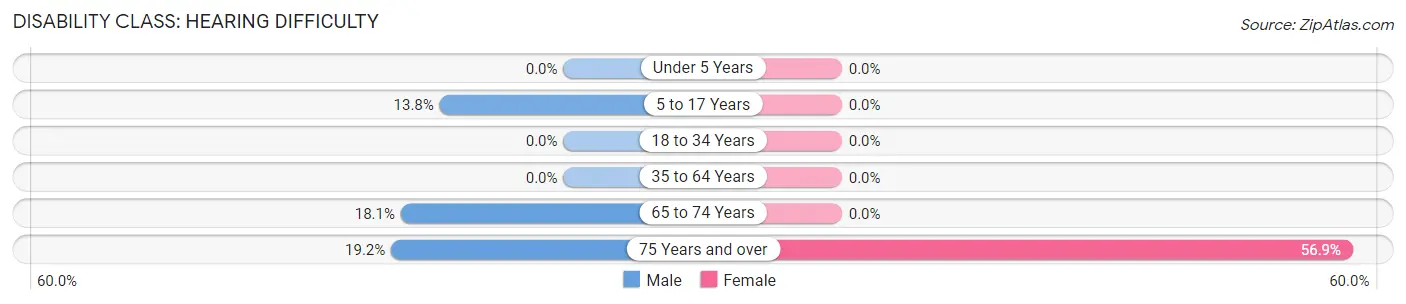
| Age Bracket | Male | Female |
| Under 5 Years | 0 (0.0%) | 0 (0.0%) |
| 5 to 17 Years | 51 (13.8%) | 0 (0.0%) |
| 18 to 34 Years | 0 (0.0%) | 0 (0.0%) |
| 35 to 64 Years | 0 (0.0%) | 0 (0.0%) |
| 65 to 74 Years | 21 (18.1%) | 0 (0.0%) |
| 75 Years and over | 28 (19.2%) | 70 (56.9%) |
Disability Class: Vision Difficulty
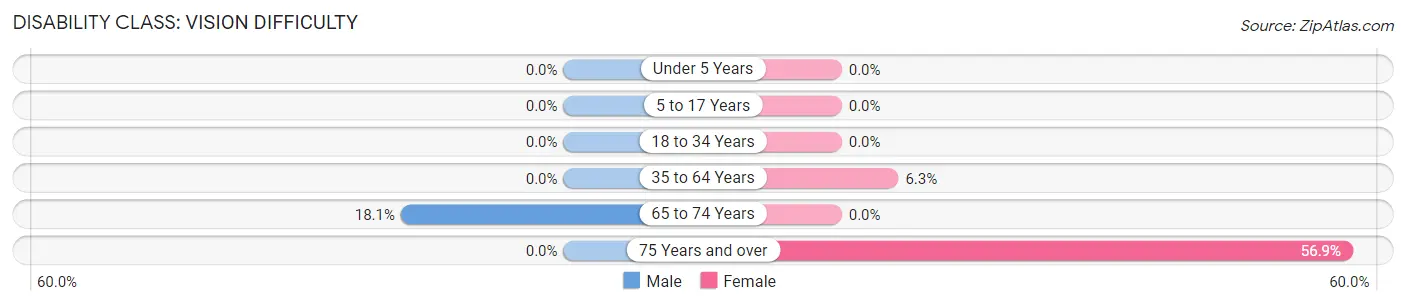
| Age Bracket | Male | Female |
| Under 5 Years | 0 (0.0%) | 0 (0.0%) |
| 5 to 17 Years | 0 (0.0%) | 0 (0.0%) |
| 18 to 34 Years | 0 (0.0%) | 0 (0.0%) |
| 35 to 64 Years | 0 (0.0%) | 38 (6.3%) |
| 65 to 74 Years | 21 (18.1%) | 0 (0.0%) |
| 75 Years and over | 0 (0.0%) | 70 (56.9%) |
Disability Class: Cognitive Difficulty
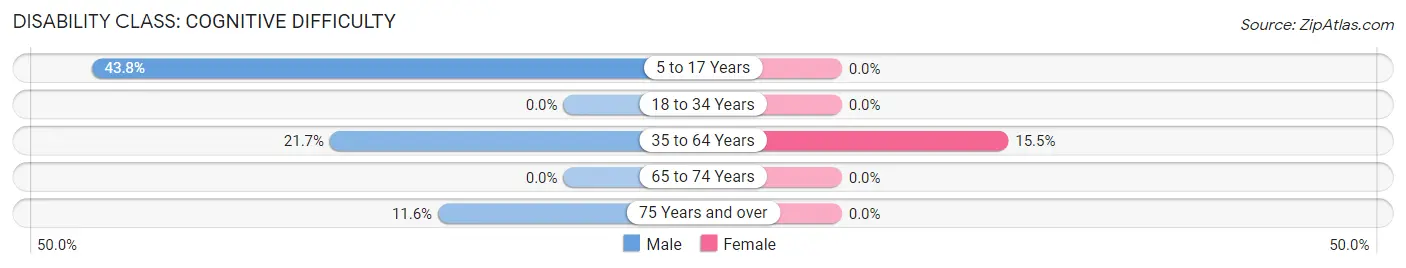
| Age Bracket | Male | Female |
| 5 to 17 Years | 162 (43.8%) | 0 (0.0%) |
| 18 to 34 Years | 0 (0.0%) | 0 (0.0%) |
| 35 to 64 Years | 83 (21.7%) | 93 (15.4%) |
| 65 to 74 Years | 0 (0.0%) | 0 (0.0%) |
| 75 Years and over | 17 (11.6%) | 0 (0.0%) |
Disability Class: Ambulatory Difficulty
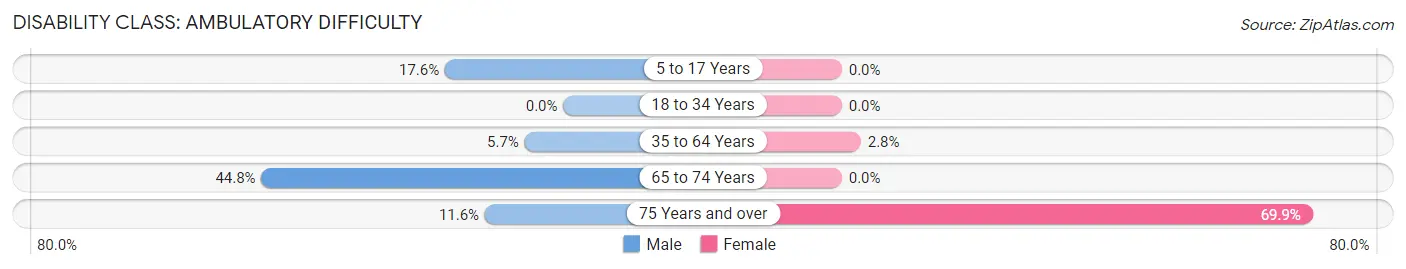
| Age Bracket | Male | Female |
| 5 to 17 Years | 65 (17.6%) | 0 (0.0%) |
| 18 to 34 Years | 0 (0.0%) | 0 (0.0%) |
| 35 to 64 Years | 22 (5.7%) | 17 (2.8%) |
| 65 to 74 Years | 52 (44.8%) | 0 (0.0%) |
| 75 Years and over | 17 (11.6%) | 86 (69.9%) |
Disability Class: Self-Care Difficulty
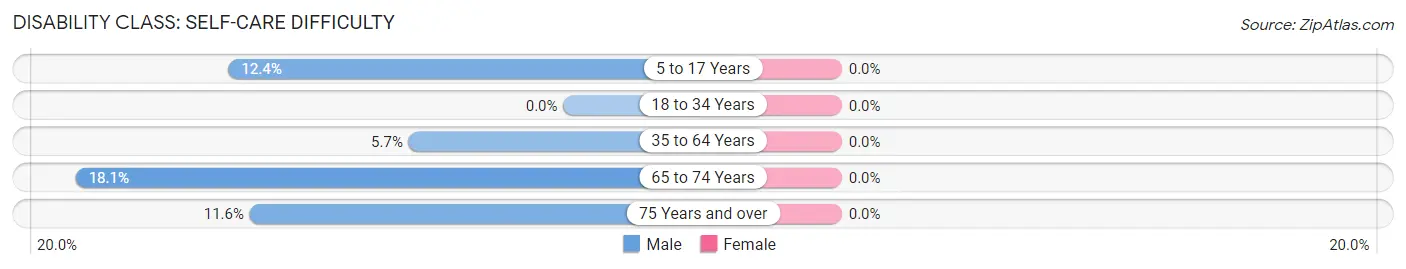
| Age Bracket | Male | Female |
| 5 to 17 Years | 46 (12.4%) | 0 (0.0%) |
| 18 to 34 Years | 0 (0.0%) | 0 (0.0%) |
| 35 to 64 Years | 22 (5.7%) | 0 (0.0%) |
| 65 to 74 Years | 21 (18.1%) | 0 (0.0%) |
| 75 Years and over | 17 (11.6%) | 0 (0.0%) |
Technology Access in Bodfish
Computing Device Access in Bodfish
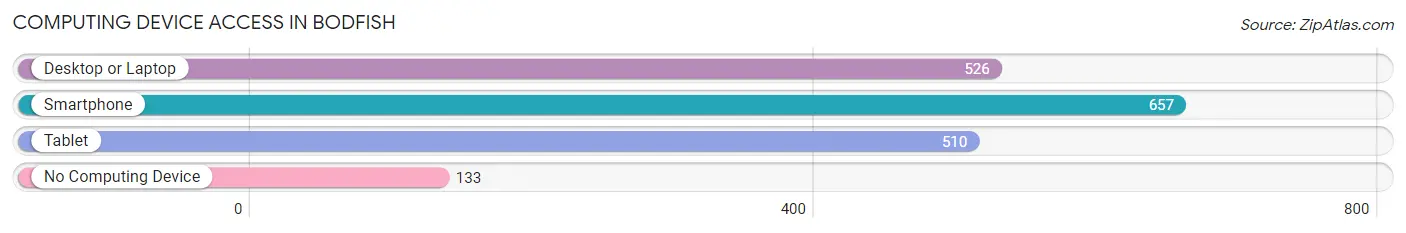
| Device Type | # Households | % Households |
| Desktop or Laptop | 526 | 58.6% |
| Smartphone | 657 | 73.2% |
| Tablet | 510 | 56.9% |
| No Computing Device | 133 | 14.8% |
| Total | 897 | 100.0% |
Internet Access in Bodfish
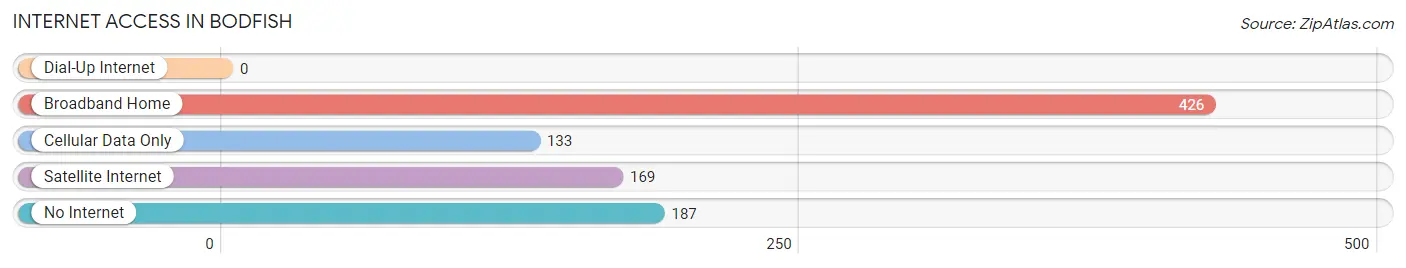
| Internet Type | # Households | % Households |
| Dial-Up Internet | 0 | 0.0% |
| Broadband Home | 426 | 47.5% |
| Cellular Data Only | 133 | 14.8% |
| Satellite Internet | 169 | 18.8% |
| No Internet | 187 | 20.8% |
| Total | 897 | 100.0% |
Bodfish Summary
Bodfish is a small unincorporated community located in Kern County, California. It is situated in the southern Sierra Nevada Mountains, approximately 8 miles east of Lake Isabella. The population of Bodfish was estimated to be 1,093 in 2019.
History
The area that is now Bodfish was originally inhabited by the Yokut Native American tribe. The first European settlers arrived in the area in the late 1800s, and the town was officially founded in 1891. The town was named after a local rancher, John Bodfish, who owned a large ranch in the area.
The town was initially a mining town, with gold and silver being mined in the surrounding hills. The town also had a few small businesses, including a general store, a saloon, and a post office.
In the early 1900s, Bodfish began to transition from a mining town to an agricultural community. The town was home to several large farms, and the surrounding hills were used for grazing cattle.
Geography
Bodfish is located in the southern Sierra Nevada Mountains, approximately 8 miles east of Lake Isabella. The town is situated at an elevation of 2,845 feet. The climate in Bodfish is semi-arid, with hot summers and mild winters.
The town is surrounded by the Sequoia National Forest, which provides a variety of recreational activities, including camping, hiking, and fishing. The nearby Kern River is also a popular destination for kayaking and rafting.
Economy
The economy of Bodfish is largely based on agriculture. The town is home to several large farms, which produce a variety of crops, including alfalfa, hay, and wheat. The town is also home to several small businesses, including a general store, a saloon, and a post office.
Demographics
As of 2019, the population of Bodfish was estimated to be 1,093. The racial makeup of the town was 94.3% White, 0.7% African American, 0.7% Native American, 0.7% Asian, 0.7% Pacific Islander, and 2.7% from other races. The median household income in Bodfish was $41,250, and the median age was 44.
Conclusion
Bodfish is a small unincorporated community located in Kern County, California. It is situated in the southern Sierra Nevada Mountains, approximately 8 miles east of Lake Isabella. The town was originally a mining town, but transitioned to an agricultural community in the early 1900s. The economy of Bodfish is largely based on agriculture, and the population was estimated to be 1,093 in 2019.
Common Questions
What is Per Capita Income in Bodfish?
Per Capita income in Bodfish is $17,860.
What is the Median Family Income in Bodfish?
Median Family Income in Bodfish is $25,590.
What is the Median Household income in Bodfish?
Median Household Income in Bodfish is $27,215.
What is Income or Wage Gap in Bodfish?
Income or Wage Gap in Bodfish is 18.4%.
Women in Bodfish earn 81.6 cents for every dollar earned by a man.
What is Inequality or Gini Index in Bodfish?
Inequality or Gini Index in Bodfish is 0.48.
What is the Total Population of Bodfish?
Total Population of Bodfish is 2,320.
What is the Total Male Population of Bodfish?
Total Male Population of Bodfish is 1,122.
What is the Total Female Population of Bodfish?
Total Female Population of Bodfish is 1,198.
What is the Ratio of Males per 100 Females in Bodfish?
There are 93.66 Males per 100 Females in Bodfish.
What is the Ratio of Females per 100 Males in Bodfish?
There are 106.77 Females per 100 Males in Bodfish.
What is the Median Population Age in Bodfish?
Median Population Age in Bodfish is 41.7 Years.
What is the Average Family Size in Bodfish
Average Family Size in Bodfish is 3.1 People.
What is the Average Household Size in Bodfish
Average Household Size in Bodfish is 2.6 People.
How Large is the Labor Force in Bodfish?
There are 596 People in the Labor Forcein in Bodfish.
What is the Percentage of People in the Labor Force in Bodfish?
32.2% of People are in the Labor Force in Bodfish.
What is the Unemployment Rate in Bodfish?
Unemployment Rate in Bodfish is 21.2%.