Bluewater, CA Map & Demographics
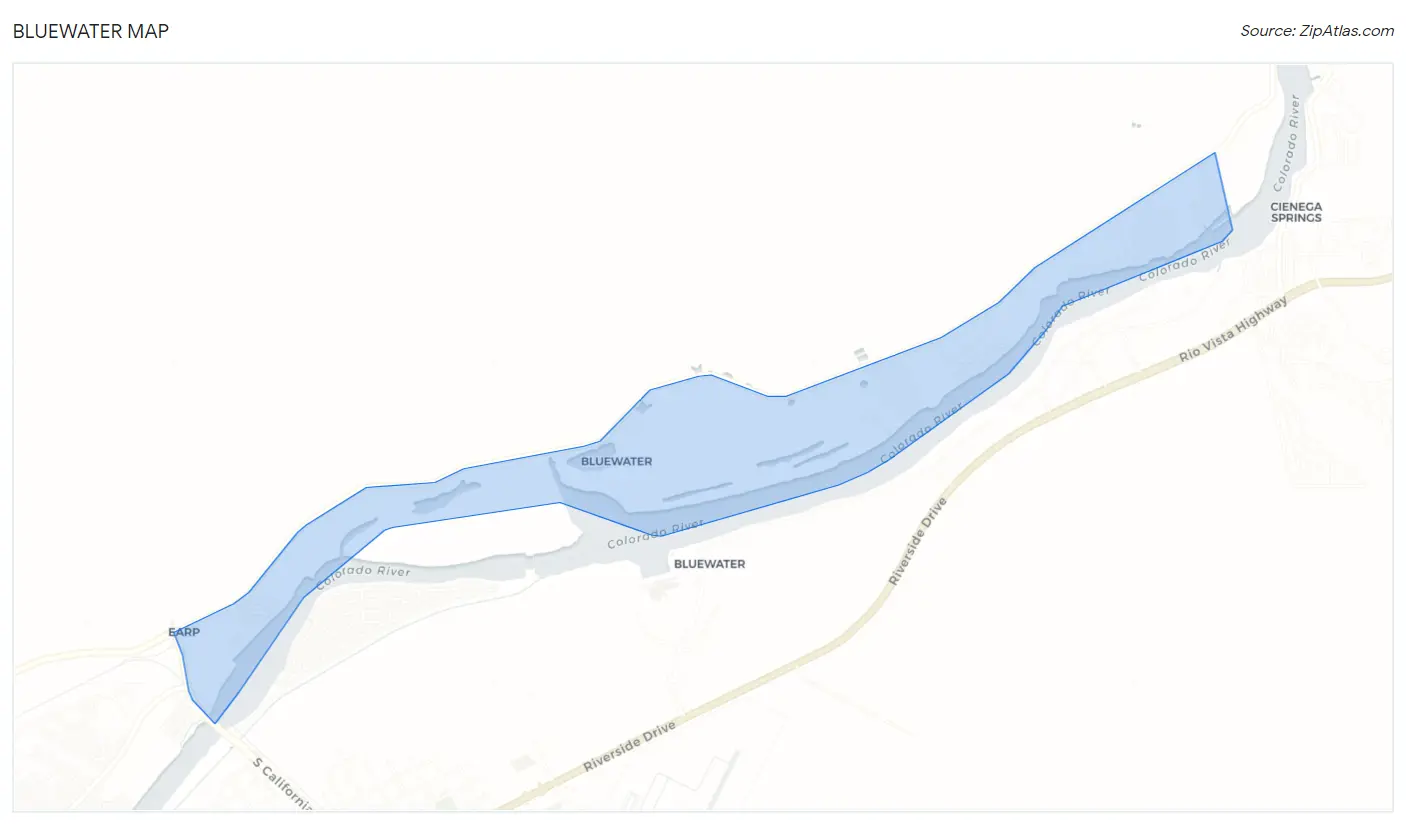
Bluewater Map
Bluewater Overview
$33,901
PER CAPITA INCOME
$33,750
AVG FAMILY INCOME
25.2%
WAGE / INCOME GAP [ % ]
74.8¢/ $1
WAGE / INCOME GAP [ $ ]
0.43
INEQUALITY / GINI INDEX
167
TOTAL POPULATION
98
MALE POPULATION
69
FEMALE POPULATION
142.03
MALES / 100 FEMALES
70.41
FEMALES / 100 MALES
61.6
MEDIAN AGE
2.8
AVG FAMILY SIZE
2.4
AVG HOUSEHOLD SIZE
49
LABOR FORCE [ PEOPLE ]
37.1%
PERCENT IN LABOR FORCE
14.3%
UNEMPLOYMENT RATE
Income in Bluewater
Income Overview in Bluewater
| Characteristic | Number | Measure |
| Per Capita Income | 167 | $33,901 |
| Median Family Income | 35 | $33,750 |
| Mean Family Income | 35 | $34,791 |
| Median Household Income | 71 | $0 |
| Mean Household Income | 71 | $75,954 |
| Income Deficit | 35 | $0 |
| Wage / Income Gap (%) | 167 | 25.20% |
| Wage / Income Gap ($) | 167 | 74.80¢ per $1 |
| Gini / Inequality Index | 167 | 0.43 |
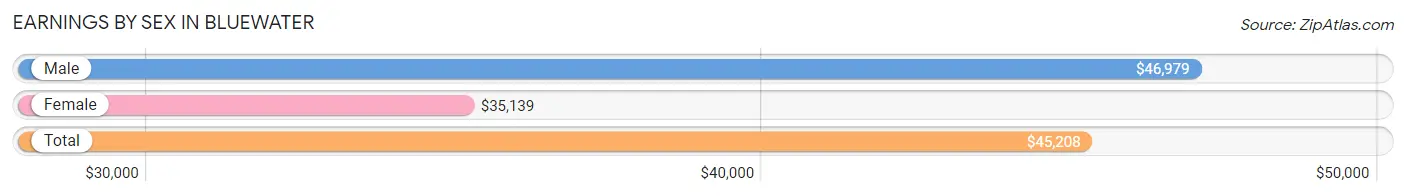
Earnings by Sex in Bluewater
Average Earnings in Bluewater are $45,208, $46,979 for men and $35,139 for women, a difference of 25.2%.
| Sex | Number | Average Earnings |
| Male | 19 (41.3%) | $46,979 |
| Female | 27 (58.7%) | $35,139 |
| Total | 46 (100.0%) | $45,208 |
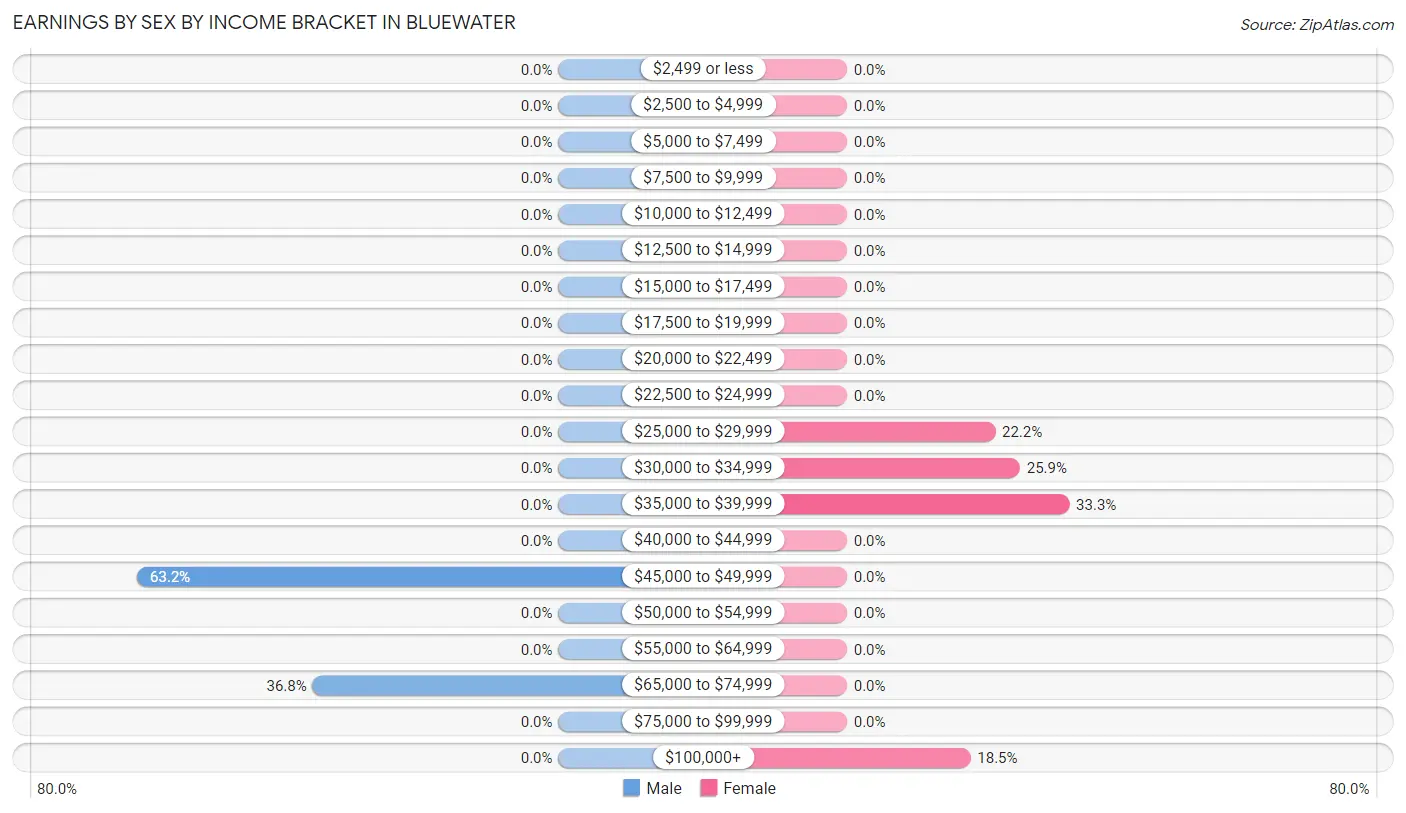
Earnings by Sex by Income Bracket in Bluewater
The most common earnings brackets in Bluewater are $45,000 to $49,999 for men (12 | 63.2%) and $35,000 to $39,999 for women (9 | 33.3%).
| Income | Male | Female |
| $2,499 or less | 0 (0.0%) | 0 (0.0%) |
| $2,500 to $4,999 | 0 (0.0%) | 0 (0.0%) |
| $5,000 to $7,499 | 0 (0.0%) | 0 (0.0%) |
| $7,500 to $9,999 | 0 (0.0%) | 0 (0.0%) |
| $10,000 to $12,499 | 0 (0.0%) | 0 (0.0%) |
| $12,500 to $14,999 | 0 (0.0%) | 0 (0.0%) |
| $15,000 to $17,499 | 0 (0.0%) | 0 (0.0%) |
| $17,500 to $19,999 | 0 (0.0%) | 0 (0.0%) |
| $20,000 to $22,499 | 0 (0.0%) | 0 (0.0%) |
| $22,500 to $24,999 | 0 (0.0%) | 0 (0.0%) |
| $25,000 to $29,999 | 0 (0.0%) | 6 (22.2%) |
| $30,000 to $34,999 | 0 (0.0%) | 7 (25.9%) |
| $35,000 to $39,999 | 0 (0.0%) | 9 (33.3%) |
| $40,000 to $44,999 | 0 (0.0%) | 0 (0.0%) |
| $45,000 to $49,999 | 12 (63.2%) | 0 (0.0%) |
| $50,000 to $54,999 | 0 (0.0%) | 0 (0.0%) |
| $55,000 to $64,999 | 0 (0.0%) | 0 (0.0%) |
| $65,000 to $74,999 | 7 (36.8%) | 0 (0.0%) |
| $75,000 to $99,999 | 0 (0.0%) | 0 (0.0%) |
| $100,000+ | 0 (0.0%) | 5 (18.5%) |
| Total | 19 (100.0%) | 27 (100.0%) |
Earnings by Sex by Educational Attainment in Bluewater
| Educational Attainment | Male Income | Female Income |
| Less than High School | - | - |
| High School Diploma | - | - |
| College or Associate's Degree | - | - |
| Bachelor's Degree | - | - |
| Graduate Degree | - | - |
| Total | $46,979 | $35,139 |
Family Income in Bluewater
Family Income Brackets in Bluewater
According to the Bluewater family income data, there are 14 families falling into the $25,000 to $34,999 income range, which is the most common income bracket and makes up 40.0% of all families.
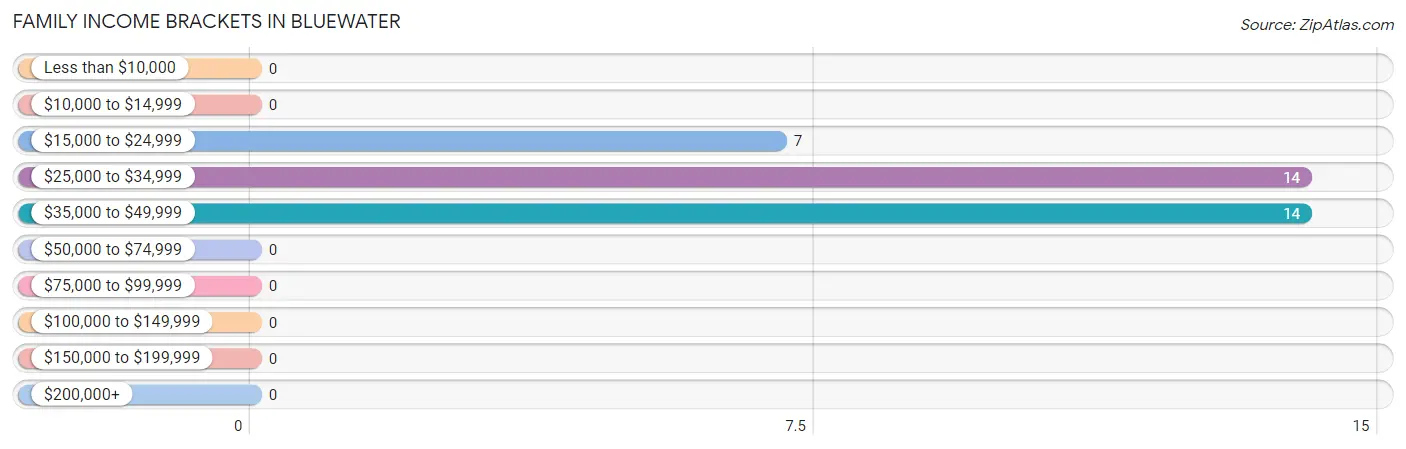
| Income Bracket | # Families | % Families |
| Less than $10,000 | 0 | 0.0% |
| $10,000 to $14,999 | 0 | 0.0% |
| $15,000 to $24,999 | 7 | 20.0% |
| $25,000 to $34,999 | 14 | 40.0% |
| $35,000 to $49,999 | 14 | 40.0% |
| $50,000 to $74,999 | 0 | 0.0% |
| $75,000 to $99,999 | 0 | 0.0% |
| $100,000 to $149,999 | 0 | 0.0% |
| $150,000 to $199,999 | 0 | 0.0% |
| $200,000+ | 0 | 0.0% |
Family Income by Famaliy Size in Bluewater
2-person families (27 | 77.1%) account for the highest median family income in Bluewater with $27,321 per family, while 2-person families (27 | 77.1%) have the highest median income of $13,660 per family member.
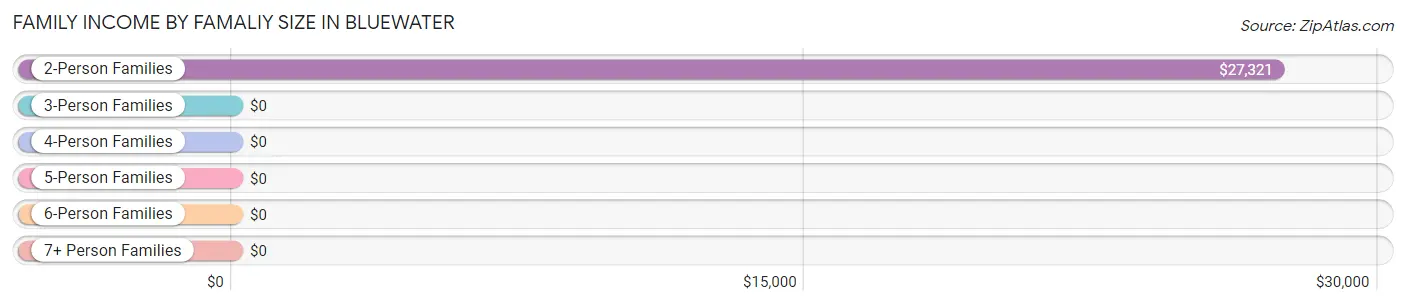
| Income Bracket | # Families | Median Income |
| 2-Person Families | 27 (77.1%) | $27,321 |
| 3-Person Families | 0 (0.0%) | $0 |
| 4-Person Families | 8 (22.9%) | $0 |
| 5-Person Families | 0 (0.0%) | $0 |
| 6-Person Families | 0 (0.0%) | $0 |
| 7+ Person Families | 0 (0.0%) | $0 |
| Total | 35 (100.0%) | $33,750 |
Family Income by Number of Earners in Bluewater
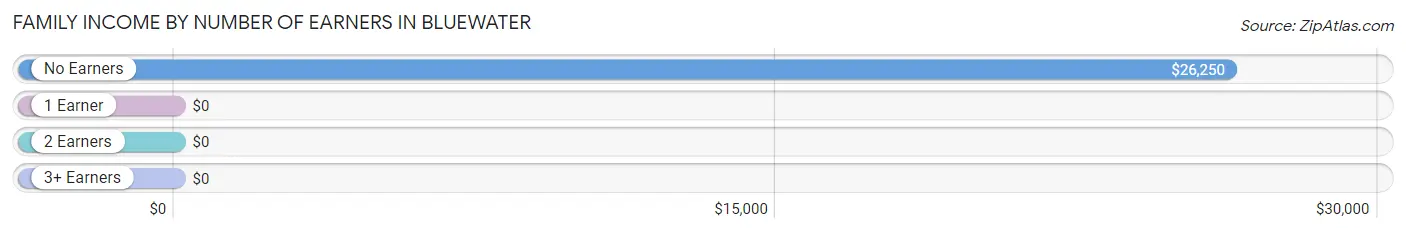
| Number of Earners | # Families | Median Income |
| No Earners | 21 (60.0%) | $26,250 |
| 1 Earner | 14 (40.0%) | $0 |
| 2 Earners | 0 (0.0%) | $0 |
| 3+ Earners | 0 (0.0%) | $0 |
| Total | 35 (100.0%) | $33,750 |
Household Income in Bluewater
Household Income Brackets in Bluewater
With 28 households falling in the category, the $25,000 to $34,999 income range is the most frequent in Bluewater, accounting for 39.4% of all households.
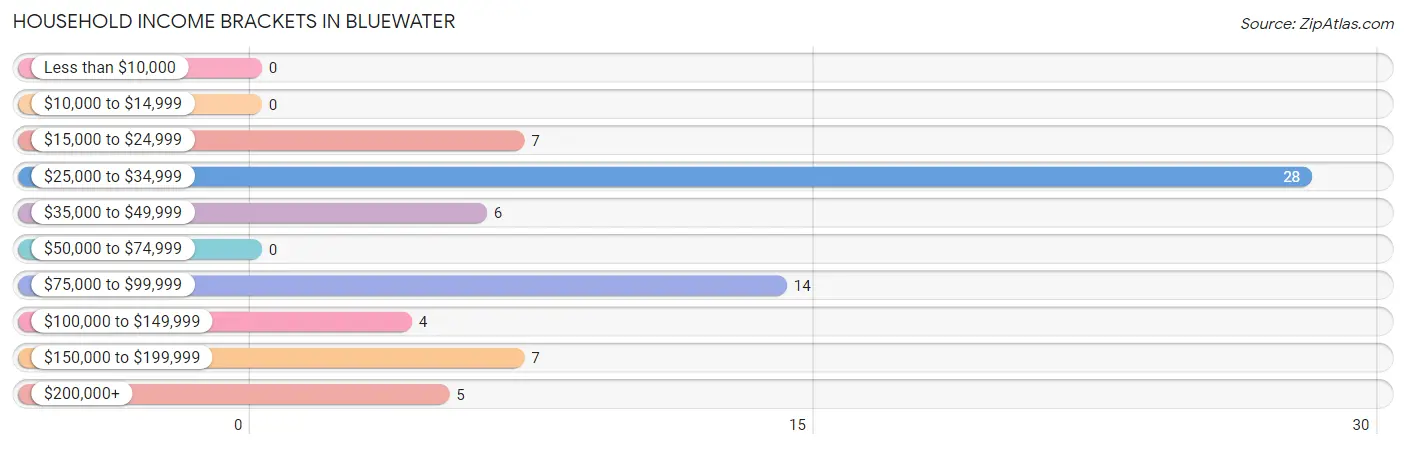
| Income Bracket | # Households | % Households |
| Less than $10,000 | 0 | 0.0% |
| $10,000 to $14,999 | 0 | 0.0% |
| $15,000 to $24,999 | 7 | 9.9% |
| $25,000 to $34,999 | 28 | 39.4% |
| $35,000 to $49,999 | 6 | 8.5% |
| $50,000 to $74,999 | 0 | 0.0% |
| $75,000 to $99,999 | 14 | 19.7% |
| $100,000 to $149,999 | 4 | 5.6% |
| $150,000 to $199,999 | 7 | 9.9% |
| $200,000+ | 5 | 7.0% |
Household Income by Householder Age in Bluewater
| Income Bracket | # Households | Median Income |
| 15 to 24 Years | 0 (0.0%) | $0 |
| 25 to 44 Years | 8 (11.3%) | $0 |
| 45 to 64 Years | 19 (26.8%) | $0 |
| 65+ Years | 44 (62.0%) | $0 |
| Total | 71 (100.0%) | $0 |
Poverty in Bluewater
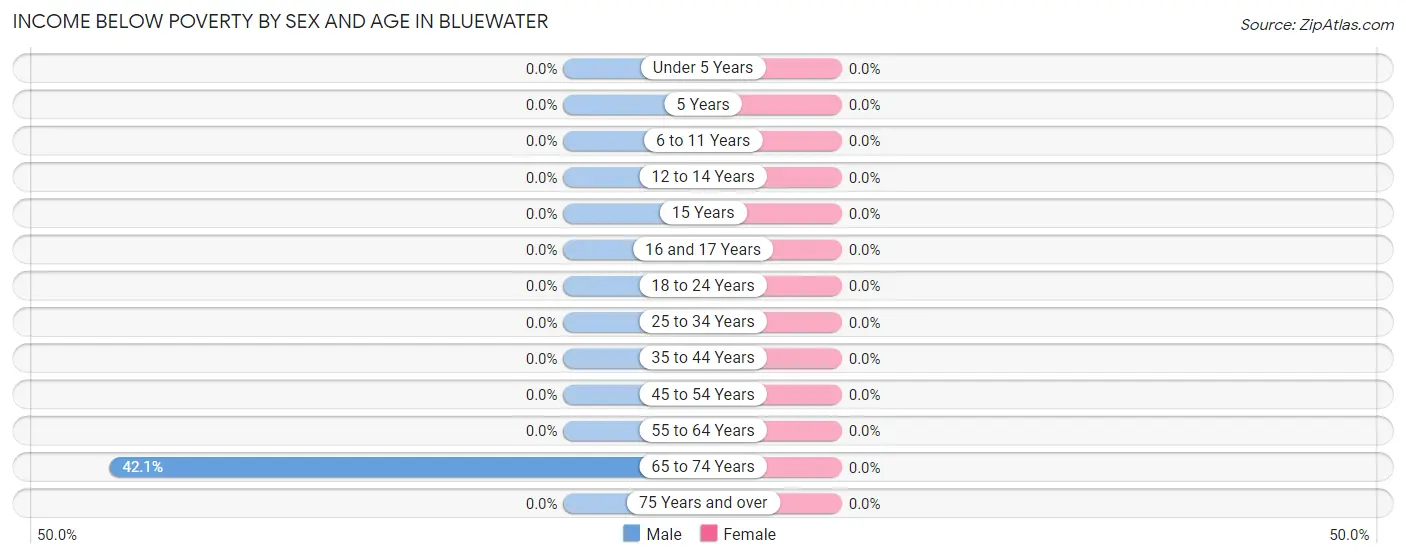
Income Below Poverty by Sex and Age in Bluewater
| Age Bracket | Male | Female |
| Under 5 Years | 0 (0.0%) | 0 (0.0%) |
| 5 Years | 0 (0.0%) | 0 (0.0%) |
| 6 to 11 Years | 0 (0.0%) | 0 (0.0%) |
| 12 to 14 Years | 0 (0.0%) | 0 (0.0%) |
| 15 Years | 0 (0.0%) | 0 (0.0%) |
| 16 and 17 Years | 0 (0.0%) | 0 (0.0%) |
| 18 to 24 Years | 0 (0.0%) | 0 (0.0%) |
| 25 to 34 Years | 0 (0.0%) | 0 (0.0%) |
| 35 to 44 Years | 0 (0.0%) | 0 (0.0%) |
| 45 to 54 Years | 0 (0.0%) | 0 (0.0%) |
| 55 to 64 Years | 0 (0.0%) | 0 (0.0%) |
| 65 to 74 Years | 8 (42.1%) | 0 (0.0%) |
| 75 Years and over | 0 (0.0%) | 0 (0.0%) |
| Total | 8 (8.2%) | 0 (0.0%) |
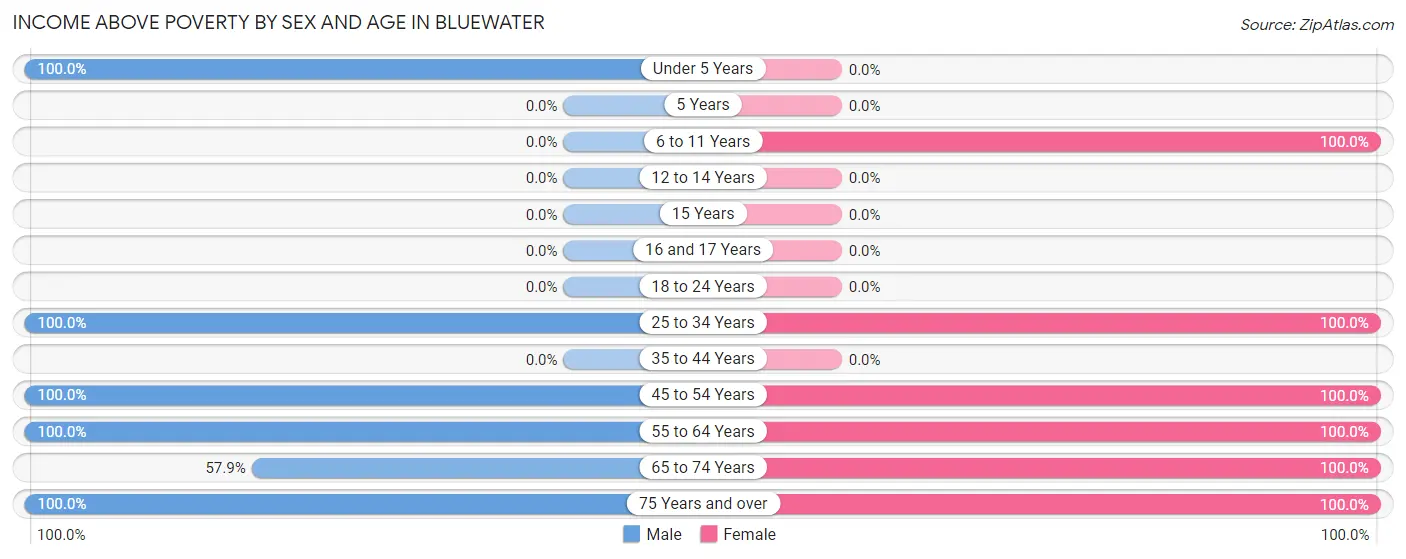
Income Above Poverty by Sex and Age in Bluewater
According to the poverty statistics in Bluewater, males aged under 5 years and females aged 6 to 11 years are the age groups that are most secure financially, with 100.0% of males and 100.0% of females in these age groups living above the poverty line.
| Age Bracket | Male | Female |
| Under 5 Years | 27 (100.0%) | 0 (0.0%) |
| 5 Years | 0 (0.0%) | 0 (0.0%) |
| 6 to 11 Years | 0 (0.0%) | 8 (100.0%) |
| 12 to 14 Years | 0 (0.0%) | 0 (0.0%) |
| 15 Years | 0 (0.0%) | 0 (0.0%) |
| 16 and 17 Years | 0 (0.0%) | 0 (0.0%) |
| 18 to 24 Years | 0 (0.0%) | 0 (0.0%) |
| 25 to 34 Years | 8 (100.0%) | 9 (100.0%) |
| 35 to 44 Years | 0 (0.0%) | 0 (0.0%) |
| 45 to 54 Years | 8 (100.0%) | 5 (100.0%) |
| 55 to 64 Years | 14 (100.0%) | 7 (100.0%) |
| 65 to 74 Years | 11 (57.9%) | 19 (100.0%) |
| 75 Years and over | 22 (100.0%) | 21 (100.0%) |
| Total | 90 (91.8%) | 69 (100.0%) |
Income Below Poverty Among Married-Couple Families in Bluewater
| Children | Above Poverty | Below Poverty |
| No Children | 21 (100.0%) | 0 (0.0%) |
| 1 or 2 Children | 0 (0.0%) | 0 (0.0%) |
| 3 or 4 Children | 0 (0.0%) | 0 (0.0%) |
| 5 or more Children | 0 (0.0%) | 0 (0.0%) |
| Total | 21 (100.0%) | 0 (0.0%) |
Income Below Poverty Among Single-Parent Households in Bluewater
| Children | Single Father | Single Mother |
| No Children | 0 (0.0%) | 0 (0.0%) |
| 1 or 2 Children | 0 (0.0%) | 0 (0.0%) |
| 3 or 4 Children | 0 (0.0%) | 0 (0.0%) |
| 5 or more Children | 0 (0.0%) | 0 (0.0%) |
| Total | 0 (0.0%) | 0 (0.0%) |
Income Below Poverty Among Married-Couple vs Single-Parent Households in Bluewater
| Children | Married-Couple Families | Single-Parent Households |
| No Children | 0 (0.0%) | 0 (0.0%) |
| 1 or 2 Children | 0 (0.0%) | 0 (0.0%) |
| 3 or 4 Children | 0 (0.0%) | 0 (0.0%) |
| 5 or more Children | 0 (0.0%) | 0 (0.0%) |
| Total | 0 (0.0%) | 0 (0.0%) |
Race in Bluewater
The most populous races in Bluewater are White / Caucasian (116 | 69.5%), Native / Alaskan (44 | 26.4%), and Hispanic or Latino (26 | 15.6%).
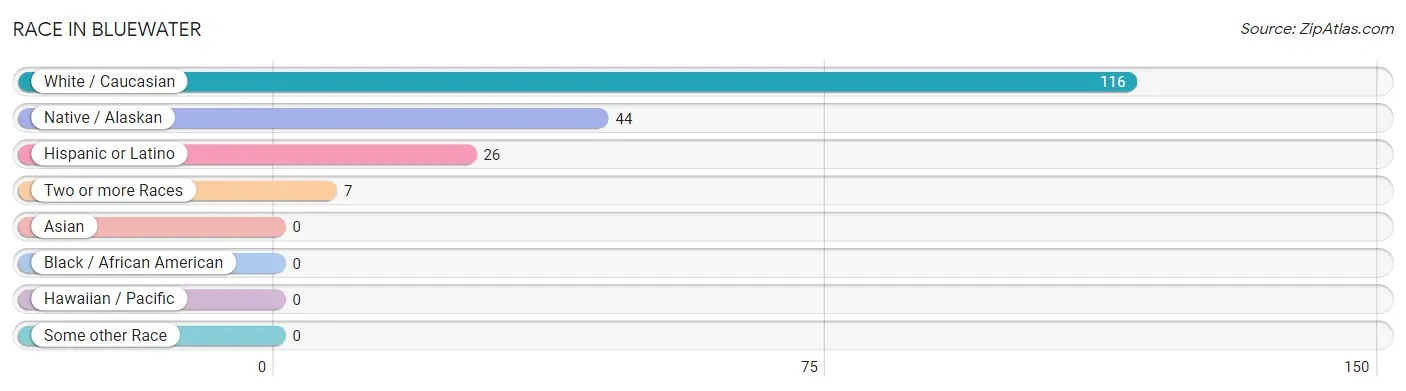
| Race | # Population | % Population |
| Asian | 0 | 0.0% |
| Black / African American | 0 | 0.0% |
| Hawaiian / Pacific | 0 | 0.0% |
| Hispanic or Latino | 26 | 15.6% |
| Native / Alaskan | 44 | 26.4% |
| White / Caucasian | 116 | 69.5% |
| Two or more Races | 7 | 4.2% |
| Some other Race | 0 | 0.0% |
| Total | 167 | 100.0% |
Ancestry in Bluewater
The most populous ancestries reported in Bluewater are Mexican (26 | 15.6%), English (25 | 15.0%), German (21 | 12.6%), Yuman (17 | 10.2%), and African (14 | 8.4%), together accounting for 61.7% of all Bluewater residents.
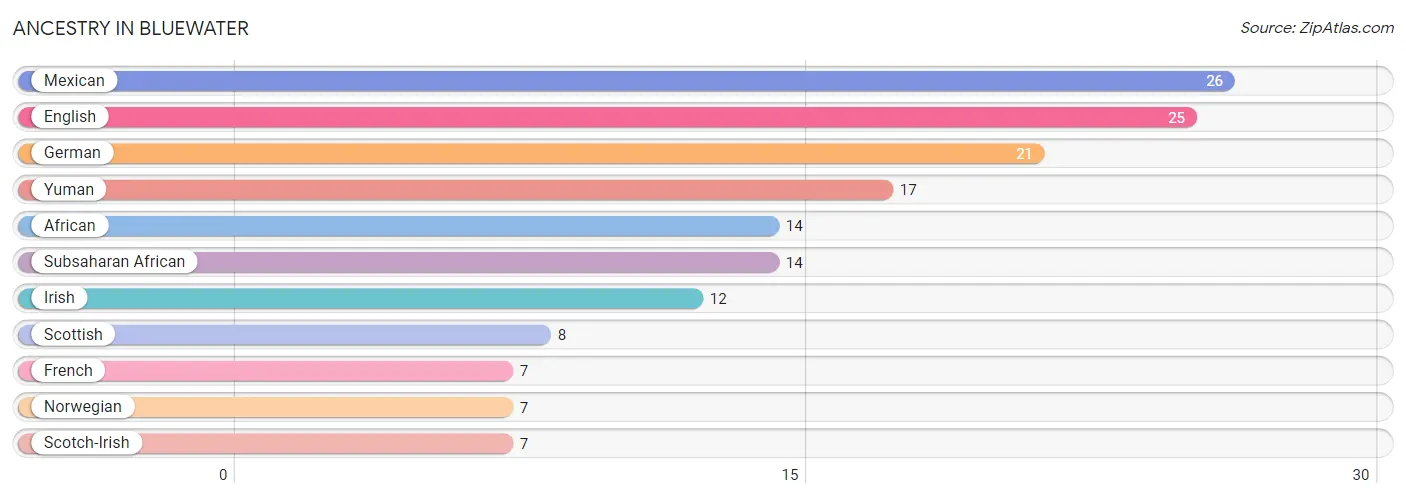
| Ancestry | # Population | % Population |
| African | 14 | 8.4% |
| English | 25 | 15.0% |
| French | 7 | 4.2% |
| German | 21 | 12.6% |
| Irish | 12 | 7.2% |
| Mexican | 26 | 15.6% |
| Norwegian | 7 | 4.2% |
| Scotch-Irish | 7 | 4.2% |
| Scottish | 8 | 4.8% |
| Subsaharan African | 14 | 8.4% |
| Yuman | 17 | 10.2% | View All 11 Rows |
Immigrants in Bluewater
The most numerous immigrant groups reported in Bluewater came from , and Africa (6 | 3.6%), together accounting for 3.6% of all Bluewater residents.

| Immigration Origin | # Population | % Population |
| Africa | 6 | 3.6% | View All 1 Rows |
Sex and Age in Bluewater
Sex and Age in Bluewater
The most populous age groups in Bluewater are Under 5 Years (27 | 27.6%) for men and 65 to 69 Years (12 | 17.4%) for women.
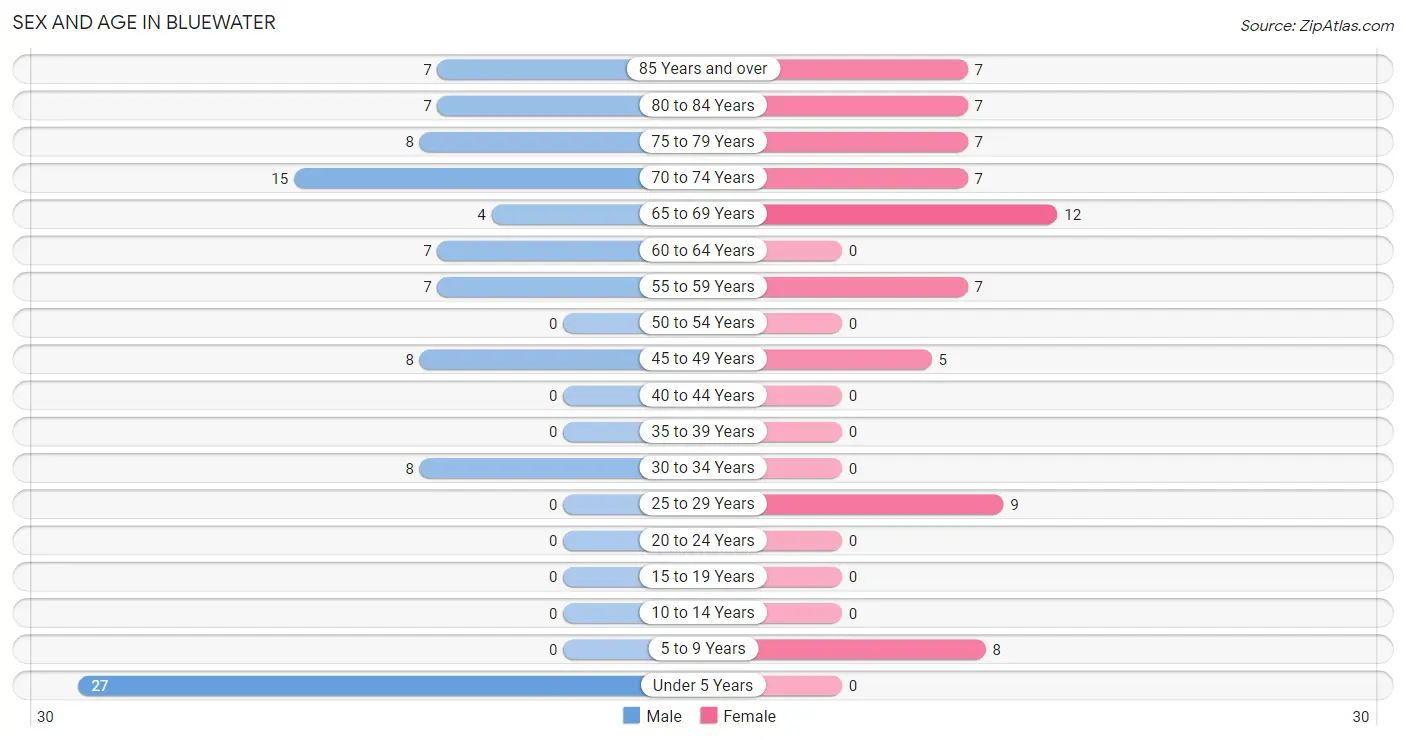
| Age Bracket | Male | Female |
| Under 5 Years | 27 (27.6%) | 0 (0.0%) |
| 5 to 9 Years | 0 (0.0%) | 8 (11.6%) |
| 10 to 14 Years | 0 (0.0%) | 0 (0.0%) |
| 15 to 19 Years | 0 (0.0%) | 0 (0.0%) |
| 20 to 24 Years | 0 (0.0%) | 0 (0.0%) |
| 25 to 29 Years | 0 (0.0%) | 9 (13.0%) |
| 30 to 34 Years | 8 (8.2%) | 0 (0.0%) |
| 35 to 39 Years | 0 (0.0%) | 0 (0.0%) |
| 40 to 44 Years | 0 (0.0%) | 0 (0.0%) |
| 45 to 49 Years | 8 (8.2%) | 5 (7.2%) |
| 50 to 54 Years | 0 (0.0%) | 0 (0.0%) |
| 55 to 59 Years | 7 (7.1%) | 7 (10.1%) |
| 60 to 64 Years | 7 (7.1%) | 0 (0.0%) |
| 65 to 69 Years | 4 (4.1%) | 12 (17.4%) |
| 70 to 74 Years | 15 (15.3%) | 7 (10.1%) |
| 75 to 79 Years | 8 (8.2%) | 7 (10.1%) |
| 80 to 84 Years | 7 (7.1%) | 7 (10.1%) |
| 85 Years and over | 7 (7.1%) | 7 (10.1%) |
| Total | 98 (100.0%) | 69 (100.0%) |
Families and Households in Bluewater
Median Family Size in Bluewater
The median family size in Bluewater is 2.83 persons per family, with single male/father families (8 | 22.9%) accounting for the largest median family size of 5.38 persons per family. On the other hand, married-couple families (21 | 60.0%) represent the smallest median family size with 2.00 persons per family.
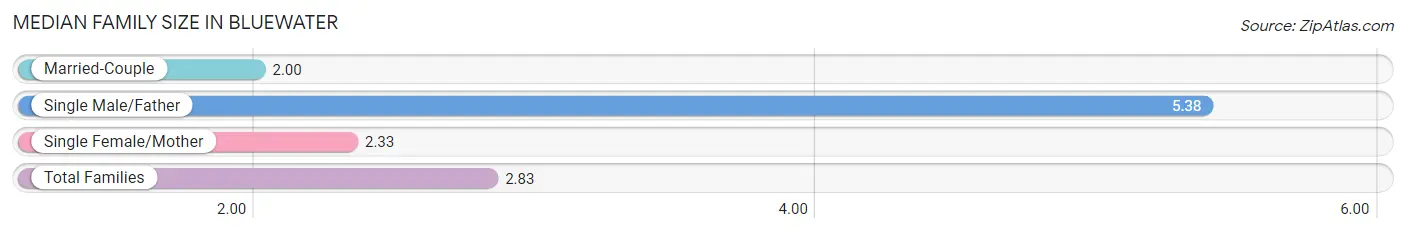
| Family Type | # Families | Family Size |
| Married-Couple | 21 (60.0%) | 2.00 |
| Single Male/Father | 8 (22.9%) | 5.38 |
| Single Female/Mother | 6 (17.1%) | 2.33 |
| Total Families | 35 (100.0%) | 2.83 |
Median Household Size in Bluewater
The median household size in Bluewater is 2.35 persons per household, with single male/father households (8 | 11.3%) accounting for the largest median household size of 6.5 persons per household. non-family households (36 | 50.7%) represent the smallest median household size with 1.64 persons per household.
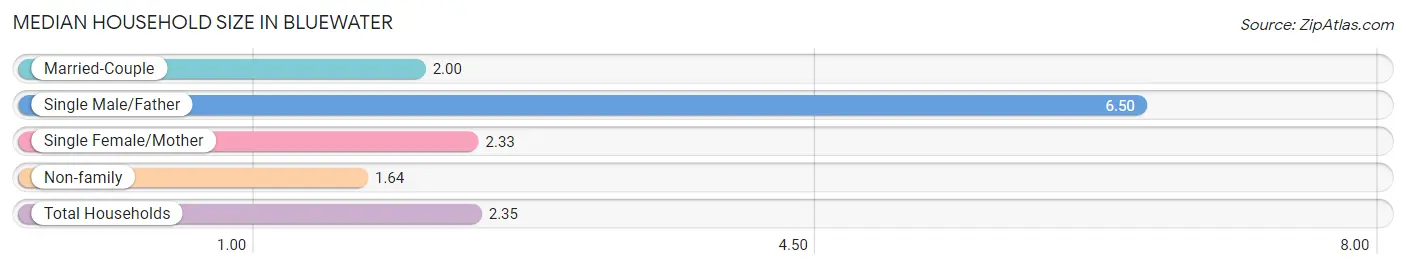
| Household Type | # Households | Household Size |
| Married-Couple | 21 (29.6%) | 2.00 |
| Single Male/Father | 8 (11.3%) | 6.50 |
| Single Female/Mother | 6 (8.5%) | 2.33 |
| Non-family | 36 (50.7%) | 1.64 |
| Total Households | 71 (100.0%) | 2.35 |
Household Size by Marriage Status in Bluewater
Out of a total of 71 households in Bluewater, 35 (49.3%) are family households, while 36 (50.7%) are nonfamily households. The most numerous type of family households are 2-person households, comprising 27, and the most common type of nonfamily households are 2-person households, comprising 20.
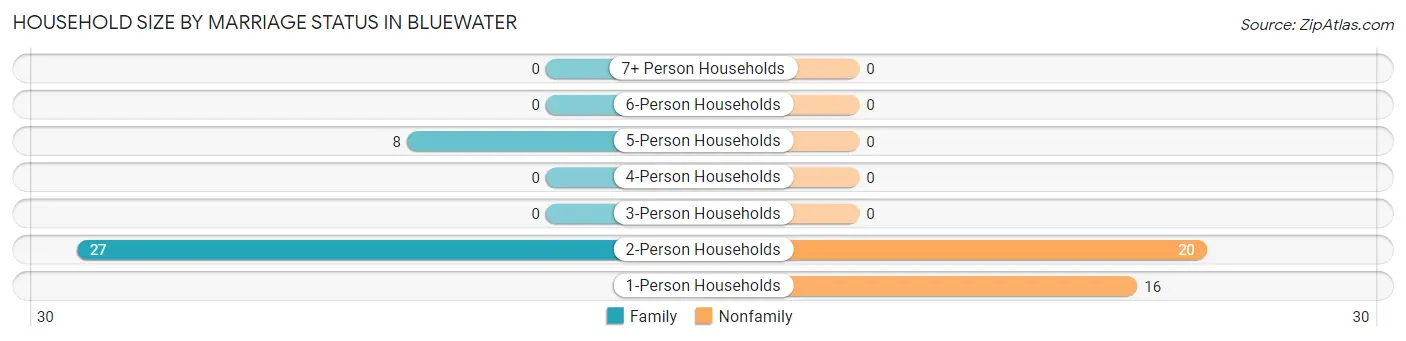
| Household Size | Family Households | Nonfamily Households |
| 1-Person Households | - | 16 (22.5%) |
| 2-Person Households | 27 (38.0%) | 20 (28.2%) |
| 3-Person Households | 0 (0.0%) | 0 (0.0%) |
| 4-Person Households | 0 (0.0%) | 0 (0.0%) |
| 5-Person Households | 8 (11.3%) | 0 (0.0%) |
| 6-Person Households | 0 (0.0%) | 0 (0.0%) |
| 7+ Person Households | 0 (0.0%) | 0 (0.0%) |
| Total | 35 (49.3%) | 36 (50.7%) |
Female Fertility in Bluewater
Fertility by Age in Bluewater
| Age Bracket | Women with Births | Births / 1,000 Women |
| 15 to 19 years | 0 (0.0%) | 0.0 |
| 20 to 34 years | 0 (0.0%) | 0.0 |
| 35 to 50 years | 0 (0.0%) | 0.0 |
| Total | 0 (0.0%) | 0.0 |
Fertility by Age by Marriage Status in Bluewater
| Age Bracket | Married | Unmarried |
| 15 to 19 years | 0 (0.0%) | 0 (0.0%) |
| 20 to 34 years | 0 (0.0%) | 0 (0.0%) |
| 35 to 50 years | 0 (0.0%) | 0 (0.0%) |
| Total | 0 (0.0%) | 0 (0.0%) |
Fertility by Education in Bluewater
| Educational Attainment | Women with Births | Births / 1,000 Women |
| Less than High School | 0 (0.0%) | 0.0 |
| High School Diploma | 0 (0.0%) | 0.0 |
| College or Associate's Degree | 0 (0.0%) | 0.0 |
| Bachelor's Degree | 0 (0.0%) | 0.0 |
| Graduate Degree | 0 (0.0%) | 0.0 |
| Total | 0 (0.0%) | 0.0 |
Fertility by Education by Marriage Status in Bluewater
| Educational Attainment | Married | Unmarried |
| Less than High School | 0 (0.0%) | 0 (0.0%) |
| High School Diploma | 0 (0.0%) | 0 (0.0%) |
| College or Associate's Degree | 0 (0.0%) | 0 (0.0%) |
| Bachelor's Degree | 0 (0.0%) | 0 (0.0%) |
| Graduate Degree | 0 (0.0%) | 0 (0.0%) |
| Total | 0 (0.0%) | 0 (0.0%) |
Employment Characteristics in Bluewater
Employment by Class of Employer in Bluewater
Among the 42 employed individuals in Bluewater, private company employees (19 | 45.2%), local government employees (17 | 40.5%), and state government employees (6 | 14.3%) make up the most common classes of employment.
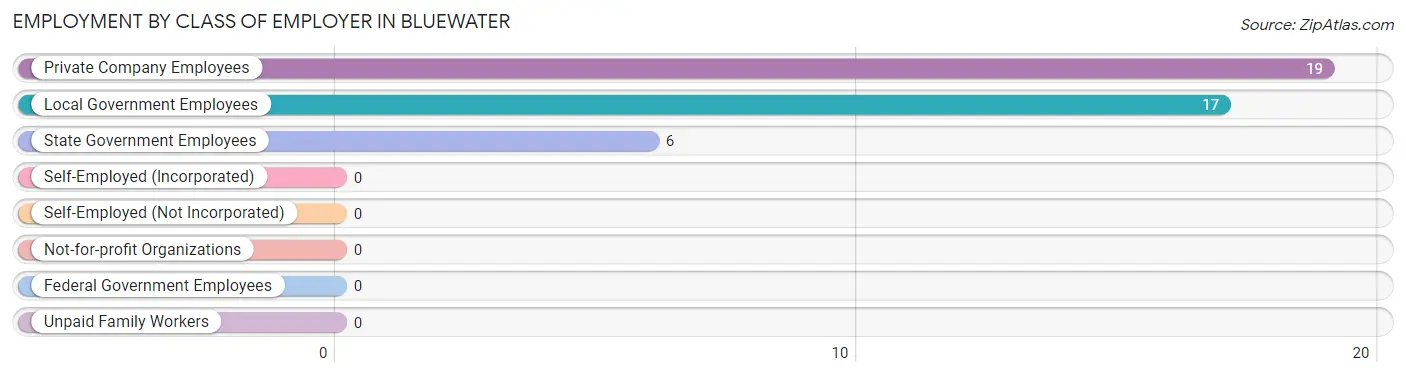
| Employer Class | # Employees | % Employees |
| Private Company Employees | 19 | 45.2% |
| Self-Employed (Incorporated) | 0 | 0.0% |
| Self-Employed (Not Incorporated) | 0 | 0.0% |
| Not-for-profit Organizations | 0 | 0.0% |
| Local Government Employees | 17 | 40.5% |
| State Government Employees | 6 | 14.3% |
| Federal Government Employees | 0 | 0.0% |
| Unpaid Family Workers | 0 | 0.0% |
| Total | 42 | 100.0% |
Employment Status by Age in Bluewater
According to the labor force statistics for Bluewater, out of the total population over 16 years of age (132), 37.1% or 49 individuals are in the labor force, with 14.3% or 7 of them unemployed. The age group with the highest labor force participation rate is 25 to 29 years, with 100.0% or 9 individuals in the labor force. Within the labor force, the 60 to 64 years age range has the highest percentage of unemployed individuals, with 100.0% or 7 of them being unemployed.
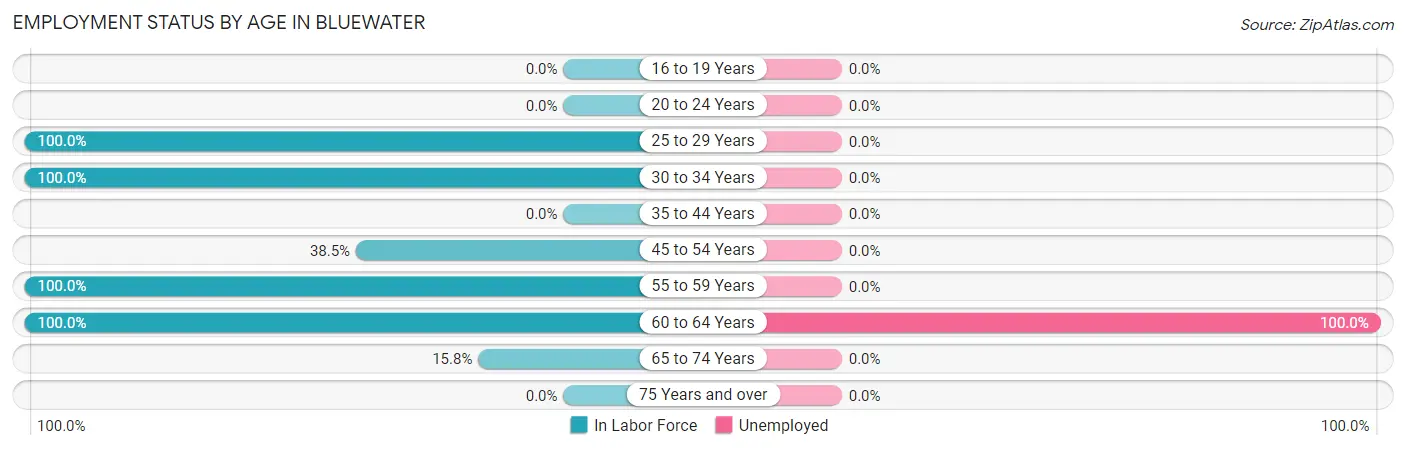
| Age Bracket | In Labor Force | Unemployed |
| 16 to 19 Years | 0 (0.0%) | 0 (0.0%) |
| 20 to 24 Years | 0 (0.0%) | 0 (0.0%) |
| 25 to 29 Years | 9 (100.0%) | 0 (0.0%) |
| 30 to 34 Years | 8 (100.0%) | 0 (0.0%) |
| 35 to 44 Years | 0 (0.0%) | 0 (0.0%) |
| 45 to 54 Years | 5 (38.5%) | 0 (0.0%) |
| 55 to 59 Years | 14 (100.0%) | 0 (0.0%) |
| 60 to 64 Years | 7 (100.0%) | 7 (100.0%) |
| 65 to 74 Years | 6 (15.8%) | 0 (0.0%) |
| 75 Years and over | 0 (0.0%) | 0 (0.0%) |
| Total | 49 (37.1%) | 7 (14.3%) |
Employment Status by Educational Attainment in Bluewater
According to labor force statistics for Bluewater, 84.3% of individuals (43) out of the total population between 25 and 64 years of age (51) are in the labor force, with 16.3% or 7 of them being unemployed. The group with the highest labor force participation rate are those with the educational attainment of less than high school, with 100.0% or 15 individuals in the labor force. Within the labor force, individuals with less than high school education have the highest percentage of unemployment, with 46.7% or 7 of them being unemployed.
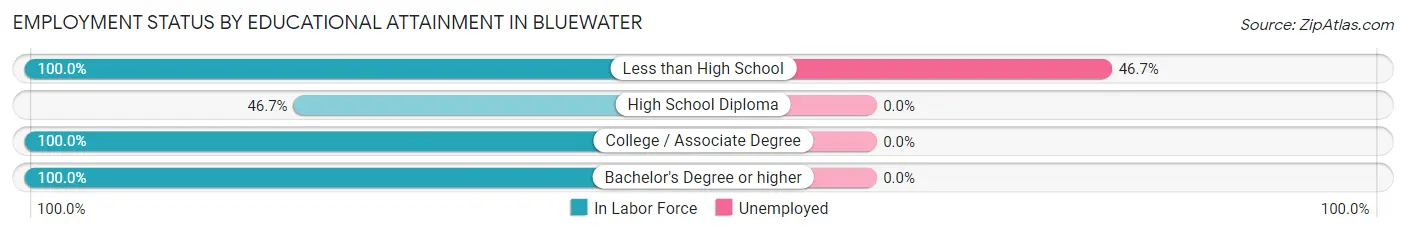
| Educational Attainment | In Labor Force | Unemployed |
| Less than High School | 15 (100.0%) | 7 (46.7%) |
| High School Diploma | 7 (46.7%) | 0 (0.0%) |
| College / Associate Degree | 9 (100.0%) | 0 (0.0%) |
| Bachelor's Degree or higher | 12 (100.0%) | 0 (0.0%) |
| Total | 43 (84.3%) | 8 (16.3%) |
Employment Occupations by Sex in Bluewater
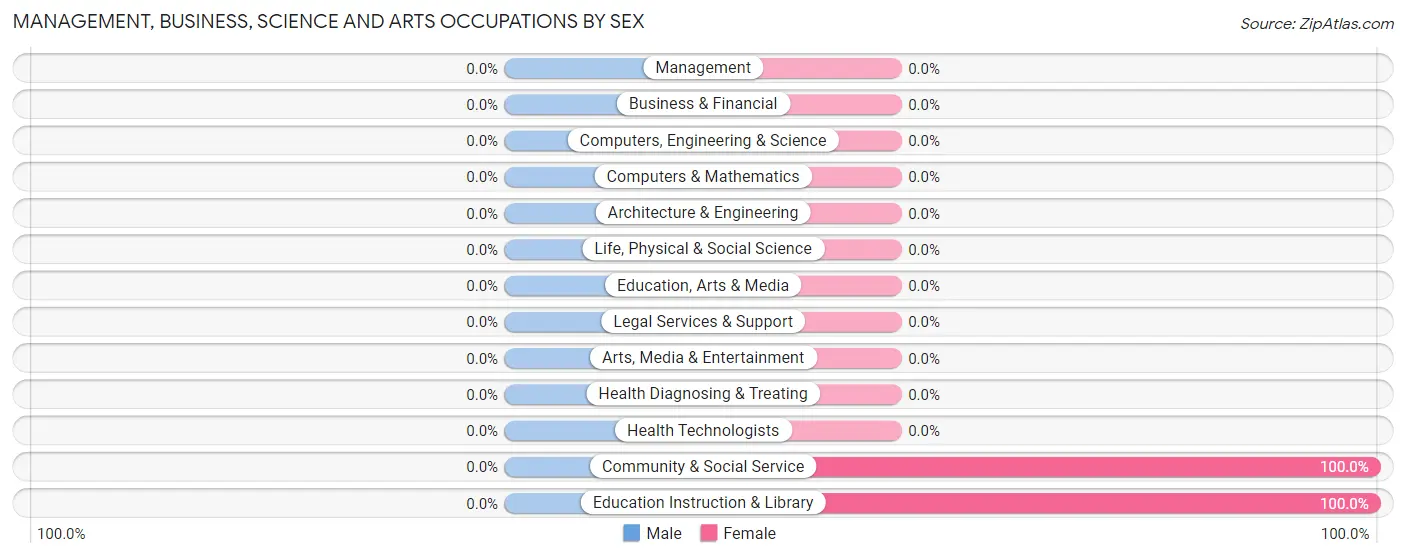
Management, Business, Science and Arts Occupations
The most common Management, Business, Science and Arts occupations in Bluewater are Community & Social Service (6 | 14.3%), and Education Instruction & Library (6 | 14.3%).
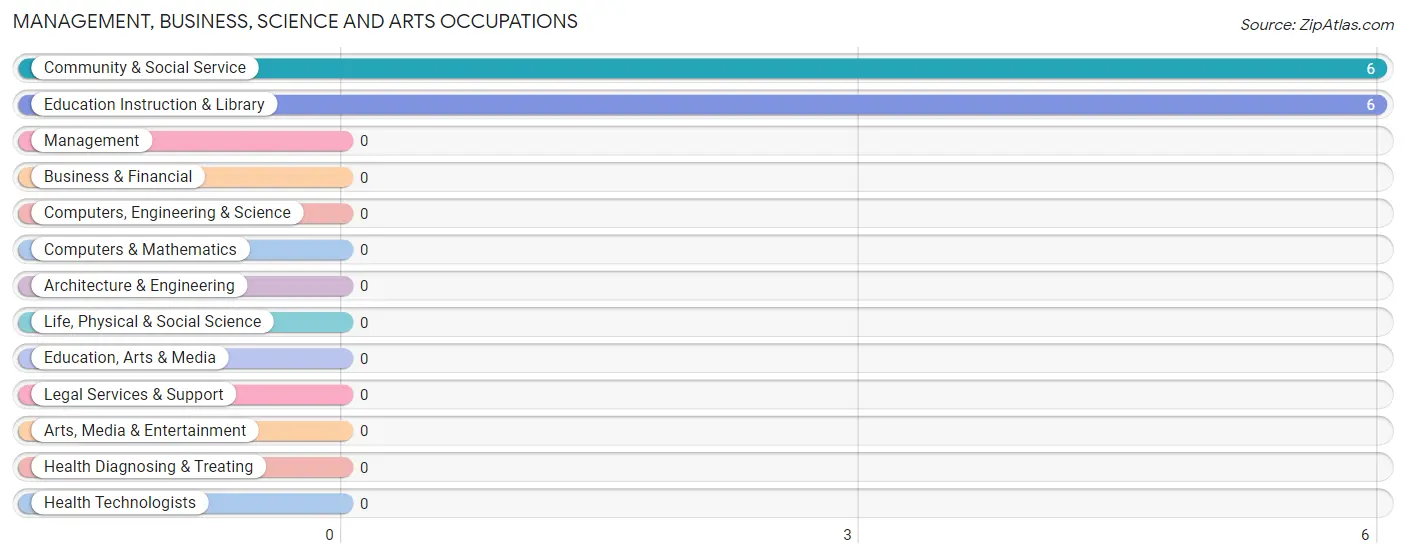
Management, Business, Science and Arts Occupations by Sex
| Occupation | Male | Female |
| Management | 0 (0.0%) | 0 (0.0%) |
| Business & Financial | 0 (0.0%) | 0 (0.0%) |
| Computers, Engineering & Science | 0 (0.0%) | 0 (0.0%) |
| Computers & Mathematics | 0 (0.0%) | 0 (0.0%) |
| Architecture & Engineering | 0 (0.0%) | 0 (0.0%) |
| Life, Physical & Social Science | 0 (0.0%) | 0 (0.0%) |
| Community & Social Service | 0 (0.0%) | 6 (100.0%) |
| Education, Arts & Media | 0 (0.0%) | 0 (0.0%) |
| Legal Services & Support | 0 (0.0%) | 0 (0.0%) |
| Education Instruction & Library | 0 (0.0%) | 6 (100.0%) |
| Arts, Media & Entertainment | 0 (0.0%) | 0 (0.0%) |
| Health Diagnosing & Treating | 0 (0.0%) | 0 (0.0%) |
| Health Technologists | 0 (0.0%) | 0 (0.0%) |
| Total (Category) | 0 (0.0%) | 6 (100.0%) |
| Total (Overall) | 15 (35.7%) | 27 (64.3%) |
Services Occupations
The most common Services occupations in Bluewater are Personal Care & Service (9 | 21.4%), and Food Preparation & Serving (8 | 19.1%).
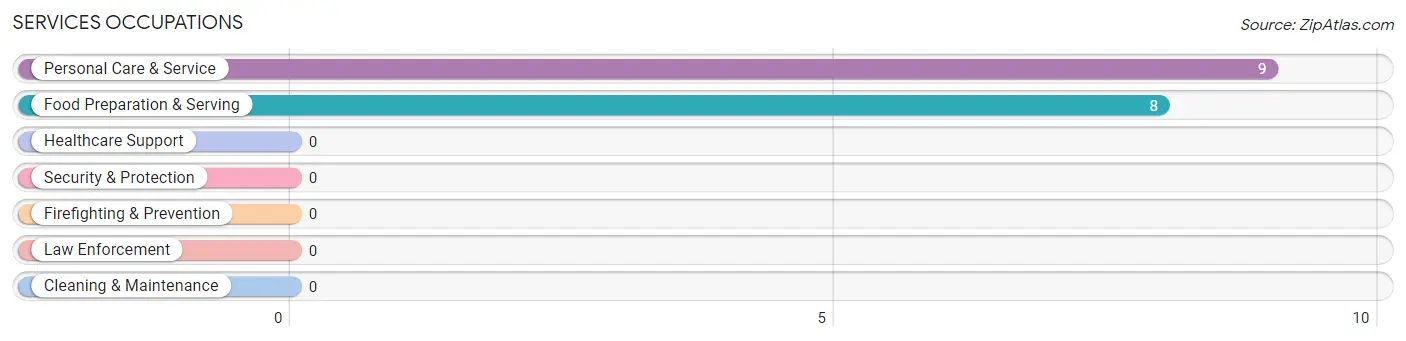
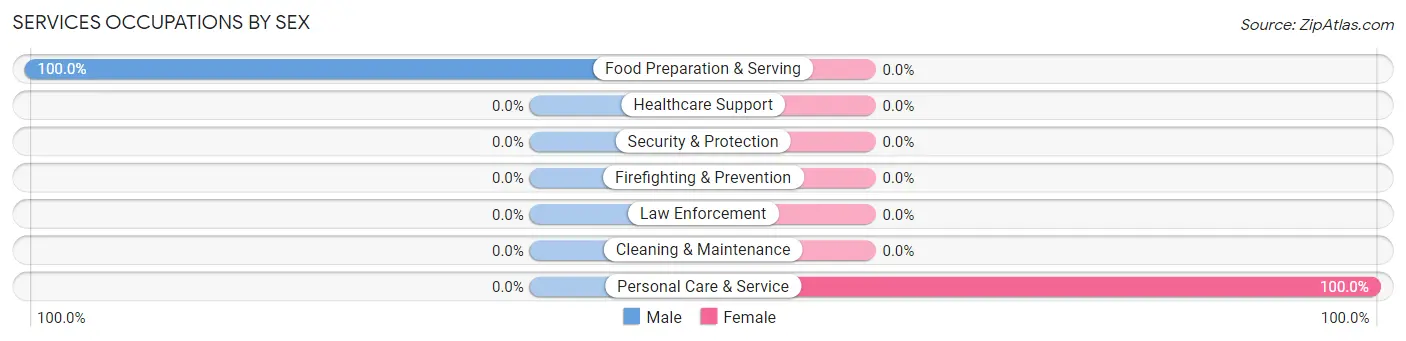
Services Occupations by Sex
| Occupation | Male | Female |
| Healthcare Support | 0 (0.0%) | 0 (0.0%) |
| Security & Protection | 0 (0.0%) | 0 (0.0%) |
| Firefighting & Prevention | 0 (0.0%) | 0 (0.0%) |
| Law Enforcement | 0 (0.0%) | 0 (0.0%) |
| Food Preparation & Serving | 8 (100.0%) | 0 (0.0%) |
| Cleaning & Maintenance | 0 (0.0%) | 0 (0.0%) |
| Personal Care & Service | 0 (0.0%) | 9 (100.0%) |
| Total (Category) | 8 (47.1%) | 9 (52.9%) |
| Total (Overall) | 15 (35.7%) | 27 (64.3%) |
Sales and Office Occupations
The most common Sales and Office occupations in Bluewater are , and Sales & Related (12 | 28.6%).
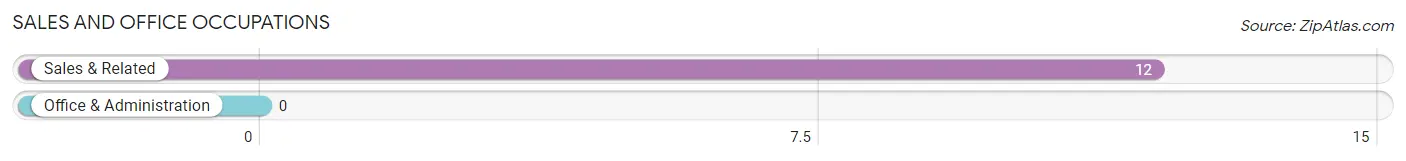
Sales and Office Occupations by Sex
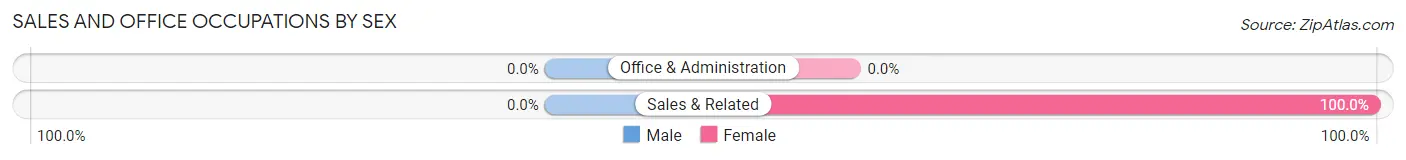
| Occupation | Male | Female |
| Sales & Related | 0 (0.0%) | 12 (100.0%) |
| Office & Administration | 0 (0.0%) | 0 (0.0%) |
| Total (Category) | 0 (0.0%) | 12 (100.0%) |
| Total (Overall) | 15 (35.7%) | 27 (64.3%) |
Natural Resources, Construction and Maintenance Occupations
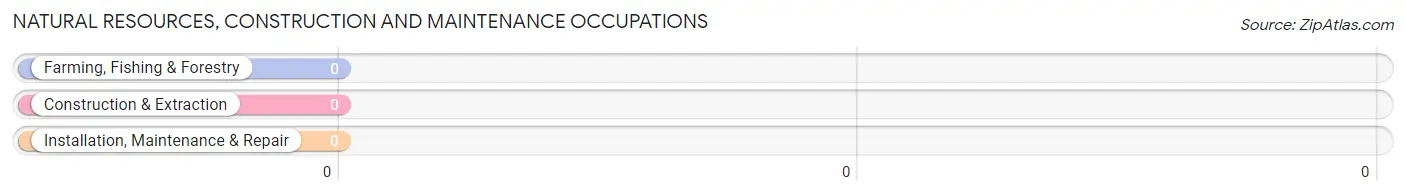
Natural Resources, Construction and Maintenance Occupations by Sex
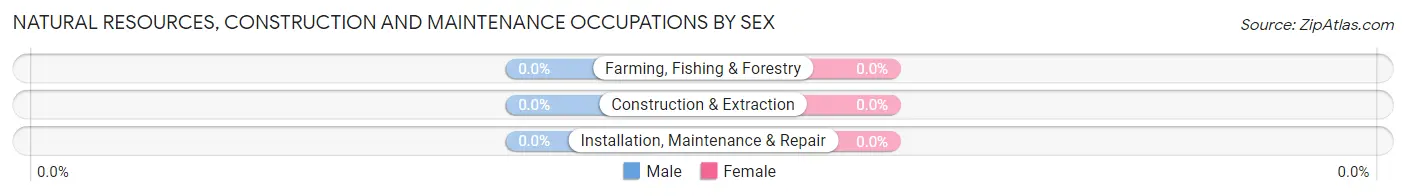
| Occupation | Male | Female |
| Farming, Fishing & Forestry | 0 (0.0%) | 0 (0.0%) |
| Construction & Extraction | 0 (0.0%) | 0 (0.0%) |
| Installation, Maintenance & Repair | 0 (0.0%) | 0 (0.0%) |
| Total (Category) | 0 (0.0%) | 0 (0.0%) |
| Total (Overall) | 15 (35.7%) | 27 (64.3%) |
Production, Transportation and Moving Occupations
The most common Production, Transportation and Moving occupations in Bluewater are , and Material Moving (7 | 16.7%).
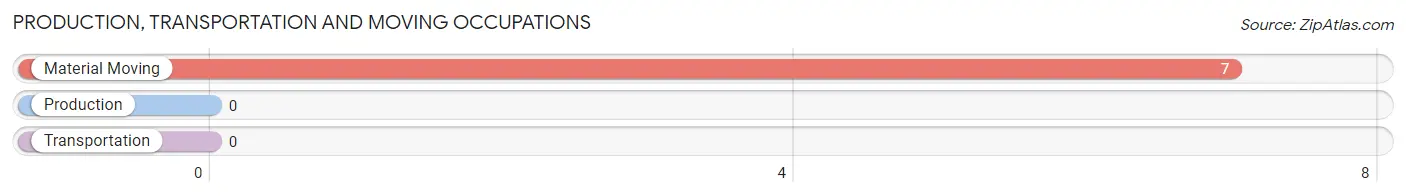
Production, Transportation and Moving Occupations by Sex
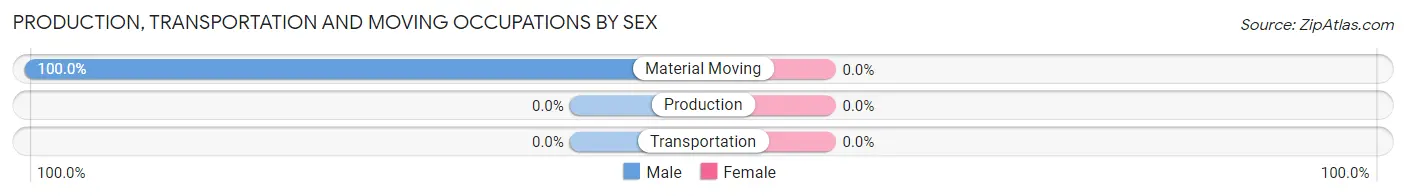
| Occupation | Male | Female |
| Production | 0 (0.0%) | 0 (0.0%) |
| Transportation | 0 (0.0%) | 0 (0.0%) |
| Material Moving | 7 (100.0%) | 0 (0.0%) |
| Total (Category) | 7 (100.0%) | 0 (0.0%) |
| Total (Overall) | 15 (35.7%) | 27 (64.3%) |
Employment Industries by Sex in Bluewater
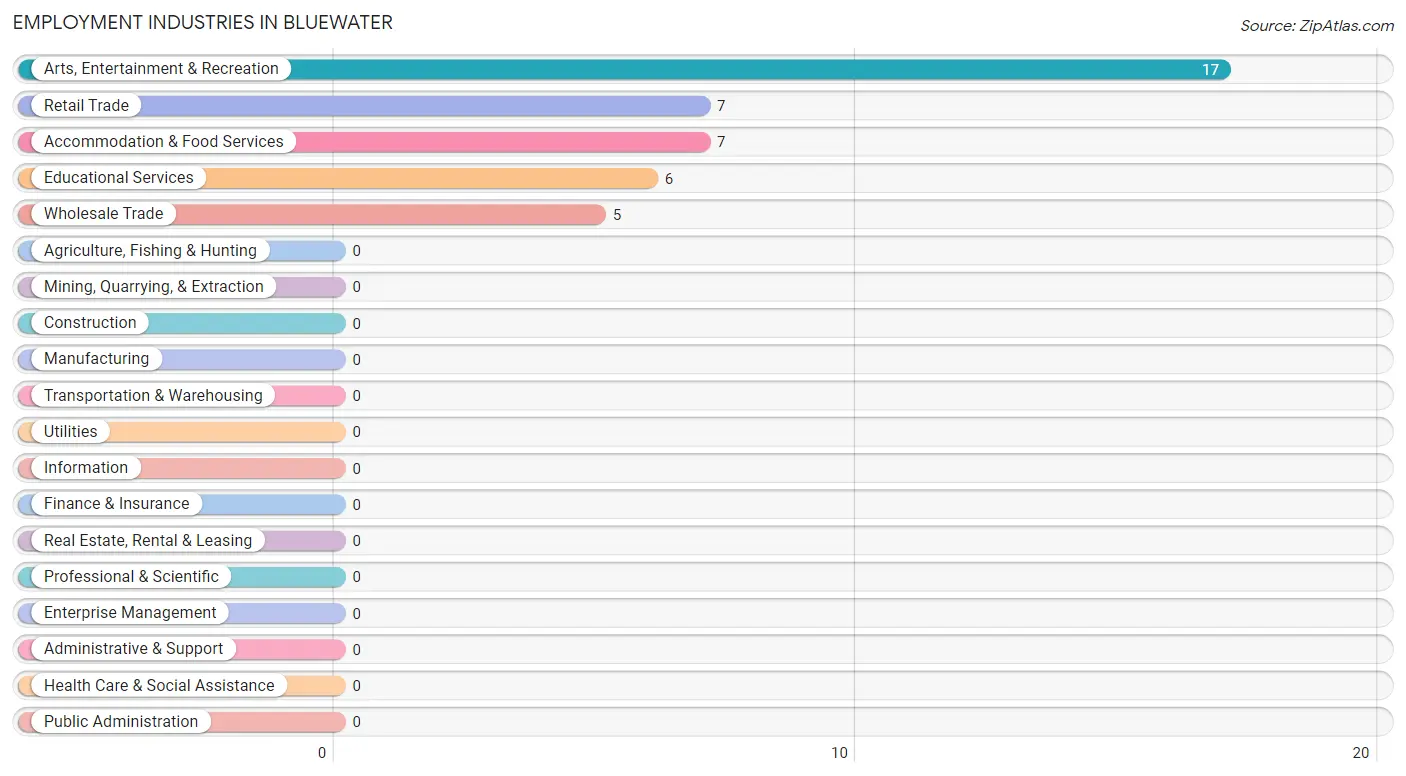
Employment Industries in Bluewater
The major employment industries in Bluewater include Arts, Entertainment & Recreation (17 | 40.5%), Retail Trade (7 | 16.7%), Accommodation & Food Services (7 | 16.7%), Educational Services (6 | 14.3%), and Wholesale Trade (5 | 11.9%).
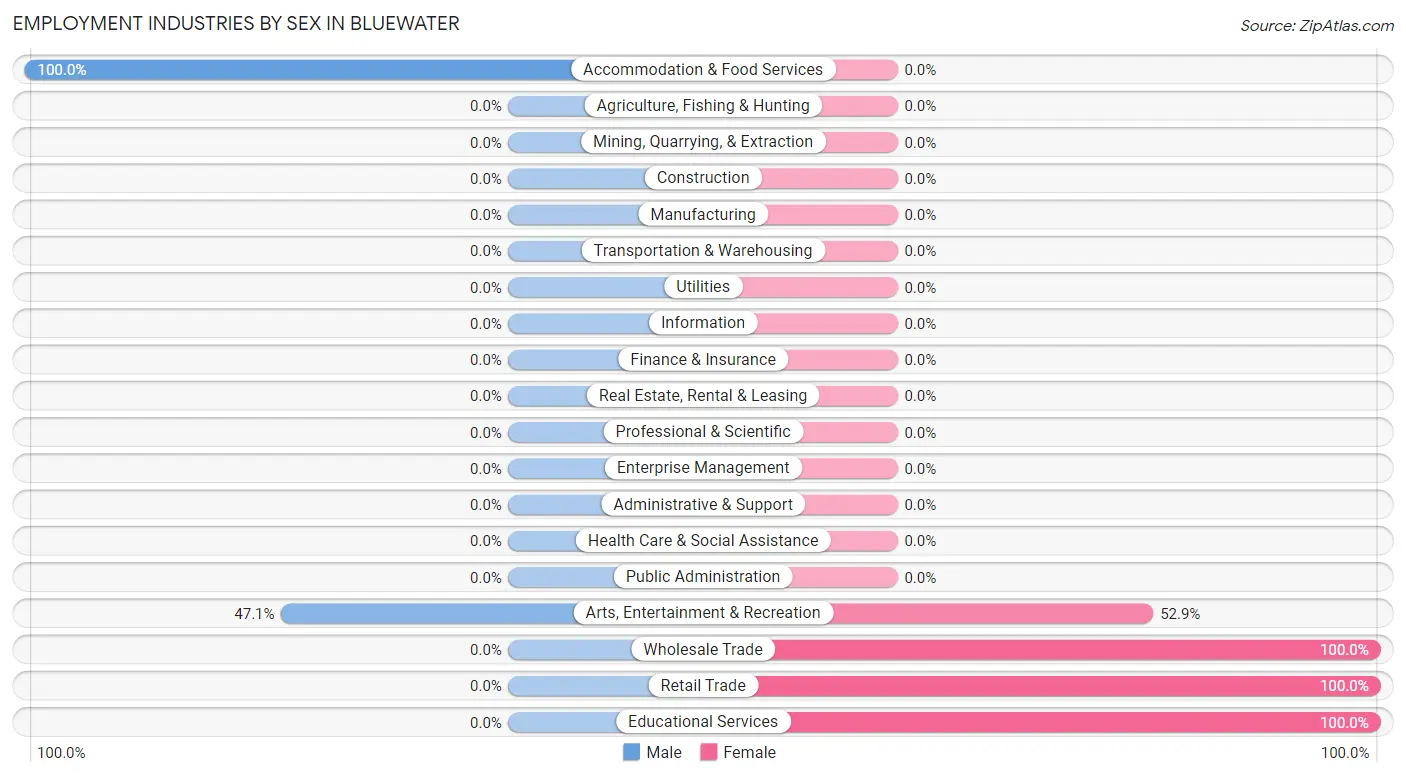
Employment Industries by Sex in Bluewater
The Bluewater industries that see more men than women are Accommodation & Food Services (100.0%), and Arts, Entertainment & Recreation (47.1%), whereas the industries that tend to have a higher number of women are Wholesale Trade (100.0%), Retail Trade (100.0%), and Educational Services (100.0%).
| Industry | Male | Female |
| Agriculture, Fishing & Hunting | 0 (0.0%) | 0 (0.0%) |
| Mining, Quarrying, & Extraction | 0 (0.0%) | 0 (0.0%) |
| Construction | 0 (0.0%) | 0 (0.0%) |
| Manufacturing | 0 (0.0%) | 0 (0.0%) |
| Wholesale Trade | 0 (0.0%) | 5 (100.0%) |
| Retail Trade | 0 (0.0%) | 7 (100.0%) |
| Transportation & Warehousing | 0 (0.0%) | 0 (0.0%) |
| Utilities | 0 (0.0%) | 0 (0.0%) |
| Information | 0 (0.0%) | 0 (0.0%) |
| Finance & Insurance | 0 (0.0%) | 0 (0.0%) |
| Real Estate, Rental & Leasing | 0 (0.0%) | 0 (0.0%) |
| Professional & Scientific | 0 (0.0%) | 0 (0.0%) |
| Enterprise Management | 0 (0.0%) | 0 (0.0%) |
| Administrative & Support | 0 (0.0%) | 0 (0.0%) |
| Educational Services | 0 (0.0%) | 6 (100.0%) |
| Health Care & Social Assistance | 0 (0.0%) | 0 (0.0%) |
| Arts, Entertainment & Recreation | 8 (47.1%) | 9 (52.9%) |
| Accommodation & Food Services | 7 (100.0%) | 0 (0.0%) |
| Public Administration | 0 (0.0%) | 0 (0.0%) |
| Total | 15 (35.7%) | 27 (64.3%) |
Education in Bluewater
School Enrollment in Bluewater
The most common levels of schooling among the 17 students in Bluewater are nursery / preschool (9 | 52.9%), and elementary school (8 | 47.1%).
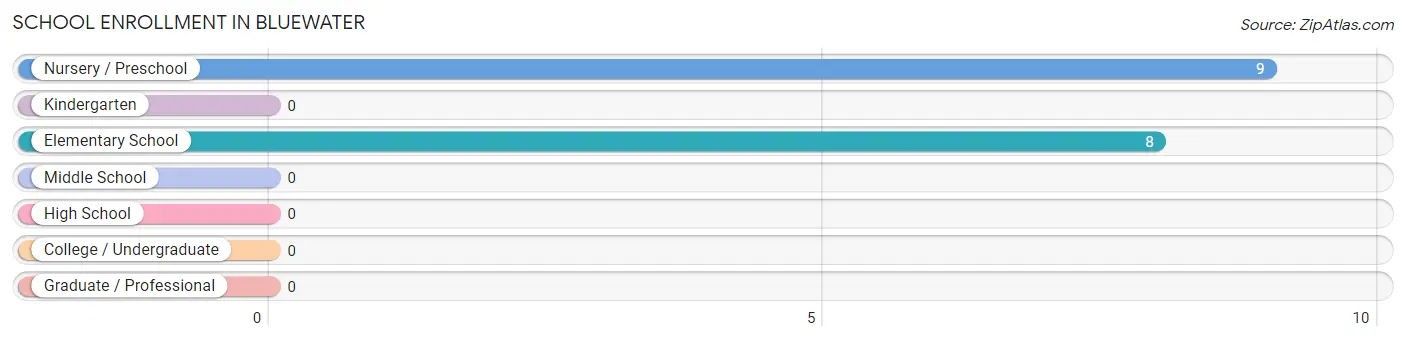
| School Level | # Students | % Students |
| Nursery / Preschool | 9 | 52.9% |
| Kindergarten | 0 | 0.0% |
| Elementary School | 8 | 47.1% |
| Middle School | 0 | 0.0% |
| High School | 0 | 0.0% |
| College / Undergraduate | 0 | 0.0% |
| Graduate / Professional | 0 | 0.0% |
| Total | 17 | 100.0% |
School Enrollment by Age by Funding Source in Bluewater
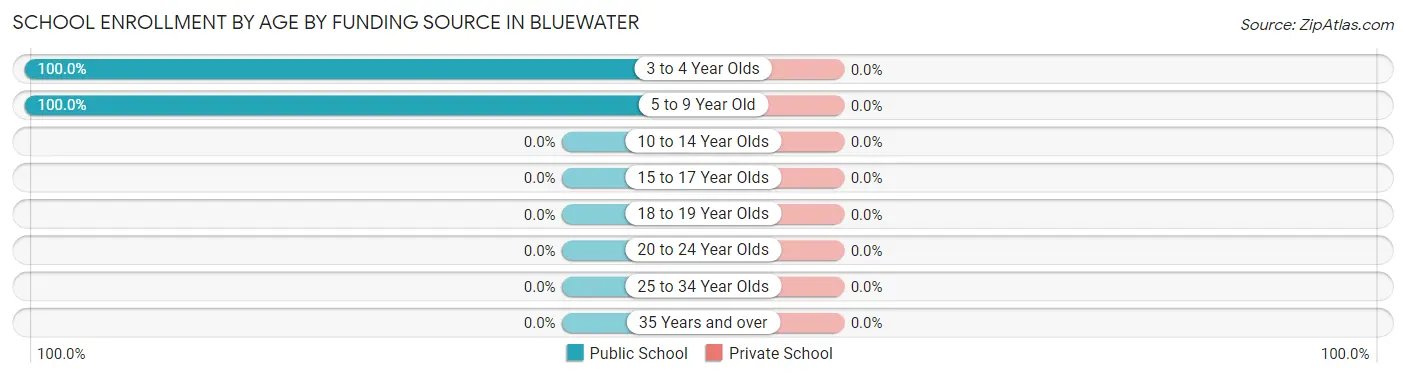
| Age Bracket | Public School | Private School |
| 3 to 4 Year Olds | 9 (100.0%) | 0 (0.0%) |
| 5 to 9 Year Old | 8 (100.0%) | 0 (0.0%) |
| 10 to 14 Year Olds | 0 (0.0%) | 0 (0.0%) |
| 15 to 17 Year Olds | 0 (0.0%) | 0 (0.0%) |
| 18 to 19 Year Olds | 0 (0.0%) | 0 (0.0%) |
| 20 to 24 Year Olds | 0 (0.0%) | 0 (0.0%) |
| 25 to 34 Year Olds | 0 (0.0%) | 0 (0.0%) |
| 35 Years and over | 0 (0.0%) | 0 (0.0%) |
| Total | 17 (100.0%) | 0 (0.0%) |
Educational Attainment by Field of Study in Bluewater
Education (7 | 26.9%), visual & performing arts (7 | 26.9%), arts & humanities (7 | 26.9%), and liberal arts & history (5 | 19.2%) are the most common fields of study among 26 individuals in Bluewater who have obtained a bachelor's degree or higher.
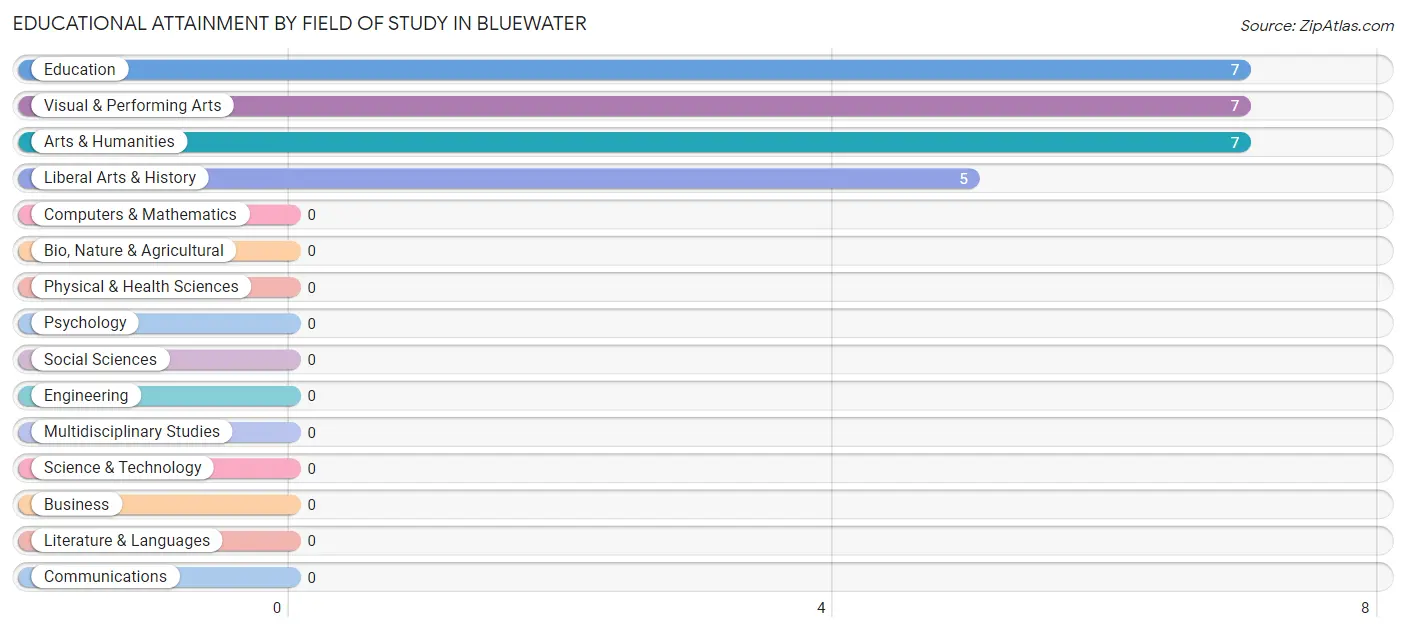
| Field of Study | # Graduates | % Graduates |
| Computers & Mathematics | 0 | 0.0% |
| Bio, Nature & Agricultural | 0 | 0.0% |
| Physical & Health Sciences | 0 | 0.0% |
| Psychology | 0 | 0.0% |
| Social Sciences | 0 | 0.0% |
| Engineering | 0 | 0.0% |
| Multidisciplinary Studies | 0 | 0.0% |
| Science & Technology | 0 | 0.0% |
| Business | 0 | 0.0% |
| Education | 7 | 26.9% |
| Literature & Languages | 0 | 0.0% |
| Liberal Arts & History | 5 | 19.2% |
| Visual & Performing Arts | 7 | 26.9% |
| Communications | 0 | 0.0% |
| Arts & Humanities | 7 | 26.9% |
| Total | 26 | 100.0% |
Transportation & Commute in Bluewater
Vehicle Availability by Sex in Bluewater
The most prevalent vehicle ownership categories in Bluewater are males with 1 vehicle (15, accounting for 100.0%) and females with 1 vehicle (20, making up 55.6%).
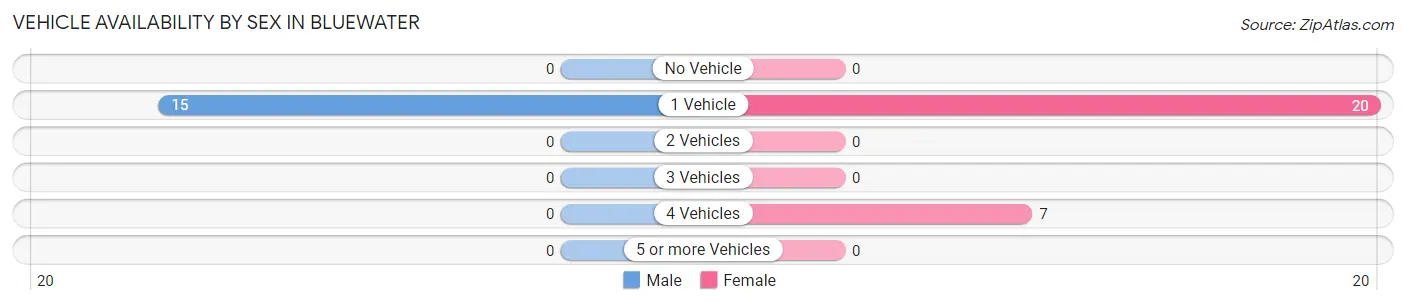
| Vehicles Available | Male | Female |
| No Vehicle | 0 (0.0%) | 0 (0.0%) |
| 1 Vehicle | 15 (100.0%) | 20 (74.1%) |
| 2 Vehicles | 0 (0.0%) | 0 (0.0%) |
| 3 Vehicles | 0 (0.0%) | 0 (0.0%) |
| 4 Vehicles | 0 (0.0%) | 7 (25.9%) |
| 5 or more Vehicles | 0 (0.0%) | 0 (0.0%) |
| Total | 15 (100.0%) | 27 (100.0%) |
Commute Time in Bluewater
The most frequently occuring commute durations in Bluewater are 10 to 14 minutes (23 commuters, 76.7%), 20 to 24 minutes (7 commuters, 23.3%), and less than 5 minutes (0 commuters, 0.0%).
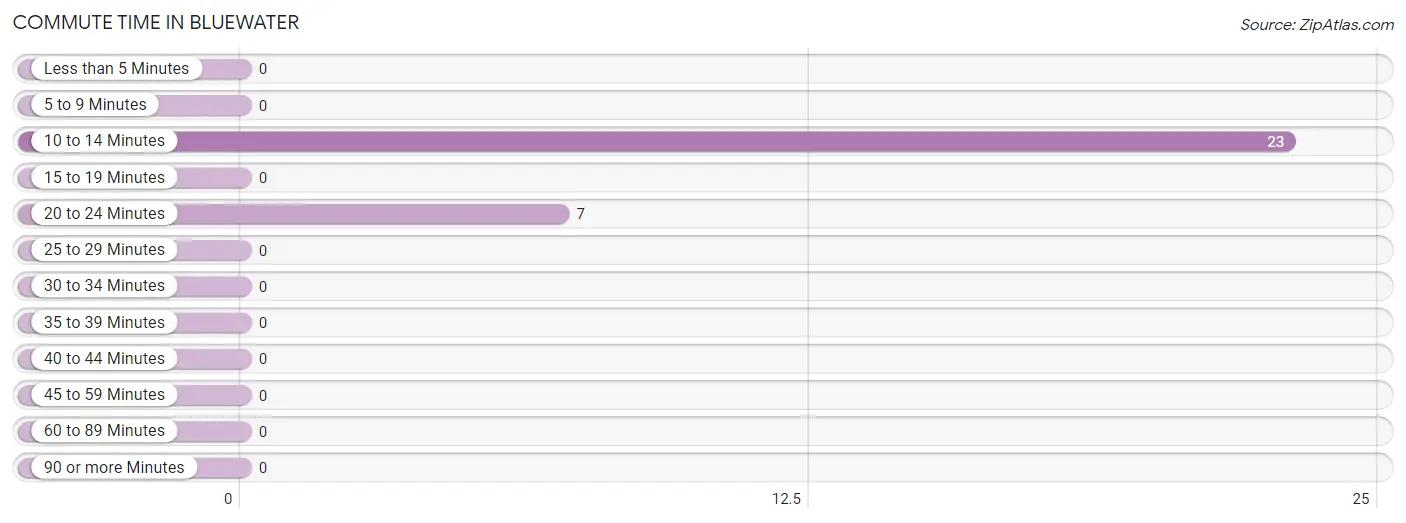
| Commute Time | # Commuters | % Commuters |
| Less than 5 Minutes | 0 | 0.0% |
| 5 to 9 Minutes | 0 | 0.0% |
| 10 to 14 Minutes | 23 | 76.7% |
| 15 to 19 Minutes | 0 | 0.0% |
| 20 to 24 Minutes | 7 | 23.3% |
| 25 to 29 Minutes | 0 | 0.0% |
| 30 to 34 Minutes | 0 | 0.0% |
| 35 to 39 Minutes | 0 | 0.0% |
| 40 to 44 Minutes | 0 | 0.0% |
| 45 to 59 Minutes | 0 | 0.0% |
| 60 to 89 Minutes | 0 | 0.0% |
| 90 or more Minutes | 0 | 0.0% |
Commute Time by Sex in Bluewater
The most common commute times in Bluewater are 10 to 14 minutes (8 commuters, 53.3%) for males and 10 to 14 minutes (15 commuters, 100.0%) for females.
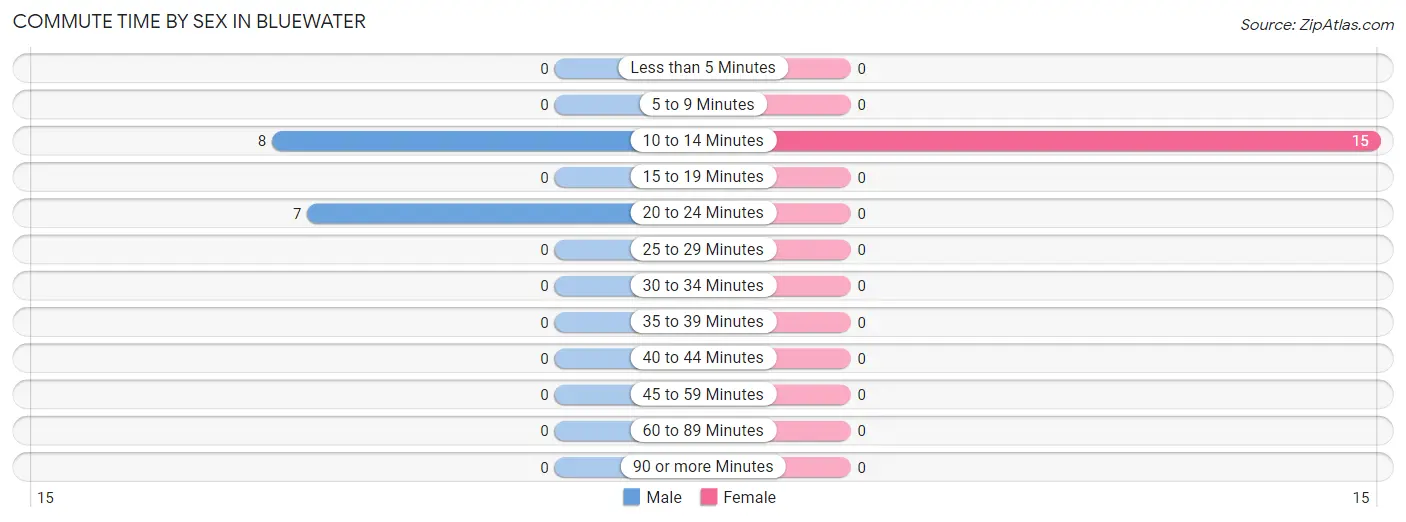
| Commute Time | Male | Female |
| Less than 5 Minutes | 0 (0.0%) | 0 (0.0%) |
| 5 to 9 Minutes | 0 (0.0%) | 0 (0.0%) |
| 10 to 14 Minutes | 8 (53.3%) | 15 (100.0%) |
| 15 to 19 Minutes | 0 (0.0%) | 0 (0.0%) |
| 20 to 24 Minutes | 7 (46.7%) | 0 (0.0%) |
| 25 to 29 Minutes | 0 (0.0%) | 0 (0.0%) |
| 30 to 34 Minutes | 0 (0.0%) | 0 (0.0%) |
| 35 to 39 Minutes | 0 (0.0%) | 0 (0.0%) |
| 40 to 44 Minutes | 0 (0.0%) | 0 (0.0%) |
| 45 to 59 Minutes | 0 (0.0%) | 0 (0.0%) |
| 60 to 89 Minutes | 0 (0.0%) | 0 (0.0%) |
| 90 or more Minutes | 0 (0.0%) | 0 (0.0%) |
Time of Departure to Work by Sex in Bluewater
The most frequent times of departure to work in Bluewater are 7:30 AM to 7:59 AM (8, 53.3%) for males and 7:30 AM to 7:59 AM (15, 100.0%) for females.
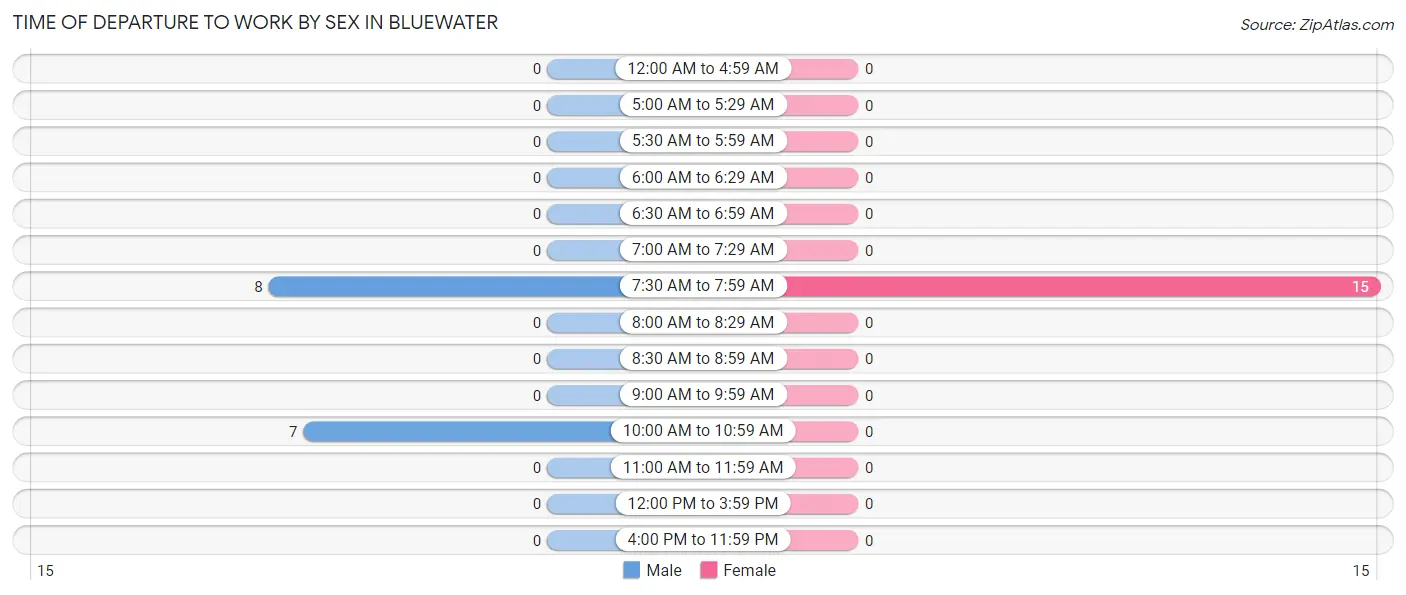
| Time of Departure | Male | Female |
| 12:00 AM to 4:59 AM | 0 (0.0%) | 0 (0.0%) |
| 5:00 AM to 5:29 AM | 0 (0.0%) | 0 (0.0%) |
| 5:30 AM to 5:59 AM | 0 (0.0%) | 0 (0.0%) |
| 6:00 AM to 6:29 AM | 0 (0.0%) | 0 (0.0%) |
| 6:30 AM to 6:59 AM | 0 (0.0%) | 0 (0.0%) |
| 7:00 AM to 7:29 AM | 0 (0.0%) | 0 (0.0%) |
| 7:30 AM to 7:59 AM | 8 (53.3%) | 15 (100.0%) |
| 8:00 AM to 8:29 AM | 0 (0.0%) | 0 (0.0%) |
| 8:30 AM to 8:59 AM | 0 (0.0%) | 0 (0.0%) |
| 9:00 AM to 9:59 AM | 0 (0.0%) | 0 (0.0%) |
| 10:00 AM to 10:59 AM | 7 (46.7%) | 0 (0.0%) |
| 11:00 AM to 11:59 AM | 0 (0.0%) | 0 (0.0%) |
| 12:00 PM to 3:59 PM | 0 (0.0%) | 0 (0.0%) |
| 4:00 PM to 11:59 PM | 0 (0.0%) | 0 (0.0%) |
| Total | 15 (100.0%) | 15 (100.0%) |
Housing Occupancy in Bluewater
Occupancy by Ownership in Bluewater
Of the total 71 dwellings in Bluewater, owner-occupied units account for 64 (90.1%), while renter-occupied units make up 7 (9.9%).
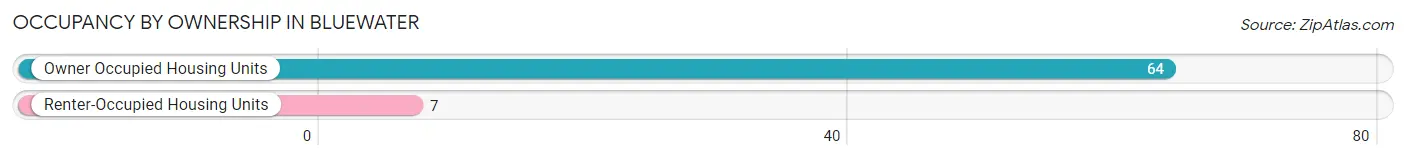
| Occupancy | # Housing Units | % Housing Units |
| Owner Occupied Housing Units | 64 | 90.1% |
| Renter-Occupied Housing Units | 7 | 9.9% |
| Total Occupied Housing Units | 71 | 100.0% |
Occupancy by Household Size in Bluewater
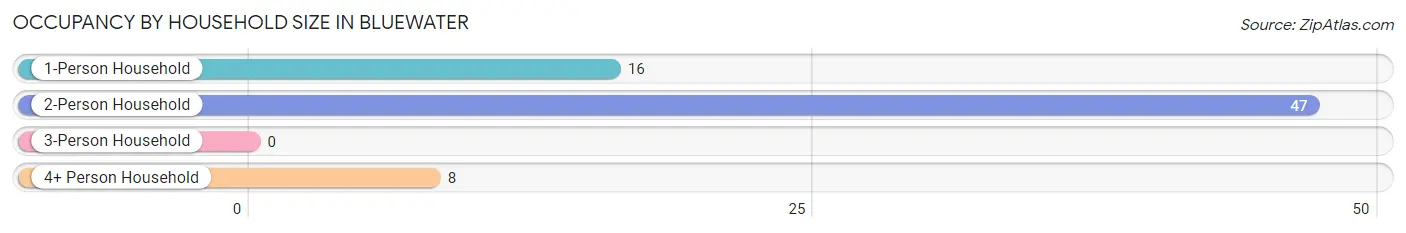
| Household Size | # Housing Units | % Housing Units |
| 1-Person Household | 16 | 22.5% |
| 2-Person Household | 47 | 66.2% |
| 3-Person Household | 0 | 0.0% |
| 4+ Person Household | 8 | 11.3% |
| Total Housing Units | 71 | 100.0% |
Occupancy by Ownership by Household Size in Bluewater
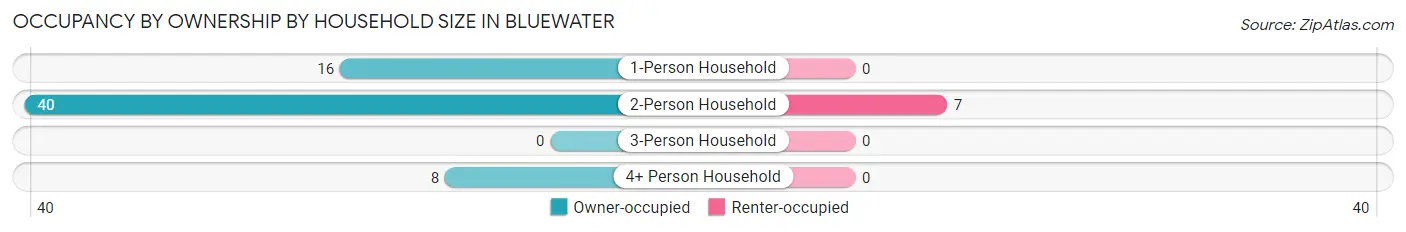
| Household Size | Owner-occupied | Renter-occupied |
| 1-Person Household | 16 (100.0%) | 0 (0.0%) |
| 2-Person Household | 40 (85.1%) | 7 (14.9%) |
| 3-Person Household | 0 (0.0%) | 0 (0.0%) |
| 4+ Person Household | 8 (100.0%) | 0 (0.0%) |
| Total Housing Units | 64 (90.1%) | 7 (9.9%) |
Occupancy by Educational Attainment in Bluewater
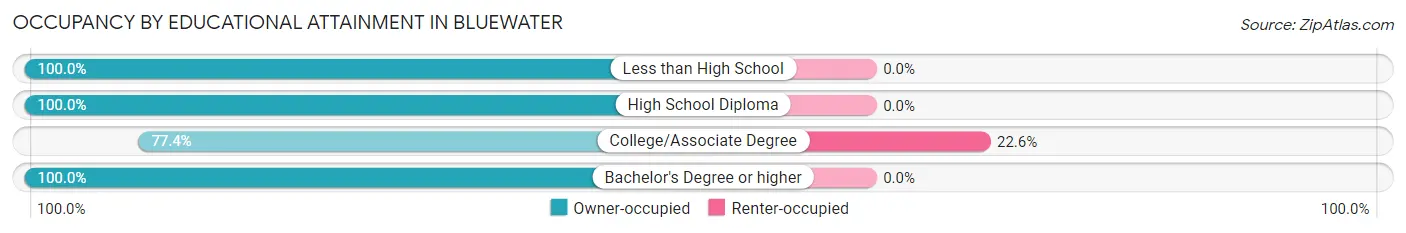
| Household Size | Owner-occupied | Renter-occupied |
| Less than High School | 15 (100.0%) | 0 (0.0%) |
| High School Diploma | 13 (100.0%) | 0 (0.0%) |
| College/Associate Degree | 24 (77.4%) | 7 (22.6%) |
| Bachelor's Degree or higher | 12 (100.0%) | 0 (0.0%) |
Occupancy by Age of Householder in Bluewater
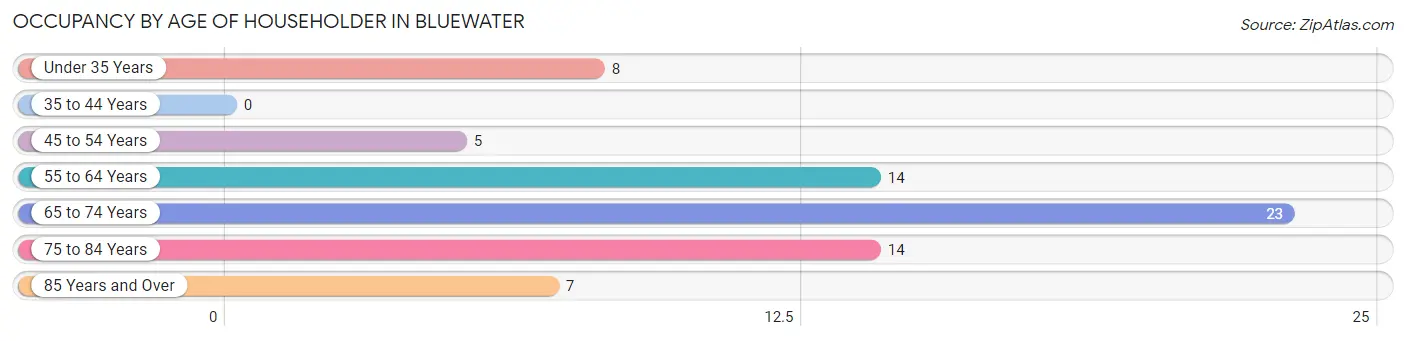
| Age Bracket | # Households | % Households |
| Under 35 Years | 8 | 11.3% |
| 35 to 44 Years | 0 | 0.0% |
| 45 to 54 Years | 5 | 7.0% |
| 55 to 64 Years | 14 | 19.7% |
| 65 to 74 Years | 23 | 32.4% |
| 75 to 84 Years | 14 | 19.7% |
| 85 Years and Over | 7 | 9.9% |
| Total | 71 | 100.0% |
Housing Finances in Bluewater
Median Income by Occupancy in Bluewater
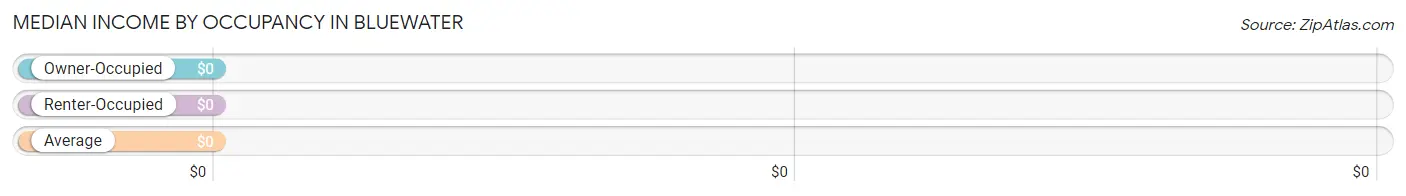
| Occupancy Type | # Households | Median Income |
| Owner-Occupied | 64 (90.1%) | $0 |
| Renter-Occupied | 7 (9.9%) | $0 |
| Average | 71 (100.0%) | $0 |
Occupancy by Householder Income Bracket in Bluewater
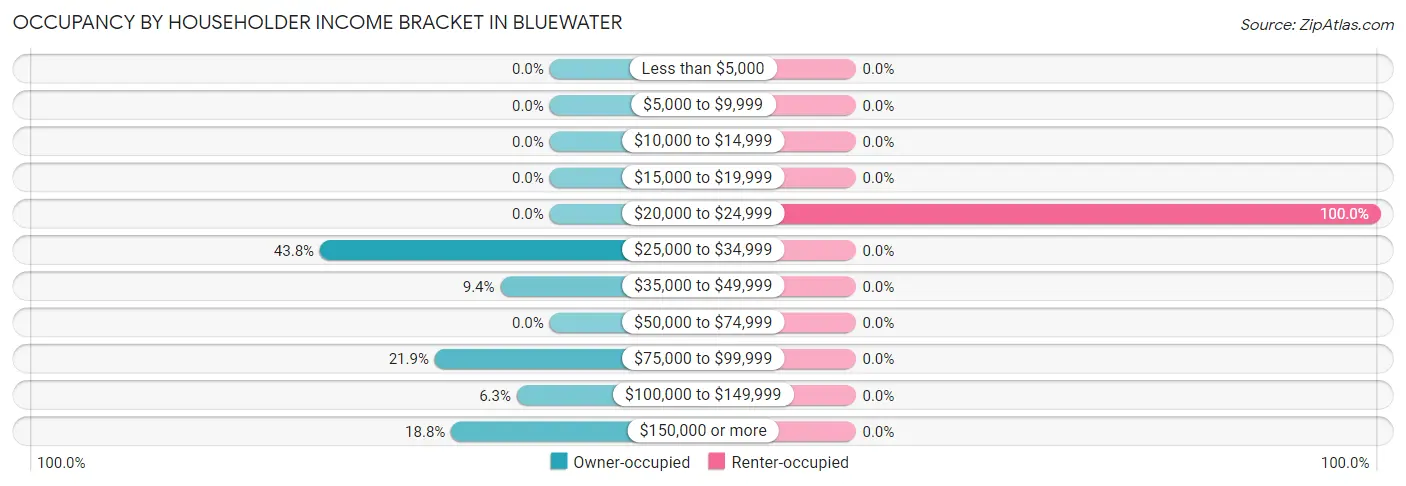
| Income Bracket | Owner-occupied | Renter-occupied |
| Less than $5,000 | 0 (0.0%) | 0 (0.0%) |
| $5,000 to $9,999 | 0 (0.0%) | 0 (0.0%) |
| $10,000 to $14,999 | 0 (0.0%) | 0 (0.0%) |
| $15,000 to $19,999 | 0 (0.0%) | 0 (0.0%) |
| $20,000 to $24,999 | 0 (0.0%) | 7 (100.0%) |
| $25,000 to $34,999 | 28 (43.8%) | 0 (0.0%) |
| $35,000 to $49,999 | 6 (9.4%) | 0 (0.0%) |
| $50,000 to $74,999 | 0 (0.0%) | 0 (0.0%) |
| $75,000 to $99,999 | 14 (21.9%) | 0 (0.0%) |
| $100,000 to $149,999 | 4 (6.2%) | 0 (0.0%) |
| $150,000 or more | 12 (18.8%) | 0 (0.0%) |
| Total | 64 (100.0%) | 7 (100.0%) |
Monthly Housing Cost Tiers in Bluewater
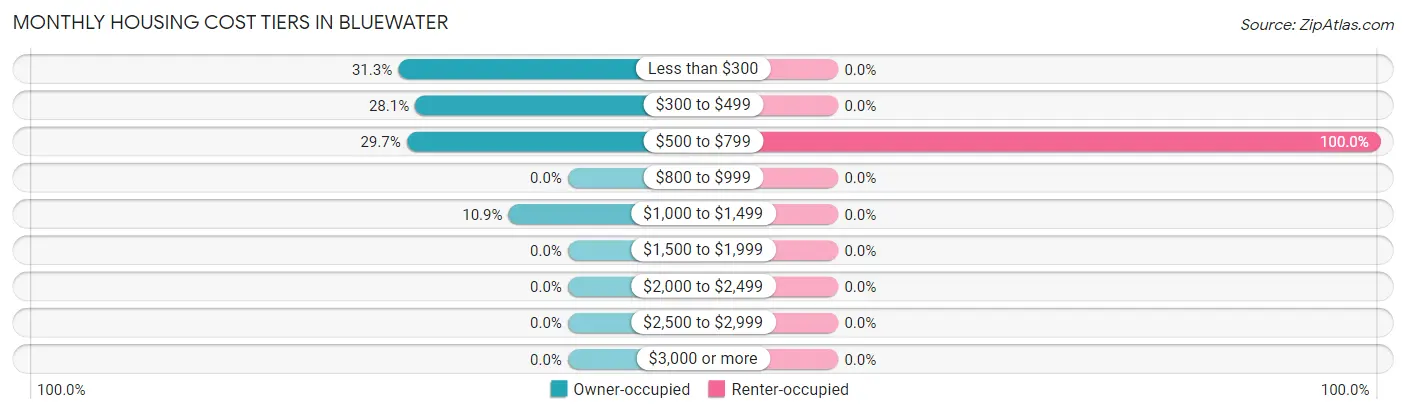
| Monthly Cost | Owner-occupied | Renter-occupied |
| Less than $300 | 20 (31.2%) | 0 (0.0%) |
| $300 to $499 | 18 (28.1%) | 0 (0.0%) |
| $500 to $799 | 19 (29.7%) | 7 (100.0%) |
| $800 to $999 | 0 (0.0%) | 0 (0.0%) |
| $1,000 to $1,499 | 7 (10.9%) | 0 (0.0%) |
| $1,500 to $1,999 | 0 (0.0%) | 0 (0.0%) |
| $2,000 to $2,499 | 0 (0.0%) | 0 (0.0%) |
| $2,500 to $2,999 | 0 (0.0%) | 0 (0.0%) |
| $3,000 or more | 0 (0.0%) | 0 (0.0%) |
| Total | 64 (100.0%) | 7 (100.0%) |
Physical Housing Characteristics in Bluewater
Housing Structures in Bluewater
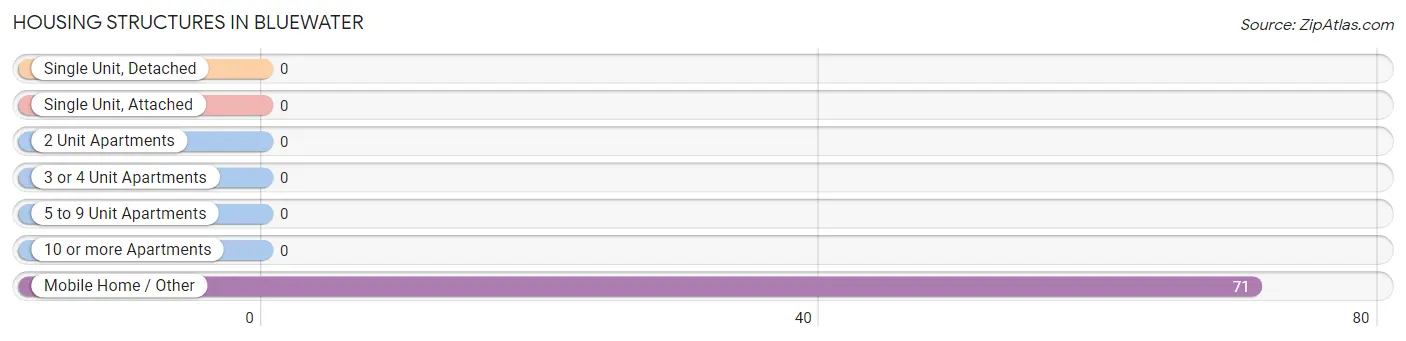
| Structure Type | # Housing Units | % Housing Units |
| Single Unit, Detached | 0 | 0.0% |
| Single Unit, Attached | 0 | 0.0% |
| 2 Unit Apartments | 0 | 0.0% |
| 3 or 4 Unit Apartments | 0 | 0.0% |
| 5 to 9 Unit Apartments | 0 | 0.0% |
| 10 or more Apartments | 0 | 0.0% |
| Mobile Home / Other | 71 | 100.0% |
| Total | 71 | 100.0% |
Housing Structures by Occupancy in Bluewater
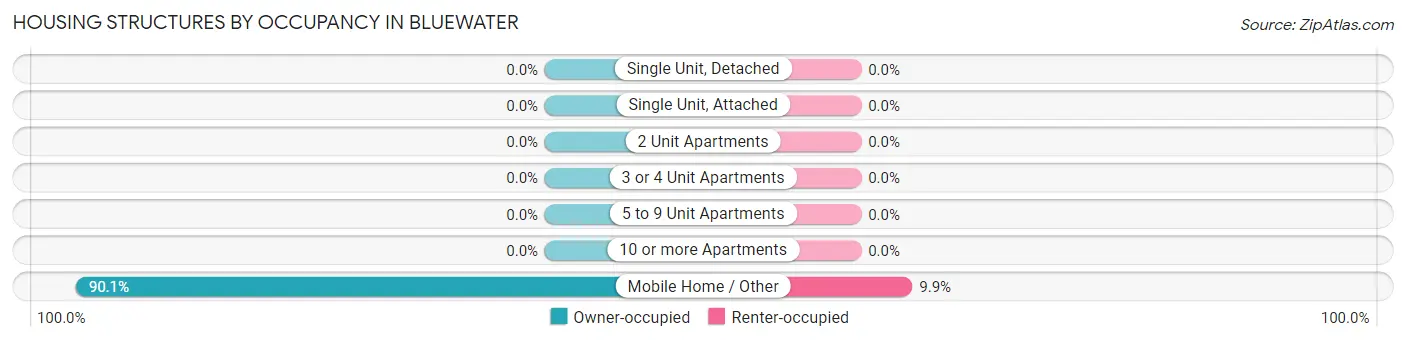
| Structure Type | Owner-occupied | Renter-occupied |
| Single Unit, Detached | 0 (0.0%) | 0 (0.0%) |
| Single Unit, Attached | 0 (0.0%) | 0 (0.0%) |
| 2 Unit Apartments | 0 (0.0%) | 0 (0.0%) |
| 3 or 4 Unit Apartments | 0 (0.0%) | 0 (0.0%) |
| 5 to 9 Unit Apartments | 0 (0.0%) | 0 (0.0%) |
| 10 or more Apartments | 0 (0.0%) | 0 (0.0%) |
| Mobile Home / Other | 64 (90.1%) | 7 (9.9%) |
| Total | 64 (90.1%) | 7 (9.9%) |
Housing Structures by Number of Rooms in Bluewater
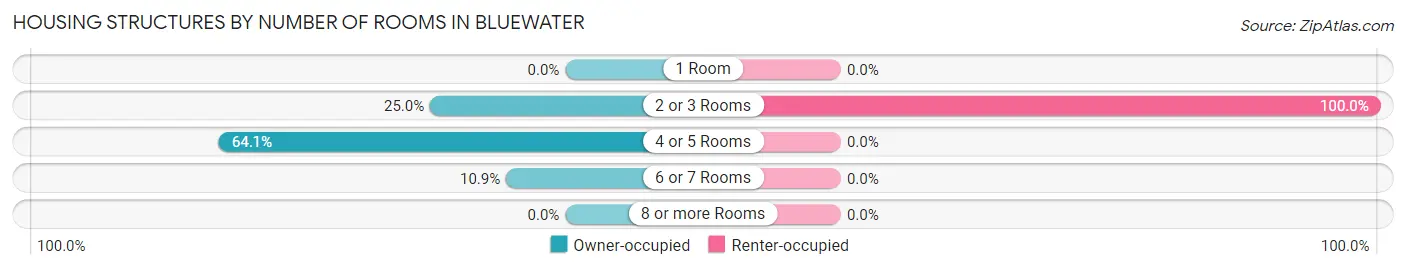
| Number of Rooms | Owner-occupied | Renter-occupied |
| 1 Room | 0 (0.0%) | 0 (0.0%) |
| 2 or 3 Rooms | 16 (25.0%) | 7 (100.0%) |
| 4 or 5 Rooms | 41 (64.1%) | 0 (0.0%) |
| 6 or 7 Rooms | 7 (10.9%) | 0 (0.0%) |
| 8 or more Rooms | 0 (0.0%) | 0 (0.0%) |
| Total | 64 (100.0%) | 7 (100.0%) |
Housing Structure by Heating Type in Bluewater
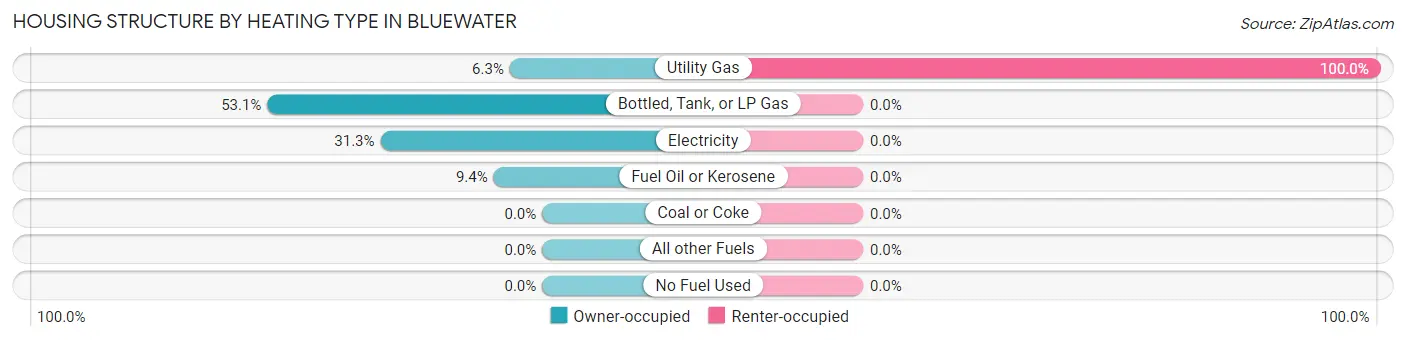
| Heating Type | Owner-occupied | Renter-occupied |
| Utility Gas | 4 (6.2%) | 7 (100.0%) |
| Bottled, Tank, or LP Gas | 34 (53.1%) | 0 (0.0%) |
| Electricity | 20 (31.2%) | 0 (0.0%) |
| Fuel Oil or Kerosene | 6 (9.4%) | 0 (0.0%) |
| Coal or Coke | 0 (0.0%) | 0 (0.0%) |
| All other Fuels | 0 (0.0%) | 0 (0.0%) |
| No Fuel Used | 0 (0.0%) | 0 (0.0%) |
| Total | 64 (100.0%) | 7 (100.0%) |
Household Vehicle Usage in Bluewater
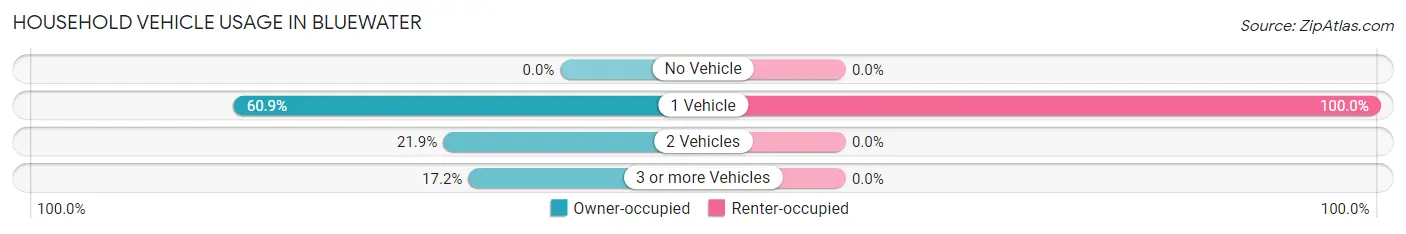
| Vehicles per Household | Owner-occupied | Renter-occupied |
| No Vehicle | 0 (0.0%) | 0 (0.0%) |
| 1 Vehicle | 39 (60.9%) | 7 (100.0%) |
| 2 Vehicles | 14 (21.9%) | 0 (0.0%) |
| 3 or more Vehicles | 11 (17.2%) | 0 (0.0%) |
| Total | 64 (100.0%) | 7 (100.0%) |
Real Estate & Mortgages in Bluewater
Real Estate and Mortgage Overview in Bluewater
| Characteristic | Without Mortgage | With Mortgage |
| Housing Units | 56 | 8 |
| Median Property Value | $41,400 | $0 |
| Median Household Income | - | - |
| Monthly Housing Costs | $409 | $0 |
| Real Estate Taxes | $199 | $0 |
Property Value by Mortgage Status in Bluewater
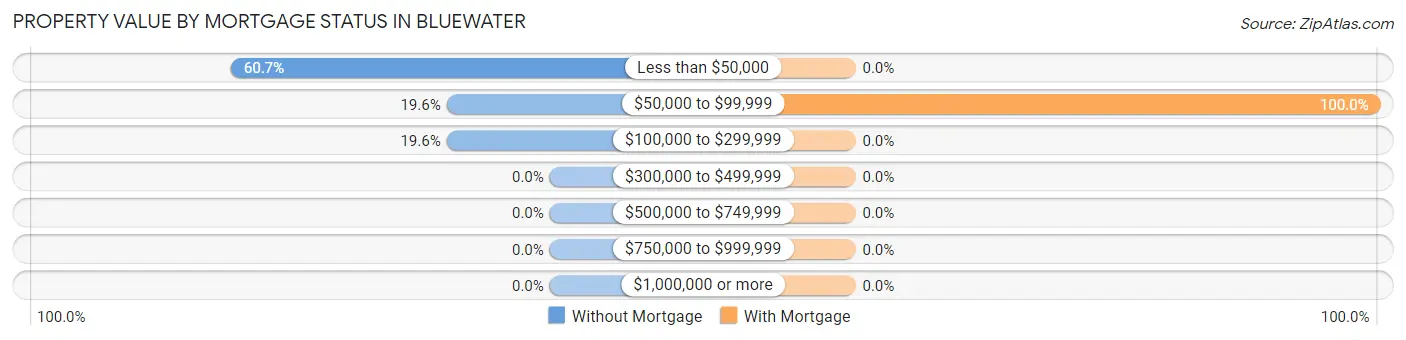
| Property Value | Without Mortgage | With Mortgage |
| Less than $50,000 | 34 (60.7%) | 0 (0.0%) |
| $50,000 to $99,999 | 11 (19.6%) | 8 (100.0%) |
| $100,000 to $299,999 | 11 (19.6%) | 0 (0.0%) |
| $300,000 to $499,999 | 0 (0.0%) | 0 (0.0%) |
| $500,000 to $749,999 | 0 (0.0%) | 0 (0.0%) |
| $750,000 to $999,999 | 0 (0.0%) | 0 (0.0%) |
| $1,000,000 or more | 0 (0.0%) | 0 (0.0%) |
| Total | 56 (100.0%) | 8 (100.0%) |
Household Income by Mortgage Status in Bluewater
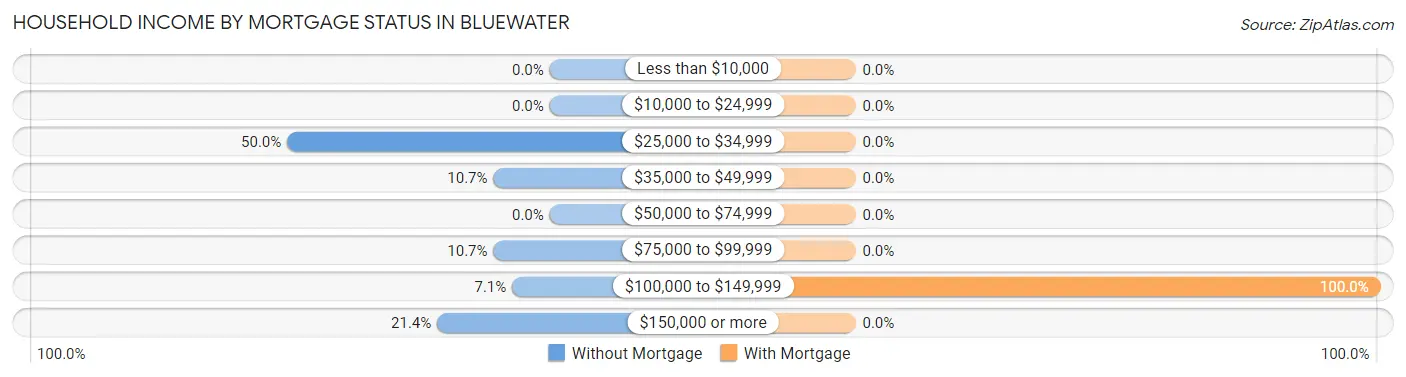
| Household Income | Without Mortgage | With Mortgage |
| Less than $10,000 | 0 (0.0%) | 0 (0.0%) |
| $10,000 to $24,999 | 0 (0.0%) | 0 (0.0%) |
| $25,000 to $34,999 | 28 (50.0%) | 0 (0.0%) |
| $35,000 to $49,999 | 6 (10.7%) | 0 (0.0%) |
| $50,000 to $74,999 | 0 (0.0%) | 0 (0.0%) |
| $75,000 to $99,999 | 6 (10.7%) | 0 (0.0%) |
| $100,000 to $149,999 | 4 (7.1%) | 8 (100.0%) |
| $150,000 or more | 12 (21.4%) | 0 (0.0%) |
| Total | 56 (100.0%) | 8 (100.0%) |
Property Value to Household Income Ratio in Bluewater
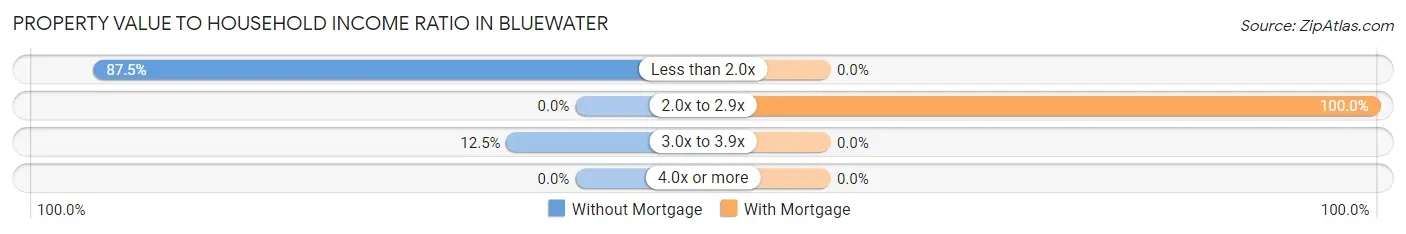
| Value-to-Income Ratio | Without Mortgage | With Mortgage |
| Less than 2.0x | 49 (87.5%) | 0 (0.0%) |
| 2.0x to 2.9x | 0 (0.0%) | 8 (100.0%) |
| 3.0x to 3.9x | 7 (12.5%) | 0 (0.0%) |
| 4.0x or more | 0 (0.0%) | 0 (0.0%) |
| Total | 56 (100.0%) | 8 (100.0%) |
Real Estate Taxes by Mortgage Status in Bluewater
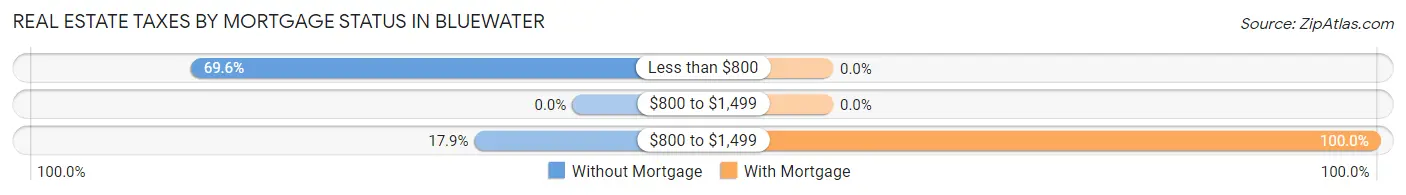
| Property Taxes | Without Mortgage | With Mortgage |
| Less than $800 | 39 (69.6%) | 0 (0.0%) |
| $800 to $1,499 | 0 (0.0%) | 0 (0.0%) |
| $800 to $1,499 | 10 (17.9%) | 8 (100.0%) |
| Total | 56 (100.0%) | 8 (100.0%) |
Health & Disability in Bluewater
Health Insurance Coverage by Age in Bluewater
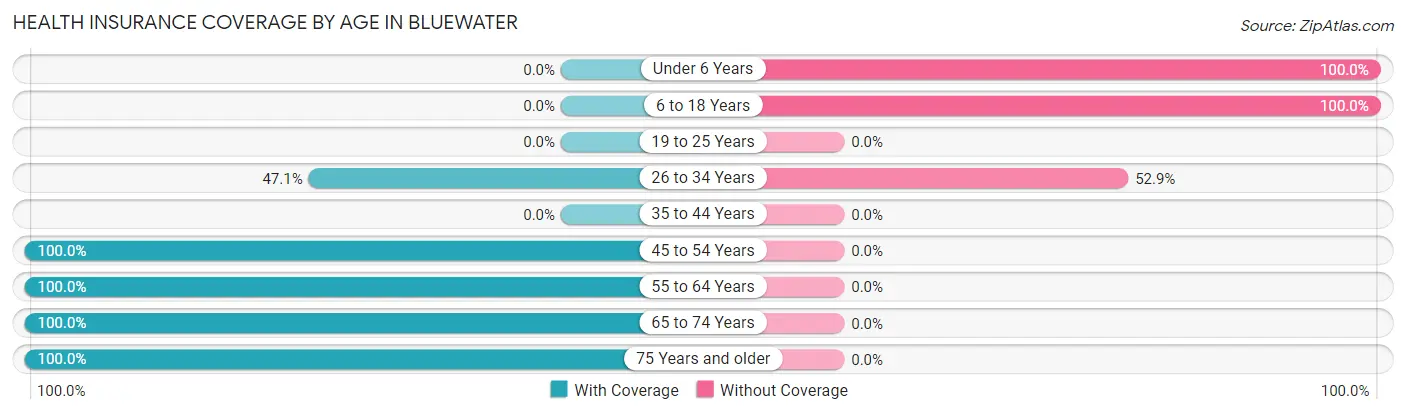
| Age Bracket | With Coverage | Without Coverage |
| Under 6 Years | 0 (0.0%) | 27 (100.0%) |
| 6 to 18 Years | 0 (0.0%) | 8 (100.0%) |
| 19 to 25 Years | 0 (0.0%) | 0 (0.0%) |
| 26 to 34 Years | 8 (47.1%) | 9 (52.9%) |
| 35 to 44 Years | 0 (0.0%) | 0 (0.0%) |
| 45 to 54 Years | 13 (100.0%) | 0 (0.0%) |
| 55 to 64 Years | 21 (100.0%) | 0 (0.0%) |
| 65 to 74 Years | 38 (100.0%) | 0 (0.0%) |
| 75 Years and older | 43 (100.0%) | 0 (0.0%) |
| Total | 123 (73.7%) | 44 (26.4%) |
Health Insurance Coverage by Citizenship Status in Bluewater
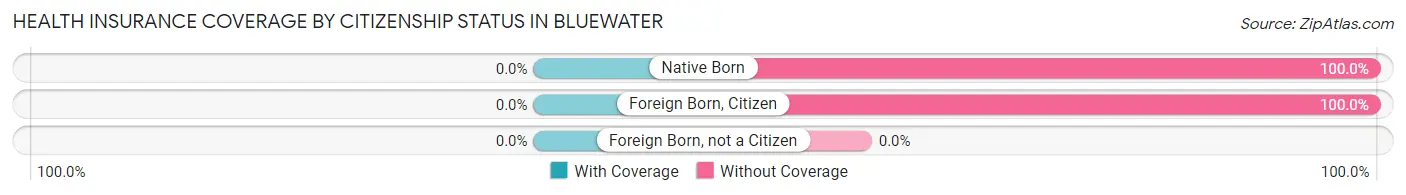
| Citizenship Status | With Coverage | Without Coverage |
| Native Born | 0 (0.0%) | 27 (100.0%) |
| Foreign Born, Citizen | 0 (0.0%) | 8 (100.0%) |
| Foreign Born, not a Citizen | 0 (0.0%) | 0 (0.0%) |
Health Insurance Coverage by Household Income in Bluewater
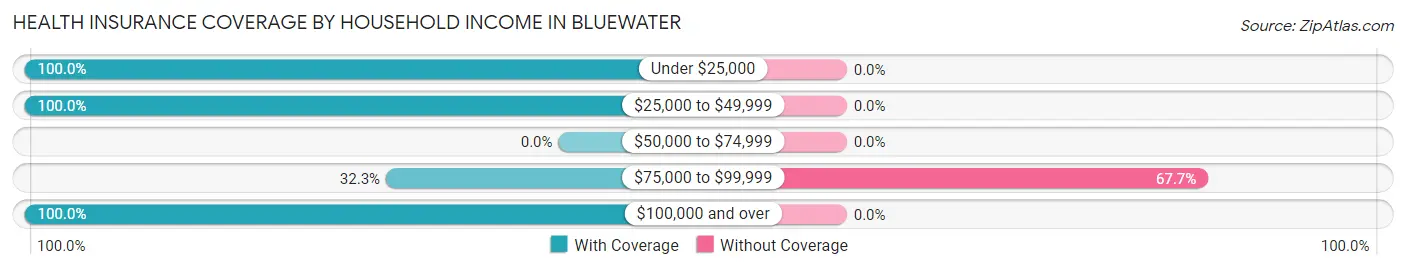
| Household Income | With Coverage | Without Coverage |
| Under $25,000 | 14 (100.0%) | 0 (0.0%) |
| $25,000 to $49,999 | 64 (100.0%) | 0 (0.0%) |
| $50,000 to $74,999 | 0 (0.0%) | 0 (0.0%) |
| $75,000 to $99,999 | 21 (32.3%) | 44 (67.7%) |
| $100,000 and over | 24 (100.0%) | 0 (0.0%) |
Public vs Private Health Insurance Coverage by Age in Bluewater
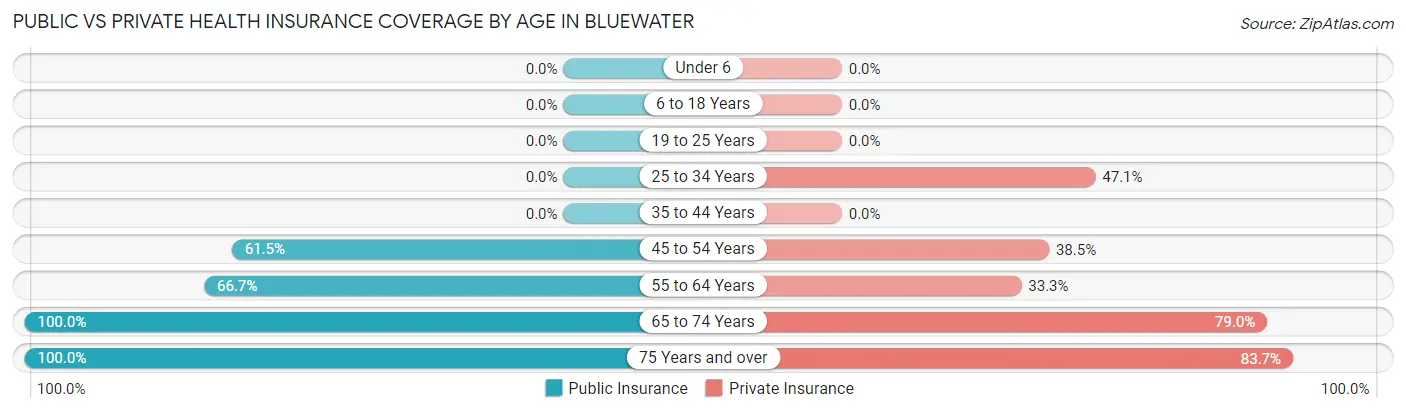
| Age Bracket | Public Insurance | Private Insurance |
| Under 6 | 0 (0.0%) | 0 (0.0%) |
| 6 to 18 Years | 0 (0.0%) | 0 (0.0%) |
| 19 to 25 Years | 0 (0.0%) | 0 (0.0%) |
| 25 to 34 Years | 0 (0.0%) | 8 (47.1%) |
| 35 to 44 Years | 0 (0.0%) | 0 (0.0%) |
| 45 to 54 Years | 8 (61.5%) | 5 (38.5%) |
| 55 to 64 Years | 14 (66.7%) | 7 (33.3%) |
| 65 to 74 Years | 38 (100.0%) | 30 (78.9%) |
| 75 Years and over | 43 (100.0%) | 36 (83.7%) |
| Total | 103 (61.7%) | 86 (51.5%) |
Disability Status by Sex by Age in Bluewater
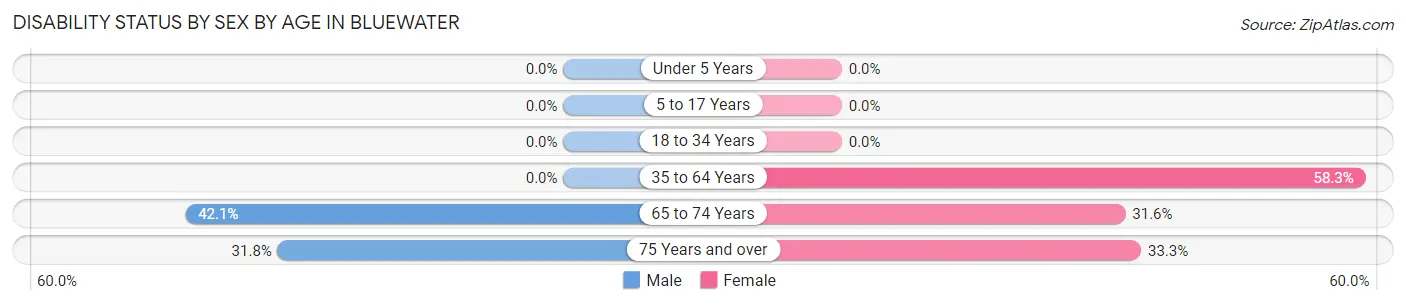
| Age Bracket | Male | Female |
| Under 5 Years | 0 (0.0%) | 0 (0.0%) |
| 5 to 17 Years | 0 (0.0%) | 0 (0.0%) |
| 18 to 34 Years | 0 (0.0%) | 0 (0.0%) |
| 35 to 64 Years | 0 (0.0%) | 7 (58.3%) |
| 65 to 74 Years | 8 (42.1%) | 6 (31.6%) |
| 75 Years and over | 7 (31.8%) | 7 (33.3%) |
Disability Class by Sex by Age in Bluewater
Disability Class: Hearing Difficulty
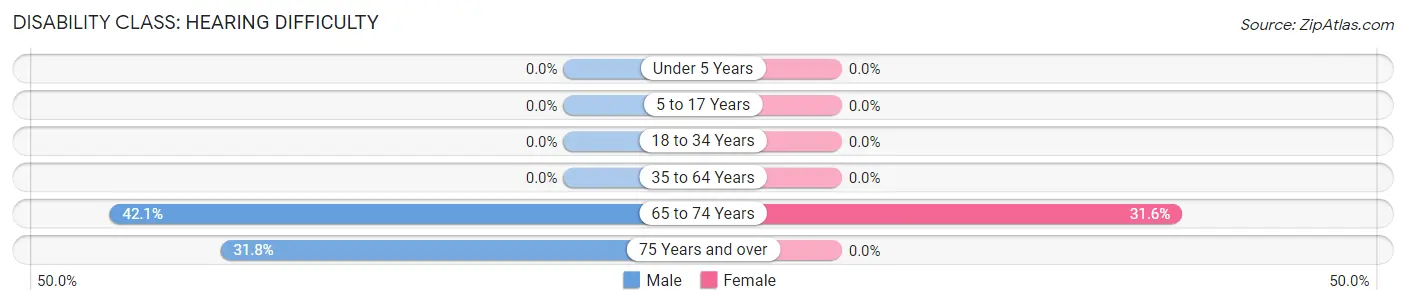
| Age Bracket | Male | Female |
| Under 5 Years | 0 (0.0%) | 0 (0.0%) |
| 5 to 17 Years | 0 (0.0%) | 0 (0.0%) |
| 18 to 34 Years | 0 (0.0%) | 0 (0.0%) |
| 35 to 64 Years | 0 (0.0%) | 0 (0.0%) |
| 65 to 74 Years | 8 (42.1%) | 6 (31.6%) |
| 75 Years and over | 7 (31.8%) | 0 (0.0%) |
Disability Class: Vision Difficulty
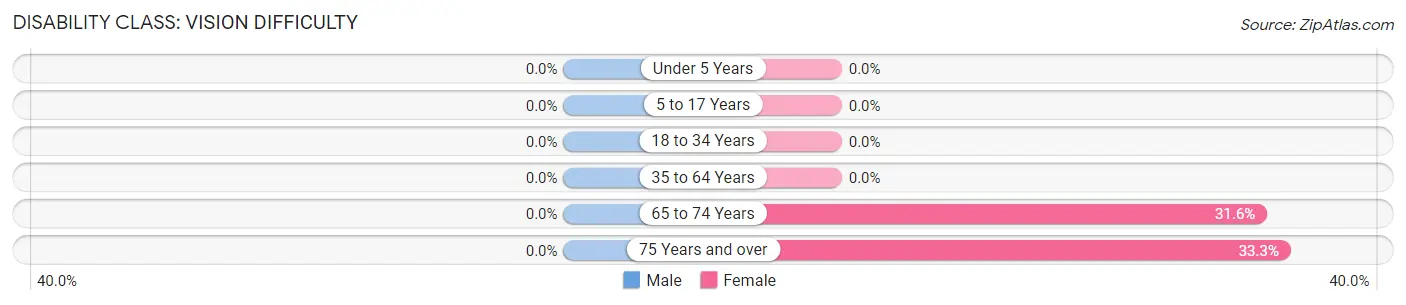
| Age Bracket | Male | Female |
| Under 5 Years | 0 (0.0%) | 0 (0.0%) |
| 5 to 17 Years | 0 (0.0%) | 0 (0.0%) |
| 18 to 34 Years | 0 (0.0%) | 0 (0.0%) |
| 35 to 64 Years | 0 (0.0%) | 0 (0.0%) |
| 65 to 74 Years | 0 (0.0%) | 6 (31.6%) |
| 75 Years and over | 0 (0.0%) | 7 (33.3%) |
Disability Class: Cognitive Difficulty
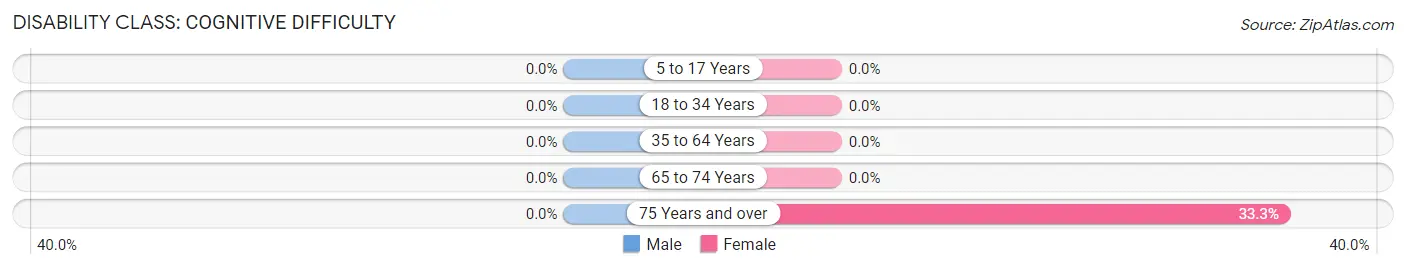
| Age Bracket | Male | Female |
| 5 to 17 Years | 0 (0.0%) | 0 (0.0%) |
| 18 to 34 Years | 0 (0.0%) | 0 (0.0%) |
| 35 to 64 Years | 0 (0.0%) | 0 (0.0%) |
| 65 to 74 Years | 0 (0.0%) | 0 (0.0%) |
| 75 Years and over | 0 (0.0%) | 7 (33.3%) |
Disability Class: Ambulatory Difficulty
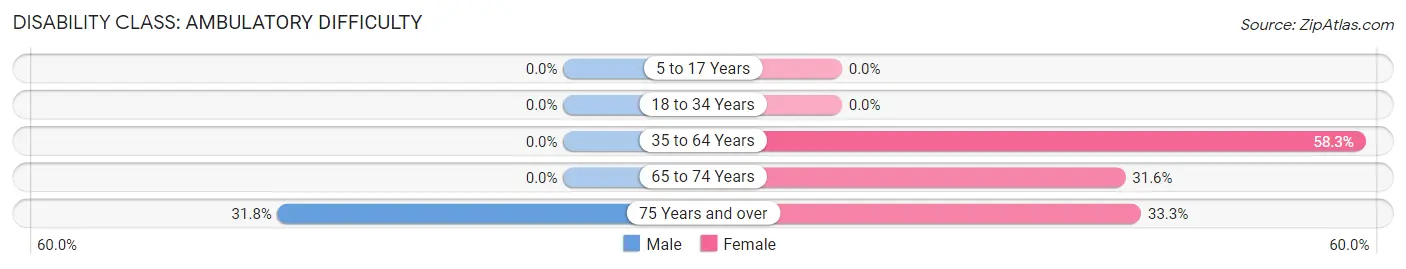
| Age Bracket | Male | Female |
| 5 to 17 Years | 0 (0.0%) | 0 (0.0%) |
| 18 to 34 Years | 0 (0.0%) | 0 (0.0%) |
| 35 to 64 Years | 0 (0.0%) | 7 (58.3%) |
| 65 to 74 Years | 0 (0.0%) | 6 (31.6%) |
| 75 Years and over | 7 (31.8%) | 7 (33.3%) |
Disability Class: Self-Care Difficulty
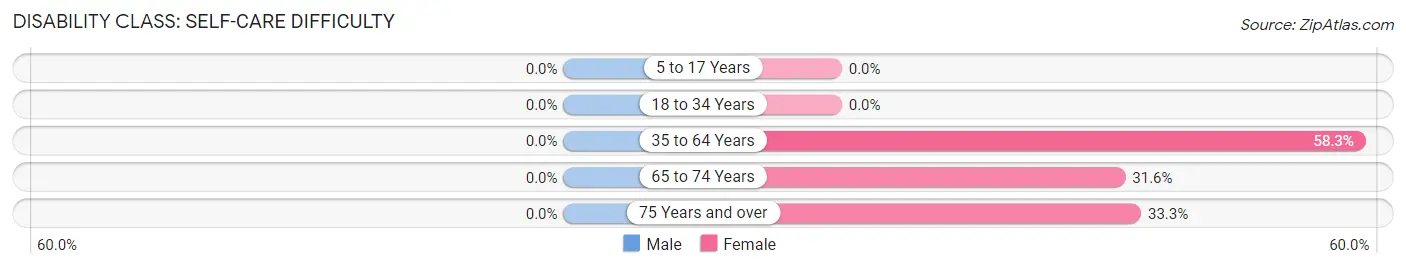
| Age Bracket | Male | Female |
| 5 to 17 Years | 0 (0.0%) | 0 (0.0%) |
| 18 to 34 Years | 0 (0.0%) | 0 (0.0%) |
| 35 to 64 Years | 0 (0.0%) | 7 (58.3%) |
| 65 to 74 Years | 0 (0.0%) | 6 (31.6%) |
| 75 Years and over | 0 (0.0%) | 7 (33.3%) |
Technology Access in Bluewater
Computing Device Access in Bluewater
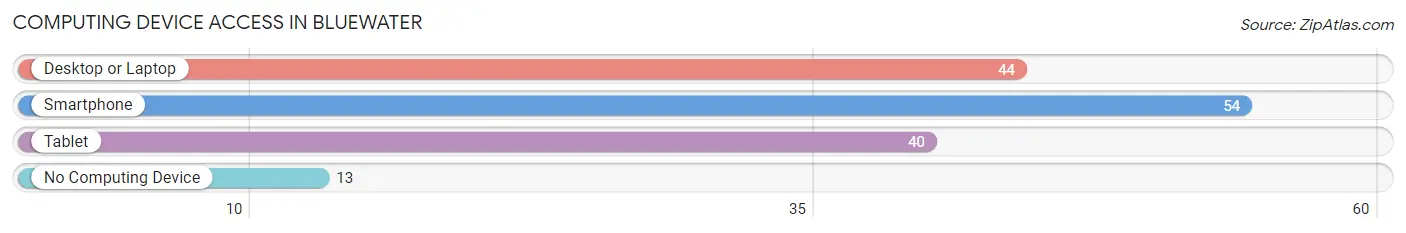
| Device Type | # Households | % Households |
| Desktop or Laptop | 44 | 62.0% |
| Smartphone | 54 | 76.1% |
| Tablet | 40 | 56.3% |
| No Computing Device | 13 | 18.3% |
| Total | 71 | 100.0% |
Internet Access in Bluewater
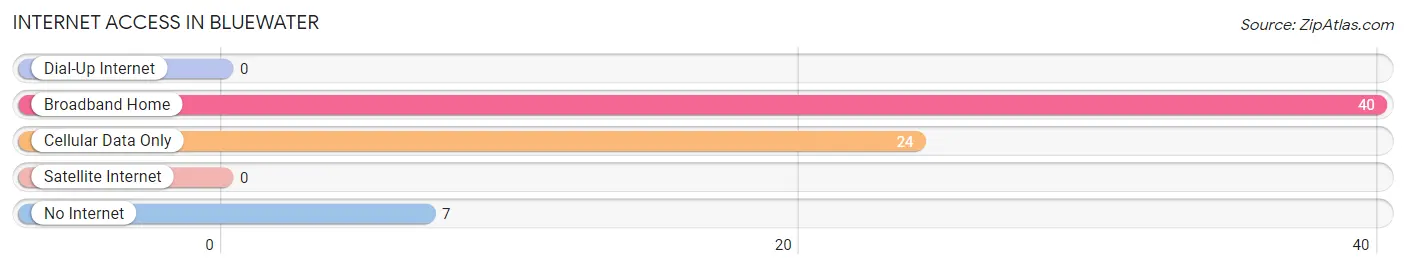
| Internet Type | # Households | % Households |
| Dial-Up Internet | 0 | 0.0% |
| Broadband Home | 40 | 56.3% |
| Cellular Data Only | 24 | 33.8% |
| Satellite Internet | 0 | 0.0% |
| No Internet | 7 | 9.9% |
| Total | 71 | 100.0% |
Bluewater Summary
Introduction
Bluewater is a small unincorporated community located in Imperial County, California. It is situated in the southeastern corner of the state, near the Mexican border. The community is located in the Sonoran Desert, and is surrounded by the Chocolate Mountains and the Salton Sea. Bluewater has a population of approximately 1,000 people, and is known for its rural lifestyle and agricultural production.
History
The area that is now Bluewater was originally inhabited by the Cahuilla Indians. The first Europeans to settle in the area were Spanish missionaries, who established a mission in the area in the late 1700s. The mission was abandoned in the early 1800s, and the area was largely uninhabited until the late 1800s.
In the late 1800s, the area was settled by ranchers and farmers, who established small farms and ranches in the area. The area was known as "Bluewater" due to the presence of a nearby lake, which was said to have a blue hue. The area was largely agricultural, and the main crops grown were cotton, alfalfa, and wheat.
In the early 1900s, the area was connected to the rest of the state by the Southern Pacific Railroad. This allowed for the development of a small town, which was incorporated in 1912. The town was named Bluewater, and it quickly became a popular destination for tourists and vacationers.
Geography
Bluewater is located in the southeastern corner of California, near the Mexican border. It is situated in the Sonoran Desert, and is surrounded by the Chocolate Mountains and the Salton Sea. The area is mostly flat, with some rolling hills and mountains in the surrounding area. The climate is hot and dry, with temperatures ranging from the mid-90s in the summer to the mid-50s in the winter.
Economy
The economy of Bluewater is largely based on agriculture. The main crops grown in the area are cotton, alfalfa, and wheat. The area is also known for its production of dates, oranges, and other citrus fruits. In addition, the area is home to a number of small businesses, including restaurants, stores, and other services.
Demographics
As of the 2010 census, the population of Bluewater was 1,000 people. The racial makeup of the town was 75.2% White, 0.7% African American, 0.3% Native American, 0.2% Asian, 0.1% Pacific Islander, and 22.5% from other races. The median household income was $30,000, and the median age was 33 years.
Conclusion
Bluewater is a small unincorporated community located in Imperial County, California. It is situated in the Sonoran Desert, and is surrounded by the Chocolate Mountains and the Salton Sea. The economy of Bluewater is largely based on agriculture, and the area is known for its production of cotton, alfalfa, and wheat. The population of Bluewater is approximately 1,000 people, and the racial makeup of the town is 75.2% White, 0.7% African American, 0.3% Native American, 0.2% Asian, 0.1% Pacific Islander, and 22.5% from other races. Bluewater is known for its rural lifestyle and agricultural production, and is a popular destination for tourists and vacationers.
Common Questions
What is Per Capita Income in Bluewater?
Per Capita income in Bluewater is $33,901.
What is the Median Family Income in Bluewater?
Median Family Income in Bluewater is $33,750.
What is Income or Wage Gap in Bluewater?
Income or Wage Gap in Bluewater is 25.2%.
Women in Bluewater earn 74.8 cents for every dollar earned by a man.
What is Inequality or Gini Index in Bluewater?
Inequality or Gini Index in Bluewater is 0.43.
What is the Total Population of Bluewater?
Total Population of Bluewater is 167.
What is the Total Male Population of Bluewater?
Total Male Population of Bluewater is 98.
What is the Total Female Population of Bluewater?
Total Female Population of Bluewater is 69.
What is the Ratio of Males per 100 Females in Bluewater?
There are 142.03 Males per 100 Females in Bluewater.
What is the Ratio of Females per 100 Males in Bluewater?
There are 70.41 Females per 100 Males in Bluewater.
What is the Median Population Age in Bluewater?
Median Population Age in Bluewater is 61.6 Years.
What is the Average Family Size in Bluewater
Average Family Size in Bluewater is 2.8 People.
What is the Average Household Size in Bluewater
Average Household Size in Bluewater is 2.4 People.
How Large is the Labor Force in Bluewater?
There are 49 People in the Labor Forcein in Bluewater.
What is the Percentage of People in the Labor Force in Bluewater?
37.1% of People are in the Labor Force in Bluewater.
What is the Unemployment Rate in Bluewater?
Unemployment Rate in Bluewater is 14.3%.