Biola, CA Map & Demographics
Biola Map
Biola Overview
$13,998
PER CAPITA INCOME
$38,542
AVG FAMILY INCOME
$39,896
AVG HOUSEHOLD INCOME
64.3%
WAGE / INCOME GAP [ % ]
35.7¢/ $1
WAGE / INCOME GAP [ $ ]
0.49
INEQUALITY / GINI INDEX
1,335
TOTAL POPULATION
574
MALE POPULATION
761
FEMALE POPULATION
75.43
MALES / 100 FEMALES
132.58
FEMALES / 100 MALES
23.5
MEDIAN AGE
4.3
AVG FAMILY SIZE
4.2
AVG HOUSEHOLD SIZE
613
LABOR FORCE [ PEOPLE ]
68.6%
PERCENT IN LABOR FORCE
22.3%
UNEMPLOYMENT RATE
Biola Zip Codes
Biola Area Codes
Income in Biola
Income Overview in Biola
Per Capita Income in Biola is $13,998, while median incomes of families and households are $38,542 and $39,896 respectively.
| Characteristic | Number | Measure |
| Per Capita Income | 1,335 | $13,998 |
| Median Family Income | 302 | $38,542 |
| Mean Family Income | 302 | $52,708 |
| Median Household Income | 315 | $39,896 |
| Mean Household Income | 315 | $55,713 |
| Income Deficit | 302 | $0 |
| Wage / Income Gap (%) | 1,335 | 64.27% |
| Wage / Income Gap ($) | 1,335 | 35.73¢ per $1 |
| Gini / Inequality Index | 1,335 | 0.49 |
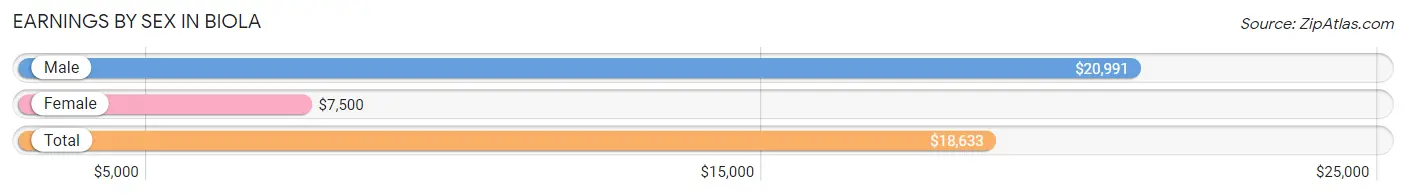
Earnings by Sex in Biola
Average Earnings in Biola are $18,633, $20,991 for men and $7,500 for women, a difference of 64.3%.
| Sex | Number | Average Earnings |
| Male | 281 (45.1%) | $20,991 |
| Female | 342 (54.9%) | $7,500 |
| Total | 623 (100.0%) | $18,633 |
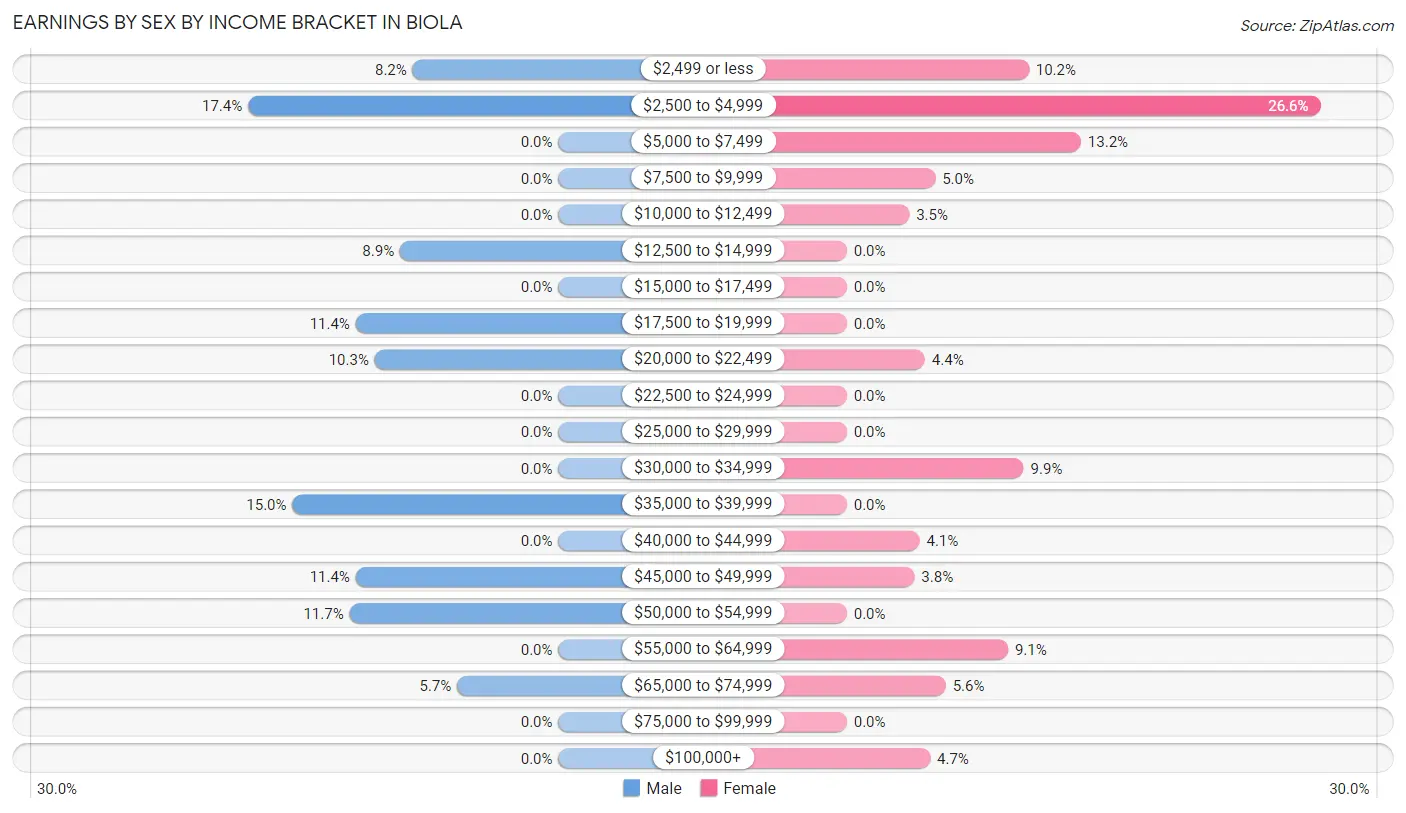
Earnings by Sex by Income Bracket in Biola
The most common earnings brackets in Biola are $2,500 to $4,999 for men (49 | 17.4%) and $2,500 to $4,999 for women (91 | 26.6%).
| Income | Male | Female |
| $2,499 or less | 23 (8.2%) | 35 (10.2%) |
| $2,500 to $4,999 | 49 (17.4%) | 91 (26.6%) |
| $5,000 to $7,499 | 0 (0.0%) | 45 (13.2%) |
| $7,500 to $9,999 | 0 (0.0%) | 17 (5.0%) |
| $10,000 to $12,499 | 0 (0.0%) | 12 (3.5%) |
| $12,500 to $14,999 | 25 (8.9%) | 0 (0.0%) |
| $15,000 to $17,499 | 0 (0.0%) | 0 (0.0%) |
| $17,500 to $19,999 | 32 (11.4%) | 0 (0.0%) |
| $20,000 to $22,499 | 29 (10.3%) | 15 (4.4%) |
| $22,500 to $24,999 | 0 (0.0%) | 0 (0.0%) |
| $25,000 to $29,999 | 0 (0.0%) | 0 (0.0%) |
| $30,000 to $34,999 | 0 (0.0%) | 34 (9.9%) |
| $35,000 to $39,999 | 42 (14.9%) | 0 (0.0%) |
| $40,000 to $44,999 | 0 (0.0%) | 14 (4.1%) |
| $45,000 to $49,999 | 32 (11.4%) | 13 (3.8%) |
| $50,000 to $54,999 | 33 (11.7%) | 0 (0.0%) |
| $55,000 to $64,999 | 0 (0.0%) | 31 (9.1%) |
| $65,000 to $74,999 | 16 (5.7%) | 19 (5.6%) |
| $75,000 to $99,999 | 0 (0.0%) | 0 (0.0%) |
| $100,000+ | 0 (0.0%) | 16 (4.7%) |
| Total | 281 (100.0%) | 342 (100.0%) |
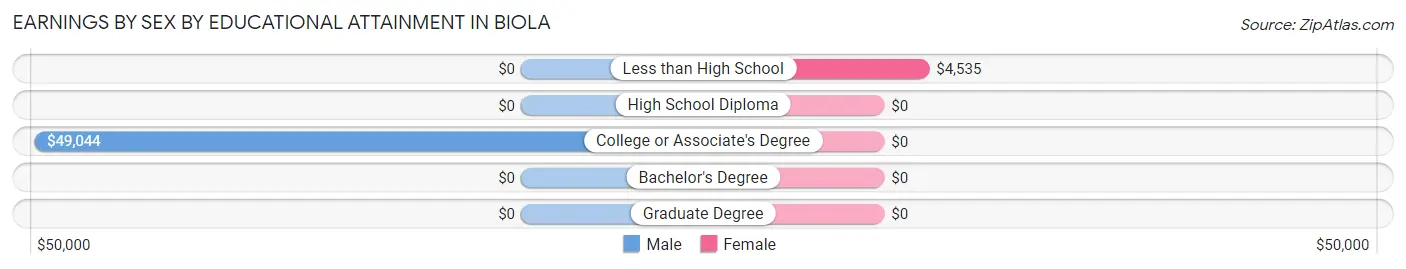
Earnings by Sex by Educational Attainment in Biola
| Educational Attainment | Male Income | Female Income |
| Less than High School | - | - |
| High School Diploma | - | - |
| College or Associate's Degree | $49,044 | $0 |
| Bachelor's Degree | - | - |
| Graduate Degree | - | - |
| Total | - | - |
Family Income in Biola
Family Income Brackets in Biola
According to the Biola family income data, there are 76 families falling into the $10,000 to $14,999 income range, which is the most common income bracket and makes up 25.2% of all families.
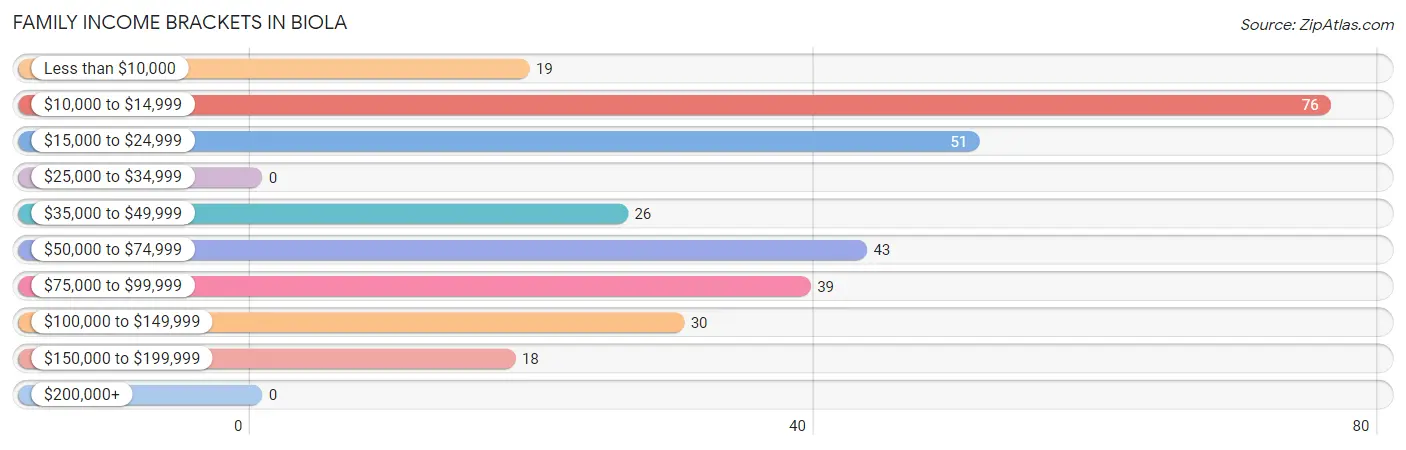
| Income Bracket | # Families | % Families |
| Less than $10,000 | 19 | 6.3% |
| $10,000 to $14,999 | 76 | 25.2% |
| $15,000 to $24,999 | 51 | 16.9% |
| $25,000 to $34,999 | 0 | 0.0% |
| $35,000 to $49,999 | 26 | 8.6% |
| $50,000 to $74,999 | 43 | 14.2% |
| $75,000 to $99,999 | 39 | 12.9% |
| $100,000 to $149,999 | 30 | 9.9% |
| $150,000 to $199,999 | 18 | 6.0% |
| $200,000+ | 0 | 0.0% |
Family Income by Famaliy Size in Biola
3-person families (67 | 22.2%) account for the highest median family income in Biola with $16,576 per family, while 3-person families (67 | 22.2%) have the highest median income of $5,525 per family member.
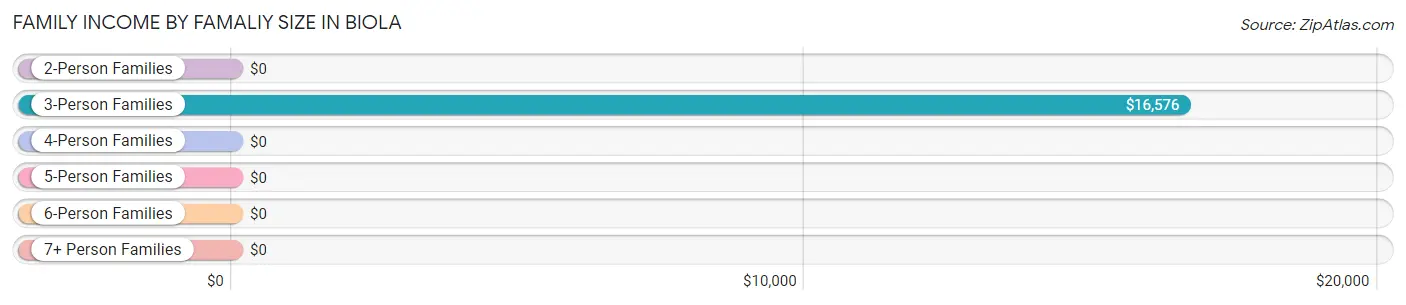
| Income Bracket | # Families | Median Income |
| 2-Person Families | 62 (20.5%) | $0 |
| 3-Person Families | 67 (22.2%) | $16,576 |
| 4-Person Families | 45 (14.9%) | $0 |
| 5-Person Families | 55 (18.2%) | $0 |
| 6-Person Families | 41 (13.6%) | $0 |
| 7+ Person Families | 32 (10.6%) | $0 |
| Total | 302 (100.0%) | $38,542 |
Family Income by Number of Earners in Biola
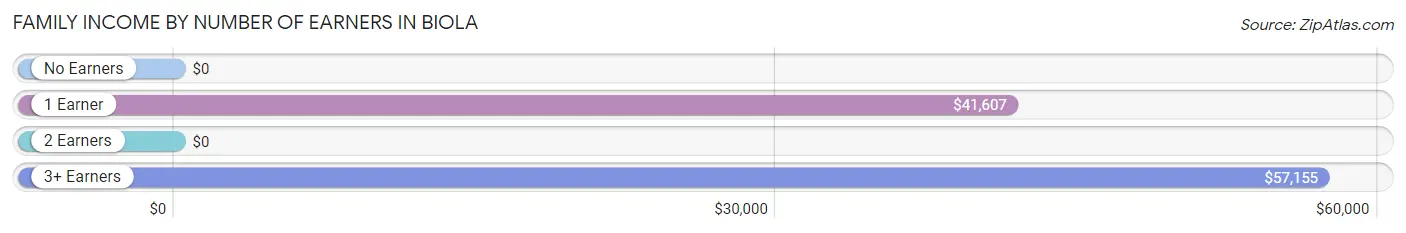
| Number of Earners | # Families | Median Income |
| No Earners | 67 (22.2%) | $0 |
| 1 Earner | 70 (23.2%) | $41,607 |
| 2 Earners | 41 (13.6%) | $0 |
| 3+ Earners | 124 (41.1%) | $57,155 |
| Total | 302 (100.0%) | $38,542 |
Household Income in Biola
Household Income Brackets in Biola
With 76 households falling in the category, the $10,000 to $14,999 income range is the most frequent in Biola, accounting for 24.1% of all households.
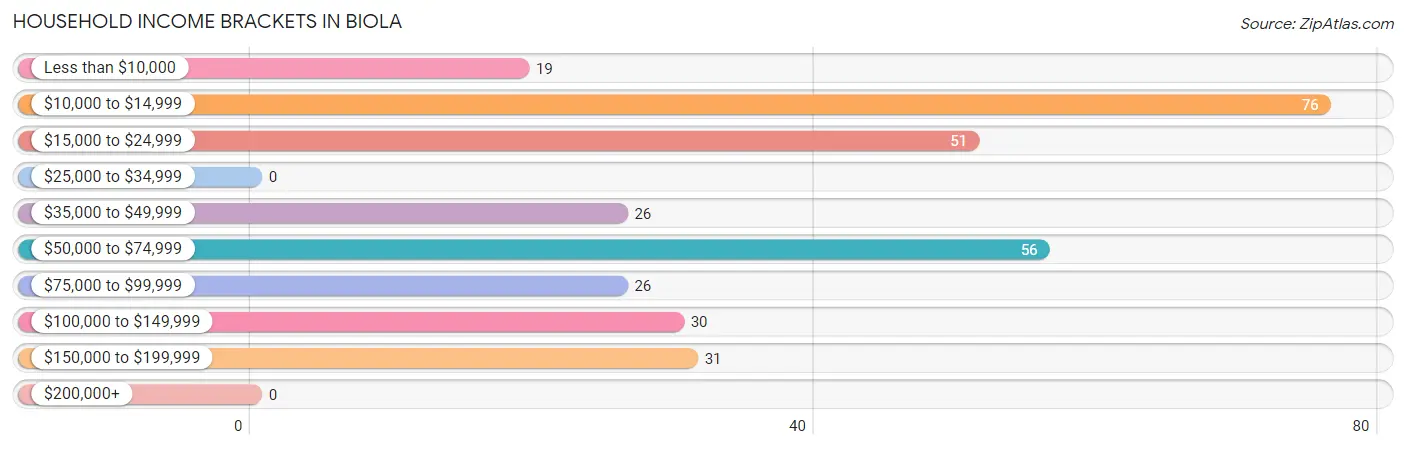
| Income Bracket | # Households | % Households |
| Less than $10,000 | 19 | 6.0% |
| $10,000 to $14,999 | 76 | 24.1% |
| $15,000 to $24,999 | 51 | 16.2% |
| $25,000 to $34,999 | 0 | 0.0% |
| $35,000 to $49,999 | 26 | 8.3% |
| $50,000 to $74,999 | 56 | 17.8% |
| $75,000 to $99,999 | 26 | 8.3% |
| $100,000 to $149,999 | 30 | 9.5% |
| $150,000 to $199,999 | 31 | 9.8% |
| $200,000+ | 0 | 0.0% |
Household Income by Householder Age in Biola
The median household income in Biola is $39,896, with the highest median household income of $56,379 found in the 45 to 64 years age bracket for the primary householder. A total of 78 households (24.8%) fall into this category. Meanwhile, the 15 to 24 years age bracket for the primary householder has the lowest median household income of $0, with 27 households (8.6%) in this group.
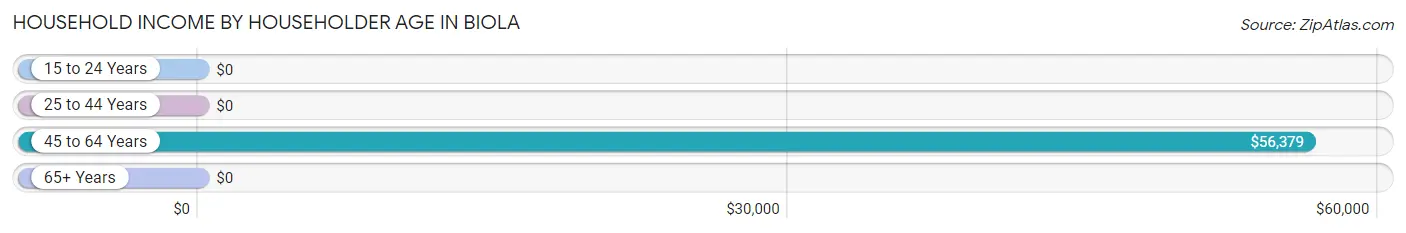
| Income Bracket | # Households | Median Income |
| 15 to 24 Years | 27 (8.6%) | $0 |
| 25 to 44 Years | 149 (47.3%) | $0 |
| 45 to 64 Years | 78 (24.8%) | $56,379 |
| 65+ Years | 61 (19.4%) | $0 |
| Total | 315 (100.0%) | $39,896 |
Poverty in Biola
Income Below Poverty by Sex and Age in Biola
With 36.4% poverty level for males and 45.9% for females among the residents of Biola, 35 to 44 year old males and 5 year old females are the most vulnerable to poverty, with 30 males (100.0%) and 15 females (100.0%) in their respective age groups living below the poverty level.
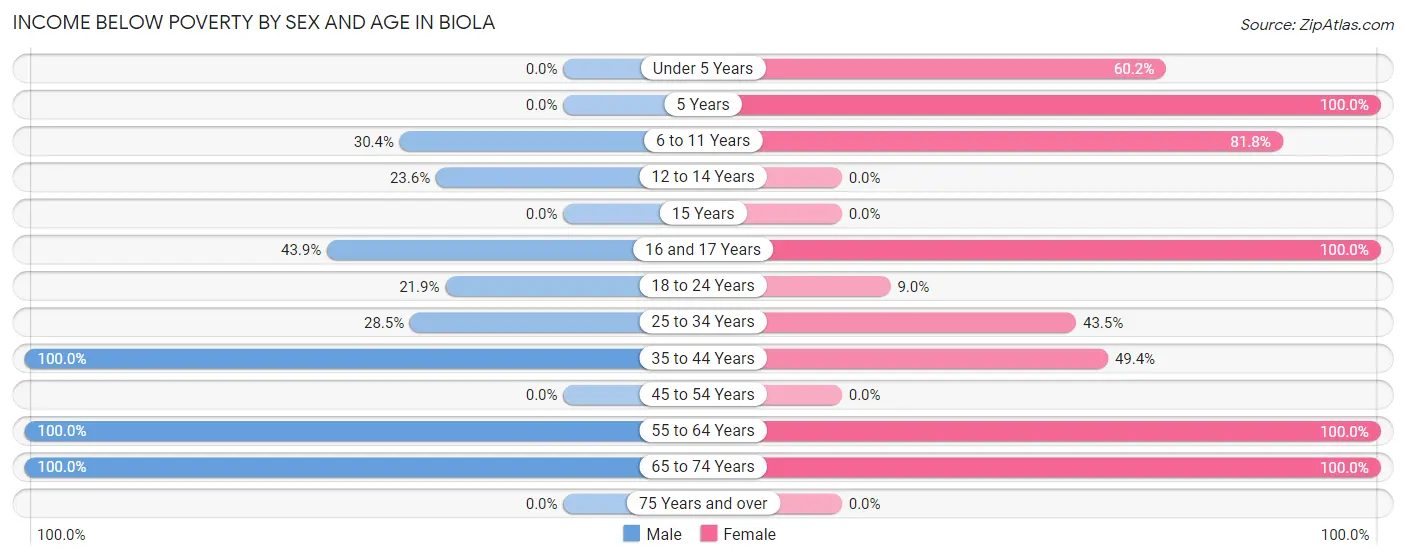
| Age Bracket | Male | Female |
| Under 5 Years | 0 (0.0%) | 65 (60.2%) |
| 5 Years | 0 (0.0%) | 15 (100.0%) |
| 6 to 11 Years | 17 (30.4%) | 81 (81.8%) |
| 12 to 14 Years | 13 (23.6%) | 0 (0.0%) |
| 15 Years | 0 (0.0%) | 0 (0.0%) |
| 16 and 17 Years | 25 (43.9%) | 14 (100.0%) |
| 18 to 24 Years | 16 (21.9%) | 14 (9.0%) |
| 25 to 34 Years | 37 (28.5%) | 50 (43.5%) |
| 35 to 44 Years | 30 (100.0%) | 41 (49.4%) |
| 45 to 54 Years | 0 (0.0%) | 0 (0.0%) |
| 55 to 64 Years | 23 (100.0%) | 21 (100.0%) |
| 65 to 74 Years | 48 (100.0%) | 48 (100.0%) |
| 75 Years and over | 0 (0.0%) | 0 (0.0%) |
| Total | 209 (36.4%) | 349 (45.9%) |
Income Above Poverty by Sex and Age in Biola
According to the poverty statistics in Biola, males aged under 5 years and females aged 12 to 14 years are the age groups that are most secure financially, with 100.0% of males and 100.0% of females in these age groups living above the poverty line.
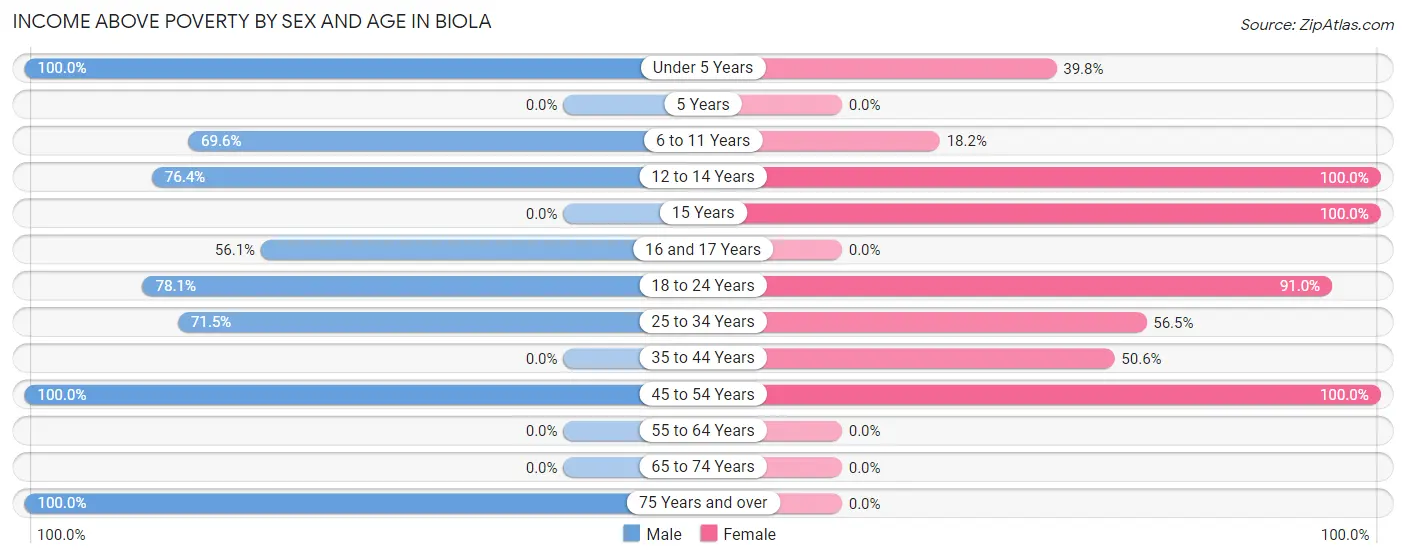
| Age Bracket | Male | Female |
| Under 5 Years | 46 (100.0%) | 43 (39.8%) |
| 5 Years | 0 (0.0%) | 0 (0.0%) |
| 6 to 11 Years | 39 (69.6%) | 18 (18.2%) |
| 12 to 14 Years | 42 (76.4%) | 30 (100.0%) |
| 15 Years | 0 (0.0%) | 32 (100.0%) |
| 16 and 17 Years | 32 (56.1%) | 0 (0.0%) |
| 18 to 24 Years | 57 (78.1%) | 141 (91.0%) |
| 25 to 34 Years | 93 (71.5%) | 65 (56.5%) |
| 35 to 44 Years | 0 (0.0%) | 42 (50.6%) |
| 45 to 54 Years | 43 (100.0%) | 41 (100.0%) |
| 55 to 64 Years | 0 (0.0%) | 0 (0.0%) |
| 65 to 74 Years | 0 (0.0%) | 0 (0.0%) |
| 75 Years and over | 13 (100.0%) | 0 (0.0%) |
| Total | 365 (63.6%) | 412 (54.1%) |
Income Below Poverty Among Married-Couple Families in Biola
The poverty statistics for married-couple families in Biola show that 58.3% or 112 of the total 192 families live below the poverty line. Families with no children have the highest poverty rate of 70.5%, comprising of 62 families. On the other hand, families with 3 or 4 children have the lowest poverty rate of 30.8%, which includes 12 families.
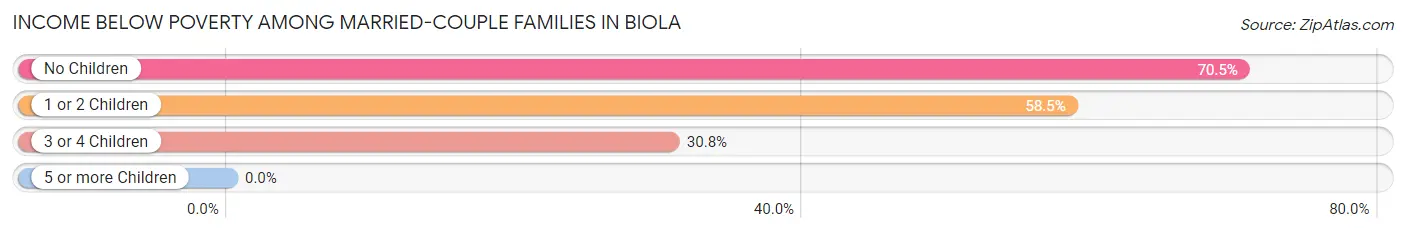
| Children | Above Poverty | Below Poverty |
| No Children | 26 (29.5%) | 62 (70.5%) |
| 1 or 2 Children | 27 (41.5%) | 38 (58.5%) |
| 3 or 4 Children | 27 (69.2%) | 12 (30.8%) |
| 5 or more Children | 0 (0.0%) | 0 (0.0%) |
| Total | 80 (41.7%) | 112 (58.3%) |
Income Below Poverty Among Single-Parent Households in Biola
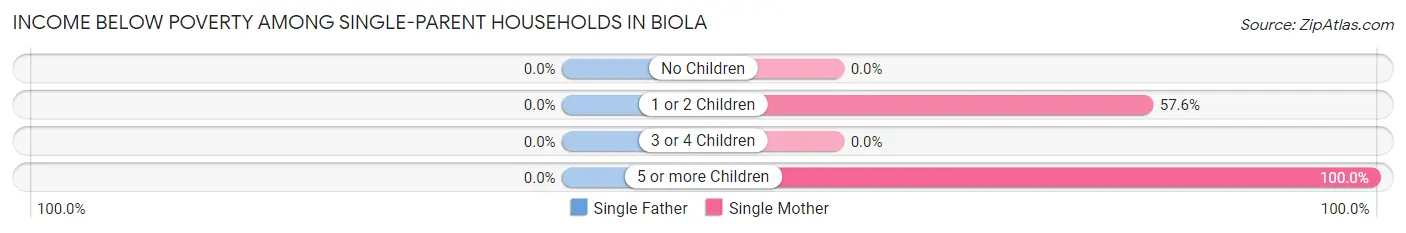
| Children | Single Father | Single Mother |
| No Children | 0 (0.0%) | 0 (0.0%) |
| 1 or 2 Children | 0 (0.0%) | 19 (57.6%) |
| 3 or 4 Children | 0 (0.0%) | 0 (0.0%) |
| 5 or more Children | 0 (0.0%) | 14 (100.0%) |
| Total | 0 (0.0%) | 33 (35.9%) |
Income Below Poverty Among Married-Couple vs Single-Parent Households in Biola
The poverty data for Biola shows that 112 of the married-couple family households (58.3%) and 33 of the single-parent households (30.0%) are living below the poverty level. Within the married-couple family households, those with no children have the highest poverty rate, with 62 households (70.5%) falling below the poverty line. Among the single-parent households, those with 5 or more children have the highest poverty rate, with 14 household (100.0%) living below poverty.
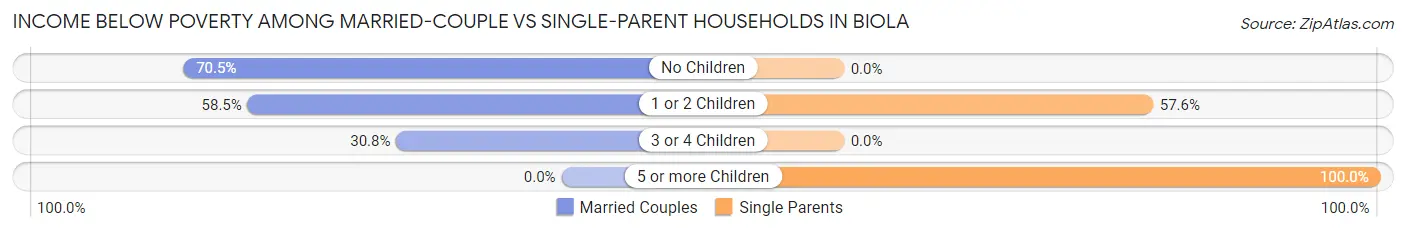
| Children | Married-Couple Families | Single-Parent Households |
| No Children | 62 (70.5%) | 0 (0.0%) |
| 1 or 2 Children | 38 (58.5%) | 19 (57.6%) |
| 3 or 4 Children | 12 (30.8%) | 0 (0.0%) |
| 5 or more Children | 0 (0.0%) | 14 (100.0%) |
| Total | 112 (58.3%) | 33 (30.0%) |
Race in Biola
The most populous races in Biola are Hispanic or Latino (1,146 | 85.8%), White / Caucasian (572 | 42.8%), and Two or more Races (337 | 25.2%).
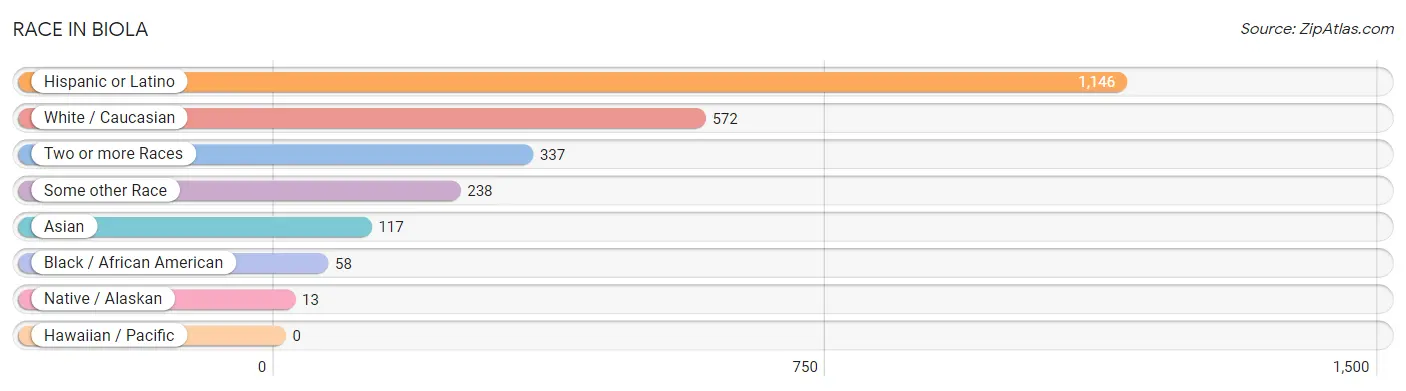
| Race | # Population | % Population |
| Asian | 117 | 8.8% |
| Black / African American | 58 | 4.3% |
| Hawaiian / Pacific | 0 | 0.0% |
| Hispanic or Latino | 1,146 | 85.8% |
| Native / Alaskan | 13 | 1.0% |
| White / Caucasian | 572 | 42.8% |
| Two or more Races | 337 | 25.2% |
| Some other Race | 238 | 17.8% |
| Total | 1,335 | 100.0% |
Ancestry in Biola
The most populous ancestries reported in Biola are Mexican (1,120 | 83.9%), Bangladeshi (117 | 8.8%), Central American (26 | 1.9%), Salvadoran (26 | 1.9%), and Navajo (13 | 1.0%), together accounting for 97.5% of all Biola residents.
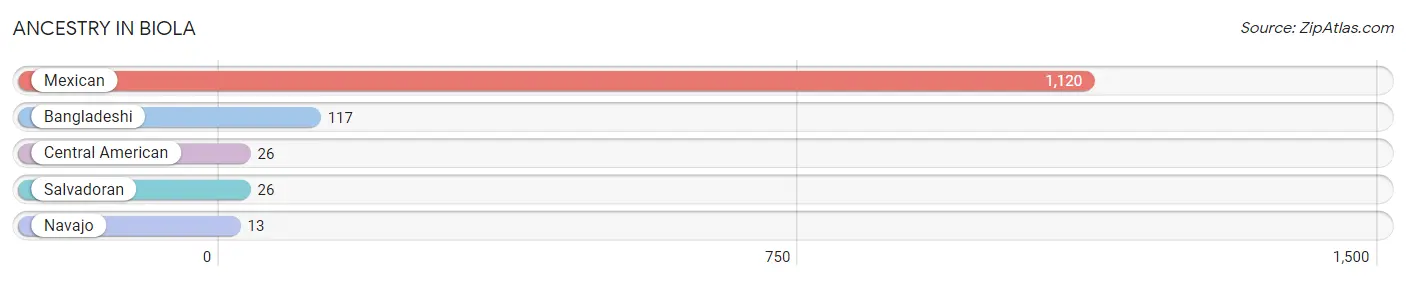
| Ancestry | # Population | % Population |
| Bangladeshi | 117 | 8.8% |
| Central American | 26 | 1.9% |
| Mexican | 1,120 | 83.9% |
| Navajo | 13 | 1.0% |
| Salvadoran | 26 | 1.9% | View All 5 Rows |
Immigrants in Biola
The most numerous immigrant groups reported in Biola came from Central America (280 | 21.0%), Latin America (280 | 21.0%), Mexico (267 | 20.0%), and El Salvador (13 | 1.0%), together accounting for 62.9% of all Biola residents.
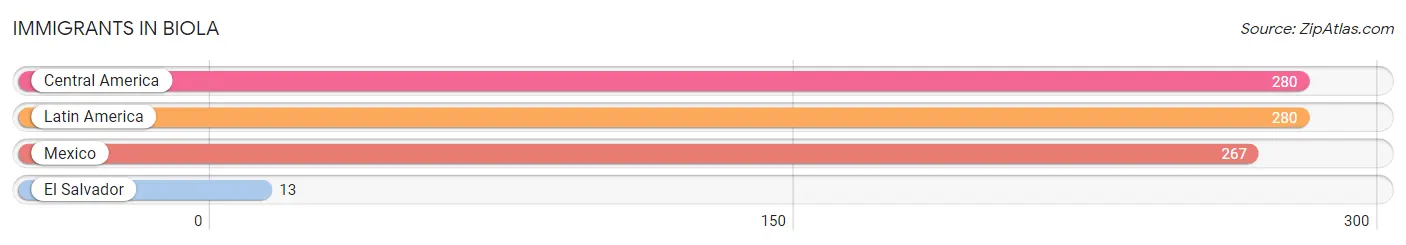
| Immigration Origin | # Population | % Population |
| Central America | 280 | 21.0% |
| El Salvador | 13 | 1.0% |
| Latin America | 280 | 21.0% |
| Mexico | 267 | 20.0% | View All 4 Rows |
Sex and Age in Biola
Sex and Age in Biola
The most populous age groups in Biola are 15 to 19 Years (84 | 14.6%) for men and Under 5 Years (108 | 14.2%) for women.
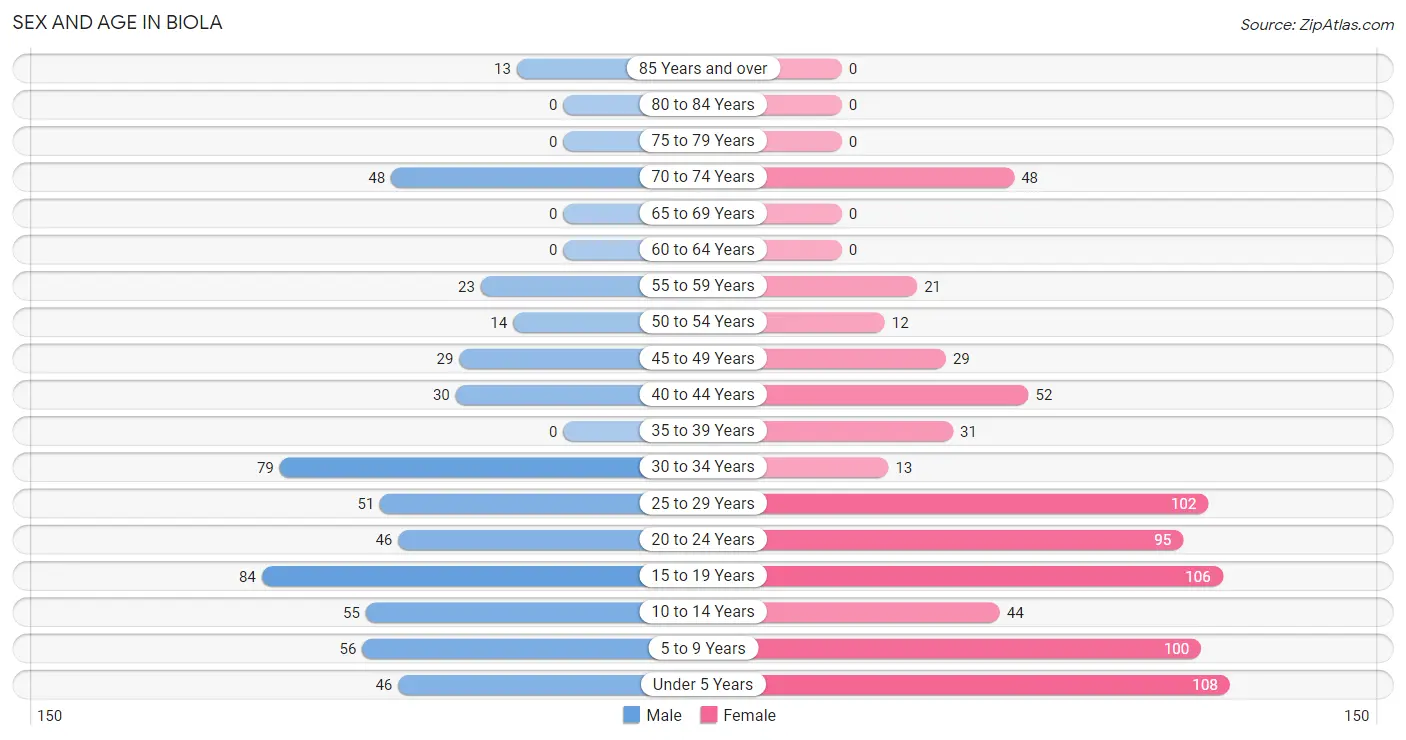
| Age Bracket | Male | Female |
| Under 5 Years | 46 (8.0%) | 108 (14.2%) |
| 5 to 9 Years | 56 (9.8%) | 100 (13.1%) |
| 10 to 14 Years | 55 (9.6%) | 44 (5.8%) |
| 15 to 19 Years | 84 (14.6%) | 106 (13.9%) |
| 20 to 24 Years | 46 (8.0%) | 95 (12.5%) |
| 25 to 29 Years | 51 (8.9%) | 102 (13.4%) |
| 30 to 34 Years | 79 (13.8%) | 13 (1.7%) |
| 35 to 39 Years | 0 (0.0%) | 31 (4.1%) |
| 40 to 44 Years | 30 (5.2%) | 52 (6.8%) |
| 45 to 49 Years | 29 (5.1%) | 29 (3.8%) |
| 50 to 54 Years | 14 (2.4%) | 12 (1.6%) |
| 55 to 59 Years | 23 (4.0%) | 21 (2.8%) |
| 60 to 64 Years | 0 (0.0%) | 0 (0.0%) |
| 65 to 69 Years | 0 (0.0%) | 0 (0.0%) |
| 70 to 74 Years | 48 (8.4%) | 48 (6.3%) |
| 75 to 79 Years | 0 (0.0%) | 0 (0.0%) |
| 80 to 84 Years | 0 (0.0%) | 0 (0.0%) |
| 85 Years and over | 13 (2.3%) | 0 (0.0%) |
| Total | 574 (100.0%) | 761 (100.0%) |
Families and Households in Biola
Median Family Size in Biola
The median family size in Biola is 4.32 persons per family, with single male/father families (18 | 6.0%) accounting for the largest median family size of 6.5 persons per family. On the other hand, married-couple families (192 | 63.6%) represent the smallest median family size with 3.87 persons per family.
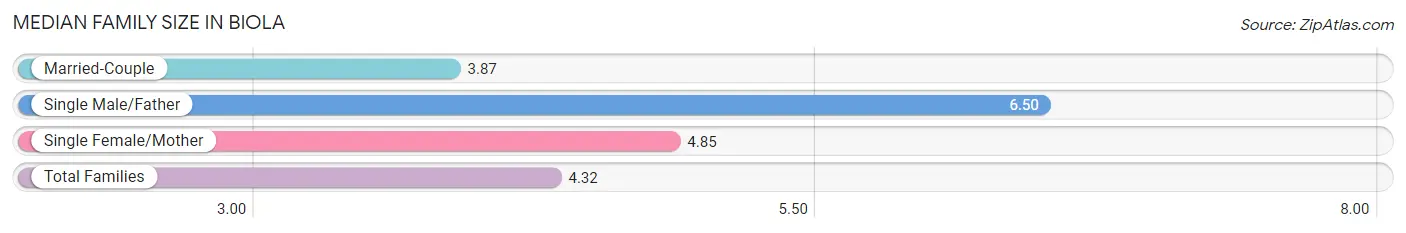
| Family Type | # Families | Family Size |
| Married-Couple | 192 (63.6%) | 3.87 |
| Single Male/Father | 18 (6.0%) | 6.50 |
| Single Female/Mother | 92 (30.5%) | 4.85 |
| Total Families | 302 (100.0%) | 4.32 |
Median Household Size in Biola
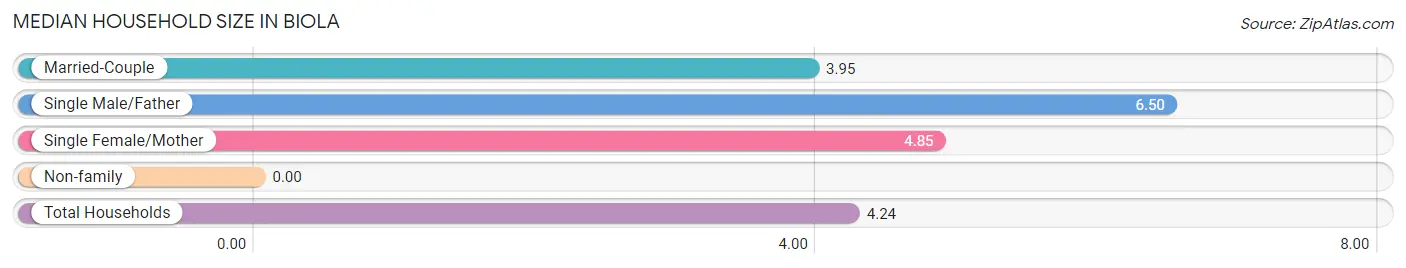
| Household Type | # Households | Household Size |
| Married-Couple | 192 (61.0%) | 3.95 |
| Single Male/Father | 18 (5.7%) | 6.50 |
| Single Female/Mother | 92 (29.2%) | 4.85 |
| Non-family | 13 (4.1%) | - |
| Total Households | 315 (100.0%) | 4.24 |
Household Size by Marriage Status in Biola
Out of a total of 315 households in Biola, 302 (95.9%) are family households, while 13 (4.1%) are nonfamily households. The most numerous type of family households are 3-person households, comprising 67, and the most common type of nonfamily households are 1-person households, comprising 13.
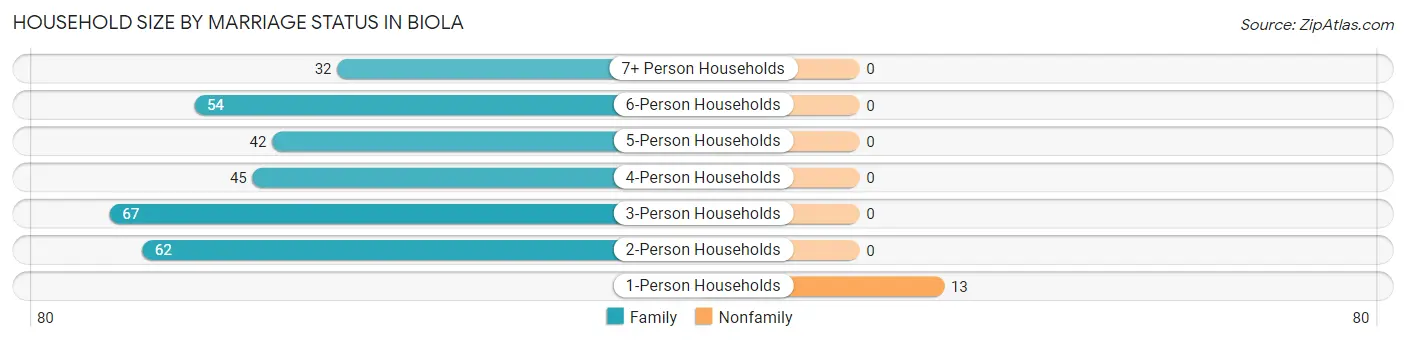
| Household Size | Family Households | Nonfamily Households |
| 1-Person Households | - | 13 (4.1%) |
| 2-Person Households | 62 (19.7%) | 0 (0.0%) |
| 3-Person Households | 67 (21.3%) | 0 (0.0%) |
| 4-Person Households | 45 (14.3%) | 0 (0.0%) |
| 5-Person Households | 42 (13.3%) | 0 (0.0%) |
| 6-Person Households | 54 (17.1%) | 0 (0.0%) |
| 7+ Person Households | 32 (10.2%) | 0 (0.0%) |
| Total | 302 (95.9%) | 13 (4.1%) |
Female Fertility in Biola
Fertility by Age in Biola
Average fertility rate in Biola is 133.0 births per 1,000 women. Women in the age bracket of 20 to 34 years have the highest fertility rate with 200.0 births per 1,000 women. Women in the age bracket of 20 to 34 years acount for 73.7% of all women with births.
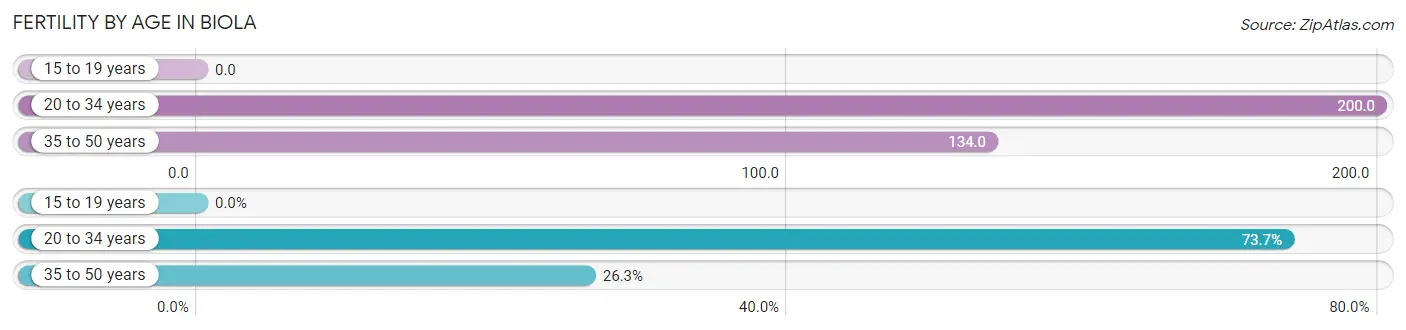
| Age Bracket | Women with Births | Births / 1,000 Women |
| 15 to 19 years | 0 (0.0%) | 0.0 |
| 20 to 34 years | 42 (73.7%) | 200.0 |
| 35 to 50 years | 15 (26.3%) | 134.0 |
| Total | 57 (100.0%) | 133.0 |
Fertility by Age by Marriage Status in Biola
75.4% of women with births (57) in Biola are married. The highest percentage of unmarried women with births falls into 20 to 34 years age bracket with 33.3% of them unmarried at the time of birth, while the lowest percentage of unmarried women with births belong to 35 to 50 years age bracket with 0.0% of them unmarried.
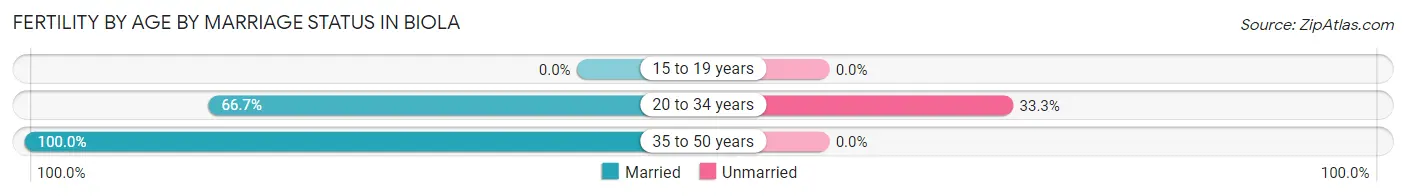
| Age Bracket | Married | Unmarried |
| 15 to 19 years | 0 (0.0%) | 0 (0.0%) |
| 20 to 34 years | 28 (66.7%) | 14 (33.3%) |
| 35 to 50 years | 15 (100.0%) | 0 (0.0%) |
| Total | 43 (75.4%) | 14 (24.6%) |
Fertility by Education in Biola
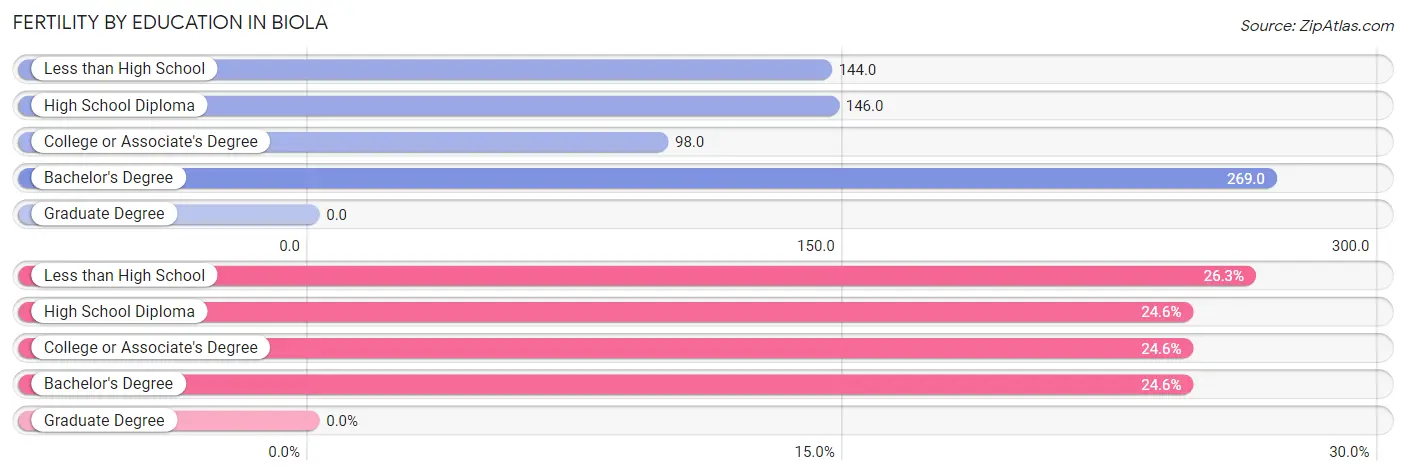
| Educational Attainment | Women with Births | Births / 1,000 Women |
| Less than High School | 15 (26.3%) | 144.0 |
| High School Diploma | 14 (24.6%) | 146.0 |
| College or Associate's Degree | 14 (24.6%) | 98.0 |
| Bachelor's Degree | 14 (24.6%) | 269.0 |
| Graduate Degree | 0 (0.0%) | 0.0 |
| Total | 57 (100.0%) | 133.0 |
Fertility by Education by Marriage Status in Biola
24.6% of women with births in Biola are unmarried. Women with the educational attainment of less than high school are most likely to be married with 100.0% of them married at childbirth, while women with the educational attainment of bachelor's degree are least likely to be married with 100.0% of them unmarried at childbirth.
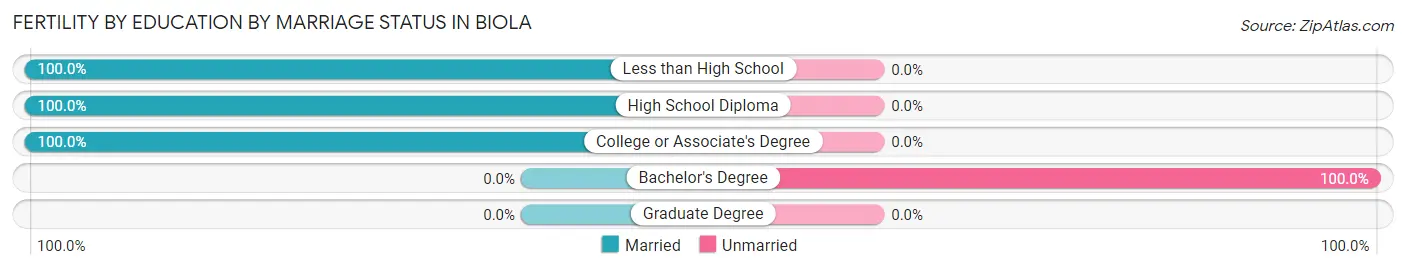
| Educational Attainment | Married | Unmarried |
| Less than High School | 15 (100.0%) | 0 (0.0%) |
| High School Diploma | 14 (100.0%) | 0 (0.0%) |
| College or Associate's Degree | 14 (100.0%) | 0 (0.0%) |
| Bachelor's Degree | 0 (0.0%) | 14 (100.0%) |
| Graduate Degree | 0 (0.0%) | 0 (0.0%) |
| Total | 43 (75.4%) | 14 (24.6%) |
Employment Characteristics in Biola
Employment by Class of Employer in Biola
Among the 463 employed individuals in Biola, private company employees (380 | 82.1%), local government employees (50 | 10.8%), and self-employed (not incorporated) (17 | 3.7%) make up the most common classes of employment.
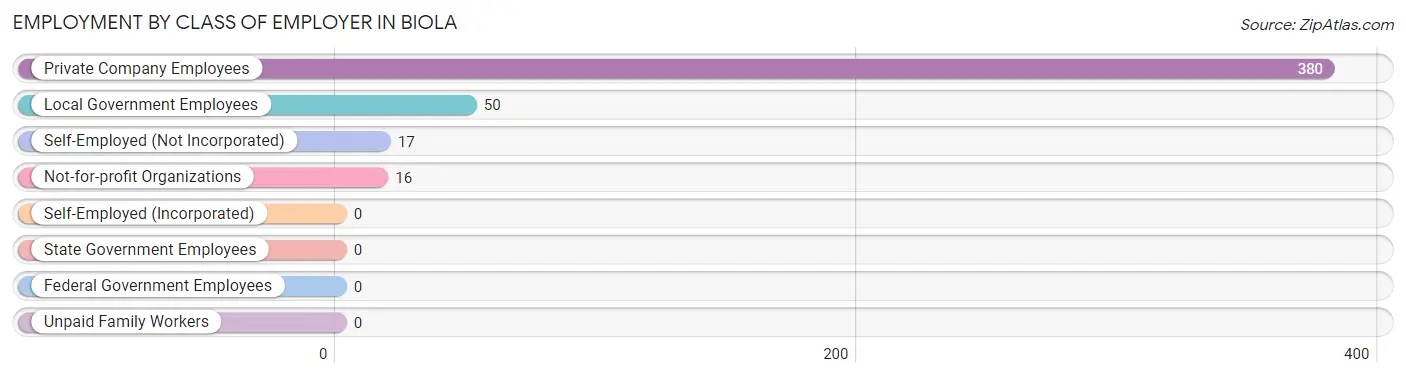
| Employer Class | # Employees | % Employees |
| Private Company Employees | 380 | 82.1% |
| Self-Employed (Incorporated) | 0 | 0.0% |
| Self-Employed (Not Incorporated) | 17 | 3.7% |
| Not-for-profit Organizations | 16 | 3.5% |
| Local Government Employees | 50 | 10.8% |
| State Government Employees | 0 | 0.0% |
| Federal Government Employees | 0 | 0.0% |
| Unpaid Family Workers | 0 | 0.0% |
| Total | 463 | 100.0% |
Employment Status by Age in Biola
According to the labor force statistics for Biola, out of the total population over 16 years of age (894), 68.6% or 613 individuals are in the labor force, with 22.3% or 137 of them unemployed. The age group with the highest labor force participation rate is 30 to 34 years, with 100.0% or 92 individuals in the labor force. Within the labor force, the 25 to 29 years age range has the highest percentage of unemployed individuals, with 58.4% or 73 of them being unemployed.
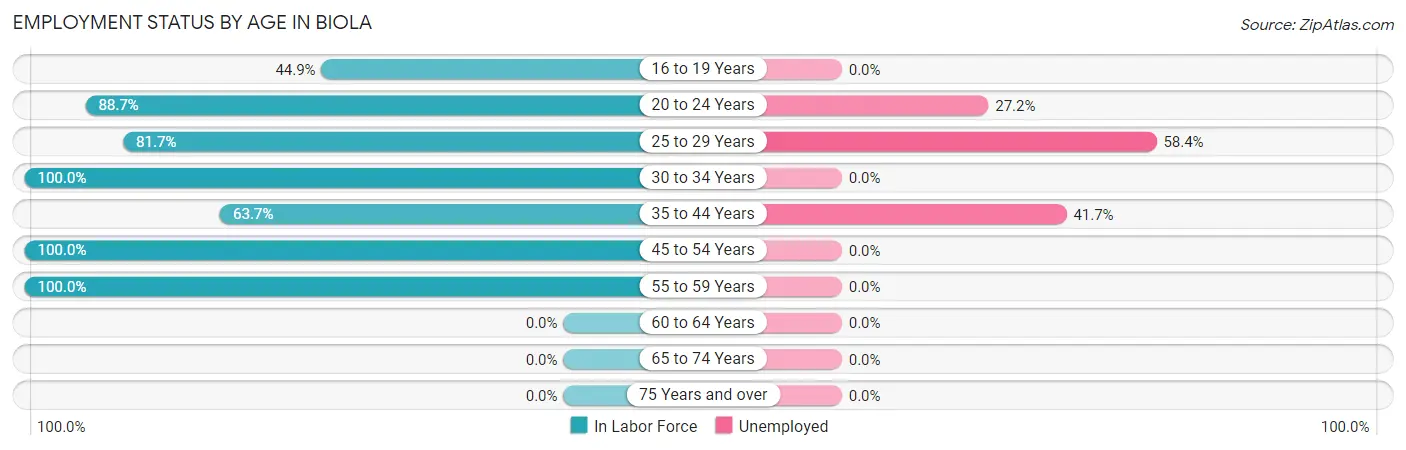
| Age Bracket | In Labor Force | Unemployed |
| 16 to 19 Years | 71 (44.9%) | 0 (0.0%) |
| 20 to 24 Years | 125 (88.7%) | 34 (27.2%) |
| 25 to 29 Years | 125 (81.7%) | 73 (58.4%) |
| 30 to 34 Years | 92 (100.0%) | 0 (0.0%) |
| 35 to 44 Years | 72 (63.7%) | 30 (41.7%) |
| 45 to 54 Years | 84 (100.0%) | 0 (0.0%) |
| 55 to 59 Years | 44 (100.0%) | 0 (0.0%) |
| 60 to 64 Years | 0 (0.0%) | 0 (0.0%) |
| 65 to 74 Years | 0 (0.0%) | 0 (0.0%) |
| 75 Years and over | 0 (0.0%) | 0 (0.0%) |
| Total | 613 (68.6%) | 137 (22.3%) |
Employment Status by Educational Attainment in Biola
According to labor force statistics for Biola, 85.8% of individuals (417) out of the total population between 25 and 64 years of age (486) are in the labor force, with 24.7% or 103 of them being unemployed. The group with the highest labor force participation rate are those with the educational attainment of bachelor's degree or higher, with 100.0% or 54 individuals in the labor force. Within the labor force, individuals with less than high school education have the highest percentage of unemployment, with 32.9% or 48 of them being unemployed.
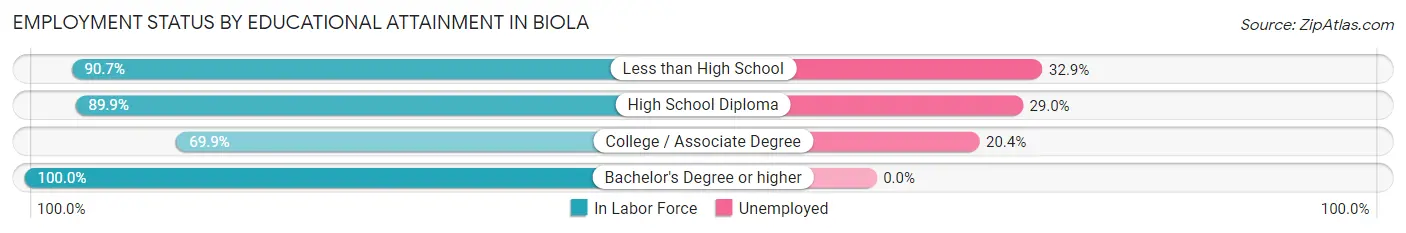
| Educational Attainment | In Labor Force | Unemployed |
| Less than High School | 146 (90.7%) | 53 (32.9%) |
| High School Diploma | 124 (89.9%) | 40 (29.0%) |
| College / Associate Degree | 93 (69.9%) | 27 (20.4%) |
| Bachelor's Degree or higher | 54 (100.0%) | 0 (0.0%) |
| Total | 417 (85.8%) | 120 (24.7%) |
Employment Occupations by Sex in Biola
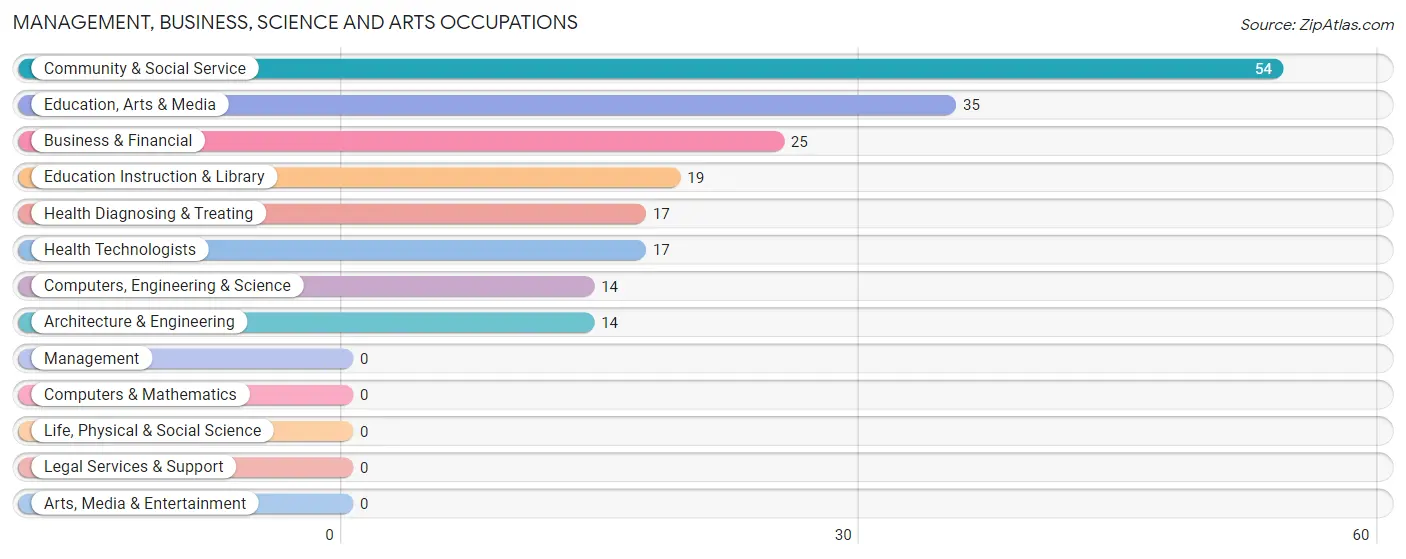
Management, Business, Science and Arts Occupations
The most common Management, Business, Science and Arts occupations in Biola are Community & Social Service (54 | 11.3%), Education, Arts & Media (35 | 7.3%), Business & Financial (25 | 5.2%), Education Instruction & Library (19 | 4.0%), and Health Diagnosing & Treating (17 | 3.6%).
Management, Business, Science and Arts Occupations by Sex
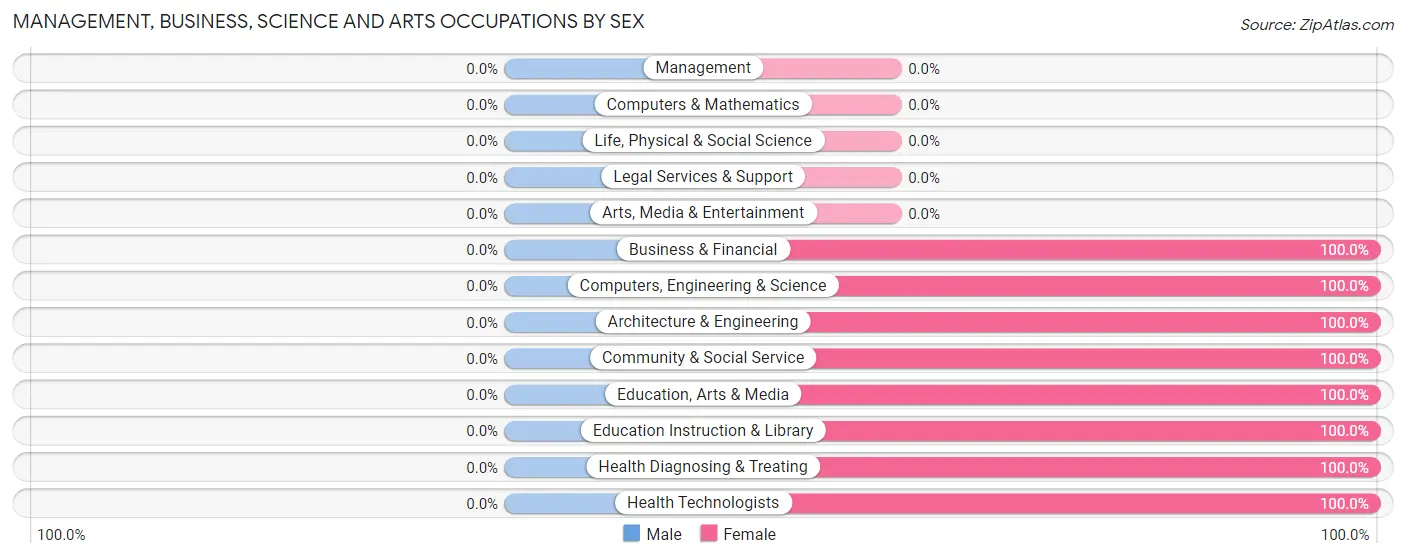
| Occupation | Male | Female |
| Management | 0 (0.0%) | 0 (0.0%) |
| Business & Financial | 0 (0.0%) | 25 (100.0%) |
| Computers, Engineering & Science | 0 (0.0%) | 14 (100.0%) |
| Computers & Mathematics | 0 (0.0%) | 0 (0.0%) |
| Architecture & Engineering | 0 (0.0%) | 14 (100.0%) |
| Life, Physical & Social Science | 0 (0.0%) | 0 (0.0%) |
| Community & Social Service | 0 (0.0%) | 54 (100.0%) |
| Education, Arts & Media | 0 (0.0%) | 35 (100.0%) |
| Legal Services & Support | 0 (0.0%) | 0 (0.0%) |
| Education Instruction & Library | 0 (0.0%) | 19 (100.0%) |
| Arts, Media & Entertainment | 0 (0.0%) | 0 (0.0%) |
| Health Diagnosing & Treating | 0 (0.0%) | 17 (100.0%) |
| Health Technologists | 0 (0.0%) | 17 (100.0%) |
| Total (Category) | 0 (0.0%) | 110 (100.0%) |
| Total (Overall) | 228 (47.9%) | 248 (52.1%) |
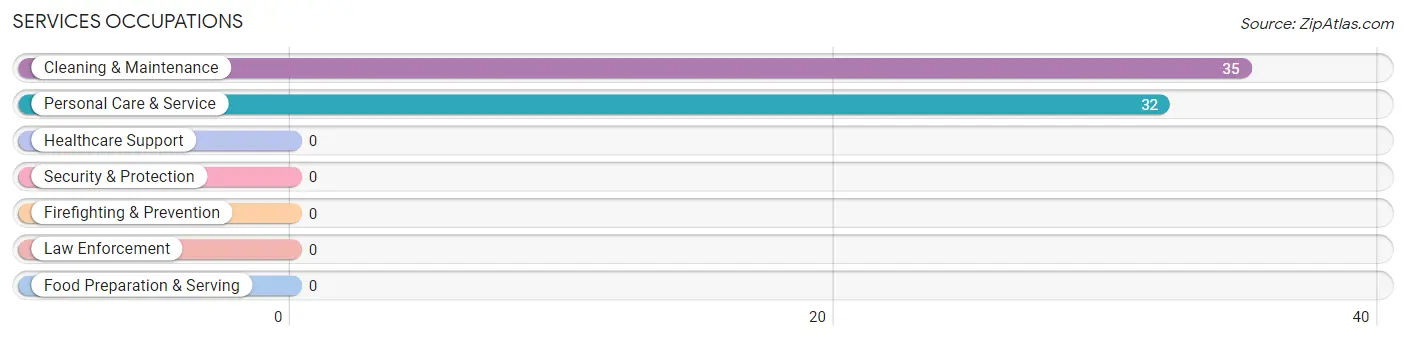
Services Occupations
The most common Services occupations in Biola are Cleaning & Maintenance (35 | 7.3%), and Personal Care & Service (32 | 6.7%).
Services Occupations by Sex
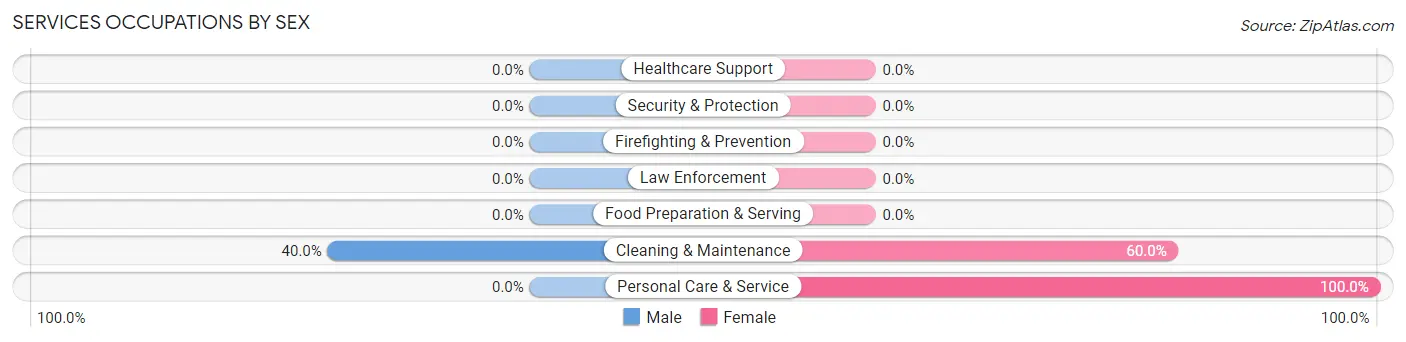
| Occupation | Male | Female |
| Healthcare Support | 0 (0.0%) | 0 (0.0%) |
| Security & Protection | 0 (0.0%) | 0 (0.0%) |
| Firefighting & Prevention | 0 (0.0%) | 0 (0.0%) |
| Law Enforcement | 0 (0.0%) | 0 (0.0%) |
| Food Preparation & Serving | 0 (0.0%) | 0 (0.0%) |
| Cleaning & Maintenance | 14 (40.0%) | 21 (60.0%) |
| Personal Care & Service | 0 (0.0%) | 32 (100.0%) |
| Total (Category) | 14 (20.9%) | 53 (79.1%) |
| Total (Overall) | 228 (47.9%) | 248 (52.1%) |
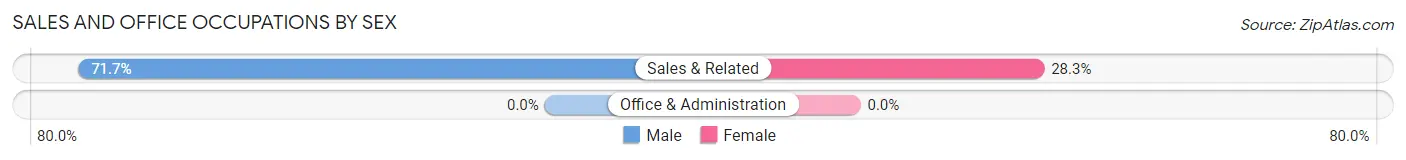
Sales and Office Occupations
The most common Sales and Office occupations in Biola are , and Sales & Related (46 | 9.7%).
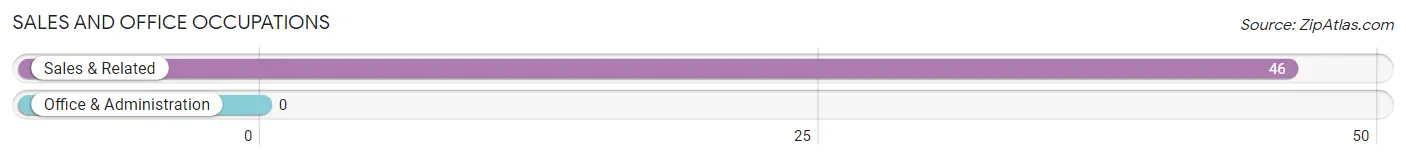
Sales and Office Occupations by Sex
| Occupation | Male | Female |
| Sales & Related | 33 (71.7%) | 13 (28.3%) |
| Office & Administration | 0 (0.0%) | 0 (0.0%) |
| Total (Category) | 33 (71.7%) | 13 (28.3%) |
| Total (Overall) | 228 (47.9%) | 248 (52.1%) |
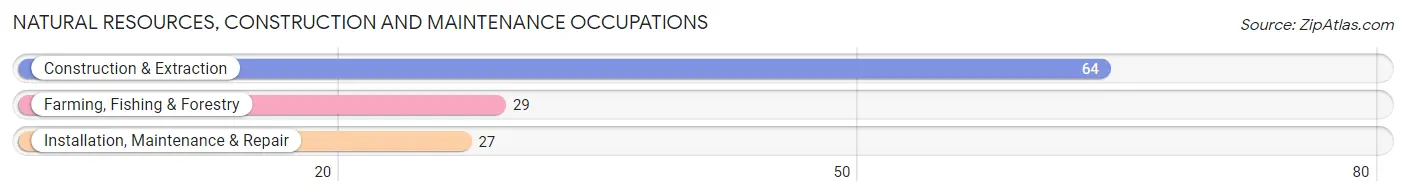
Natural Resources, Construction and Maintenance Occupations
The most common Natural Resources, Construction and Maintenance occupations in Biola are Construction & Extraction (64 | 13.5%), Farming, Fishing & Forestry (29 | 6.1%), and Installation, Maintenance & Repair (27 | 5.7%).
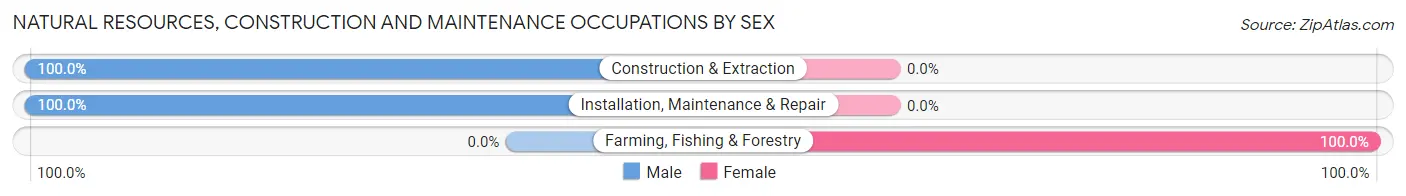
Natural Resources, Construction and Maintenance Occupations by Sex
| Occupation | Male | Female |
| Farming, Fishing & Forestry | 0 (0.0%) | 29 (100.0%) |
| Construction & Extraction | 64 (100.0%) | 0 (0.0%) |
| Installation, Maintenance & Repair | 27 (100.0%) | 0 (0.0%) |
| Total (Category) | 91 (75.8%) | 29 (24.2%) |
| Total (Overall) | 228 (47.9%) | 248 (52.1%) |
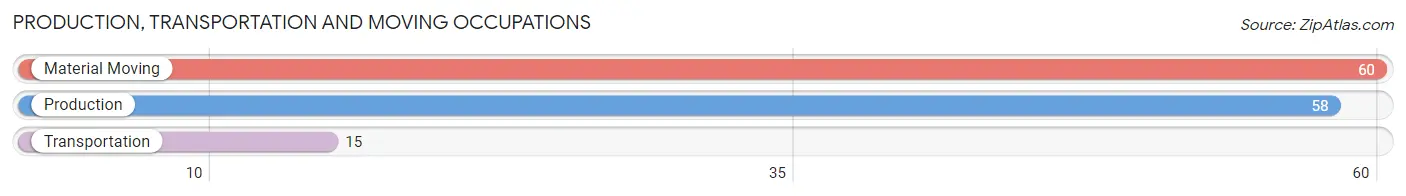
Production, Transportation and Moving Occupations
The most common Production, Transportation and Moving occupations in Biola are Material Moving (60 | 12.6%), Production (58 | 12.2%), and Transportation (15 | 3.2%).
Production, Transportation and Moving Occupations by Sex
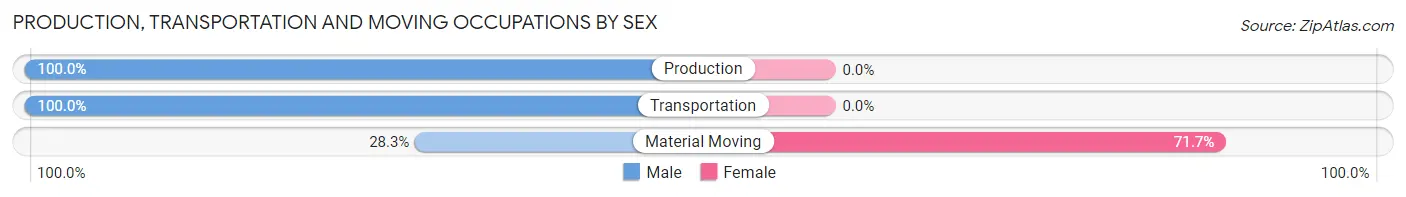
| Occupation | Male | Female |
| Production | 58 (100.0%) | 0 (0.0%) |
| Transportation | 15 (100.0%) | 0 (0.0%) |
| Material Moving | 17 (28.3%) | 43 (71.7%) |
| Total (Category) | 90 (67.7%) | 43 (32.3%) |
| Total (Overall) | 228 (47.9%) | 248 (52.1%) |
Employment Industries by Sex in Biola
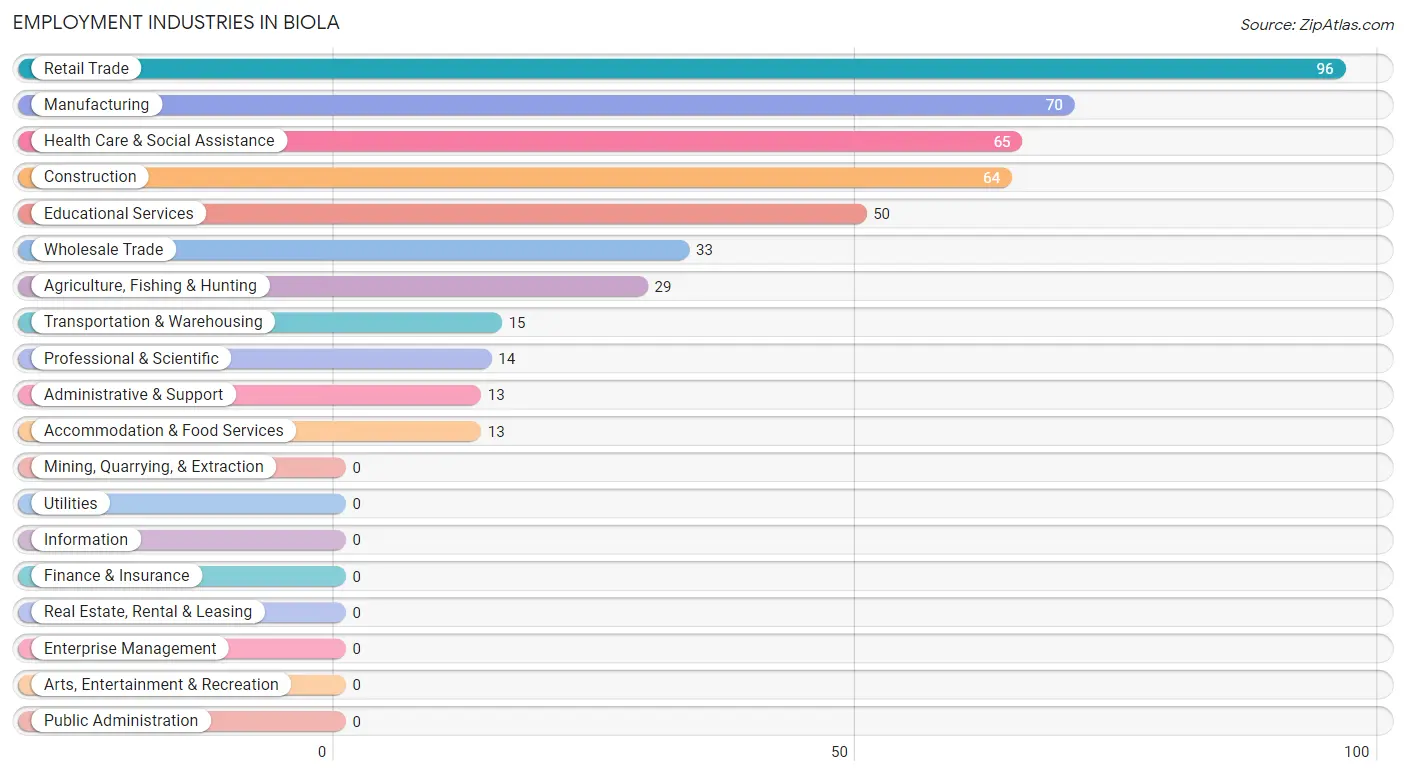
Employment Industries in Biola
The major employment industries in Biola include Retail Trade (96 | 20.2%), Manufacturing (70 | 14.7%), Health Care & Social Assistance (65 | 13.7%), Construction (64 | 13.5%), and Educational Services (50 | 10.5%).
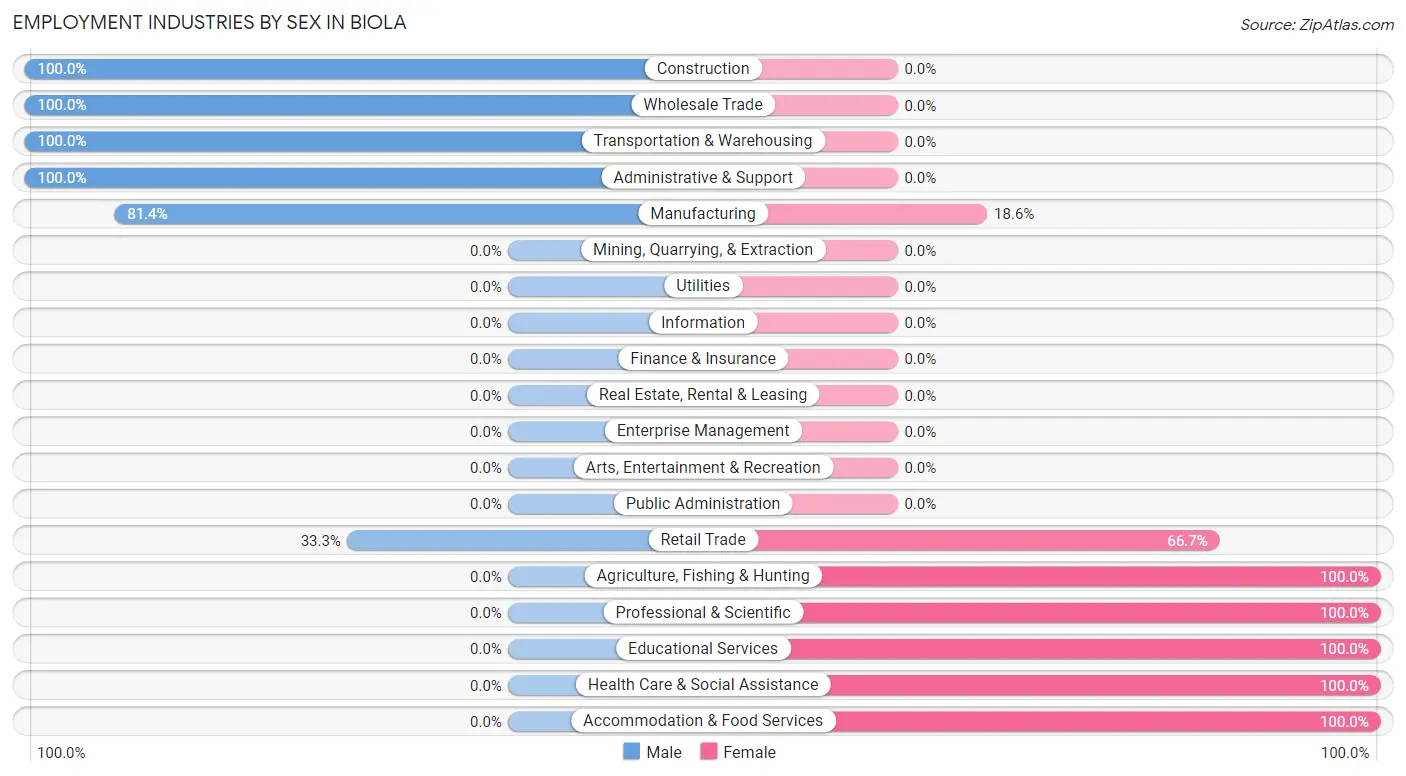
Employment Industries by Sex in Biola
The Biola industries that see more men than women are Construction (100.0%), Wholesale Trade (100.0%), and Transportation & Warehousing (100.0%), whereas the industries that tend to have a higher number of women are Agriculture, Fishing & Hunting (100.0%), Professional & Scientific (100.0%), and Educational Services (100.0%).
| Industry | Male | Female |
| Agriculture, Fishing & Hunting | 0 (0.0%) | 29 (100.0%) |
| Mining, Quarrying, & Extraction | 0 (0.0%) | 0 (0.0%) |
| Construction | 64 (100.0%) | 0 (0.0%) |
| Manufacturing | 57 (81.4%) | 13 (18.6%) |
| Wholesale Trade | 33 (100.0%) | 0 (0.0%) |
| Retail Trade | 32 (33.3%) | 64 (66.7%) |
| Transportation & Warehousing | 15 (100.0%) | 0 (0.0%) |
| Utilities | 0 (0.0%) | 0 (0.0%) |
| Information | 0 (0.0%) | 0 (0.0%) |
| Finance & Insurance | 0 (0.0%) | 0 (0.0%) |
| Real Estate, Rental & Leasing | 0 (0.0%) | 0 (0.0%) |
| Professional & Scientific | 0 (0.0%) | 14 (100.0%) |
| Enterprise Management | 0 (0.0%) | 0 (0.0%) |
| Administrative & Support | 13 (100.0%) | 0 (0.0%) |
| Educational Services | 0 (0.0%) | 50 (100.0%) |
| Health Care & Social Assistance | 0 (0.0%) | 65 (100.0%) |
| Arts, Entertainment & Recreation | 0 (0.0%) | 0 (0.0%) |
| Accommodation & Food Services | 0 (0.0%) | 13 (100.0%) |
| Public Administration | 0 (0.0%) | 0 (0.0%) |
| Total | 228 (47.9%) | 248 (52.1%) |
Education in Biola
School Enrollment in Biola
The most common levels of schooling among the 577 students in Biola are college / undergraduate (169 | 29.3%), elementary school (141 | 24.4%), and high school (116 | 20.1%).
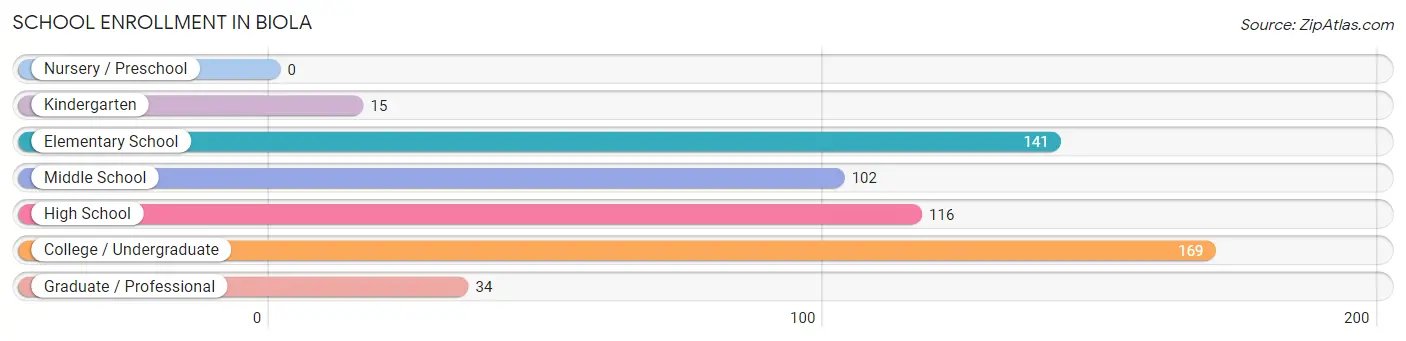
| School Level | # Students | % Students |
| Nursery / Preschool | 0 | 0.0% |
| Kindergarten | 15 | 2.6% |
| Elementary School | 141 | 24.4% |
| Middle School | 102 | 17.7% |
| High School | 116 | 20.1% |
| College / Undergraduate | 169 | 29.3% |
| Graduate / Professional | 34 | 5.9% |
| Total | 577 | 100.0% |
School Enrollment by Age by Funding Source in Biola
Out of a total of 577 students who are enrolled in schools in Biola, 19 (3.3%) attend a private institution, while the remaining 558 (96.7%) are enrolled in public schools. The age group of 25 to 34 year olds has the highest likelihood of being enrolled in private schools, with 19 (28.8% in the age bracket) enrolled. Conversely, the age group of 5 to 9 year old has the lowest likelihood of being enrolled in a private school, with 156 (100.0% in the age bracket) attending a public institution.
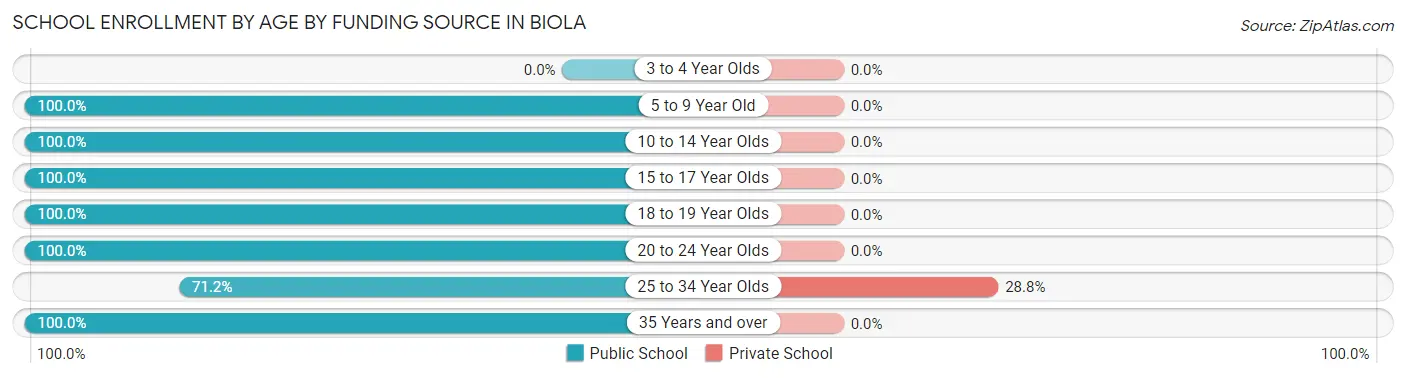
| Age Bracket | Public School | Private School |
| 3 to 4 Year Olds | 0 (0.0%) | 0 (0.0%) |
| 5 to 9 Year Old | 156 (100.0%) | 0 (0.0%) |
| 10 to 14 Year Olds | 99 (100.0%) | 0 (0.0%) |
| 15 to 17 Year Olds | 103 (100.0%) | 0 (0.0%) |
| 18 to 19 Year Olds | 42 (100.0%) | 0 (0.0%) |
| 20 to 24 Year Olds | 63 (100.0%) | 0 (0.0%) |
| 25 to 34 Year Olds | 47 (71.2%) | 19 (28.8%) |
| 35 Years and over | 48 (100.0%) | 0 (0.0%) |
| Total | 558 (96.7%) | 19 (3.3%) |
Educational Attainment by Field of Study in Biola
Education (48 | 47.1%), bio, nature & agricultural (19 | 18.6%), physical & health sciences (19 | 18.6%), and science & technology (16 | 15.7%) are the most common fields of study among 102 individuals in Biola who have obtained a bachelor's degree or higher.
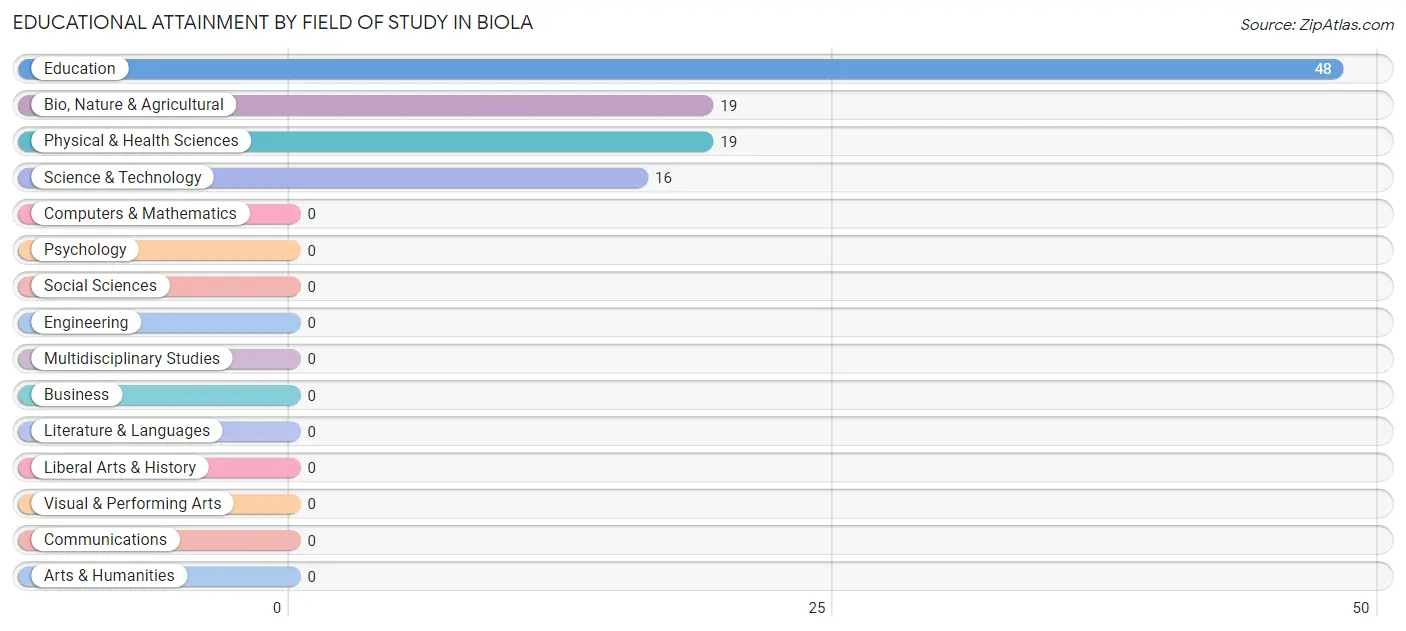
| Field of Study | # Graduates | % Graduates |
| Computers & Mathematics | 0 | 0.0% |
| Bio, Nature & Agricultural | 19 | 18.6% |
| Physical & Health Sciences | 19 | 18.6% |
| Psychology | 0 | 0.0% |
| Social Sciences | 0 | 0.0% |
| Engineering | 0 | 0.0% |
| Multidisciplinary Studies | 0 | 0.0% |
| Science & Technology | 16 | 15.7% |
| Business | 0 | 0.0% |
| Education | 48 | 47.1% |
| Literature & Languages | 0 | 0.0% |
| Liberal Arts & History | 0 | 0.0% |
| Visual & Performing Arts | 0 | 0.0% |
| Communications | 0 | 0.0% |
| Arts & Humanities | 0 | 0.0% |
| Total | 102 | 100.0% |
Transportation & Commute in Biola
Vehicle Availability by Sex in Biola
The most prevalent vehicle ownership categories in Biola are males with 3 vehicles (91, accounting for 39.9%) and females with 3 vehicles (61, making up 38.7%).
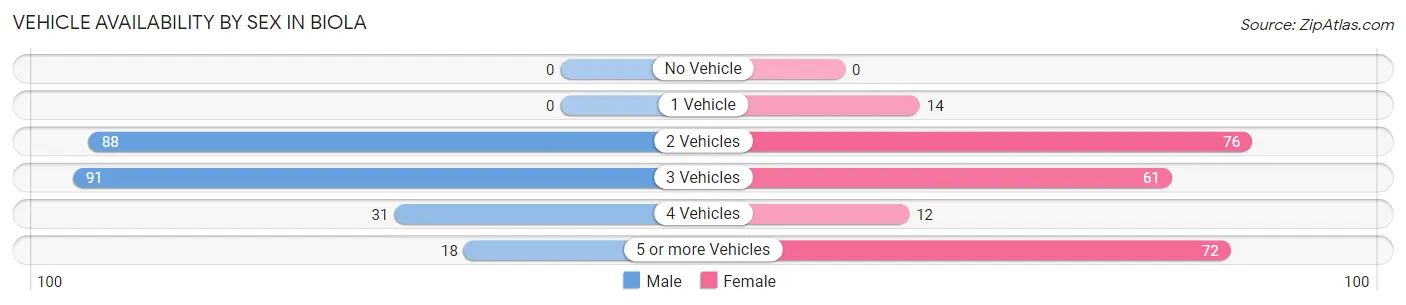
| Vehicles Available | Male | Female |
| No Vehicle | 0 (0.0%) | 0 (0.0%) |
| 1 Vehicle | 0 (0.0%) | 14 (6.0%) |
| 2 Vehicles | 88 (38.6%) | 76 (32.3%) |
| 3 Vehicles | 91 (39.9%) | 61 (26.0%) |
| 4 Vehicles | 31 (13.6%) | 12 (5.1%) |
| 5 or more Vehicles | 18 (7.9%) | 72 (30.6%) |
| Total | 228 (100.0%) | 235 (100.0%) |
Commute Time in Biola
The most frequently occuring commute durations in Biola are 30 to 34 minutes (118 commuters, 25.5%), 15 to 19 minutes (71 commuters, 15.3%), and 10 to 14 minutes (64 commuters, 13.8%).
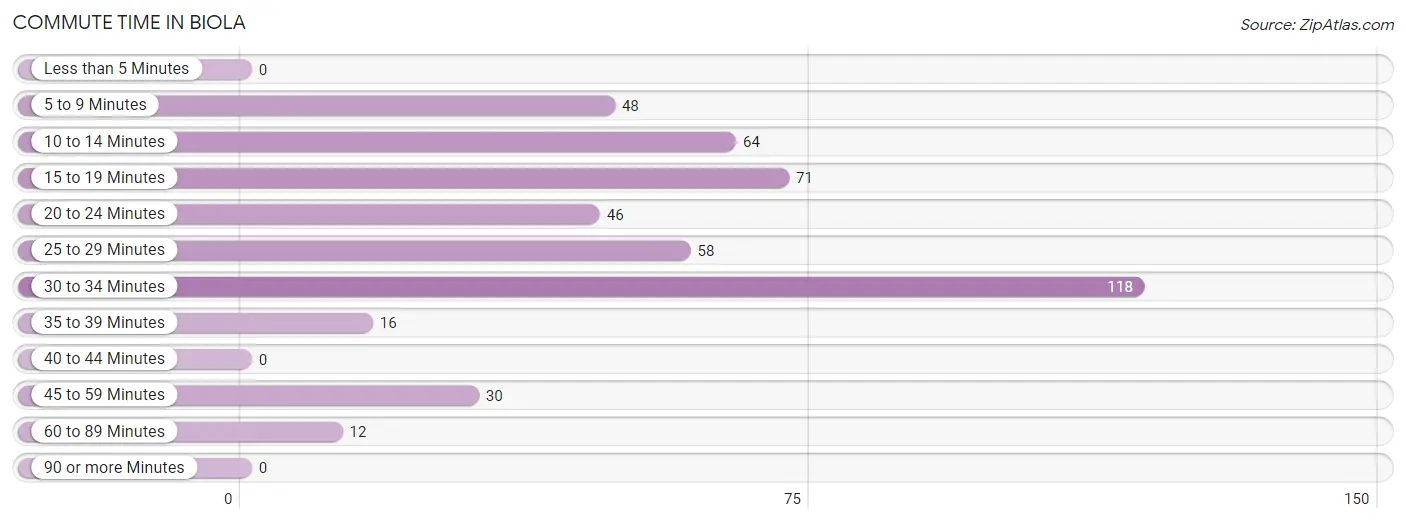
| Commute Time | # Commuters | % Commuters |
| Less than 5 Minutes | 0 | 0.0% |
| 5 to 9 Minutes | 48 | 10.4% |
| 10 to 14 Minutes | 64 | 13.8% |
| 15 to 19 Minutes | 71 | 15.3% |
| 20 to 24 Minutes | 46 | 9.9% |
| 25 to 29 Minutes | 58 | 12.5% |
| 30 to 34 Minutes | 118 | 25.5% |
| 35 to 39 Minutes | 16 | 3.5% |
| 40 to 44 Minutes | 0 | 0.0% |
| 45 to 59 Minutes | 30 | 6.5% |
| 60 to 89 Minutes | 12 | 2.6% |
| 90 or more Minutes | 0 | 0.0% |
Commute Time by Sex in Biola
The most common commute times in Biola are 30 to 34 minutes (87 commuters, 38.2%) for males and 15 to 19 minutes (53 commuters, 22.6%) for females.
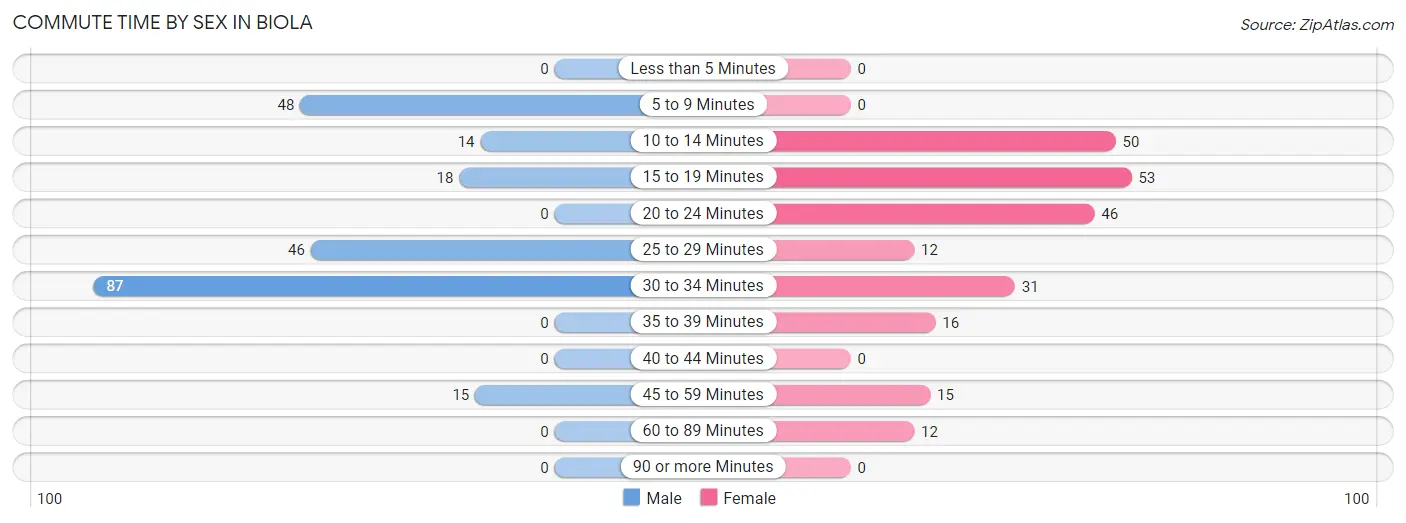
| Commute Time | Male | Female |
| Less than 5 Minutes | 0 (0.0%) | 0 (0.0%) |
| 5 to 9 Minutes | 48 (21.0%) | 0 (0.0%) |
| 10 to 14 Minutes | 14 (6.1%) | 50 (21.3%) |
| 15 to 19 Minutes | 18 (7.9%) | 53 (22.6%) |
| 20 to 24 Minutes | 0 (0.0%) | 46 (19.6%) |
| 25 to 29 Minutes | 46 (20.2%) | 12 (5.1%) |
| 30 to 34 Minutes | 87 (38.2%) | 31 (13.2%) |
| 35 to 39 Minutes | 0 (0.0%) | 16 (6.8%) |
| 40 to 44 Minutes | 0 (0.0%) | 0 (0.0%) |
| 45 to 59 Minutes | 15 (6.6%) | 15 (6.4%) |
| 60 to 89 Minutes | 0 (0.0%) | 12 (5.1%) |
| 90 or more Minutes | 0 (0.0%) | 0 (0.0%) |
Time of Departure to Work by Sex in Biola
The most frequent times of departure to work in Biola are 5:00 AM to 5:29 AM (77, 33.8%) for males and 7:00 AM to 7:29 AM (94, 40.0%) for females.
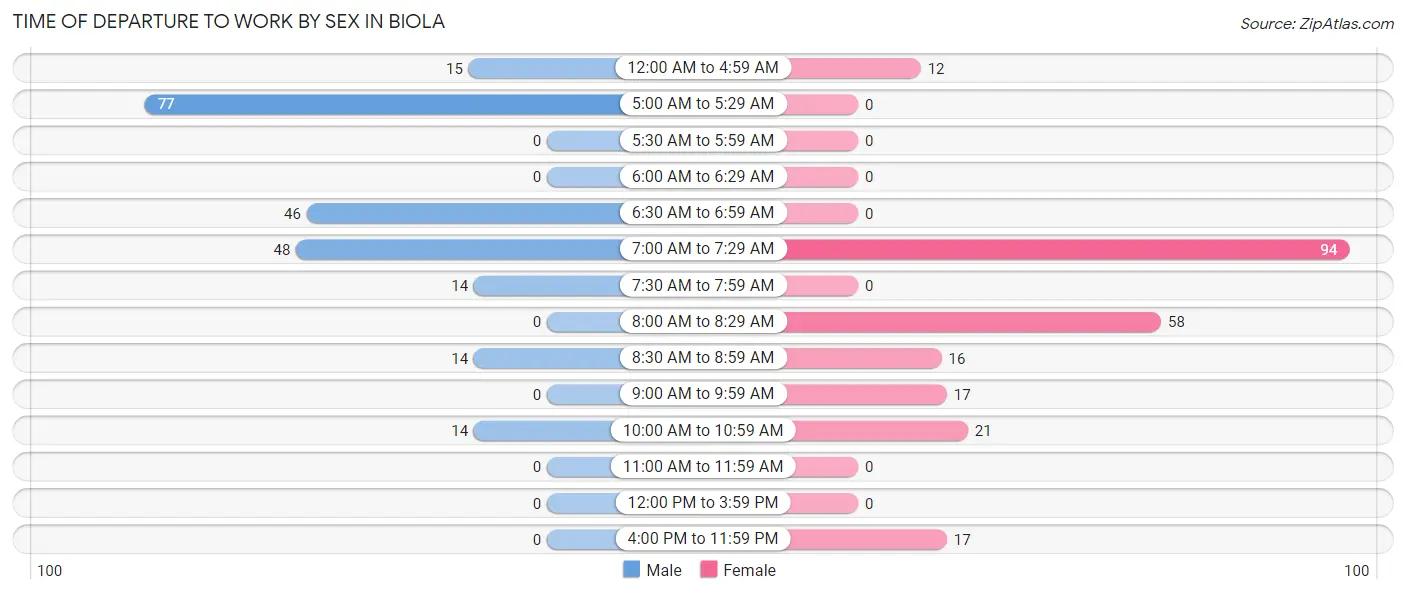
| Time of Departure | Male | Female |
| 12:00 AM to 4:59 AM | 15 (6.6%) | 12 (5.1%) |
| 5:00 AM to 5:29 AM | 77 (33.8%) | 0 (0.0%) |
| 5:30 AM to 5:59 AM | 0 (0.0%) | 0 (0.0%) |
| 6:00 AM to 6:29 AM | 0 (0.0%) | 0 (0.0%) |
| 6:30 AM to 6:59 AM | 46 (20.2%) | 0 (0.0%) |
| 7:00 AM to 7:29 AM | 48 (21.0%) | 94 (40.0%) |
| 7:30 AM to 7:59 AM | 14 (6.1%) | 0 (0.0%) |
| 8:00 AM to 8:29 AM | 0 (0.0%) | 58 (24.7%) |
| 8:30 AM to 8:59 AM | 14 (6.1%) | 16 (6.8%) |
| 9:00 AM to 9:59 AM | 0 (0.0%) | 17 (7.2%) |
| 10:00 AM to 10:59 AM | 14 (6.1%) | 21 (8.9%) |
| 11:00 AM to 11:59 AM | 0 (0.0%) | 0 (0.0%) |
| 12:00 PM to 3:59 PM | 0 (0.0%) | 0 (0.0%) |
| 4:00 PM to 11:59 PM | 0 (0.0%) | 17 (7.2%) |
| Total | 228 (100.0%) | 235 (100.0%) |
Housing Occupancy in Biola
Occupancy by Ownership in Biola
Of the total 315 dwellings in Biola, owner-occupied units account for 113 (35.9%), while renter-occupied units make up 202 (64.1%).
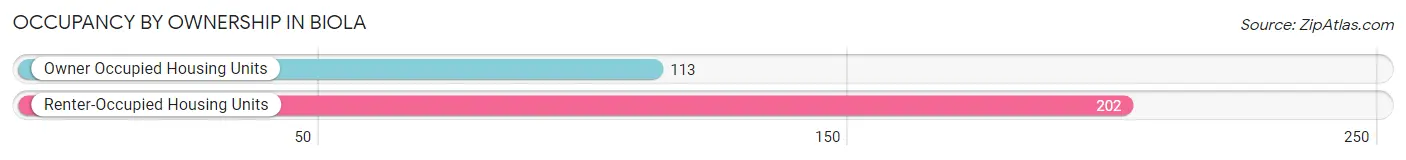
| Occupancy | # Housing Units | % Housing Units |
| Owner Occupied Housing Units | 113 | 35.9% |
| Renter-Occupied Housing Units | 202 | 64.1% |
| Total Occupied Housing Units | 315 | 100.0% |
Occupancy by Household Size in Biola
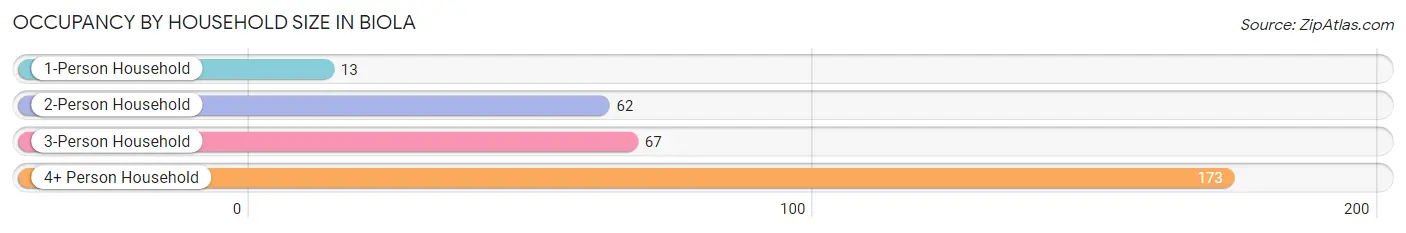
| Household Size | # Housing Units | % Housing Units |
| 1-Person Household | 13 | 4.1% |
| 2-Person Household | 62 | 19.7% |
| 3-Person Household | 67 | 21.3% |
| 4+ Person Household | 173 | 54.9% |
| Total Housing Units | 315 | 100.0% |
Occupancy by Ownership by Household Size in Biola
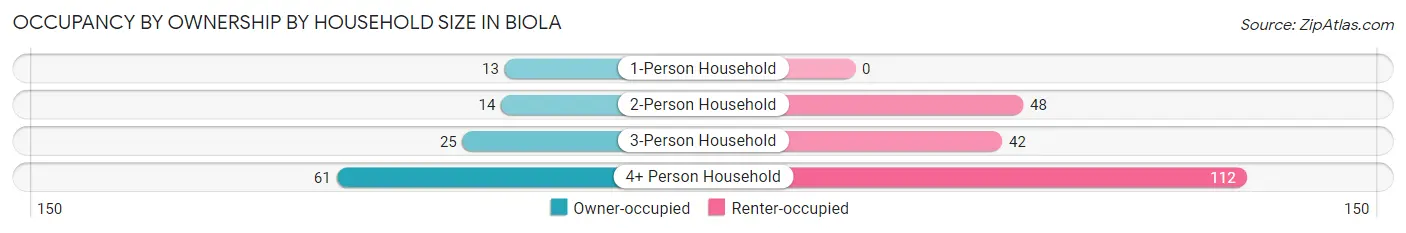
| Household Size | Owner-occupied | Renter-occupied |
| 1-Person Household | 13 (100.0%) | 0 (0.0%) |
| 2-Person Household | 14 (22.6%) | 48 (77.4%) |
| 3-Person Household | 25 (37.3%) | 42 (62.7%) |
| 4+ Person Household | 61 (35.3%) | 112 (64.7%) |
| Total Housing Units | 113 (35.9%) | 202 (64.1%) |
Occupancy by Educational Attainment in Biola
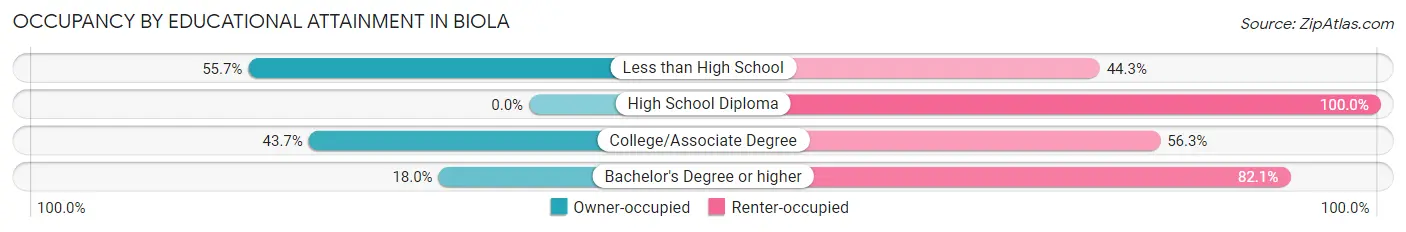
| Household Size | Owner-occupied | Renter-occupied |
| Less than High School | 54 (55.7%) | 43 (44.3%) |
| High School Diploma | 0 (0.0%) | 37 (100.0%) |
| College/Associate Degree | 45 (43.7%) | 58 (56.3%) |
| Bachelor's Degree or higher | 14 (17.9%) | 64 (82.1%) |
Occupancy by Age of Householder in Biola
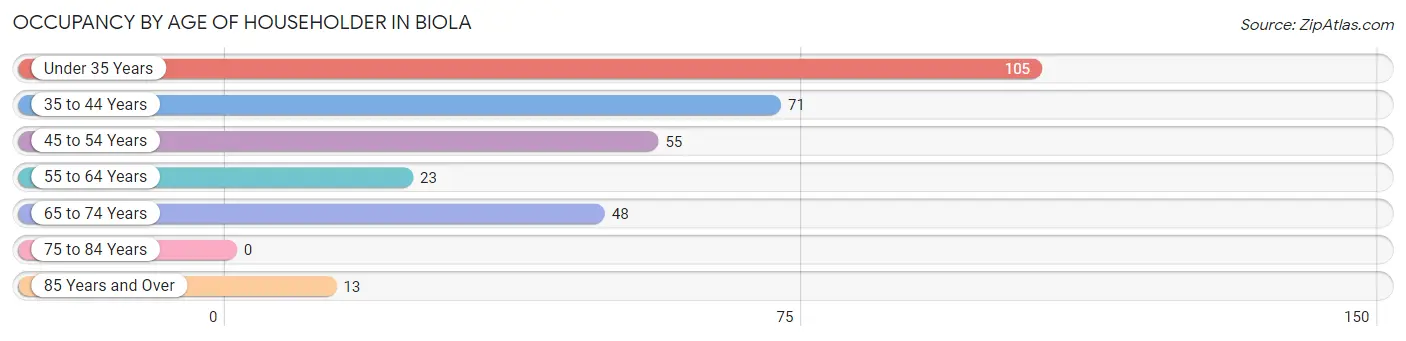
| Age Bracket | # Households | % Households |
| Under 35 Years | 105 | 33.3% |
| 35 to 44 Years | 71 | 22.5% |
| 45 to 54 Years | 55 | 17.5% |
| 55 to 64 Years | 23 | 7.3% |
| 65 to 74 Years | 48 | 15.2% |
| 75 to 84 Years | 0 | 0.0% |
| 85 Years and Over | 13 | 4.1% |
| Total | 315 | 100.0% |
Housing Finances in Biola
Median Income by Occupancy in Biola
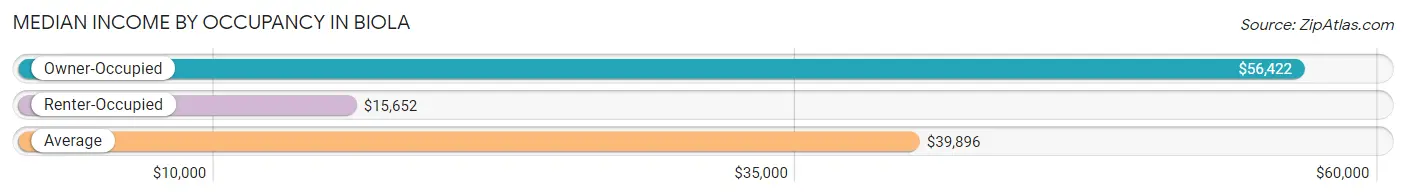
| Occupancy Type | # Households | Median Income |
| Owner-Occupied | 113 (35.9%) | $56,422 |
| Renter-Occupied | 202 (64.1%) | $15,652 |
| Average | 315 (100.0%) | $39,896 |
Occupancy by Householder Income Bracket in Biola
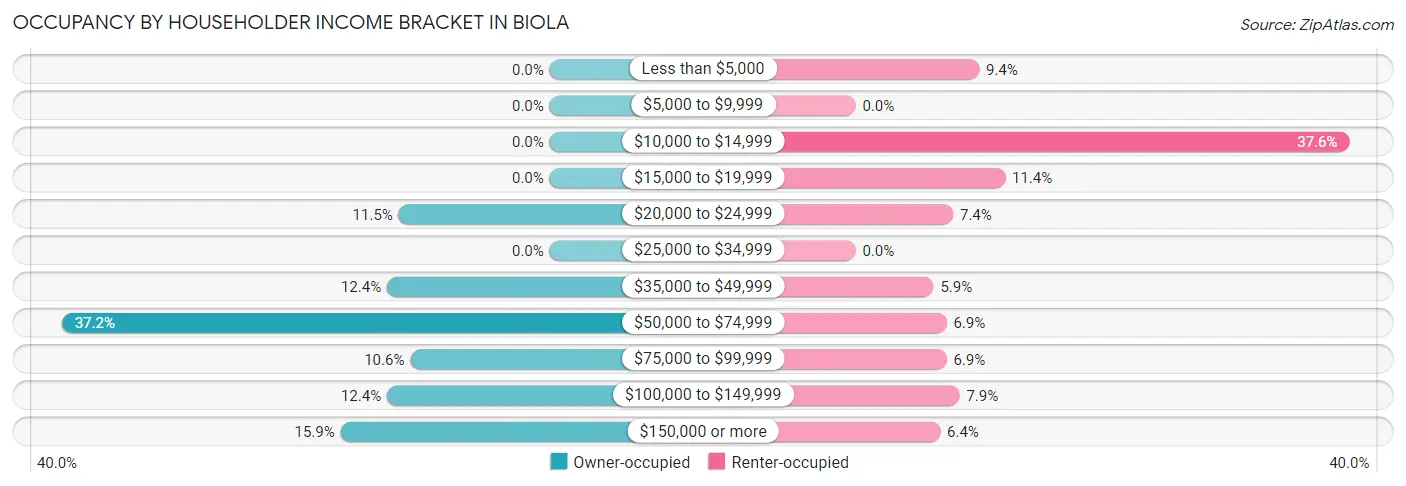
| Income Bracket | Owner-occupied | Renter-occupied |
| Less than $5,000 | 0 (0.0%) | 19 (9.4%) |
| $5,000 to $9,999 | 0 (0.0%) | 0 (0.0%) |
| $10,000 to $14,999 | 0 (0.0%) | 76 (37.6%) |
| $15,000 to $19,999 | 0 (0.0%) | 23 (11.4%) |
| $20,000 to $24,999 | 13 (11.5%) | 15 (7.4%) |
| $25,000 to $34,999 | 0 (0.0%) | 0 (0.0%) |
| $35,000 to $49,999 | 14 (12.4%) | 12 (5.9%) |
| $50,000 to $74,999 | 42 (37.2%) | 14 (6.9%) |
| $75,000 to $99,999 | 12 (10.6%) | 14 (6.9%) |
| $100,000 to $149,999 | 14 (12.4%) | 16 (7.9%) |
| $150,000 or more | 18 (15.9%) | 13 (6.4%) |
| Total | 113 (100.0%) | 202 (100.0%) |
Monthly Housing Cost Tiers in Biola
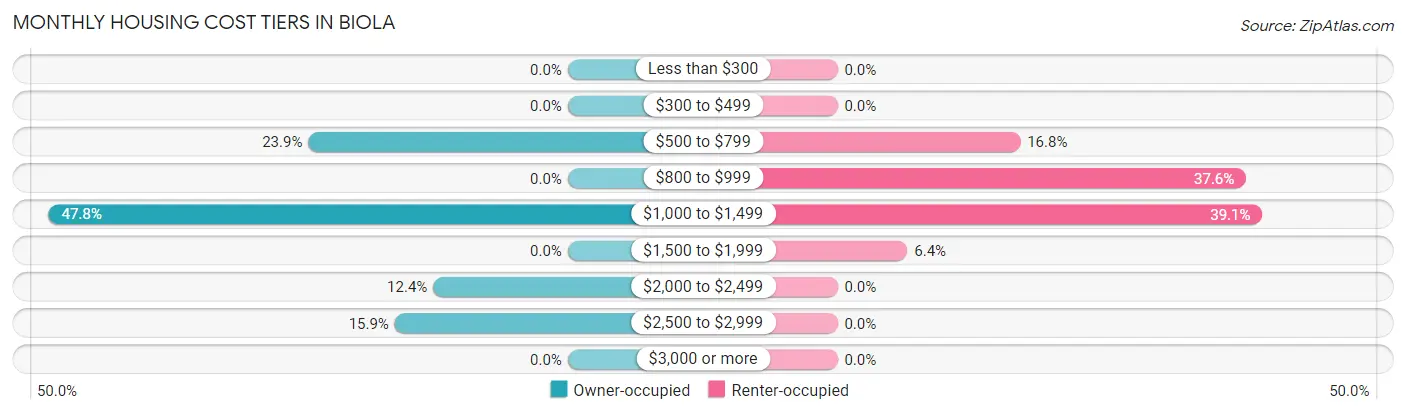
| Monthly Cost | Owner-occupied | Renter-occupied |
| Less than $300 | 0 (0.0%) | 0 (0.0%) |
| $300 to $499 | 0 (0.0%) | 0 (0.0%) |
| $500 to $799 | 27 (23.9%) | 34 (16.8%) |
| $800 to $999 | 0 (0.0%) | 76 (37.6%) |
| $1,000 to $1,499 | 54 (47.8%) | 79 (39.1%) |
| $1,500 to $1,999 | 0 (0.0%) | 13 (6.4%) |
| $2,000 to $2,499 | 14 (12.4%) | 0 (0.0%) |
| $2,500 to $2,999 | 18 (15.9%) | 0 (0.0%) |
| $3,000 or more | 0 (0.0%) | 0 (0.0%) |
| Total | 113 (100.0%) | 202 (100.0%) |
Physical Housing Characteristics in Biola
Housing Structures in Biola
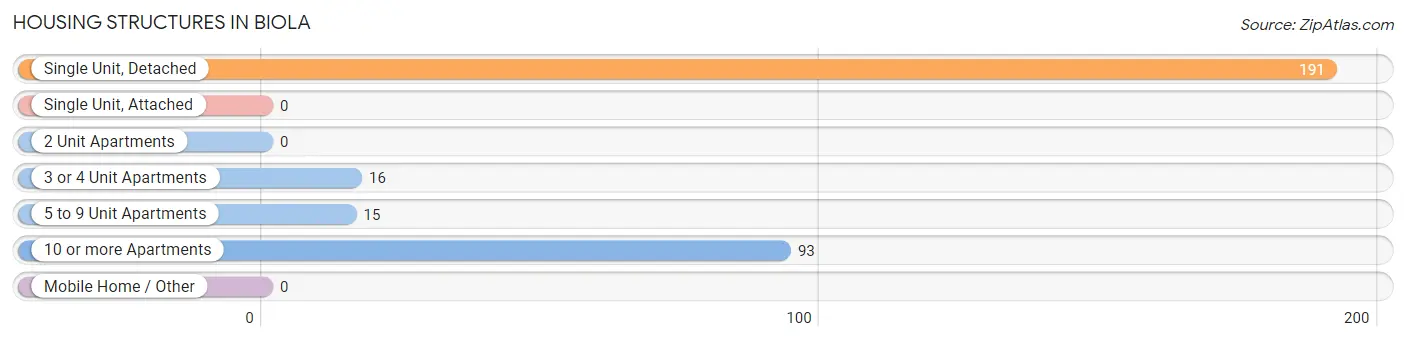
| Structure Type | # Housing Units | % Housing Units |
| Single Unit, Detached | 191 | 60.6% |
| Single Unit, Attached | 0 | 0.0% |
| 2 Unit Apartments | 0 | 0.0% |
| 3 or 4 Unit Apartments | 16 | 5.1% |
| 5 to 9 Unit Apartments | 15 | 4.8% |
| 10 or more Apartments | 93 | 29.5% |
| Mobile Home / Other | 0 | 0.0% |
| Total | 315 | 100.0% |
Housing Structures by Occupancy in Biola
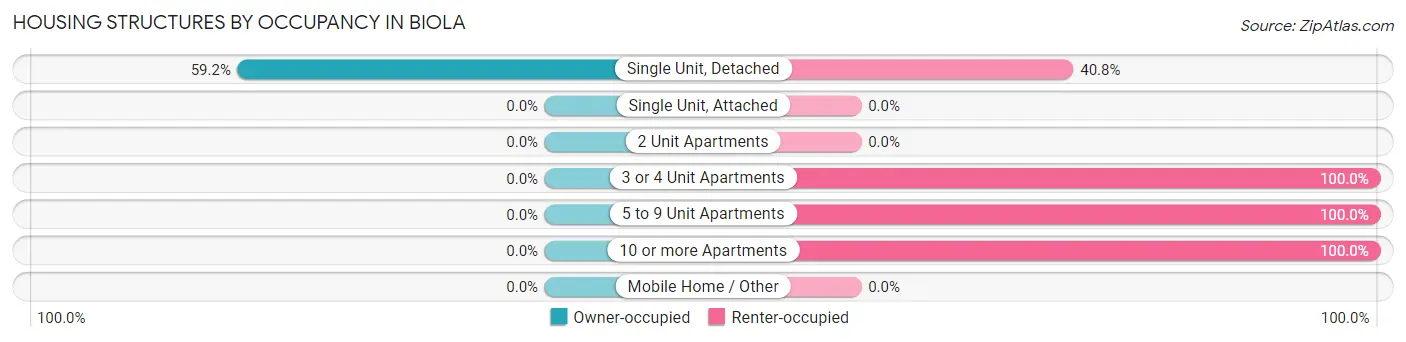
| Structure Type | Owner-occupied | Renter-occupied |
| Single Unit, Detached | 113 (59.2%) | 78 (40.8%) |
| Single Unit, Attached | 0 (0.0%) | 0 (0.0%) |
| 2 Unit Apartments | 0 (0.0%) | 0 (0.0%) |
| 3 or 4 Unit Apartments | 0 (0.0%) | 16 (100.0%) |
| 5 to 9 Unit Apartments | 0 (0.0%) | 15 (100.0%) |
| 10 or more Apartments | 0 (0.0%) | 93 (100.0%) |
| Mobile Home / Other | 0 (0.0%) | 0 (0.0%) |
| Total | 113 (35.9%) | 202 (64.1%) |
Housing Structures by Number of Rooms in Biola
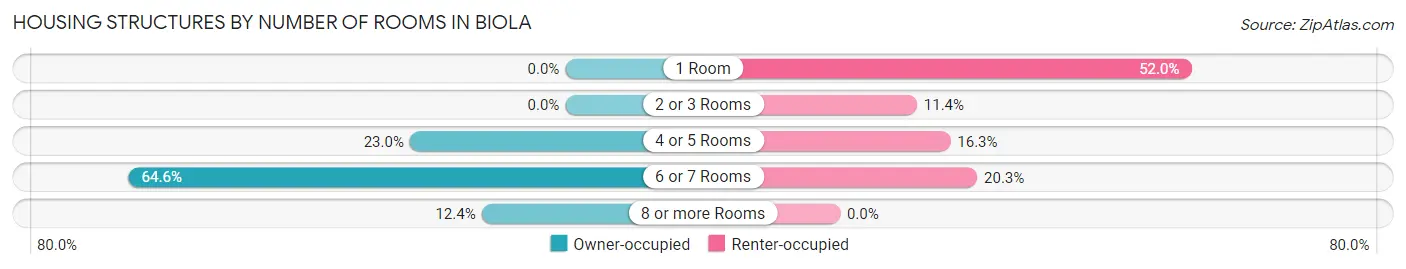
| Number of Rooms | Owner-occupied | Renter-occupied |
| 1 Room | 0 (0.0%) | 105 (52.0%) |
| 2 or 3 Rooms | 0 (0.0%) | 23 (11.4%) |
| 4 or 5 Rooms | 26 (23.0%) | 33 (16.3%) |
| 6 or 7 Rooms | 73 (64.6%) | 41 (20.3%) |
| 8 or more Rooms | 14 (12.4%) | 0 (0.0%) |
| Total | 113 (100.0%) | 202 (100.0%) |
Housing Structure by Heating Type in Biola
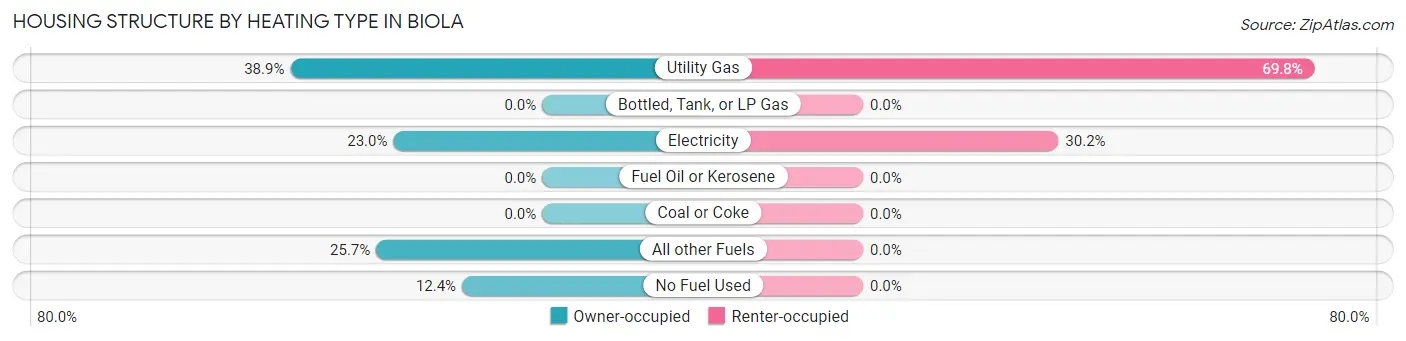
| Heating Type | Owner-occupied | Renter-occupied |
| Utility Gas | 44 (38.9%) | 141 (69.8%) |
| Bottled, Tank, or LP Gas | 0 (0.0%) | 0 (0.0%) |
| Electricity | 26 (23.0%) | 61 (30.2%) |
| Fuel Oil or Kerosene | 0 (0.0%) | 0 (0.0%) |
| Coal or Coke | 0 (0.0%) | 0 (0.0%) |
| All other Fuels | 29 (25.7%) | 0 (0.0%) |
| No Fuel Used | 14 (12.4%) | 0 (0.0%) |
| Total | 113 (100.0%) | 202 (100.0%) |
Household Vehicle Usage in Biola
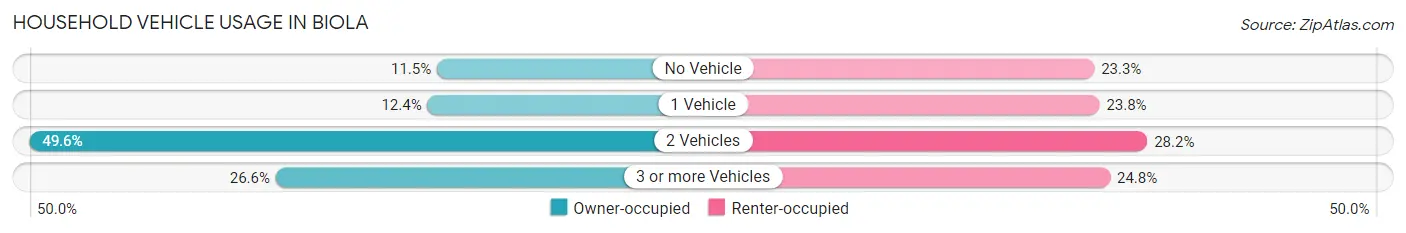
| Vehicles per Household | Owner-occupied | Renter-occupied |
| No Vehicle | 13 (11.5%) | 47 (23.3%) |
| 1 Vehicle | 14 (12.4%) | 48 (23.8%) |
| 2 Vehicles | 56 (49.6%) | 57 (28.2%) |
| 3 or more Vehicles | 30 (26.6%) | 50 (24.7%) |
| Total | 113 (100.0%) | 202 (100.0%) |
Real Estate & Mortgages in Biola
Real Estate and Mortgage Overview in Biola
| Characteristic | Without Mortgage | With Mortgage |
| Housing Units | 27 | 86 |
| Median Property Value | - | - |
| Median Household Income | - | - |
| Monthly Housing Costs | - | - |
| Real Estate Taxes | - | - |
Property Value by Mortgage Status in Biola
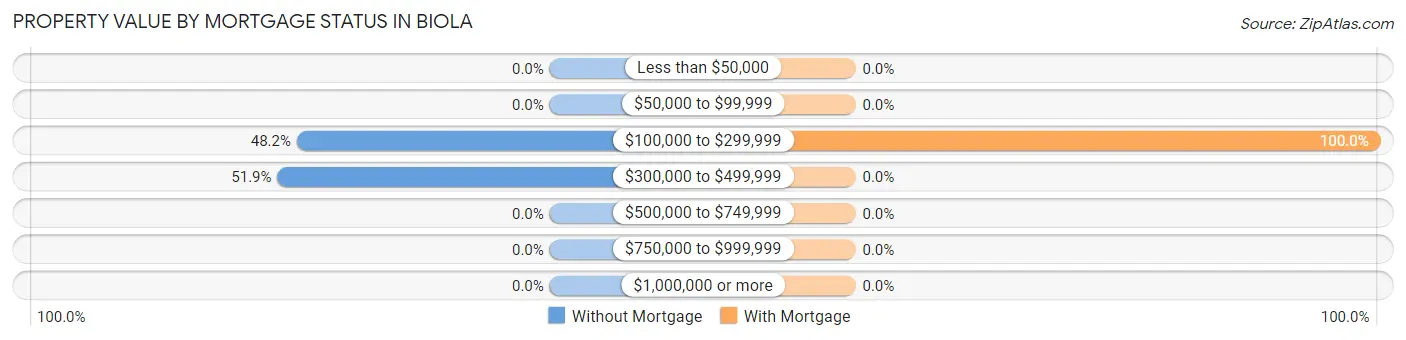
| Property Value | Without Mortgage | With Mortgage |
| Less than $50,000 | 0 (0.0%) | 0 (0.0%) |
| $50,000 to $99,999 | 0 (0.0%) | 0 (0.0%) |
| $100,000 to $299,999 | 13 (48.1%) | 86 (100.0%) |
| $300,000 to $499,999 | 14 (51.8%) | 0 (0.0%) |
| $500,000 to $749,999 | 0 (0.0%) | 0 (0.0%) |
| $750,000 to $999,999 | 0 (0.0%) | 0 (0.0%) |
| $1,000,000 or more | 0 (0.0%) | 0 (0.0%) |
| Total | 27 (100.0%) | 86 (100.0%) |
Household Income by Mortgage Status in Biola
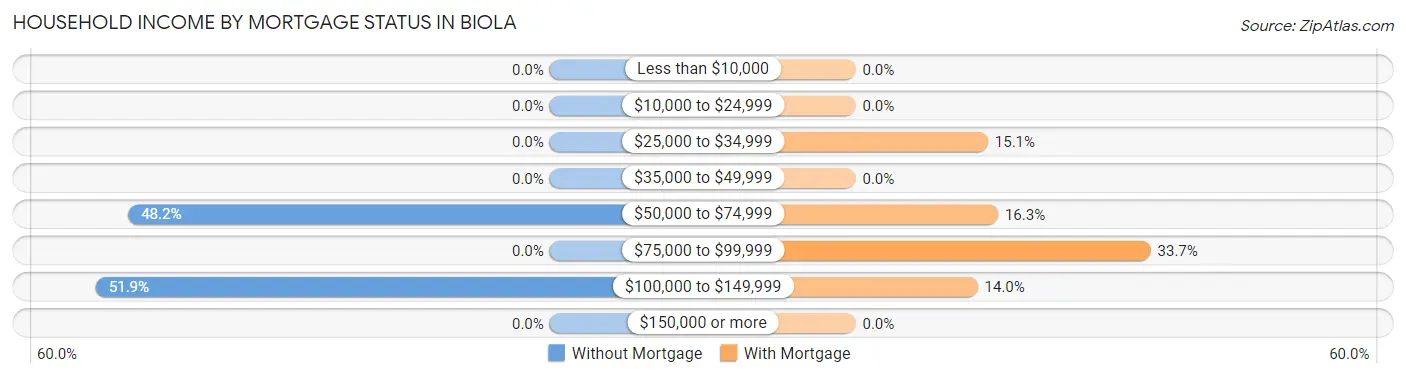
| Household Income | Without Mortgage | With Mortgage |
| Less than $10,000 | 0 (0.0%) | 0 (0.0%) |
| $10,000 to $24,999 | 0 (0.0%) | 0 (0.0%) |
| $25,000 to $34,999 | 0 (0.0%) | 13 (15.1%) |
| $35,000 to $49,999 | 0 (0.0%) | 0 (0.0%) |
| $50,000 to $74,999 | 13 (48.1%) | 14 (16.3%) |
| $75,000 to $99,999 | 0 (0.0%) | 29 (33.7%) |
| $100,000 to $149,999 | 14 (51.8%) | 12 (14.0%) |
| $150,000 or more | 0 (0.0%) | 0 (0.0%) |
| Total | 27 (100.0%) | 86 (100.0%) |
Property Value to Household Income Ratio in Biola
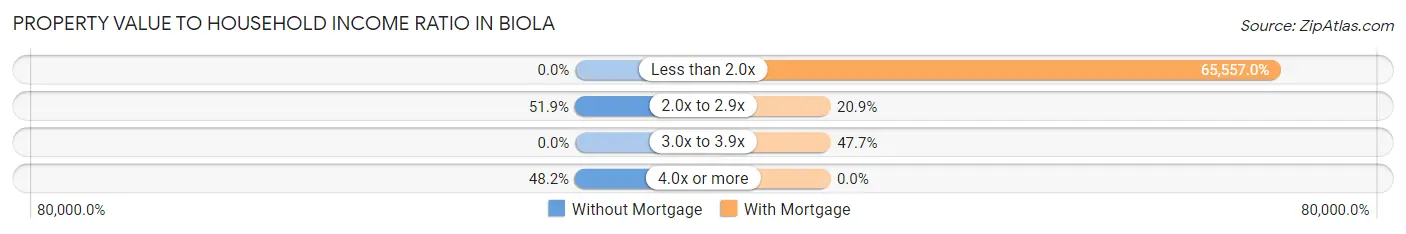
| Value-to-Income Ratio | Without Mortgage | With Mortgage |
| Less than 2.0x | 0 (0.0%) | 56,379 (65,557.0%) |
| 2.0x to 2.9x | 14 (51.8%) | 18 (20.9%) |
| 3.0x to 3.9x | 0 (0.0%) | 41 (47.7%) |
| 4.0x or more | 13 (48.1%) | 0 (0.0%) |
| Total | 27 (100.0%) | 86 (100.0%) |
Real Estate Taxes by Mortgage Status in Biola
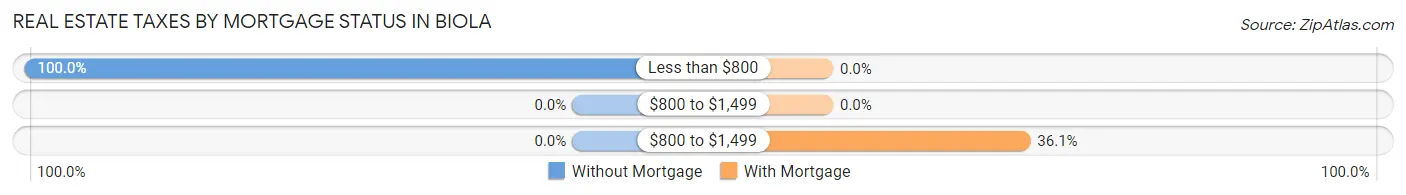
| Property Taxes | Without Mortgage | With Mortgage |
| Less than $800 | 27 (100.0%) | 0 (0.0%) |
| $800 to $1,499 | 0 (0.0%) | 0 (0.0%) |
| $800 to $1,499 | 0 (0.0%) | 31 (36.0%) |
| Total | 27 (100.0%) | 86 (100.0%) |
Health & Disability in Biola
Health Insurance Coverage by Age in Biola
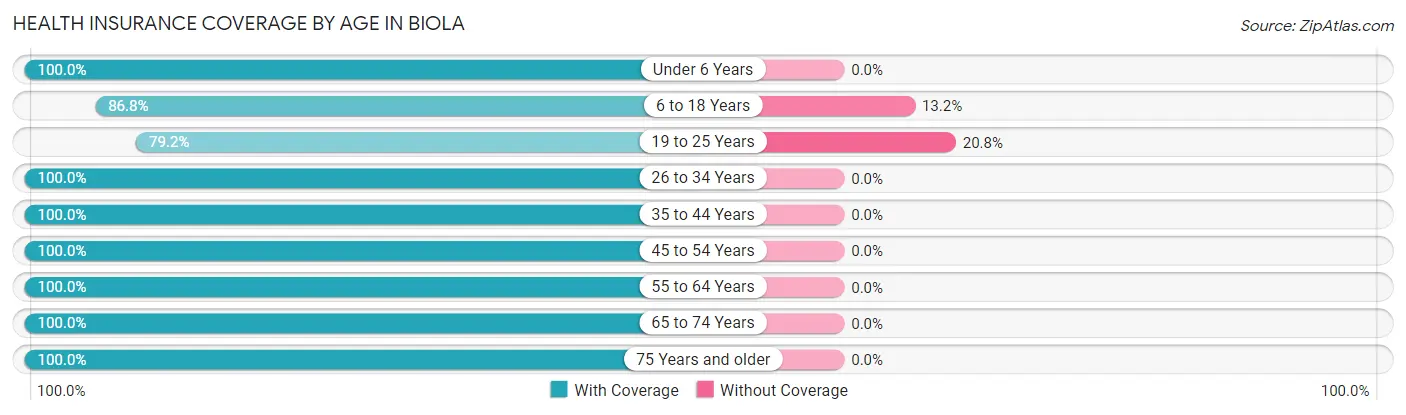
| Age Bracket | With Coverage | Without Coverage |
| Under 6 Years | 169 (100.0%) | 0 (0.0%) |
| 6 to 18 Years | 349 (86.8%) | 53 (13.2%) |
| 19 to 25 Years | 160 (79.2%) | 42 (20.8%) |
| 26 to 34 Years | 212 (100.0%) | 0 (0.0%) |
| 35 to 44 Years | 113 (100.0%) | 0 (0.0%) |
| 45 to 54 Years | 84 (100.0%) | 0 (0.0%) |
| 55 to 64 Years | 44 (100.0%) | 0 (0.0%) |
| 65 to 74 Years | 96 (100.0%) | 0 (0.0%) |
| 75 Years and older | 13 (100.0%) | 0 (0.0%) |
| Total | 1,240 (92.9%) | 95 (7.1%) |
Health Insurance Coverage by Citizenship Status in Biola
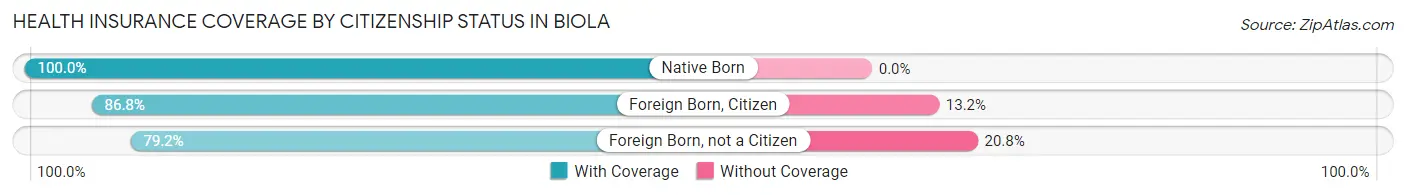
| Citizenship Status | With Coverage | Without Coverage |
| Native Born | 169 (100.0%) | 0 (0.0%) |
| Foreign Born, Citizen | 349 (86.8%) | 53 (13.2%) |
| Foreign Born, not a Citizen | 160 (79.2%) | 42 (20.8%) |
Health Insurance Coverage by Household Income in Biola
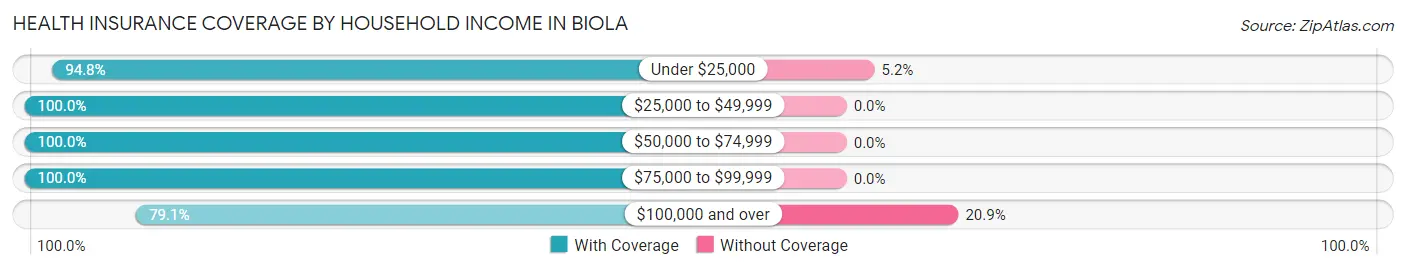
| Household Income | With Coverage | Without Coverage |
| Under $25,000 | 491 (94.8%) | 27 (5.2%) |
| $25,000 to $49,999 | 108 (100.0%) | 0 (0.0%) |
| $50,000 to $74,999 | 273 (100.0%) | 0 (0.0%) |
| $75,000 to $99,999 | 111 (100.0%) | 0 (0.0%) |
| $100,000 and over | 257 (79.1%) | 68 (20.9%) |
Public vs Private Health Insurance Coverage by Age in Biola
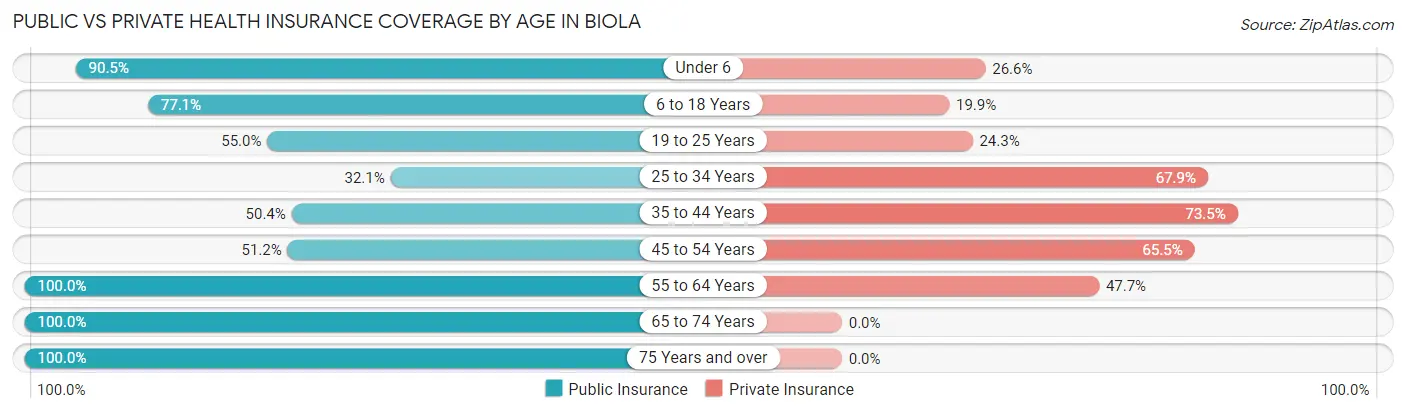
| Age Bracket | Public Insurance | Private Insurance |
| Under 6 | 153 (90.5%) | 45 (26.6%) |
| 6 to 18 Years | 310 (77.1%) | 80 (19.9%) |
| 19 to 25 Years | 111 (54.9%) | 49 (24.3%) |
| 25 to 34 Years | 68 (32.1%) | 144 (67.9%) |
| 35 to 44 Years | 57 (50.4%) | 83 (73.5%) |
| 45 to 54 Years | 43 (51.2%) | 55 (65.5%) |
| 55 to 64 Years | 44 (100.0%) | 21 (47.7%) |
| 65 to 74 Years | 96 (100.0%) | 0 (0.0%) |
| 75 Years and over | 13 (100.0%) | 0 (0.0%) |
| Total | 895 (67.0%) | 477 (35.7%) |
Disability Status by Sex by Age in Biola
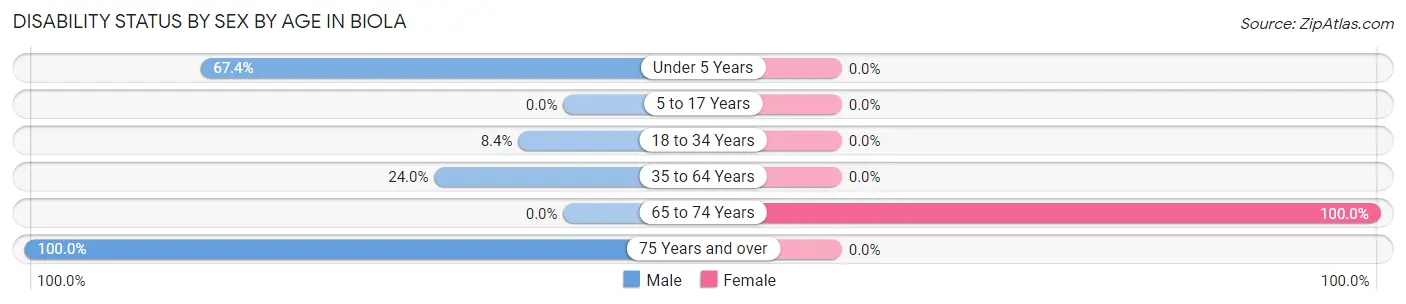
| Age Bracket | Male | Female |
| Under 5 Years | 31 (67.4%) | 0 (0.0%) |
| 5 to 17 Years | 0 (0.0%) | 0 (0.0%) |
| 18 to 34 Years | 17 (8.4%) | 0 (0.0%) |
| 35 to 64 Years | 23 (24.0%) | 0 (0.0%) |
| 65 to 74 Years | 0 (0.0%) | 48 (100.0%) |
| 75 Years and over | 13 (100.0%) | 0 (0.0%) |
Disability Class by Sex by Age in Biola
Disability Class: Hearing Difficulty
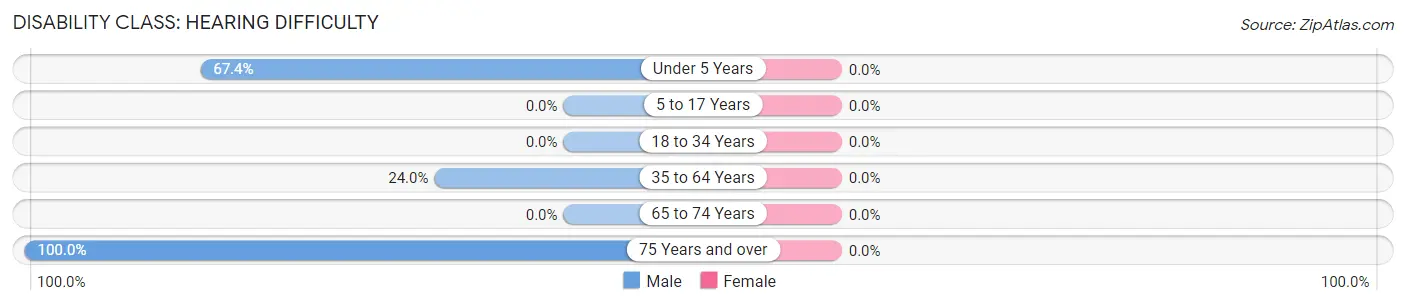
| Age Bracket | Male | Female |
| Under 5 Years | 31 (67.4%) | 0 (0.0%) |
| 5 to 17 Years | 0 (0.0%) | 0 (0.0%) |
| 18 to 34 Years | 0 (0.0%) | 0 (0.0%) |
| 35 to 64 Years | 23 (24.0%) | 0 (0.0%) |
| 65 to 74 Years | 0 (0.0%) | 0 (0.0%) |
| 75 Years and over | 13 (100.0%) | 0 (0.0%) |
Disability Class: Vision Difficulty
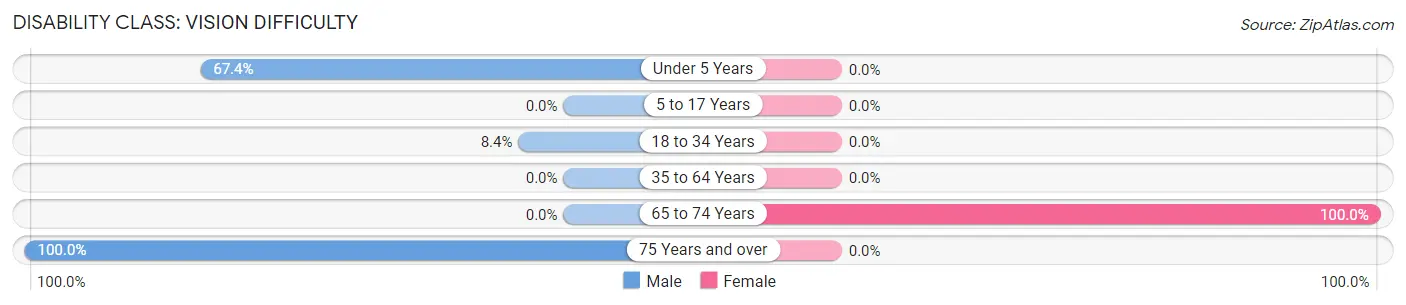
| Age Bracket | Male | Female |
| Under 5 Years | 31 (67.4%) | 0 (0.0%) |
| 5 to 17 Years | 0 (0.0%) | 0 (0.0%) |
| 18 to 34 Years | 17 (8.4%) | 0 (0.0%) |
| 35 to 64 Years | 0 (0.0%) | 0 (0.0%) |
| 65 to 74 Years | 0 (0.0%) | 48 (100.0%) |
| 75 Years and over | 13 (100.0%) | 0 (0.0%) |
Disability Class: Cognitive Difficulty
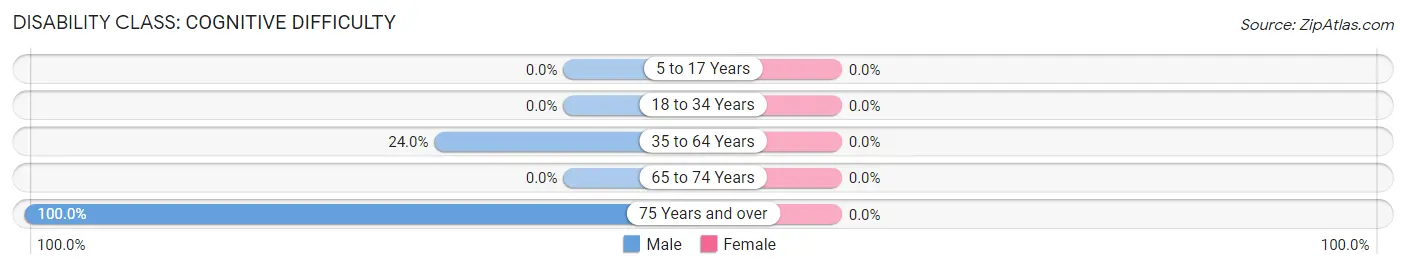
| Age Bracket | Male | Female |
| 5 to 17 Years | 0 (0.0%) | 0 (0.0%) |
| 18 to 34 Years | 0 (0.0%) | 0 (0.0%) |
| 35 to 64 Years | 23 (24.0%) | 0 (0.0%) |
| 65 to 74 Years | 0 (0.0%) | 0 (0.0%) |
| 75 Years and over | 13 (100.0%) | 0 (0.0%) |
Disability Class: Ambulatory Difficulty
| Age Bracket | Male | Female |
| 5 to 17 Years | 0 (0.0%) | 0 (0.0%) |
| 18 to 34 Years | 0 (0.0%) | 0 (0.0%) |
| 35 to 64 Years | 0 (0.0%) | 0 (0.0%) |
| 65 to 74 Years | 0 (0.0%) | 0 (0.0%) |
| 75 Years and over | 13 (100.0%) | 0 (0.0%) |
Disability Class: Self-Care Difficulty
| Age Bracket | Male | Female |
| 5 to 17 Years | 0 (0.0%) | 0 (0.0%) |
| 18 to 34 Years | 0 (0.0%) | 0 (0.0%) |
| 35 to 64 Years | 0 (0.0%) | 0 (0.0%) |
| 65 to 74 Years | 0 (0.0%) | 0 (0.0%) |
| 75 Years and over | 13 (100.0%) | 0 (0.0%) |
Technology Access in Biola
Computing Device Access in Biola
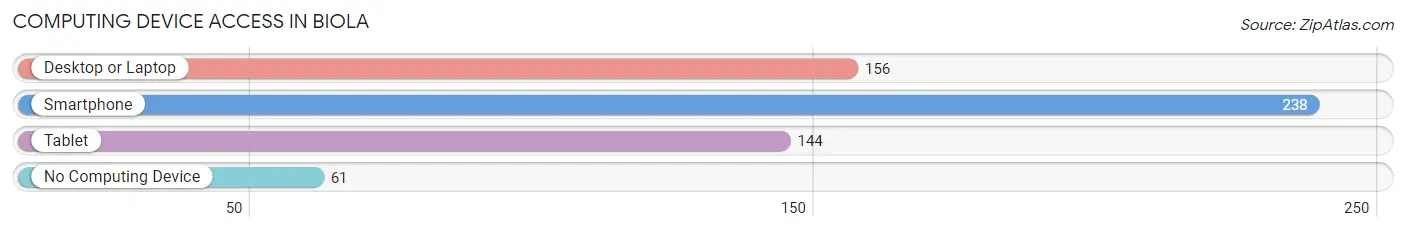
| Device Type | # Households | % Households |
| Desktop or Laptop | 156 | 49.5% |
| Smartphone | 238 | 75.6% |
| Tablet | 144 | 45.7% |
| No Computing Device | 61 | 19.4% |
| Total | 315 | 100.0% |
Internet Access in Biola
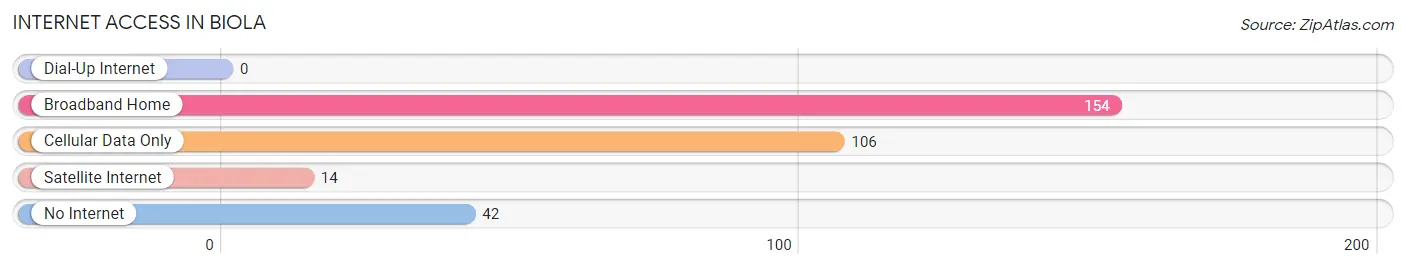
| Internet Type | # Households | % Households |
| Dial-Up Internet | 0 | 0.0% |
| Broadband Home | 154 | 48.9% |
| Cellular Data Only | 106 | 33.7% |
| Satellite Internet | 14 | 4.4% |
| No Internet | 42 | 13.3% |
| Total | 315 | 100.0% |
Biola Summary
Biola, California is a small unincorporated community located in the San Joaquin Valley of California. It is situated in Fresno County, approximately 20 miles east of Fresno. The population of Biola was estimated to be 1,845 in 2019.
History
Biola was founded in 1891 by the Southern Pacific Railroad. The town was named after the Biola family, who were early settlers in the area. The Biola family owned a large ranch in the area and the town was built around it.
The town was originally a farming community, with many of the residents working in the fields. In the early 1900s, the town began to grow as more people moved to the area. The town was incorporated in 1911 and the first post office was established in 1912.
Geography
Biola is located in the San Joaquin Valley of California, approximately 20 miles east of Fresno. The town is situated on the banks of the San Joaquin River. The area is mostly flat, with some rolling hills in the surrounding area. The climate is semi-arid, with hot summers and mild winters.
Economy
The economy of Biola is largely based on agriculture. The town is home to several large farms, which produce a variety of crops, including grapes, almonds, and cotton. The town is also home to several small businesses, including restaurants, gas stations, and convenience stores.
Demographics
As of 2019, the population of Biola was estimated to be 1,845. The population is largely Hispanic, with a small percentage of African Americans and other races. The median household income is $45,000, and the median home value is $200,000.
Conclusion
Biola, California is a small unincorporated community located in the San Joaquin Valley of California. It is situated in Fresno County, approximately 20 miles east of Fresno. The population of Biola was estimated to be 1,845 in 2019. The town was founded in 1891 by the Southern Pacific Railroad and was originally a farming community. The economy of Biola is largely based on agriculture, with many of the residents working in the fields. The population is largely Hispanic, with a small percentage of African Americans and other races. The median household income is $45,000, and the median home value is $200,000.
Common Questions
What is Per Capita Income in Biola?
Per Capita income in Biola is $13,998.
What is the Median Family Income in Biola?
Median Family Income in Biola is $38,542.
What is the Median Household income in Biola?
Median Household Income in Biola is $39,896.
What is Income or Wage Gap in Biola?
Income or Wage Gap in Biola is 64.3%.
Women in Biola earn 35.7 cents for every dollar earned by a man.
What is Inequality or Gini Index in Biola?
Inequality or Gini Index in Biola is 0.49.
What is the Total Population of Biola?
Total Population of Biola is 1,335.
What is the Total Male Population of Biola?
Total Male Population of Biola is 574.
What is the Total Female Population of Biola?
Total Female Population of Biola is 761.
What is the Ratio of Males per 100 Females in Biola?
There are 75.43 Males per 100 Females in Biola.
What is the Ratio of Females per 100 Males in Biola?
There are 132.58 Females per 100 Males in Biola.
What is the Median Population Age in Biola?
Median Population Age in Biola is 23.5 Years.
What is the Average Family Size in Biola
Average Family Size in Biola is 4.3 People.
What is the Average Household Size in Biola
Average Household Size in Biola is 4.2 People.
How Large is the Labor Force in Biola?
There are 613 People in the Labor Forcein in Biola.
What is the Percentage of People in the Labor Force in Biola?
68.6% of People are in the Labor Force in Biola.
What is the Unemployment Rate in Biola?
Unemployment Rate in Biola is 22.3%.