Bieber, CA Map & Demographics
Bieber Map
Bieber Overview
$14,548
PER CAPITA INCOME
$50,357
AVG FAMILY INCOME
$46,667
AVG HOUSEHOLD INCOME
0.20
INEQUALITY / GINI INDEX
151
TOTAL POPULATION
72
MALE POPULATION
79
FEMALE POPULATION
91.14
MALES / 100 FEMALES
109.72
FEMALES / 100 MALES
33.6
MEDIAN AGE
4.0
AVG FAMILY SIZE
2.5
AVG HOUSEHOLD SIZE
33
LABOR FORCE [ PEOPLE ]
31.1%
PERCENT IN LABOR FORCE
Bieber Zip Codes
Bieber Area Codes
Income in Bieber
Income Overview in Bieber
Per Capita Income in Bieber is $14,548, while median incomes of families and households are $50,357 and $46,667 respectively.
| Characteristic | Number | Measure |
| Per Capita Income | 151 | $14,548 |
| Median Family Income | 30 | $50,357 |
| Mean Family Income | 30 | $50,437 |
| Median Household Income | 60 | $46,667 |
| Mean Household Income | 60 | $39,307 |
| Income Deficit | 30 | $0 |
| Wage / Income Gap (%) | 151 | 0.00% |
| Wage / Income Gap ($) | 151 | 100.00¢ per $1 |
| Gini / Inequality Index | 151 | 0.20 |
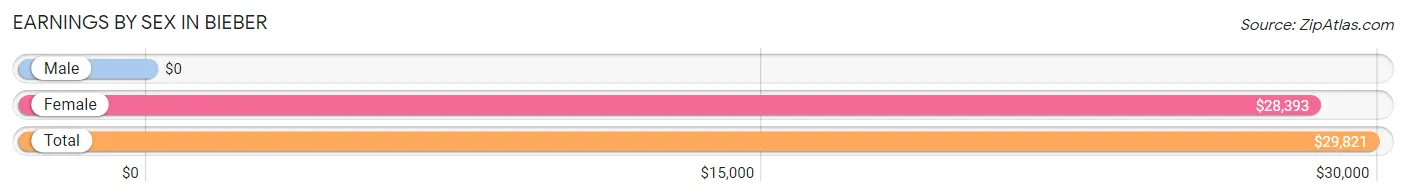
Earnings by Sex in Bieber
| Sex | Number | Average Earnings |
| Male | 14 (40.0%) | $0 |
| Female | 21 (60.0%) | $28,393 |
| Total | 35 (100.0%) | $29,821 |
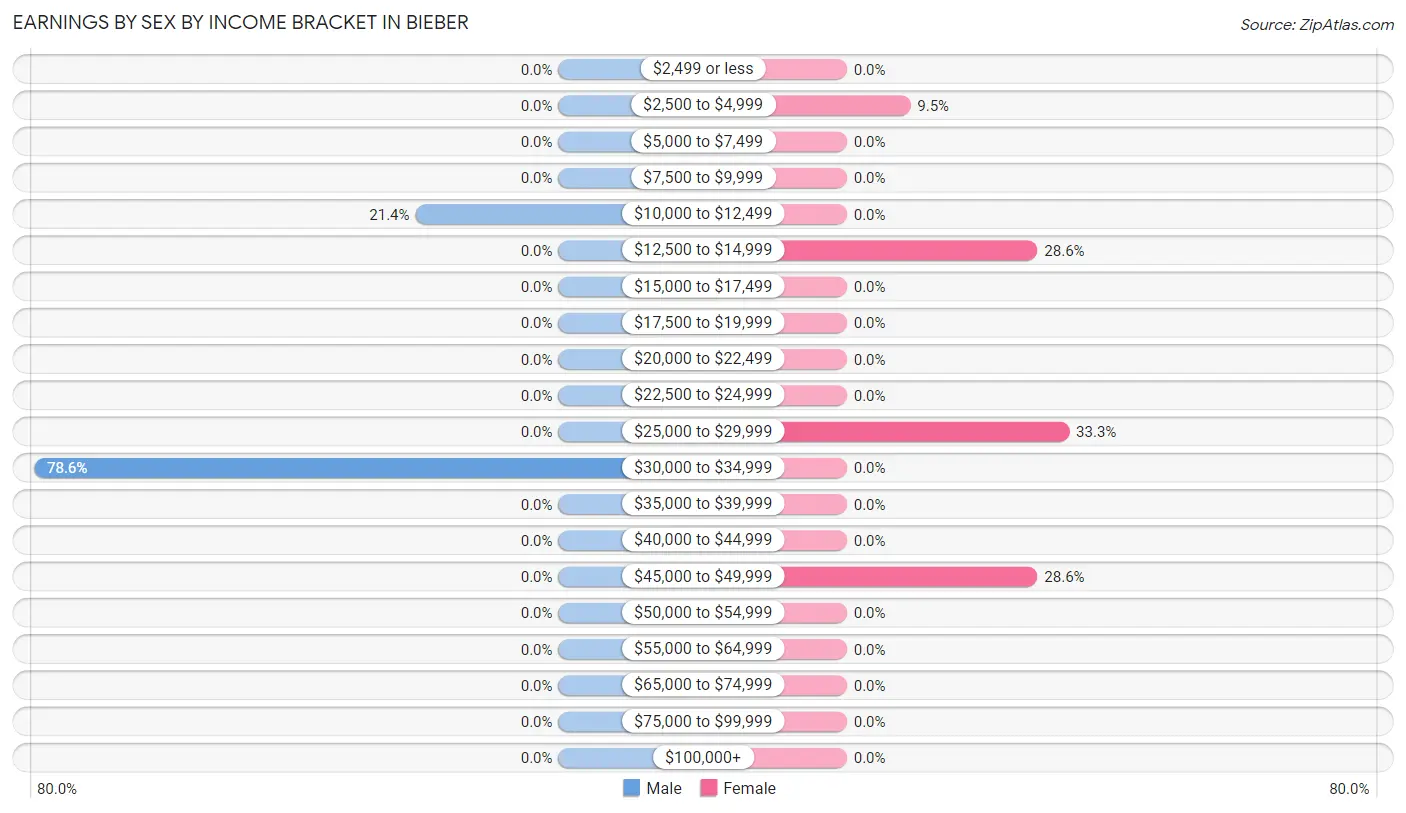
Earnings by Sex by Income Bracket in Bieber
The most common earnings brackets in Bieber are $30,000 to $34,999 for men (11 | 78.6%) and $25,000 to $29,999 for women (7 | 33.3%).
| Income | Male | Female |
| $2,499 or less | 0 (0.0%) | 0 (0.0%) |
| $2,500 to $4,999 | 0 (0.0%) | 2 (9.5%) |
| $5,000 to $7,499 | 0 (0.0%) | 0 (0.0%) |
| $7,500 to $9,999 | 0 (0.0%) | 0 (0.0%) |
| $10,000 to $12,499 | 3 (21.4%) | 0 (0.0%) |
| $12,500 to $14,999 | 0 (0.0%) | 6 (28.6%) |
| $15,000 to $17,499 | 0 (0.0%) | 0 (0.0%) |
| $17,500 to $19,999 | 0 (0.0%) | 0 (0.0%) |
| $20,000 to $22,499 | 0 (0.0%) | 0 (0.0%) |
| $22,500 to $24,999 | 0 (0.0%) | 0 (0.0%) |
| $25,000 to $29,999 | 0 (0.0%) | 7 (33.3%) |
| $30,000 to $34,999 | 11 (78.6%) | 0 (0.0%) |
| $35,000 to $39,999 | 0 (0.0%) | 0 (0.0%) |
| $40,000 to $44,999 | 0 (0.0%) | 0 (0.0%) |
| $45,000 to $49,999 | 0 (0.0%) | 6 (28.6%) |
| $50,000 to $54,999 | 0 (0.0%) | 0 (0.0%) |
| $55,000 to $64,999 | 0 (0.0%) | 0 (0.0%) |
| $65,000 to $74,999 | 0 (0.0%) | 0 (0.0%) |
| $75,000 to $99,999 | 0 (0.0%) | 0 (0.0%) |
| $100,000+ | 0 (0.0%) | 0 (0.0%) |
| Total | 14 (100.0%) | 21 (100.0%) |
Earnings by Sex by Educational Attainment in Bieber
| Educational Attainment | Male Income | Female Income |
| Less than High School | - | - |
| High School Diploma | - | - |
| College or Associate's Degree | - | - |
| Bachelor's Degree | - | - |
| Graduate Degree | - | - |
| Total | - | - |
Family Income in Bieber
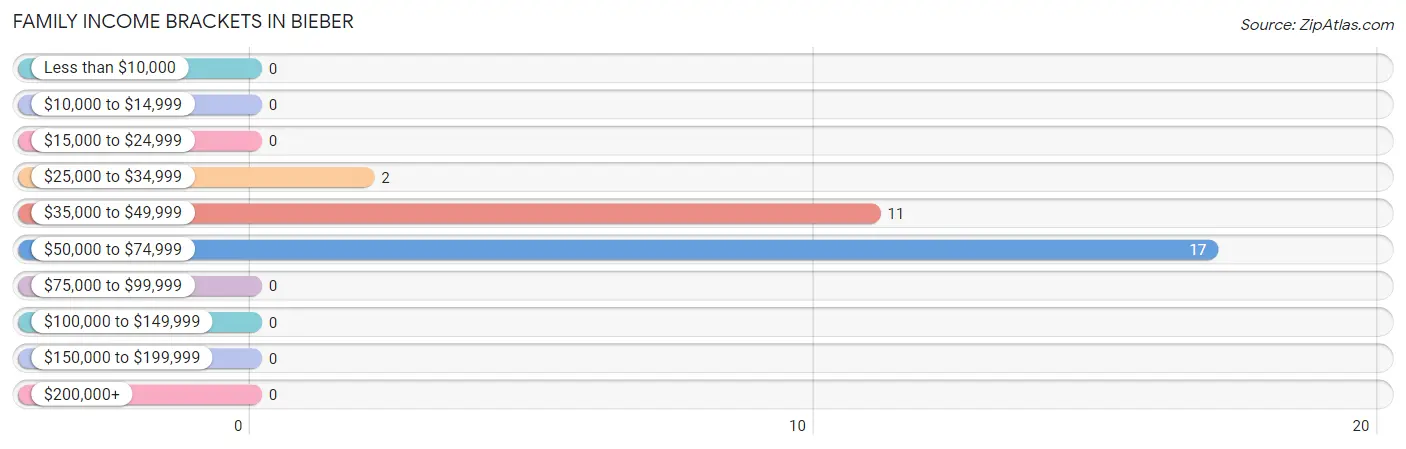
Family Income Brackets in Bieber
According to the Bieber family income data, there are 17 families falling into the $50,000 to $74,999 income range, which is the most common income bracket and makes up 56.7% of all families.
| Income Bracket | # Families | % Families |
| Less than $10,000 | 0 | 0.0% |
| $10,000 to $14,999 | 0 | 0.0% |
| $15,000 to $24,999 | 0 | 0.0% |
| $25,000 to $34,999 | 2 | 6.7% |
| $35,000 to $49,999 | 11 | 36.7% |
| $50,000 to $74,999 | 17 | 56.7% |
| $75,000 to $99,999 | 0 | 0.0% |
| $100,000 to $149,999 | 0 | 0.0% |
| $150,000 to $199,999 | 0 | 0.0% |
| $200,000+ | 0 | 0.0% |
Family Income by Famaliy Size in Bieber
| Income Bracket | # Families | Median Income |
| 2-Person Families | 2 (6.7%) | $0 |
| 3-Person Families | 17 (56.7%) | $0 |
| 4-Person Families | 0 (0.0%) | $0 |
| 5-Person Families | 0 (0.0%) | $0 |
| 6-Person Families | 11 (36.7%) | $0 |
| 7+ Person Families | 0 (0.0%) | $0 |
| Total | 30 (100.0%) | $50,357 |
Family Income by Number of Earners in Bieber
| Number of Earners | # Families | Median Income |
| No Earners | 2 (6.7%) | $0 |
| 1 Earner | 25 (83.3%) | $0 |
| 2 Earners | 3 (10.0%) | $0 |
| 3+ Earners | 0 (0.0%) | $0 |
| Total | 30 (100.0%) | $50,357 |
Household Income in Bieber
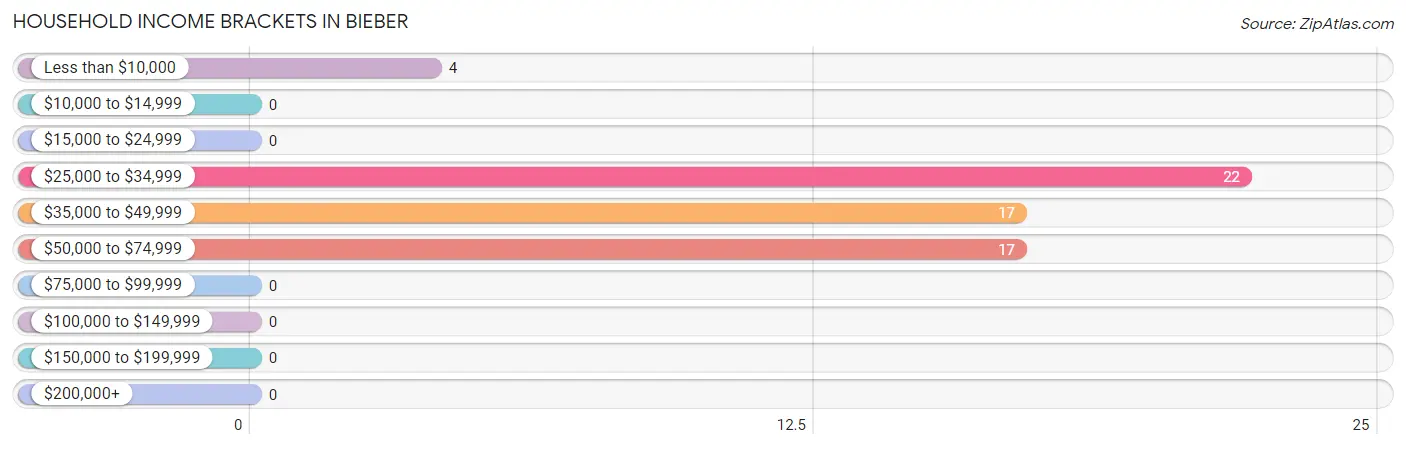
Household Income Brackets in Bieber
With 22 households falling in the category, the $25,000 to $34,999 income range is the most frequent in Bieber, accounting for 36.7% of all households.
| Income Bracket | # Households | % Households |
| Less than $10,000 | 4 | 6.7% |
| $10,000 to $14,999 | 0 | 0.0% |
| $15,000 to $24,999 | 0 | 0.0% |
| $25,000 to $34,999 | 22 | 36.7% |
| $35,000 to $49,999 | 17 | 28.3% |
| $50,000 to $74,999 | 17 | 28.3% |
| $75,000 to $99,999 | 0 | 0.0% |
| $100,000 to $149,999 | 0 | 0.0% |
| $150,000 to $199,999 | 0 | 0.0% |
| $200,000+ | 0 | 0.0% |
Household Income by Householder Age in Bieber
The median household income in Bieber is $46,667, with the highest median household income of $46,458 found in the 45 to 64 years age bracket for the primary householder. A total of 33 households (55.0%) fall into this category.
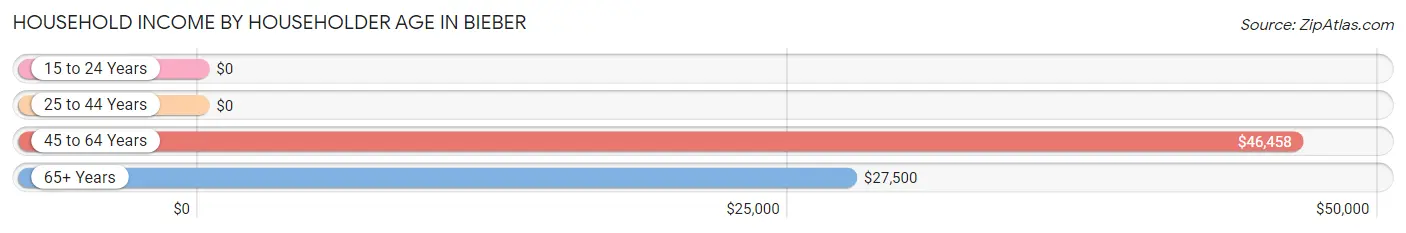
| Income Bracket | # Households | Median Income |
| 15 to 24 Years | 0 (0.0%) | $0 |
| 25 to 44 Years | 11 (18.3%) | $0 |
| 45 to 64 Years | 33 (55.0%) | $46,458 |
| 65+ Years | 16 (26.7%) | $27,500 |
| Total | 60 (100.0%) | $46,667 |
Poverty in Bieber
Income Below Poverty by Sex and Age in Bieber
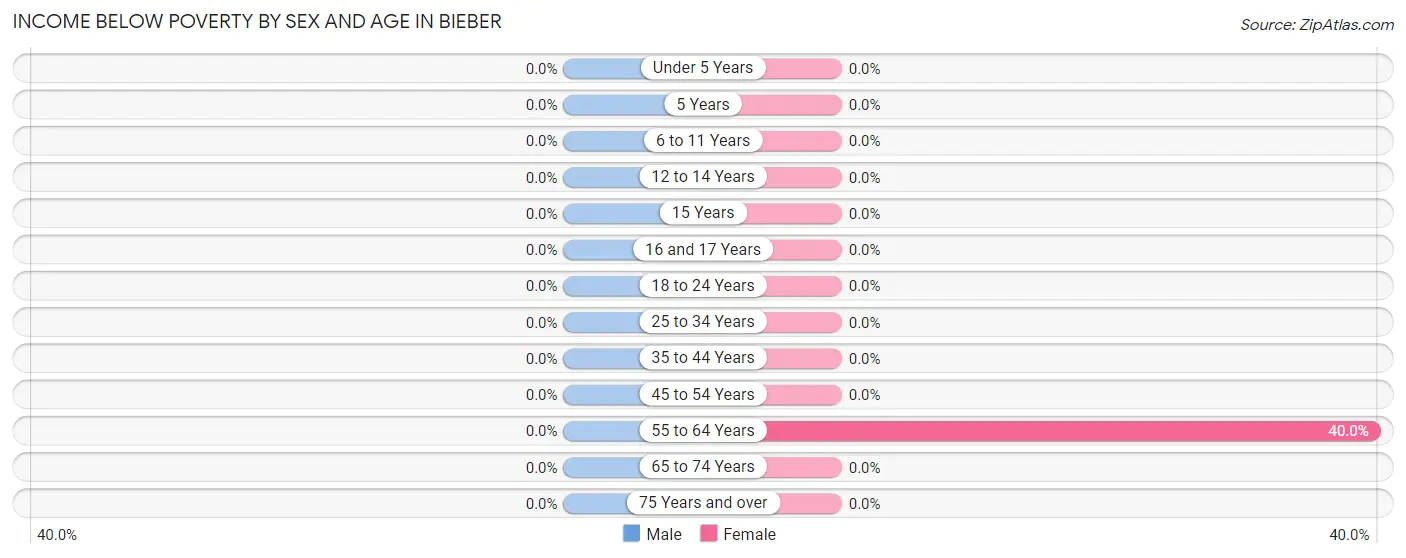
| Age Bracket | Male | Female |
| Under 5 Years | 0 (0.0%) | 0 (0.0%) |
| 5 Years | 0 (0.0%) | 0 (0.0%) |
| 6 to 11 Years | 0 (0.0%) | 0 (0.0%) |
| 12 to 14 Years | 0 (0.0%) | 0 (0.0%) |
| 15 Years | 0 (0.0%) | 0 (0.0%) |
| 16 and 17 Years | 0 (0.0%) | 0 (0.0%) |
| 18 to 24 Years | 0 (0.0%) | 0 (0.0%) |
| 25 to 34 Years | 0 (0.0%) | 0 (0.0%) |
| 35 to 44 Years | 0 (0.0%) | 0 (0.0%) |
| 45 to 54 Years | 0 (0.0%) | 0 (0.0%) |
| 55 to 64 Years | 0 (0.0%) | 4 (40.0%) |
| 65 to 74 Years | 0 (0.0%) | 0 (0.0%) |
| 75 Years and over | 0 (0.0%) | 0 (0.0%) |
| Total | 0 (0.0%) | 4 (5.1%) |
Income Above Poverty by Sex and Age in Bieber
According to the poverty statistics in Bieber, males aged under 5 years and females aged under 5 years are the age groups that are most secure financially, with 100.0% of males and 100.0% of females in these age groups living above the poverty line.
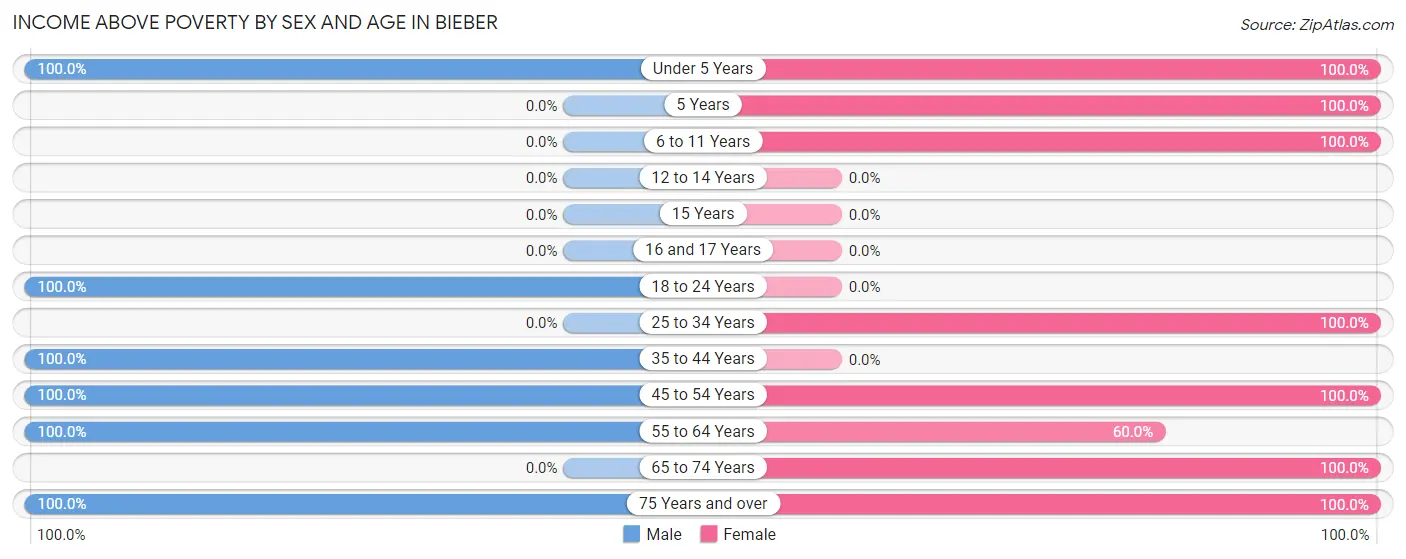
| Age Bracket | Male | Female |
| Under 5 Years | 14 (100.0%) | 7 (100.0%) |
| 5 Years | 0 (0.0%) | 12 (100.0%) |
| 6 to 11 Years | 0 (0.0%) | 12 (100.0%) |
| 12 to 14 Years | 0 (0.0%) | 0 (0.0%) |
| 15 Years | 0 (0.0%) | 0 (0.0%) |
| 16 and 17 Years | 0 (0.0%) | 0 (0.0%) |
| 18 to 24 Years | 18 (100.0%) | 0 (0.0%) |
| 25 to 34 Years | 0 (0.0%) | 15 (100.0%) |
| 35 to 44 Years | 11 (100.0%) | 0 (0.0%) |
| 45 to 54 Years | 14 (100.0%) | 7 (100.0%) |
| 55 to 64 Years | 9 (100.0%) | 6 (60.0%) |
| 65 to 74 Years | 0 (0.0%) | 10 (100.0%) |
| 75 Years and over | 6 (100.0%) | 6 (100.0%) |
| Total | 72 (100.0%) | 75 (94.9%) |
Income Below Poverty Among Married-Couple Families in Bieber
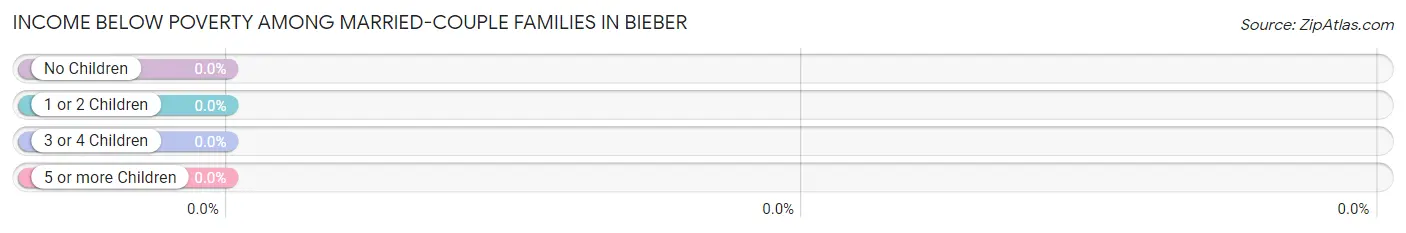
| Children | Above Poverty | Below Poverty |
| No Children | 19 (100.0%) | 0 (0.0%) |
| 1 or 2 Children | 0 (0.0%) | 0 (0.0%) |
| 3 or 4 Children | 11 (100.0%) | 0 (0.0%) |
| 5 or more Children | 0 (0.0%) | 0 (0.0%) |
| Total | 30 (100.0%) | 0 (0.0%) |
Income Below Poverty Among Single-Parent Households in Bieber
| Children | Single Father | Single Mother |
| No Children | 0 (0.0%) | 0 (0.0%) |
| 1 or 2 Children | 0 (0.0%) | 0 (0.0%) |
| 3 or 4 Children | 0 (0.0%) | 0 (0.0%) |
| 5 or more Children | 0 (0.0%) | 0 (0.0%) |
| Total | 0 (0.0%) | 0 (0.0%) |
Income Below Poverty Among Married-Couple vs Single-Parent Households in Bieber
| Children | Married-Couple Families | Single-Parent Households |
| No Children | 0 (0.0%) | 0 (0.0%) |
| 1 or 2 Children | 0 (0.0%) | 0 (0.0%) |
| 3 or 4 Children | 0 (0.0%) | 0 (0.0%) |
| 5 or more Children | 0 (0.0%) | 0 (0.0%) |
| Total | 0 (0.0%) | 0 (0.0%) |
Race in Bieber
The most populous races in Bieber are White / Caucasian (147 | 97.4%), Hispanic or Latino (4 | 2.6%), and Two or more Races (4 | 2.6%).
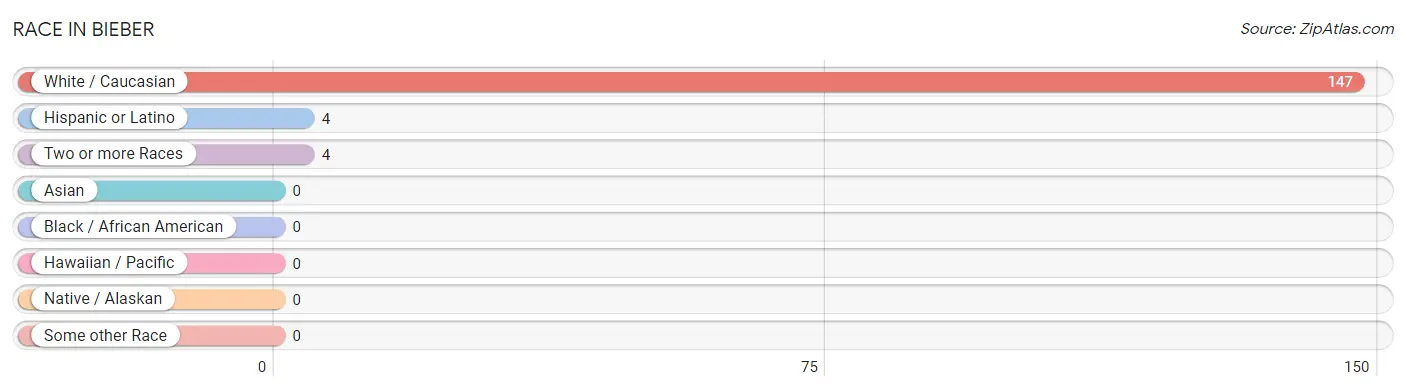
| Race | # Population | % Population |
| Asian | 0 | 0.0% |
| Black / African American | 0 | 0.0% |
| Hawaiian / Pacific | 0 | 0.0% |
| Hispanic or Latino | 4 | 2.6% |
| Native / Alaskan | 0 | 0.0% |
| White / Caucasian | 147 | 97.4% |
| Two or more Races | 4 | 2.6% |
| Some other Race | 0 | 0.0% |
| Total | 151 | 100.0% |
Ancestry in Bieber
The most populous ancestries reported in Bieber are Scottish (54 | 35.8%), Irish (17 | 11.3%), European (15 | 9.9%), German (5 | 3.3%), and Mexican (4 | 2.6%), together accounting for 62.9% of all Bieber residents.
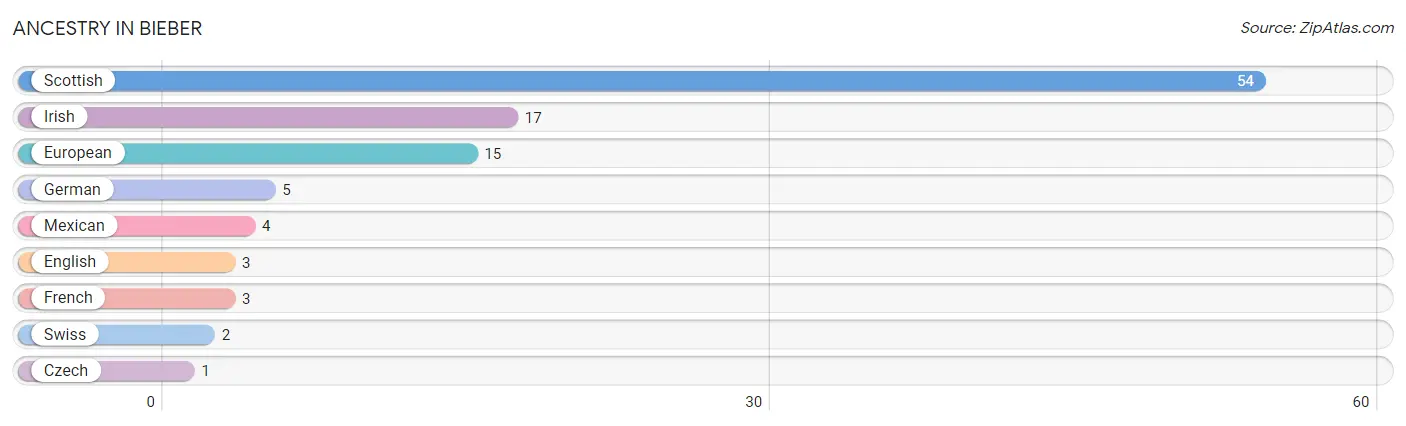
| Ancestry | # Population | % Population |
| Czech | 1 | 0.7% |
| English | 3 | 2.0% |
| European | 15 | 9.9% |
| French | 3 | 2.0% |
| German | 5 | 3.3% |
| Irish | 17 | 11.3% |
| Mexican | 4 | 2.6% |
| Scottish | 54 | 35.8% |
| Swiss | 2 | 1.3% | View All 9 Rows |
Immigrants in Bieber
The most numerous immigrant groups reported in Bieber came from Central America (4 | 2.6%), Latin America (4 | 2.6%), and Mexico (4 | 2.6%), together accounting for 8.0% of all Bieber residents.
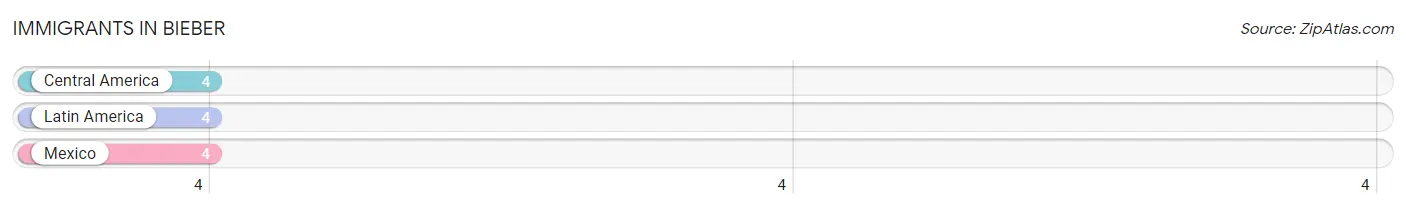
| Immigration Origin | # Population | % Population |
| Central America | 4 | 2.6% |
| Latin America | 4 | 2.6% |
| Mexico | 4 | 2.6% | View All 3 Rows |
Sex and Age in Bieber
Sex and Age in Bieber
The most populous age groups in Bieber are 15 to 19 Years (18 | 25.0%) for men and 5 to 9 Years (24 | 30.4%) for women.
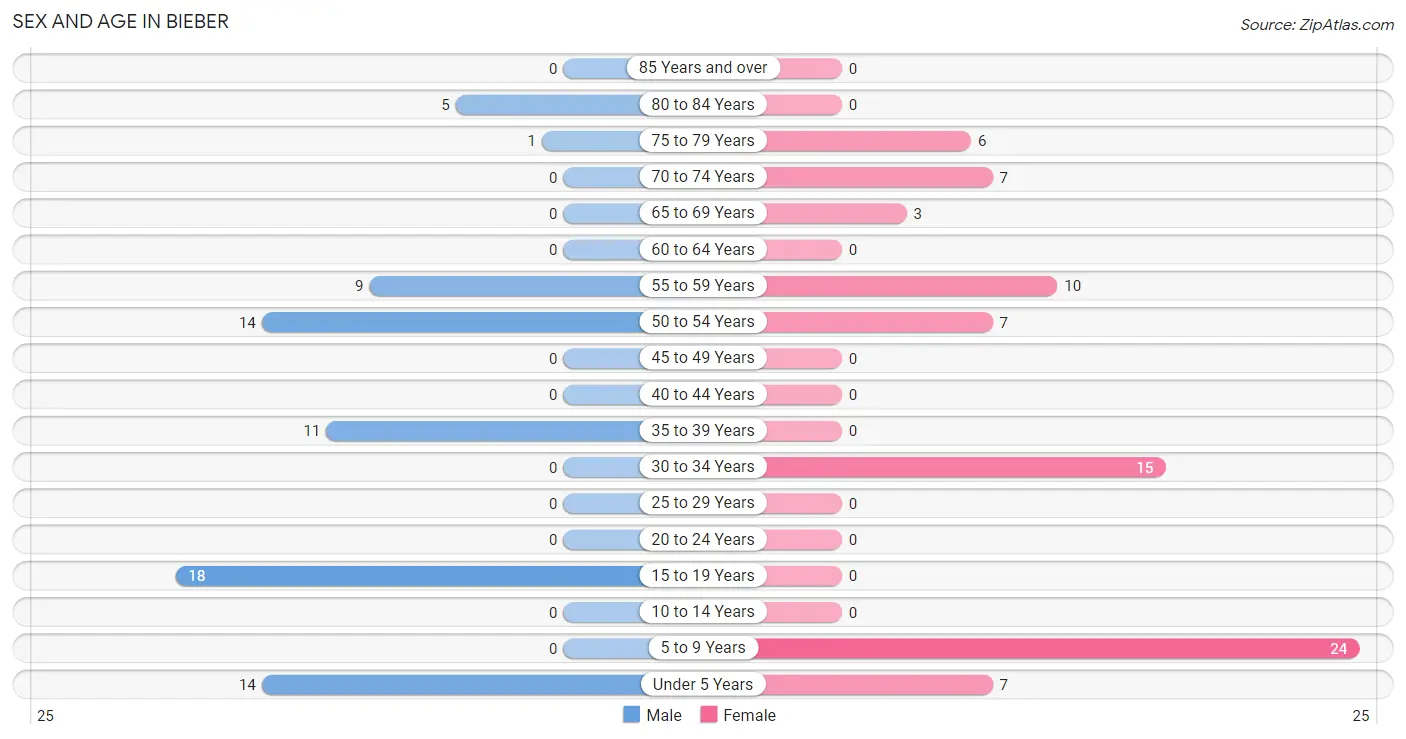
| Age Bracket | Male | Female |
| Under 5 Years | 14 (19.4%) | 7 (8.9%) |
| 5 to 9 Years | 0 (0.0%) | 24 (30.4%) |
| 10 to 14 Years | 0 (0.0%) | 0 (0.0%) |
| 15 to 19 Years | 18 (25.0%) | 0 (0.0%) |
| 20 to 24 Years | 0 (0.0%) | 0 (0.0%) |
| 25 to 29 Years | 0 (0.0%) | 0 (0.0%) |
| 30 to 34 Years | 0 (0.0%) | 15 (19.0%) |
| 35 to 39 Years | 11 (15.3%) | 0 (0.0%) |
| 40 to 44 Years | 0 (0.0%) | 0 (0.0%) |
| 45 to 49 Years | 0 (0.0%) | 0 (0.0%) |
| 50 to 54 Years | 14 (19.4%) | 7 (8.9%) |
| 55 to 59 Years | 9 (12.5%) | 10 (12.7%) |
| 60 to 64 Years | 0 (0.0%) | 0 (0.0%) |
| 65 to 69 Years | 0 (0.0%) | 3 (3.8%) |
| 70 to 74 Years | 0 (0.0%) | 7 (8.9%) |
| 75 to 79 Years | 1 (1.4%) | 6 (7.6%) |
| 80 to 84 Years | 5 (6.9%) | 0 (0.0%) |
| 85 Years and over | 0 (0.0%) | 0 (0.0%) |
| Total | 72 (100.0%) | 79 (100.0%) |
Families and Households in Bieber
Median Family Size in Bieber
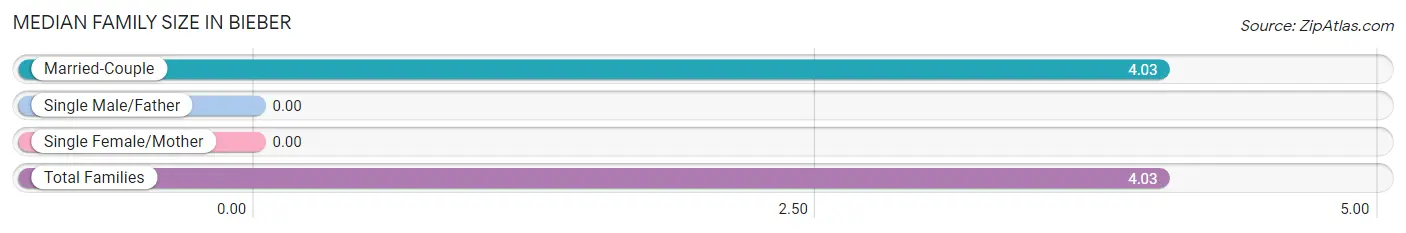
| Family Type | # Families | Family Size |
| Married-Couple | 30 (100.0%) | 4.03 |
| Single Male/Father | 0 (0.0%) | - |
| Single Female/Mother | 0 (0.0%) | - |
| Total Families | 30 (100.0%) | 4.03 |
Median Household Size in Bieber
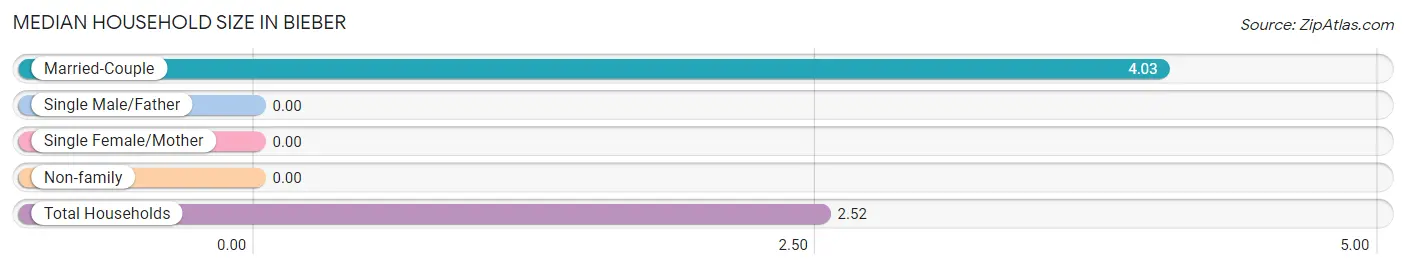
| Household Type | # Households | Household Size |
| Married-Couple | 30 (50.0%) | 4.03 |
| Single Male/Father | 0 (0.0%) | - |
| Single Female/Mother | 0 (0.0%) | - |
| Non-family | 30 (50.0%) | - |
| Total Households | 60 (100.0%) | 2.52 |
Household Size by Marriage Status in Bieber
Out of a total of 60 households in Bieber, 30 (50.0%) are family households, while 30 (50.0%) are nonfamily households. The most numerous type of family households are 3-person households, comprising 17, and the most common type of nonfamily households are 1-person households, comprising 30.
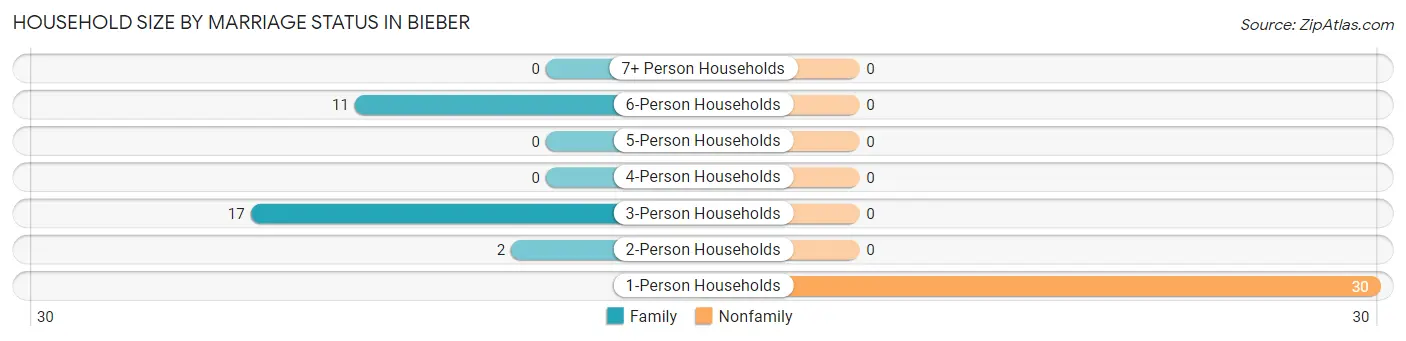
| Household Size | Family Households | Nonfamily Households |
| 1-Person Households | - | 30 (50.0%) |
| 2-Person Households | 2 (3.3%) | 0 (0.0%) |
| 3-Person Households | 17 (28.3%) | 0 (0.0%) |
| 4-Person Households | 0 (0.0%) | 0 (0.0%) |
| 5-Person Households | 0 (0.0%) | 0 (0.0%) |
| 6-Person Households | 11 (18.3%) | 0 (0.0%) |
| 7+ Person Households | 0 (0.0%) | 0 (0.0%) |
| Total | 30 (50.0%) | 30 (50.0%) |
Female Fertility in Bieber
Fertility by Age in Bieber
Average fertility rate in Bieber is 600.0 births per 1,000 women. Women in the age bracket of 20 to 34 years have the highest fertility rate with 600.0 births per 1,000 women. Women in the age bracket of 20 to 34 years acount for 100.0% of all women with births.
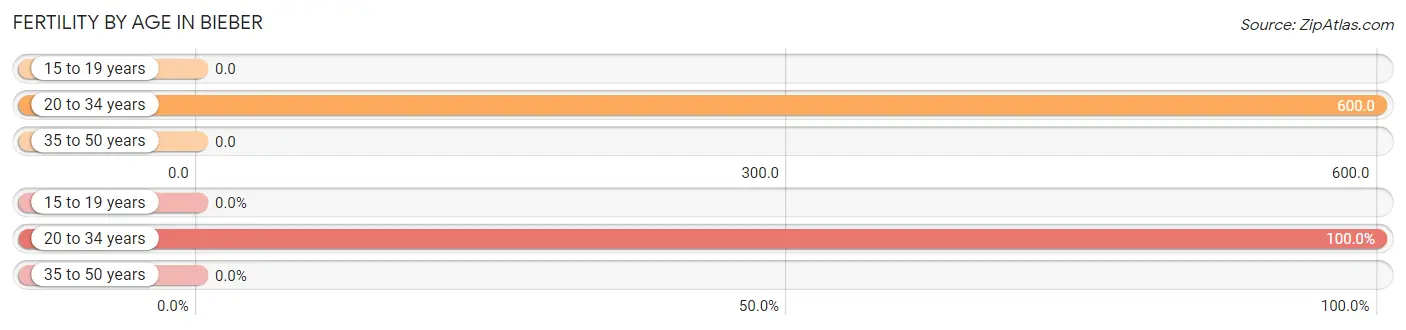
| Age Bracket | Women with Births | Births / 1,000 Women |
| 15 to 19 years | 0 (0.0%) | 0.0 |
| 20 to 34 years | 9 (100.0%) | 600.0 |
| 35 to 50 years | 0 (0.0%) | 0.0 |
| Total | 9 (100.0%) | 600.0 |
Fertility by Age by Marriage Status in Bieber
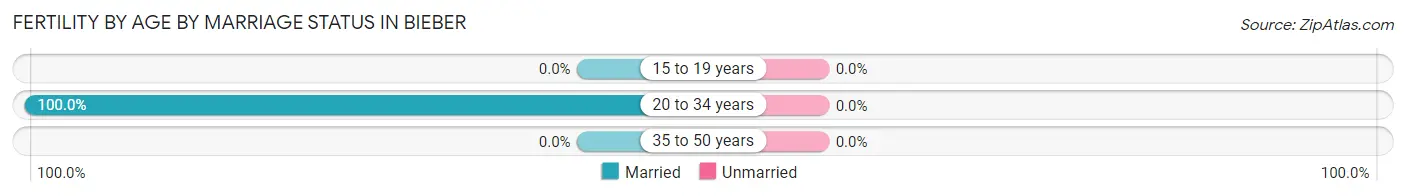
| Age Bracket | Married | Unmarried |
| 15 to 19 years | 0 (0.0%) | 0 (0.0%) |
| 20 to 34 years | 9 (100.0%) | 0 (0.0%) |
| 35 to 50 years | 0 (0.0%) | 0 (0.0%) |
| Total | 9 (100.0%) | 0 (0.0%) |
Fertility by Education in Bieber
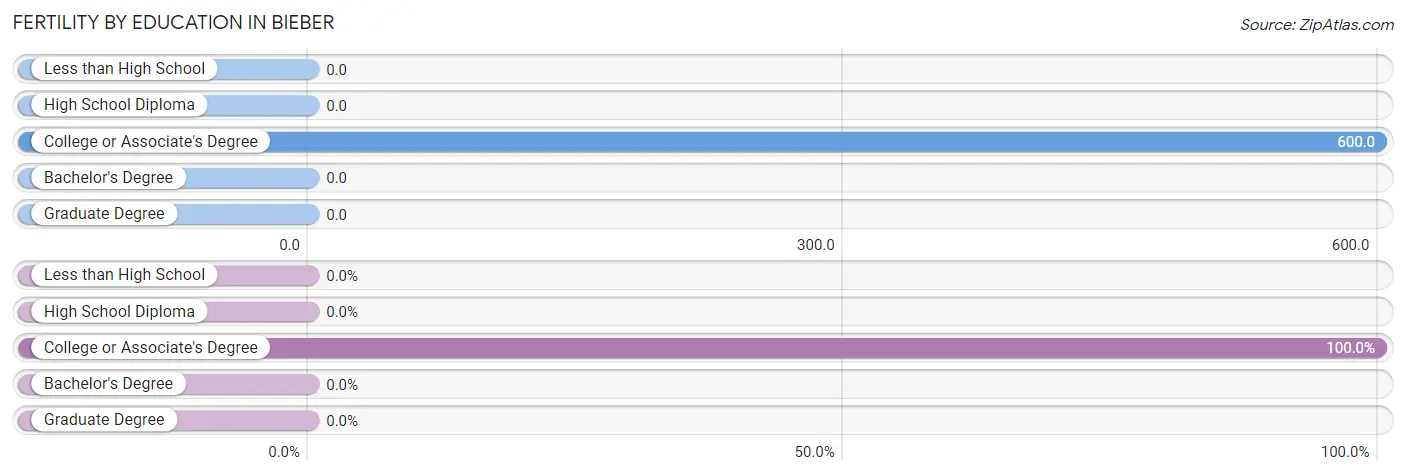
| Educational Attainment | Women with Births | Births / 1,000 Women |
| Less than High School | 0 (0.0%) | 0.0 |
| High School Diploma | 0 (0.0%) | 0.0 |
| College or Associate's Degree | 9 (100.0%) | 600.0 |
| Bachelor's Degree | 0 (0.0%) | 0.0 |
| Graduate Degree | 0 (0.0%) | 0.0 |
| Total | 9 (100.0%) | 600.0 |
Fertility by Education by Marriage Status in Bieber
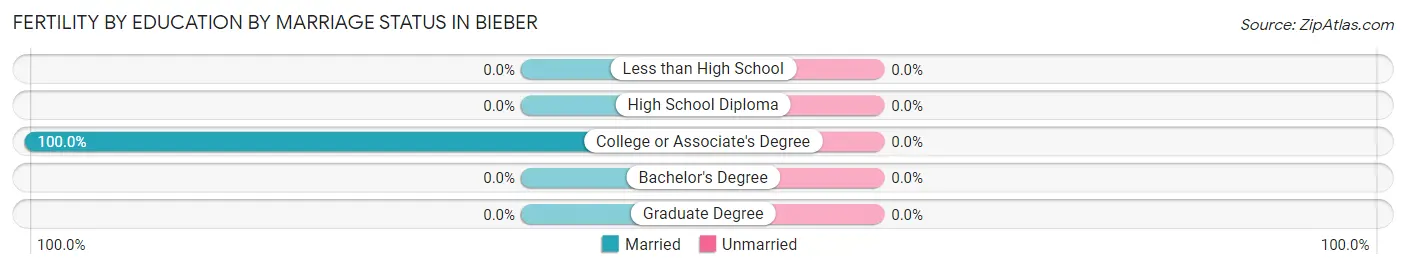
| Educational Attainment | Married | Unmarried |
| Less than High School | 0 (0.0%) | 0 (0.0%) |
| High School Diploma | 0 (0.0%) | 0 (0.0%) |
| College or Associate's Degree | 9 (100.0%) | 0 (0.0%) |
| Bachelor's Degree | 0 (0.0%) | 0 (0.0%) |
| Graduate Degree | 0 (0.0%) | 0 (0.0%) |
| Total | 9 (100.0%) | 0 (0.0%) |
Employment Characteristics in Bieber
Employment by Class of Employer in Bieber
Among the 33 employed individuals in Bieber, private company employees (12 | 36.4%), local government employees (11 | 33.3%), and not-for-profit organizations (7 | 21.2%) make up the most common classes of employment.
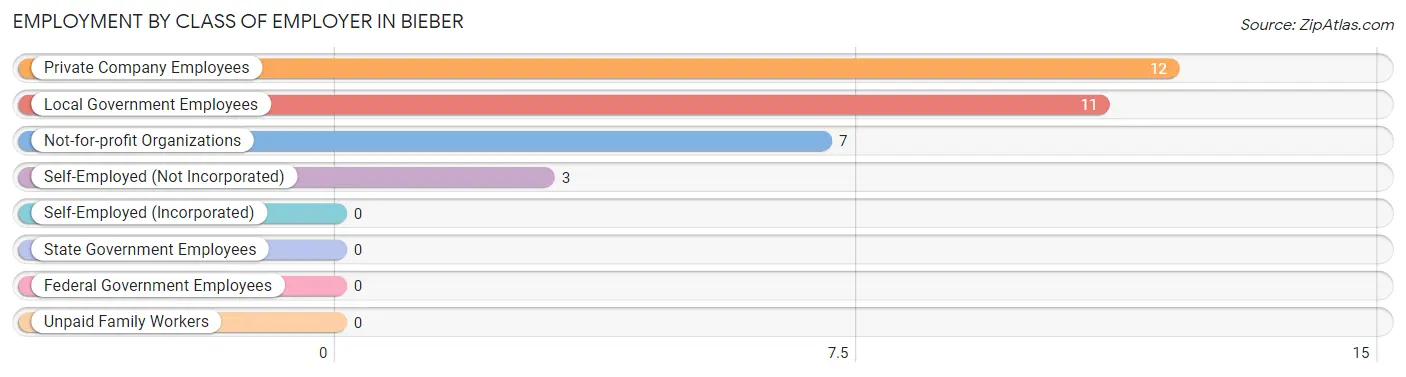
| Employer Class | # Employees | % Employees |
| Private Company Employees | 12 | 36.4% |
| Self-Employed (Incorporated) | 0 | 0.0% |
| Self-Employed (Not Incorporated) | 3 | 9.1% |
| Not-for-profit Organizations | 7 | 21.2% |
| Local Government Employees | 11 | 33.3% |
| State Government Employees | 0 | 0.0% |
| Federal Government Employees | 0 | 0.0% |
| Unpaid Family Workers | 0 | 0.0% |
| Total | 33 | 100.0% |
Employment Status by Age in Bieber
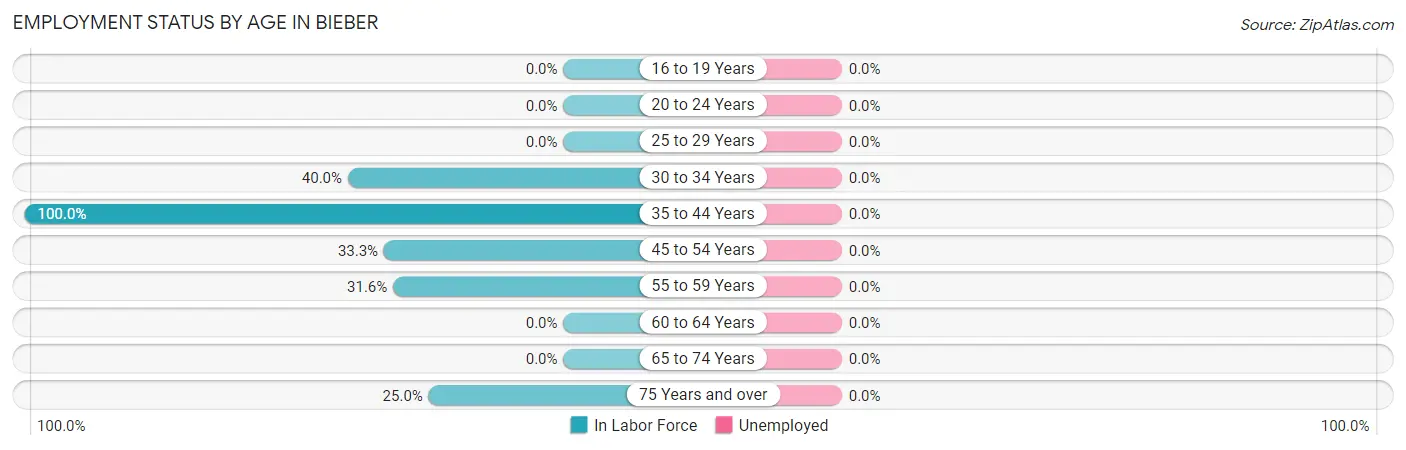
| Age Bracket | In Labor Force | Unemployed |
| 16 to 19 Years | 0 (0.0%) | 0 (0.0%) |
| 20 to 24 Years | 0 (0.0%) | 0 (0.0%) |
| 25 to 29 Years | 0 (0.0%) | 0 (0.0%) |
| 30 to 34 Years | 6 (40.0%) | 0 (0.0%) |
| 35 to 44 Years | 11 (100.0%) | 0 (0.0%) |
| 45 to 54 Years | 7 (33.3%) | 0 (0.0%) |
| 55 to 59 Years | 6 (31.6%) | 0 (0.0%) |
| 60 to 64 Years | 0 (0.0%) | 0 (0.0%) |
| 65 to 74 Years | 0 (0.0%) | 0 (0.0%) |
| 75 Years and over | 3 (25.0%) | 0 (0.0%) |
| Total | 33 (31.1%) | 0 (0.0%) |
Employment Status by Educational Attainment in Bieber
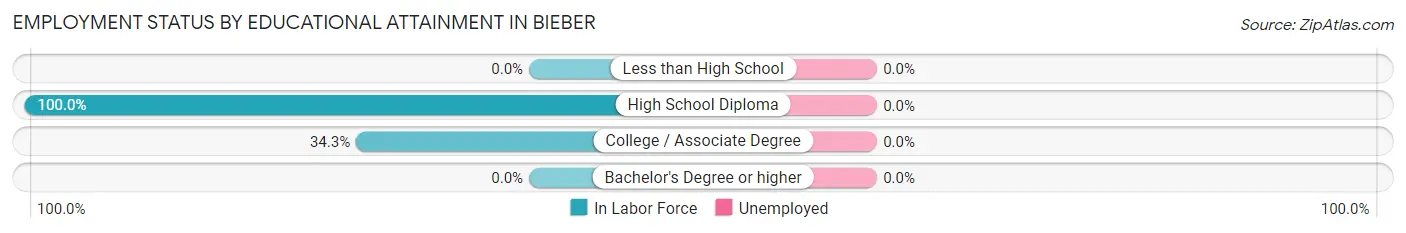
| Educational Attainment | In Labor Force | Unemployed |
| Less than High School | 0 (0.0%) | 0 (0.0%) |
| High School Diploma | 18 (100.0%) | 0 (0.0%) |
| College / Associate Degree | 12 (34.3%) | 0 (0.0%) |
| Bachelor's Degree or higher | 0 (0.0%) | 0 (0.0%) |
| Total | 30 (45.5%) | 0 (0.0%) |
Employment Occupations by Sex in Bieber
Management, Business, Science and Arts Occupations
The most common Management, Business, Science and Arts occupations in Bieber are Health Diagnosing & Treating (6 | 18.2%), and Management (3 | 9.1%).
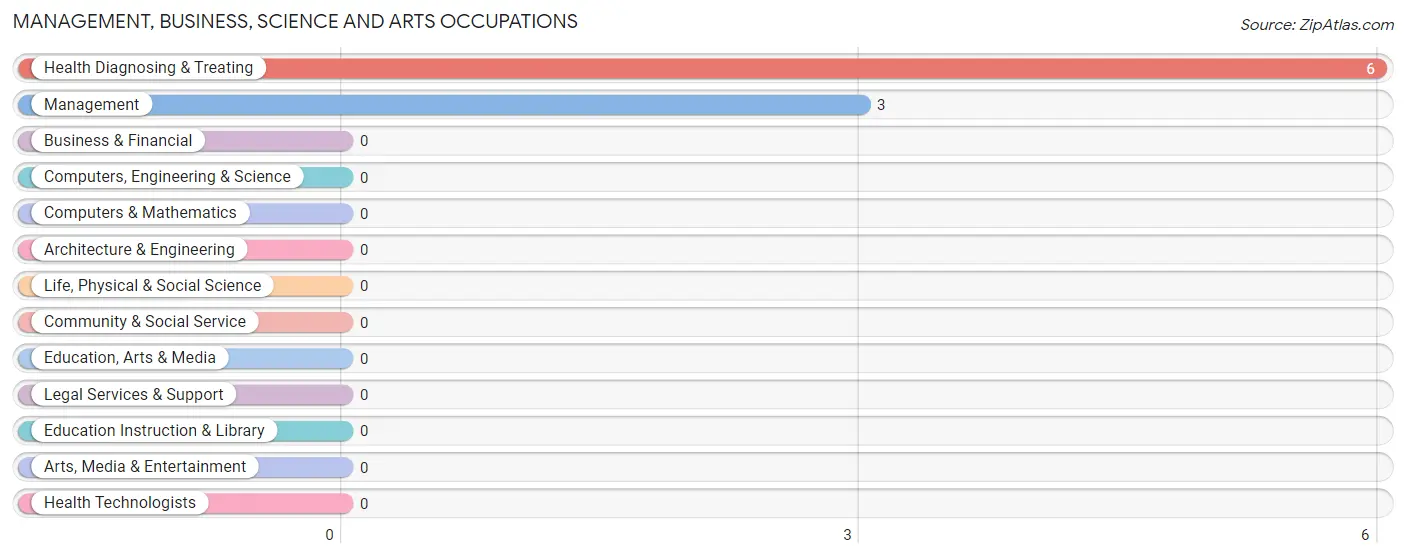
Management, Business, Science and Arts Occupations by Sex
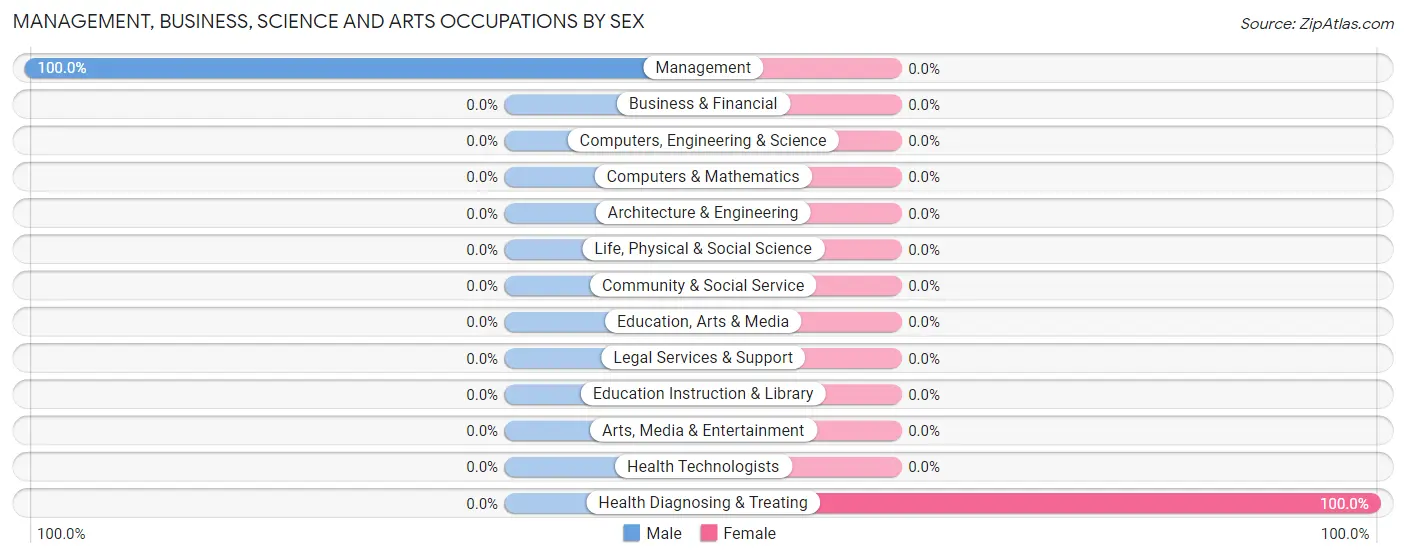
| Occupation | Male | Female |
| Management | 3 (100.0%) | 0 (0.0%) |
| Business & Financial | 0 (0.0%) | 0 (0.0%) |
| Computers, Engineering & Science | 0 (0.0%) | 0 (0.0%) |
| Computers & Mathematics | 0 (0.0%) | 0 (0.0%) |
| Architecture & Engineering | 0 (0.0%) | 0 (0.0%) |
| Life, Physical & Social Science | 0 (0.0%) | 0 (0.0%) |
| Community & Social Service | 0 (0.0%) | 0 (0.0%) |
| Education, Arts & Media | 0 (0.0%) | 0 (0.0%) |
| Legal Services & Support | 0 (0.0%) | 0 (0.0%) |
| Education Instruction & Library | 0 (0.0%) | 0 (0.0%) |
| Arts, Media & Entertainment | 0 (0.0%) | 0 (0.0%) |
| Health Diagnosing & Treating | 0 (0.0%) | 6 (100.0%) |
| Health Technologists | 0 (0.0%) | 0 (0.0%) |
| Total (Category) | 3 (33.3%) | 6 (66.7%) |
| Total (Overall) | 14 (42.4%) | 19 (57.6%) |
Services Occupations
The most common Services occupations in Bieber are Security & Protection (11 | 33.3%), Firefighting & Prevention (11 | 33.3%), and Cleaning & Maintenance (6 | 18.2%).
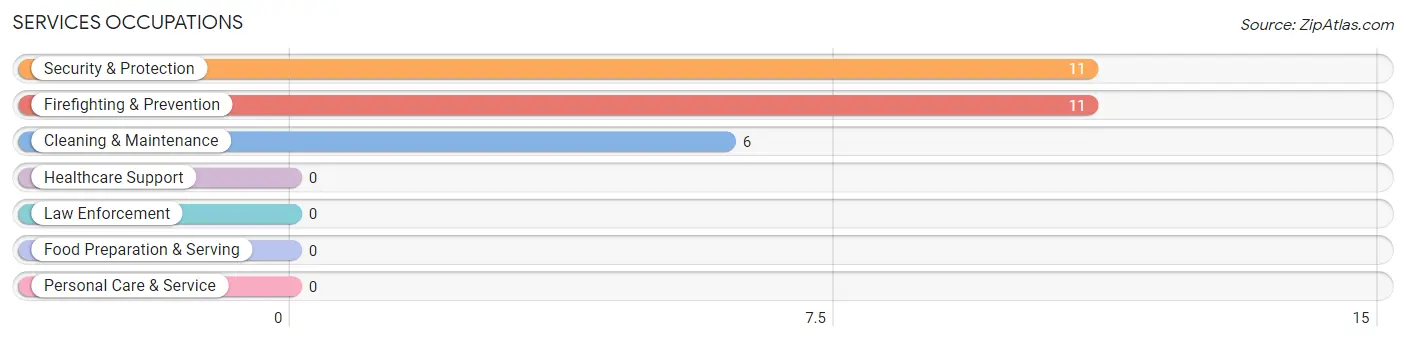
Services Occupations by Sex
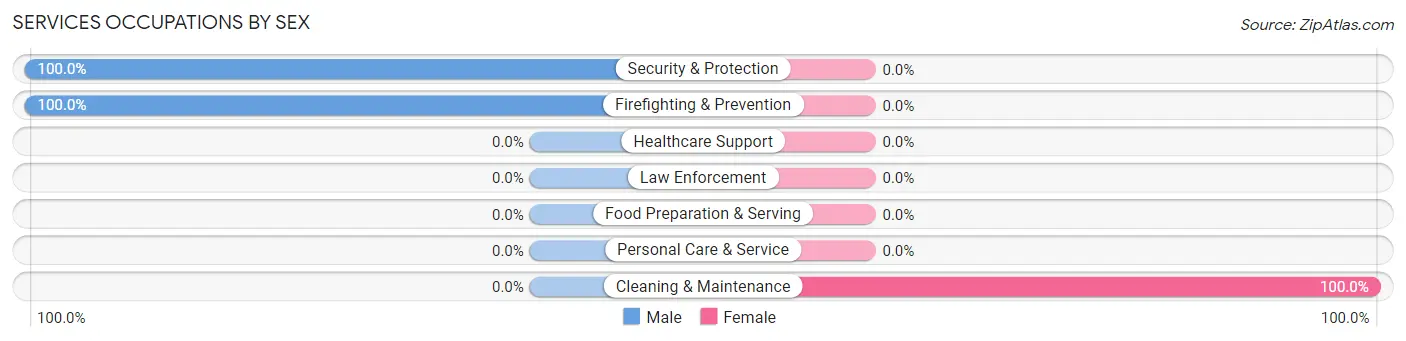
| Occupation | Male | Female |
| Healthcare Support | 0 (0.0%) | 0 (0.0%) |
| Security & Protection | 11 (100.0%) | 0 (0.0%) |
| Firefighting & Prevention | 11 (100.0%) | 0 (0.0%) |
| Law Enforcement | 0 (0.0%) | 0 (0.0%) |
| Food Preparation & Serving | 0 (0.0%) | 0 (0.0%) |
| Cleaning & Maintenance | 0 (0.0%) | 6 (100.0%) |
| Personal Care & Service | 0 (0.0%) | 0 (0.0%) |
| Total (Category) | 11 (64.7%) | 6 (35.3%) |
| Total (Overall) | 14 (42.4%) | 19 (57.6%) |
Sales and Office Occupations
The most common Sales and Office occupations in Bieber are , and Office & Administration (7 | 21.2%).
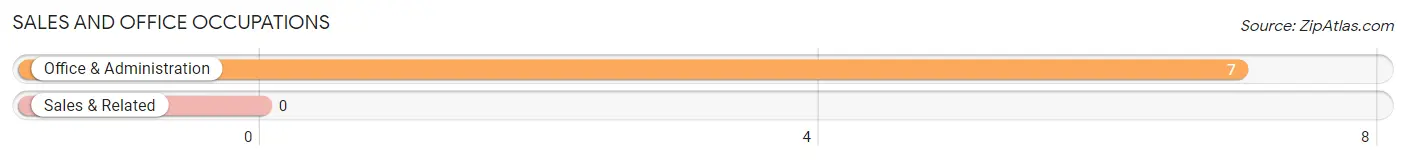
Sales and Office Occupations by Sex
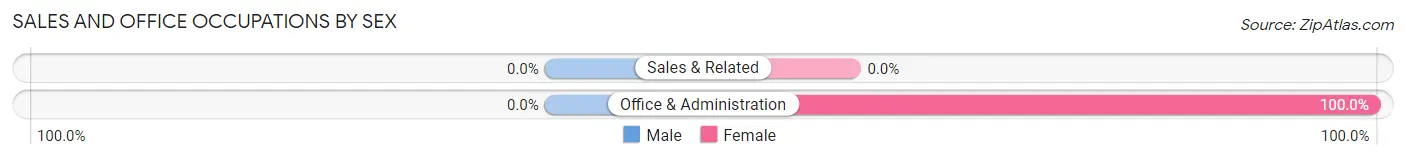
| Occupation | Male | Female |
| Sales & Related | 0 (0.0%) | 0 (0.0%) |
| Office & Administration | 0 (0.0%) | 7 (100.0%) |
| Total (Category) | 0 (0.0%) | 7 (100.0%) |
| Total (Overall) | 14 (42.4%) | 19 (57.6%) |
Natural Resources, Construction and Maintenance Occupations

Natural Resources, Construction and Maintenance Occupations by Sex
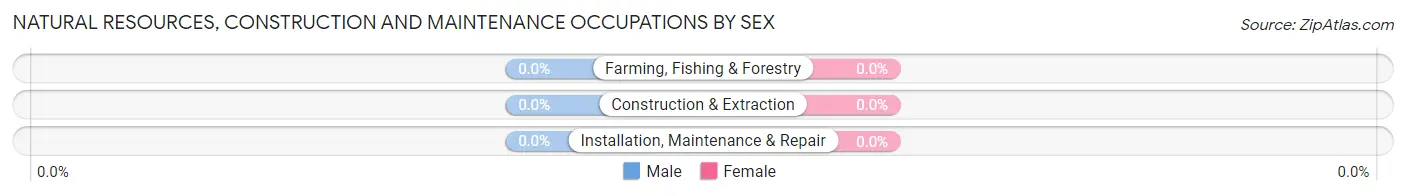
| Occupation | Male | Female |
| Farming, Fishing & Forestry | 0 (0.0%) | 0 (0.0%) |
| Construction & Extraction | 0 (0.0%) | 0 (0.0%) |
| Installation, Maintenance & Repair | 0 (0.0%) | 0 (0.0%) |
| Total (Category) | 0 (0.0%) | 0 (0.0%) |
| Total (Overall) | 14 (42.4%) | 19 (57.6%) |
Production, Transportation and Moving Occupations
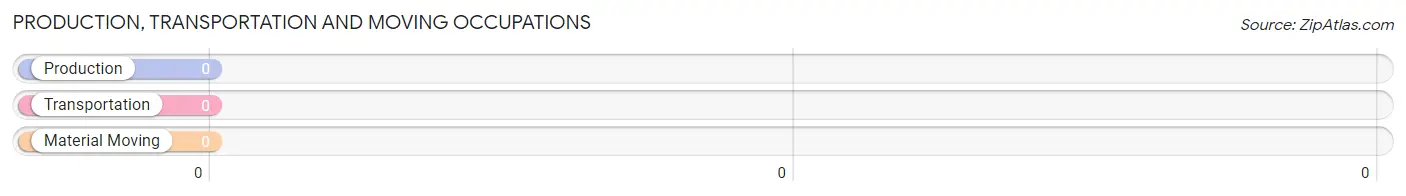
Production, Transportation and Moving Occupations by Sex
| Occupation | Male | Female |
| Production | 0 (0.0%) | 0 (0.0%) |
| Transportation | 0 (0.0%) | 0 (0.0%) |
| Material Moving | 0 (0.0%) | 0 (0.0%) |
| Total (Category) | 0 (0.0%) | 0 (0.0%) |
| Total (Overall) | 14 (42.4%) | 19 (57.6%) |
Employment Industries by Sex in Bieber
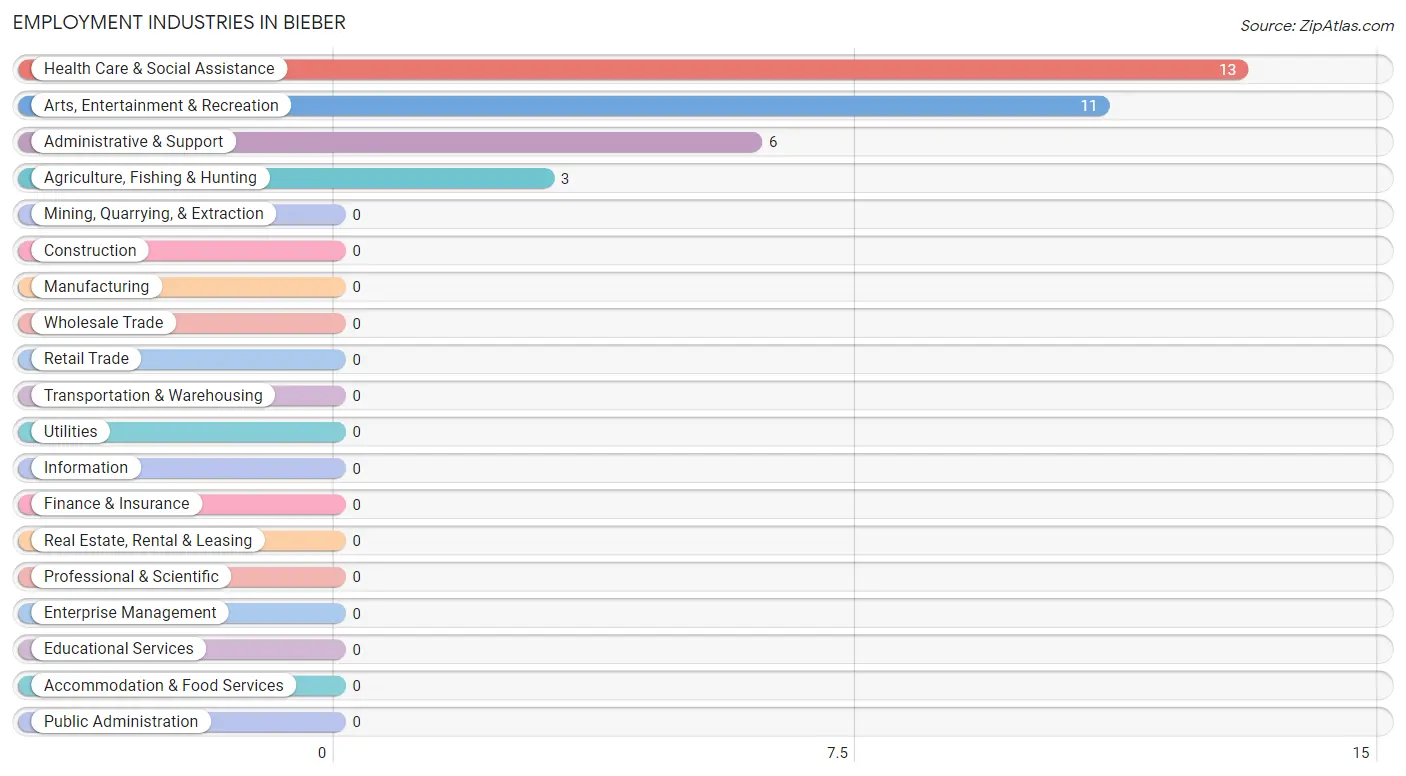
Employment Industries in Bieber
The major employment industries in Bieber include Health Care & Social Assistance (13 | 39.4%), Arts, Entertainment & Recreation (11 | 33.3%), Administrative & Support (6 | 18.2%), and Agriculture, Fishing & Hunting (3 | 9.1%).
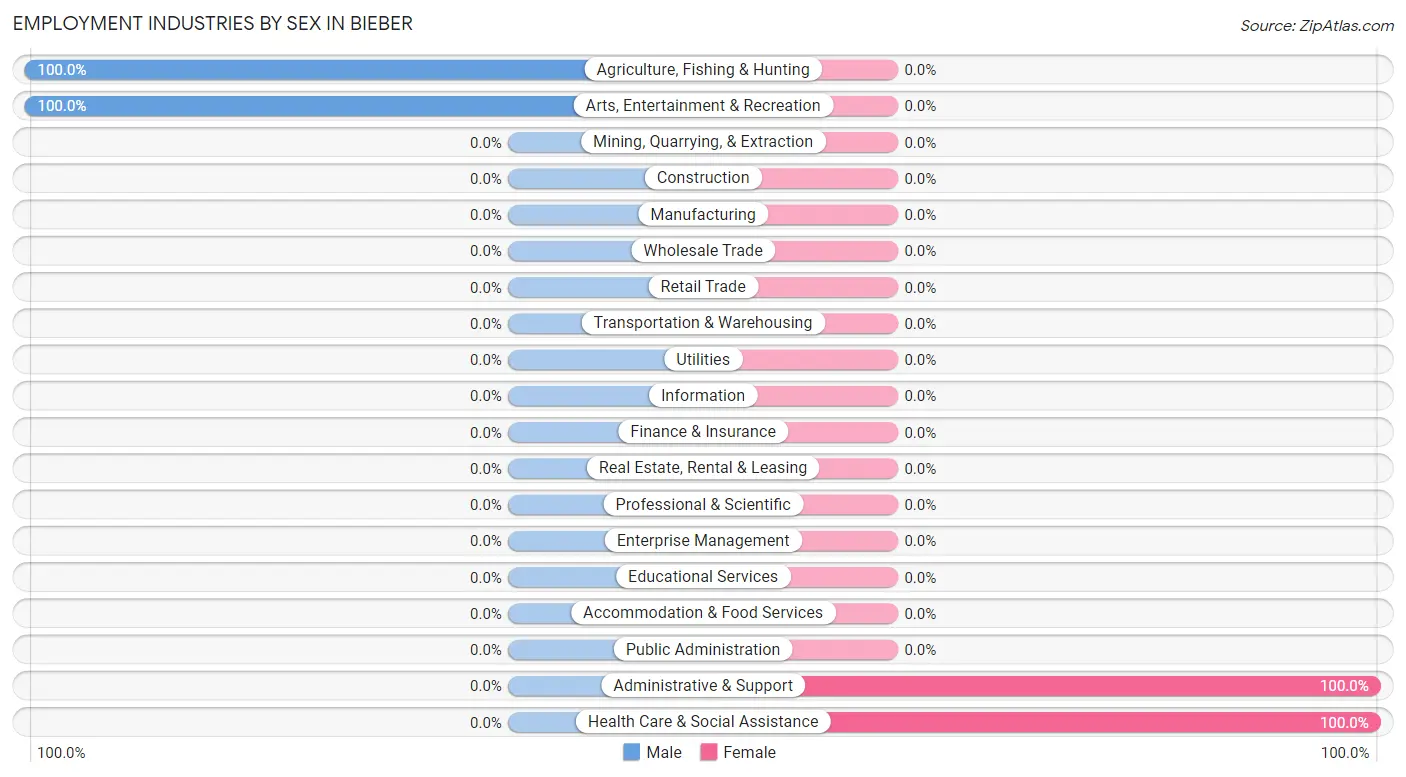
Employment Industries by Sex in Bieber
The Bieber industries that see more men than women are Agriculture, Fishing & Hunting (100.0%), and Arts, Entertainment & Recreation (100.0%), whereas the industries that tend to have a higher number of women are Administrative & Support (100.0%), and Health Care & Social Assistance (100.0%).
| Industry | Male | Female |
| Agriculture, Fishing & Hunting | 3 (100.0%) | 0 (0.0%) |
| Mining, Quarrying, & Extraction | 0 (0.0%) | 0 (0.0%) |
| Construction | 0 (0.0%) | 0 (0.0%) |
| Manufacturing | 0 (0.0%) | 0 (0.0%) |
| Wholesale Trade | 0 (0.0%) | 0 (0.0%) |
| Retail Trade | 0 (0.0%) | 0 (0.0%) |
| Transportation & Warehousing | 0 (0.0%) | 0 (0.0%) |
| Utilities | 0 (0.0%) | 0 (0.0%) |
| Information | 0 (0.0%) | 0 (0.0%) |
| Finance & Insurance | 0 (0.0%) | 0 (0.0%) |
| Real Estate, Rental & Leasing | 0 (0.0%) | 0 (0.0%) |
| Professional & Scientific | 0 (0.0%) | 0 (0.0%) |
| Enterprise Management | 0 (0.0%) | 0 (0.0%) |
| Administrative & Support | 0 (0.0%) | 6 (100.0%) |
| Educational Services | 0 (0.0%) | 0 (0.0%) |
| Health Care & Social Assistance | 0 (0.0%) | 13 (100.0%) |
| Arts, Entertainment & Recreation | 11 (100.0%) | 0 (0.0%) |
| Accommodation & Food Services | 0 (0.0%) | 0 (0.0%) |
| Public Administration | 0 (0.0%) | 0 (0.0%) |
| Total | 14 (42.4%) | 19 (57.6%) |
Education in Bieber
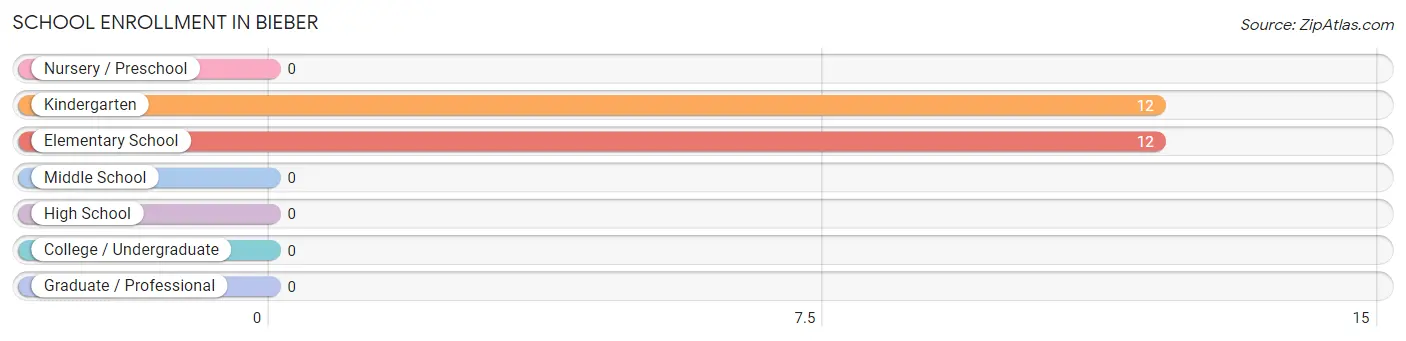
School Enrollment in Bieber
The most common levels of schooling among the 24 students in Bieber are kindergarten (12 | 50.0%), and elementary school (12 | 50.0%).
| School Level | # Students | % Students |
| Nursery / Preschool | 0 | 0.0% |
| Kindergarten | 12 | 50.0% |
| Elementary School | 12 | 50.0% |
| Middle School | 0 | 0.0% |
| High School | 0 | 0.0% |
| College / Undergraduate | 0 | 0.0% |
| Graduate / Professional | 0 | 0.0% |
| Total | 24 | 100.0% |
School Enrollment by Age by Funding Source in Bieber
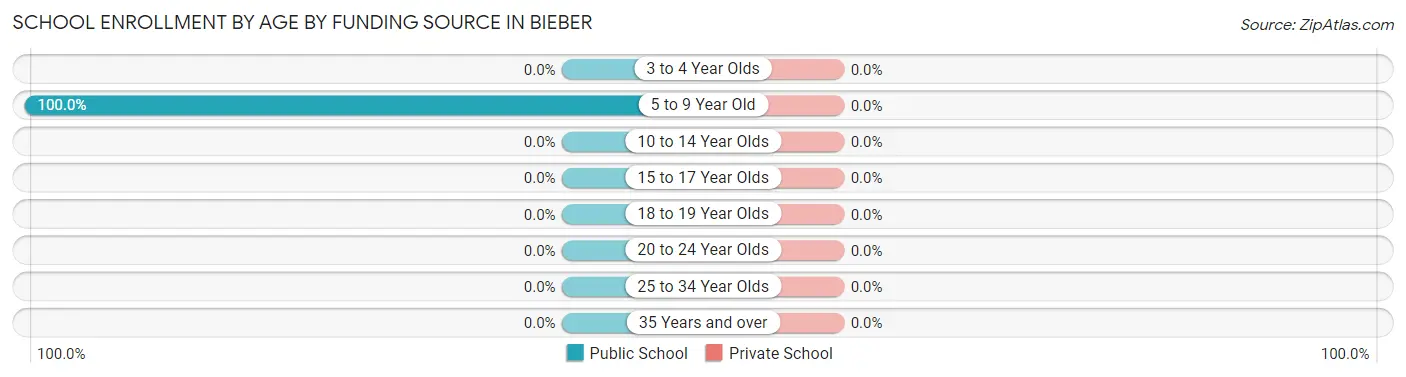
| Age Bracket | Public School | Private School |
| 3 to 4 Year Olds | 0 (0.0%) | 0 (0.0%) |
| 5 to 9 Year Old | 24 (100.0%) | 0 (0.0%) |
| 10 to 14 Year Olds | 0 (0.0%) | 0 (0.0%) |
| 15 to 17 Year Olds | 0 (0.0%) | 0 (0.0%) |
| 18 to 19 Year Olds | 0 (0.0%) | 0 (0.0%) |
| 20 to 24 Year Olds | 0 (0.0%) | 0 (0.0%) |
| 25 to 34 Year Olds | 0 (0.0%) | 0 (0.0%) |
| 35 Years and over | 0 (0.0%) | 0 (0.0%) |
| Total | 24 (100.0%) | 0 (0.0%) |
Educational Attainment by Field of Study in Bieber
, and arts & humanities (9 | 100.0%) are the most common fields of study among 9 individuals in Bieber who have obtained a bachelor's degree or higher.
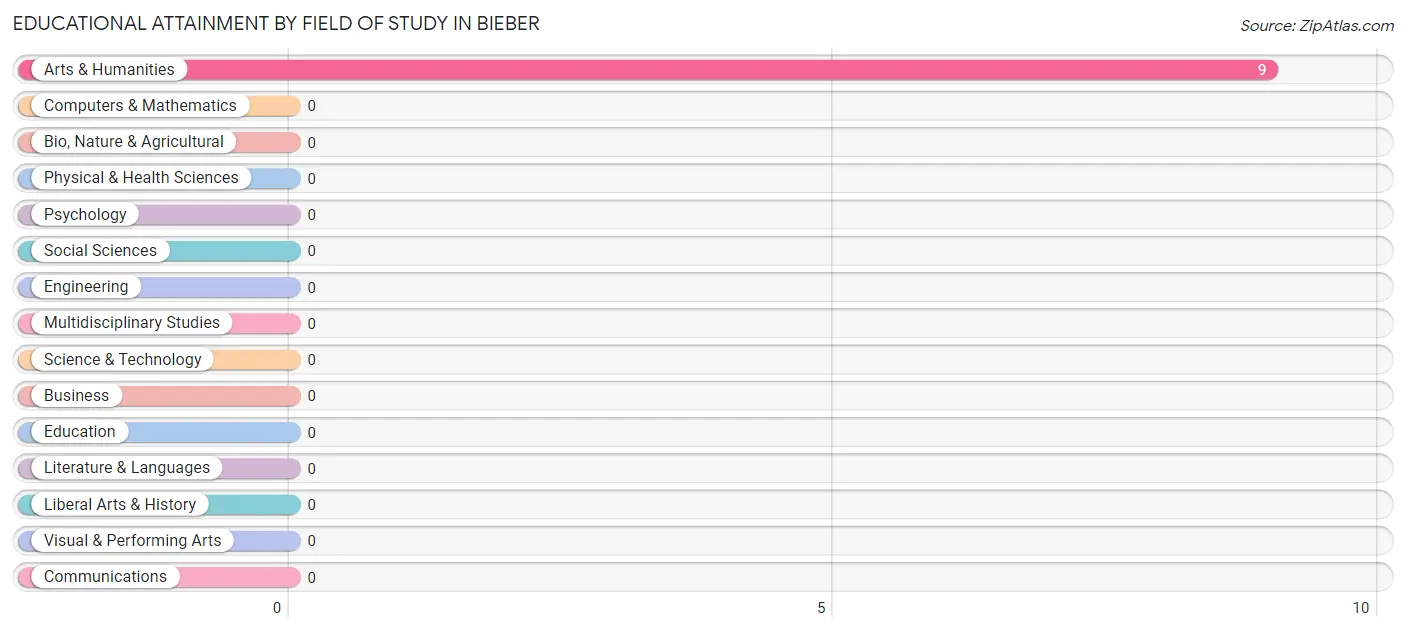
| Field of Study | # Graduates | % Graduates |
| Computers & Mathematics | 0 | 0.0% |
| Bio, Nature & Agricultural | 0 | 0.0% |
| Physical & Health Sciences | 0 | 0.0% |
| Psychology | 0 | 0.0% |
| Social Sciences | 0 | 0.0% |
| Engineering | 0 | 0.0% |
| Multidisciplinary Studies | 0 | 0.0% |
| Science & Technology | 0 | 0.0% |
| Business | 0 | 0.0% |
| Education | 0 | 0.0% |
| Literature & Languages | 0 | 0.0% |
| Liberal Arts & History | 0 | 0.0% |
| Visual & Performing Arts | 0 | 0.0% |
| Communications | 0 | 0.0% |
| Arts & Humanities | 9 | 100.0% |
| Total | 9 | 100.0% |
Transportation & Commute in Bieber
Vehicle Availability by Sex in Bieber
The most prevalent vehicle ownership categories in Bieber are males with 2 vehicles (11, accounting for 78.6%) and females with 2 vehicles (0, making up 57.9%).
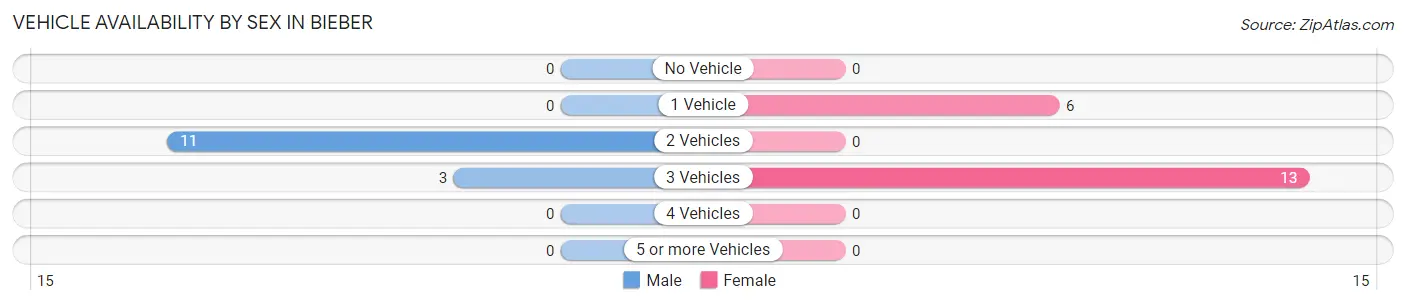
| Vehicles Available | Male | Female |
| No Vehicle | 0 (0.0%) | 0 (0.0%) |
| 1 Vehicle | 0 (0.0%) | 6 (31.6%) |
| 2 Vehicles | 11 (78.6%) | 0 (0.0%) |
| 3 Vehicles | 3 (21.4%) | 13 (68.4%) |
| 4 Vehicles | 0 (0.0%) | 0 (0.0%) |
| 5 or more Vehicles | 0 (0.0%) | 0 (0.0%) |
| Total | 14 (100.0%) | 19 (100.0%) |
Commute Time in Bieber
The most frequently occuring commute durations in Bieber are 10 to 14 minutes (13 commuters, 39.4%), 40 to 44 minutes (11 commuters, 33.3%), and 20 to 24 minutes (6 commuters, 18.2%).
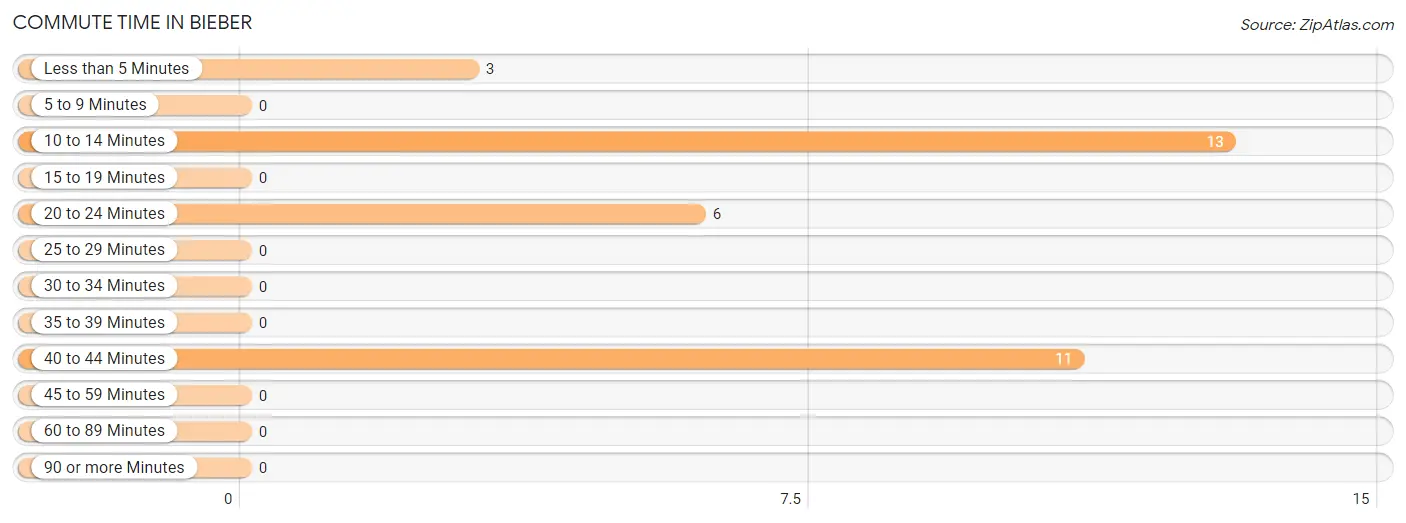
| Commute Time | # Commuters | % Commuters |
| Less than 5 Minutes | 3 | 9.1% |
| 5 to 9 Minutes | 0 | 0.0% |
| 10 to 14 Minutes | 13 | 39.4% |
| 15 to 19 Minutes | 0 | 0.0% |
| 20 to 24 Minutes | 6 | 18.2% |
| 25 to 29 Minutes | 0 | 0.0% |
| 30 to 34 Minutes | 0 | 0.0% |
| 35 to 39 Minutes | 0 | 0.0% |
| 40 to 44 Minutes | 11 | 33.3% |
| 45 to 59 Minutes | 0 | 0.0% |
| 60 to 89 Minutes | 0 | 0.0% |
| 90 or more Minutes | 0 | 0.0% |
Commute Time by Sex in Bieber
The most common commute times in Bieber are 40 to 44 minutes (11 commuters, 78.6%) for males and 10 to 14 minutes (13 commuters, 68.4%) for females.
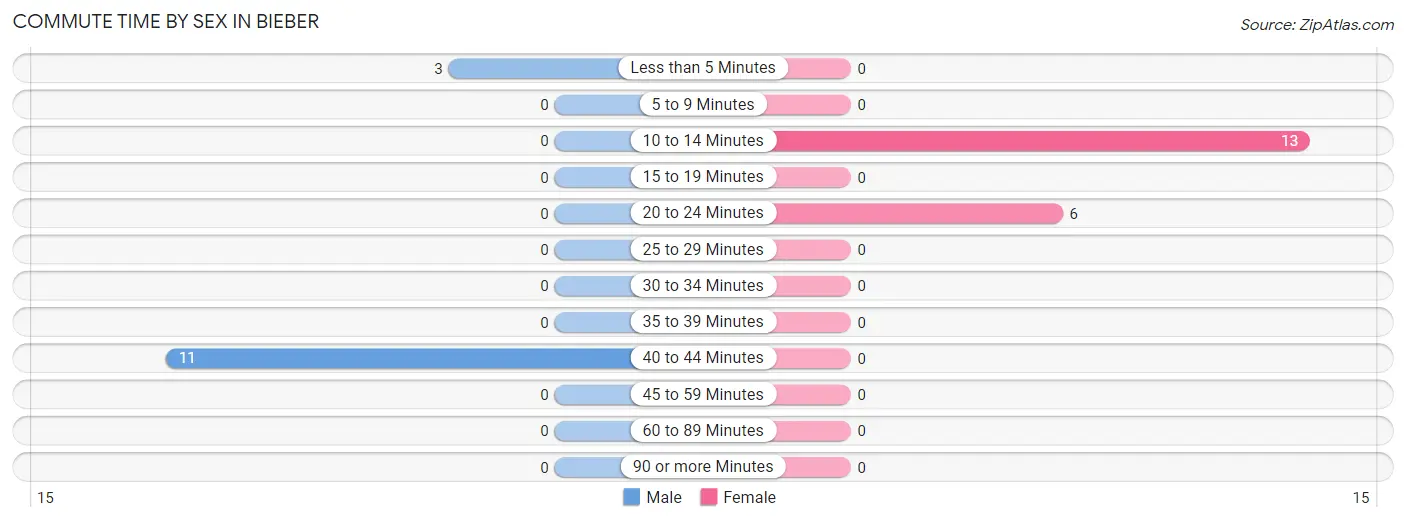
| Commute Time | Male | Female |
| Less than 5 Minutes | 3 (21.4%) | 0 (0.0%) |
| 5 to 9 Minutes | 0 (0.0%) | 0 (0.0%) |
| 10 to 14 Minutes | 0 (0.0%) | 13 (68.4%) |
| 15 to 19 Minutes | 0 (0.0%) | 0 (0.0%) |
| 20 to 24 Minutes | 0 (0.0%) | 6 (31.6%) |
| 25 to 29 Minutes | 0 (0.0%) | 0 (0.0%) |
| 30 to 34 Minutes | 0 (0.0%) | 0 (0.0%) |
| 35 to 39 Minutes | 0 (0.0%) | 0 (0.0%) |
| 40 to 44 Minutes | 11 (78.6%) | 0 (0.0%) |
| 45 to 59 Minutes | 0 (0.0%) | 0 (0.0%) |
| 60 to 89 Minutes | 0 (0.0%) | 0 (0.0%) |
| 90 or more Minutes | 0 (0.0%) | 0 (0.0%) |
Time of Departure to Work by Sex in Bieber
The most frequent times of departure to work in Bieber are 4:00 PM to 11:59 PM (11, 78.6%) for males and 6:30 AM to 6:59 AM (7, 36.8%) for females.
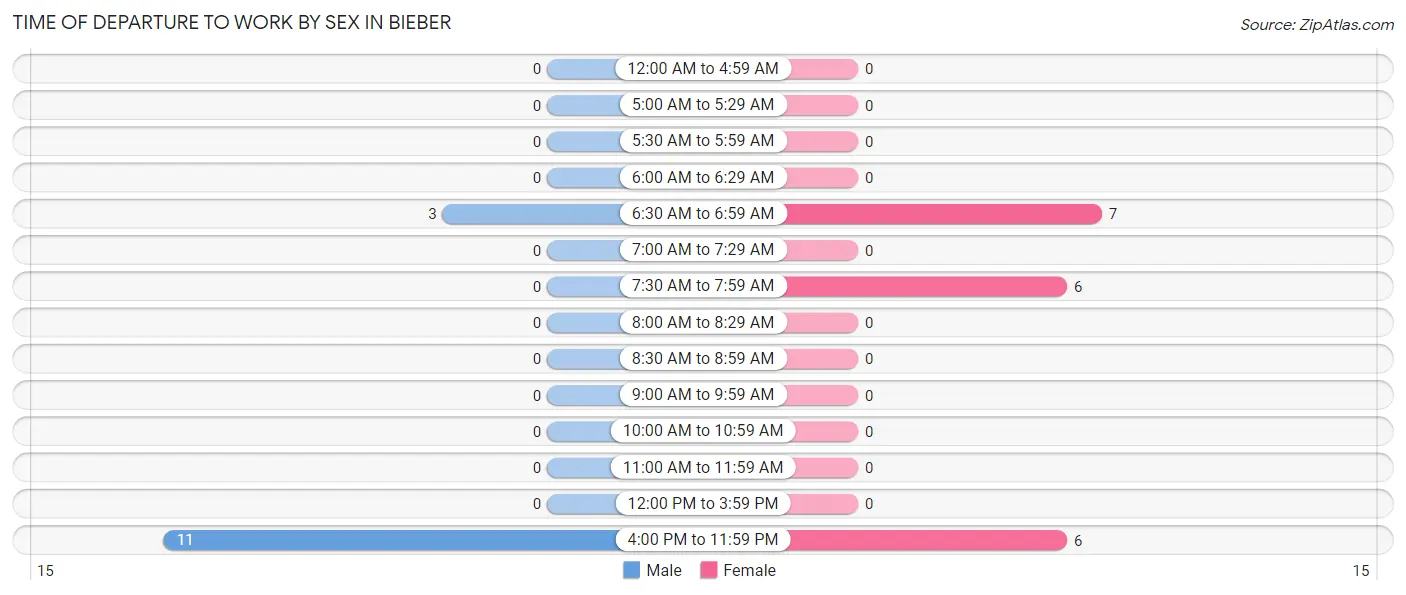
| Time of Departure | Male | Female |
| 12:00 AM to 4:59 AM | 0 (0.0%) | 0 (0.0%) |
| 5:00 AM to 5:29 AM | 0 (0.0%) | 0 (0.0%) |
| 5:30 AM to 5:59 AM | 0 (0.0%) | 0 (0.0%) |
| 6:00 AM to 6:29 AM | 0 (0.0%) | 0 (0.0%) |
| 6:30 AM to 6:59 AM | 3 (21.4%) | 7 (36.8%) |
| 7:00 AM to 7:29 AM | 0 (0.0%) | 0 (0.0%) |
| 7:30 AM to 7:59 AM | 0 (0.0%) | 6 (31.6%) |
| 8:00 AM to 8:29 AM | 0 (0.0%) | 0 (0.0%) |
| 8:30 AM to 8:59 AM | 0 (0.0%) | 0 (0.0%) |
| 9:00 AM to 9:59 AM | 0 (0.0%) | 0 (0.0%) |
| 10:00 AM to 10:59 AM | 0 (0.0%) | 0 (0.0%) |
| 11:00 AM to 11:59 AM | 0 (0.0%) | 0 (0.0%) |
| 12:00 PM to 3:59 PM | 0 (0.0%) | 0 (0.0%) |
| 4:00 PM to 11:59 PM | 11 (78.6%) | 6 (31.6%) |
| Total | 14 (100.0%) | 19 (100.0%) |
Housing Occupancy in Bieber
Occupancy by Ownership in Bieber
Of the total 60 dwellings in Bieber, owner-occupied units account for 38 (63.3%), while renter-occupied units make up 22 (36.7%).
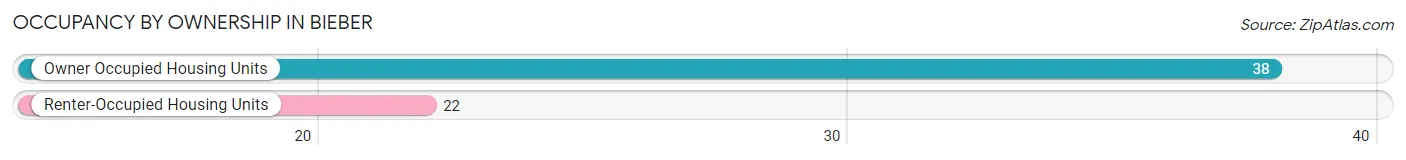
| Occupancy | # Housing Units | % Housing Units |
| Owner Occupied Housing Units | 38 | 63.3% |
| Renter-Occupied Housing Units | 22 | 36.7% |
| Total Occupied Housing Units | 60 | 100.0% |
Occupancy by Household Size in Bieber
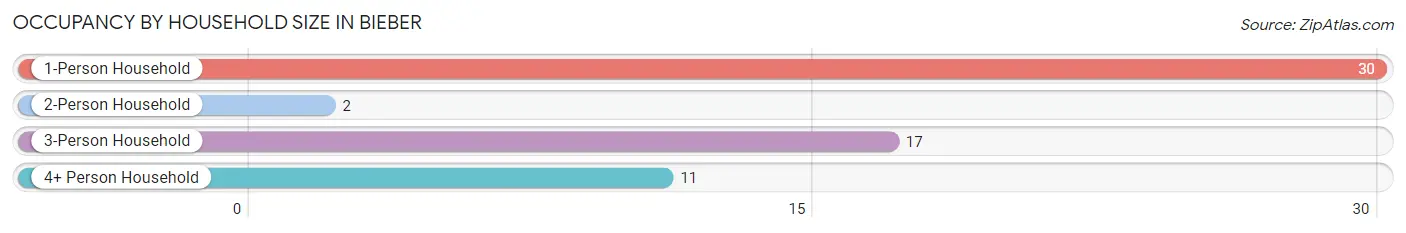
| Household Size | # Housing Units | % Housing Units |
| 1-Person Household | 30 | 50.0% |
| 2-Person Household | 2 | 3.3% |
| 3-Person Household | 17 | 28.3% |
| 4+ Person Household | 11 | 18.3% |
| Total Housing Units | 60 | 100.0% |
Occupancy by Ownership by Household Size in Bieber
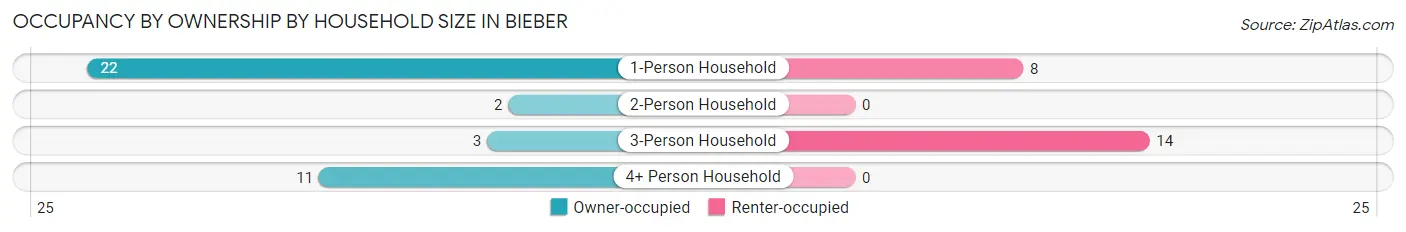
| Household Size | Owner-occupied | Renter-occupied |
| 1-Person Household | 22 (73.3%) | 8 (26.7%) |
| 2-Person Household | 2 (100.0%) | 0 (0.0%) |
| 3-Person Household | 3 (17.6%) | 14 (82.4%) |
| 4+ Person Household | 11 (100.0%) | 0 (0.0%) |
| Total Housing Units | 38 (63.3%) | 22 (36.7%) |
Occupancy by Educational Attainment in Bieber
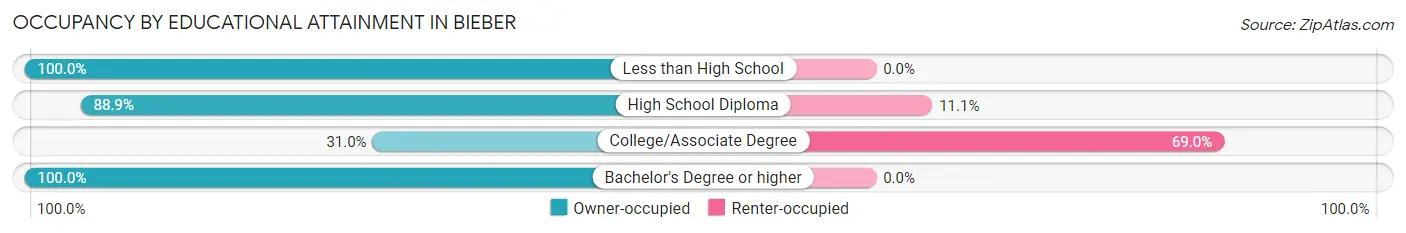
| Household Size | Owner-occupied | Renter-occupied |
| Less than High School | 4 (100.0%) | 0 (0.0%) |
| High School Diploma | 16 (88.9%) | 2 (11.1%) |
| College/Associate Degree | 9 (31.0%) | 20 (69.0%) |
| Bachelor's Degree or higher | 9 (100.0%) | 0 (0.0%) |
Occupancy by Age of Householder in Bieber
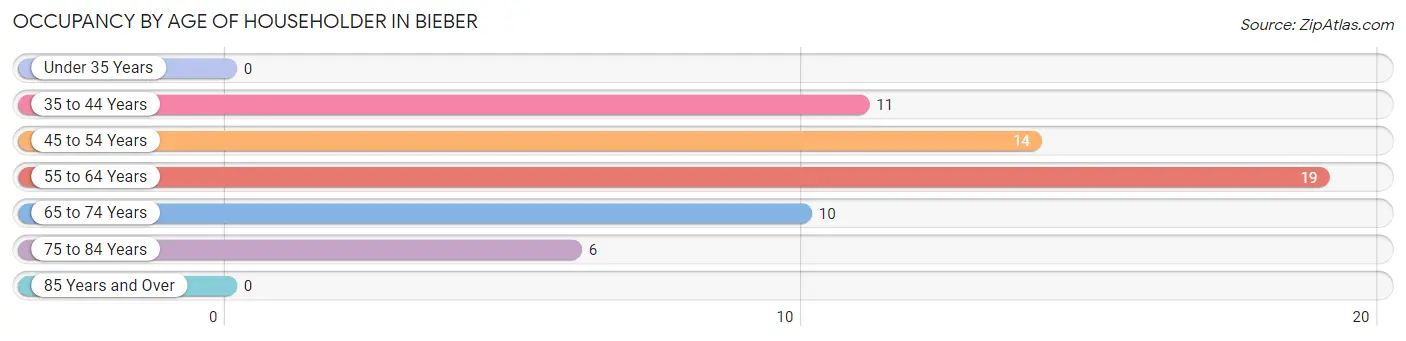
| Age Bracket | # Households | % Households |
| Under 35 Years | 0 | 0.0% |
| 35 to 44 Years | 11 | 18.3% |
| 45 to 54 Years | 14 | 23.3% |
| 55 to 64 Years | 19 | 31.7% |
| 65 to 74 Years | 10 | 16.7% |
| 75 to 84 Years | 6 | 10.0% |
| 85 Years and Over | 0 | 0.0% |
| Total | 60 | 100.0% |
Housing Finances in Bieber
Median Income by Occupancy in Bieber
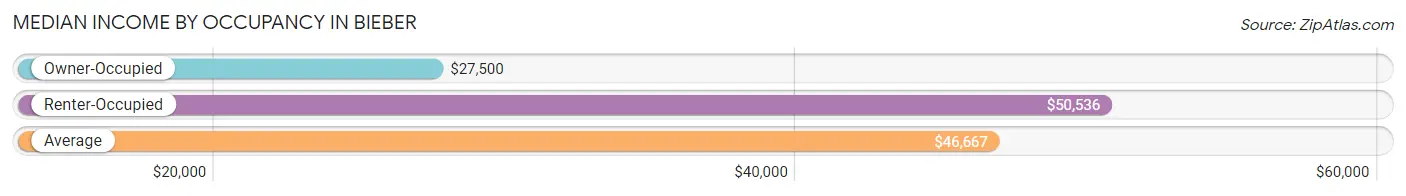
| Occupancy Type | # Households | Median Income |
| Owner-Occupied | 38 (63.3%) | $27,500 |
| Renter-Occupied | 22 (36.7%) | $50,536 |
| Average | 60 (100.0%) | $46,667 |
Occupancy by Householder Income Bracket in Bieber
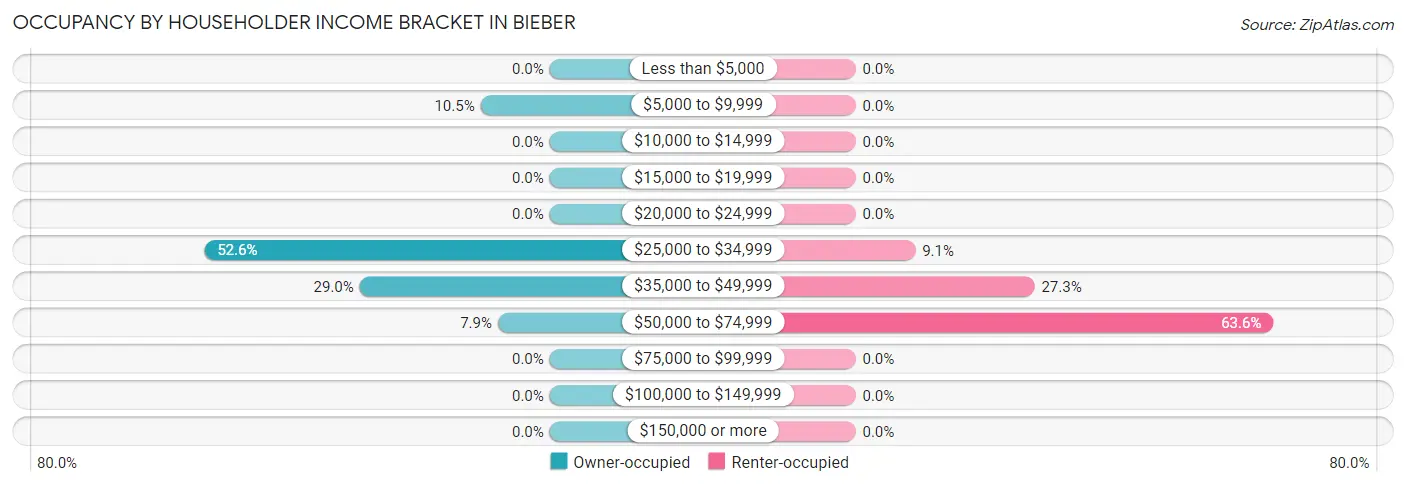
| Income Bracket | Owner-occupied | Renter-occupied |
| Less than $5,000 | 0 (0.0%) | 0 (0.0%) |
| $5,000 to $9,999 | 4 (10.5%) | 0 (0.0%) |
| $10,000 to $14,999 | 0 (0.0%) | 0 (0.0%) |
| $15,000 to $19,999 | 0 (0.0%) | 0 (0.0%) |
| $20,000 to $24,999 | 0 (0.0%) | 0 (0.0%) |
| $25,000 to $34,999 | 20 (52.6%) | 2 (9.1%) |
| $35,000 to $49,999 | 11 (28.9%) | 6 (27.3%) |
| $50,000 to $74,999 | 3 (7.9%) | 14 (63.6%) |
| $75,000 to $99,999 | 0 (0.0%) | 0 (0.0%) |
| $100,000 to $149,999 | 0 (0.0%) | 0 (0.0%) |
| $150,000 or more | 0 (0.0%) | 0 (0.0%) |
| Total | 38 (100.0%) | 22 (100.0%) |
Monthly Housing Cost Tiers in Bieber
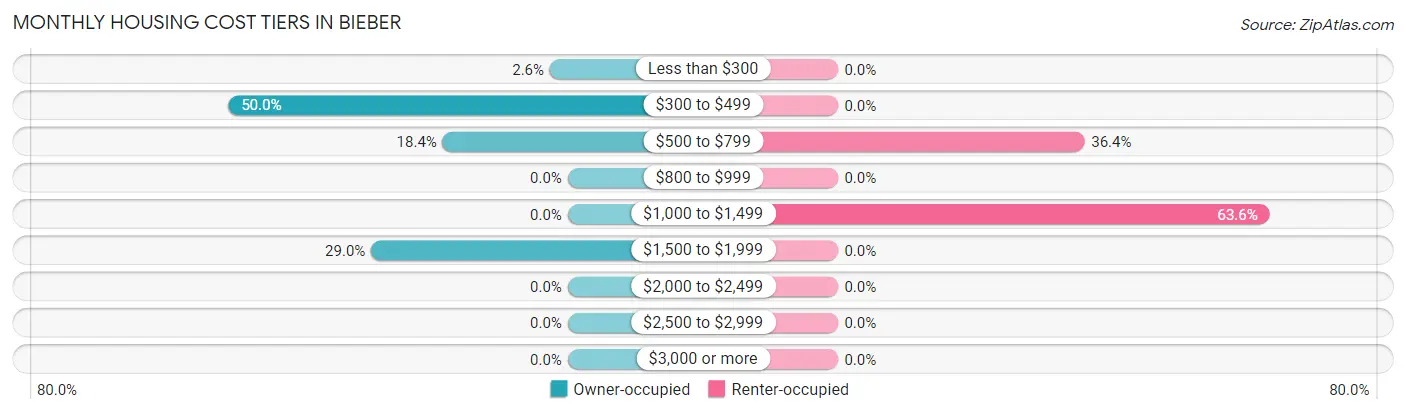
| Monthly Cost | Owner-occupied | Renter-occupied |
| Less than $300 | 1 (2.6%) | 0 (0.0%) |
| $300 to $499 | 19 (50.0%) | 0 (0.0%) |
| $500 to $799 | 7 (18.4%) | 8 (36.4%) |
| $800 to $999 | 0 (0.0%) | 0 (0.0%) |
| $1,000 to $1,499 | 0 (0.0%) | 14 (63.6%) |
| $1,500 to $1,999 | 11 (28.9%) | 0 (0.0%) |
| $2,000 to $2,499 | 0 (0.0%) | 0 (0.0%) |
| $2,500 to $2,999 | 0 (0.0%) | 0 (0.0%) |
| $3,000 or more | 0 (0.0%) | 0 (0.0%) |
| Total | 38 (100.0%) | 22 (100.0%) |
Physical Housing Characteristics in Bieber
Housing Structures in Bieber
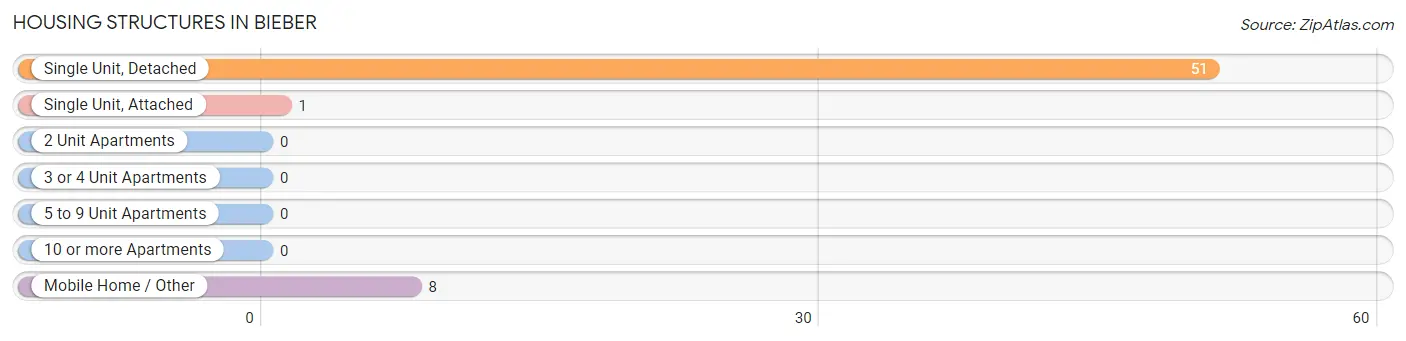
| Structure Type | # Housing Units | % Housing Units |
| Single Unit, Detached | 51 | 85.0% |
| Single Unit, Attached | 1 | 1.7% |
| 2 Unit Apartments | 0 | 0.0% |
| 3 or 4 Unit Apartments | 0 | 0.0% |
| 5 to 9 Unit Apartments | 0 | 0.0% |
| 10 or more Apartments | 0 | 0.0% |
| Mobile Home / Other | 8 | 13.3% |
| Total | 60 | 100.0% |
Housing Structures by Occupancy in Bieber
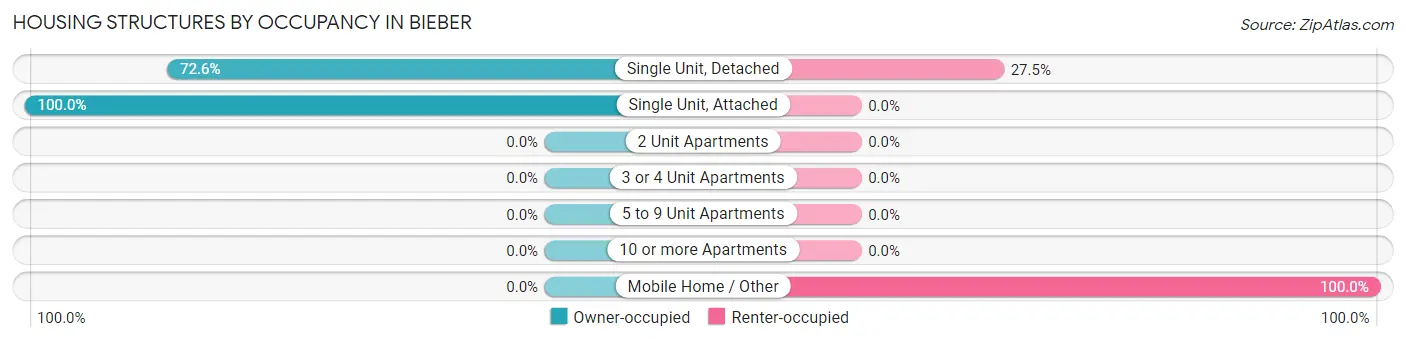
| Structure Type | Owner-occupied | Renter-occupied |
| Single Unit, Detached | 37 (72.6%) | 14 (27.5%) |
| Single Unit, Attached | 1 (100.0%) | 0 (0.0%) |
| 2 Unit Apartments | 0 (0.0%) | 0 (0.0%) |
| 3 or 4 Unit Apartments | 0 (0.0%) | 0 (0.0%) |
| 5 to 9 Unit Apartments | 0 (0.0%) | 0 (0.0%) |
| 10 or more Apartments | 0 (0.0%) | 0 (0.0%) |
| Mobile Home / Other | 0 (0.0%) | 8 (100.0%) |
| Total | 38 (63.3%) | 22 (36.7%) |
Housing Structures by Number of Rooms in Bieber
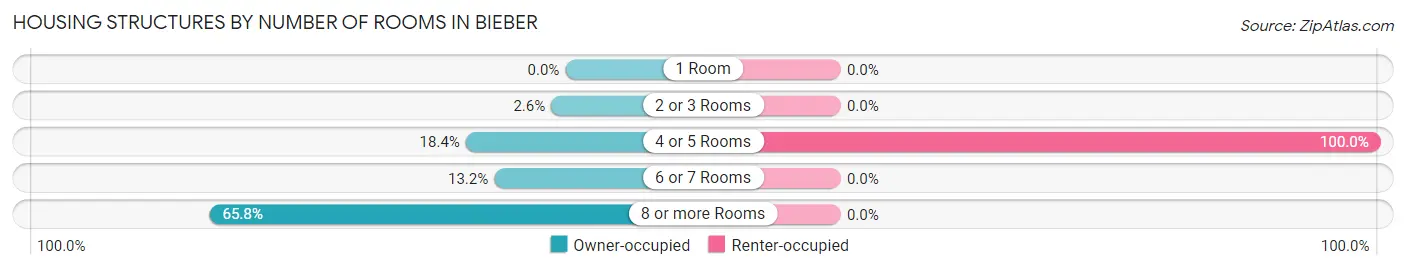
| Number of Rooms | Owner-occupied | Renter-occupied |
| 1 Room | 0 (0.0%) | 0 (0.0%) |
| 2 or 3 Rooms | 1 (2.6%) | 0 (0.0%) |
| 4 or 5 Rooms | 7 (18.4%) | 22 (100.0%) |
| 6 or 7 Rooms | 5 (13.2%) | 0 (0.0%) |
| 8 or more Rooms | 25 (65.8%) | 0 (0.0%) |
| Total | 38 (100.0%) | 22 (100.0%) |
Housing Structure by Heating Type in Bieber
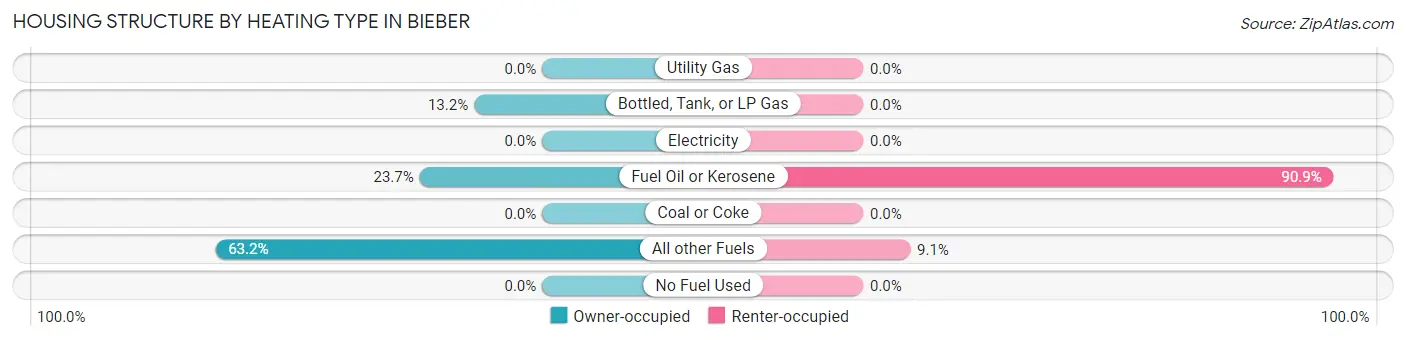
| Heating Type | Owner-occupied | Renter-occupied |
| Utility Gas | 0 (0.0%) | 0 (0.0%) |
| Bottled, Tank, or LP Gas | 5 (13.2%) | 0 (0.0%) |
| Electricity | 0 (0.0%) | 0 (0.0%) |
| Fuel Oil or Kerosene | 9 (23.7%) | 20 (90.9%) |
| Coal or Coke | 0 (0.0%) | 0 (0.0%) |
| All other Fuels | 24 (63.2%) | 2 (9.1%) |
| No Fuel Used | 0 (0.0%) | 0 (0.0%) |
| Total | 38 (100.0%) | 22 (100.0%) |
Household Vehicle Usage in Bieber
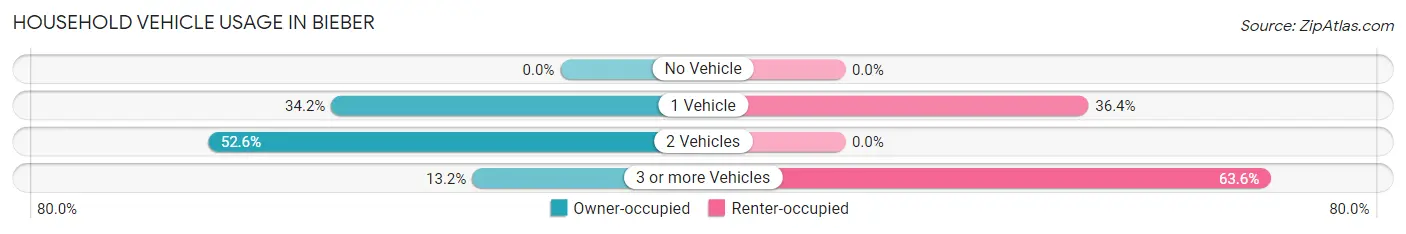
| Vehicles per Household | Owner-occupied | Renter-occupied |
| No Vehicle | 0 (0.0%) | 0 (0.0%) |
| 1 Vehicle | 13 (34.2%) | 8 (36.4%) |
| 2 Vehicles | 20 (52.6%) | 0 (0.0%) |
| 3 or more Vehicles | 5 (13.2%) | 14 (63.6%) |
| Total | 38 (100.0%) | 22 (100.0%) |
Real Estate & Mortgages in Bieber
Real Estate and Mortgage Overview in Bieber
| Characteristic | Without Mortgage | With Mortgage |
| Housing Units | 27 | 11 |
| Median Property Value | $151,400 | $0 |
| Median Household Income | $26,583 | $0 |
| Monthly Housing Costs | $354 | $0 |
| Real Estate Taxes | $850 | $0 |
Property Value by Mortgage Status in Bieber
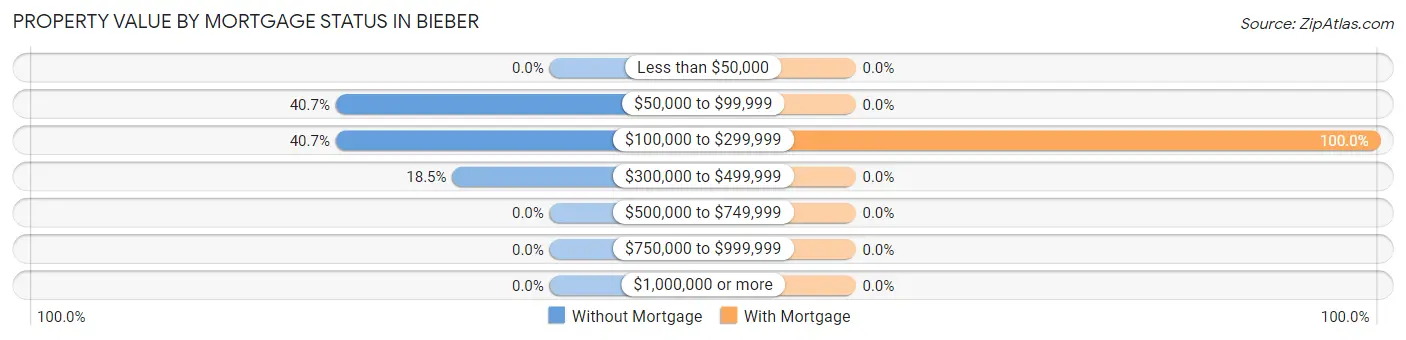
| Property Value | Without Mortgage | With Mortgage |
| Less than $50,000 | 0 (0.0%) | 0 (0.0%) |
| $50,000 to $99,999 | 11 (40.7%) | 0 (0.0%) |
| $100,000 to $299,999 | 11 (40.7%) | 11 (100.0%) |
| $300,000 to $499,999 | 5 (18.5%) | 0 (0.0%) |
| $500,000 to $749,999 | 0 (0.0%) | 0 (0.0%) |
| $750,000 to $999,999 | 0 (0.0%) | 0 (0.0%) |
| $1,000,000 or more | 0 (0.0%) | 0 (0.0%) |
| Total | 27 (100.0%) | 11 (100.0%) |
Household Income by Mortgage Status in Bieber
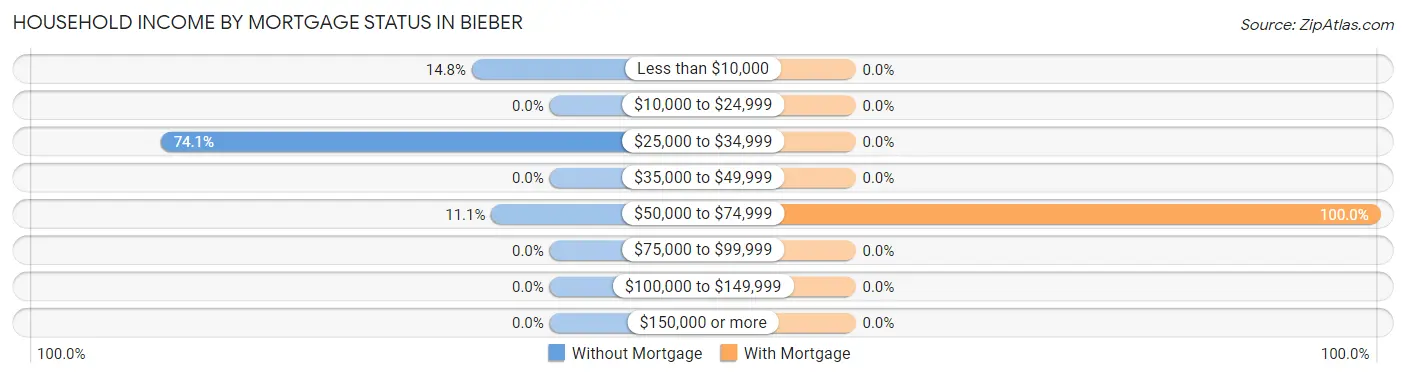
| Household Income | Without Mortgage | With Mortgage |
| Less than $10,000 | 4 (14.8%) | 0 (0.0%) |
| $10,000 to $24,999 | 0 (0.0%) | 0 (0.0%) |
| $25,000 to $34,999 | 20 (74.1%) | 0 (0.0%) |
| $35,000 to $49,999 | 0 (0.0%) | 0 (0.0%) |
| $50,000 to $74,999 | 3 (11.1%) | 11 (100.0%) |
| $75,000 to $99,999 | 0 (0.0%) | 0 (0.0%) |
| $100,000 to $149,999 | 0 (0.0%) | 0 (0.0%) |
| $150,000 or more | 0 (0.0%) | 0 (0.0%) |
| Total | 27 (100.0%) | 11 (100.0%) |
Property Value to Household Income Ratio in Bieber
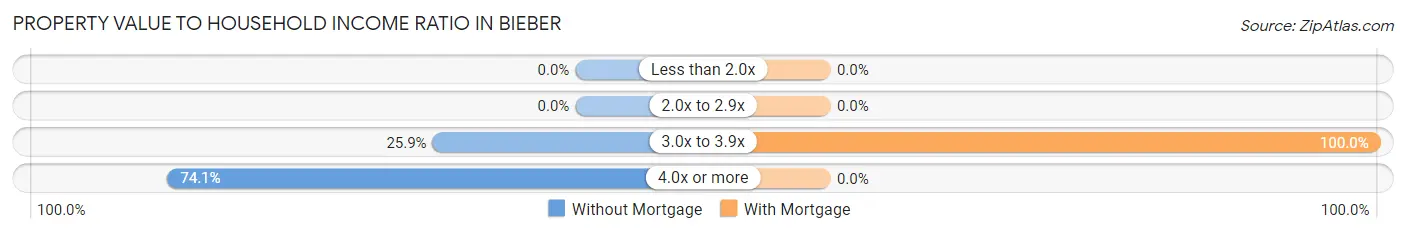
| Value-to-Income Ratio | Without Mortgage | With Mortgage |
| Less than 2.0x | 0 (0.0%) | 0 (0.0%) |
| 2.0x to 2.9x | 0 (0.0%) | 0 (0.0%) |
| 3.0x to 3.9x | 7 (25.9%) | 11 (100.0%) |
| 4.0x or more | 20 (74.1%) | 0 (0.0%) |
| Total | 27 (100.0%) | 11 (100.0%) |
Real Estate Taxes by Mortgage Status in Bieber
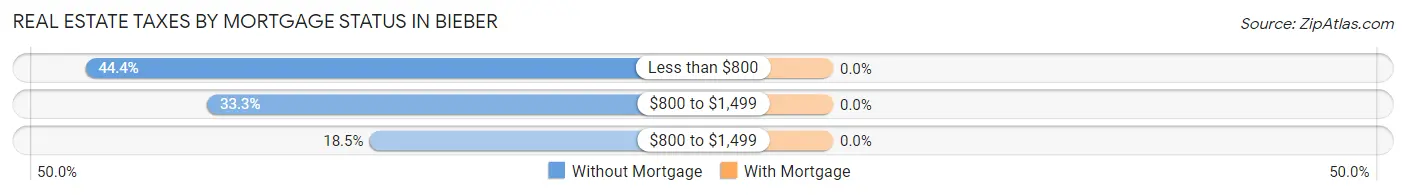
| Property Taxes | Without Mortgage | With Mortgage |
| Less than $800 | 12 (44.4%) | 0 (0.0%) |
| $800 to $1,499 | 9 (33.3%) | 0 (0.0%) |
| $800 to $1,499 | 5 (18.5%) | 0 (0.0%) |
| Total | 27 (100.0%) | 11 (100.0%) |
Health & Disability in Bieber
Health Insurance Coverage by Age in Bieber
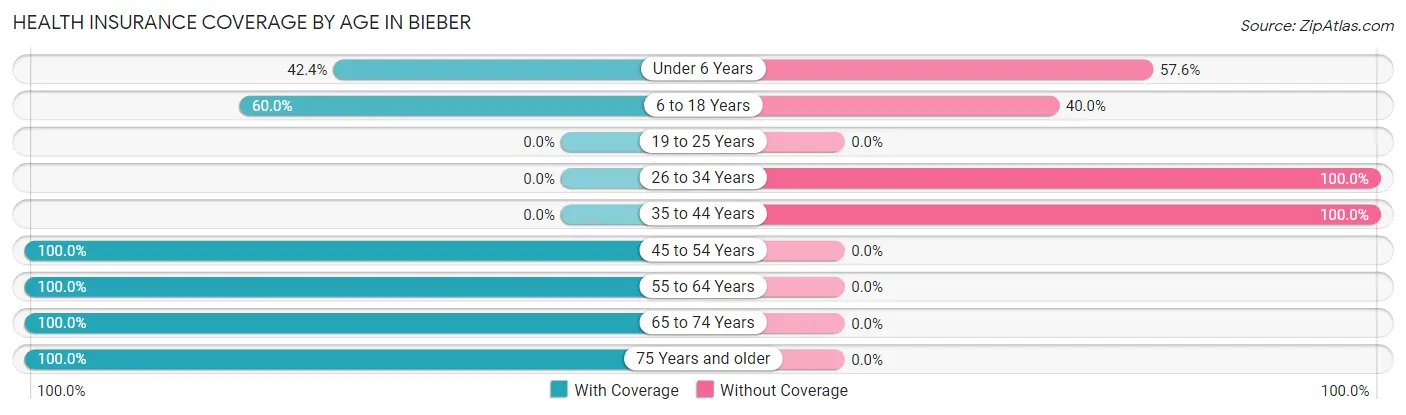
| Age Bracket | With Coverage | Without Coverage |
| Under 6 Years | 14 (42.4%) | 19 (57.6%) |
| 6 to 18 Years | 18 (60.0%) | 12 (40.0%) |
| 19 to 25 Years | 0 (0.0%) | 0 (0.0%) |
| 26 to 34 Years | 0 (0.0%) | 15 (100.0%) |
| 35 to 44 Years | 0 (0.0%) | 11 (100.0%) |
| 45 to 54 Years | 21 (100.0%) | 0 (0.0%) |
| 55 to 64 Years | 19 (100.0%) | 0 (0.0%) |
| 65 to 74 Years | 10 (100.0%) | 0 (0.0%) |
| 75 Years and older | 12 (100.0%) | 0 (0.0%) |
| Total | 94 (62.3%) | 57 (37.8%) |
Health Insurance Coverage by Citizenship Status in Bieber
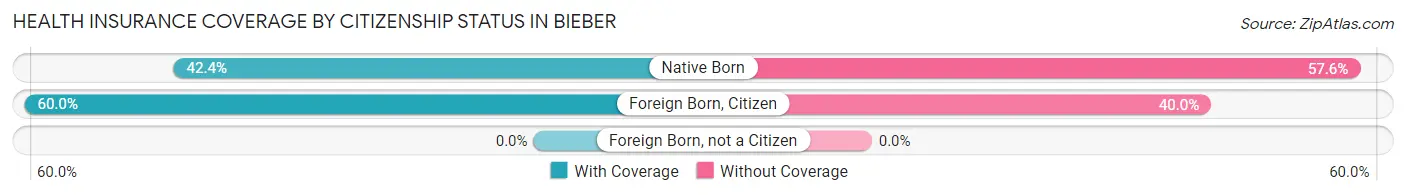
| Citizenship Status | With Coverage | Without Coverage |
| Native Born | 14 (42.4%) | 19 (57.6%) |
| Foreign Born, Citizen | 18 (60.0%) | 12 (40.0%) |
| Foreign Born, not a Citizen | 0 (0.0%) | 0 (0.0%) |
Health Insurance Coverage by Household Income in Bieber
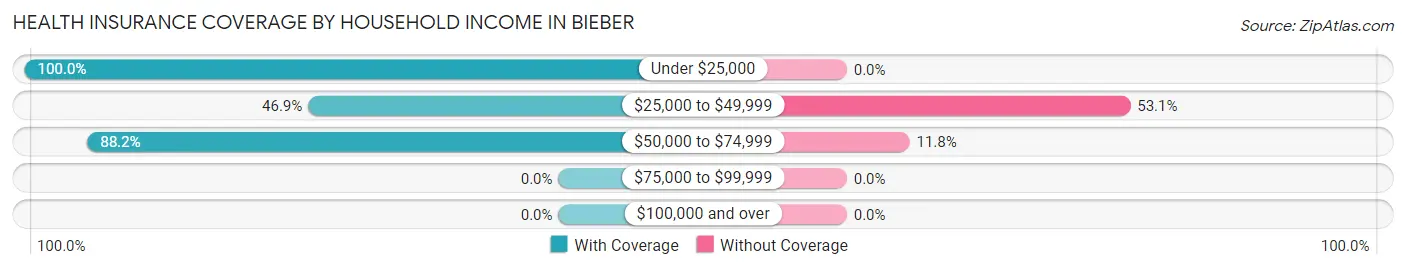
| Household Income | With Coverage | Without Coverage |
| Under $25,000 | 4 (100.0%) | 0 (0.0%) |
| $25,000 to $49,999 | 45 (46.9%) | 51 (53.1%) |
| $50,000 to $74,999 | 45 (88.2%) | 6 (11.8%) |
| $75,000 to $99,999 | 0 (0.0%) | 0 (0.0%) |
| $100,000 and over | 0 (0.0%) | 0 (0.0%) |
Public vs Private Health Insurance Coverage by Age in Bieber
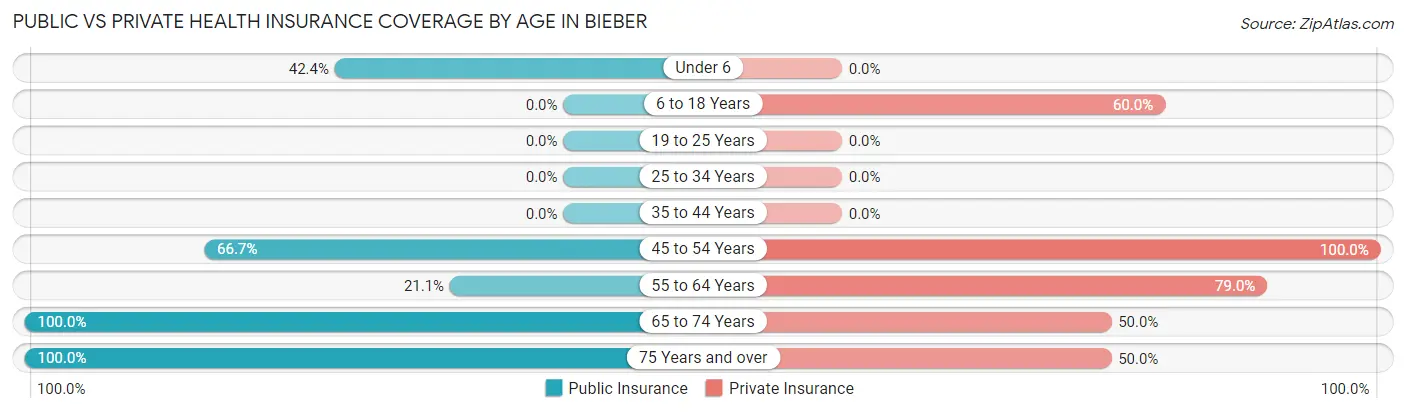
| Age Bracket | Public Insurance | Private Insurance |
| Under 6 | 14 (42.4%) | 0 (0.0%) |
| 6 to 18 Years | 0 (0.0%) | 18 (60.0%) |
| 19 to 25 Years | 0 (0.0%) | 0 (0.0%) |
| 25 to 34 Years | 0 (0.0%) | 0 (0.0%) |
| 35 to 44 Years | 0 (0.0%) | 0 (0.0%) |
| 45 to 54 Years | 14 (66.7%) | 21 (100.0%) |
| 55 to 64 Years | 4 (21.0%) | 15 (78.9%) |
| 65 to 74 Years | 10 (100.0%) | 5 (50.0%) |
| 75 Years and over | 12 (100.0%) | 6 (50.0%) |
| Total | 54 (35.8%) | 65 (43.0%) |
Disability Status by Sex by Age in Bieber
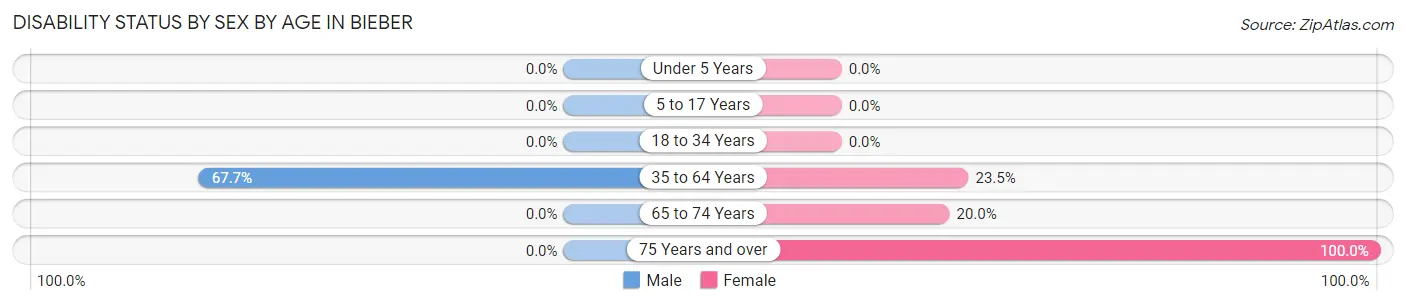
| Age Bracket | Male | Female |
| Under 5 Years | 0 (0.0%) | 0 (0.0%) |
| 5 to 17 Years | 0 (0.0%) | 0 (0.0%) |
| 18 to 34 Years | 0 (0.0%) | 0 (0.0%) |
| 35 to 64 Years | 23 (67.6%) | 4 (23.5%) |
| 65 to 74 Years | 0 (0.0%) | 2 (20.0%) |
| 75 Years and over | 0 (0.0%) | 6 (100.0%) |
Disability Class by Sex by Age in Bieber
Disability Class: Hearing Difficulty
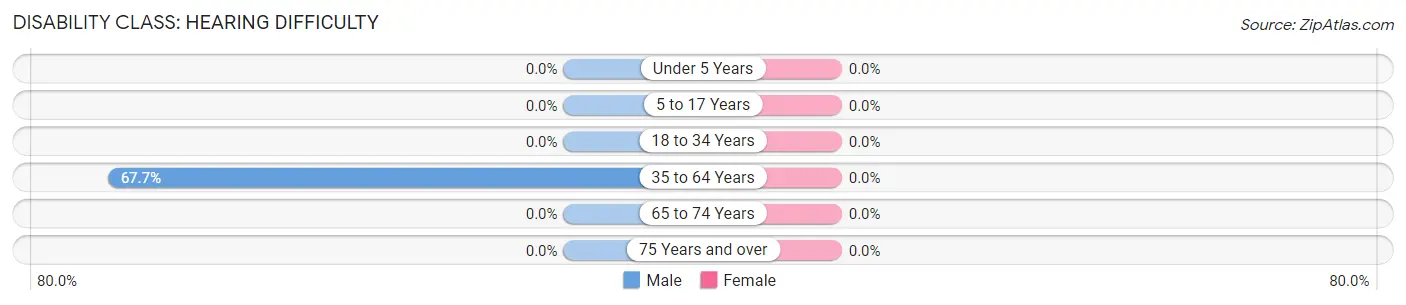
| Age Bracket | Male | Female |
| Under 5 Years | 0 (0.0%) | 0 (0.0%) |
| 5 to 17 Years | 0 (0.0%) | 0 (0.0%) |
| 18 to 34 Years | 0 (0.0%) | 0 (0.0%) |
| 35 to 64 Years | 23 (67.6%) | 0 (0.0%) |
| 65 to 74 Years | 0 (0.0%) | 0 (0.0%) |
| 75 Years and over | 0 (0.0%) | 0 (0.0%) |
Disability Class: Vision Difficulty
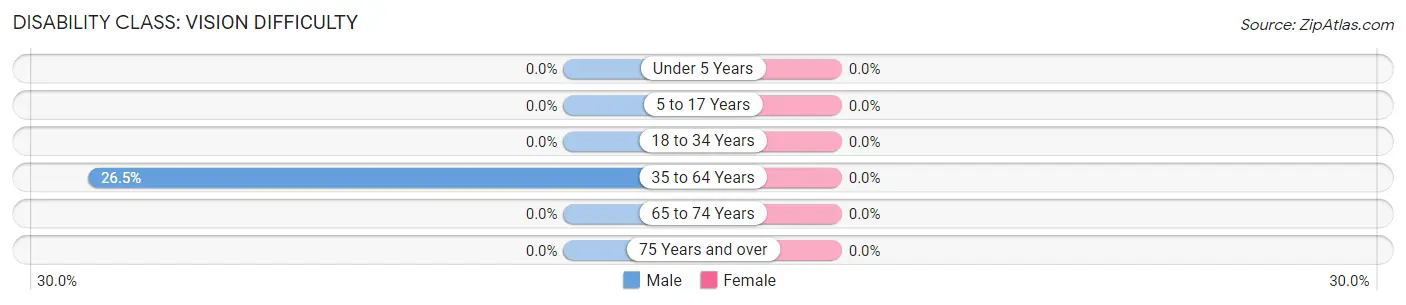
| Age Bracket | Male | Female |
| Under 5 Years | 0 (0.0%) | 0 (0.0%) |
| 5 to 17 Years | 0 (0.0%) | 0 (0.0%) |
| 18 to 34 Years | 0 (0.0%) | 0 (0.0%) |
| 35 to 64 Years | 9 (26.5%) | 0 (0.0%) |
| 65 to 74 Years | 0 (0.0%) | 0 (0.0%) |
| 75 Years and over | 0 (0.0%) | 0 (0.0%) |
Disability Class: Cognitive Difficulty
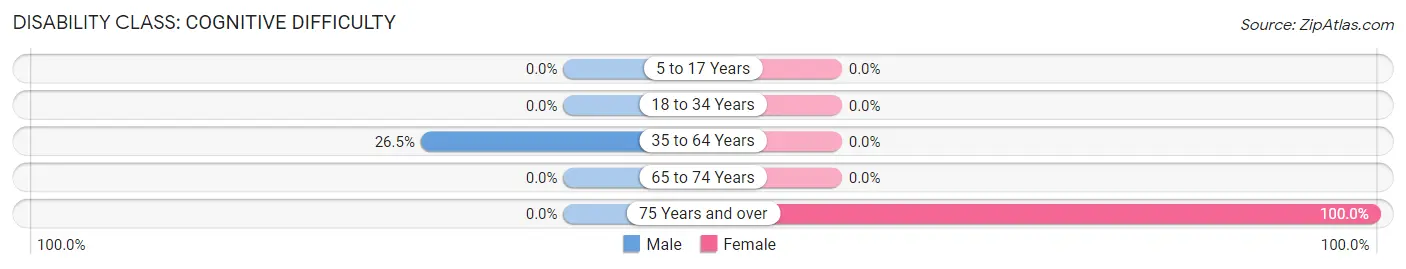
| Age Bracket | Male | Female |
| 5 to 17 Years | 0 (0.0%) | 0 (0.0%) |
| 18 to 34 Years | 0 (0.0%) | 0 (0.0%) |
| 35 to 64 Years | 9 (26.5%) | 0 (0.0%) |
| 65 to 74 Years | 0 (0.0%) | 0 (0.0%) |
| 75 Years and over | 0 (0.0%) | 6 (100.0%) |
Disability Class: Ambulatory Difficulty
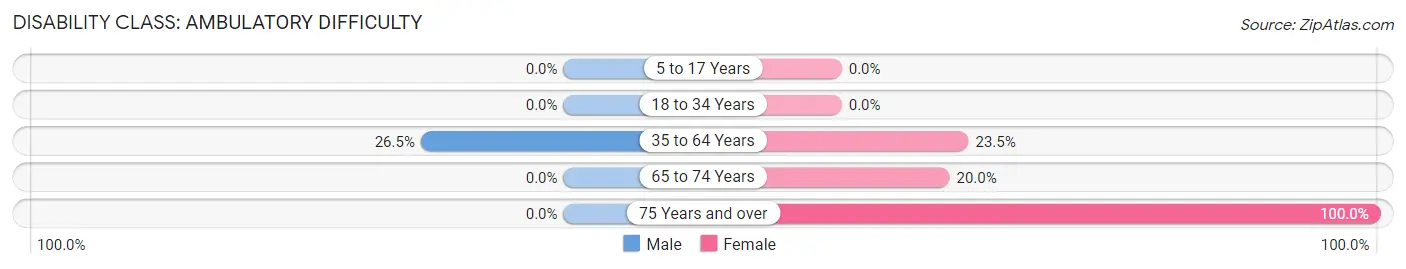
| Age Bracket | Male | Female |
| 5 to 17 Years | 0 (0.0%) | 0 (0.0%) |
| 18 to 34 Years | 0 (0.0%) | 0 (0.0%) |
| 35 to 64 Years | 9 (26.5%) | 4 (23.5%) |
| 65 to 74 Years | 0 (0.0%) | 2 (20.0%) |
| 75 Years and over | 0 (0.0%) | 6 (100.0%) |
Disability Class: Self-Care Difficulty

| Age Bracket | Male | Female |
| 5 to 17 Years | 0 (0.0%) | 0 (0.0%) |
| 18 to 34 Years | 0 (0.0%) | 0 (0.0%) |
| 35 to 64 Years | 9 (26.5%) | 0 (0.0%) |
| 65 to 74 Years | 0 (0.0%) | 0 (0.0%) |
| 75 Years and over | 0 (0.0%) | 6 (100.0%) |
Technology Access in Bieber
Computing Device Access in Bieber
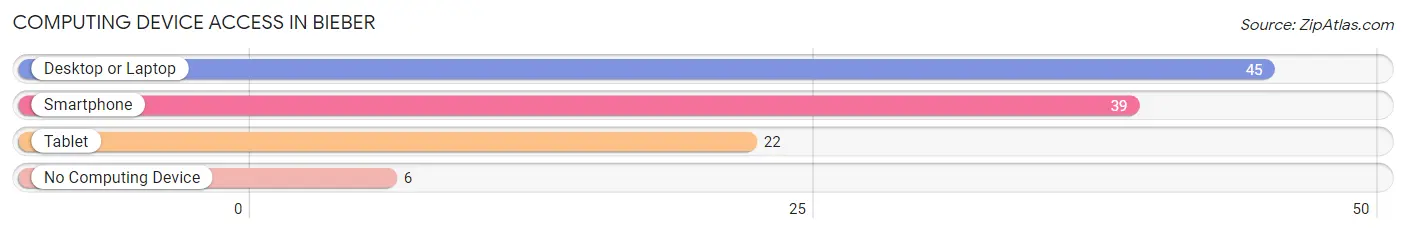
| Device Type | # Households | % Households |
| Desktop or Laptop | 45 | 75.0% |
| Smartphone | 39 | 65.0% |
| Tablet | 22 | 36.7% |
| No Computing Device | 6 | 10.0% |
| Total | 60 | 100.0% |
Internet Access in Bieber
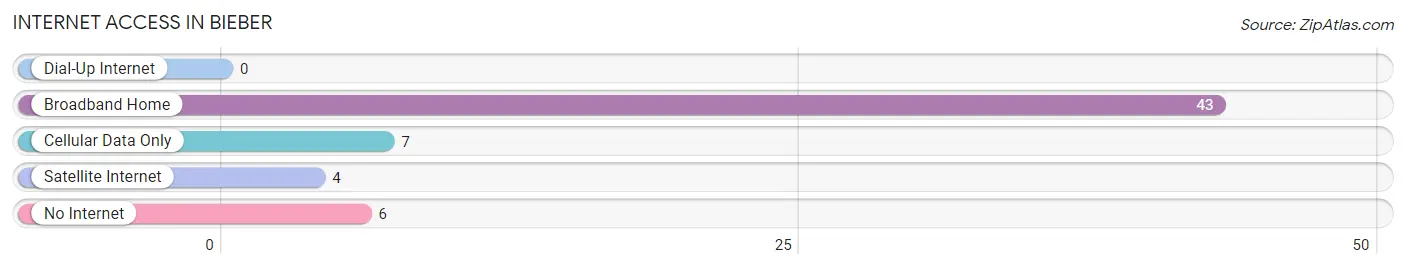
| Internet Type | # Households | % Households |
| Dial-Up Internet | 0 | 0.0% |
| Broadband Home | 43 | 71.7% |
| Cellular Data Only | 7 | 11.7% |
| Satellite Internet | 4 | 6.7% |
| No Internet | 6 | 10.0% |
| Total | 60 | 100.0% |
Bieber Summary
CA History
California is a state located on the western coast of the United States. It is the most populous state in the country and the third largest by area. California was first inhabited by Native Americans, who lived in the area for thousands of years before the arrival of Europeans. The first Europeans to explore the area were Spanish explorers, who arrived in the late 18th century. The area was then claimed by Mexico in 1821, and became part of the United States in 1848 after the Mexican-American War.
California has a rich and varied history. In the 19th century, it was a major destination for settlers from the eastern United States, and it was also a major destination for immigrants from Asia and Latin America. The Gold Rush of 1849 brought thousands of people to the state in search of fortune, and the state’s population grew rapidly. In the 20th century, California became a major center of industry and technology, and it is now home to some of the world’s largest companies.
Geography
California is located on the western coast of the United States, and it is bordered by Oregon to the north, Nevada to the east, and Mexico to the south. The state has a total area of 163,696 square miles, making it the third largest state in the country. California is divided into 58 counties, and it is home to some of the most diverse geography in the United States.
The state is home to a variety of landscapes, including mountains, deserts, forests, and beaches. The Sierra Nevada mountain range runs through the state, and it is home to some of the highest peaks in the country. The state also has a number of deserts, including the Mojave and the Sonoran. The state is also home to some of the most beautiful beaches in the world, including the famous beaches of Malibu and Santa Monica.
Economy
California has a large and diverse economy. It is the most populous state in the country, and it is home to some of the largest and most successful companies in the world. The state’s economy is driven by a variety of industries, including technology, entertainment, tourism, agriculture, and manufacturing.
California is home to some of the world’s largest technology companies, including Apple, Google, and Facebook. The state is also home to some of the world’s largest entertainment companies, including Disney, Warner Bros., and Universal Studios. Tourism is also a major industry in the state, and it is home to some of the most popular tourist destinations in the world, including Los Angeles, San Francisco, and San Diego.
Agriculture is also an important part of the state’s economy, and it is home to some of the most productive agricultural regions in the world. California is the leading producer of fruits, vegetables, and nuts in the United States, and it is also a major producer of wine. Manufacturing is also an important part of the state’s economy, and it is home to some of the largest manufacturing companies in the world, including Boeing, Lockheed Martin, and Northrop Grumman.
Demographics
California is the most populous state in the United States, with an estimated population of 39.5 million in 2019. The state is home to a diverse population, and it is one of the most ethnically diverse states in the country. The largest ethnic group in the state is Hispanic or Latino, which makes up 39.4% of the population. White people make up 36.2% of the population, while Asian people make up 14.9%. African Americans make up 6.5% of the population, and Native Americans make up 1.5%.
California is also home to a large immigrant population. In 2019, an estimated 27.2% of the state’s population was foreign-born. The largest immigrant groups in the state are from Mexico (25.2%), China (5.2%), and India (4.2%). California is also home to a large number of refugees, with an estimated 1.2 million refugees living in the state in 2019.
Common Questions
What is Per Capita Income in Bieber?
Per Capita income in Bieber is $14,548.
What is the Median Family Income in Bieber?
Median Family Income in Bieber is $50,357.
What is the Median Household income in Bieber?
Median Household Income in Bieber is $46,667.
What is Inequality or Gini Index in Bieber?
Inequality or Gini Index in Bieber is 0.20.
What is the Total Population of Bieber?
Total Population of Bieber is 151.
What is the Total Male Population of Bieber?
Total Male Population of Bieber is 72.
What is the Total Female Population of Bieber?
Total Female Population of Bieber is 79.
What is the Ratio of Males per 100 Females in Bieber?
There are 91.14 Males per 100 Females in Bieber.
What is the Ratio of Females per 100 Males in Bieber?
There are 109.72 Females per 100 Males in Bieber.
What is the Median Population Age in Bieber?
Median Population Age in Bieber is 33.6 Years.
What is the Average Family Size in Bieber
Average Family Size in Bieber is 4.0 People.
What is the Average Household Size in Bieber
Average Household Size in Bieber is 2.5 People.
How Large is the Labor Force in Bieber?
There are 33 People in the Labor Forcein in Bieber.
What is the Percentage of People in the Labor Force in Bieber?
31.1% of People are in the Labor Force in Bieber.