Bethel Island, CA Map & Demographics
Bethel Island Map
Bethel Island Overview
$47,884
PER CAPITA INCOME
$172,704
AVG FAMILY INCOME
$85,870
AVG HOUSEHOLD INCOME
0.42
INEQUALITY / GINI INDEX
1,993
TOTAL POPULATION
1,065
MALE POPULATION
928
FEMALE POPULATION
114.76
MALES / 100 FEMALES
87.14
FEMALES / 100 MALES
55.4
MEDIAN AGE
3.4
AVG FAMILY SIZE
2.4
AVG HOUSEHOLD SIZE
931
LABOR FORCE [ PEOPLE ]
54.1%
PERCENT IN LABOR FORCE
17.0%
UNEMPLOYMENT RATE
Bethel Island Zip Codes
Income in Bethel Island
Income Overview in Bethel Island
Per Capita Income in Bethel Island is $47,884, while median incomes of families and households are $172,704 and $85,870 respectively.
| Characteristic | Number | Measure |
| Per Capita Income | 1,993 | $47,884 |
| Median Family Income | 400 | $172,704 |
| Mean Family Income | 400 | $149,308 |
| Median Household Income | 842 | $85,870 |
| Mean Household Income | 842 | $113,726 |
| Income Deficit | 400 | $0 |
| Wage / Income Gap (%) | 1,993 | 0.00% |
| Wage / Income Gap ($) | 1,993 | 100.00¢ per $1 |
| Gini / Inequality Index | 1,993 | 0.42 |
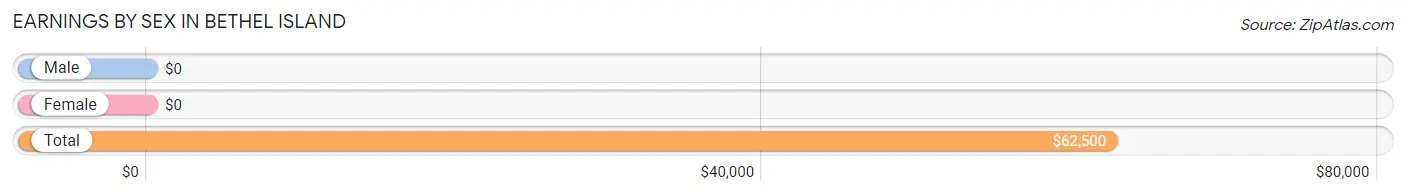
Earnings by Sex in Bethel Island
| Sex | Number | Average Earnings |
| Male | 670 (71.1%) | $0 |
| Female | 272 (28.9%) | $0 |
| Total | 942 (100.0%) | $62,500 |
Earnings by Sex by Income Bracket in Bethel Island
The most common earnings brackets in Bethel Island are $100,000+ for men (149 | 22.2%) and $100,000+ for women (133 | 48.9%).
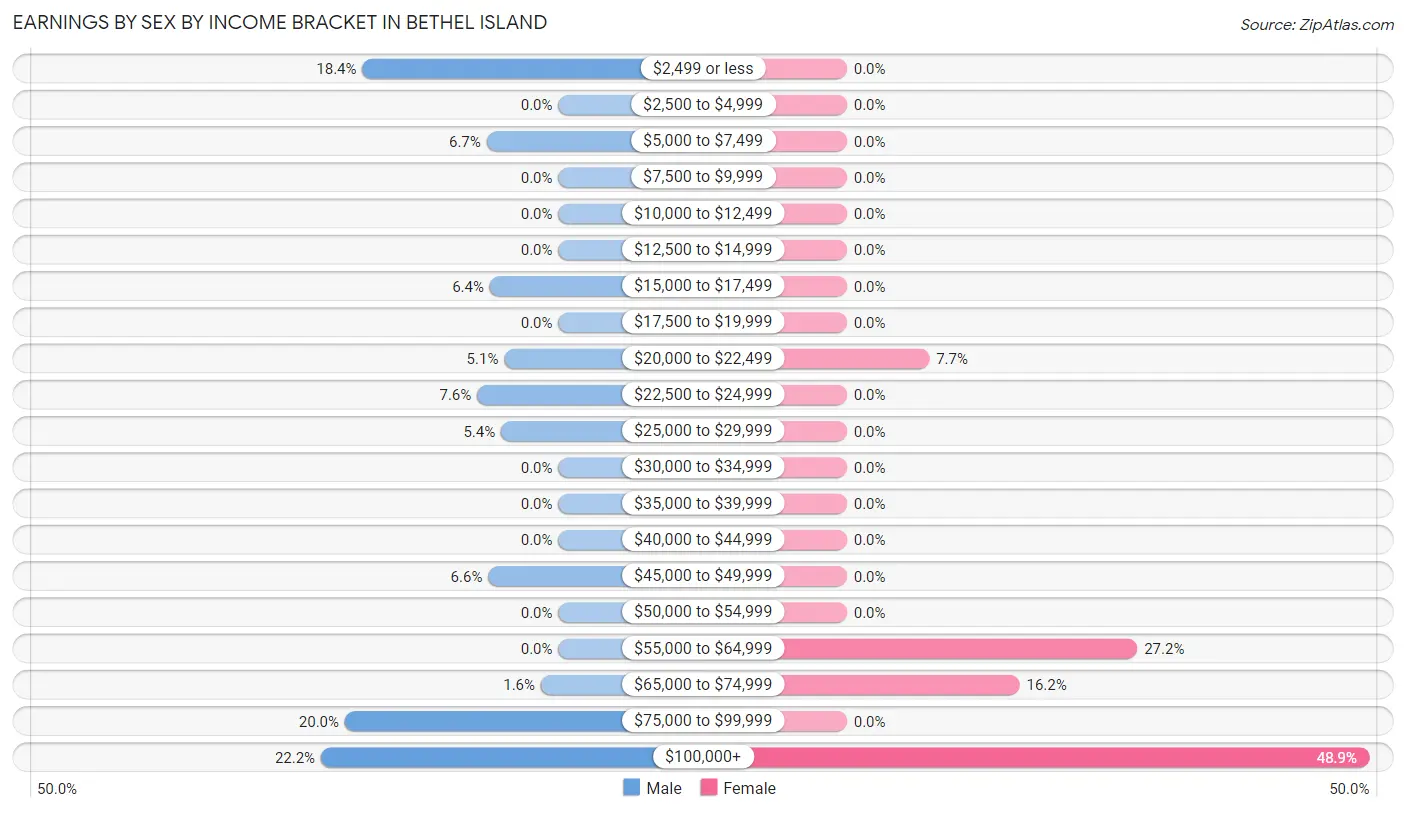
| Income | Male | Female |
| $2,499 or less | 123 (18.4%) | 0 (0.0%) |
| $2,500 to $4,999 | 0 (0.0%) | 0 (0.0%) |
| $5,000 to $7,499 | 45 (6.7%) | 0 (0.0%) |
| $7,500 to $9,999 | 0 (0.0%) | 0 (0.0%) |
| $10,000 to $12,499 | 0 (0.0%) | 0 (0.0%) |
| $12,500 to $14,999 | 0 (0.0%) | 0 (0.0%) |
| $15,000 to $17,499 | 43 (6.4%) | 0 (0.0%) |
| $17,500 to $19,999 | 0 (0.0%) | 0 (0.0%) |
| $20,000 to $22,499 | 34 (5.1%) | 21 (7.7%) |
| $22,500 to $24,999 | 51 (7.6%) | 0 (0.0%) |
| $25,000 to $29,999 | 36 (5.4%) | 0 (0.0%) |
| $30,000 to $34,999 | 0 (0.0%) | 0 (0.0%) |
| $35,000 to $39,999 | 0 (0.0%) | 0 (0.0%) |
| $40,000 to $44,999 | 0 (0.0%) | 0 (0.0%) |
| $45,000 to $49,999 | 44 (6.6%) | 0 (0.0%) |
| $50,000 to $54,999 | 0 (0.0%) | 0 (0.0%) |
| $55,000 to $64,999 | 0 (0.0%) | 74 (27.2%) |
| $65,000 to $74,999 | 11 (1.6%) | 44 (16.2%) |
| $75,000 to $99,999 | 134 (20.0%) | 0 (0.0%) |
| $100,000+ | 149 (22.2%) | 133 (48.9%) |
| Total | 670 (100.0%) | 272 (100.0%) |
Earnings by Sex by Educational Attainment in Bethel Island
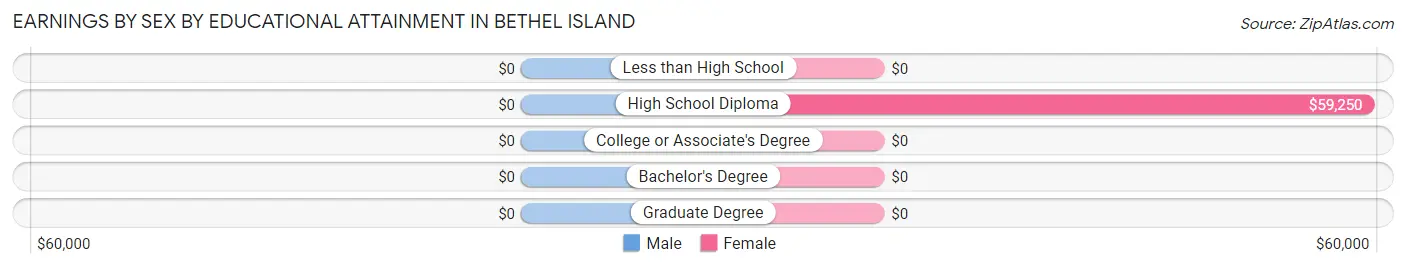
| Educational Attainment | Male Income | Female Income |
| Less than High School | - | - |
| High School Diploma | - | - |
| College or Associate's Degree | - | - |
| Bachelor's Degree | - | - |
| Graduate Degree | - | - |
| Total | $75,319 | $0 |
Family Income in Bethel Island
Family Income Brackets in Bethel Island
According to the Bethel Island family income data, there are 155 families falling into the $200,000+ income range, which is the most common income bracket and makes up 38.8% of all families.
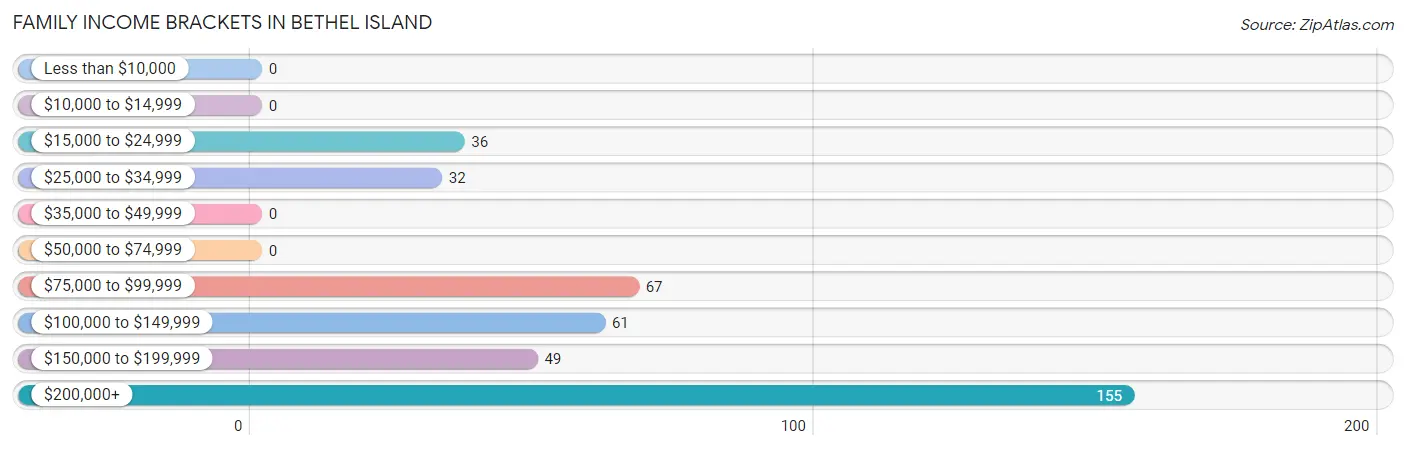
| Income Bracket | # Families | % Families |
| Less than $10,000 | 0 | 0.0% |
| $10,000 to $14,999 | 0 | 0.0% |
| $15,000 to $24,999 | 36 | 9.0% |
| $25,000 to $34,999 | 32 | 8.0% |
| $35,000 to $49,999 | 0 | 0.0% |
| $50,000 to $74,999 | 0 | 0.0% |
| $75,000 to $99,999 | 67 | 16.8% |
| $100,000 to $149,999 | 61 | 15.3% |
| $150,000 to $199,999 | 49 | 12.3% |
| $200,000+ | 155 | 38.8% |
Family Income by Famaliy Size in Bethel Island
4-person families (131 | 32.8%) account for the highest median family income in Bethel Island with $213,924 per family, while 2-person families (176 | 44.0%) have the highest median income of $87,016 per family member.
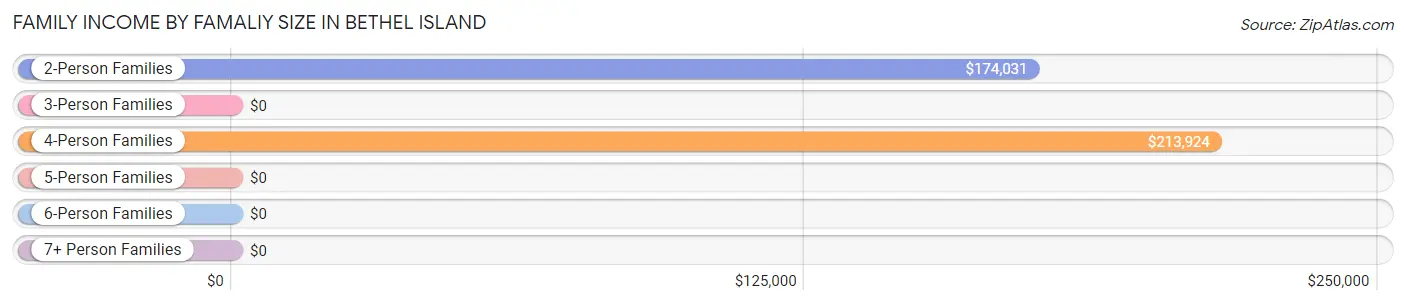
| Income Bracket | # Families | Median Income |
| 2-Person Families | 176 (44.0%) | $174,031 |
| 3-Person Families | 44 (11.0%) | $0 |
| 4-Person Families | 131 (32.8%) | $213,924 |
| 5-Person Families | 49 (12.2%) | $0 |
| 6-Person Families | 0 (0.0%) | $0 |
| 7+ Person Families | 0 (0.0%) | $0 |
| Total | 400 (100.0%) | $172,704 |
Family Income by Number of Earners in Bethel Island
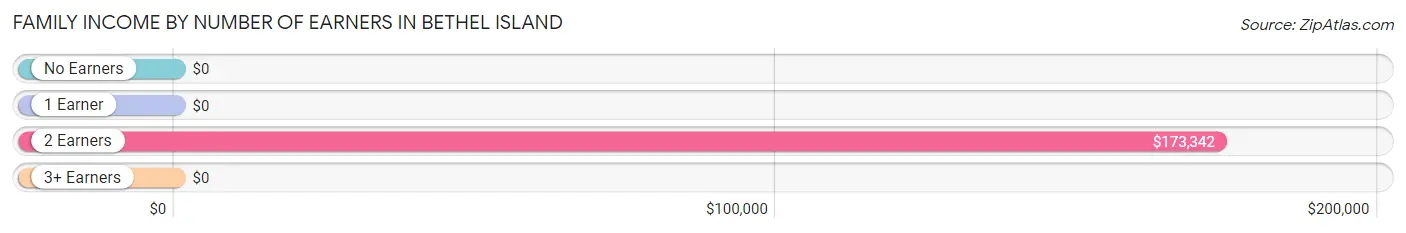
| Number of Earners | # Families | Median Income |
| No Earners | 26 (6.5%) | $0 |
| 1 Earner | 125 (31.2%) | $0 |
| 2 Earners | 213 (53.2%) | $173,342 |
| 3+ Earners | 36 (9.0%) | $0 |
| Total | 400 (100.0%) | $172,704 |
Household Income in Bethel Island
Household Income Brackets in Bethel Island
With 200 households falling in the category, the $75,000 to $99,999 income range is the most frequent in Bethel Island, accounting for 23.7% of all households.
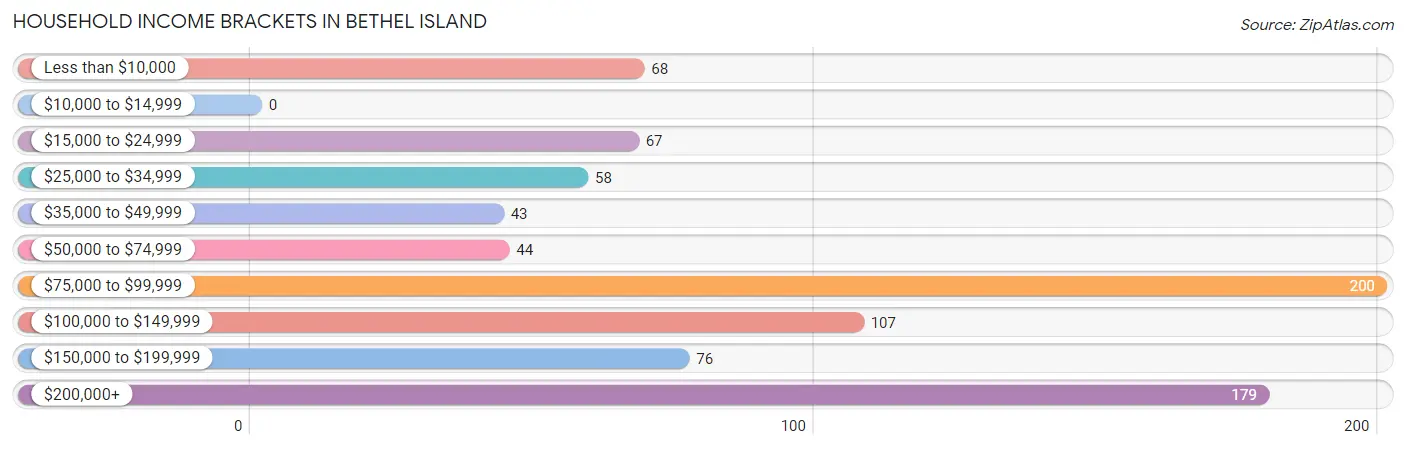
| Income Bracket | # Households | % Households |
| Less than $10,000 | 68 | 8.1% |
| $10,000 to $14,999 | 0 | 0.0% |
| $15,000 to $24,999 | 67 | 8.0% |
| $25,000 to $34,999 | 58 | 6.9% |
| $35,000 to $49,999 | 43 | 5.1% |
| $50,000 to $74,999 | 44 | 5.2% |
| $75,000 to $99,999 | 200 | 23.8% |
| $100,000 to $149,999 | 107 | 12.7% |
| $150,000 to $199,999 | 76 | 9.0% |
| $200,000+ | 179 | 21.3% |
Household Income by Householder Age in Bethel Island
The median household income in Bethel Island is $85,870, with the highest median household income of $173,546 found in the 45 to 64 years age bracket for the primary householder. A total of 275 households (32.7%) fall into this category.
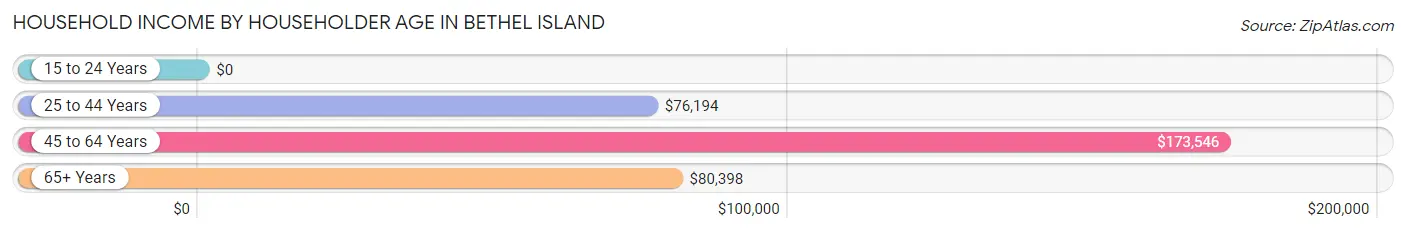
| Income Bracket | # Households | Median Income |
| 15 to 24 Years | 0 (0.0%) | $0 |
| 25 to 44 Years | 200 (23.7%) | $76,194 |
| 45 to 64 Years | 275 (32.7%) | $173,546 |
| 65+ Years | 367 (43.6%) | $80,398 |
| Total | 842 (100.0%) | $85,870 |
Poverty in Bethel Island
Income Below Poverty by Sex and Age in Bethel Island
With 14.0% poverty level for males and 22.1% for females among the residents of Bethel Island, 35 to 44 year old males and 25 to 34 year old females are the most vulnerable to poverty, with 43 males (27.0%) and 36 females (100.0%) in their respective age groups living below the poverty level.
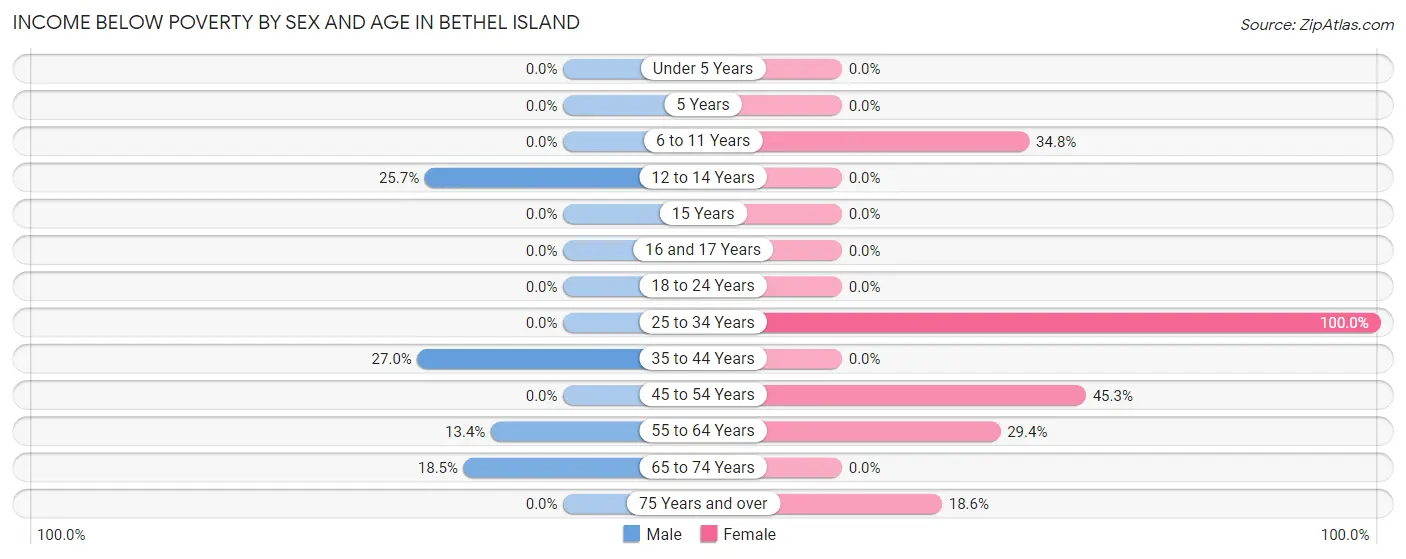
| Age Bracket | Male | Female |
| Under 5 Years | 0 (0.0%) | 0 (0.0%) |
| 5 Years | 0 (0.0%) | 0 (0.0%) |
| 6 to 11 Years | 0 (0.0%) | 40 (34.8%) |
| 12 to 14 Years | 38 (25.7%) | 0 (0.0%) |
| 15 Years | 0 (0.0%) | 0 (0.0%) |
| 16 and 17 Years | 0 (0.0%) | 0 (0.0%) |
| 18 to 24 Years | 0 (0.0%) | 0 (0.0%) |
| 25 to 34 Years | 0 (0.0%) | 36 (100.0%) |
| 35 to 44 Years | 43 (27.0%) | 0 (0.0%) |
| 45 to 54 Years | 0 (0.0%) | 48 (45.3%) |
| 55 to 64 Years | 39 (13.4%) | 50 (29.4%) |
| 65 to 74 Years | 29 (18.5%) | 0 (0.0%) |
| 75 Years and over | 0 (0.0%) | 31 (18.6%) |
| Total | 149 (14.0%) | 205 (22.1%) |
Income Above Poverty by Sex and Age in Bethel Island
According to the poverty statistics in Bethel Island, males aged 16 and 17 years and females aged 12 to 14 years are the age groups that are most secure financially, with 100.0% of males and 100.0% of females in these age groups living above the poverty line.
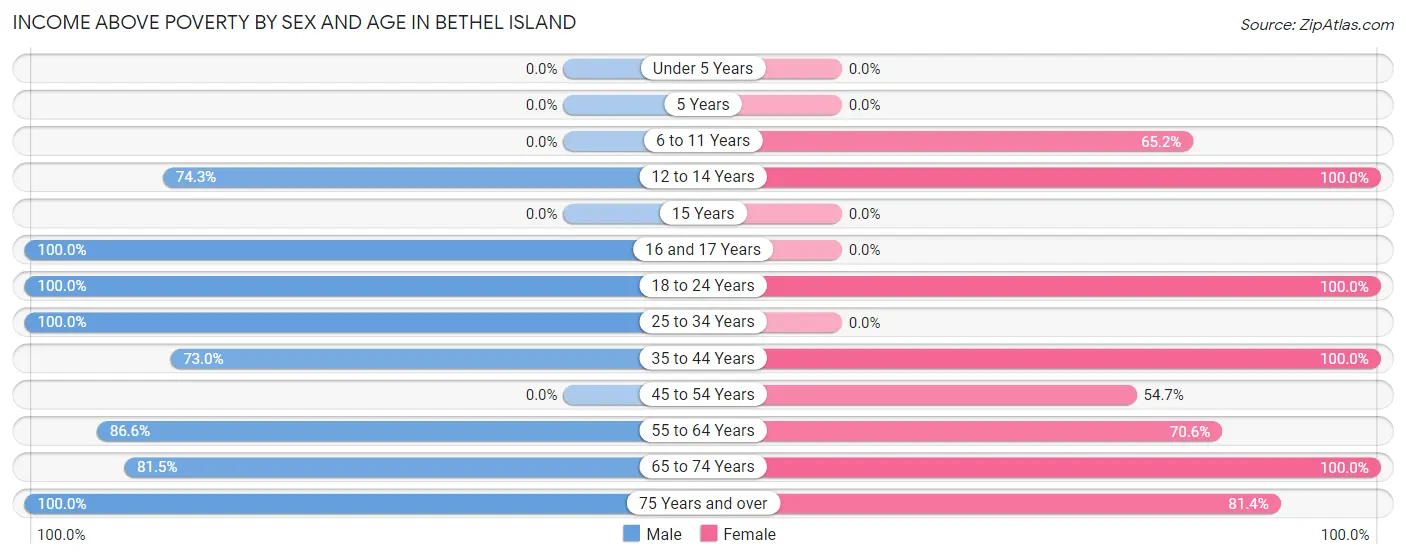
| Age Bracket | Male | Female |
| Under 5 Years | 0 (0.0%) | 0 (0.0%) |
| 5 Years | 0 (0.0%) | 0 (0.0%) |
| 6 to 11 Years | 0 (0.0%) | 75 (65.2%) |
| 12 to 14 Years | 110 (74.3%) | 9 (100.0%) |
| 15 Years | 0 (0.0%) | 0 (0.0%) |
| 16 and 17 Years | 27 (100.0%) | 0 (0.0%) |
| 18 to 24 Years | 127 (100.0%) | 71 (100.0%) |
| 25 to 34 Years | 122 (100.0%) | 0 (0.0%) |
| 35 to 44 Years | 116 (73.0%) | 60 (100.0%) |
| 45 to 54 Years | 0 (0.0%) | 58 (54.7%) |
| 55 to 64 Years | 252 (86.6%) | 120 (70.6%) |
| 65 to 74 Years | 128 (81.5%) | 194 (100.0%) |
| 75 Years and over | 34 (100.0%) | 136 (81.4%) |
| Total | 916 (86.0%) | 723 (77.9%) |
Income Below Poverty Among Married-Couple Families in Bethel Island
The poverty statistics for married-couple families in Bethel Island show that 11.1% or 36 of the total 324 families live below the poverty line. Families with 1 or 2 children have the highest poverty rate of 30.5%, comprising of 36 families. On the other hand, families with no children have the lowest poverty rate of 0.0%, which includes 0 families.
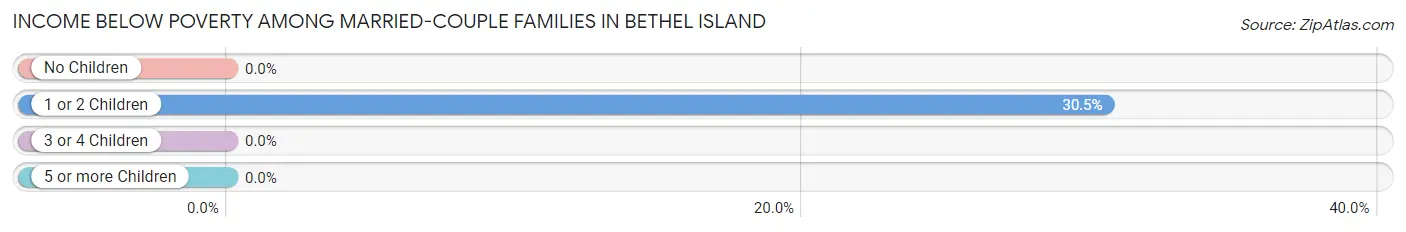
| Children | Above Poverty | Below Poverty |
| No Children | 180 (100.0%) | 0 (0.0%) |
| 1 or 2 Children | 82 (69.5%) | 36 (30.5%) |
| 3 or 4 Children | 26 (100.0%) | 0 (0.0%) |
| 5 or more Children | 0 (0.0%) | 0 (0.0%) |
| Total | 288 (88.9%) | 36 (11.1%) |
Income Below Poverty Among Single-Parent Households in Bethel Island
| Children | Single Father | Single Mother |
| No Children | 0 (0.0%) | 0 (0.0%) |
| 1 or 2 Children | 0 (0.0%) | 0 (0.0%) |
| 3 or 4 Children | 0 (0.0%) | 0 (0.0%) |
| 5 or more Children | 0 (0.0%) | 0 (0.0%) |
| Total | 0 (0.0%) | 0 (0.0%) |
Income Below Poverty Among Married-Couple vs Single-Parent Households in Bethel Island
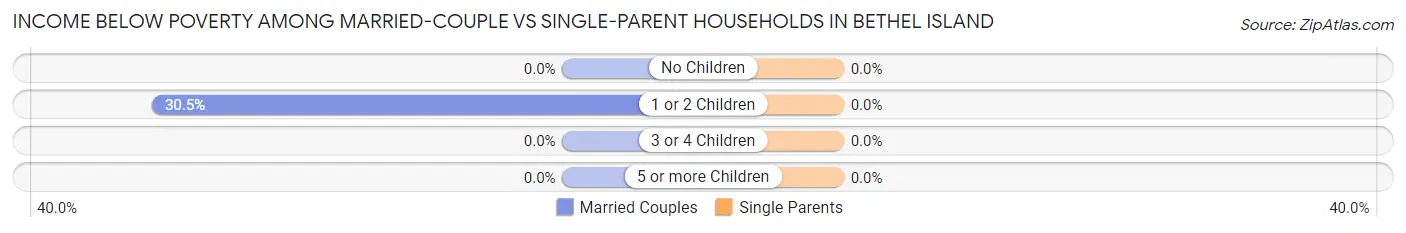
| Children | Married-Couple Families | Single-Parent Households |
| No Children | 0 (0.0%) | 0 (0.0%) |
| 1 or 2 Children | 36 (30.5%) | 0 (0.0%) |
| 3 or 4 Children | 0 (0.0%) | 0 (0.0%) |
| 5 or more Children | 0 (0.0%) | 0 (0.0%) |
| Total | 36 (11.1%) | 0 (0.0%) |
Race in Bethel Island
The most populous races in Bethel Island are White / Caucasian (1,416 | 71.1%), Hispanic or Latino (435 | 21.8%), and Some other Race (346 | 17.4%).
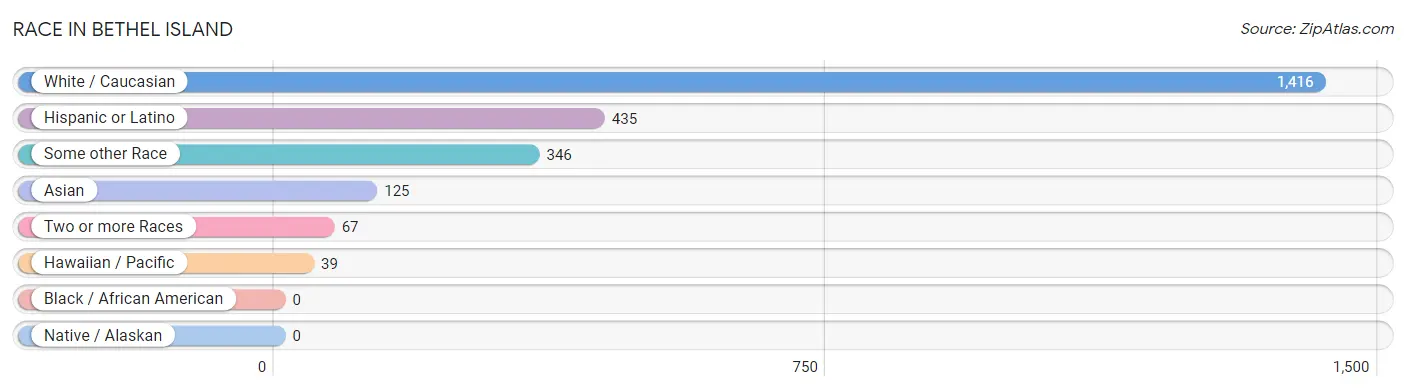
| Race | # Population | % Population |
| Asian | 125 | 6.3% |
| Black / African American | 0 | 0.0% |
| Hawaiian / Pacific | 39 | 2.0% |
| Hispanic or Latino | 435 | 21.8% |
| Native / Alaskan | 0 | 0.0% |
| White / Caucasian | 1,416 | 71.1% |
| Two or more Races | 67 | 3.4% |
| Some other Race | 346 | 17.4% |
| Total | 1,993 | 100.0% |
Ancestry in Bethel Island
The most populous ancestries reported in Bethel Island are Mexican (435 | 21.8%), German (250 | 12.5%), Italian (181 | 9.1%), English (150 | 7.5%), and Scottish (104 | 5.2%), together accounting for 56.2% of all Bethel Island residents.
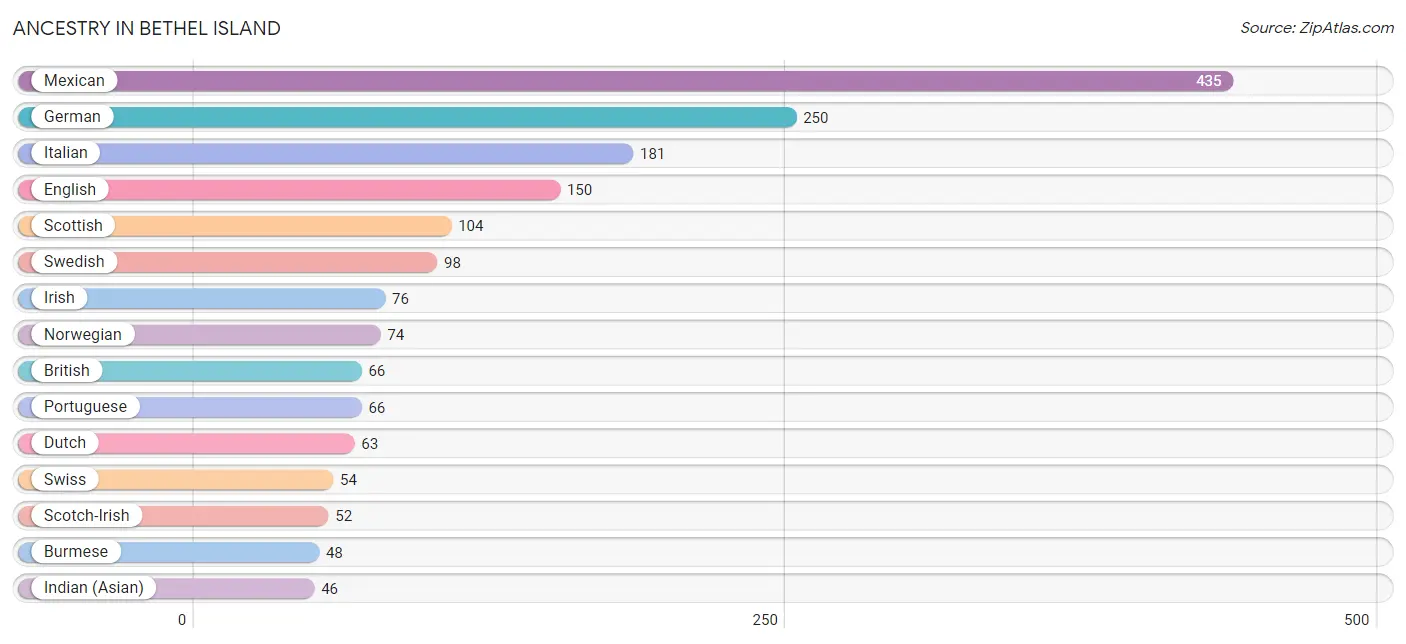
| Ancestry | # Population | % Population |
| American | 29 | 1.5% |
| British | 66 | 3.3% |
| Burmese | 48 | 2.4% |
| Dutch | 63 | 3.2% |
| English | 150 | 7.5% |
| German | 250 | 12.5% |
| Indian (Asian) | 46 | 2.3% |
| Irish | 76 | 3.8% |
| Italian | 181 | 9.1% |
| Korean | 31 | 1.6% |
| Mexican | 435 | 21.8% |
| Norwegian | 74 | 3.7% |
| Polish | 34 | 1.7% |
| Portuguese | 66 | 3.3% |
| Samoan | 39 | 2.0% |
| Scotch-Irish | 52 | 2.6% |
| Scottish | 104 | 5.2% |
| Slovak | 34 | 1.7% |
| Swedish | 98 | 4.9% |
| Swiss | 54 | 2.7% | View All 20 Rows |
Immigrants in Bethel Island
The most numerous immigrant groups reported in Bethel Island came from Central America (126 | 6.3%), Latin America (126 | 6.3%), Mexico (126 | 6.3%), Europe (77 | 3.9%), and Asia (72 | 3.6%), together accounting for 26.4% of all Bethel Island residents.
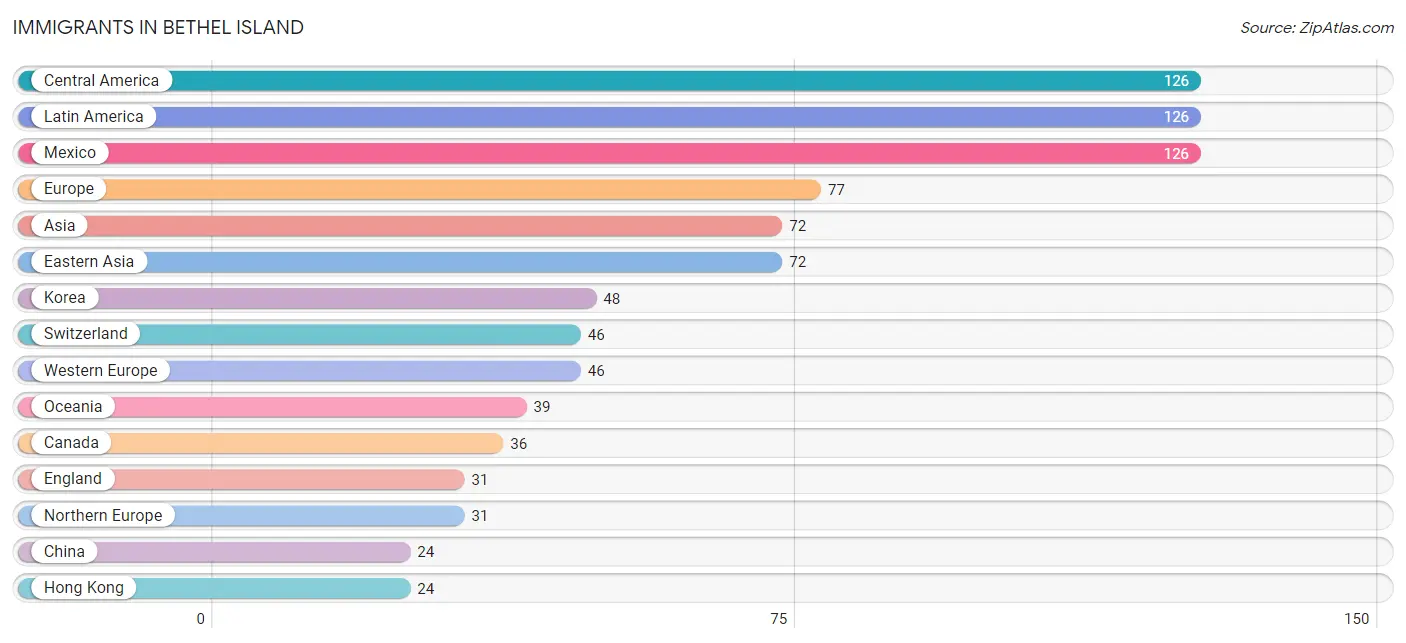
| Immigration Origin | # Population | % Population |
| Asia | 72 | 3.6% |
| Canada | 36 | 1.8% |
| Central America | 126 | 6.3% |
| China | 24 | 1.2% |
| Eastern Asia | 72 | 3.6% |
| England | 31 | 1.6% |
| Europe | 77 | 3.9% |
| Hong Kong | 24 | 1.2% |
| Korea | 48 | 2.4% |
| Latin America | 126 | 6.3% |
| Mexico | 126 | 6.3% |
| Northern Europe | 31 | 1.6% |
| Oceania | 39 | 2.0% |
| Switzerland | 46 | 2.3% |
| Western Europe | 46 | 2.3% | View All 15 Rows |
Sex and Age in Bethel Island
Sex and Age in Bethel Island
The most populous age groups in Bethel Island are 55 to 59 Years (150 | 14.1%) for men and 70 to 74 Years (150 | 16.2%) for women.
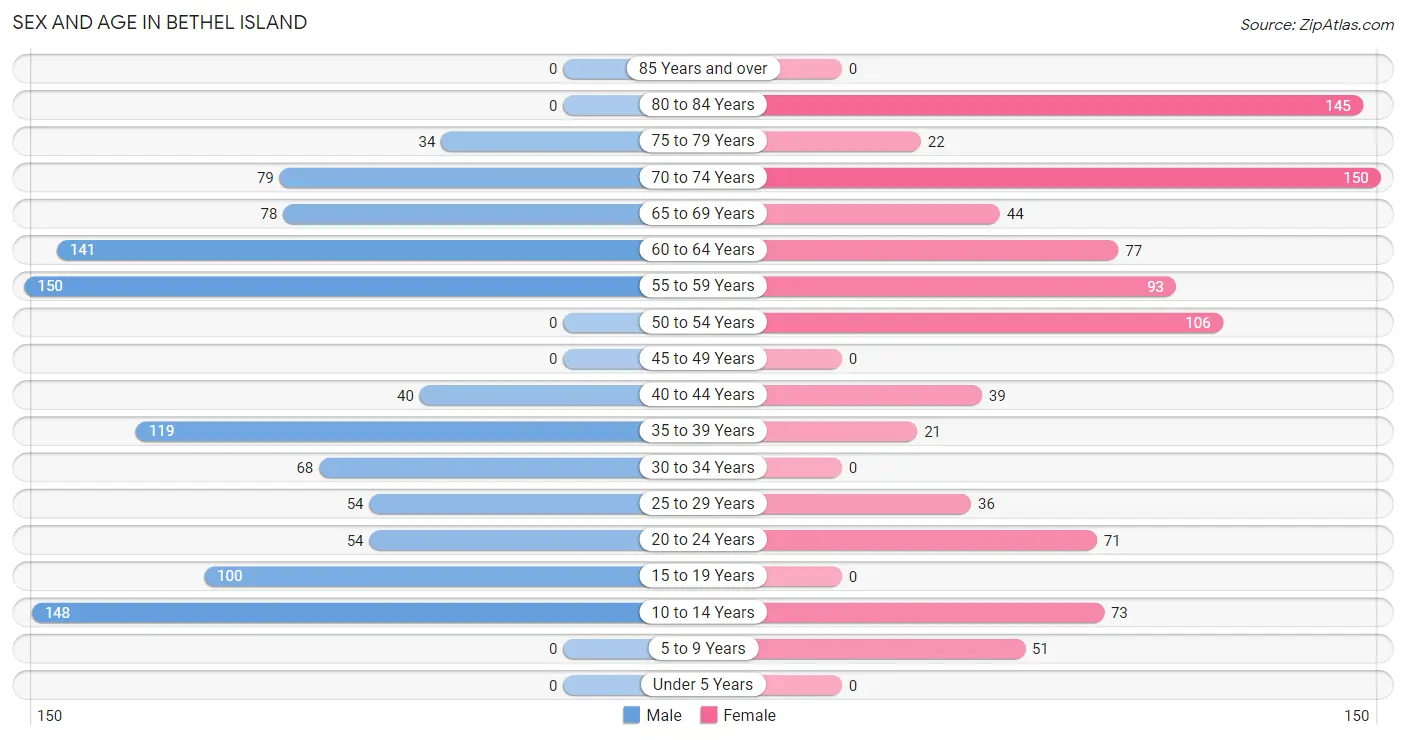
| Age Bracket | Male | Female |
| Under 5 Years | 0 (0.0%) | 0 (0.0%) |
| 5 to 9 Years | 0 (0.0%) | 51 (5.5%) |
| 10 to 14 Years | 148 (13.9%) | 73 (7.9%) |
| 15 to 19 Years | 100 (9.4%) | 0 (0.0%) |
| 20 to 24 Years | 54 (5.1%) | 71 (7.6%) |
| 25 to 29 Years | 54 (5.1%) | 36 (3.9%) |
| 30 to 34 Years | 68 (6.4%) | 0 (0.0%) |
| 35 to 39 Years | 119 (11.2%) | 21 (2.3%) |
| 40 to 44 Years | 40 (3.8%) | 39 (4.2%) |
| 45 to 49 Years | 0 (0.0%) | 0 (0.0%) |
| 50 to 54 Years | 0 (0.0%) | 106 (11.4%) |
| 55 to 59 Years | 150 (14.1%) | 93 (10.0%) |
| 60 to 64 Years | 141 (13.2%) | 77 (8.3%) |
| 65 to 69 Years | 78 (7.3%) | 44 (4.7%) |
| 70 to 74 Years | 79 (7.4%) | 150 (16.2%) |
| 75 to 79 Years | 34 (3.2%) | 22 (2.4%) |
| 80 to 84 Years | 0 (0.0%) | 145 (15.6%) |
| 85 Years and over | 0 (0.0%) | 0 (0.0%) |
| Total | 1,065 (100.0%) | 928 (100.0%) |
Families and Households in Bethel Island
Median Family Size in Bethel Island
The median family size in Bethel Island is 3.38 persons per family, with single female/mother families (44 | 11.0%) accounting for the largest median family size of 3.84 persons per family. On the other hand, single male/father families (32 | 8.0%) represent the smallest median family size with 2.13 persons per family.
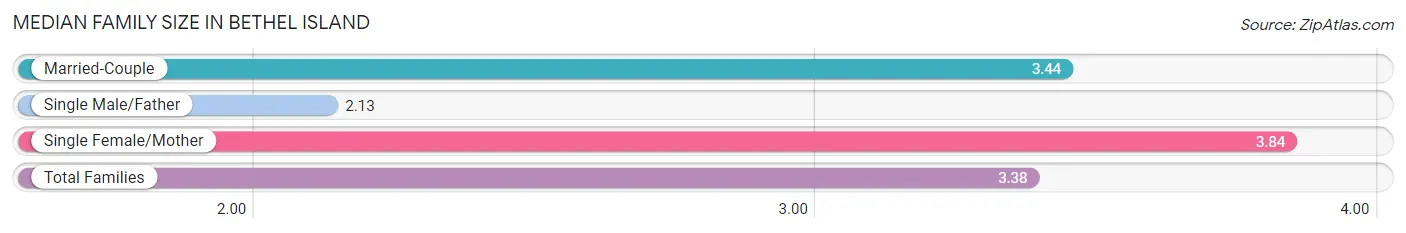
| Family Type | # Families | Family Size |
| Married-Couple | 324 (81.0%) | 3.44 |
| Single Male/Father | 32 (8.0%) | 2.13 |
| Single Female/Mother | 44 (11.0%) | 3.84 |
| Total Families | 400 (100.0%) | 3.38 |
Median Household Size in Bethel Island
The median household size in Bethel Island is 2.37 persons per household, with single female/mother households (44 | 5.2%) accounting for the largest median household size of 6.07 persons per household. non-family households (442 | 52.5%) represent the smallest median household size with 1.23 persons per household.
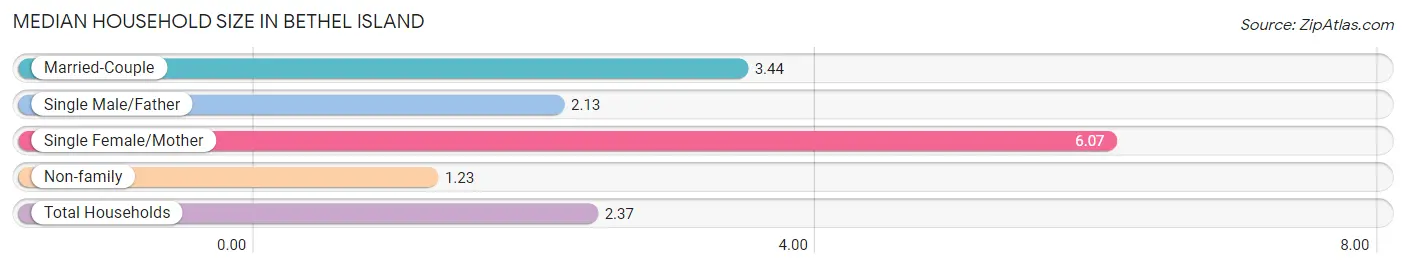
| Household Type | # Households | Household Size |
| Married-Couple | 324 (38.5%) | 3.44 |
| Single Male/Father | 32 (3.8%) | 2.13 |
| Single Female/Mother | 44 (5.2%) | 6.07 |
| Non-family | 442 (52.5%) | 1.23 |
| Total Households | 842 (100.0%) | 2.37 |
Household Size by Marriage Status in Bethel Island
Out of a total of 842 households in Bethel Island, 400 (47.5%) are family households, while 442 (52.5%) are nonfamily households. The most numerous type of family households are 2-person households, comprising 176, and the most common type of nonfamily households are 1-person households, comprising 308.
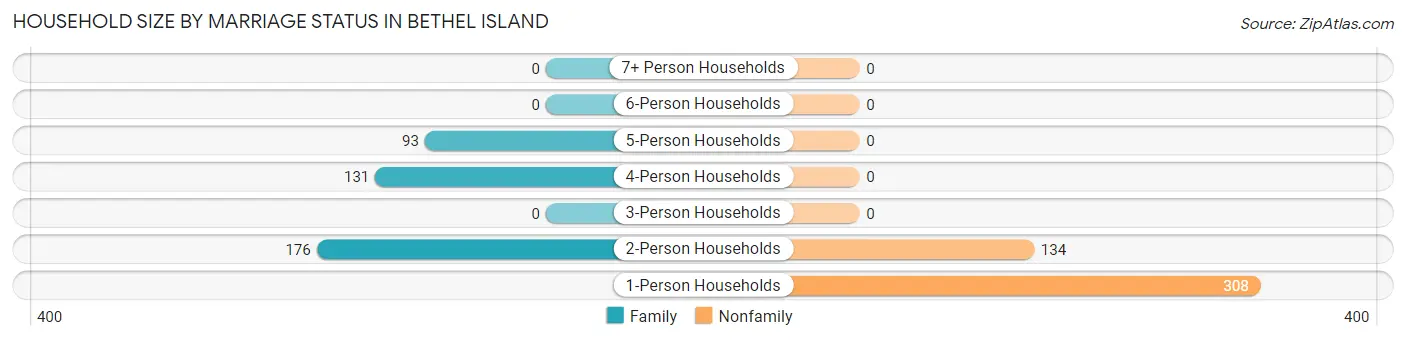
| Household Size | Family Households | Nonfamily Households |
| 1-Person Households | - | 308 (36.6%) |
| 2-Person Households | 176 (20.9%) | 134 (15.9%) |
| 3-Person Households | 0 (0.0%) | 0 (0.0%) |
| 4-Person Households | 131 (15.6%) | 0 (0.0%) |
| 5-Person Households | 93 (11.1%) | 0 (0.0%) |
| 6-Person Households | 0 (0.0%) | 0 (0.0%) |
| 7+ Person Households | 0 (0.0%) | 0 (0.0%) |
| Total | 400 (47.5%) | 442 (52.5%) |
Female Fertility in Bethel Island
Fertility by Age in Bethel Island
| Age Bracket | Women with Births | Births / 1,000 Women |
| 15 to 19 years | 0 (0.0%) | 0.0 |
| 20 to 34 years | 0 (0.0%) | 0.0 |
| 35 to 50 years | 0 (0.0%) | 0.0 |
| Total | 0 (0.0%) | 0.0 |
Fertility by Age by Marriage Status in Bethel Island
| Age Bracket | Married | Unmarried |
| 15 to 19 years | 0 (0.0%) | 0 (0.0%) |
| 20 to 34 years | 0 (0.0%) | 0 (0.0%) |
| 35 to 50 years | 0 (0.0%) | 0 (0.0%) |
| Total | 0 (0.0%) | 0 (0.0%) |
Fertility by Education in Bethel Island
| Educational Attainment | Women with Births | Births / 1,000 Women |
| Less than High School | 0 (0.0%) | 0.0 |
| High School Diploma | 0 (0.0%) | 0.0 |
| College or Associate's Degree | 0 (0.0%) | 0.0 |
| Bachelor's Degree | 0 (0.0%) | 0.0 |
| Graduate Degree | 0 (0.0%) | 0.0 |
| Total | 0 (0.0%) | 0.0 |
Fertility by Education by Marriage Status in Bethel Island
| Educational Attainment | Married | Unmarried |
| Less than High School | 0 (0.0%) | 0 (0.0%) |
| High School Diploma | 0 (0.0%) | 0 (0.0%) |
| College or Associate's Degree | 0 (0.0%) | 0 (0.0%) |
| Bachelor's Degree | 0 (0.0%) | 0 (0.0%) |
| Graduate Degree | 0 (0.0%) | 0 (0.0%) |
| Total | 0 (0.0%) | 0 (0.0%) |
Employment Characteristics in Bethel Island
Employment by Class of Employer in Bethel Island
Among the 752 employed individuals in Bethel Island, private company employees (465 | 61.8%), self-employed (not incorporated) (154 | 20.5%), and self-employed (incorporated) (79 | 10.5%) make up the most common classes of employment.
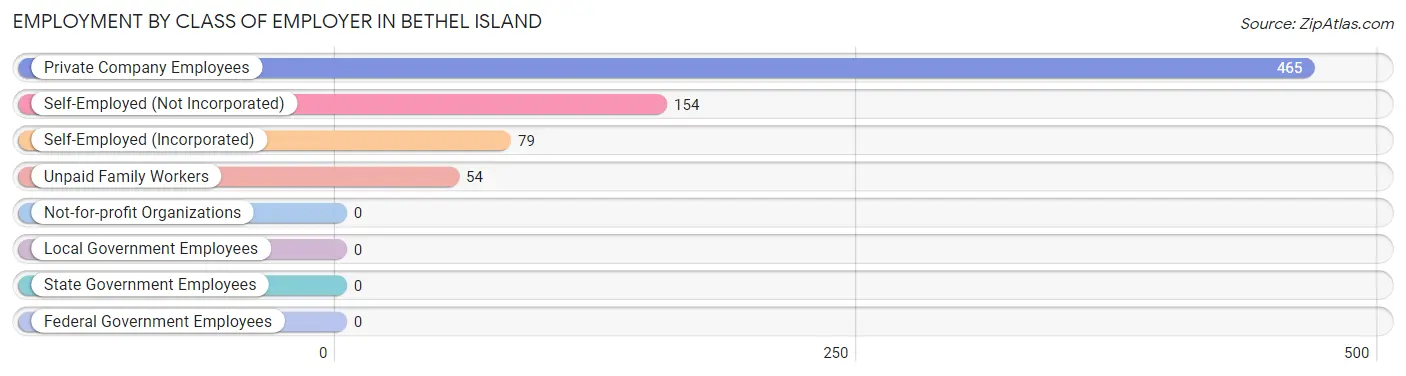
| Employer Class | # Employees | % Employees |
| Private Company Employees | 465 | 61.8% |
| Self-Employed (Incorporated) | 79 | 10.5% |
| Self-Employed (Not Incorporated) | 154 | 20.5% |
| Not-for-profit Organizations | 0 | 0.0% |
| Local Government Employees | 0 | 0.0% |
| State Government Employees | 0 | 0.0% |
| Federal Government Employees | 0 | 0.0% |
| Unpaid Family Workers | 54 | 7.2% |
| Total | 752 | 100.0% |
Employment Status by Age in Bethel Island
According to the labor force statistics for Bethel Island, out of the total population over 16 years of age (1,721), 54.1% or 931 individuals are in the labor force, with 17.0% or 158 of them unemployed. The age group with the highest labor force participation rate is 30 to 34 years, with 100.0% or 68 individuals in the labor force. Within the labor force, the 30 to 34 years age range has the highest percentage of unemployed individuals, with 52.9% or 36 of them being unemployed.
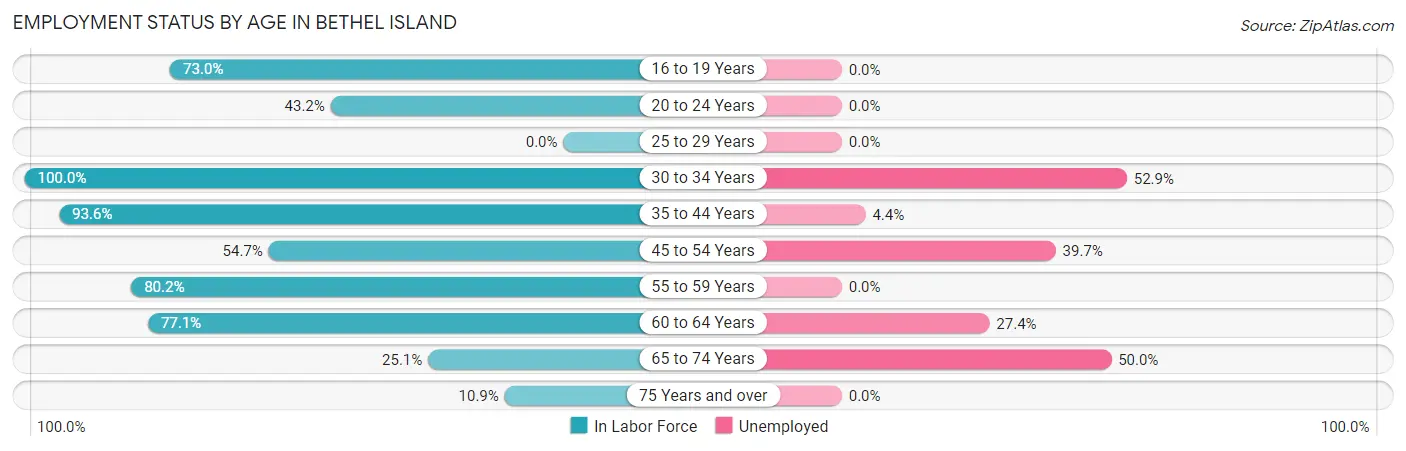
| Age Bracket | In Labor Force | Unemployed |
| 16 to 19 Years | 73 (73.0%) | 0 (0.0%) |
| 20 to 24 Years | 54 (43.2%) | 0 (0.0%) |
| 25 to 29 Years | 0 (0.0%) | 0 (0.0%) |
| 30 to 34 Years | 68 (100.0%) | 36 (52.9%) |
| 35 to 44 Years | 205 (93.6%) | 9 (4.4%) |
| 45 to 54 Years | 58 (54.7%) | 23 (39.7%) |
| 55 to 59 Years | 195 (80.2%) | 0 (0.0%) |
| 60 to 64 Years | 168 (77.1%) | 46 (27.4%) |
| 65 to 74 Years | 88 (25.1%) | 44 (50.0%) |
| 75 Years and over | 22 (10.9%) | 0 (0.0%) |
| Total | 931 (54.1%) | 158 (17.0%) |
Employment Status by Educational Attainment in Bethel Island
According to labor force statistics for Bethel Island, 73.5% of individuals (694) out of the total population between 25 and 64 years of age (944) are in the labor force, with 16.4% or 114 of them being unemployed. The group with the highest labor force participation rate are those with the educational attainment of bachelor's degree or higher, with 89.7% or 122 individuals in the labor force. Within the labor force, individuals with bachelor's degree or higher education have the highest percentage of unemployment, with 37.7% or 46 of them being unemployed.
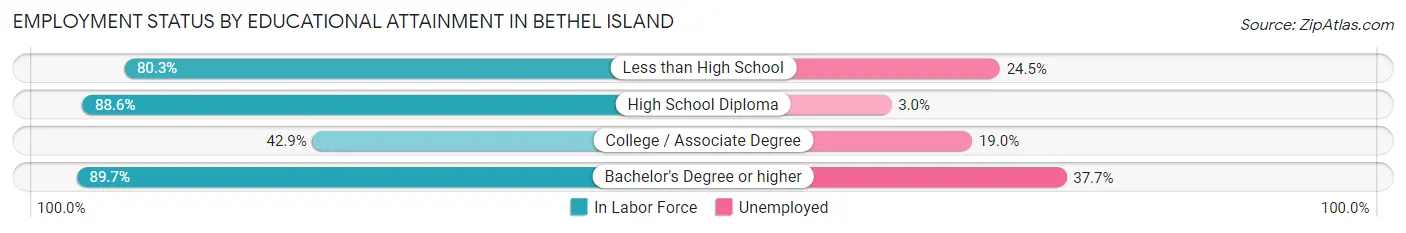
| Educational Attainment | In Labor Force | Unemployed |
| Less than High School | 147 (80.3%) | 45 (24.5%) |
| High School Diploma | 304 (88.6%) | 10 (3.0%) |
| College / Associate Degree | 121 (42.9%) | 54 (19.0%) |
| Bachelor's Degree or higher | 122 (89.7%) | 51 (37.7%) |
| Total | 694 (73.5%) | 155 (16.4%) |
Employment Occupations by Sex in Bethel Island
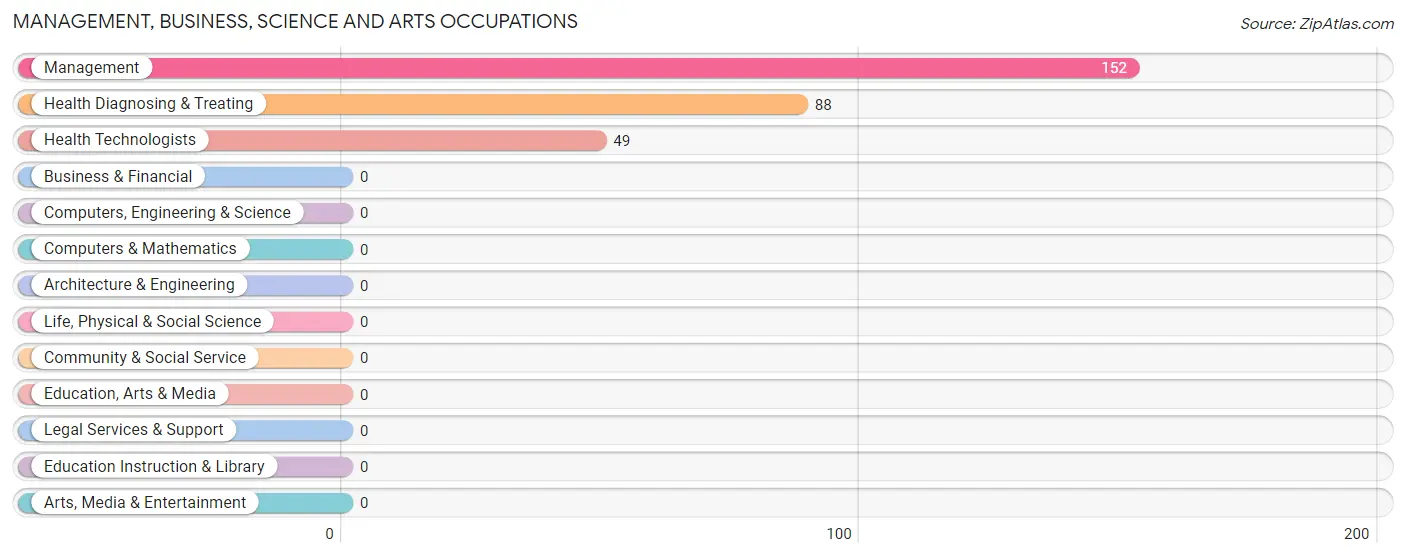
Management, Business, Science and Arts Occupations
The most common Management, Business, Science and Arts occupations in Bethel Island are Management (152 | 19.7%), Health Diagnosing & Treating (88 | 11.4%), and Health Technologists (49 | 6.3%).
Management, Business, Science and Arts Occupations by Sex
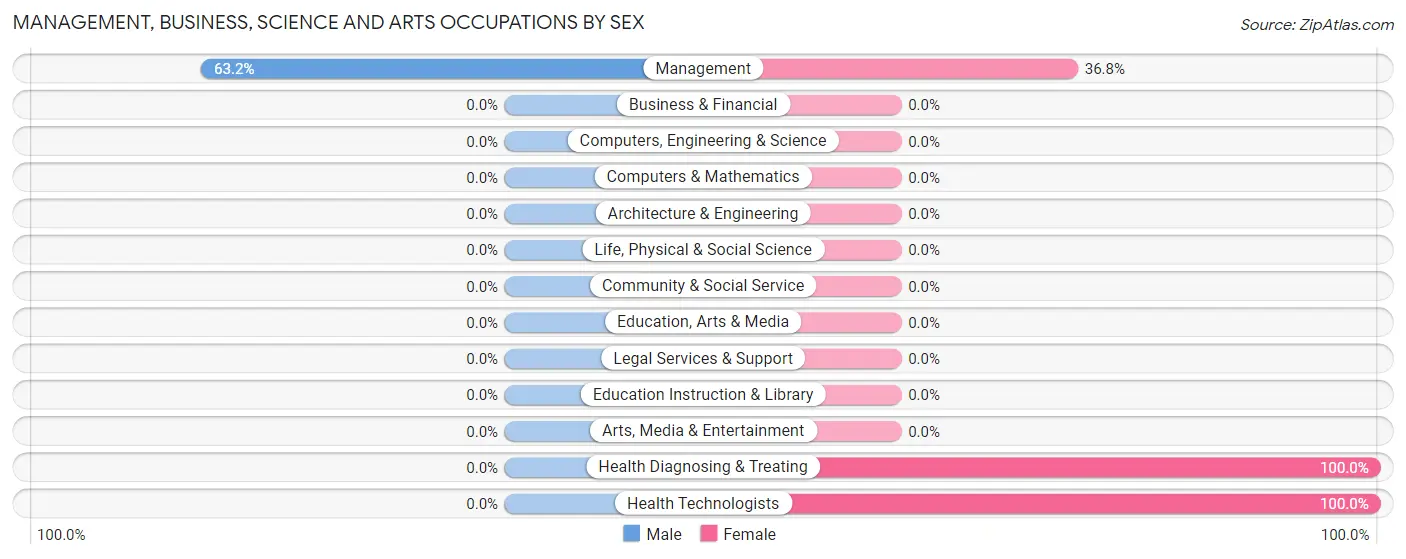
| Occupation | Male | Female |
| Management | 96 (63.2%) | 56 (36.8%) |
| Business & Financial | 0 (0.0%) | 0 (0.0%) |
| Computers, Engineering & Science | 0 (0.0%) | 0 (0.0%) |
| Computers & Mathematics | 0 (0.0%) | 0 (0.0%) |
| Architecture & Engineering | 0 (0.0%) | 0 (0.0%) |
| Life, Physical & Social Science | 0 (0.0%) | 0 (0.0%) |
| Community & Social Service | 0 (0.0%) | 0 (0.0%) |
| Education, Arts & Media | 0 (0.0%) | 0 (0.0%) |
| Legal Services & Support | 0 (0.0%) | 0 (0.0%) |
| Education Instruction & Library | 0 (0.0%) | 0 (0.0%) |
| Arts, Media & Entertainment | 0 (0.0%) | 0 (0.0%) |
| Health Diagnosing & Treating | 0 (0.0%) | 88 (100.0%) |
| Health Technologists | 0 (0.0%) | 49 (100.0%) |
| Total (Category) | 96 (40.0%) | 144 (60.0%) |
| Total (Overall) | 501 (64.8%) | 272 (35.2%) |
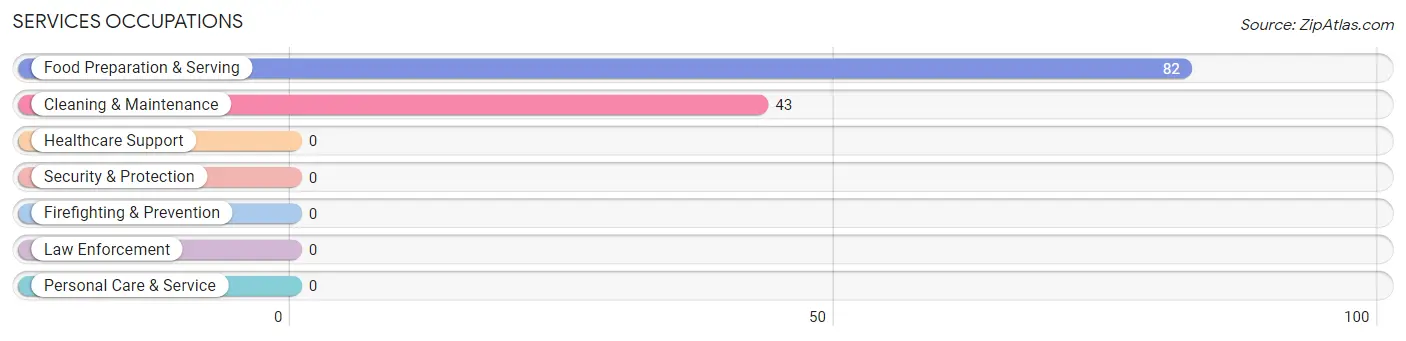
Services Occupations
The most common Services occupations in Bethel Island are Food Preparation & Serving (82 | 10.6%), and Cleaning & Maintenance (43 | 5.6%).
Services Occupations by Sex
| Occupation | Male | Female |
| Healthcare Support | 0 (0.0%) | 0 (0.0%) |
| Security & Protection | 0 (0.0%) | 0 (0.0%) |
| Firefighting & Prevention | 0 (0.0%) | 0 (0.0%) |
| Law Enforcement | 0 (0.0%) | 0 (0.0%) |
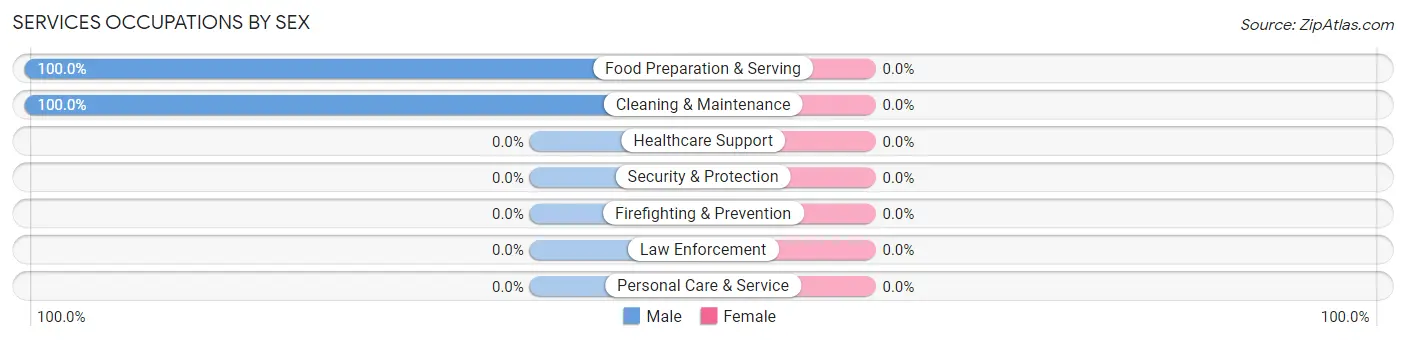
| Food Preparation & Serving | 82 (100.0%) | 0 (0.0%) |
| Cleaning & Maintenance | 43 (100.0%) | 0 (0.0%) |
| Personal Care & Service | 0 (0.0%) | 0 (0.0%) |
| Total (Category) | 125 (100.0%) | 0 (0.0%) |
| Total (Overall) | 501 (64.8%) | 272 (35.2%) |
Sales and Office Occupations
The most common Sales and Office occupations in Bethel Island are , and Sales & Related (93 | 12.0%).
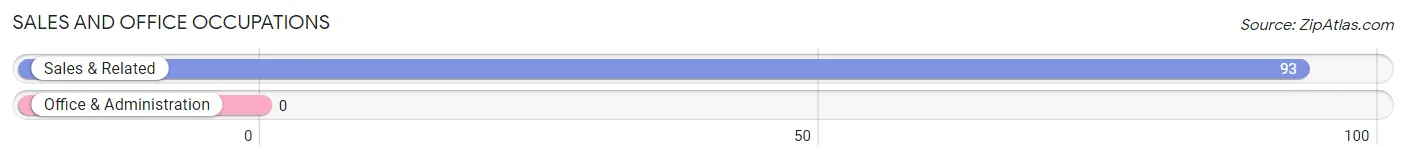
Sales and Office Occupations by Sex
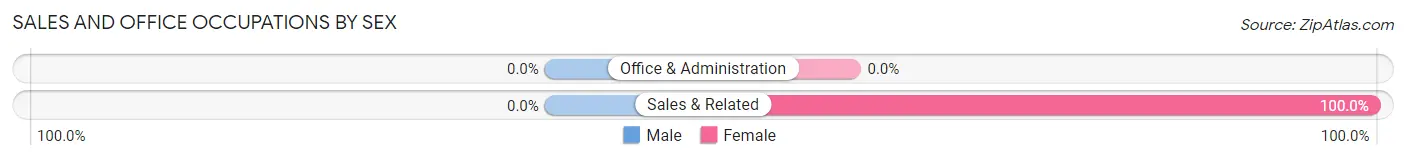
| Occupation | Male | Female |
| Sales & Related | 0 (0.0%) | 93 (100.0%) |
| Office & Administration | 0 (0.0%) | 0 (0.0%) |
| Total (Category) | 0 (0.0%) | 93 (100.0%) |
| Total (Overall) | 501 (64.8%) | 272 (35.2%) |
Natural Resources, Construction and Maintenance Occupations
The most common Natural Resources, Construction and Maintenance occupations in Bethel Island are , and Construction & Extraction (235 | 30.4%).
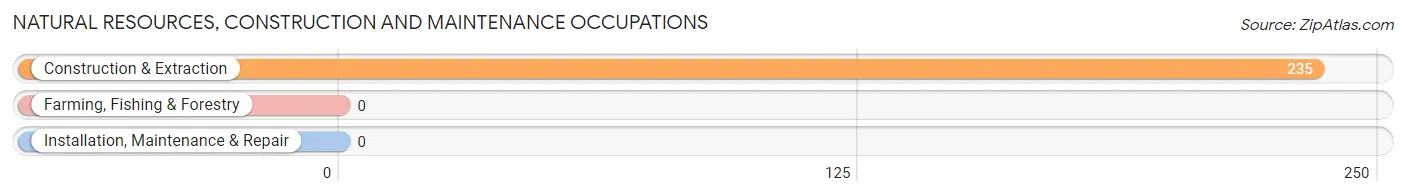
Natural Resources, Construction and Maintenance Occupations by Sex
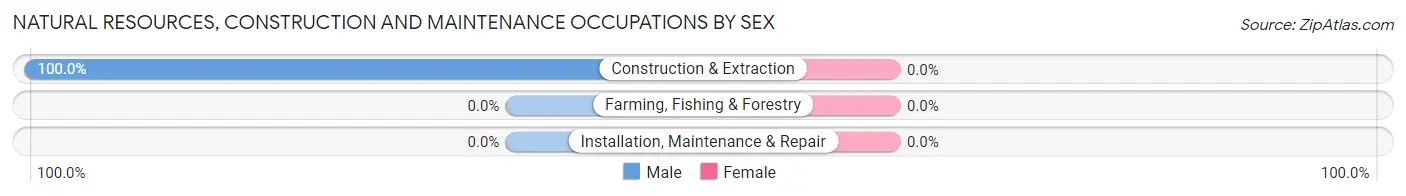
| Occupation | Male | Female |
| Farming, Fishing & Forestry | 0 (0.0%) | 0 (0.0%) |
| Construction & Extraction | 235 (100.0%) | 0 (0.0%) |
| Installation, Maintenance & Repair | 0 (0.0%) | 0 (0.0%) |
| Total (Category) | 235 (100.0%) | 0 (0.0%) |
| Total (Overall) | 501 (64.8%) | 272 (35.2%) |
Production, Transportation and Moving Occupations
The most common Production, Transportation and Moving occupations in Bethel Island are , and Transportation (80 | 10.3%).
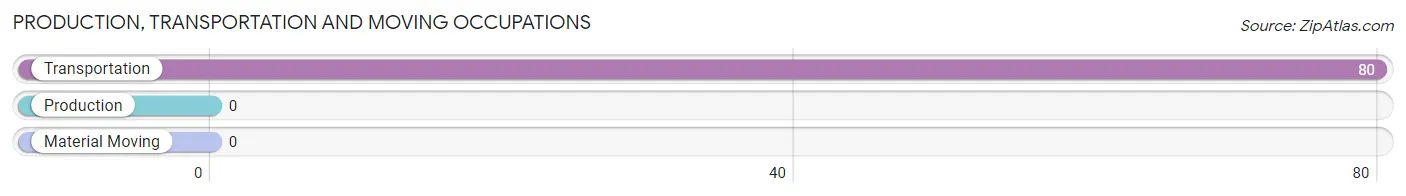
Production, Transportation and Moving Occupations by Sex
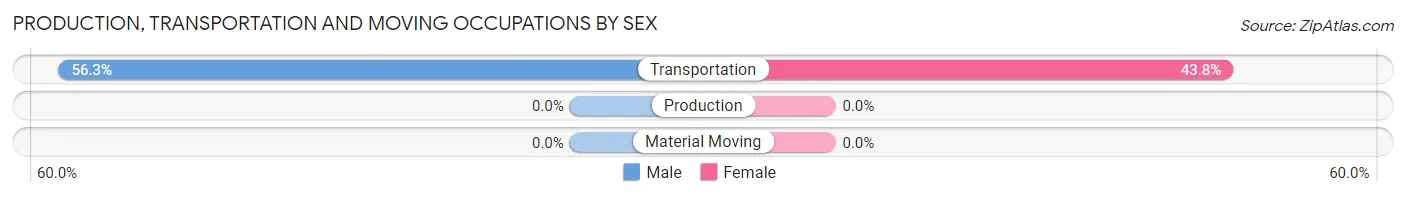
| Occupation | Male | Female |
| Production | 0 (0.0%) | 0 (0.0%) |
| Transportation | 45 (56.2%) | 35 (43.8%) |
| Material Moving | 0 (0.0%) | 0 (0.0%) |
| Total (Category) | 45 (56.2%) | 35 (43.8%) |
| Total (Overall) | 501 (64.8%) | 272 (35.2%) |
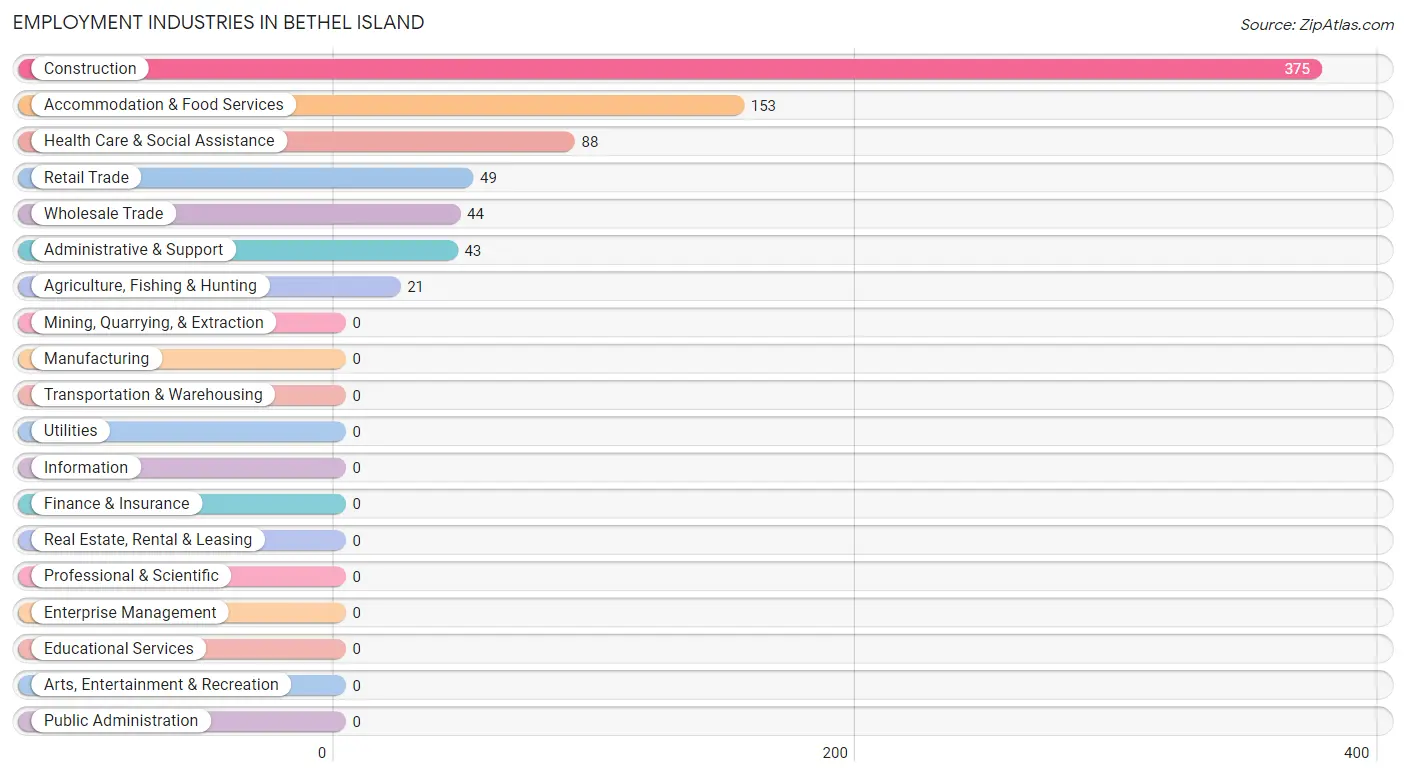
Employment Industries by Sex in Bethel Island
Employment Industries in Bethel Island
The major employment industries in Bethel Island include Construction (375 | 48.5%), Accommodation & Food Services (153 | 19.8%), Health Care & Social Assistance (88 | 11.4%), Retail Trade (49 | 6.3%), and Wholesale Trade (44 | 5.7%).
Employment Industries by Sex in Bethel Island
The Bethel Island industries that see more men than women are Administrative & Support (100.0%), Construction (90.7%), and Accommodation & Food Services (77.1%), whereas the industries that tend to have a higher number of women are Agriculture, Fishing & Hunting (100.0%), Wholesale Trade (100.0%), and Retail Trade (100.0%).
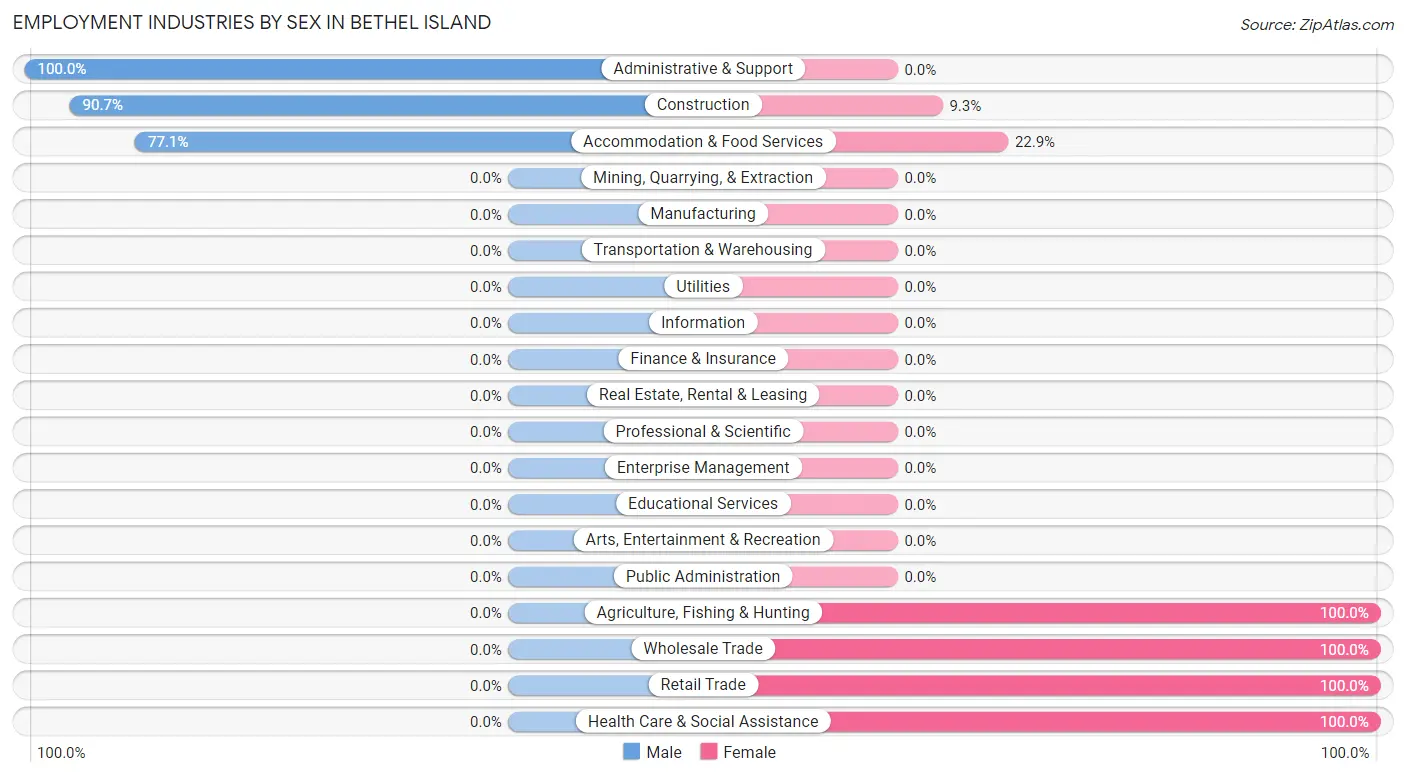
| Industry | Male | Female |
| Agriculture, Fishing & Hunting | 0 (0.0%) | 21 (100.0%) |
| Mining, Quarrying, & Extraction | 0 (0.0%) | 0 (0.0%) |
| Construction | 340 (90.7%) | 35 (9.3%) |
| Manufacturing | 0 (0.0%) | 0 (0.0%) |
| Wholesale Trade | 0 (0.0%) | 44 (100.0%) |
| Retail Trade | 0 (0.0%) | 49 (100.0%) |
| Transportation & Warehousing | 0 (0.0%) | 0 (0.0%) |
| Utilities | 0 (0.0%) | 0 (0.0%) |
| Information | 0 (0.0%) | 0 (0.0%) |
| Finance & Insurance | 0 (0.0%) | 0 (0.0%) |
| Real Estate, Rental & Leasing | 0 (0.0%) | 0 (0.0%) |
| Professional & Scientific | 0 (0.0%) | 0 (0.0%) |
| Enterprise Management | 0 (0.0%) | 0 (0.0%) |
| Administrative & Support | 43 (100.0%) | 0 (0.0%) |
| Educational Services | 0 (0.0%) | 0 (0.0%) |
| Health Care & Social Assistance | 0 (0.0%) | 88 (100.0%) |
| Arts, Entertainment & Recreation | 0 (0.0%) | 0 (0.0%) |
| Accommodation & Food Services | 118 (77.1%) | 35 (22.9%) |
| Public Administration | 0 (0.0%) | 0 (0.0%) |
| Total | 501 (64.8%) | 272 (35.2%) |
Education in Bethel Island
School Enrollment in Bethel Island
The most common levels of schooling among the 517 students in Bethel Island are college / undergraduate (218 | 42.2%), middle school (125 | 24.2%), and high school (123 | 23.8%).
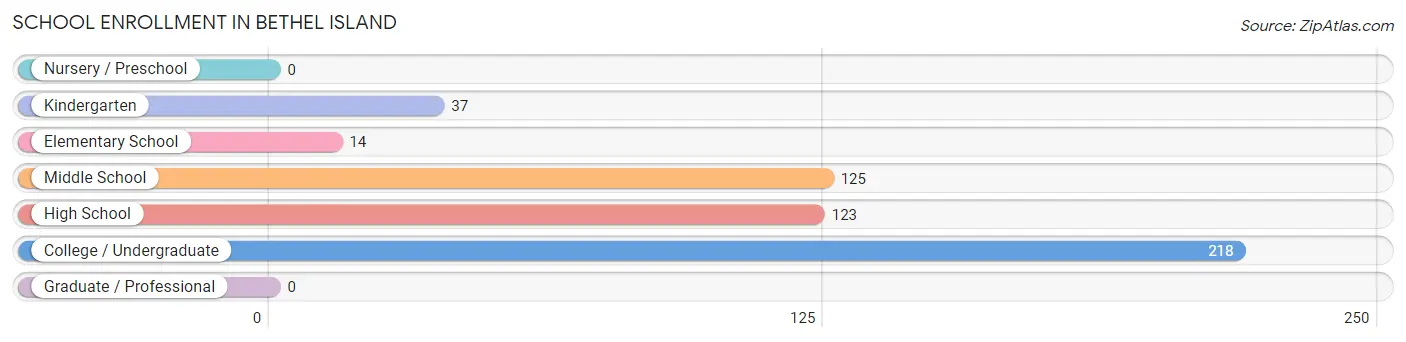
| School Level | # Students | % Students |
| Nursery / Preschool | 0 | 0.0% |
| Kindergarten | 37 | 7.2% |
| Elementary School | 14 | 2.7% |
| Middle School | 125 | 24.2% |
| High School | 123 | 23.8% |
| College / Undergraduate | 218 | 42.2% |
| Graduate / Professional | 0 | 0.0% |
| Total | 517 | 100.0% |
School Enrollment by Age by Funding Source in Bethel Island
Out of a total of 517 students who are enrolled in schools in Bethel Island, 27 (5.2%) attend a private institution, while the remaining 490 (94.8%) are enrolled in public schools. The age group of 5 to 9 year old has the highest likelihood of being enrolled in private schools, with 27 (52.9% in the age bracket) enrolled. Conversely, the age group of 10 to 14 year olds has the lowest likelihood of being enrolled in a private school, with 221 (100.0% in the age bracket) attending a public institution.
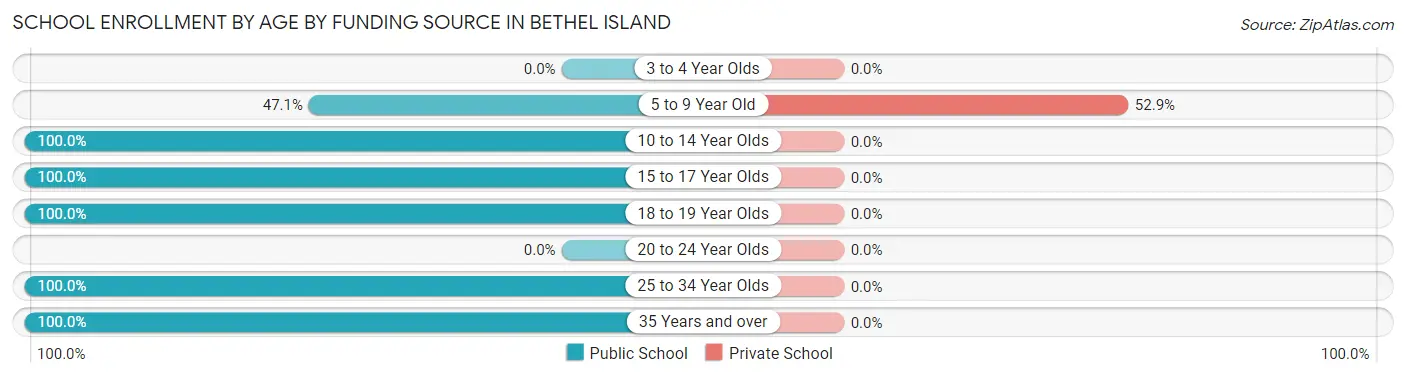
| Age Bracket | Public School | Private School |
| 3 to 4 Year Olds | 0 (0.0%) | 0 (0.0%) |
| 5 to 9 Year Old | 24 (47.1%) | 27 (52.9%) |
| 10 to 14 Year Olds | 221 (100.0%) | 0 (0.0%) |
| 15 to 17 Year Olds | 27 (100.0%) | 0 (0.0%) |
| 18 to 19 Year Olds | 45 (100.0%) | 0 (0.0%) |
| 20 to 24 Year Olds | 0 (0.0%) | 0 (0.0%) |
| 25 to 34 Year Olds | 54 (100.0%) | 0 (0.0%) |
| 35 Years and over | 119 (100.0%) | 0 (0.0%) |
| Total | 490 (94.8%) | 27 (5.2%) |
Educational Attainment by Field of Study in Bethel Island
Science & technology (163 | 38.8%), arts & humanities (83 | 19.8%), business (58 | 13.8%), computers & mathematics (46 | 11.0%), and literature & languages (46 | 11.0%) are the most common fields of study among 420 individuals in Bethel Island who have obtained a bachelor's degree or higher.
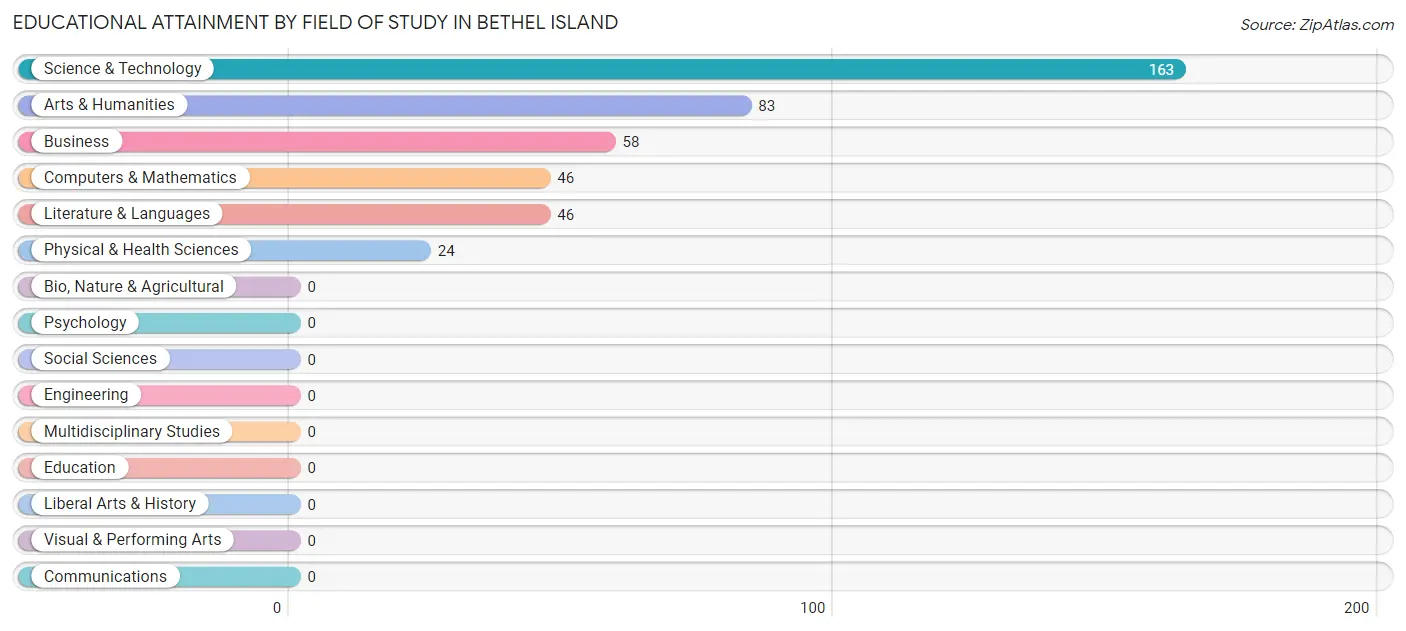
| Field of Study | # Graduates | % Graduates |
| Computers & Mathematics | 46 | 11.0% |
| Bio, Nature & Agricultural | 0 | 0.0% |
| Physical & Health Sciences | 24 | 5.7% |
| Psychology | 0 | 0.0% |
| Social Sciences | 0 | 0.0% |
| Engineering | 0 | 0.0% |
| Multidisciplinary Studies | 0 | 0.0% |
| Science & Technology | 163 | 38.8% |
| Business | 58 | 13.8% |
| Education | 0 | 0.0% |
| Literature & Languages | 46 | 11.0% |
| Liberal Arts & History | 0 | 0.0% |
| Visual & Performing Arts | 0 | 0.0% |
| Communications | 0 | 0.0% |
| Arts & Humanities | 83 | 19.8% |
| Total | 420 | 100.0% |
Transportation & Commute in Bethel Island
Vehicle Availability by Sex in Bethel Island
The most prevalent vehicle ownership categories in Bethel Island are males with 2 vehicles (253, accounting for 50.5%) and females with 2 vehicles (159, making up 100.8%).
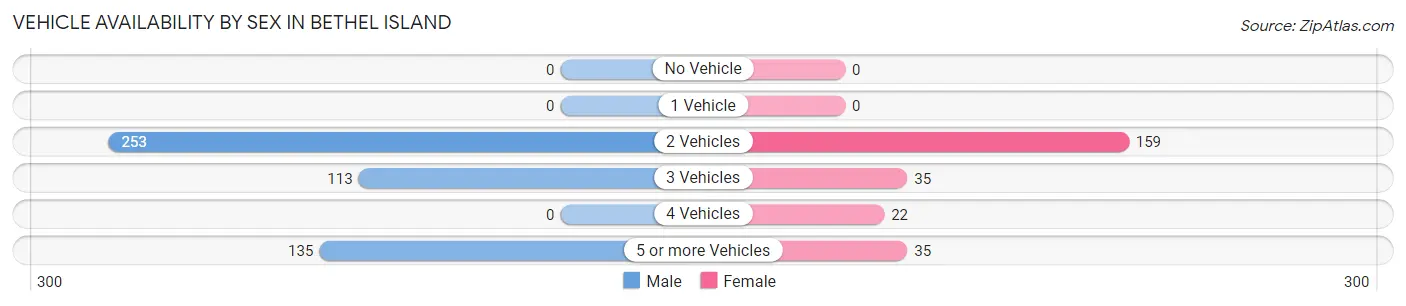
| Vehicles Available | Male | Female |
| No Vehicle | 0 (0.0%) | 0 (0.0%) |
| 1 Vehicle | 0 (0.0%) | 0 (0.0%) |
| 2 Vehicles | 253 (50.5%) | 159 (63.3%) |
| 3 Vehicles | 113 (22.6%) | 35 (13.9%) |
| 4 Vehicles | 0 (0.0%) | 22 (8.8%) |
| 5 or more Vehicles | 135 (27.0%) | 35 (13.9%) |
| Total | 501 (100.0%) | 251 (100.0%) |
Commute Time in Bethel Island
The most frequently occuring commute durations in Bethel Island are 60 to 89 minutes (185 commuters, 26.7%), 10 to 14 minutes (121 commuters, 17.5%), and 30 to 34 minutes (116 commuters, 16.8%).
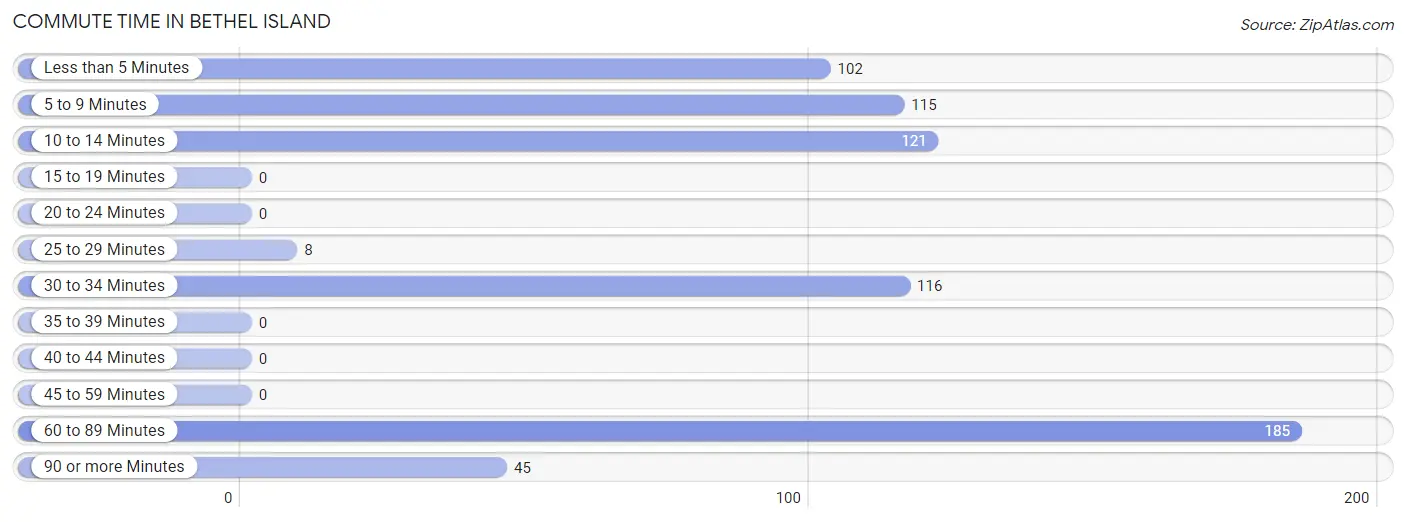
| Commute Time | # Commuters | % Commuters |
| Less than 5 Minutes | 102 | 14.7% |
| 5 to 9 Minutes | 115 | 16.6% |
| 10 to 14 Minutes | 121 | 17.5% |
| 15 to 19 Minutes | 0 | 0.0% |
| 20 to 24 Minutes | 0 | 0.0% |
| 25 to 29 Minutes | 8 | 1.2% |
| 30 to 34 Minutes | 116 | 16.8% |
| 35 to 39 Minutes | 0 | 0.0% |
| 40 to 44 Minutes | 0 | 0.0% |
| 45 to 59 Minutes | 0 | 0.0% |
| 60 to 89 Minutes | 185 | 26.7% |
| 90 or more Minutes | 45 | 6.5% |
Commute Time by Sex in Bethel Island
The most common commute times in Bethel Island are 10 to 14 minutes (121 commuters, 24.7%) for males and 60 to 89 minutes (106 commuters, 52.5%) for females.
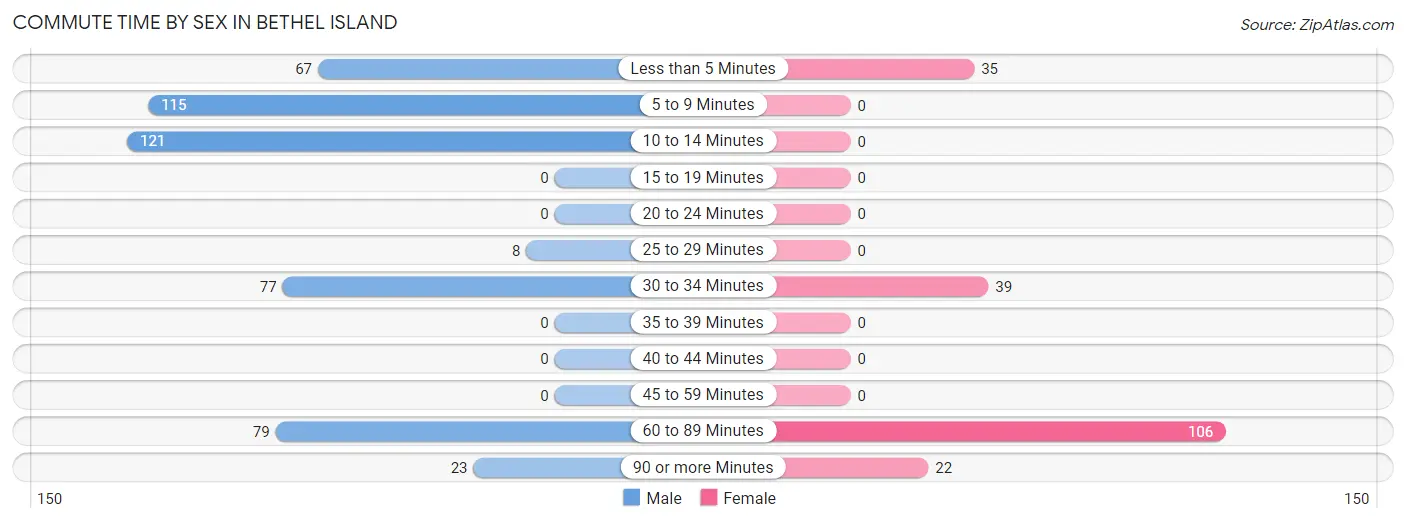
| Commute Time | Male | Female |
| Less than 5 Minutes | 67 (13.7%) | 35 (17.3%) |
| 5 to 9 Minutes | 115 (23.5%) | 0 (0.0%) |
| 10 to 14 Minutes | 121 (24.7%) | 0 (0.0%) |
| 15 to 19 Minutes | 0 (0.0%) | 0 (0.0%) |
| 20 to 24 Minutes | 0 (0.0%) | 0 (0.0%) |
| 25 to 29 Minutes | 8 (1.6%) | 0 (0.0%) |
| 30 to 34 Minutes | 77 (15.7%) | 39 (19.3%) |
| 35 to 39 Minutes | 0 (0.0%) | 0 (0.0%) |
| 40 to 44 Minutes | 0 (0.0%) | 0 (0.0%) |
| 45 to 59 Minutes | 0 (0.0%) | 0 (0.0%) |
| 60 to 89 Minutes | 79 (16.1%) | 106 (52.5%) |
| 90 or more Minutes | 23 (4.7%) | 22 (10.9%) |
Time of Departure to Work by Sex in Bethel Island
The most frequent times of departure to work in Bethel Island are 5:00 AM to 5:29 AM (180, 36.7%) for males and 8:30 AM to 8:59 AM (79, 39.1%) for females.
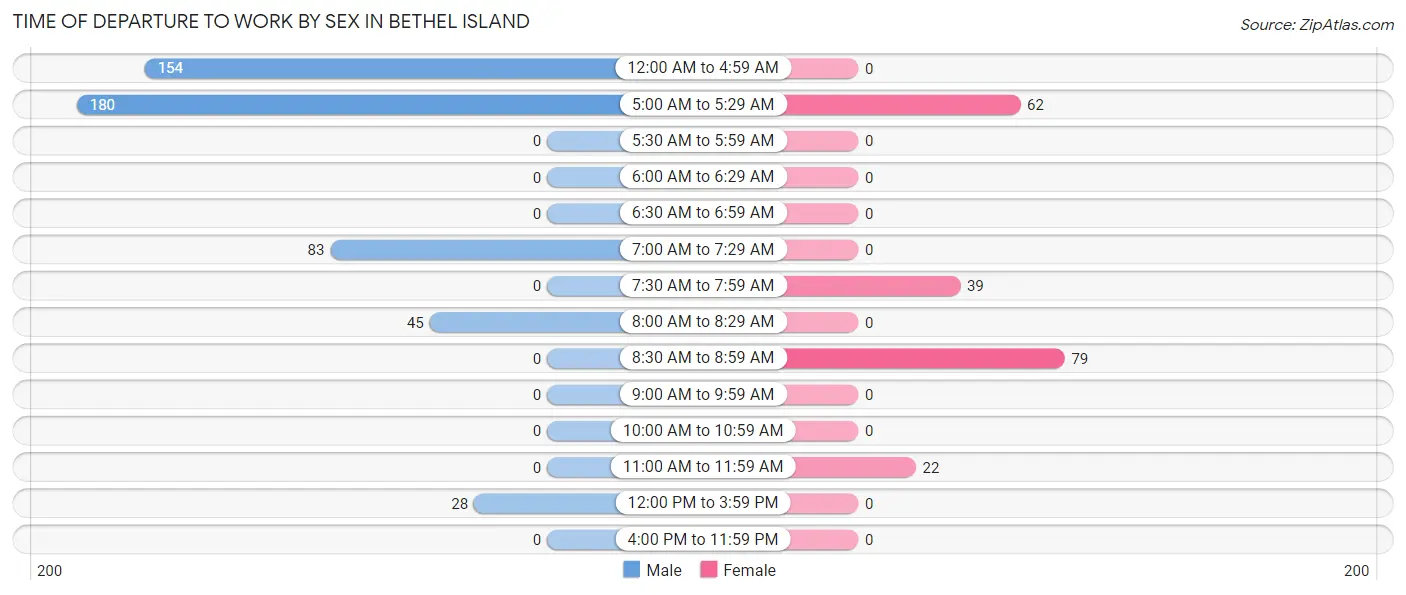
| Time of Departure | Male | Female |
| 12:00 AM to 4:59 AM | 154 (31.4%) | 0 (0.0%) |
| 5:00 AM to 5:29 AM | 180 (36.7%) | 62 (30.7%) |
| 5:30 AM to 5:59 AM | 0 (0.0%) | 0 (0.0%) |
| 6:00 AM to 6:29 AM | 0 (0.0%) | 0 (0.0%) |
| 6:30 AM to 6:59 AM | 0 (0.0%) | 0 (0.0%) |
| 7:00 AM to 7:29 AM | 83 (16.9%) | 0 (0.0%) |
| 7:30 AM to 7:59 AM | 0 (0.0%) | 39 (19.3%) |
| 8:00 AM to 8:29 AM | 45 (9.2%) | 0 (0.0%) |
| 8:30 AM to 8:59 AM | 0 (0.0%) | 79 (39.1%) |
| 9:00 AM to 9:59 AM | 0 (0.0%) | 0 (0.0%) |
| 10:00 AM to 10:59 AM | 0 (0.0%) | 0 (0.0%) |
| 11:00 AM to 11:59 AM | 0 (0.0%) | 22 (10.9%) |
| 12:00 PM to 3:59 PM | 28 (5.7%) | 0 (0.0%) |
| 4:00 PM to 11:59 PM | 0 (0.0%) | 0 (0.0%) |
| Total | 490 (100.0%) | 202 (100.0%) |
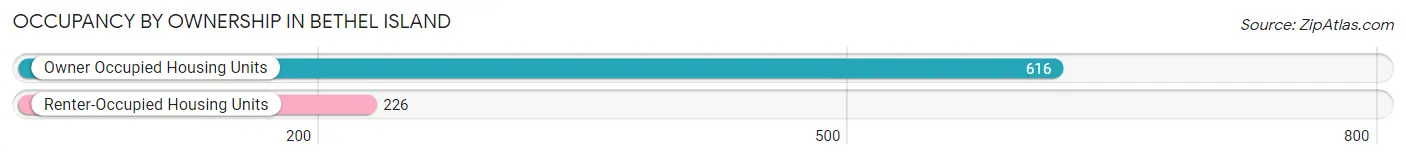
Housing Occupancy in Bethel Island
Occupancy by Ownership in Bethel Island
Of the total 842 dwellings in Bethel Island, owner-occupied units account for 616 (73.2%), while renter-occupied units make up 226 (26.8%).
| Occupancy | # Housing Units | % Housing Units |
| Owner Occupied Housing Units | 616 | 73.2% |
| Renter-Occupied Housing Units | 226 | 26.8% |
| Total Occupied Housing Units | 842 | 100.0% |
Occupancy by Household Size in Bethel Island
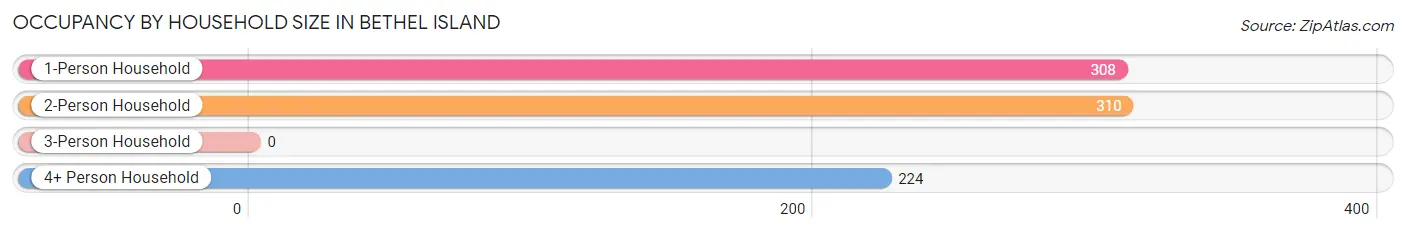
| Household Size | # Housing Units | % Housing Units |
| 1-Person Household | 308 | 36.6% |
| 2-Person Household | 310 | 36.8% |
| 3-Person Household | 0 | 0.0% |
| 4+ Person Household | 224 | 26.6% |
| Total Housing Units | 842 | 100.0% |
Occupancy by Ownership by Household Size in Bethel Island
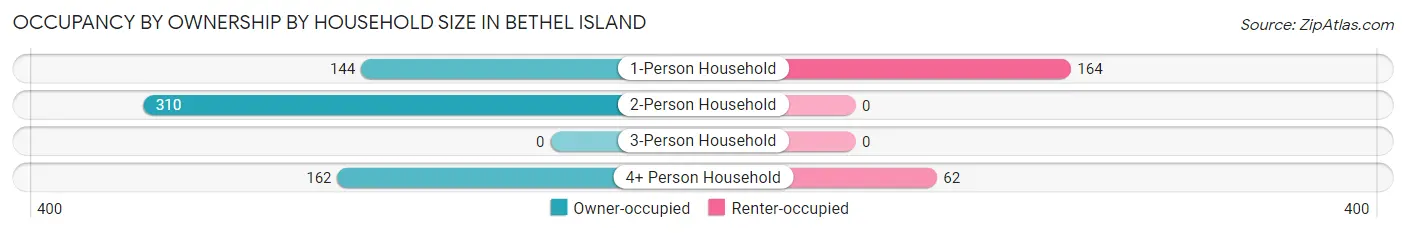
| Household Size | Owner-occupied | Renter-occupied |
| 1-Person Household | 144 (46.8%) | 164 (53.2%) |
| 2-Person Household | 310 (100.0%) | 0 (0.0%) |
| 3-Person Household | 0 (0.0%) | 0 (0.0%) |
| 4+ Person Household | 162 (72.3%) | 62 (27.7%) |
| Total Housing Units | 616 (73.2%) | 226 (26.8%) |
Occupancy by Educational Attainment in Bethel Island
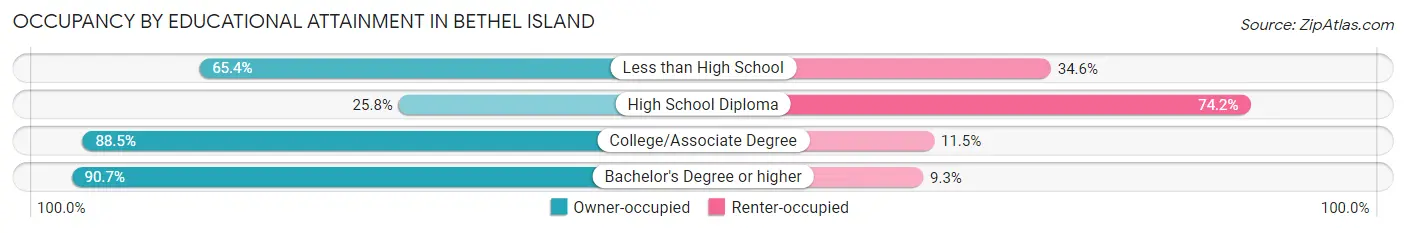
| Household Size | Owner-occupied | Renter-occupied |
| Less than High School | 68 (65.4%) | 36 (34.6%) |
| High School Diploma | 46 (25.8%) | 132 (74.2%) |
| College/Associate Degree | 239 (88.5%) | 31 (11.5%) |
| Bachelor's Degree or higher | 263 (90.7%) | 27 (9.3%) |
Occupancy by Age of Householder in Bethel Island
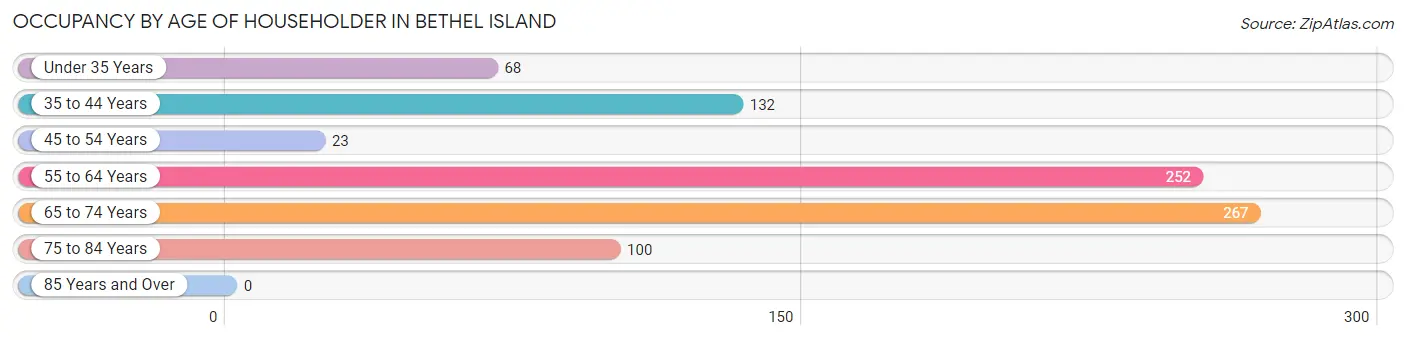
| Age Bracket | # Households | % Households |
| Under 35 Years | 68 | 8.1% |
| 35 to 44 Years | 132 | 15.7% |
| 45 to 54 Years | 23 | 2.7% |
| 55 to 64 Years | 252 | 29.9% |
| 65 to 74 Years | 267 | 31.7% |
| 75 to 84 Years | 100 | 11.9% |
| 85 Years and Over | 0 | 0.0% |
| Total | 842 | 100.0% |
Housing Finances in Bethel Island
Median Income by Occupancy in Bethel Island
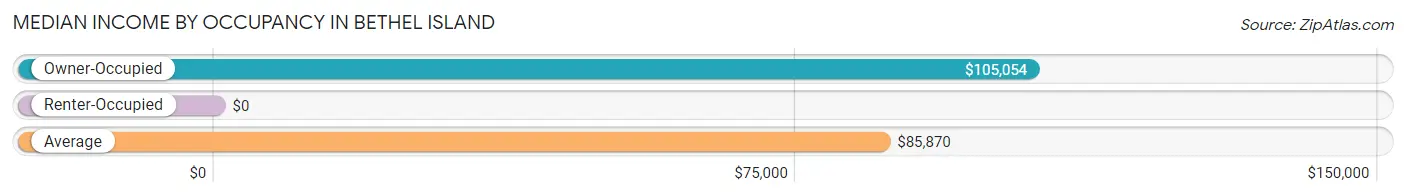
| Occupancy Type | # Households | Median Income |
| Owner-Occupied | 616 (73.2%) | $105,054 |
| Renter-Occupied | 226 (26.8%) | $0 |
| Average | 842 (100.0%) | $85,870 |
Occupancy by Householder Income Bracket in Bethel Island
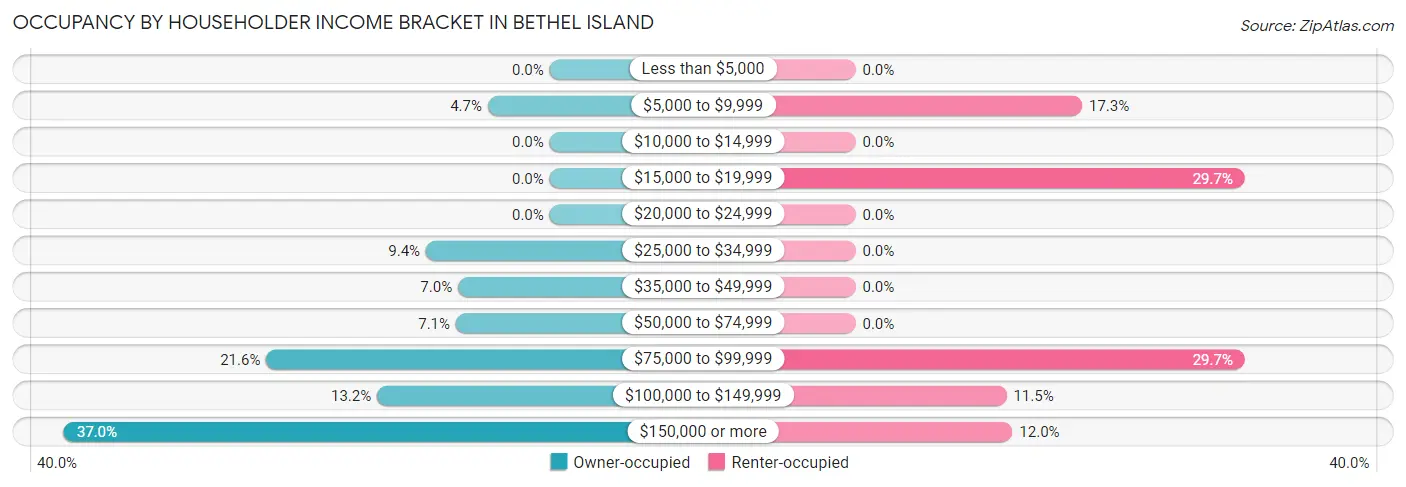
| Income Bracket | Owner-occupied | Renter-occupied |
| Less than $5,000 | 0 (0.0%) | 0 (0.0%) |
| $5,000 to $9,999 | 29 (4.7%) | 39 (17.3%) |
| $10,000 to $14,999 | 0 (0.0%) | 0 (0.0%) |
| $15,000 to $19,999 | 0 (0.0%) | 67 (29.6%) |
| $20,000 to $24,999 | 0 (0.0%) | 0 (0.0%) |
| $25,000 to $34,999 | 58 (9.4%) | 0 (0.0%) |
| $35,000 to $49,999 | 43 (7.0%) | 0 (0.0%) |
| $50,000 to $74,999 | 44 (7.1%) | 0 (0.0%) |
| $75,000 to $99,999 | 133 (21.6%) | 67 (29.6%) |
| $100,000 to $149,999 | 81 (13.2%) | 26 (11.5%) |
| $150,000 or more | 228 (37.0%) | 27 (11.9%) |
| Total | 616 (100.0%) | 226 (100.0%) |
Monthly Housing Cost Tiers in Bethel Island
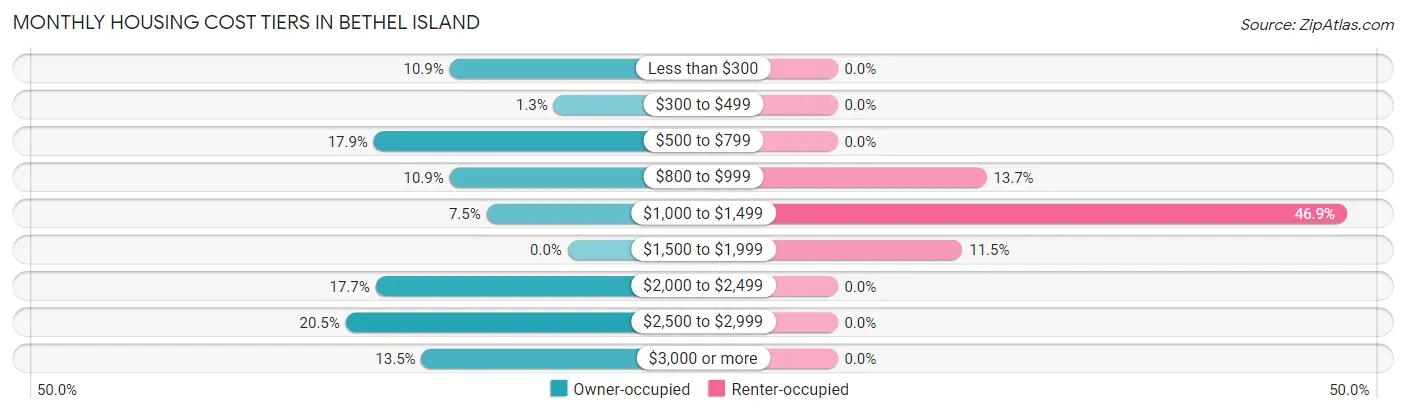
| Monthly Cost | Owner-occupied | Renter-occupied |
| Less than $300 | 67 (10.9%) | 0 (0.0%) |
| $300 to $499 | 8 (1.3%) | 0 (0.0%) |
| $500 to $799 | 110 (17.9%) | 0 (0.0%) |
| $800 to $999 | 67 (10.9%) | 31 (13.7%) |
| $1,000 to $1,499 | 46 (7.5%) | 106 (46.9%) |
| $1,500 to $1,999 | 0 (0.0%) | 26 (11.5%) |
| $2,000 to $2,499 | 109 (17.7%) | 0 (0.0%) |
| $2,500 to $2,999 | 126 (20.4%) | 0 (0.0%) |
| $3,000 or more | 83 (13.5%) | 0 (0.0%) |
| Total | 616 (100.0%) | 226 (100.0%) |
Physical Housing Characteristics in Bethel Island
Housing Structures in Bethel Island
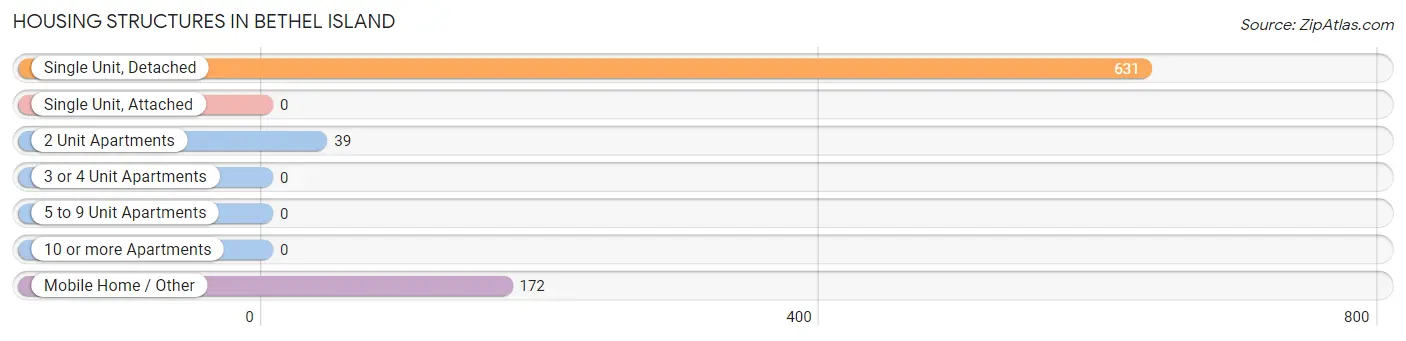
| Structure Type | # Housing Units | % Housing Units |
| Single Unit, Detached | 631 | 74.9% |
| Single Unit, Attached | 0 | 0.0% |
| 2 Unit Apartments | 39 | 4.6% |
| 3 or 4 Unit Apartments | 0 | 0.0% |
| 5 to 9 Unit Apartments | 0 | 0.0% |
| 10 or more Apartments | 0 | 0.0% |
| Mobile Home / Other | 172 | 20.4% |
| Total | 842 | 100.0% |
Housing Structures by Occupancy in Bethel Island
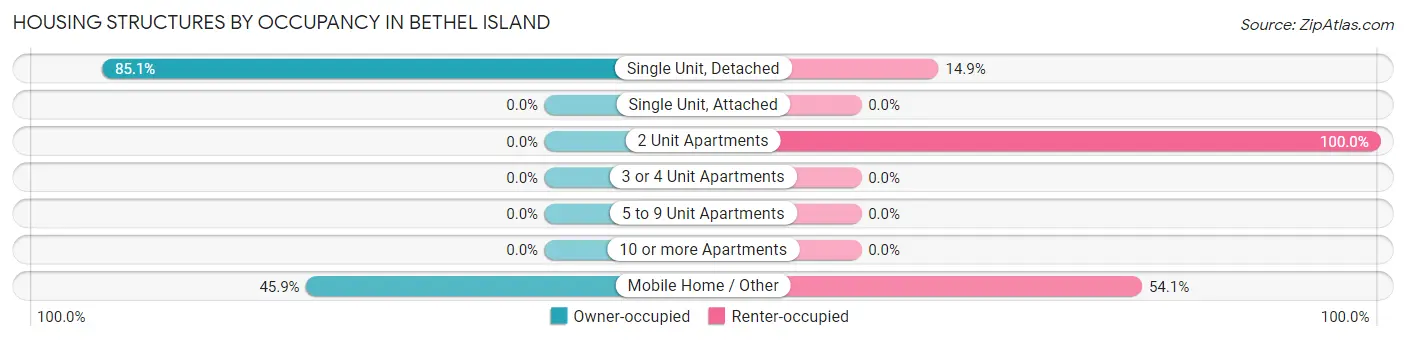
| Structure Type | Owner-occupied | Renter-occupied |
| Single Unit, Detached | 537 (85.1%) | 94 (14.9%) |
| Single Unit, Attached | 0 (0.0%) | 0 (0.0%) |
| 2 Unit Apartments | 0 (0.0%) | 39 (100.0%) |
| 3 or 4 Unit Apartments | 0 (0.0%) | 0 (0.0%) |
| 5 to 9 Unit Apartments | 0 (0.0%) | 0 (0.0%) |
| 10 or more Apartments | 0 (0.0%) | 0 (0.0%) |
| Mobile Home / Other | 79 (45.9%) | 93 (54.1%) |
| Total | 616 (73.2%) | 226 (26.8%) |
Housing Structures by Number of Rooms in Bethel Island
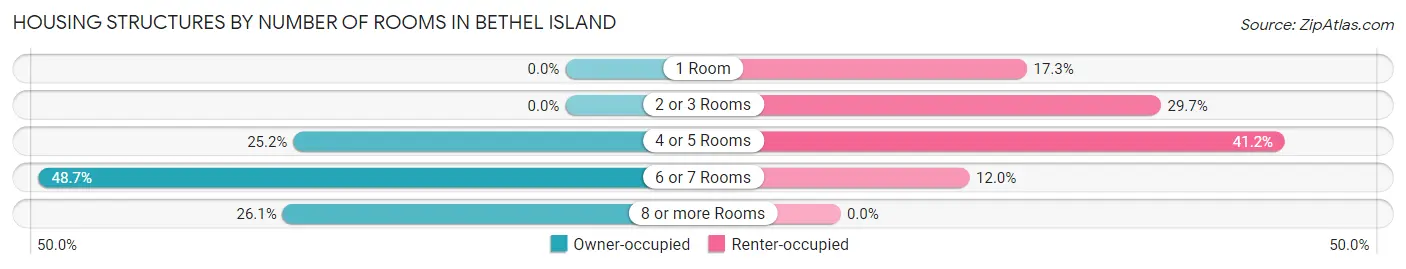
| Number of Rooms | Owner-occupied | Renter-occupied |
| 1 Room | 0 (0.0%) | 39 (17.3%) |
| 2 or 3 Rooms | 0 (0.0%) | 67 (29.6%) |
| 4 or 5 Rooms | 155 (25.2%) | 93 (41.1%) |
| 6 or 7 Rooms | 300 (48.7%) | 27 (11.9%) |
| 8 or more Rooms | 161 (26.1%) | 0 (0.0%) |
| Total | 616 (100.0%) | 226 (100.0%) |
Housing Structure by Heating Type in Bethel Island
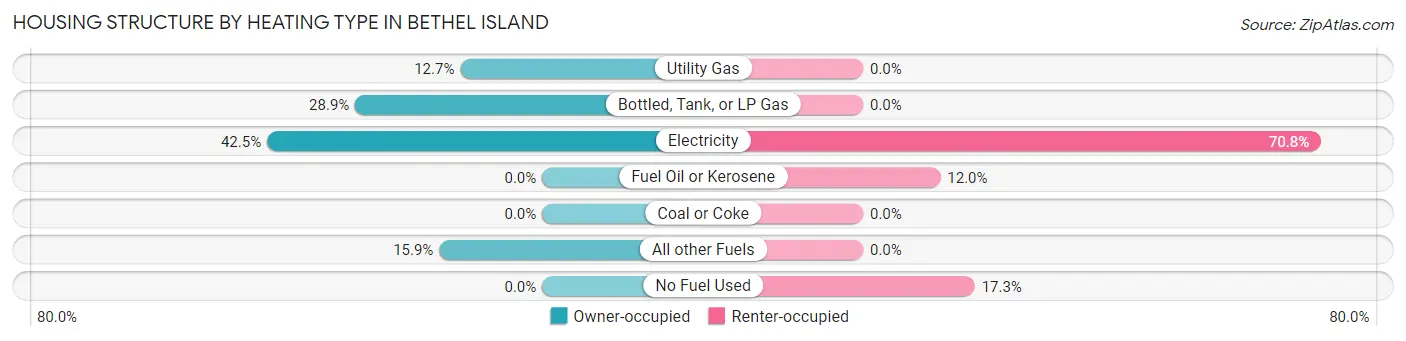
| Heating Type | Owner-occupied | Renter-occupied |
| Utility Gas | 78 (12.7%) | 0 (0.0%) |
| Bottled, Tank, or LP Gas | 178 (28.9%) | 0 (0.0%) |
| Electricity | 262 (42.5%) | 160 (70.8%) |
| Fuel Oil or Kerosene | 0 (0.0%) | 27 (11.9%) |
| Coal or Coke | 0 (0.0%) | 0 (0.0%) |
| All other Fuels | 98 (15.9%) | 0 (0.0%) |
| No Fuel Used | 0 (0.0%) | 39 (17.3%) |
| Total | 616 (100.0%) | 226 (100.0%) |
Household Vehicle Usage in Bethel Island
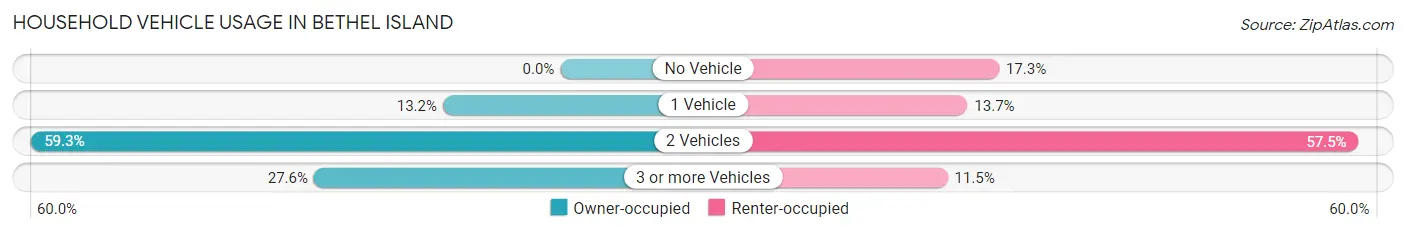
| Vehicles per Household | Owner-occupied | Renter-occupied |
| No Vehicle | 0 (0.0%) | 39 (17.3%) |
| 1 Vehicle | 81 (13.2%) | 31 (13.7%) |
| 2 Vehicles | 365 (59.3%) | 130 (57.5%) |
| 3 or more Vehicles | 170 (27.6%) | 26 (11.5%) |
| Total | 616 (100.0%) | 226 (100.0%) |
Real Estate & Mortgages in Bethel Island
Real Estate and Mortgage Overview in Bethel Island
| Characteristic | Without Mortgage | With Mortgage |
| Housing Units | 298 | 318 |
| Median Property Value | $382,600 | $580,500 |
| Median Household Income | $81,136 | $170 |
| Monthly Housing Costs | $645 | $83 |
| Real Estate Taxes | - | - |
Property Value by Mortgage Status in Bethel Island
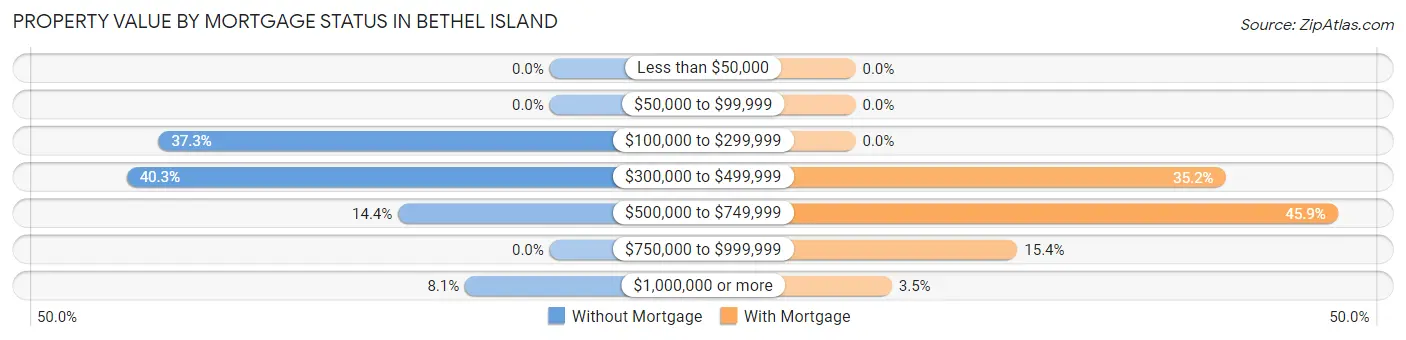
| Property Value | Without Mortgage | With Mortgage |
| Less than $50,000 | 0 (0.0%) | 0 (0.0%) |
| $50,000 to $99,999 | 0 (0.0%) | 0 (0.0%) |
| $100,000 to $299,999 | 111 (37.2%) | 0 (0.0%) |
| $300,000 to $499,999 | 120 (40.3%) | 112 (35.2%) |
| $500,000 to $749,999 | 43 (14.4%) | 146 (45.9%) |
| $750,000 to $999,999 | 0 (0.0%) | 49 (15.4%) |
| $1,000,000 or more | 24 (8.1%) | 11 (3.5%) |
| Total | 298 (100.0%) | 318 (100.0%) |
Household Income by Mortgage Status in Bethel Island
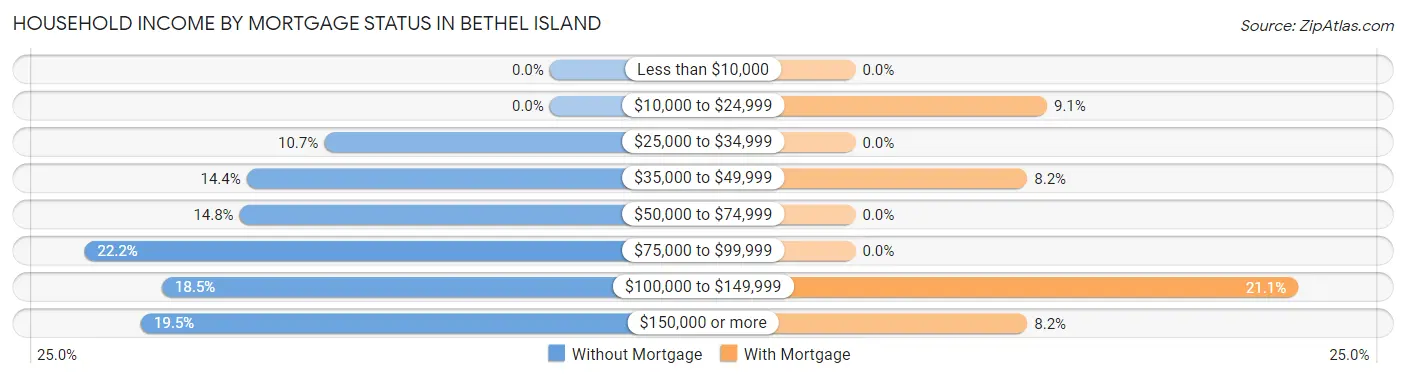
| Household Income | Without Mortgage | With Mortgage |
| Less than $10,000 | 0 (0.0%) | 0 (0.0%) |
| $10,000 to $24,999 | 0 (0.0%) | 29 (9.1%) |
| $25,000 to $34,999 | 32 (10.7%) | 0 (0.0%) |
| $35,000 to $49,999 | 43 (14.4%) | 26 (8.2%) |
| $50,000 to $74,999 | 44 (14.8%) | 0 (0.0%) |
| $75,000 to $99,999 | 66 (22.2%) | 0 (0.0%) |
| $100,000 to $149,999 | 55 (18.5%) | 67 (21.1%) |
| $150,000 or more | 58 (19.5%) | 26 (8.2%) |
| Total | 298 (100.0%) | 318 (100.0%) |
Property Value to Household Income Ratio in Bethel Island
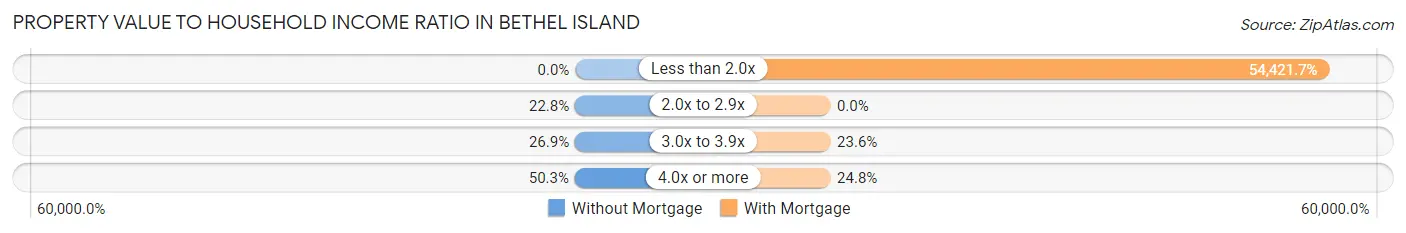
| Value-to-Income Ratio | Without Mortgage | With Mortgage |
| Less than 2.0x | 0 (0.0%) | 173,061 (54,421.7%) |
| 2.0x to 2.9x | 68 (22.8%) | 0 (0.0%) |
| 3.0x to 3.9x | 80 (26.9%) | 75 (23.6%) |
| 4.0x or more | 150 (50.3%) | 79 (24.8%) |
| Total | 298 (100.0%) | 318 (100.0%) |
Real Estate Taxes by Mortgage Status in Bethel Island
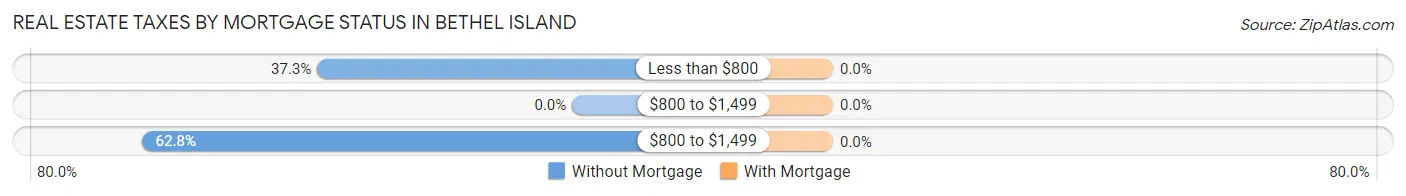
| Property Taxes | Without Mortgage | With Mortgage |
| Less than $800 | 111 (37.2%) | 0 (0.0%) |
| $800 to $1,499 | 0 (0.0%) | 0 (0.0%) |
| $800 to $1,499 | 187 (62.7%) | 0 (0.0%) |
| Total | 298 (100.0%) | 318 (100.0%) |
Health & Disability in Bethel Island
Health Insurance Coverage by Age in Bethel Island
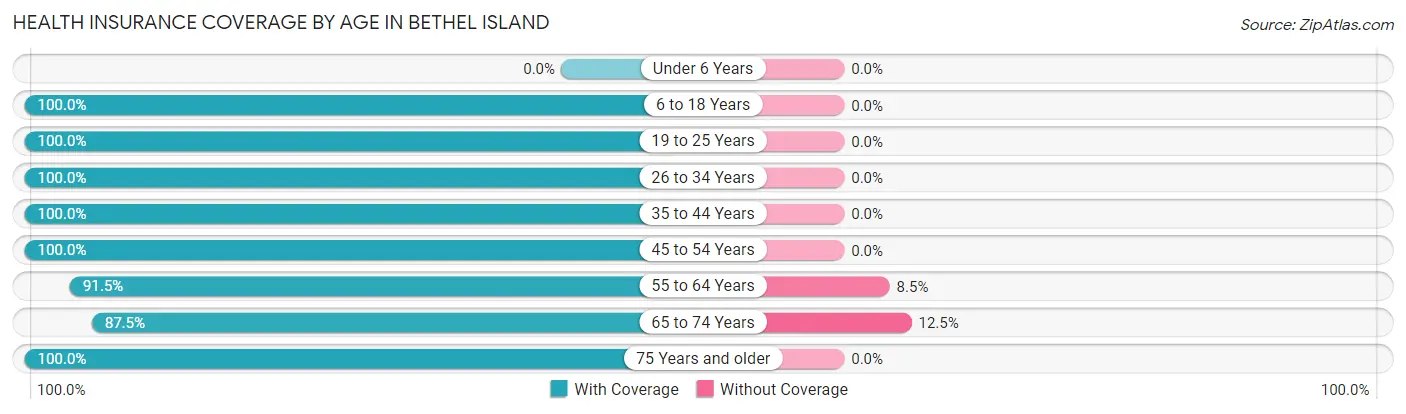
| Age Bracket | With Coverage | Without Coverage |
| Under 6 Years | 0 (0.0%) | 0 (0.0%) |
| 6 to 18 Years | 327 (100.0%) | 0 (0.0%) |
| 19 to 25 Years | 224 (100.0%) | 0 (0.0%) |
| 26 to 34 Years | 104 (100.0%) | 0 (0.0%) |
| 35 to 44 Years | 219 (100.0%) | 0 (0.0%) |
| 45 to 54 Years | 106 (100.0%) | 0 (0.0%) |
| 55 to 64 Years | 422 (91.5%) | 39 (8.5%) |
| 65 to 74 Years | 307 (87.5%) | 44 (12.5%) |
| 75 Years and older | 201 (100.0%) | 0 (0.0%) |
| Total | 1,910 (95.8%) | 83 (4.2%) |
Health Insurance Coverage by Citizenship Status in Bethel Island
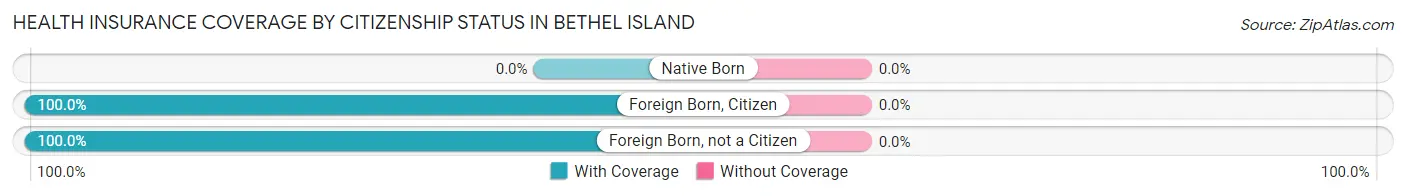
| Citizenship Status | With Coverage | Without Coverage |
| Native Born | 0 (0.0%) | 0 (0.0%) |
| Foreign Born, Citizen | 327 (100.0%) | 0 (0.0%) |
| Foreign Born, not a Citizen | 224 (100.0%) | 0 (0.0%) |
Health Insurance Coverage by Household Income in Bethel Island
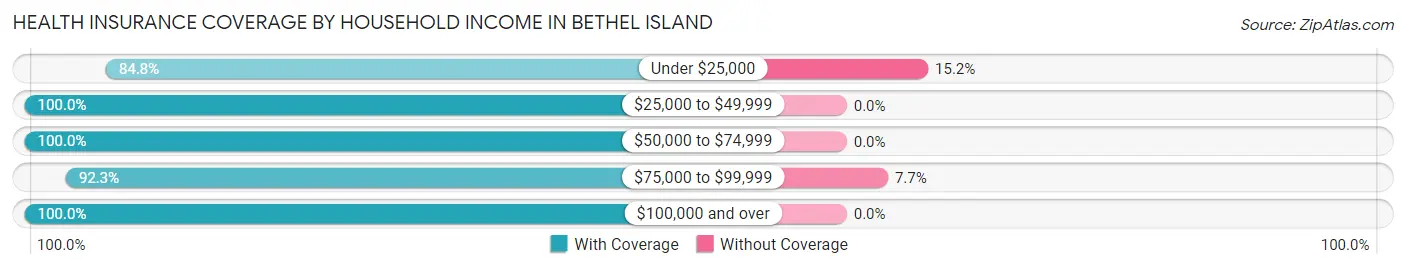
| Household Income | With Coverage | Without Coverage |
| Under $25,000 | 217 (84.8%) | 39 (15.2%) |
| $25,000 to $49,999 | 137 (100.0%) | 0 (0.0%) |
| $50,000 to $74,999 | 75 (100.0%) | 0 (0.0%) |
| $75,000 to $99,999 | 526 (92.3%) | 44 (7.7%) |
| $100,000 and over | 955 (100.0%) | 0 (0.0%) |
Public vs Private Health Insurance Coverage by Age in Bethel Island
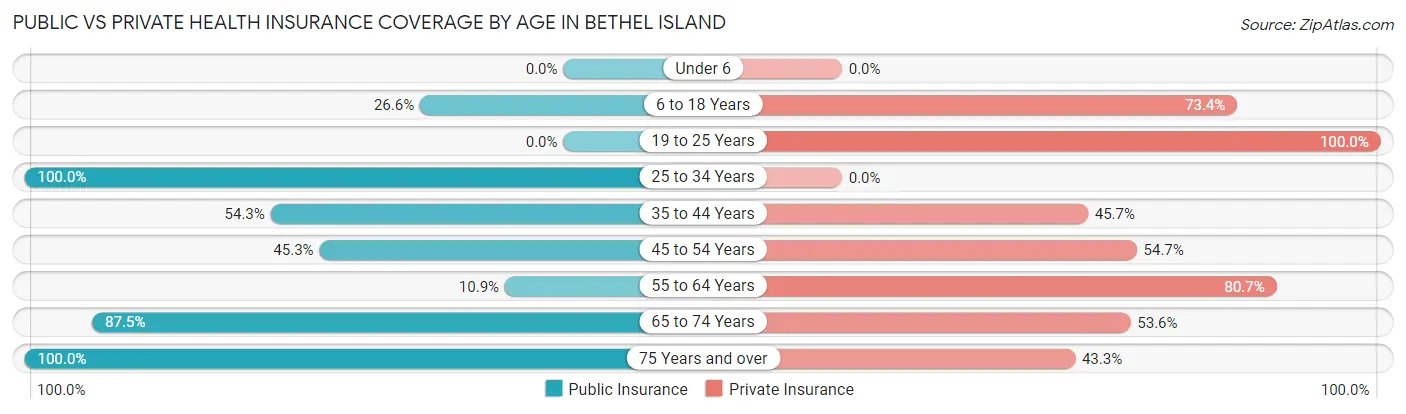
| Age Bracket | Public Insurance | Private Insurance |
| Under 6 | 0 (0.0%) | 0 (0.0%) |
| 6 to 18 Years | 87 (26.6%) | 240 (73.4%) |
| 19 to 25 Years | 0 (0.0%) | 224 (100.0%) |
| 25 to 34 Years | 104 (100.0%) | 0 (0.0%) |
| 35 to 44 Years | 119 (54.3%) | 100 (45.7%) |
| 45 to 54 Years | 48 (45.3%) | 58 (54.7%) |
| 55 to 64 Years | 50 (10.8%) | 372 (80.7%) |
| 65 to 74 Years | 307 (87.5%) | 188 (53.6%) |
| 75 Years and over | 201 (100.0%) | 87 (43.3%) |
| Total | 916 (46.0%) | 1,269 (63.7%) |
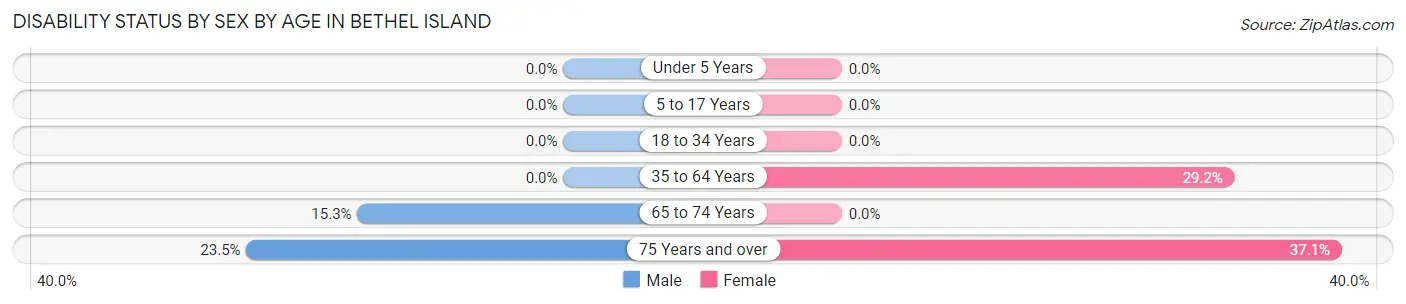
Disability Status by Sex by Age in Bethel Island
| Age Bracket | Male | Female |
| Under 5 Years | 0 (0.0%) | 0 (0.0%) |
| 5 to 17 Years | 0 (0.0%) | 0 (0.0%) |
| 18 to 34 Years | 0 (0.0%) | 0 (0.0%) |
| 35 to 64 Years | 0 (0.0%) | 98 (29.2%) |
| 65 to 74 Years | 24 (15.3%) | 0 (0.0%) |
| 75 Years and over | 8 (23.5%) | 62 (37.1%) |
Disability Class by Sex by Age in Bethel Island
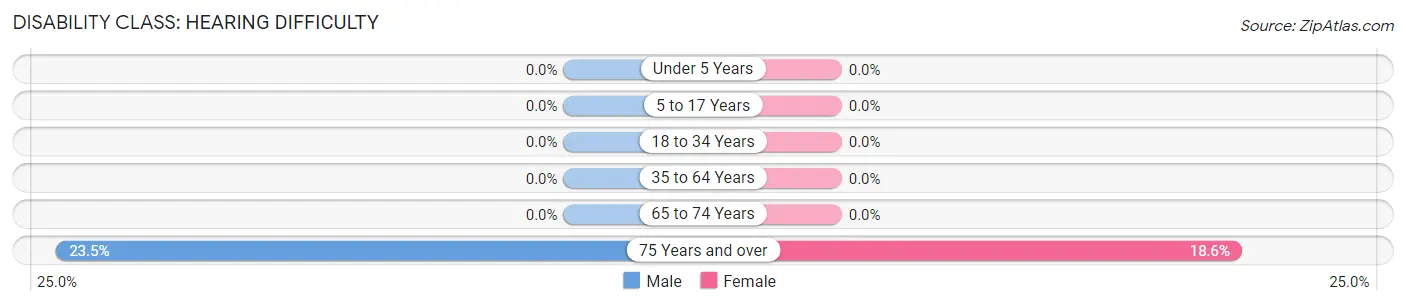
Disability Class: Hearing Difficulty
| Age Bracket | Male | Female |
| Under 5 Years | 0 (0.0%) | 0 (0.0%) |
| 5 to 17 Years | 0 (0.0%) | 0 (0.0%) |
| 18 to 34 Years | 0 (0.0%) | 0 (0.0%) |
| 35 to 64 Years | 0 (0.0%) | 0 (0.0%) |
| 65 to 74 Years | 0 (0.0%) | 0 (0.0%) |
| 75 Years and over | 8 (23.5%) | 31 (18.6%) |
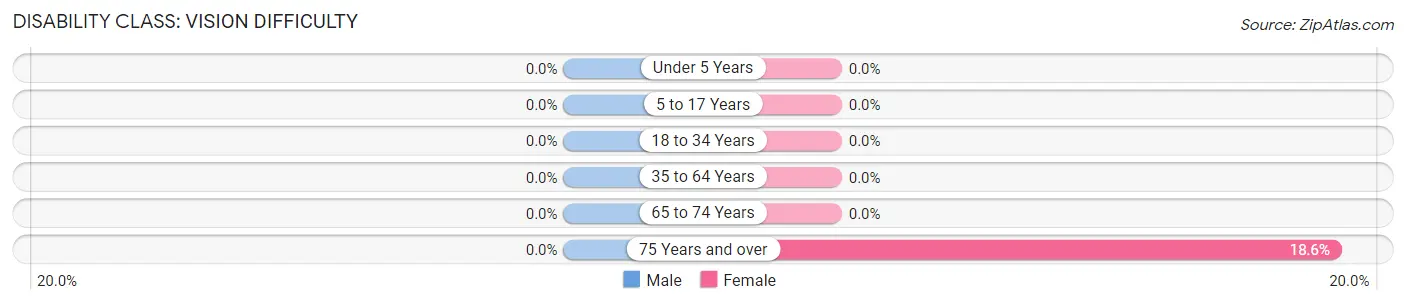
Disability Class: Vision Difficulty
| Age Bracket | Male | Female |
| Under 5 Years | 0 (0.0%) | 0 (0.0%) |
| 5 to 17 Years | 0 (0.0%) | 0 (0.0%) |
| 18 to 34 Years | 0 (0.0%) | 0 (0.0%) |
| 35 to 64 Years | 0 (0.0%) | 0 (0.0%) |
| 65 to 74 Years | 0 (0.0%) | 0 (0.0%) |
| 75 Years and over | 0 (0.0%) | 31 (18.6%) |
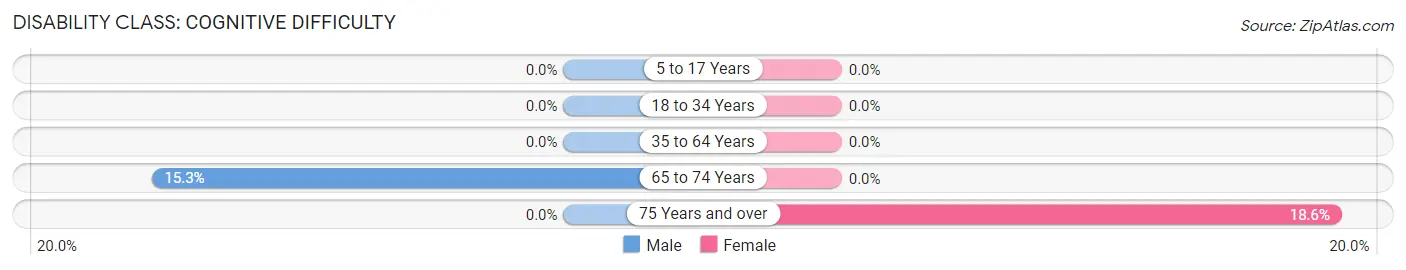
Disability Class: Cognitive Difficulty
| Age Bracket | Male | Female |
| 5 to 17 Years | 0 (0.0%) | 0 (0.0%) |
| 18 to 34 Years | 0 (0.0%) | 0 (0.0%) |
| 35 to 64 Years | 0 (0.0%) | 0 (0.0%) |
| 65 to 74 Years | 24 (15.3%) | 0 (0.0%) |
| 75 Years and over | 0 (0.0%) | 31 (18.6%) |
Disability Class: Ambulatory Difficulty
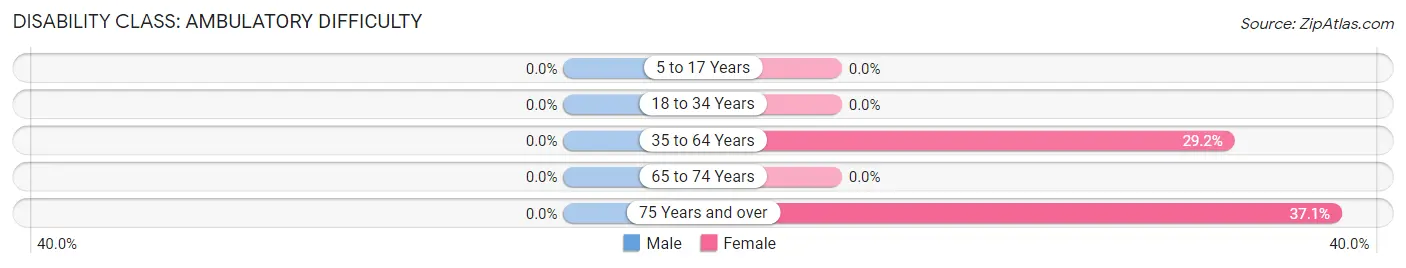
| Age Bracket | Male | Female |
| 5 to 17 Years | 0 (0.0%) | 0 (0.0%) |
| 18 to 34 Years | 0 (0.0%) | 0 (0.0%) |
| 35 to 64 Years | 0 (0.0%) | 98 (29.2%) |
| 65 to 74 Years | 0 (0.0%) | 0 (0.0%) |
| 75 Years and over | 0 (0.0%) | 62 (37.1%) |
Disability Class: Self-Care Difficulty
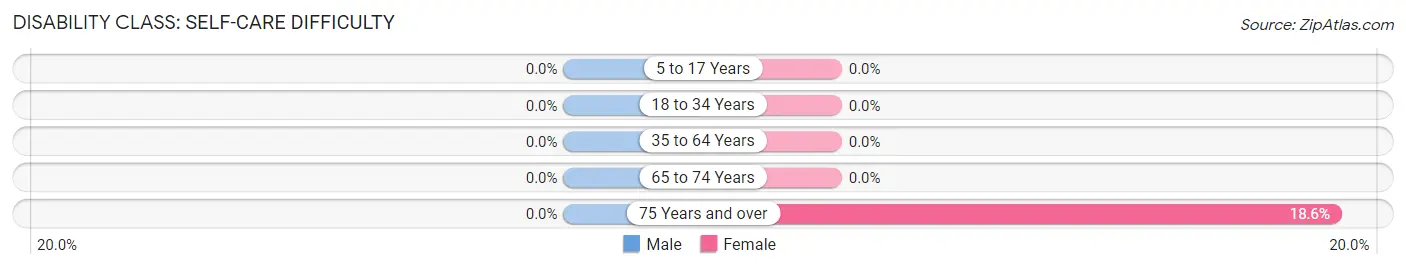
| Age Bracket | Male | Female |
| 5 to 17 Years | 0 (0.0%) | 0 (0.0%) |
| 18 to 34 Years | 0 (0.0%) | 0 (0.0%) |
| 35 to 64 Years | 0 (0.0%) | 0 (0.0%) |
| 65 to 74 Years | 0 (0.0%) | 0 (0.0%) |
| 75 Years and over | 0 (0.0%) | 31 (18.6%) |
Technology Access in Bethel Island
Computing Device Access in Bethel Island
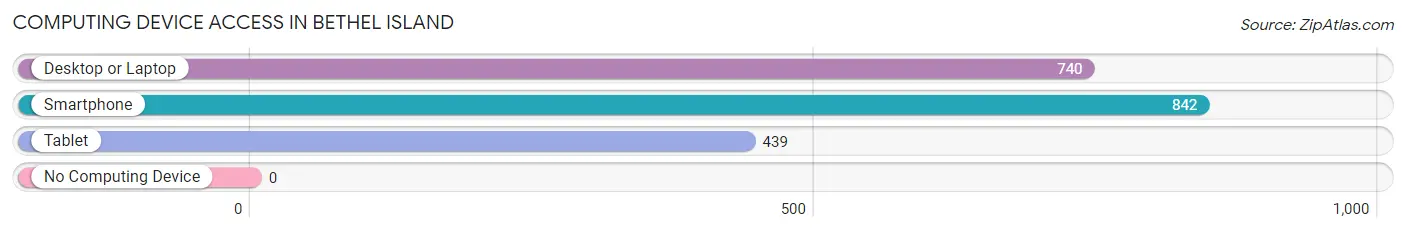
| Device Type | # Households | % Households |
| Desktop or Laptop | 740 | 87.9% |
| Smartphone | 842 | 100.0% |
| Tablet | 439 | 52.1% |
| No Computing Device | 0 | 0.0% |
| Total | 842 | 100.0% |
Internet Access in Bethel Island
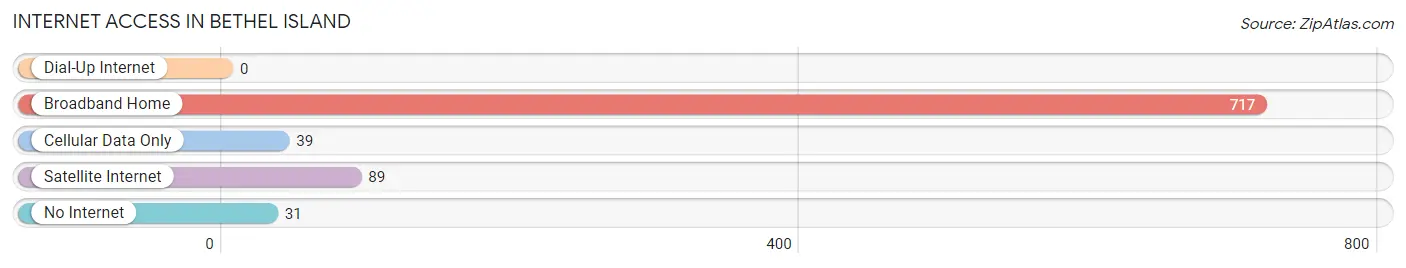
| Internet Type | # Households | % Households |
| Dial-Up Internet | 0 | 0.0% |
| Broadband Home | 717 | 85.2% |
| Cellular Data Only | 39 | 4.6% |
| Satellite Internet | 89 | 10.6% |
| No Internet | 31 | 3.7% |
| Total | 842 | 100.0% |
Bethel Island Summary
Bethel Island is a small unincorporated community located in Contra Costa County, California. It is situated on the eastern shore of the San Joaquin River Delta, approximately 25 miles northeast of Oakland. The island is home to a population of approximately 1,500 people, and is a popular destination for boaters, fishermen, and other outdoor enthusiasts.
History
Bethel Island was originally inhabited by the Miwok Native American tribe, who lived in the area for thousands of years before the arrival of European settlers. The island was named after the Bethel Church, which was built in 1854 by the Reverend William Bethel. The church was the first permanent structure on the island, and served as a gathering place for the local community.
In the late 19th century, the island became a popular destination for duck hunters and fishermen. In the early 20th century, the island was developed as a resort community, with the construction of a hotel, a marina, and a golf course.
Geography
Bethel Island is located in the San Joaquin River Delta, approximately 25 miles northeast of Oakland. The island is approximately 4.5 miles long and 1.5 miles wide, and is surrounded by the San Joaquin River, the Mokelumne River, and the Sacramento River. The island is mostly flat, with an elevation of approximately 10 feet above sea level.
The island is home to a variety of wildlife, including ducks, geese, and other waterfowl. The island is also home to a variety of fish, including bass, catfish, and sturgeon.
Economy
The economy of Bethel Island is largely based on tourism and recreation. The island is home to a variety of marinas, boat docks, and other recreational facilities. The island is also home to a variety of restaurants, bars, and other businesses catering to visitors.
The island is also home to a variety of agricultural operations, including vineyards, orchards, and farms. The island is also home to a variety of manufacturing operations, including boat building and repair, and metal fabrication.
Demographics
As of the 2010 census, the population of Bethel Island was 1,521. The racial makeup of the island was 79.3% White, 0.7% African American, 0.3% Native American, 0.7% Asian, 0.1% Pacific Islander, and 18.9% from other races. The median household income was $50,938, and the median family income was $60,938.
The island is home to a variety of religious denominations, including Catholic, Protestant, and non-denominational. The island is also home to a variety of recreational activities, including boating, fishing, and golfing.
Common Questions
What is Per Capita Income in Bethel Island?
Per Capita income in Bethel Island is $47,884.
What is the Median Family Income in Bethel Island?
Median Family Income in Bethel Island is $172,704.
What is the Median Household income in Bethel Island?
Median Household Income in Bethel Island is $85,870.
What is Inequality or Gini Index in Bethel Island?
Inequality or Gini Index in Bethel Island is 0.42.
What is the Total Population of Bethel Island?
Total Population of Bethel Island is 1,993.
What is the Total Male Population of Bethel Island?
Total Male Population of Bethel Island is 1,065.
What is the Total Female Population of Bethel Island?
Total Female Population of Bethel Island is 928.
What is the Ratio of Males per 100 Females in Bethel Island?
There are 114.76 Males per 100 Females in Bethel Island.
What is the Ratio of Females per 100 Males in Bethel Island?
There are 87.14 Females per 100 Males in Bethel Island.
What is the Median Population Age in Bethel Island?
Median Population Age in Bethel Island is 55.4 Years.
What is the Average Family Size in Bethel Island
Average Family Size in Bethel Island is 3.4 People.
What is the Average Household Size in Bethel Island
Average Household Size in Bethel Island is 2.4 People.
How Large is the Labor Force in Bethel Island?
There are 931 People in the Labor Forcein in Bethel Island.
What is the Percentage of People in the Labor Force in Bethel Island?
54.1% of People are in the Labor Force in Bethel Island.
What is the Unemployment Rate in Bethel Island?
Unemployment Rate in Bethel Island is 17.0%.