Berry Creek, CA Map & Demographics
Berry Creek Map
Berry Creek Overview
$27,652
PER CAPITA INCOME
$73,347
AVG FAMILY INCOME
$45,547
AVG HOUSEHOLD INCOME
0.42
INEQUALITY / GINI INDEX
1,006
TOTAL POPULATION
541
MALE POPULATION
465
FEMALE POPULATION
116.34
MALES / 100 FEMALES
85.95
FEMALES / 100 MALES
56.3
MEDIAN AGE
2.8
AVG FAMILY SIZE
2.3
AVG HOUSEHOLD SIZE
275
LABOR FORCE [ PEOPLE ]
30.5%
PERCENT IN LABOR FORCE
19.3%
UNEMPLOYMENT RATE
Berry Creek Zip Codes
Berry Creek Area Codes
Income in Berry Creek
Income Overview in Berry Creek
Per Capita Income in Berry Creek is $27,652, while median incomes of families and households are $73,347 and $45,547 respectively.
| Characteristic | Number | Measure |
| Per Capita Income | 1,006 | $27,652 |
| Median Family Income | 273 | $73,347 |
| Mean Family Income | 273 | $74,319 |
| Median Household Income | 429 | $45,547 |
| Mean Household Income | 429 | $59,842 |
| Income Deficit | 273 | $0 |
| Wage / Income Gap (%) | 1,006 | 0.00% |
| Wage / Income Gap ($) | 1,006 | 100.00¢ per $1 |
| Gini / Inequality Index | 1,006 | 0.42 |
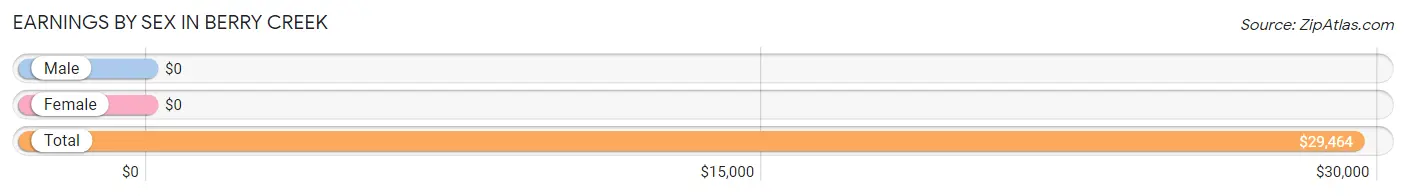
Earnings by Sex in Berry Creek
| Sex | Number | Average Earnings |
| Male | 150 (49.3%) | $0 |
| Female | 154 (50.7%) | $0 |
| Total | 304 (100.0%) | $29,464 |
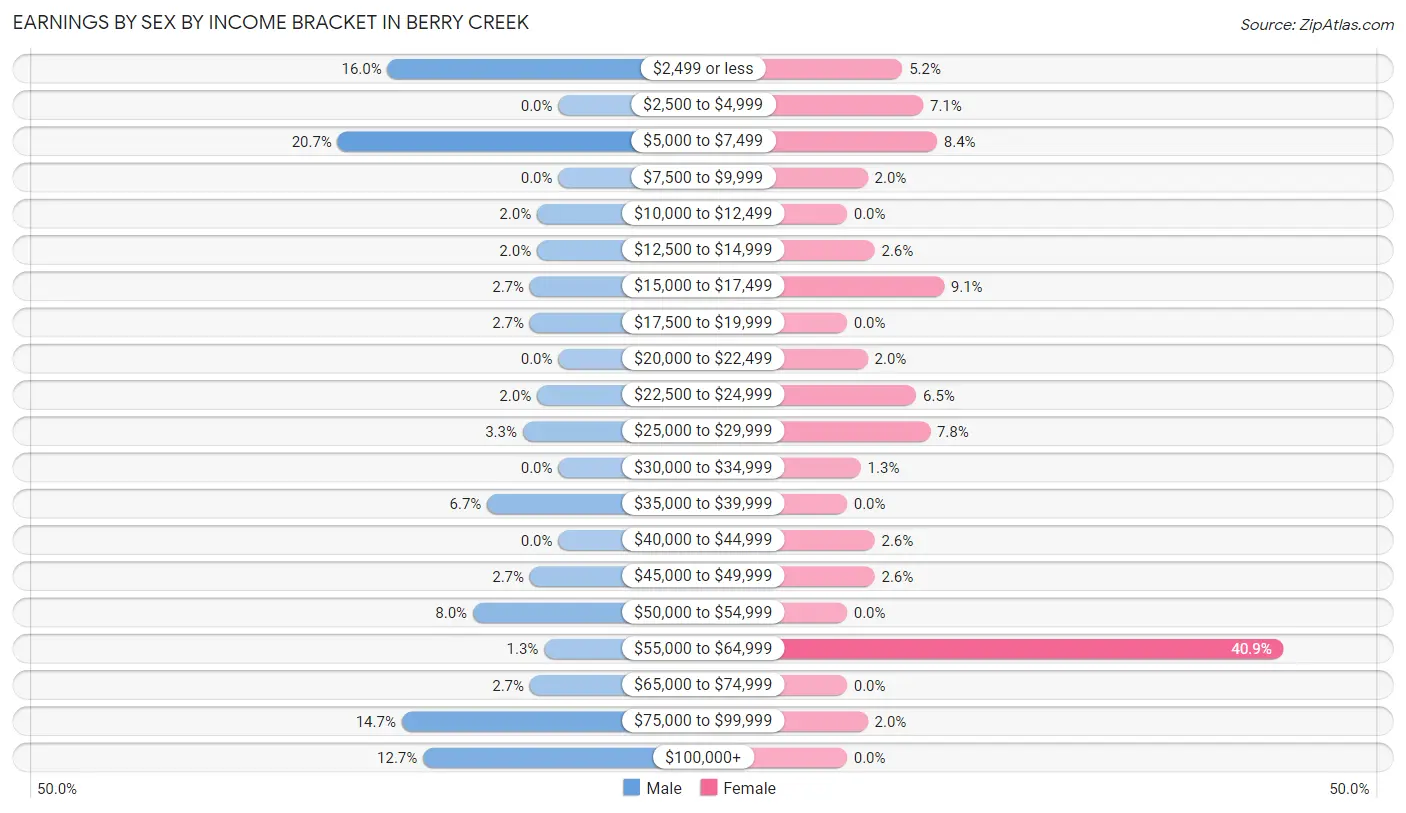
Earnings by Sex by Income Bracket in Berry Creek
The most common earnings brackets in Berry Creek are $5,000 to $7,499 for men (31 | 20.7%) and $55,000 to $64,999 for women (63 | 40.9%).
| Income | Male | Female |
| $2,499 or less | 24 (16.0%) | 8 (5.2%) |
| $2,500 to $4,999 | 0 (0.0%) | 11 (7.1%) |
| $5,000 to $7,499 | 31 (20.7%) | 13 (8.4%) |
| $7,500 to $9,999 | 0 (0.0%) | 3 (1.9%) |
| $10,000 to $12,499 | 3 (2.0%) | 0 (0.0%) |
| $12,500 to $14,999 | 3 (2.0%) | 4 (2.6%) |
| $15,000 to $17,499 | 4 (2.7%) | 14 (9.1%) |
| $17,500 to $19,999 | 4 (2.7%) | 0 (0.0%) |
| $20,000 to $22,499 | 0 (0.0%) | 3 (1.9%) |
| $22,500 to $24,999 | 3 (2.0%) | 10 (6.5%) |
| $25,000 to $29,999 | 5 (3.3%) | 12 (7.8%) |
| $30,000 to $34,999 | 0 (0.0%) | 2 (1.3%) |
| $35,000 to $39,999 | 10 (6.7%) | 0 (0.0%) |
| $40,000 to $44,999 | 0 (0.0%) | 4 (2.6%) |
| $45,000 to $49,999 | 4 (2.7%) | 4 (2.6%) |
| $50,000 to $54,999 | 12 (8.0%) | 0 (0.0%) |
| $55,000 to $64,999 | 2 (1.3%) | 63 (40.9%) |
| $65,000 to $74,999 | 4 (2.7%) | 0 (0.0%) |
| $75,000 to $99,999 | 22 (14.7%) | 3 (1.9%) |
| $100,000+ | 19 (12.7%) | 0 (0.0%) |
| Total | 150 (100.0%) | 154 (100.0%) |
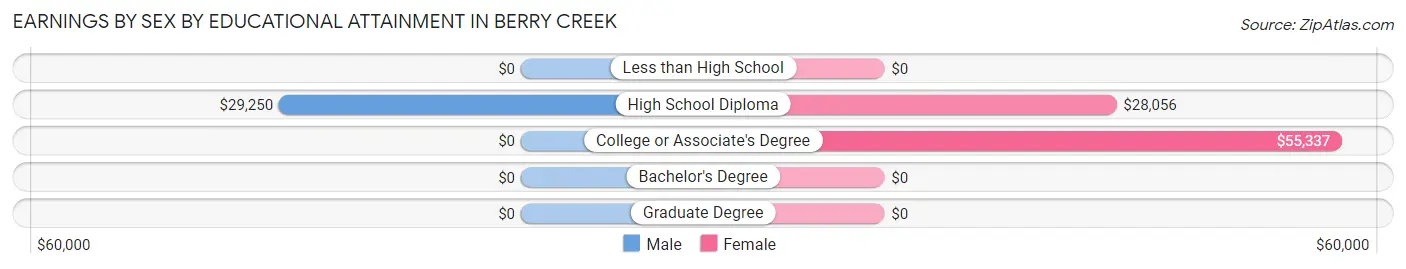
Earnings by Sex by Educational Attainment in Berry Creek
Average earnings in Berry Creek are $36,625 for men and $44,688 for women, a difference of 18.0%. Men with an educational attainment of high school diploma enjoy the highest average annual earnings of $29,250, while those with high school diploma education earn the least with $29,250. Women with an educational attainment of college or associate's degree earn the most with the average annual earnings of $55,337, while those with high school diploma education have the smallest earnings of $28,056.
| Educational Attainment | Male Income | Female Income |
| Less than High School | - | - |
| High School Diploma | $29,250 | $28,056 |
| College or Associate's Degree | - | - |
| Bachelor's Degree | - | - |
| Graduate Degree | - | - |
| Total | $36,625 | $44,688 |
Family Income in Berry Creek
Family Income Brackets in Berry Creek
According to the Berry Creek family income data, there are 65 families falling into the $100,000 to $149,999 income range, which is the most common income bracket and makes up 23.8% of all families.
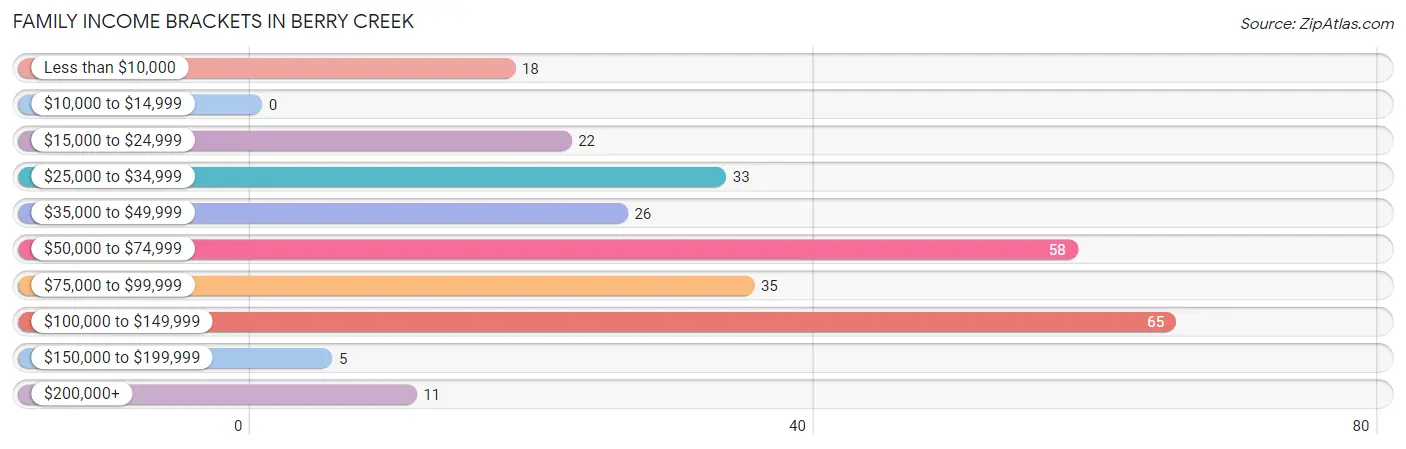
| Income Bracket | # Families | % Families |
| Less than $10,000 | 18 | 6.6% |
| $10,000 to $14,999 | 0 | 0.0% |
| $15,000 to $24,999 | 22 | 8.1% |
| $25,000 to $34,999 | 33 | 12.1% |
| $35,000 to $49,999 | 26 | 9.5% |
| $50,000 to $74,999 | 58 | 21.2% |
| $75,000 to $99,999 | 35 | 12.8% |
| $100,000 to $149,999 | 65 | 23.8% |
| $150,000 to $199,999 | 5 | 1.8% |
| $200,000+ | 11 | 4.0% |
Family Income by Famaliy Size in Berry Creek
3-person families (87 | 31.9%) account for the highest median family income in Berry Creek with $109,375 per family, while 3-person families (87 | 31.9%) have the highest median income of $36,458 per family member.
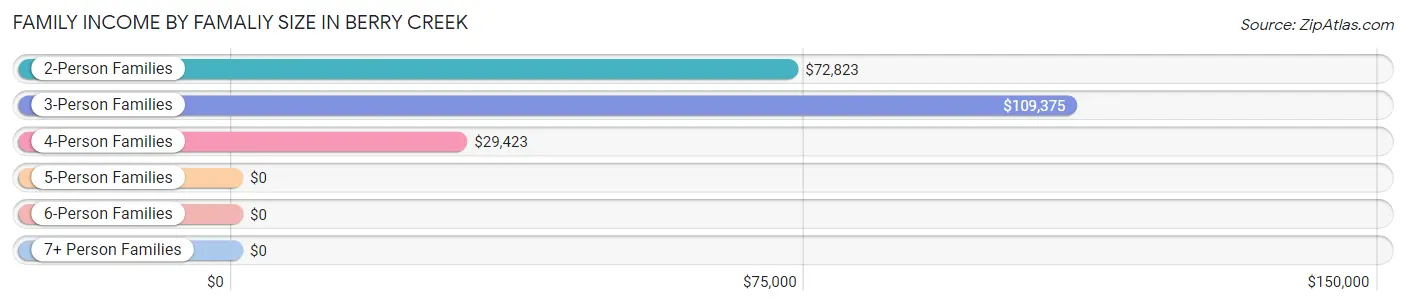
| Income Bracket | # Families | Median Income |
| 2-Person Families | 162 (59.3%) | $72,823 |
| 3-Person Families | 87 (31.9%) | $109,375 |
| 4-Person Families | 20 (7.3%) | $29,423 |
| 5-Person Families | 4 (1.5%) | $0 |
| 6-Person Families | 0 (0.0%) | $0 |
| 7+ Person Families | 0 (0.0%) | $0 |
| Total | 273 (100.0%) | $73,347 |
Family Income by Number of Earners in Berry Creek
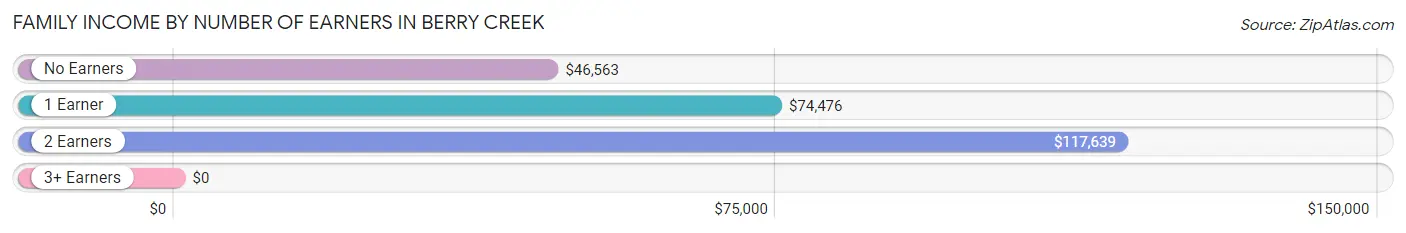
| Number of Earners | # Families | Median Income |
| No Earners | 135 (49.4%) | $46,563 |
| 1 Earner | 101 (37.0%) | $74,476 |
| 2 Earners | 37 (13.6%) | $117,639 |
| 3+ Earners | 0 (0.0%) | $0 |
| Total | 273 (100.0%) | $73,347 |
Household Income in Berry Creek
Household Income Brackets in Berry Creek
With 86 households falling in the category, the $35,000 to $49,999 income range is the most frequent in Berry Creek, accounting for 20.1% of all households. In contrast, only 5 households (1.2%) fall into the $150,000 to $199,999 income bracket, making it the least populous group.
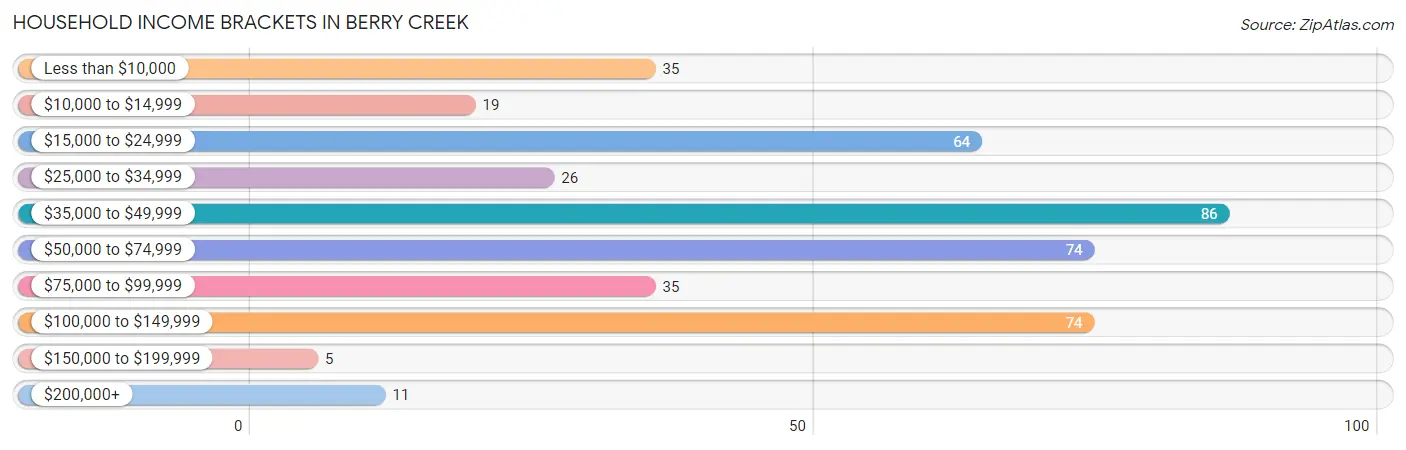
| Income Bracket | # Households | % Households |
| Less than $10,000 | 35 | 8.2% |
| $10,000 to $14,999 | 19 | 4.4% |
| $15,000 to $24,999 | 64 | 14.9% |
| $25,000 to $34,999 | 26 | 6.1% |
| $35,000 to $49,999 | 86 | 20.0% |
| $50,000 to $74,999 | 74 | 17.2% |
| $75,000 to $99,999 | 35 | 8.2% |
| $100,000 to $149,999 | 74 | 17.2% |
| $150,000 to $199,999 | 5 | 1.2% |
| $200,000+ | 11 | 2.6% |
Household Income by Householder Age in Berry Creek
The median household income in Berry Creek is $45,547, with the highest median household income of $73,468 found in the 45 to 64 years age bracket for the primary householder. A total of 156 households (36.4%) fall into this category.
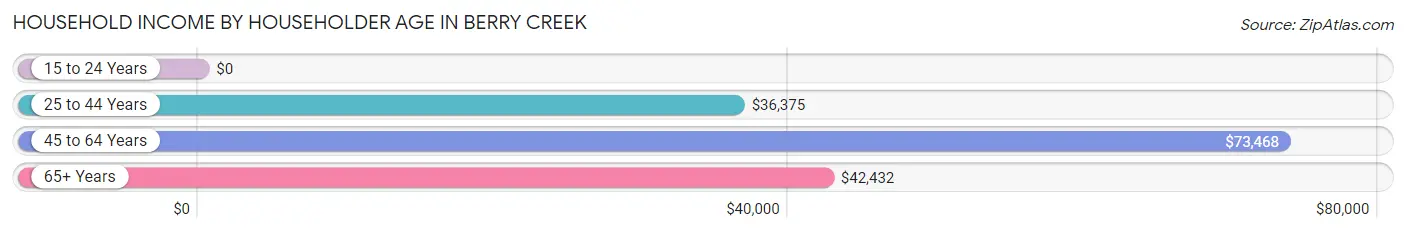
| Income Bracket | # Households | Median Income |
| 15 to 24 Years | 0 (0.0%) | $0 |
| 25 to 44 Years | 61 (14.2%) | $36,375 |
| 45 to 64 Years | 156 (36.4%) | $73,468 |
| 65+ Years | 212 (49.4%) | $42,432 |
| Total | 429 (100.0%) | $45,547 |
Poverty in Berry Creek
Income Below Poverty by Sex and Age in Berry Creek
With 24.9% poverty level for males and 37.9% for females among the residents of Berry Creek, under 5 year old males and 6 to 11 year old females are the most vulnerable to poverty, with 7 males (100.0%) and 12 females (100.0%) in their respective age groups living below the poverty level.
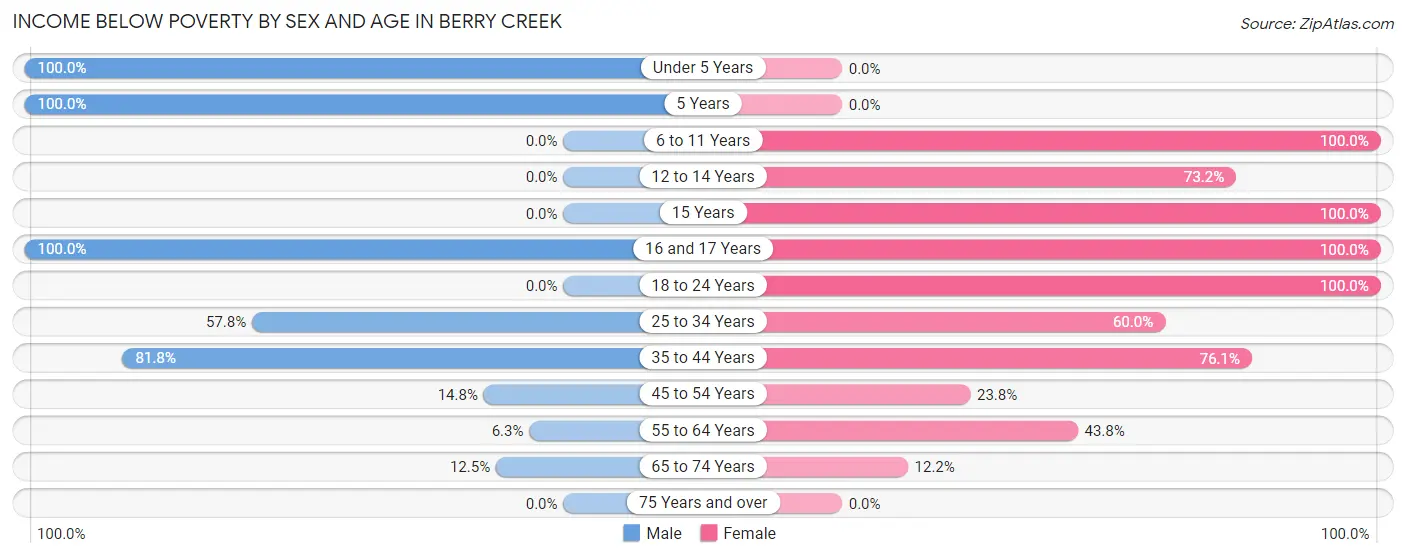
| Age Bracket | Male | Female |
| Under 5 Years | 7 (100.0%) | 0 (0.0%) |
| 5 Years | 19 (100.0%) | 0 (0.0%) |
| 6 to 11 Years | 0 (0.0%) | 12 (100.0%) |
| 12 to 14 Years | 0 (0.0%) | 30 (73.2%) |
| 15 Years | 0 (0.0%) | 11 (100.0%) |
| 16 and 17 Years | 22 (100.0%) | 3 (100.0%) |
| 18 to 24 Years | 0 (0.0%) | 13 (100.0%) |
| 25 to 34 Years | 26 (57.8%) | 3 (60.0%) |
| 35 to 44 Years | 18 (81.8%) | 35 (76.1%) |
| 45 to 54 Years | 17 (14.8%) | 25 (23.8%) |
| 55 to 64 Years | 6 (6.3%) | 28 (43.8%) |
| 65 to 74 Years | 20 (12.5%) | 16 (12.2%) |
| 75 Years and over | 0 (0.0%) | 0 (0.0%) |
| Total | 135 (24.9%) | 176 (37.9%) |
Income Above Poverty by Sex and Age in Berry Creek
According to the poverty statistics in Berry Creek, males aged 12 to 14 years and females aged 75 years and over are the age groups that are most secure financially, with 100.0% of males and 100.0% of females in these age groups living above the poverty line.
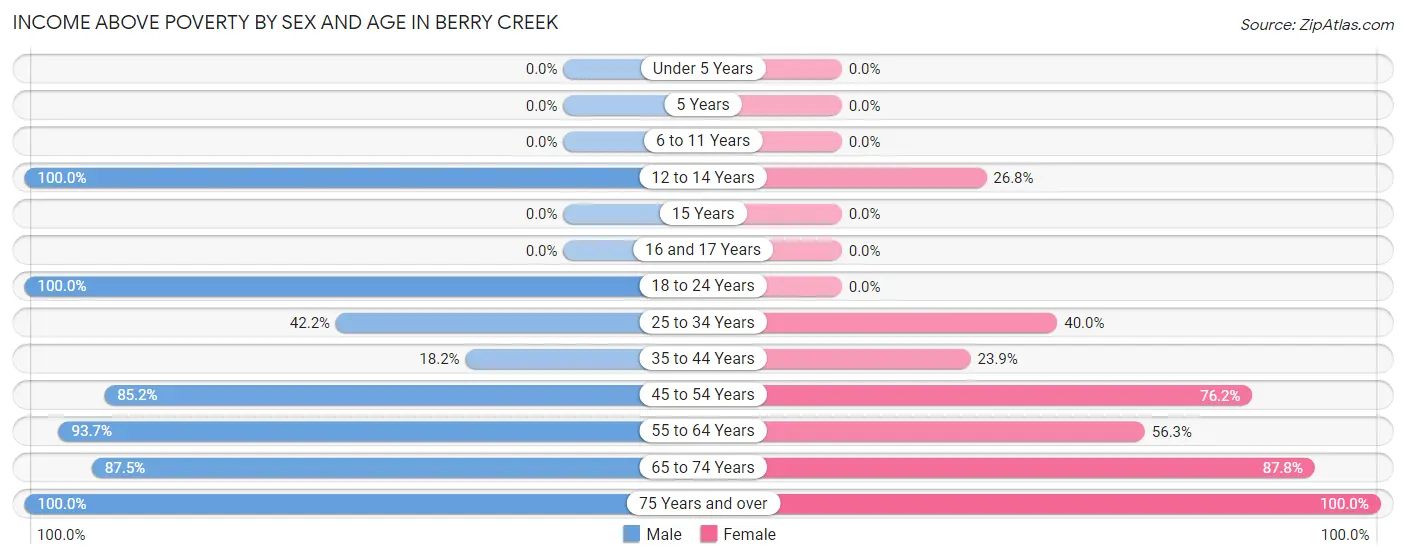
| Age Bracket | Male | Female |
| Under 5 Years | 0 (0.0%) | 0 (0.0%) |
| 5 Years | 0 (0.0%) | 0 (0.0%) |
| 6 to 11 Years | 0 (0.0%) | 0 (0.0%) |
| 12 to 14 Years | 13 (100.0%) | 11 (26.8%) |
| 15 Years | 0 (0.0%) | 0 (0.0%) |
| 16 and 17 Years | 0 (0.0%) | 0 (0.0%) |
| 18 to 24 Years | 20 (100.0%) | 0 (0.0%) |
| 25 to 34 Years | 19 (42.2%) | 2 (40.0%) |
| 35 to 44 Years | 4 (18.2%) | 11 (23.9%) |
| 45 to 54 Years | 98 (85.2%) | 80 (76.2%) |
| 55 to 64 Years | 89 (93.7%) | 36 (56.2%) |
| 65 to 74 Years | 140 (87.5%) | 115 (87.8%) |
| 75 Years and over | 23 (100.0%) | 34 (100.0%) |
| Total | 406 (75.0%) | 289 (62.2%) |
Income Below Poverty Among Married-Couple Families in Berry Creek
The poverty statistics for married-couple families in Berry Creek show that 7.1% or 14 of the total 196 families live below the poverty line. Families with no children have the highest poverty rate of 7.6%, comprising of 14 families. On the other hand, families with 1 or 2 children have the lowest poverty rate of 0.0%, which includes 0 families.
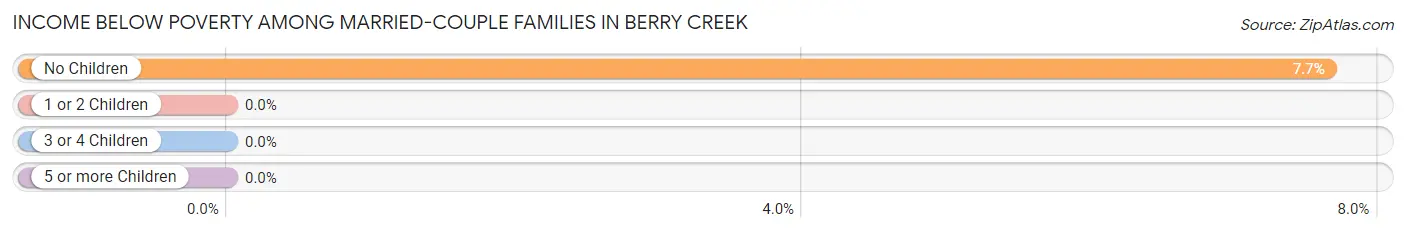
| Children | Above Poverty | Below Poverty |
| No Children | 169 (92.3%) | 14 (7.6%) |
| 1 or 2 Children | 13 (100.0%) | 0 (0.0%) |
| 3 or 4 Children | 0 (0.0%) | 0 (0.0%) |
| 5 or more Children | 0 (0.0%) | 0 (0.0%) |
| Total | 182 (92.9%) | 14 (7.1%) |
Income Below Poverty Among Single-Parent Households in Berry Creek
According to the poverty data in Berry Creek, 30.8% or 4 single-father households and 60.9% or 39 single-mother households are living below the poverty line. Among single-father households, those with 1 or 2 children have the highest poverty rate, with 4 households (100.0%) experiencing poverty. Likewise, among single-mother households, those with 1 or 2 children have the highest poverty rate, with 26 households (100.0%) falling below the poverty line.
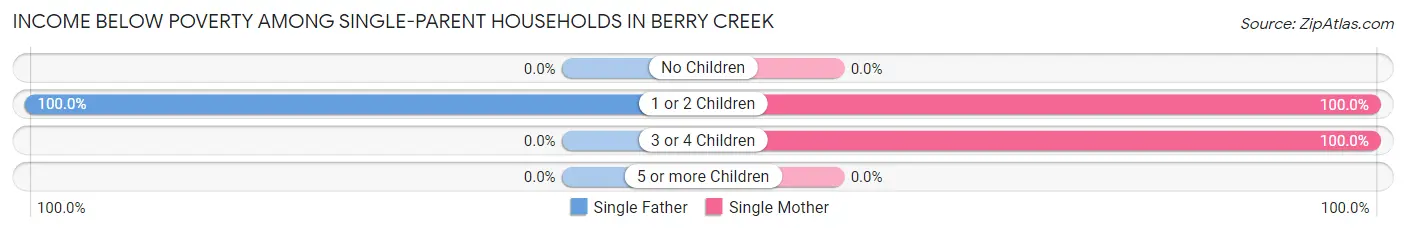
| Children | Single Father | Single Mother |
| No Children | 0 (0.0%) | 0 (0.0%) |
| 1 or 2 Children | 4 (100.0%) | 26 (100.0%) |
| 3 or 4 Children | 0 (0.0%) | 13 (100.0%) |
| 5 or more Children | 0 (0.0%) | 0 (0.0%) |
| Total | 4 (30.8%) | 39 (60.9%) |
Income Below Poverty Among Married-Couple vs Single-Parent Households in Berry Creek
The poverty data for Berry Creek shows that 14 of the married-couple family households (7.1%) and 43 of the single-parent households (55.8%) are living below the poverty level. Within the married-couple family households, those with no children have the highest poverty rate, with 14 households (7.6%) falling below the poverty line. Among the single-parent households, those with 1 or 2 children have the highest poverty rate, with 30 household (100.0%) living below poverty.
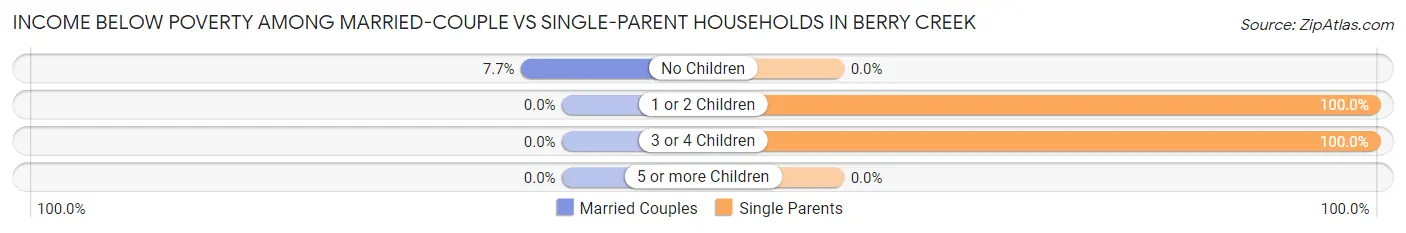
| Children | Married-Couple Families | Single-Parent Households |
| No Children | 14 (7.6%) | 0 (0.0%) |
| 1 or 2 Children | 0 (0.0%) | 30 (100.0%) |
| 3 or 4 Children | 0 (0.0%) | 13 (100.0%) |
| 5 or more Children | 0 (0.0%) | 0 (0.0%) |
| Total | 14 (7.1%) | 43 (55.8%) |
Race in Berry Creek
The most populous races in Berry Creek are White / Caucasian (859 | 85.4%), Hispanic or Latino (99 | 9.8%), and Asian (51 | 5.1%).
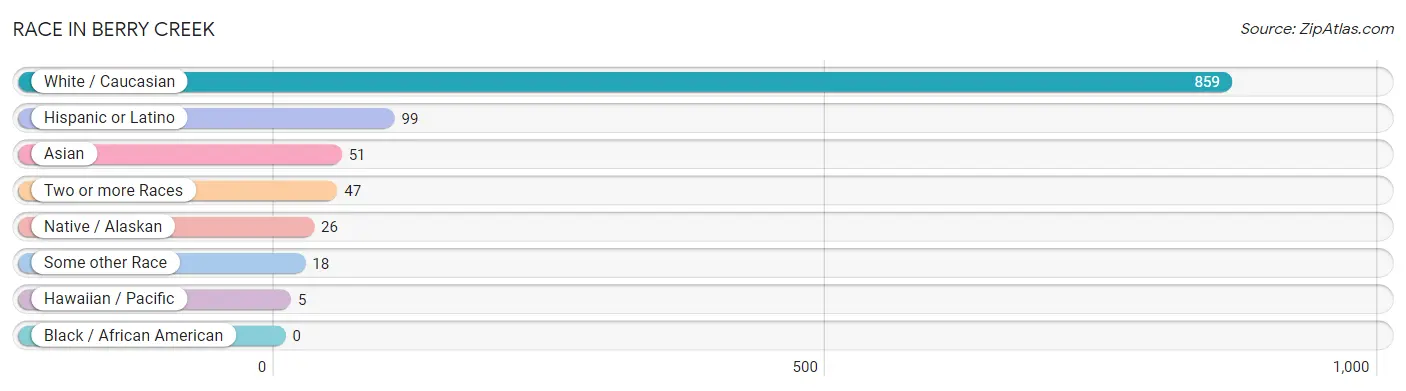
| Race | # Population | % Population |
| Asian | 51 | 5.1% |
| Black / African American | 0 | 0.0% |
| Hawaiian / Pacific | 5 | 0.5% |
| Hispanic or Latino | 99 | 9.8% |
| Native / Alaskan | 26 | 2.6% |
| White / Caucasian | 859 | 85.4% |
| Two or more Races | 47 | 4.7% |
| Some other Race | 18 | 1.8% |
| Total | 1,006 | 100.0% |
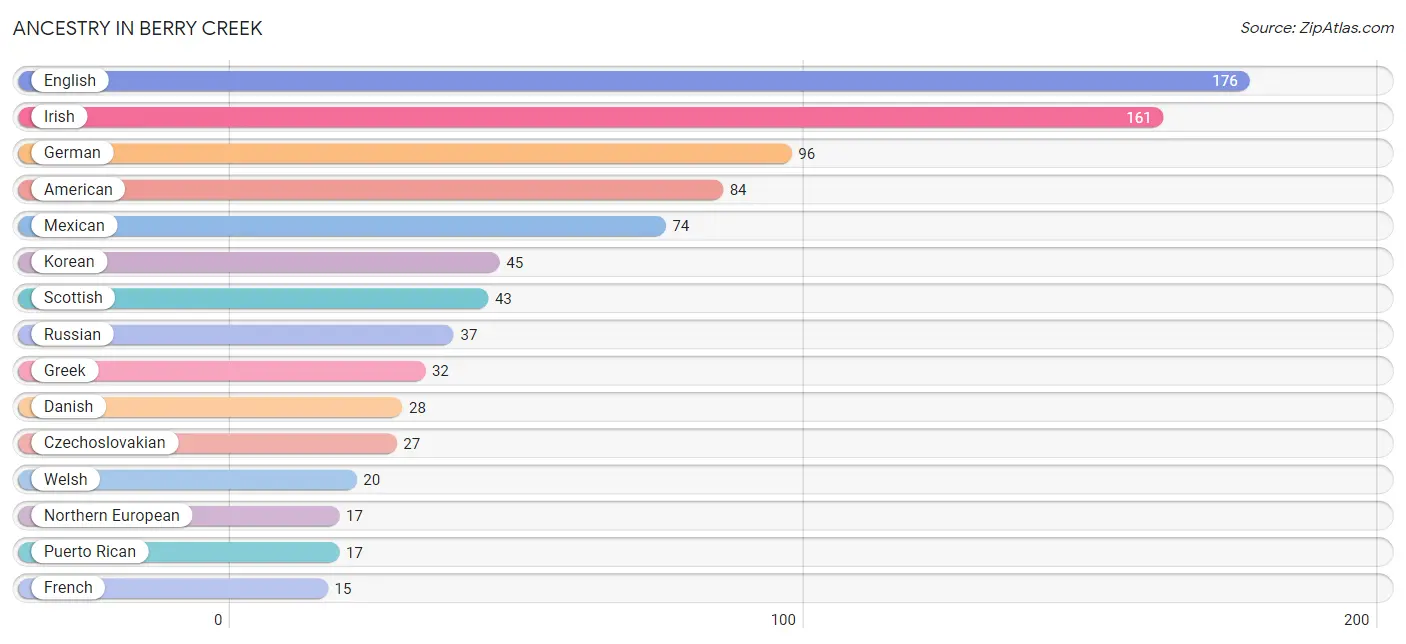
Ancestry in Berry Creek
The most populous ancestries reported in Berry Creek are English (176 | 17.5%), Irish (161 | 16.0%), German (96 | 9.5%), American (84 | 8.4%), and Mexican (74 | 7.4%), together accounting for 58.7% of all Berry Creek residents.
| Ancestry | # Population | % Population |
| American | 84 | 8.4% |
| Austrian | 4 | 0.4% |
| Bangladeshi | 10 | 1.0% |
| Belgian | 3 | 0.3% |
| Blackfeet | 3 | 0.3% |
| Burmese | 3 | 0.3% |
| Cajun | 12 | 1.2% |
| Cherokee | 8 | 0.8% |
| Chilean | 4 | 0.4% |
| Choctaw | 13 | 1.3% |
| Czechoslovakian | 27 | 2.7% |
| Danish | 28 | 2.8% |
| Dutch | 10 | 1.0% |
| English | 176 | 17.5% |
| European | 4 | 0.4% |
| French | 15 | 1.5% |
| German | 96 | 9.5% |
| Greek | 32 | 3.2% |
| Hopi | 2 | 0.2% |
| Irish | 161 | 16.0% |
| Italian | 13 | 1.3% |
| Korean | 45 | 4.5% |
| Mexican | 74 | 7.4% |
| Native Hawaiian | 5 | 0.5% |
| Northern European | 17 | 1.7% |
| Norwegian | 6 | 0.6% |
| Polish | 11 | 1.1% |
| Portuguese | 4 | 0.4% |
| Pueblo | 4 | 0.4% |
| Puerto Rican | 17 | 1.7% |
| Russian | 37 | 3.7% |
| Scandinavian | 8 | 0.8% |
| Scotch-Irish | 6 | 0.6% |
| Scottish | 43 | 4.3% |
| South American | 4 | 0.4% |
| Spaniard | 4 | 0.4% |
| Swedish | 4 | 0.4% |
| Swiss | 4 | 0.4% |
| Welsh | 20 | 2.0% | View All 39 Rows |
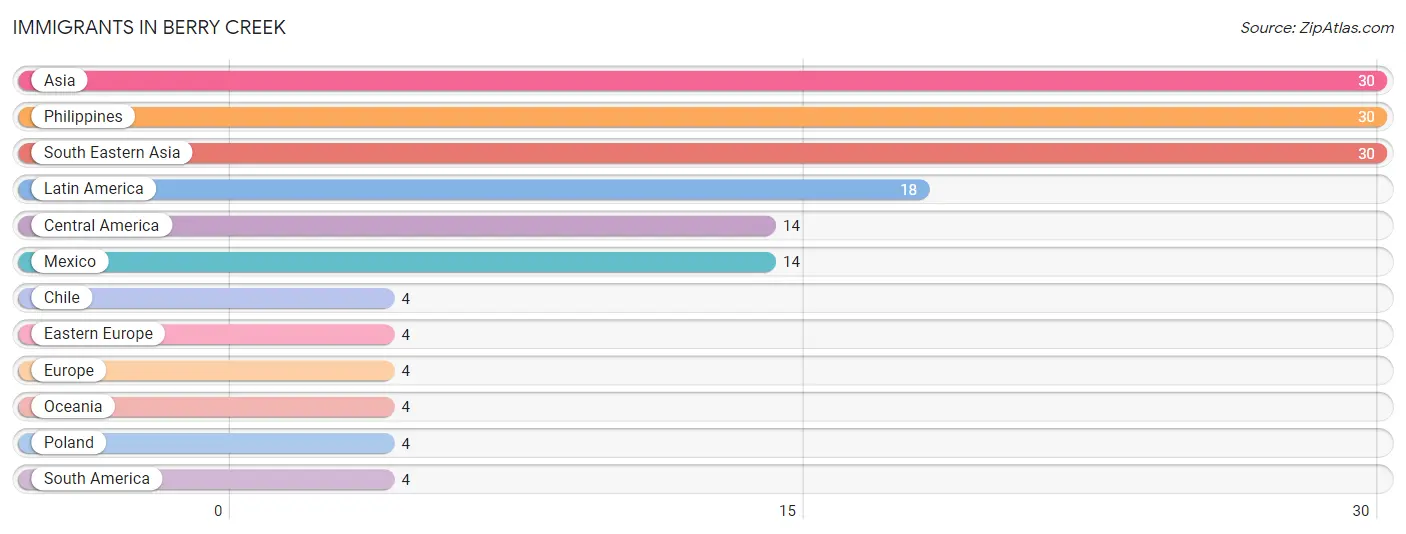
Immigrants in Berry Creek
The most numerous immigrant groups reported in Berry Creek came from Asia (30 | 3.0%), Philippines (30 | 3.0%), South Eastern Asia (30 | 3.0%), Latin America (18 | 1.8%), and Central America (14 | 1.4%), together accounting for 12.1% of all Berry Creek residents.
| Immigration Origin | # Population | % Population |
| Asia | 30 | 3.0% |
| Central America | 14 | 1.4% |
| Chile | 4 | 0.4% |
| Eastern Europe | 4 | 0.4% |
| Europe | 4 | 0.4% |
| Latin America | 18 | 1.8% |
| Mexico | 14 | 1.4% |
| Oceania | 4 | 0.4% |
| Philippines | 30 | 3.0% |
| Poland | 4 | 0.4% |
| South America | 4 | 0.4% |
| South Eastern Asia | 30 | 3.0% | View All 12 Rows |
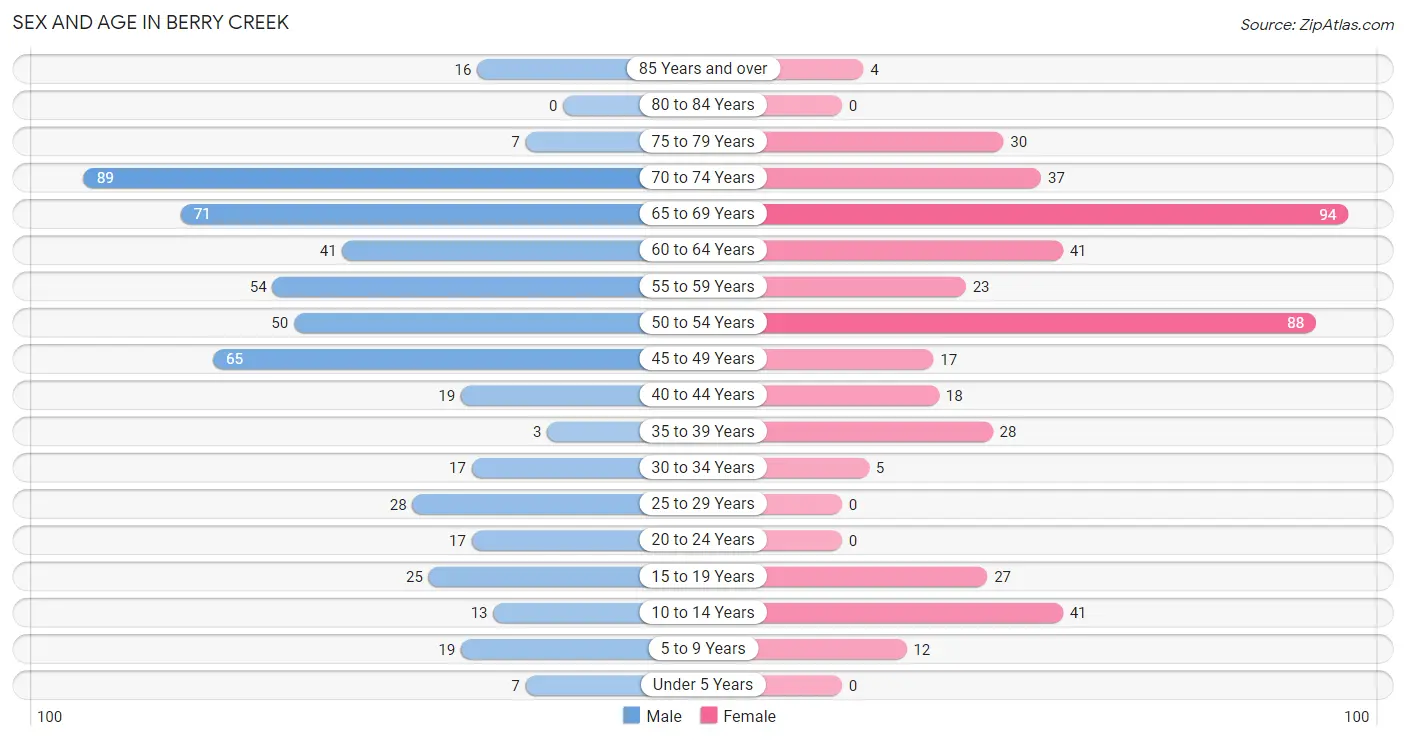
Sex and Age in Berry Creek
Sex and Age in Berry Creek
The most populous age groups in Berry Creek are 70 to 74 Years (89 | 16.5%) for men and 65 to 69 Years (94 | 20.2%) for women.
| Age Bracket | Male | Female |
| Under 5 Years | 7 (1.3%) | 0 (0.0%) |
| 5 to 9 Years | 19 (3.5%) | 12 (2.6%) |
| 10 to 14 Years | 13 (2.4%) | 41 (8.8%) |
| 15 to 19 Years | 25 (4.6%) | 27 (5.8%) |
| 20 to 24 Years | 17 (3.1%) | 0 (0.0%) |
| 25 to 29 Years | 28 (5.2%) | 0 (0.0%) |
| 30 to 34 Years | 17 (3.1%) | 5 (1.1%) |
| 35 to 39 Years | 3 (0.5%) | 28 (6.0%) |
| 40 to 44 Years | 19 (3.5%) | 18 (3.9%) |
| 45 to 49 Years | 65 (12.0%) | 17 (3.7%) |
| 50 to 54 Years | 50 (9.2%) | 88 (18.9%) |
| 55 to 59 Years | 54 (10.0%) | 23 (5.0%) |
| 60 to 64 Years | 41 (7.6%) | 41 (8.8%) |
| 65 to 69 Years | 71 (13.1%) | 94 (20.2%) |
| 70 to 74 Years | 89 (16.5%) | 37 (8.0%) |
| 75 to 79 Years | 7 (1.3%) | 30 (6.5%) |
| 80 to 84 Years | 0 (0.0%) | 0 (0.0%) |
| 85 Years and over | 16 (3.0%) | 4 (0.9%) |
| Total | 541 (100.0%) | 465 (100.0%) |
Families and Households in Berry Creek
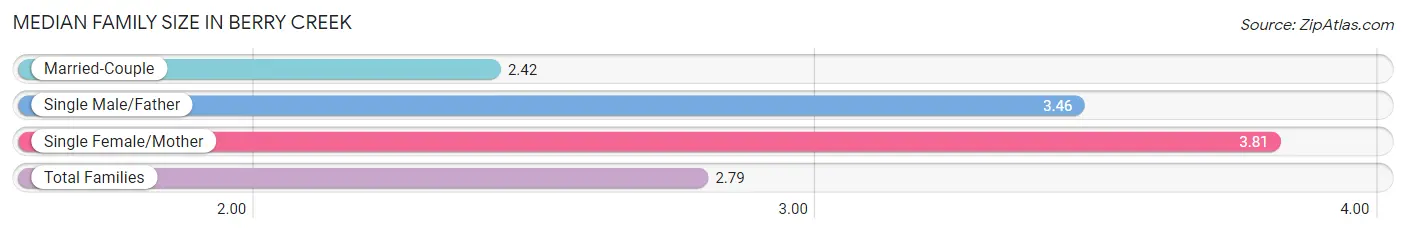
Median Family Size in Berry Creek
The median family size in Berry Creek is 2.79 persons per family, with single female/mother families (64 | 23.4%) accounting for the largest median family size of 3.81 persons per family. On the other hand, married-couple families (196 | 71.8%) represent the smallest median family size with 2.42 persons per family.
| Family Type | # Families | Family Size |
| Married-Couple | 196 (71.8%) | 2.42 |
| Single Male/Father | 13 (4.8%) | 3.46 |
| Single Female/Mother | 64 (23.4%) | 3.81 |
| Total Families | 273 (100.0%) | 2.79 |
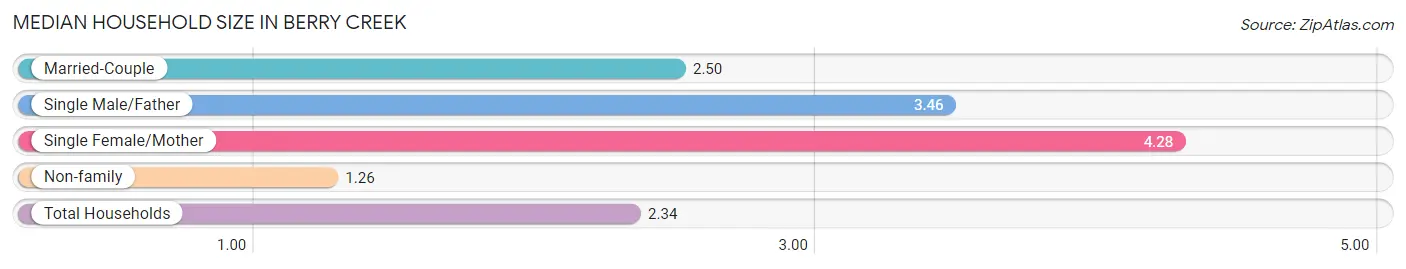
Median Household Size in Berry Creek
The median household size in Berry Creek is 2.34 persons per household, with single female/mother households (64 | 14.9%) accounting for the largest median household size of 4.28 persons per household. non-family households (156 | 36.4%) represent the smallest median household size with 1.26 persons per household.
| Household Type | # Households | Household Size |
| Married-Couple | 196 (45.7%) | 2.50 |
| Single Male/Father | 13 (3.0%) | 3.46 |
| Single Female/Mother | 64 (14.9%) | 4.28 |
| Non-family | 156 (36.4%) | 1.26 |
| Total Households | 429 (100.0%) | 2.34 |
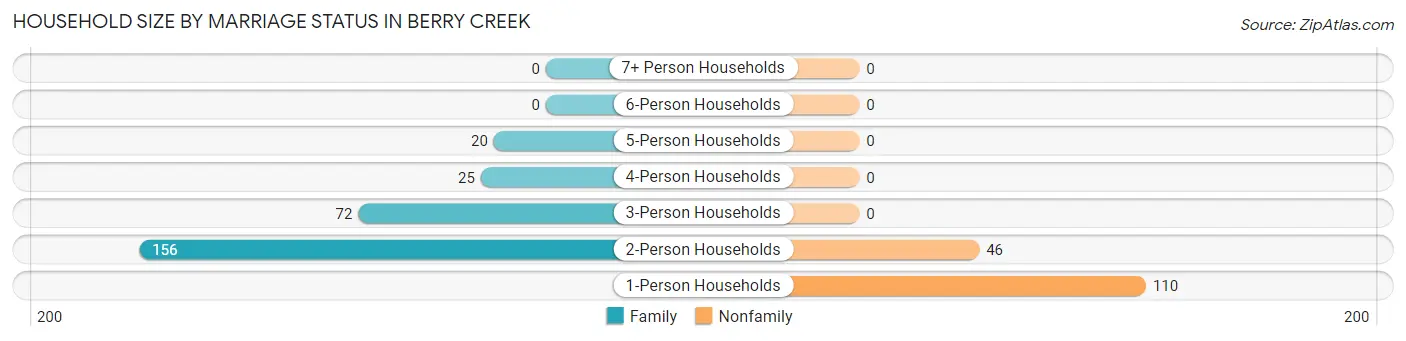
Household Size by Marriage Status in Berry Creek
Out of a total of 429 households in Berry Creek, 273 (63.6%) are family households, while 156 (36.4%) are nonfamily households. The most numerous type of family households are 2-person households, comprising 156, and the most common type of nonfamily households are 1-person households, comprising 110.
| Household Size | Family Households | Nonfamily Households |
| 1-Person Households | - | 110 (25.6%) |
| 2-Person Households | 156 (36.4%) | 46 (10.7%) |
| 3-Person Households | 72 (16.8%) | 0 (0.0%) |
| 4-Person Households | 25 (5.8%) | 0 (0.0%) |
| 5-Person Households | 20 (4.7%) | 0 (0.0%) |
| 6-Person Households | 0 (0.0%) | 0 (0.0%) |
| 7+ Person Households | 0 (0.0%) | 0 (0.0%) |
| Total | 273 (63.6%) | 156 (36.4%) |
Female Fertility in Berry Creek
Fertility by Age in Berry Creek
| Age Bracket | Women with Births | Births / 1,000 Women |
| 15 to 19 years | 0 (0.0%) | 0.0 |
| 20 to 34 years | 0 (0.0%) | 0.0 |
| 35 to 50 years | 0 (0.0%) | 0.0 |
| Total | 0 (0.0%) | 0.0 |
Fertility by Age by Marriage Status in Berry Creek
| Age Bracket | Married | Unmarried |
| 15 to 19 years | 0 (0.0%) | 0 (0.0%) |
| 20 to 34 years | 0 (0.0%) | 0 (0.0%) |
| 35 to 50 years | 0 (0.0%) | 0 (0.0%) |
| Total | 0 (0.0%) | 0 (0.0%) |
Fertility by Education in Berry Creek
| Educational Attainment | Women with Births | Births / 1,000 Women |
| Less than High School | 0 (0.0%) | 0.0 |
| High School Diploma | 0 (0.0%) | 0.0 |
| College or Associate's Degree | 0 (0.0%) | 0.0 |
| Bachelor's Degree | 0 (0.0%) | 0.0 |
| Graduate Degree | 0 (0.0%) | 0.0 |
| Total | 0 (0.0%) | 0.0 |
Fertility by Education by Marriage Status in Berry Creek
| Educational Attainment | Married | Unmarried |
| Less than High School | 0 (0.0%) | 0 (0.0%) |
| High School Diploma | 0 (0.0%) | 0 (0.0%) |
| College or Associate's Degree | 0 (0.0%) | 0 (0.0%) |
| Bachelor's Degree | 0 (0.0%) | 0 (0.0%) |
| Graduate Degree | 0 (0.0%) | 0 (0.0%) |
| Total | 0 (0.0%) | 0 (0.0%) |
Employment Characteristics in Berry Creek
Employment by Class of Employer in Berry Creek
Among the 215 employed individuals in Berry Creek, private company employees (80 | 37.2%), self-employed (not incorporated) (61 | 28.4%), and not-for-profit organizations (26 | 12.1%) make up the most common classes of employment.
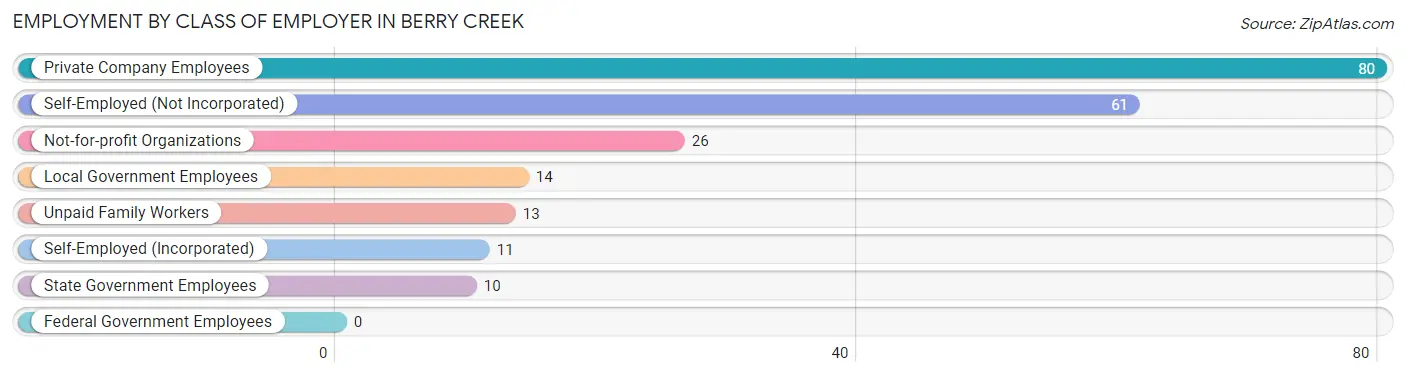
| Employer Class | # Employees | % Employees |
| Private Company Employees | 80 | 37.2% |
| Self-Employed (Incorporated) | 11 | 5.1% |
| Self-Employed (Not Incorporated) | 61 | 28.4% |
| Not-for-profit Organizations | 26 | 12.1% |
| Local Government Employees | 14 | 6.5% |
| State Government Employees | 10 | 4.6% |
| Federal Government Employees | 0 | 0.0% |
| Unpaid Family Workers | 13 | 6.0% |
| Total | 215 | 100.0% |
Employment Status by Age in Berry Creek
According to the labor force statistics for Berry Creek, out of the total population over 16 years of age (903), 30.5% or 275 individuals are in the labor force, with 19.3% or 53 of them unemployed. The age group with the highest labor force participation rate is 25 to 29 years, with 100.0% or 28 individuals in the labor force. Within the labor force, the 16 to 19 years age range has the highest percentage of unemployed individuals, with 100.0% or 16 of them being unemployed.
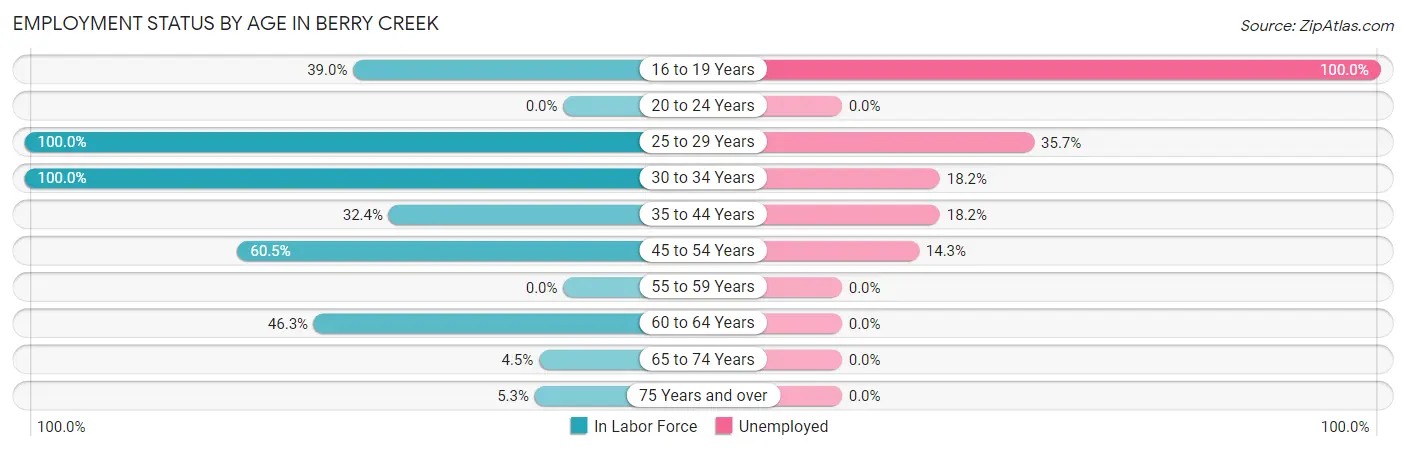
| Age Bracket | In Labor Force | Unemployed |
| 16 to 19 Years | 16 (39.0%) | 16 (100.0%) |
| 20 to 24 Years | 0 (0.0%) | 0 (0.0%) |
| 25 to 29 Years | 28 (100.0%) | 10 (35.7%) |
| 30 to 34 Years | 22 (100.0%) | 4 (18.2%) |
| 35 to 44 Years | 22 (32.4%) | 4 (18.2%) |
| 45 to 54 Years | 133 (60.5%) | 19 (14.3%) |
| 55 to 59 Years | 0 (0.0%) | 0 (0.0%) |
| 60 to 64 Years | 38 (46.3%) | 0 (0.0%) |
| 65 to 74 Years | 13 (4.5%) | 0 (0.0%) |
| 75 Years and over | 3 (5.3%) | 0 (0.0%) |
| Total | 275 (30.5%) | 53 (19.3%) |
Employment Status by Educational Attainment in Berry Creek
According to labor force statistics for Berry Creek, 48.9% of individuals (243) out of the total population between 25 and 64 years of age (497) are in the labor force, with 15.2% or 37 of them being unemployed. The group with the highest labor force participation rate are those with the educational attainment of college / associate degree, with 67.6% or 125 individuals in the labor force. Within the labor force, individuals with less than high school education have the highest percentage of unemployment, with 74.4% or 29 of them being unemployed.
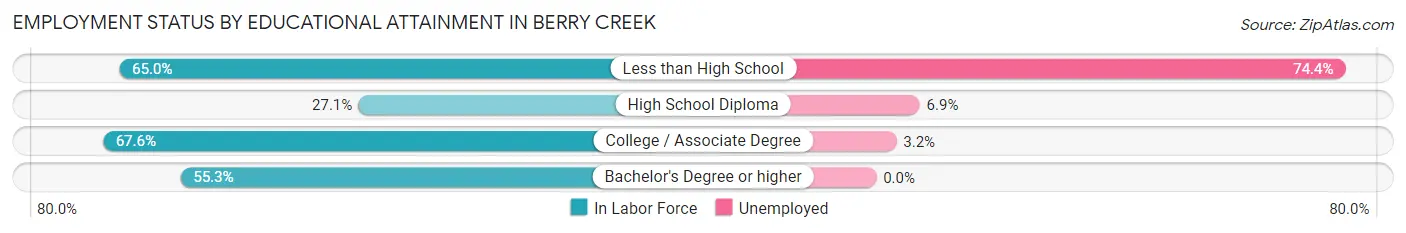
| Educational Attainment | In Labor Force | Unemployed |
| Less than High School | 39 (65.0%) | 45 (74.4%) |
| High School Diploma | 58 (27.1%) | 15 (6.9%) |
| College / Associate Degree | 125 (67.6%) | 6 (3.2%) |
| Bachelor's Degree or higher | 21 (55.3%) | 0 (0.0%) |
| Total | 243 (48.9%) | 76 (15.2%) |
Employment Occupations by Sex in Berry Creek
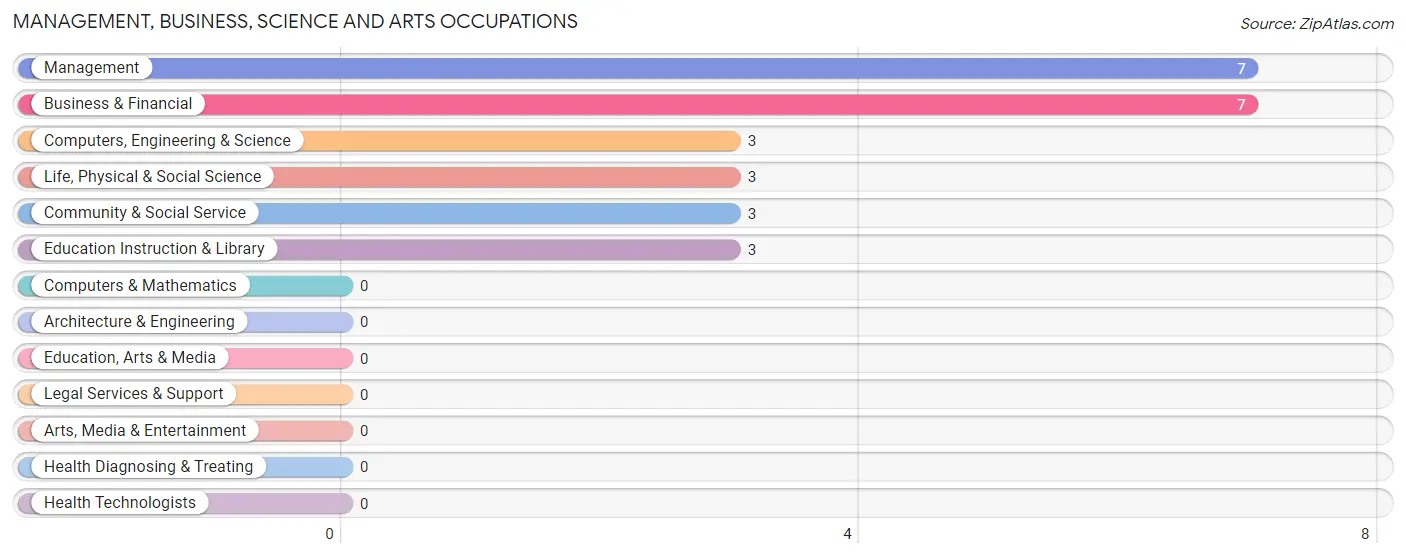
Management, Business, Science and Arts Occupations
The most common Management, Business, Science and Arts occupations in Berry Creek are Management (7 | 3.2%), Business & Financial (7 | 3.2%), Computers, Engineering & Science (3 | 1.3%), Life, Physical & Social Science (3 | 1.3%), and Community & Social Service (3 | 1.3%).
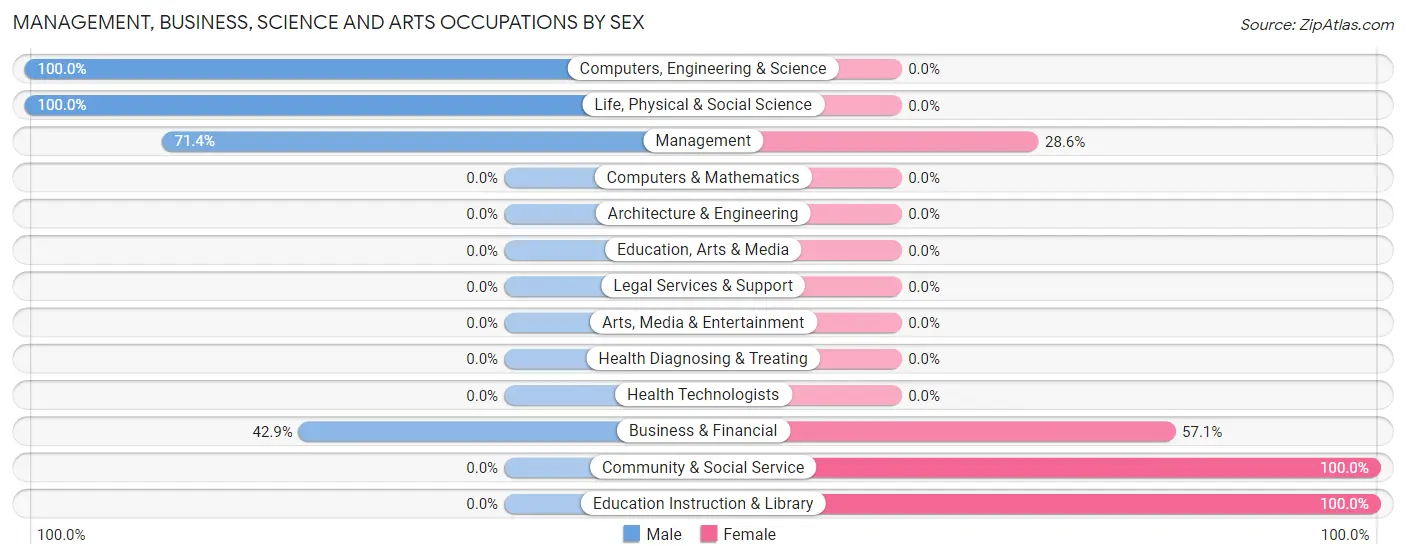
Management, Business, Science and Arts Occupations by Sex
Within the Management, Business, Science and Arts occupations in Berry Creek, the most male-oriented occupations are Computers, Engineering & Science (100.0%), Life, Physical & Social Science (100.0%), and Management (71.4%), while the most female-oriented occupations are Community & Social Service (100.0%), Education Instruction & Library (100.0%), and Business & Financial (57.1%).
| Occupation | Male | Female |
| Management | 5 (71.4%) | 2 (28.6%) |
| Business & Financial | 3 (42.9%) | 4 (57.1%) |
| Computers, Engineering & Science | 3 (100.0%) | 0 (0.0%) |
| Computers & Mathematics | 0 (0.0%) | 0 (0.0%) |
| Architecture & Engineering | 0 (0.0%) | 0 (0.0%) |
| Life, Physical & Social Science | 3 (100.0%) | 0 (0.0%) |
| Community & Social Service | 0 (0.0%) | 3 (100.0%) |
| Education, Arts & Media | 0 (0.0%) | 0 (0.0%) |
| Legal Services & Support | 0 (0.0%) | 0 (0.0%) |
| Education Instruction & Library | 0 (0.0%) | 3 (100.0%) |
| Arts, Media & Entertainment | 0 (0.0%) | 0 (0.0%) |
| Health Diagnosing & Treating | 0 (0.0%) | 0 (0.0%) |
| Health Technologists | 0 (0.0%) | 0 (0.0%) |
| Total (Category) | 11 (55.0%) | 9 (45.0%) |
| Total (Overall) | 92 (41.4%) | 130 (58.6%) |
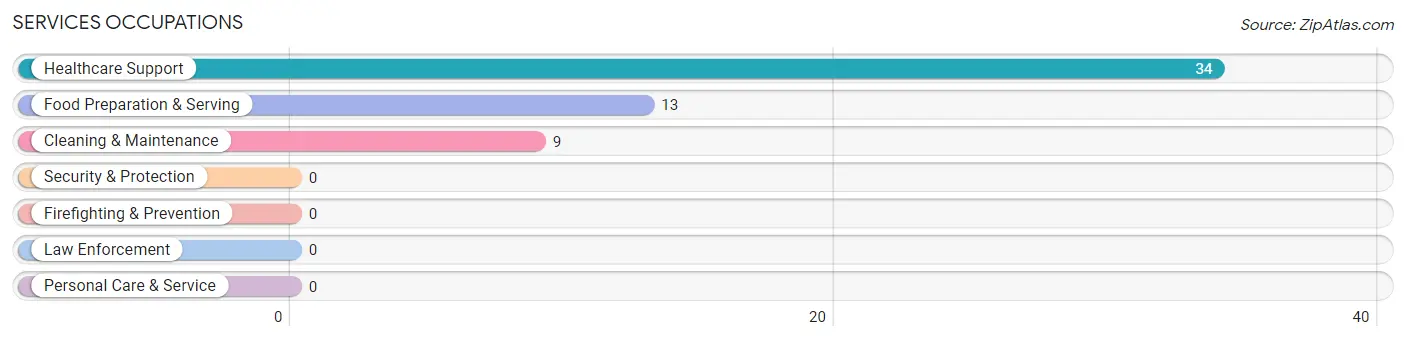
Services Occupations
The most common Services occupations in Berry Creek are Healthcare Support (34 | 15.3%), Food Preparation & Serving (13 | 5.9%), and Cleaning & Maintenance (9 | 4.1%).
Services Occupations by Sex
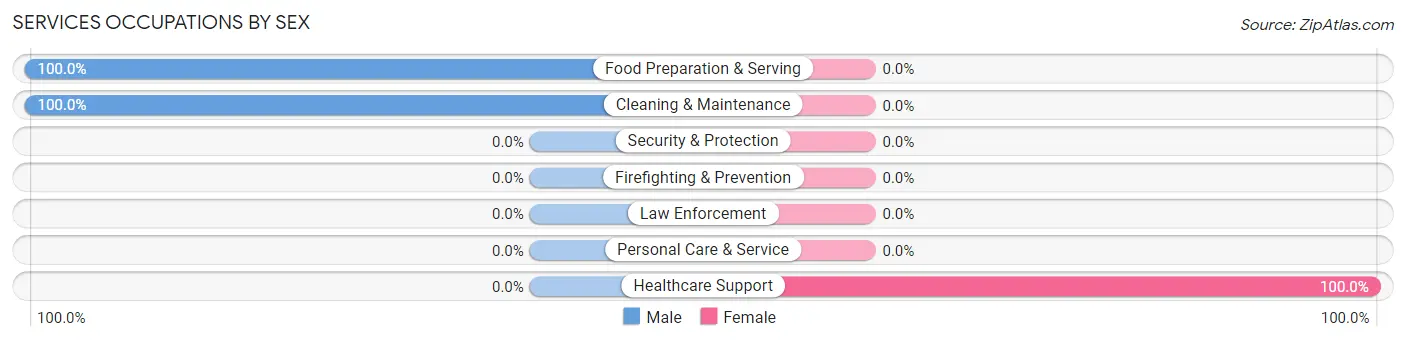
| Occupation | Male | Female |
| Healthcare Support | 0 (0.0%) | 34 (100.0%) |
| Security & Protection | 0 (0.0%) | 0 (0.0%) |
| Firefighting & Prevention | 0 (0.0%) | 0 (0.0%) |
| Law Enforcement | 0 (0.0%) | 0 (0.0%) |
| Food Preparation & Serving | 13 (100.0%) | 0 (0.0%) |
| Cleaning & Maintenance | 9 (100.0%) | 0 (0.0%) |
| Personal Care & Service | 0 (0.0%) | 0 (0.0%) |
| Total (Category) | 22 (39.3%) | 34 (60.7%) |
| Total (Overall) | 92 (41.4%) | 130 (58.6%) |
Sales and Office Occupations
The most common Sales and Office occupations in Berry Creek are Sales & Related (57 | 25.7%), and Office & Administration (39 | 17.6%).

Sales and Office Occupations by Sex

| Occupation | Male | Female |
| Sales & Related | 15 (26.3%) | 42 (73.7%) |
| Office & Administration | 0 (0.0%) | 39 (100.0%) |
| Total (Category) | 15 (15.6%) | 81 (84.4%) |
| Total (Overall) | 92 (41.4%) | 130 (58.6%) |
Natural Resources, Construction and Maintenance Occupations
The most common Natural Resources, Construction and Maintenance occupations in Berry Creek are Construction & Extraction (29 | 13.1%), and Installation, Maintenance & Repair (5 | 2.2%).
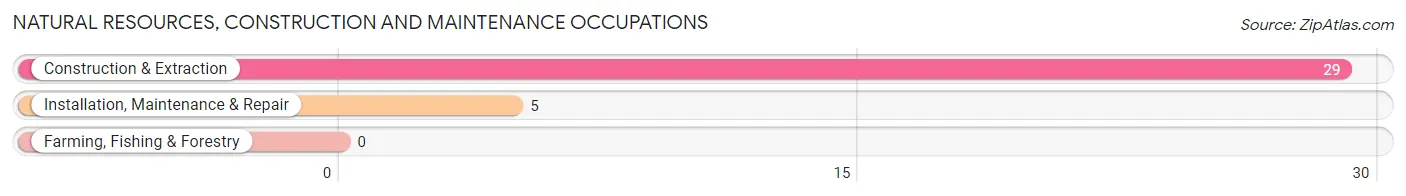
Natural Resources, Construction and Maintenance Occupations by Sex

| Occupation | Male | Female |
| Farming, Fishing & Forestry | 0 (0.0%) | 0 (0.0%) |
| Construction & Extraction | 29 (100.0%) | 0 (0.0%) |
| Installation, Maintenance & Repair | 5 (100.0%) | 0 (0.0%) |
| Total (Category) | 34 (100.0%) | 0 (0.0%) |
| Total (Overall) | 92 (41.4%) | 130 (58.6%) |
Production, Transportation and Moving Occupations
The most common Production, Transportation and Moving occupations in Berry Creek are Production (14 | 6.3%), and Material Moving (2 | 0.9%).
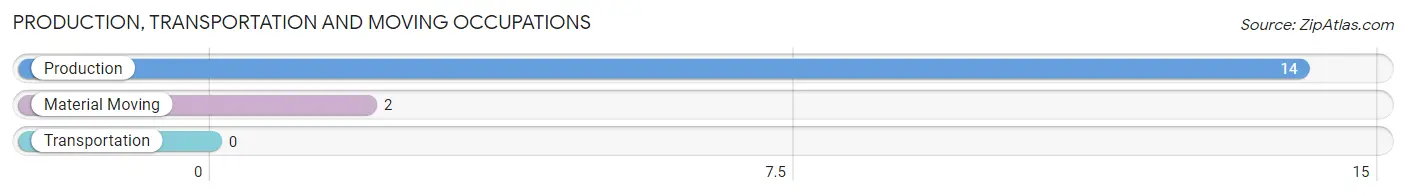
Production, Transportation and Moving Occupations by Sex
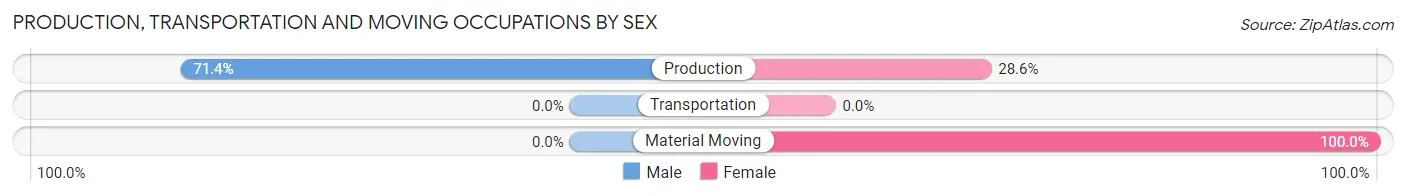
| Occupation | Male | Female |
| Production | 10 (71.4%) | 4 (28.6%) |
| Transportation | 0 (0.0%) | 0 (0.0%) |
| Material Moving | 0 (0.0%) | 2 (100.0%) |
| Total (Category) | 10 (62.5%) | 6 (37.5%) |
| Total (Overall) | 92 (41.4%) | 130 (58.6%) |
Employment Industries by Sex in Berry Creek
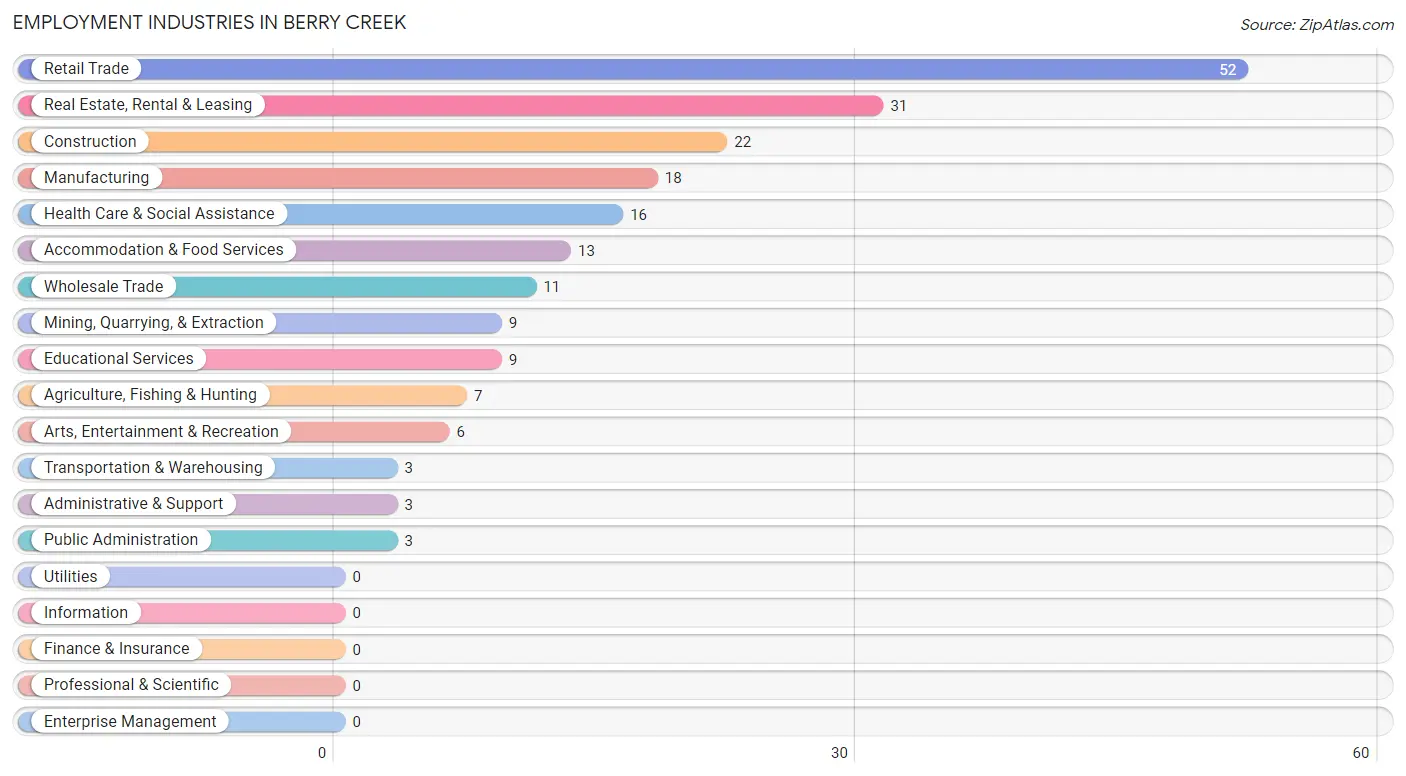
Employment Industries in Berry Creek
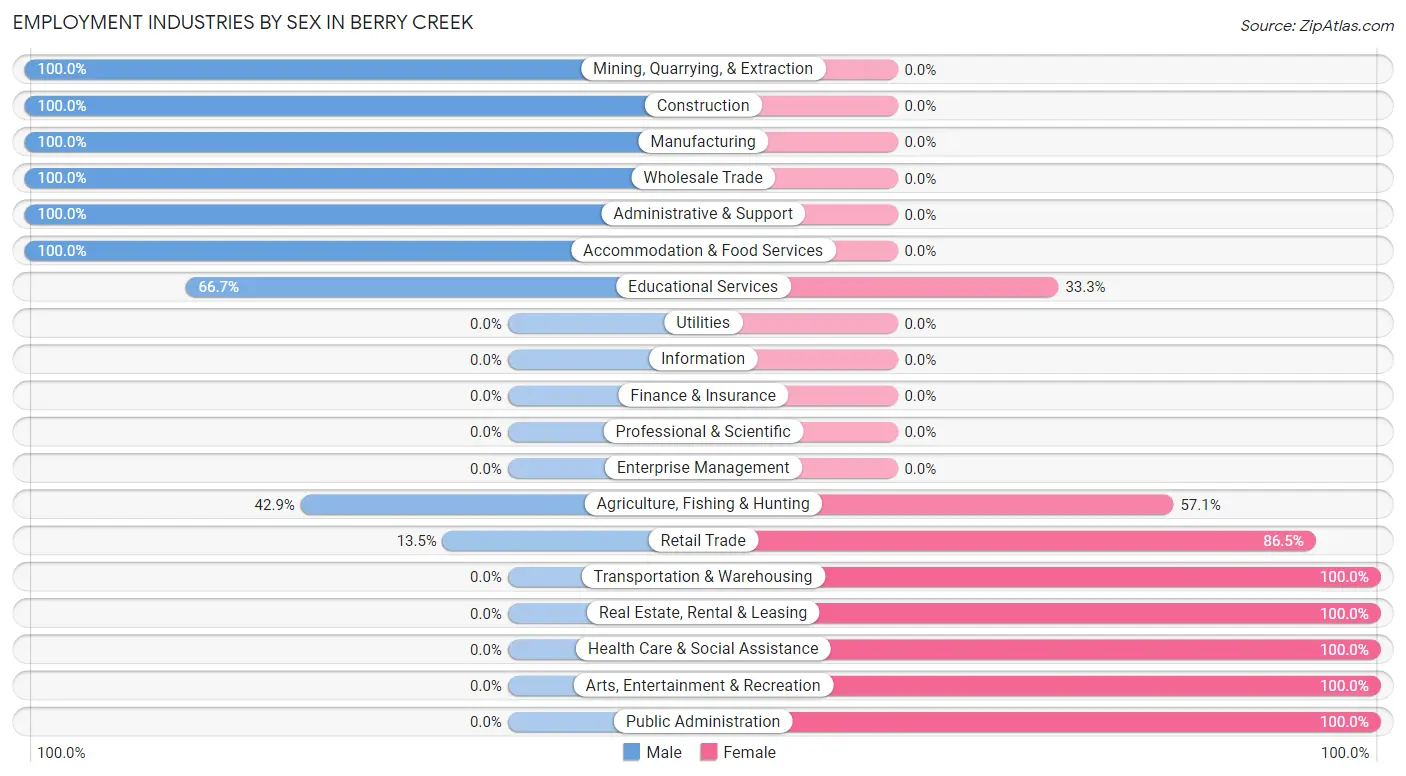
The major employment industries in Berry Creek include Retail Trade (52 | 23.4%), Real Estate, Rental & Leasing (31 | 14.0%), Construction (22 | 9.9%), Manufacturing (18 | 8.1%), and Health Care & Social Assistance (16 | 7.2%).
Employment Industries by Sex in Berry Creek
The Berry Creek industries that see more men than women are Mining, Quarrying, & Extraction (100.0%), Construction (100.0%), and Manufacturing (100.0%), whereas the industries that tend to have a higher number of women are Transportation & Warehousing (100.0%), Real Estate, Rental & Leasing (100.0%), and Health Care & Social Assistance (100.0%).
| Industry | Male | Female |
| Agriculture, Fishing & Hunting | 3 (42.9%) | 4 (57.1%) |
| Mining, Quarrying, & Extraction | 9 (100.0%) | 0 (0.0%) |
| Construction | 22 (100.0%) | 0 (0.0%) |
| Manufacturing | 18 (100.0%) | 0 (0.0%) |
| Wholesale Trade | 11 (100.0%) | 0 (0.0%) |
| Retail Trade | 7 (13.5%) | 45 (86.5%) |
| Transportation & Warehousing | 0 (0.0%) | 3 (100.0%) |
| Utilities | 0 (0.0%) | 0 (0.0%) |
| Information | 0 (0.0%) | 0 (0.0%) |
| Finance & Insurance | 0 (0.0%) | 0 (0.0%) |
| Real Estate, Rental & Leasing | 0 (0.0%) | 31 (100.0%) |
| Professional & Scientific | 0 (0.0%) | 0 (0.0%) |
| Enterprise Management | 0 (0.0%) | 0 (0.0%) |
| Administrative & Support | 3 (100.0%) | 0 (0.0%) |
| Educational Services | 6 (66.7%) | 3 (33.3%) |
| Health Care & Social Assistance | 0 (0.0%) | 16 (100.0%) |
| Arts, Entertainment & Recreation | 0 (0.0%) | 6 (100.0%) |
| Accommodation & Food Services | 13 (100.0%) | 0 (0.0%) |
| Public Administration | 0 (0.0%) | 3 (100.0%) |
| Total | 92 (41.4%) | 130 (58.6%) |
Education in Berry Creek
School Enrollment in Berry Creek
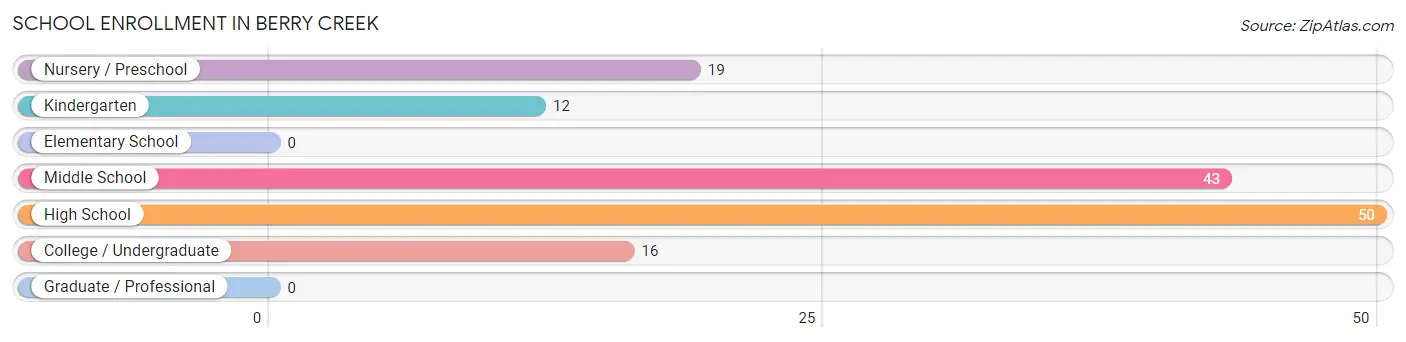
The most common levels of schooling among the 140 students in Berry Creek are high school (50 | 35.7%), middle school (43 | 30.7%), and nursery / preschool (19 | 13.6%).
| School Level | # Students | % Students |
| Nursery / Preschool | 19 | 13.6% |
| Kindergarten | 12 | 8.6% |
| Elementary School | 0 | 0.0% |
| Middle School | 43 | 30.7% |
| High School | 50 | 35.7% |
| College / Undergraduate | 16 | 11.4% |
| Graduate / Professional | 0 | 0.0% |
| Total | 140 | 100.0% |
School Enrollment by Age by Funding Source in Berry Creek
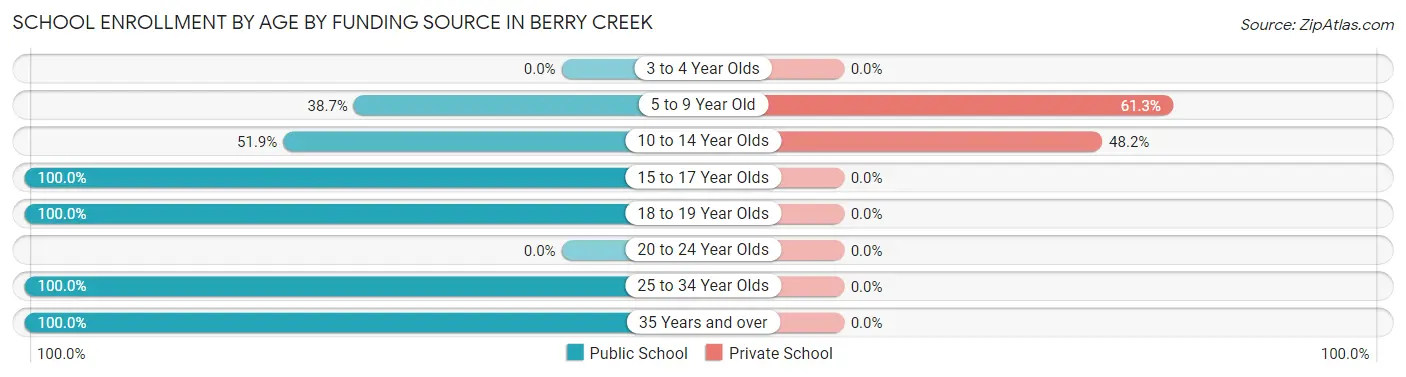
Out of a total of 140 students who are enrolled in schools in Berry Creek, 45 (32.1%) attend a private institution, while the remaining 95 (67.9%) are enrolled in public schools. The age group of 5 to 9 year old has the highest likelihood of being enrolled in private schools, with 19 (61.3% in the age bracket) enrolled. Conversely, the age group of 15 to 17 year olds has the lowest likelihood of being enrolled in a private school, with 36 (100.0% in the age bracket) attending a public institution.
| Age Bracket | Public School | Private School |
| 3 to 4 Year Olds | 0 (0.0%) | 0 (0.0%) |
| 5 to 9 Year Old | 12 (38.7%) | 19 (61.3%) |
| 10 to 14 Year Olds | 28 (51.8%) | 26 (48.1%) |
| 15 to 17 Year Olds | 36 (100.0%) | 0 (0.0%) |
| 18 to 19 Year Olds | 3 (100.0%) | 0 (0.0%) |
| 20 to 24 Year Olds | 0 (0.0%) | 0 (0.0%) |
| 25 to 34 Year Olds | 13 (100.0%) | 0 (0.0%) |
| 35 Years and over | 3 (100.0%) | 0 (0.0%) |
| Total | 95 (67.9%) | 45 (32.1%) |
Educational Attainment by Field of Study in Berry Creek
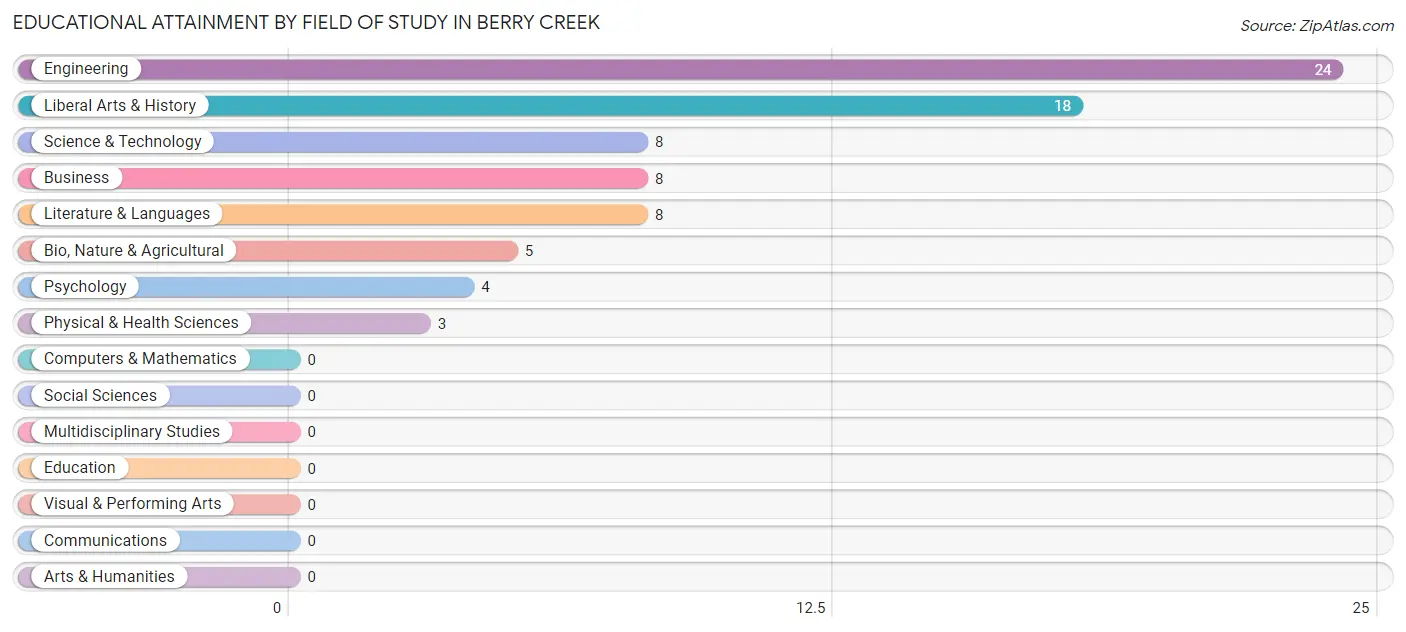
Engineering (24 | 30.8%), liberal arts & history (18 | 23.1%), science & technology (8 | 10.3%), business (8 | 10.3%), and literature & languages (8 | 10.3%) are the most common fields of study among 78 individuals in Berry Creek who have obtained a bachelor's degree or higher.
| Field of Study | # Graduates | % Graduates |
| Computers & Mathematics | 0 | 0.0% |
| Bio, Nature & Agricultural | 5 | 6.4% |
| Physical & Health Sciences | 3 | 3.8% |
| Psychology | 4 | 5.1% |
| Social Sciences | 0 | 0.0% |
| Engineering | 24 | 30.8% |
| Multidisciplinary Studies | 0 | 0.0% |
| Science & Technology | 8 | 10.3% |
| Business | 8 | 10.3% |
| Education | 0 | 0.0% |
| Literature & Languages | 8 | 10.3% |
| Liberal Arts & History | 18 | 23.1% |
| Visual & Performing Arts | 0 | 0.0% |
| Communications | 0 | 0.0% |
| Arts & Humanities | 0 | 0.0% |
| Total | 78 | 100.0% |
Transportation & Commute in Berry Creek
Vehicle Availability by Sex in Berry Creek
The most prevalent vehicle ownership categories in Berry Creek are males with 1 vehicle (32, accounting for 36.8%) and females with 1 vehicle (13, making up 25.0%).
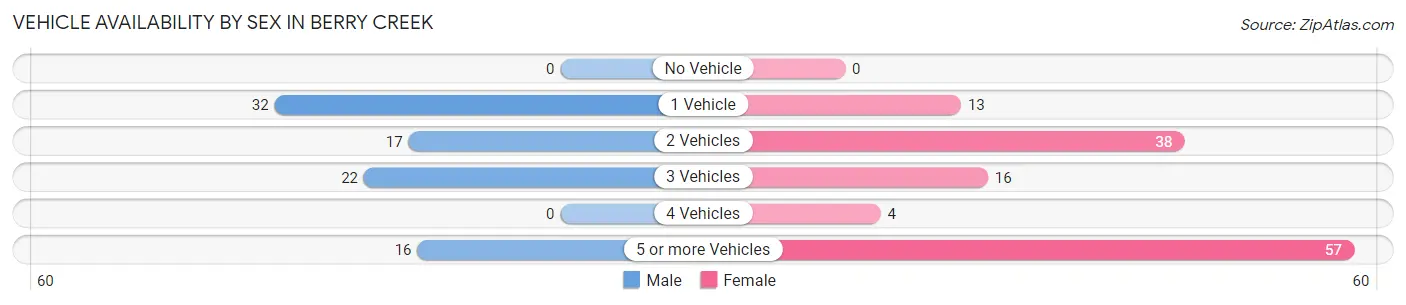
| Vehicles Available | Male | Female |
| No Vehicle | 0 (0.0%) | 0 (0.0%) |
| 1 Vehicle | 32 (36.8%) | 13 (10.2%) |
| 2 Vehicles | 17 (19.5%) | 38 (29.7%) |
| 3 Vehicles | 22 (25.3%) | 16 (12.5%) |
| 4 Vehicles | 0 (0.0%) | 4 (3.1%) |
| 5 or more Vehicles | 16 (18.4%) | 57 (44.5%) |
| Total | 87 (100.0%) | 128 (100.0%) |
Commute Time in Berry Creek
The most frequently occuring commute durations in Berry Creek are 90 or more minutes (41 commuters, 26.3%), 45 to 59 minutes (28 commuters, 17.9%), and 60 to 89 minutes (24 commuters, 15.4%).
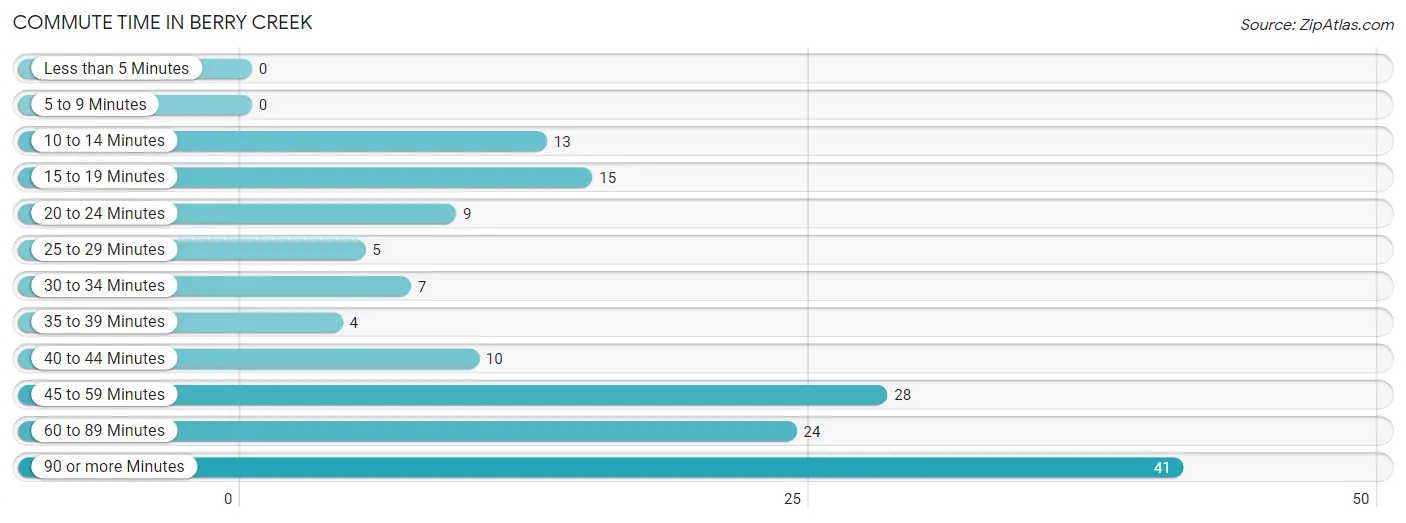
| Commute Time | # Commuters | % Commuters |
| Less than 5 Minutes | 0 | 0.0% |
| 5 to 9 Minutes | 0 | 0.0% |
| 10 to 14 Minutes | 13 | 8.3% |
| 15 to 19 Minutes | 15 | 9.6% |
| 20 to 24 Minutes | 9 | 5.8% |
| 25 to 29 Minutes | 5 | 3.2% |
| 30 to 34 Minutes | 7 | 4.5% |
| 35 to 39 Minutes | 4 | 2.6% |
| 40 to 44 Minutes | 10 | 6.4% |
| 45 to 59 Minutes | 28 | 17.9% |
| 60 to 89 Minutes | 24 | 15.4% |
| 90 or more Minutes | 41 | 26.3% |
Commute Time by Sex in Berry Creek
The most common commute times in Berry Creek are 60 to 89 minutes (21 commuters, 26.9%) for males and 90 or more minutes (41 commuters, 52.6%) for females.
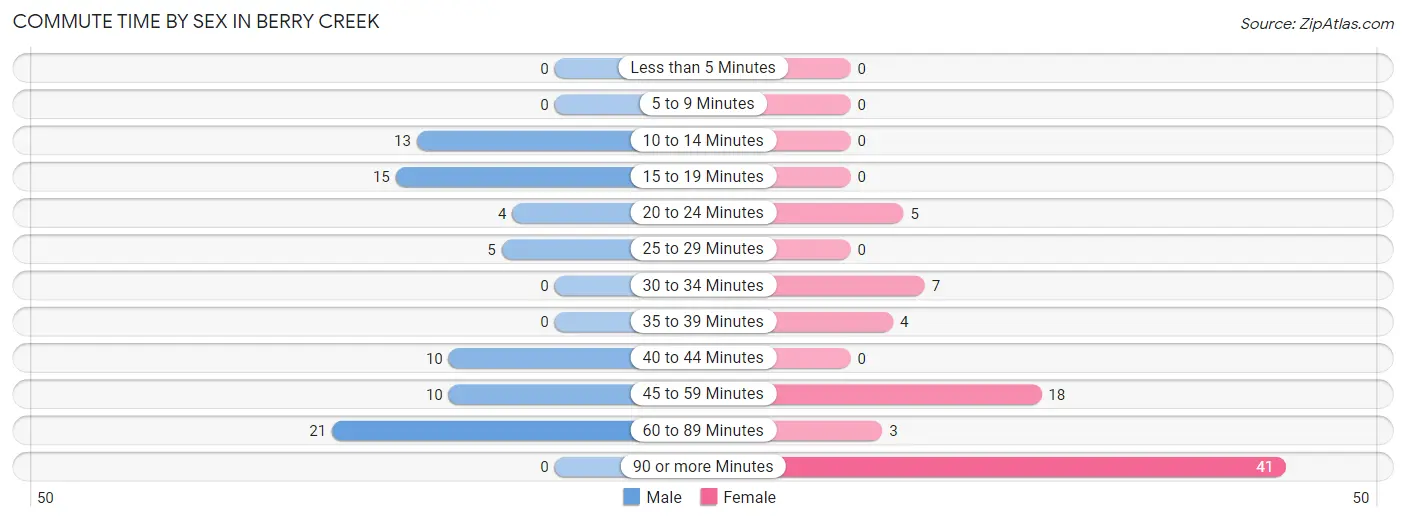
| Commute Time | Male | Female |
| Less than 5 Minutes | 0 (0.0%) | 0 (0.0%) |
| 5 to 9 Minutes | 0 (0.0%) | 0 (0.0%) |
| 10 to 14 Minutes | 13 (16.7%) | 0 (0.0%) |
| 15 to 19 Minutes | 15 (19.2%) | 0 (0.0%) |
| 20 to 24 Minutes | 4 (5.1%) | 5 (6.4%) |
| 25 to 29 Minutes | 5 (6.4%) | 0 (0.0%) |
| 30 to 34 Minutes | 0 (0.0%) | 7 (9.0%) |
| 35 to 39 Minutes | 0 (0.0%) | 4 (5.1%) |
| 40 to 44 Minutes | 10 (12.8%) | 0 (0.0%) |
| 45 to 59 Minutes | 10 (12.8%) | 18 (23.1%) |
| 60 to 89 Minutes | 21 (26.9%) | 3 (3.8%) |
| 90 or more Minutes | 0 (0.0%) | 41 (52.6%) |
Time of Departure to Work by Sex in Berry Creek
The most frequent times of departure to work in Berry Creek are 7:00 AM to 7:29 AM (43, 55.1%) for males and 6:30 AM to 6:59 AM (39, 50.0%) for females.
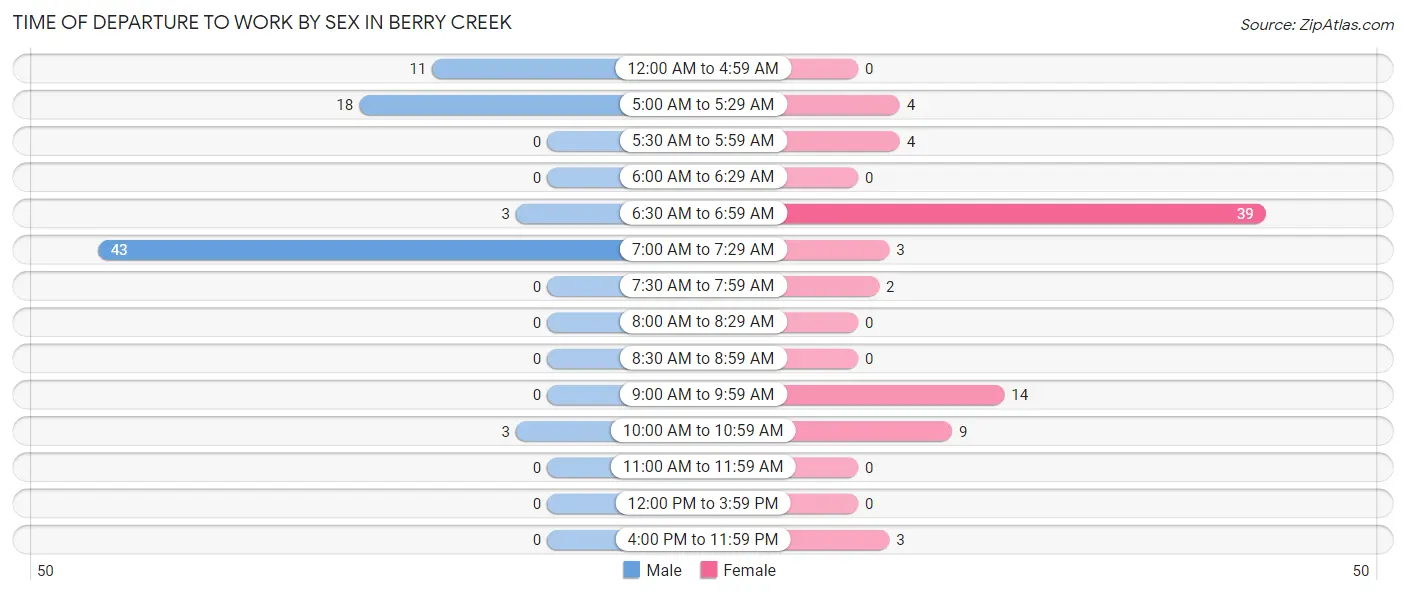
| Time of Departure | Male | Female |
| 12:00 AM to 4:59 AM | 11 (14.1%) | 0 (0.0%) |
| 5:00 AM to 5:29 AM | 18 (23.1%) | 4 (5.1%) |
| 5:30 AM to 5:59 AM | 0 (0.0%) | 4 (5.1%) |
| 6:00 AM to 6:29 AM | 0 (0.0%) | 0 (0.0%) |
| 6:30 AM to 6:59 AM | 3 (3.8%) | 39 (50.0%) |
| 7:00 AM to 7:29 AM | 43 (55.1%) | 3 (3.8%) |
| 7:30 AM to 7:59 AM | 0 (0.0%) | 2 (2.6%) |
| 8:00 AM to 8:29 AM | 0 (0.0%) | 0 (0.0%) |
| 8:30 AM to 8:59 AM | 0 (0.0%) | 0 (0.0%) |
| 9:00 AM to 9:59 AM | 0 (0.0%) | 14 (17.9%) |
| 10:00 AM to 10:59 AM | 3 (3.8%) | 9 (11.5%) |
| 11:00 AM to 11:59 AM | 0 (0.0%) | 0 (0.0%) |
| 12:00 PM to 3:59 PM | 0 (0.0%) | 0 (0.0%) |
| 4:00 PM to 11:59 PM | 0 (0.0%) | 3 (3.8%) |
| Total | 78 (100.0%) | 78 (100.0%) |
Housing Occupancy in Berry Creek
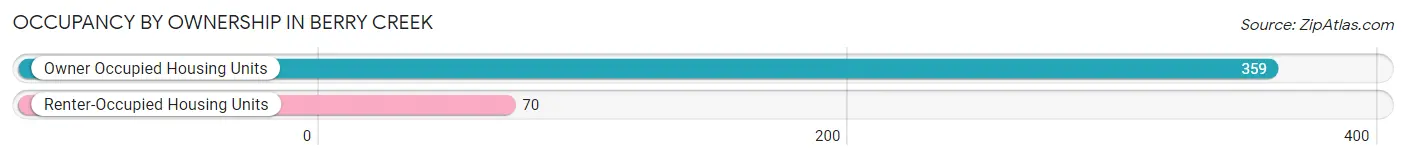
Occupancy by Ownership in Berry Creek
Of the total 429 dwellings in Berry Creek, owner-occupied units account for 359 (83.7%), while renter-occupied units make up 70 (16.3%).
| Occupancy | # Housing Units | % Housing Units |
| Owner Occupied Housing Units | 359 | 83.7% |
| Renter-Occupied Housing Units | 70 | 16.3% |
| Total Occupied Housing Units | 429 | 100.0% |
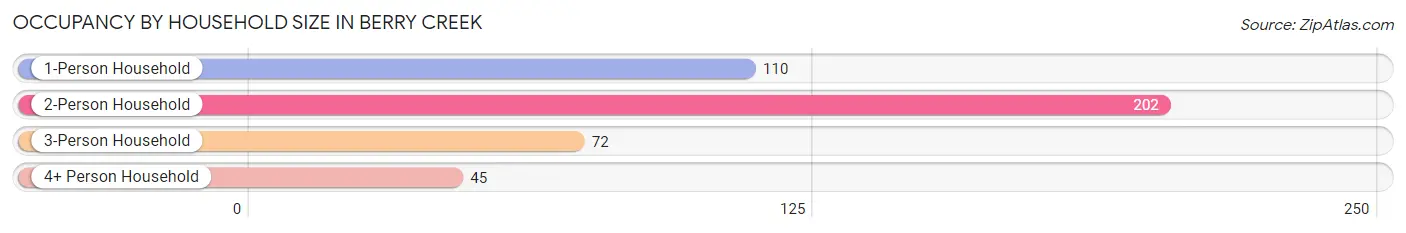
Occupancy by Household Size in Berry Creek
| Household Size | # Housing Units | % Housing Units |
| 1-Person Household | 110 | 25.6% |
| 2-Person Household | 202 | 47.1% |
| 3-Person Household | 72 | 16.8% |
| 4+ Person Household | 45 | 10.5% |
| Total Housing Units | 429 | 100.0% |
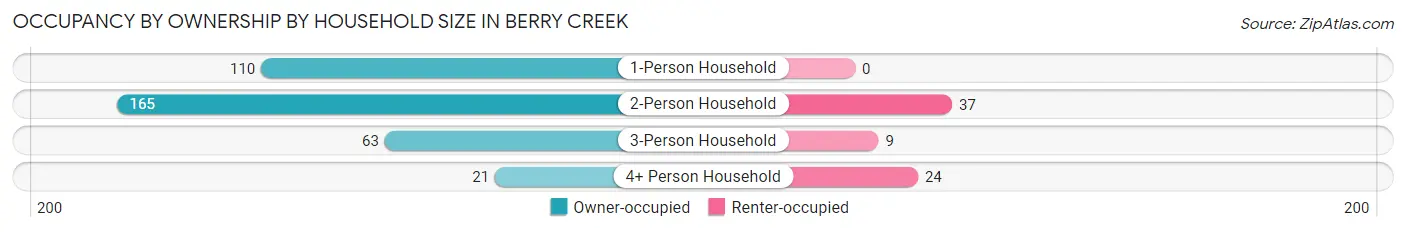
Occupancy by Ownership by Household Size in Berry Creek
| Household Size | Owner-occupied | Renter-occupied |
| 1-Person Household | 110 (100.0%) | 0 (0.0%) |
| 2-Person Household | 165 (81.7%) | 37 (18.3%) |
| 3-Person Household | 63 (87.5%) | 9 (12.5%) |
| 4+ Person Household | 21 (46.7%) | 24 (53.3%) |
| Total Housing Units | 359 (83.7%) | 70 (16.3%) |
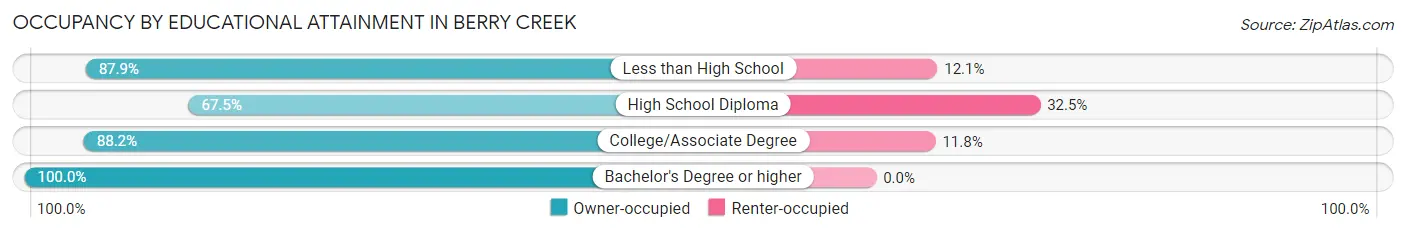
Occupancy by Educational Attainment in Berry Creek
| Household Size | Owner-occupied | Renter-occupied |
| Less than High School | 29 (87.9%) | 4 (12.1%) |
| High School Diploma | 83 (67.5%) | 40 (32.5%) |
| College/Associate Degree | 195 (88.2%) | 26 (11.8%) |
| Bachelor's Degree or higher | 52 (100.0%) | 0 (0.0%) |
Occupancy by Age of Householder in Berry Creek
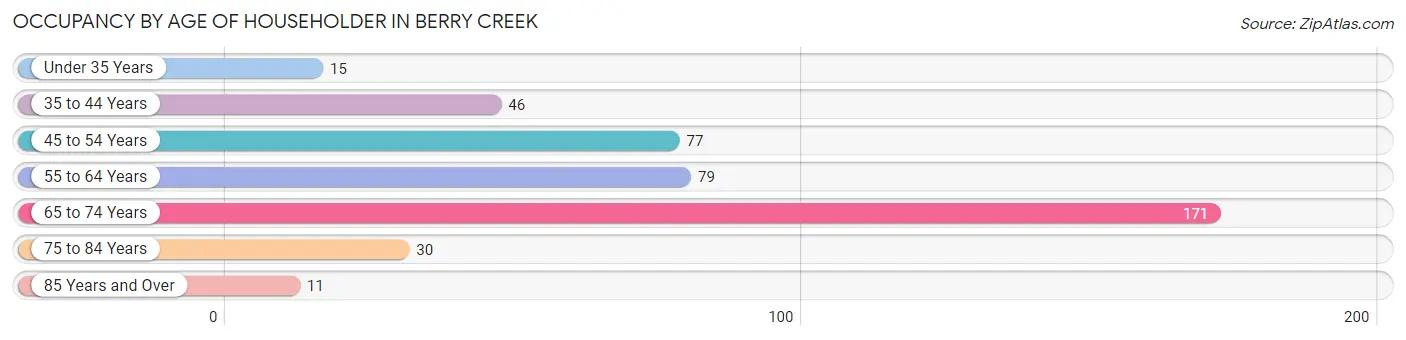
| Age Bracket | # Households | % Households |
| Under 35 Years | 15 | 3.5% |
| 35 to 44 Years | 46 | 10.7% |
| 45 to 54 Years | 77 | 17.9% |
| 55 to 64 Years | 79 | 18.4% |
| 65 to 74 Years | 171 | 39.9% |
| 75 to 84 Years | 30 | 7.0% |
| 85 Years and Over | 11 | 2.6% |
| Total | 429 | 100.0% |
Housing Finances in Berry Creek
Median Income by Occupancy in Berry Creek
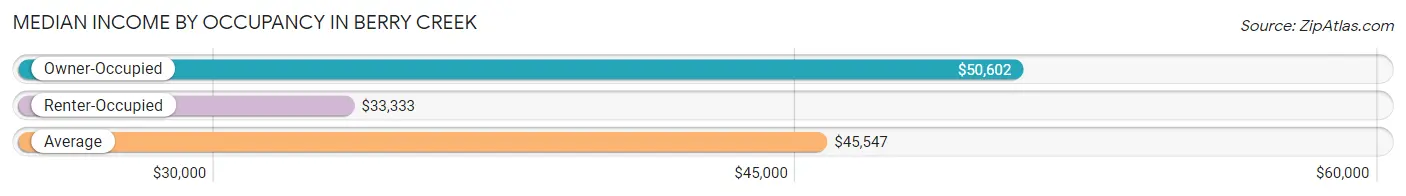
| Occupancy Type | # Households | Median Income |
| Owner-Occupied | 359 (83.7%) | $50,602 |
| Renter-Occupied | 70 (16.3%) | $33,333 |
| Average | 429 (100.0%) | $45,547 |
Occupancy by Householder Income Bracket in Berry Creek
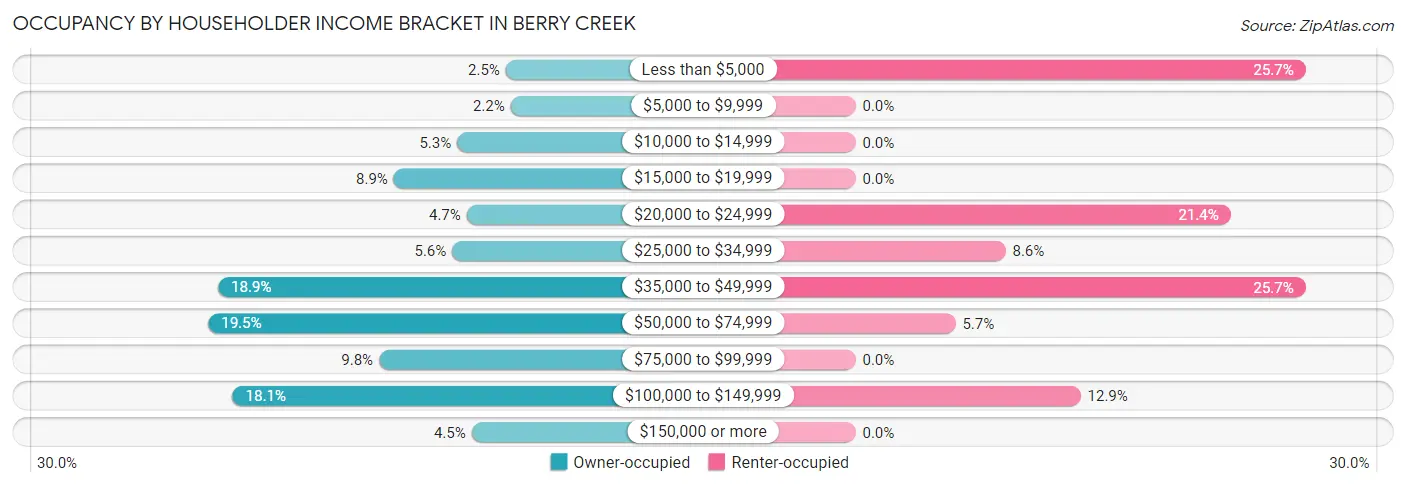
| Income Bracket | Owner-occupied | Renter-occupied |
| Less than $5,000 | 9 (2.5%) | 18 (25.7%) |
| $5,000 to $9,999 | 8 (2.2%) | 0 (0.0%) |
| $10,000 to $14,999 | 19 (5.3%) | 0 (0.0%) |
| $15,000 to $19,999 | 32 (8.9%) | 0 (0.0%) |
| $20,000 to $24,999 | 17 (4.7%) | 15 (21.4%) |
| $25,000 to $34,999 | 20 (5.6%) | 6 (8.6%) |
| $35,000 to $49,999 | 68 (18.9%) | 18 (25.7%) |
| $50,000 to $74,999 | 70 (19.5%) | 4 (5.7%) |
| $75,000 to $99,999 | 35 (9.8%) | 0 (0.0%) |
| $100,000 to $149,999 | 65 (18.1%) | 9 (12.9%) |
| $150,000 or more | 16 (4.5%) | 0 (0.0%) |
| Total | 359 (100.0%) | 70 (100.0%) |
Monthly Housing Cost Tiers in Berry Creek
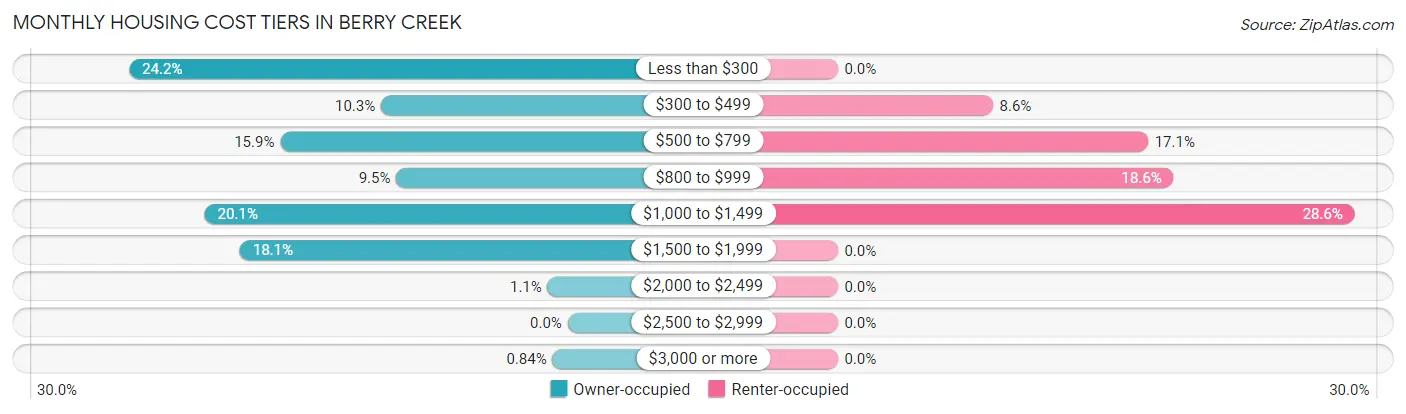
| Monthly Cost | Owner-occupied | Renter-occupied |
| Less than $300 | 87 (24.2%) | 0 (0.0%) |
| $300 to $499 | 37 (10.3%) | 6 (8.6%) |
| $500 to $799 | 57 (15.9%) | 12 (17.1%) |
| $800 to $999 | 34 (9.5%) | 13 (18.6%) |
| $1,000 to $1,499 | 72 (20.1%) | 20 (28.6%) |
| $1,500 to $1,999 | 65 (18.1%) | 0 (0.0%) |
| $2,000 to $2,499 | 4 (1.1%) | 0 (0.0%) |
| $2,500 to $2,999 | 0 (0.0%) | 0 (0.0%) |
| $3,000 or more | 3 (0.8%) | 0 (0.0%) |
| Total | 359 (100.0%) | 70 (100.0%) |
Physical Housing Characteristics in Berry Creek
Housing Structures in Berry Creek
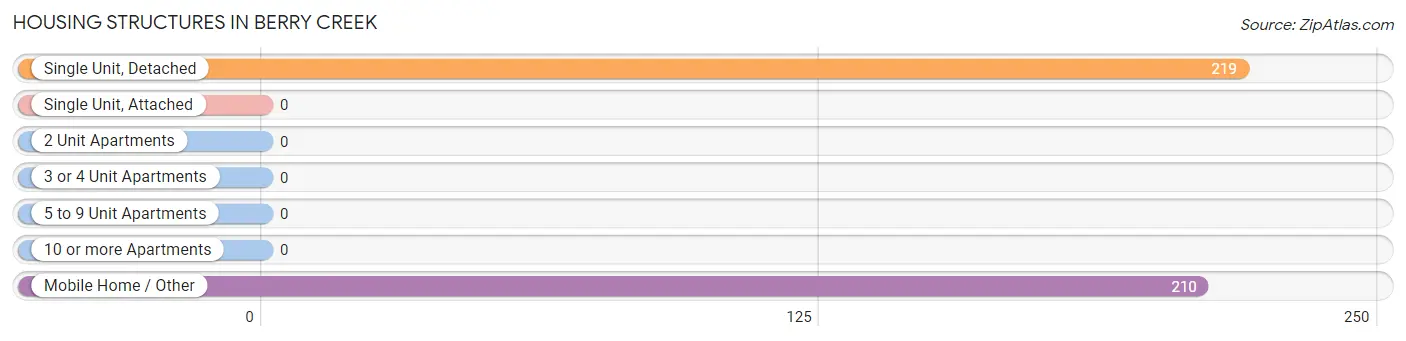
| Structure Type | # Housing Units | % Housing Units |
| Single Unit, Detached | 219 | 51.0% |
| Single Unit, Attached | 0 | 0.0% |
| 2 Unit Apartments | 0 | 0.0% |
| 3 or 4 Unit Apartments | 0 | 0.0% |
| 5 to 9 Unit Apartments | 0 | 0.0% |
| 10 or more Apartments | 0 | 0.0% |
| Mobile Home / Other | 210 | 48.9% |
| Total | 429 | 100.0% |
Housing Structures by Occupancy in Berry Creek
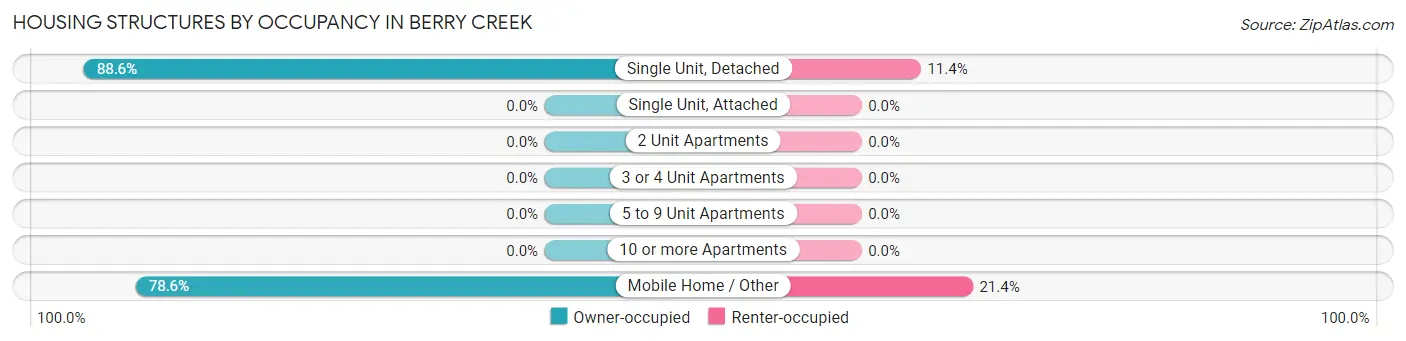
| Structure Type | Owner-occupied | Renter-occupied |
| Single Unit, Detached | 194 (88.6%) | 25 (11.4%) |
| Single Unit, Attached | 0 (0.0%) | 0 (0.0%) |
| 2 Unit Apartments | 0 (0.0%) | 0 (0.0%) |
| 3 or 4 Unit Apartments | 0 (0.0%) | 0 (0.0%) |
| 5 to 9 Unit Apartments | 0 (0.0%) | 0 (0.0%) |
| 10 or more Apartments | 0 (0.0%) | 0 (0.0%) |
| Mobile Home / Other | 165 (78.6%) | 45 (21.4%) |
| Total | 359 (83.7%) | 70 (16.3%) |
Housing Structures by Number of Rooms in Berry Creek
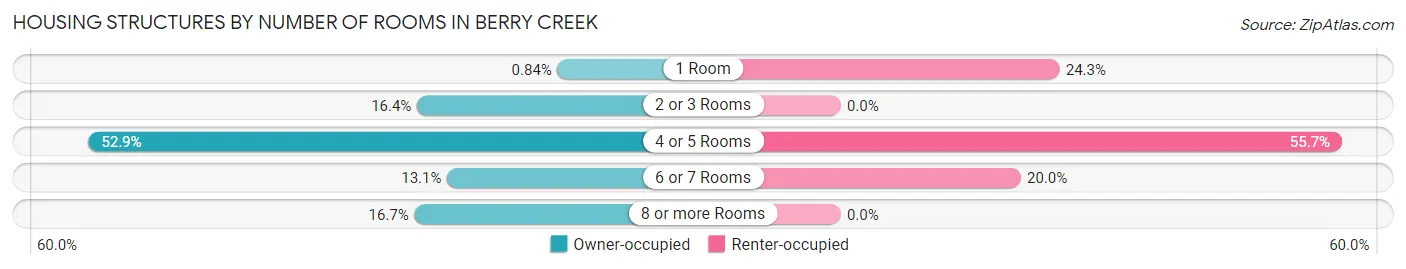
| Number of Rooms | Owner-occupied | Renter-occupied |
| 1 Room | 3 (0.8%) | 17 (24.3%) |
| 2 or 3 Rooms | 59 (16.4%) | 0 (0.0%) |
| 4 or 5 Rooms | 190 (52.9%) | 39 (55.7%) |
| 6 or 7 Rooms | 47 (13.1%) | 14 (20.0%) |
| 8 or more Rooms | 60 (16.7%) | 0 (0.0%) |
| Total | 359 (100.0%) | 70 (100.0%) |
Housing Structure by Heating Type in Berry Creek
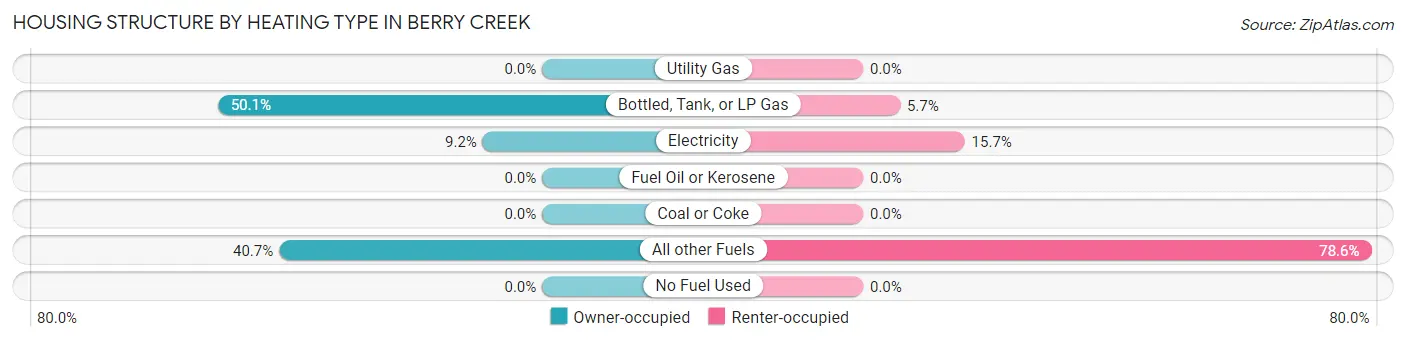
| Heating Type | Owner-occupied | Renter-occupied |
| Utility Gas | 0 (0.0%) | 0 (0.0%) |
| Bottled, Tank, or LP Gas | 180 (50.1%) | 4 (5.7%) |
| Electricity | 33 (9.2%) | 11 (15.7%) |
| Fuel Oil or Kerosene | 0 (0.0%) | 0 (0.0%) |
| Coal or Coke | 0 (0.0%) | 0 (0.0%) |
| All other Fuels | 146 (40.7%) | 55 (78.6%) |
| No Fuel Used | 0 (0.0%) | 0 (0.0%) |
| Total | 359 (100.0%) | 70 (100.0%) |
Household Vehicle Usage in Berry Creek
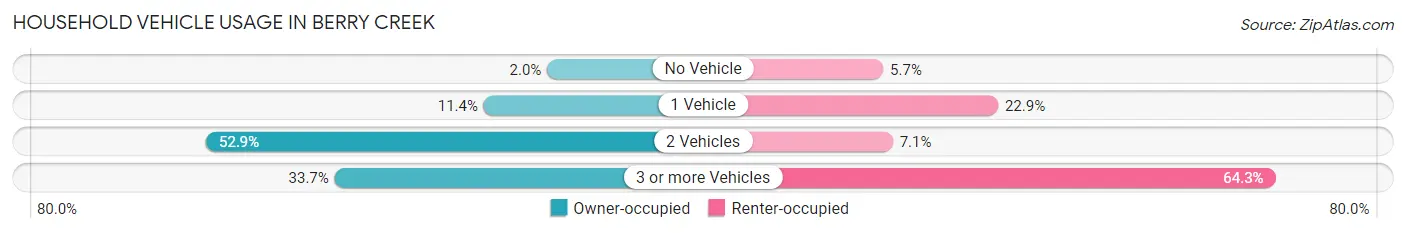
| Vehicles per Household | Owner-occupied | Renter-occupied |
| No Vehicle | 7 (1.9%) | 4 (5.7%) |
| 1 Vehicle | 41 (11.4%) | 16 (22.9%) |
| 2 Vehicles | 190 (52.9%) | 5 (7.1%) |
| 3 or more Vehicles | 121 (33.7%) | 45 (64.3%) |
| Total | 359 (100.0%) | 70 (100.0%) |
Real Estate & Mortgages in Berry Creek
Real Estate and Mortgage Overview in Berry Creek
| Characteristic | Without Mortgage | With Mortgage |
| Housing Units | 248 | 111 |
| Median Property Value | $216,700 | $387,500 |
| Median Household Income | $41,824 | $0 |
| Monthly Housing Costs | $500 | $0 |
| Real Estate Taxes | $1,609 | $0 |
Property Value by Mortgage Status in Berry Creek
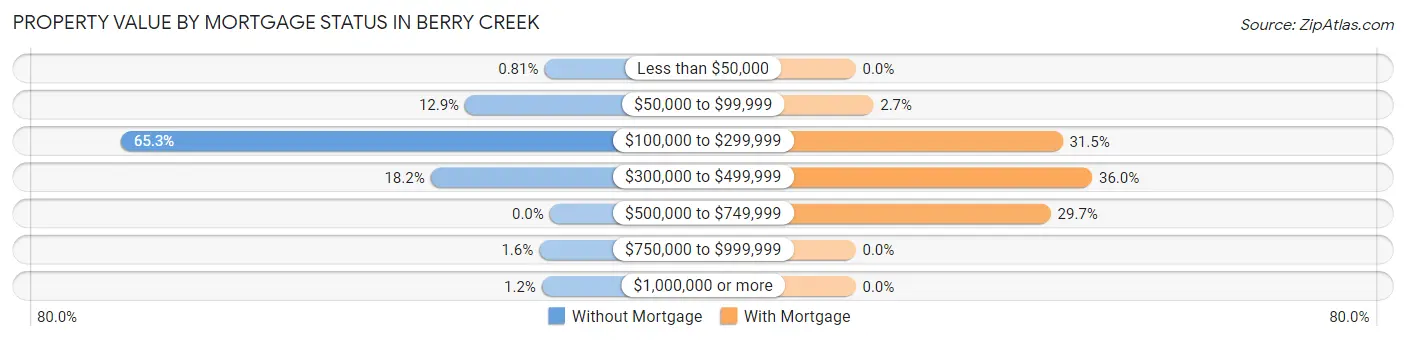
| Property Value | Without Mortgage | With Mortgage |
| Less than $50,000 | 2 (0.8%) | 0 (0.0%) |
| $50,000 to $99,999 | 32 (12.9%) | 3 (2.7%) |
| $100,000 to $299,999 | 162 (65.3%) | 35 (31.5%) |
| $300,000 to $499,999 | 45 (18.1%) | 40 (36.0%) |
| $500,000 to $749,999 | 0 (0.0%) | 33 (29.7%) |
| $750,000 to $999,999 | 4 (1.6%) | 0 (0.0%) |
| $1,000,000 or more | 3 (1.2%) | 0 (0.0%) |
| Total | 248 (100.0%) | 111 (100.0%) |
Household Income by Mortgage Status in Berry Creek
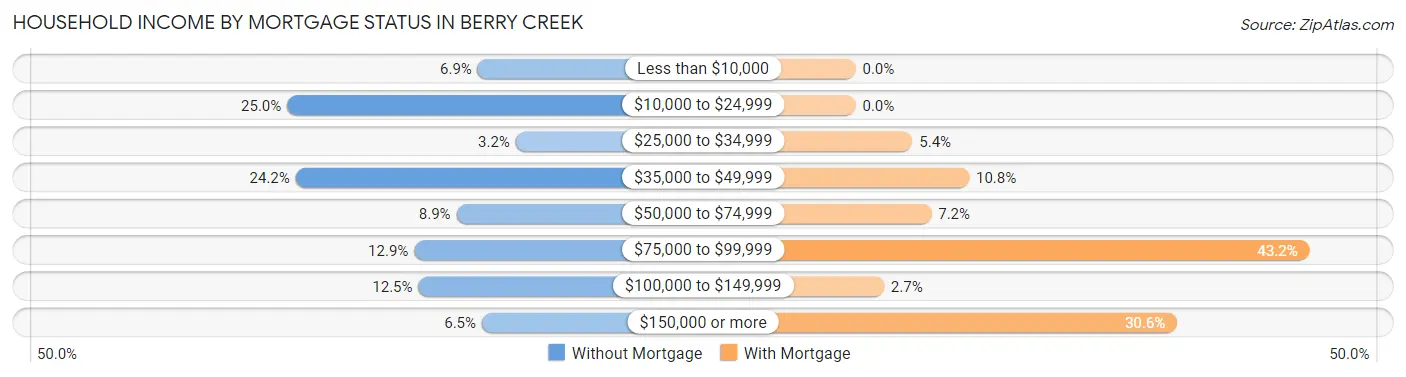
| Household Income | Without Mortgage | With Mortgage |
| Less than $10,000 | 17 (6.9%) | 0 (0.0%) |
| $10,000 to $24,999 | 62 (25.0%) | 0 (0.0%) |
| $25,000 to $34,999 | 8 (3.2%) | 6 (5.4%) |
| $35,000 to $49,999 | 60 (24.2%) | 12 (10.8%) |
| $50,000 to $74,999 | 22 (8.9%) | 8 (7.2%) |
| $75,000 to $99,999 | 32 (12.9%) | 48 (43.2%) |
| $100,000 to $149,999 | 31 (12.5%) | 3 (2.7%) |
| $150,000 or more | 16 (6.5%) | 34 (30.6%) |
| Total | 248 (100.0%) | 111 (100.0%) |
Property Value to Household Income Ratio in Berry Creek
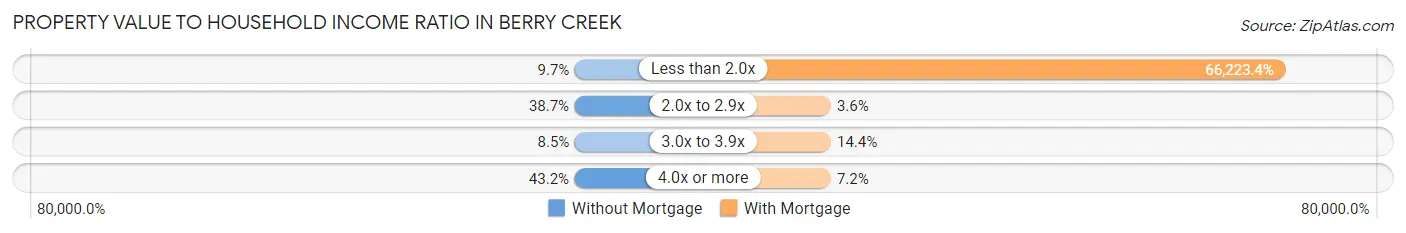
| Value-to-Income Ratio | Without Mortgage | With Mortgage |
| Less than 2.0x | 24 (9.7%) | 73,508 (66,223.4%) |
| 2.0x to 2.9x | 96 (38.7%) | 4 (3.6%) |
| 3.0x to 3.9x | 21 (8.5%) | 16 (14.4%) |
| 4.0x or more | 107 (43.1%) | 8 (7.2%) |
| Total | 248 (100.0%) | 111 (100.0%) |
Real Estate Taxes by Mortgage Status in Berry Creek
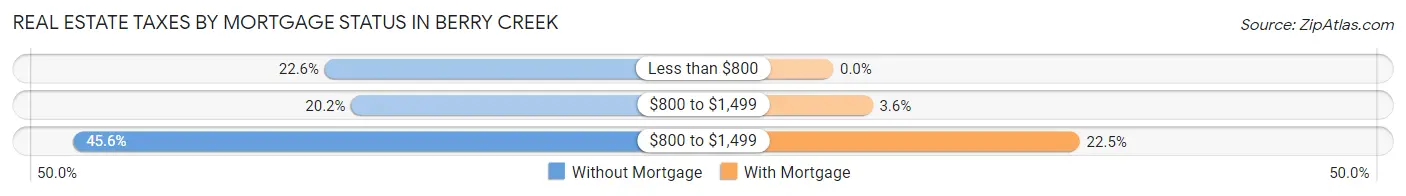
| Property Taxes | Without Mortgage | With Mortgage |
| Less than $800 | 56 (22.6%) | 0 (0.0%) |
| $800 to $1,499 | 50 (20.2%) | 4 (3.6%) |
| $800 to $1,499 | 113 (45.6%) | 25 (22.5%) |
| Total | 248 (100.0%) | 111 (100.0%) |
Health & Disability in Berry Creek
Health Insurance Coverage by Age in Berry Creek
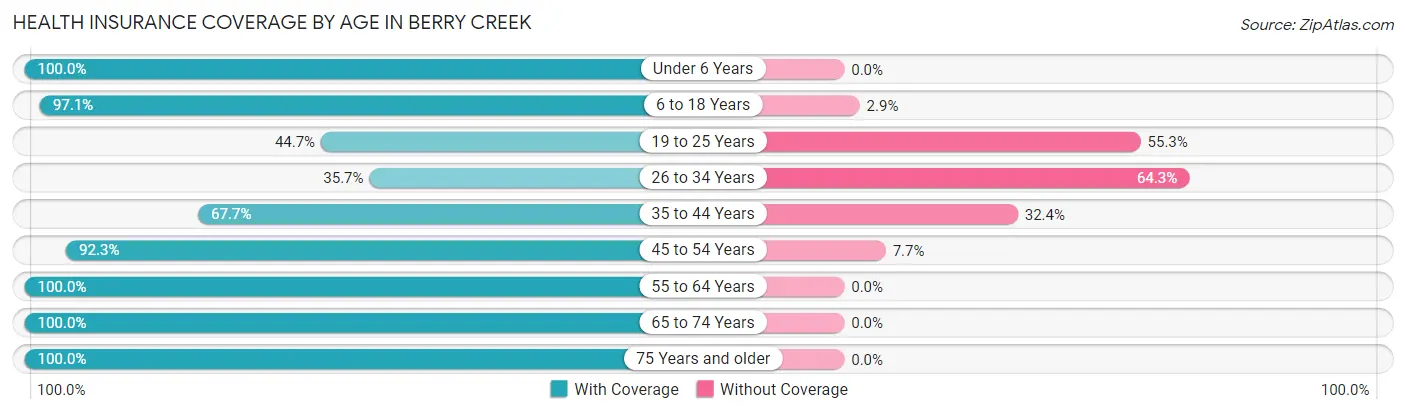
| Age Bracket | With Coverage | Without Coverage |
| Under 6 Years | 26 (100.0%) | 0 (0.0%) |
| 6 to 18 Years | 102 (97.1%) | 3 (2.9%) |
| 19 to 25 Years | 17 (44.7%) | 21 (55.3%) |
| 26 to 34 Years | 15 (35.7%) | 27 (64.3%) |
| 35 to 44 Years | 46 (67.6%) | 22 (32.4%) |
| 45 to 54 Years | 203 (92.3%) | 17 (7.7%) |
| 55 to 64 Years | 159 (100.0%) | 0 (0.0%) |
| 65 to 74 Years | 291 (100.0%) | 0 (0.0%) |
| 75 Years and older | 57 (100.0%) | 0 (0.0%) |
| Total | 916 (91.0%) | 90 (8.9%) |
Health Insurance Coverage by Citizenship Status in Berry Creek

| Citizenship Status | With Coverage | Without Coverage |
| Native Born | 26 (100.0%) | 0 (0.0%) |
| Foreign Born, Citizen | 102 (97.1%) | 3 (2.9%) |
| Foreign Born, not a Citizen | 17 (44.7%) | 21 (55.3%) |
Health Insurance Coverage by Household Income in Berry Creek
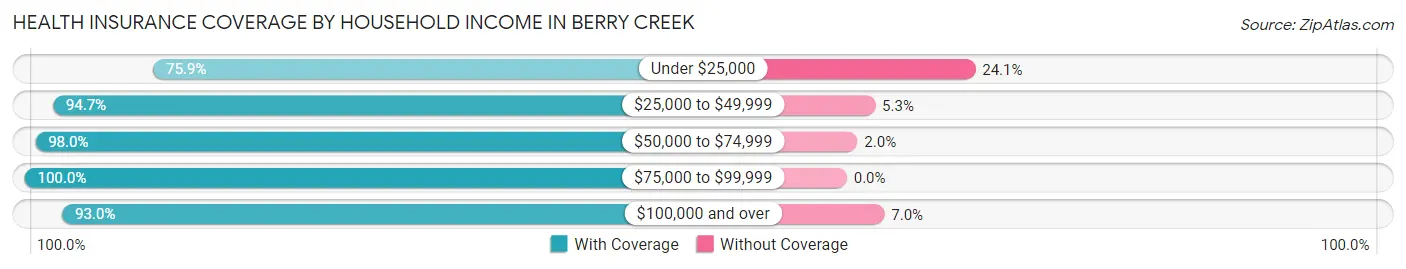
| Household Income | With Coverage | Without Coverage |
| Under $25,000 | 164 (75.9%) | 52 (24.1%) |
| $25,000 to $49,999 | 232 (94.7%) | 13 (5.3%) |
| $50,000 to $74,999 | 148 (98.0%) | 3 (2.0%) |
| $75,000 to $99,999 | 81 (100.0%) | 0 (0.0%) |
| $100,000 and over | 291 (93.0%) | 22 (7.0%) |
Public vs Private Health Insurance Coverage by Age in Berry Creek
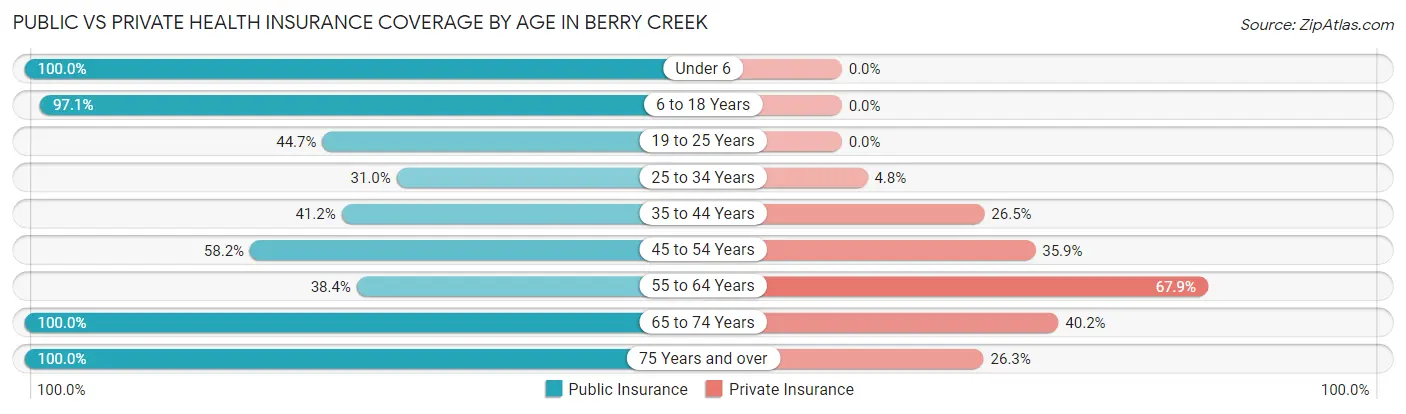
| Age Bracket | Public Insurance | Private Insurance |
| Under 6 | 26 (100.0%) | 0 (0.0%) |
| 6 to 18 Years | 102 (97.1%) | 0 (0.0%) |
| 19 to 25 Years | 17 (44.7%) | 0 (0.0%) |
| 25 to 34 Years | 13 (30.9%) | 2 (4.8%) |
| 35 to 44 Years | 28 (41.2%) | 18 (26.5%) |
| 45 to 54 Years | 128 (58.2%) | 79 (35.9%) |
| 55 to 64 Years | 61 (38.4%) | 108 (67.9%) |
| 65 to 74 Years | 291 (100.0%) | 117 (40.2%) |
| 75 Years and over | 57 (100.0%) | 15 (26.3%) |
| Total | 723 (71.9%) | 339 (33.7%) |
Disability Status by Sex by Age in Berry Creek
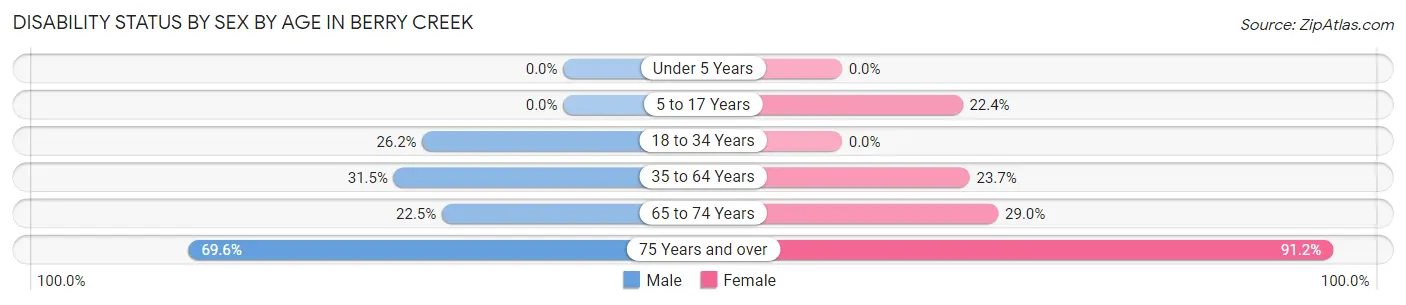
| Age Bracket | Male | Female |
| Under 5 Years | 0 (0.0%) | 0 (0.0%) |
| 5 to 17 Years | 0 (0.0%) | 15 (22.4%) |
| 18 to 34 Years | 17 (26.2%) | 0 (0.0%) |
| 35 to 64 Years | 73 (31.5%) | 51 (23.7%) |
| 65 to 74 Years | 36 (22.5%) | 38 (29.0%) |
| 75 Years and over | 16 (69.6%) | 31 (91.2%) |
Disability Class by Sex by Age in Berry Creek
Disability Class: Hearing Difficulty
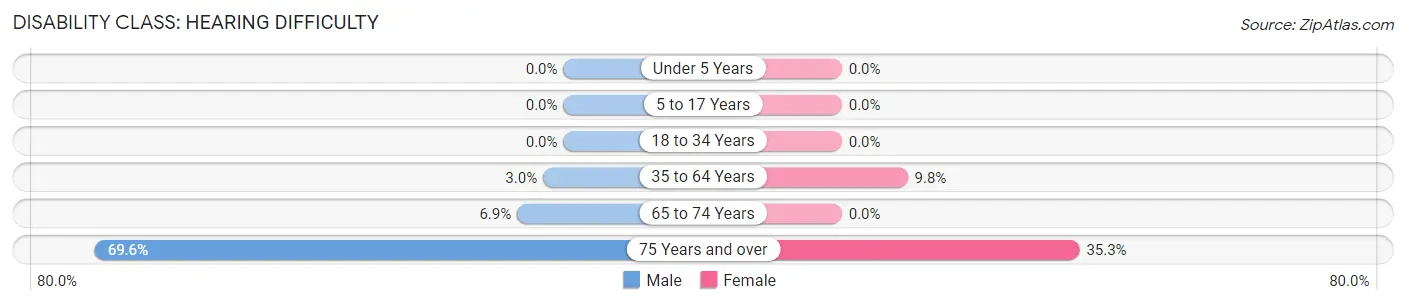
| Age Bracket | Male | Female |
| Under 5 Years | 0 (0.0%) | 0 (0.0%) |
| 5 to 17 Years | 0 (0.0%) | 0 (0.0%) |
| 18 to 34 Years | 0 (0.0%) | 0 (0.0%) |
| 35 to 64 Years | 7 (3.0%) | 21 (9.8%) |
| 65 to 74 Years | 11 (6.9%) | 0 (0.0%) |
| 75 Years and over | 16 (69.6%) | 12 (35.3%) |
Disability Class: Vision Difficulty
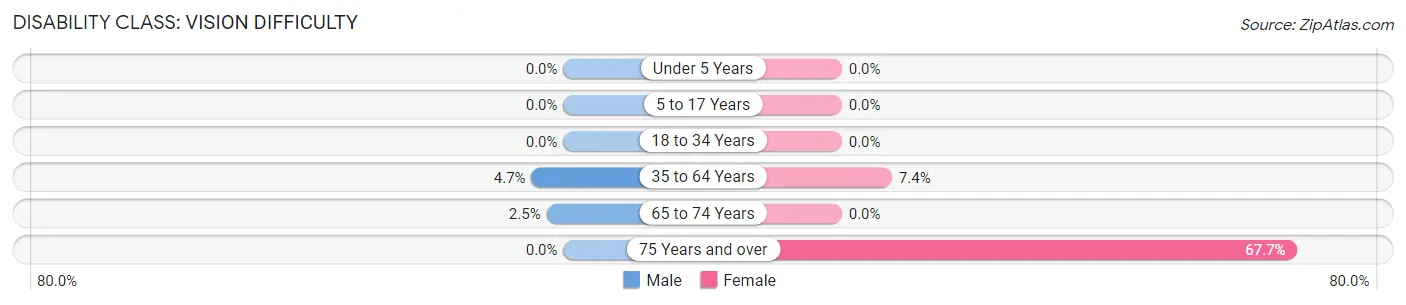
| Age Bracket | Male | Female |
| Under 5 Years | 0 (0.0%) | 0 (0.0%) |
| 5 to 17 Years | 0 (0.0%) | 0 (0.0%) |
| 18 to 34 Years | 0 (0.0%) | 0 (0.0%) |
| 35 to 64 Years | 11 (4.7%) | 16 (7.4%) |
| 65 to 74 Years | 4 (2.5%) | 0 (0.0%) |
| 75 Years and over | 0 (0.0%) | 23 (67.6%) |
Disability Class: Cognitive Difficulty
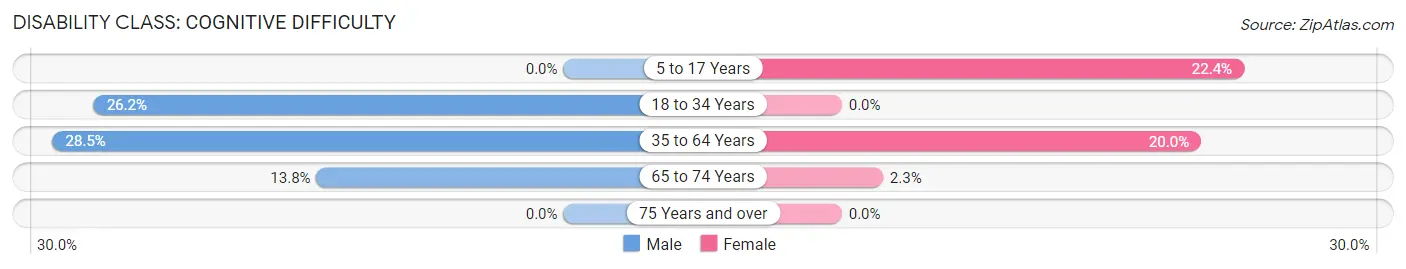
| Age Bracket | Male | Female |
| 5 to 17 Years | 0 (0.0%) | 15 (22.4%) |
| 18 to 34 Years | 17 (26.2%) | 0 (0.0%) |
| 35 to 64 Years | 66 (28.4%) | 43 (20.0%) |
| 65 to 74 Years | 22 (13.8%) | 3 (2.3%) |
| 75 Years and over | 0 (0.0%) | 0 (0.0%) |
Disability Class: Ambulatory Difficulty
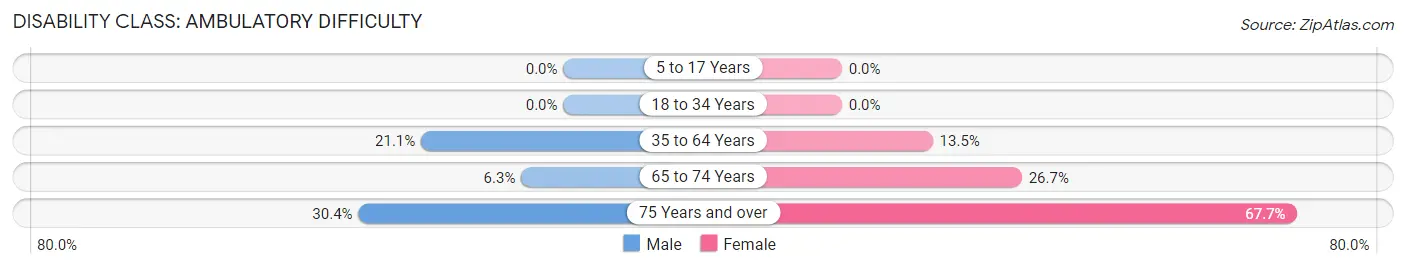
| Age Bracket | Male | Female |
| 5 to 17 Years | 0 (0.0%) | 0 (0.0%) |
| 18 to 34 Years | 0 (0.0%) | 0 (0.0%) |
| 35 to 64 Years | 49 (21.1%) | 29 (13.5%) |
| 65 to 74 Years | 10 (6.2%) | 35 (26.7%) |
| 75 Years and over | 7 (30.4%) | 23 (67.6%) |
Disability Class: Self-Care Difficulty
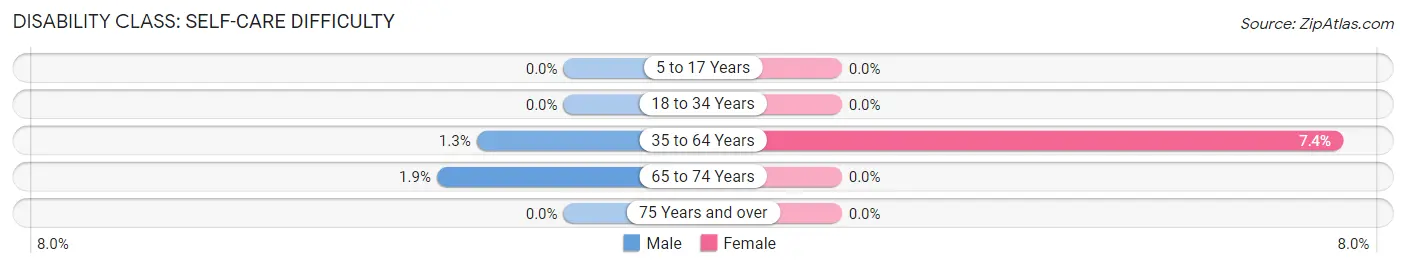
| Age Bracket | Male | Female |
| 5 to 17 Years | 0 (0.0%) | 0 (0.0%) |
| 18 to 34 Years | 0 (0.0%) | 0 (0.0%) |
| 35 to 64 Years | 3 (1.3%) | 16 (7.4%) |
| 65 to 74 Years | 3 (1.9%) | 0 (0.0%) |
| 75 Years and over | 0 (0.0%) | 0 (0.0%) |
Technology Access in Berry Creek
Computing Device Access in Berry Creek
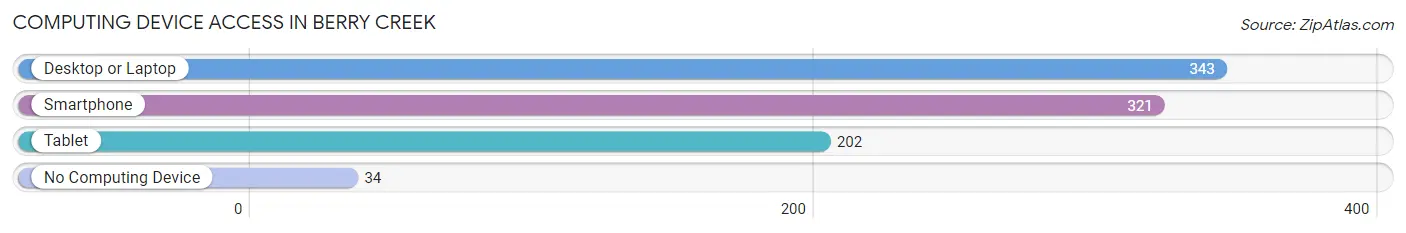
| Device Type | # Households | % Households |
| Desktop or Laptop | 343 | 79.9% |
| Smartphone | 321 | 74.8% |
| Tablet | 202 | 47.1% |
| No Computing Device | 34 | 7.9% |
| Total | 429 | 100.0% |
Internet Access in Berry Creek
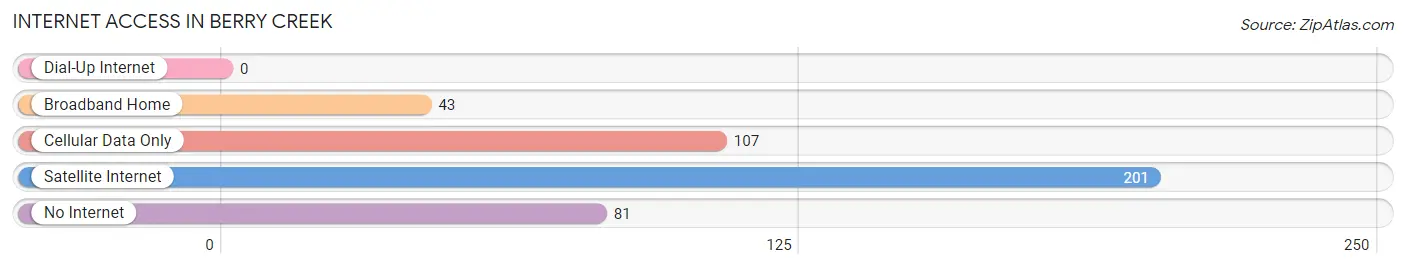
| Internet Type | # Households | % Households |
| Dial-Up Internet | 0 | 0.0% |
| Broadband Home | 43 | 10.0% |
| Cellular Data Only | 107 | 24.9% |
| Satellite Internet | 201 | 46.9% |
| No Internet | 81 | 18.9% |
| Total | 429 | 100.0% |
Berry Creek Summary
Introduction
Berry Creek is a small unincorporated community located in Butte County, California. It is situated in the foothills of the Sierra Nevada Mountains, approximately 10 miles east of the city of Oroville. The town is home to a population of approximately 1,000 people and is known for its rural charm and natural beauty.
History
The area that is now Berry Creek was originally inhabited by the Maidu Native American tribe. The first European settlers arrived in the area in the late 1800s, and the town was officially established in 1891. The town was named after a local rancher, John Berry, who owned a large amount of land in the area.
In the early 1900s, the town began to grow and develop. The first post office was established in 1906, and the first school was built in 1908. The town also had a general store, a blacksmith shop, and a few other businesses.
In the 1920s, the town began to experience a period of growth and prosperity. The population increased, and new businesses opened. The town also had a movie theater, a bowling alley, and a few other amenities.
In the 1950s, the town began to decline. Many of the businesses closed, and the population began to decrease. The town was also affected by the construction of the Oroville Dam, which flooded much of the surrounding area.
Geography
Berry Creek is located in the foothills of the Sierra Nevada Mountains, approximately 10 miles east of the city of Oroville. The town is situated at an elevation of 1,400 feet, and the surrounding area is characterized by rolling hills and oak woodlands. The town is located in a rural area, and the nearest major city is Chico, which is approximately 30 miles away.
The climate in Berry Creek is mild and temperate. The average high temperature in the summer is around 90 degrees Fahrenheit, and the average low temperature in the winter is around 40 degrees Fahrenheit. The area receives an average of 20 inches of precipitation per year.
Economy
The economy of Berry Creek is largely based on agriculture and tourism. The town is home to several small farms, which produce a variety of fruits and vegetables. The town is also a popular destination for outdoor recreation, and there are several campgrounds and hiking trails in the area.
The town also has a few small businesses, including a general store, a gas station, and a few restaurants. The nearest major city is Chico, which is approximately 30 miles away.
Demographics
As of the 2010 census, the population of Berry Creek was 1,000 people. The racial makeup of the town was 94.2% White, 0.7% African American, 0.7% Native American, 0.7% Asian, 0.7% Pacific Islander, and 2.7% from other races. The median household income was $37,500, and the median age was 44 years.
Conclusion
Berry Creek is a small unincorporated community located in Butte County, California. It is situated in the foothills of the Sierra Nevada Mountains, approximately 10 miles east of the city of Oroville. The town is home to a population of approximately 1,000 people and is known for its rural charm and natural beauty. The economy of Berry Creek is largely based on agriculture and tourism, and the town is a popular destination for outdoor recreation. The racial makeup of the town is predominantly White, and the median household income is $37,500.
Common Questions
What is Per Capita Income in Berry Creek?
Per Capita income in Berry Creek is $27,652.
What is the Median Family Income in Berry Creek?
Median Family Income in Berry Creek is $73,347.
What is the Median Household income in Berry Creek?
Median Household Income in Berry Creek is $45,547.
What is Inequality or Gini Index in Berry Creek?
Inequality or Gini Index in Berry Creek is 0.42.
What is the Total Population of Berry Creek?
Total Population of Berry Creek is 1,006.
What is the Total Male Population of Berry Creek?
Total Male Population of Berry Creek is 541.
What is the Total Female Population of Berry Creek?
Total Female Population of Berry Creek is 465.
What is the Ratio of Males per 100 Females in Berry Creek?
There are 116.34 Males per 100 Females in Berry Creek.
What is the Ratio of Females per 100 Males in Berry Creek?
There are 85.95 Females per 100 Males in Berry Creek.
What is the Median Population Age in Berry Creek?
Median Population Age in Berry Creek is 56.3 Years.
What is the Average Family Size in Berry Creek
Average Family Size in Berry Creek is 2.8 People.
What is the Average Household Size in Berry Creek
Average Household Size in Berry Creek is 2.3 People.
How Large is the Labor Force in Berry Creek?
There are 275 People in the Labor Forcein in Berry Creek.
What is the Percentage of People in the Labor Force in Berry Creek?
30.5% of People are in the Labor Force in Berry Creek.
What is the Unemployment Rate in Berry Creek?
Unemployment Rate in Berry Creek is 19.3%.