Ben Lomond, CA Map & Demographics
Ben Lomond Map
Ben Lomond Overview
$57,364
PER CAPITA INCOME
$136,576
AVG FAMILY INCOME
$115,797
AVG HOUSEHOLD INCOME
40.9%
WAGE / INCOME GAP [ % ]
59.1¢/ $1
WAGE / INCOME GAP [ $ ]
0.41
INEQUALITY / GINI INDEX
7,247
TOTAL POPULATION
3,700
MALE POPULATION
3,547
FEMALE POPULATION
104.31
MALES / 100 FEMALES
95.86
FEMALES / 100 MALES
44.5
MEDIAN AGE
3.0
AVG FAMILY SIZE
2.7
AVG HOUSEHOLD SIZE
3,927
LABOR FORCE [ PEOPLE ]
68.6%
PERCENT IN LABOR FORCE
8.4%
UNEMPLOYMENT RATE
Ben Lomond Zip Codes
Ben Lomond Area Codes
Income in Ben Lomond
Income Overview in Ben Lomond
Per Capita Income in Ben Lomond is $57,364, while median incomes of families and households are $136,576 and $115,797 respectively.
| Characteristic | Number | Measure |
| Per Capita Income | 7,247 | $57,364 |
| Median Family Income | 1,835 | $136,576 |
| Mean Family Income | 1,835 | $160,760 |
| Median Household Income | 2,639 | $115,797 |
| Mean Household Income | 2,639 | $151,593 |
| Income Deficit | 1,835 | $0 |
| Wage / Income Gap (%) | 7,247 | 40.94% |
| Wage / Income Gap ($) | 7,247 | 59.06¢ per $1 |
| Gini / Inequality Index | 7,247 | 0.41 |
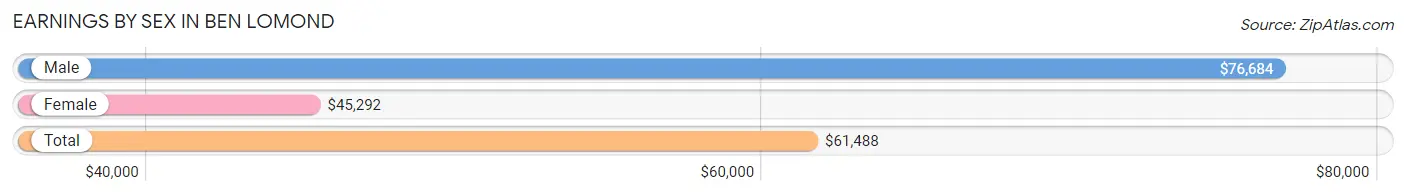
Earnings by Sex in Ben Lomond
Average Earnings in Ben Lomond are $61,488, $76,684 for men and $45,292 for women, a difference of 40.9%.
| Sex | Number | Average Earnings |
| Male | 2,080 (54.5%) | $76,684 |
| Female | 1,736 (45.5%) | $45,292 |
| Total | 3,816 (100.0%) | $61,488 |
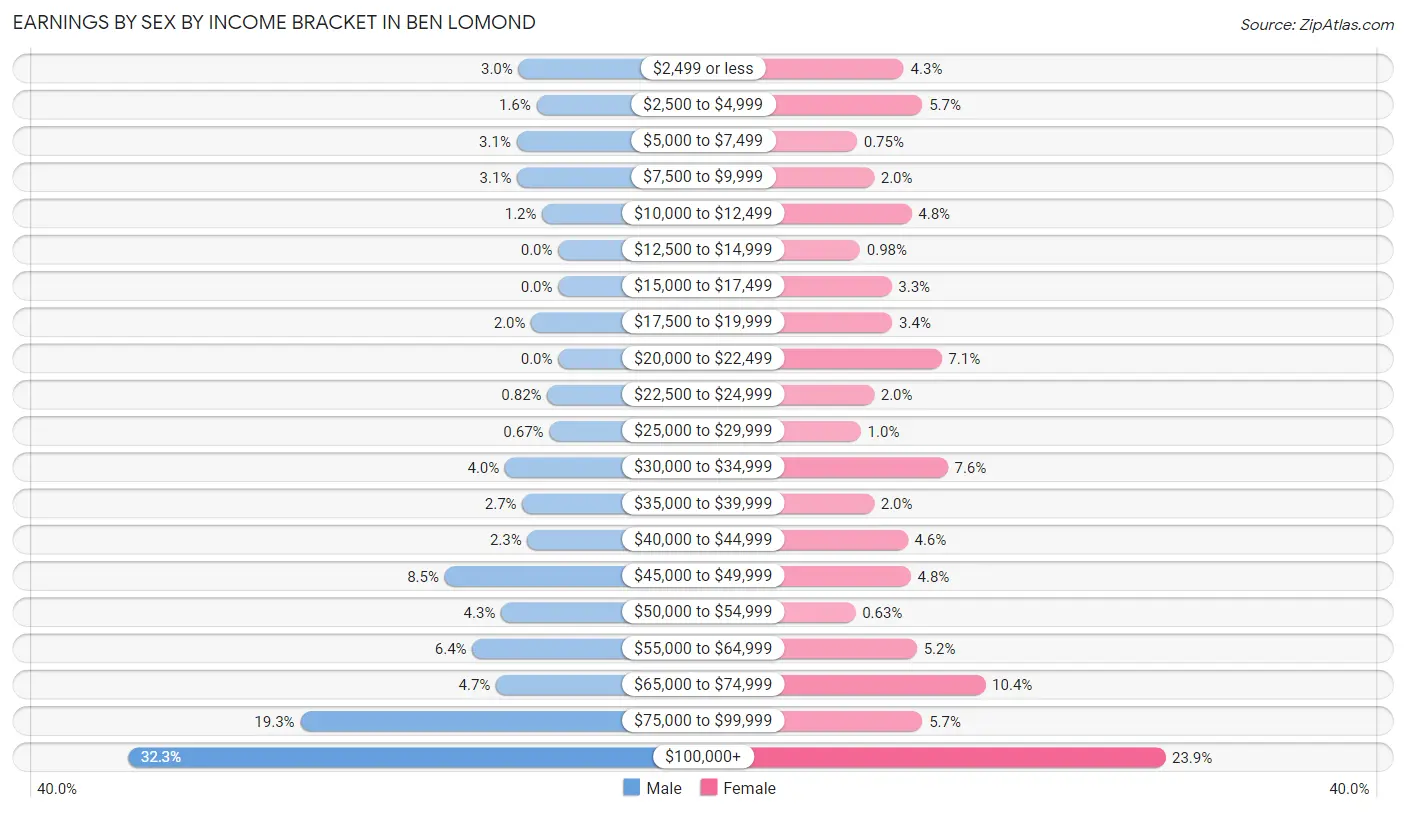
Earnings by Sex by Income Bracket in Ben Lomond
The most common earnings brackets in Ben Lomond are $100,000+ for men (671 | 32.3%) and $100,000+ for women (414 | 23.8%).
| Income | Male | Female |
| $2,499 or less | 62 (3.0%) | 74 (4.3%) |
| $2,500 to $4,999 | 34 (1.6%) | 98 (5.7%) |
| $5,000 to $7,499 | 65 (3.1%) | 13 (0.7%) |
| $7,500 to $9,999 | 64 (3.1%) | 35 (2.0%) |
| $10,000 to $12,499 | 25 (1.2%) | 84 (4.8%) |
| $12,500 to $14,999 | 0 (0.0%) | 17 (1.0%) |
| $15,000 to $17,499 | 0 (0.0%) | 58 (3.3%) |
| $17,500 to $19,999 | 42 (2.0%) | 59 (3.4%) |
| $20,000 to $22,499 | 0 (0.0%) | 123 (7.1%) |
| $22,500 to $24,999 | 17 (0.8%) | 35 (2.0%) |
| $25,000 to $29,999 | 14 (0.7%) | 18 (1.0%) |
| $30,000 to $34,999 | 83 (4.0%) | 131 (7.5%) |
| $35,000 to $39,999 | 56 (2.7%) | 35 (2.0%) |
| $40,000 to $44,999 | 48 (2.3%) | 79 (4.5%) |
| $45,000 to $49,999 | 177 (8.5%) | 83 (4.8%) |
| $50,000 to $54,999 | 89 (4.3%) | 11 (0.6%) |
| $55,000 to $64,999 | 134 (6.4%) | 91 (5.2%) |
| $65,000 to $74,999 | 97 (4.7%) | 180 (10.4%) |
| $75,000 to $99,999 | 402 (19.3%) | 98 (5.7%) |
| $100,000+ | 671 (32.3%) | 414 (23.8%) |
| Total | 2,080 (100.0%) | 1,736 (100.0%) |
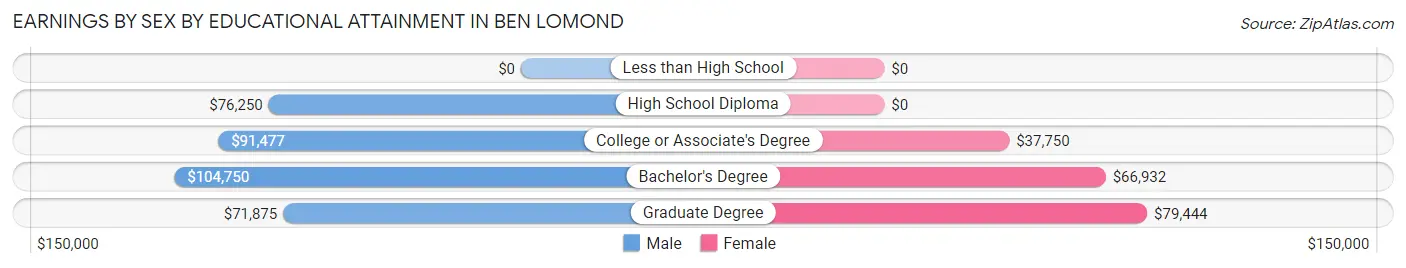
Earnings by Sex by Educational Attainment in Ben Lomond
Average earnings in Ben Lomond are $90,422 for men and $46,623 for women, a difference of 48.4%. Men with an educational attainment of bachelor's degree enjoy the highest average annual earnings of $104,750, while those with graduate degree education earn the least with $71,875. Women with an educational attainment of graduate degree earn the most with the average annual earnings of $79,444, while those with college or associate's degree education have the smallest earnings of $37,750.
| Educational Attainment | Male Income | Female Income |
| Less than High School | - | - |
| High School Diploma | $76,250 | $0 |
| College or Associate's Degree | $91,477 | $37,750 |
| Bachelor's Degree | $104,750 | $66,932 |
| Graduate Degree | $71,875 | $79,444 |
| Total | $90,422 | $46,623 |
Family Income in Ben Lomond
Family Income Brackets in Ben Lomond
According to the Ben Lomond family income data, there are 494 families falling into the $200,000+ income range, which is the most common income bracket and makes up 26.9% of all families.
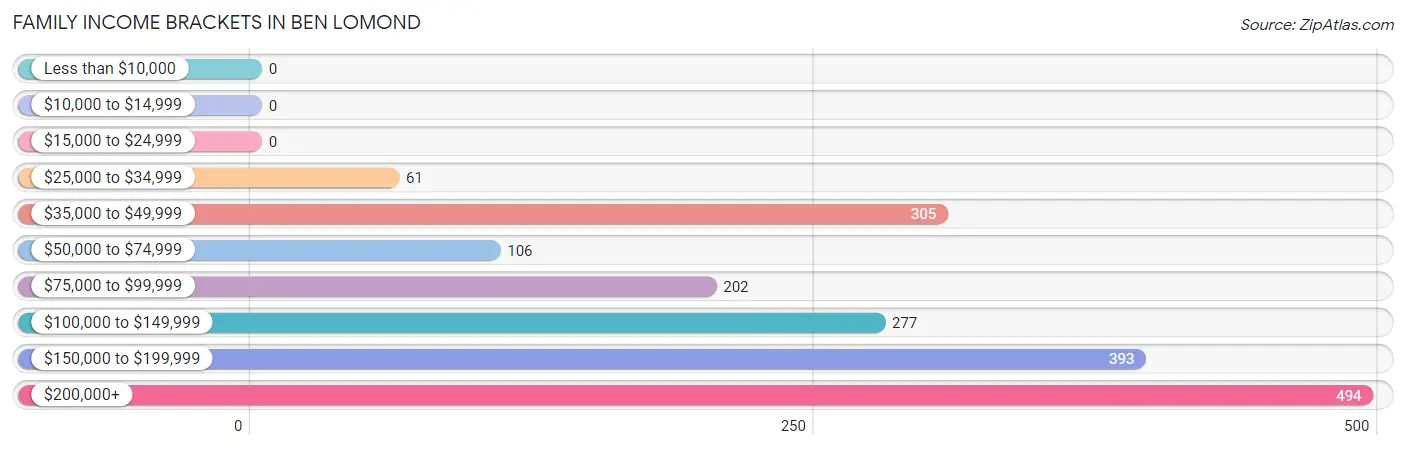
| Income Bracket | # Families | % Families |
| Less than $10,000 | 0 | 0.0% |
| $10,000 to $14,999 | 0 | 0.0% |
| $15,000 to $24,999 | 0 | 0.0% |
| $25,000 to $34,999 | 61 | 3.3% |
| $35,000 to $49,999 | 305 | 16.6% |
| $50,000 to $74,999 | 106 | 5.8% |
| $75,000 to $99,999 | 202 | 11.0% |
| $100,000 to $149,999 | 277 | 15.1% |
| $150,000 to $199,999 | 393 | 21.4% |
| $200,000+ | 494 | 26.9% |
Family Income by Famaliy Size in Ben Lomond
5-person families (87 | 4.7%) account for the highest median family income in Ben Lomond with $178,177 per family, while 2-person families (855 | 46.6%) have the highest median income of $62,125 per family member.
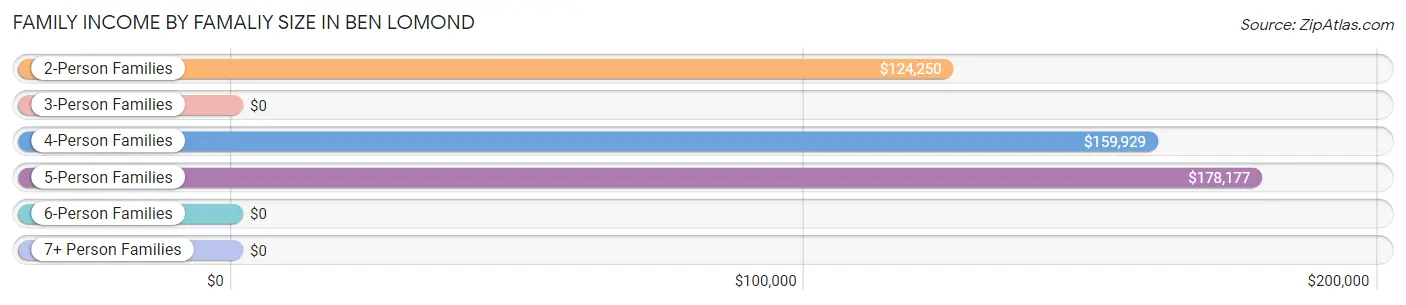
| Income Bracket | # Families | Median Income |
| 2-Person Families | 855 (46.6%) | $124,250 |
| 3-Person Families | 535 (29.2%) | $0 |
| 4-Person Families | 338 (18.4%) | $159,929 |
| 5-Person Families | 87 (4.7%) | $178,177 |
| 6-Person Families | 16 (0.9%) | $0 |
| 7+ Person Families | 4 (0.2%) | $0 |
| Total | 1,835 (100.0%) | $136,576 |
Family Income by Number of Earners in Ben Lomond
The median family income in Ben Lomond is $136,576, with families comprising 3+ earners (132) having the highest median family income of $186,136, while families with no earners (366) have the lowest median family income of $93,636, accounting for 7.2% and 20.0% of families, respectively.
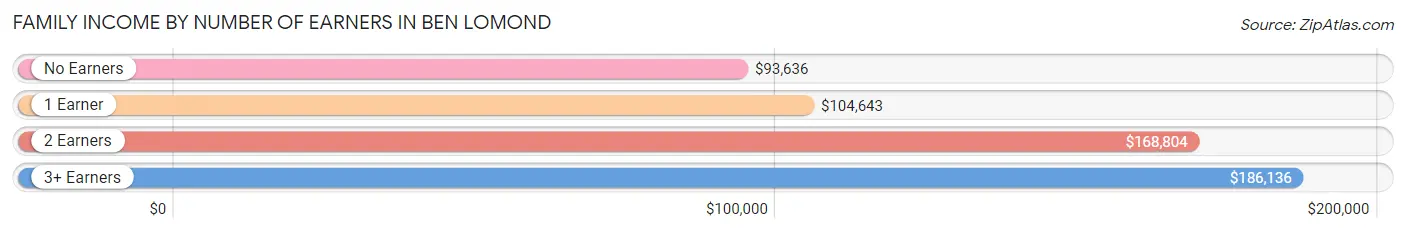
| Number of Earners | # Families | Median Income |
| No Earners | 366 (20.0%) | $93,636 |
| 1 Earner | 548 (29.9%) | $104,643 |
| 2 Earners | 789 (43.0%) | $168,804 |
| 3+ Earners | 132 (7.2%) | $186,136 |
| Total | 1,835 (100.0%) | $136,576 |
Household Income in Ben Lomond
Household Income Brackets in Ben Lomond
With 636 households falling in the category, the $200,000+ income range is the most frequent in Ben Lomond, accounting for 24.1% of all households. In contrast, only 29 households (1.1%) fall into the $15,000 to $24,999 income bracket, making it the least populous group.
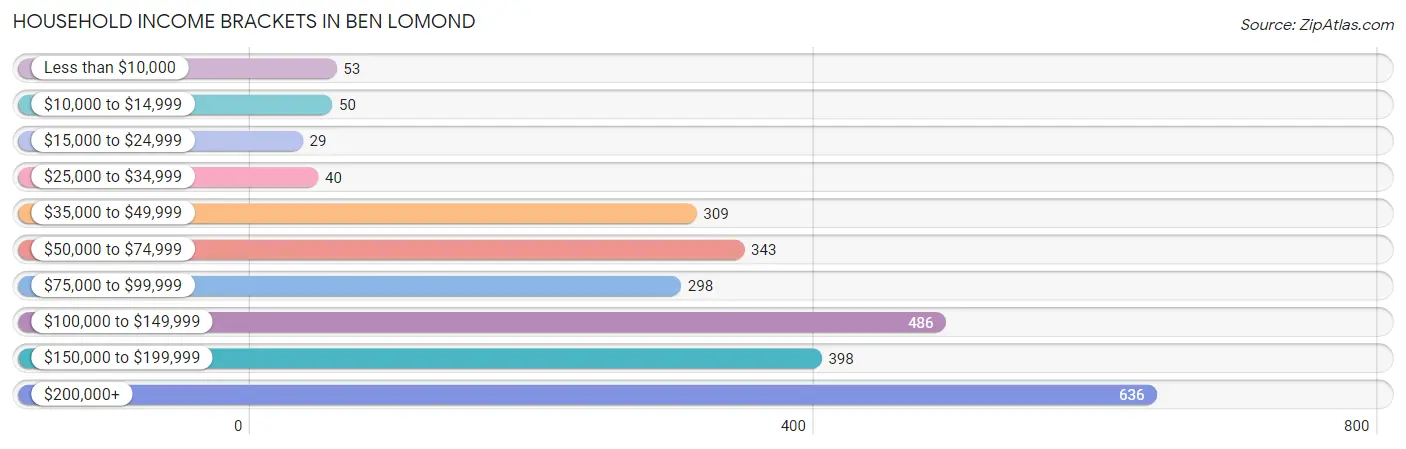
| Income Bracket | # Households | % Households |
| Less than $10,000 | 53 | 2.0% |
| $10,000 to $14,999 | 50 | 1.9% |
| $15,000 to $24,999 | 29 | 1.1% |
| $25,000 to $34,999 | 40 | 1.5% |
| $35,000 to $49,999 | 309 | 11.7% |
| $50,000 to $74,999 | 343 | 13.0% |
| $75,000 to $99,999 | 298 | 11.3% |
| $100,000 to $149,999 | 486 | 18.4% |
| $150,000 to $199,999 | 398 | 15.1% |
| $200,000+ | 636 | 24.1% |
Household Income by Householder Age in Ben Lomond
The median household income in Ben Lomond is $115,797, with the highest median household income of $121,000 found in the 25 to 44 years age bracket for the primary householder. A total of 654 households (24.8%) fall into this category.
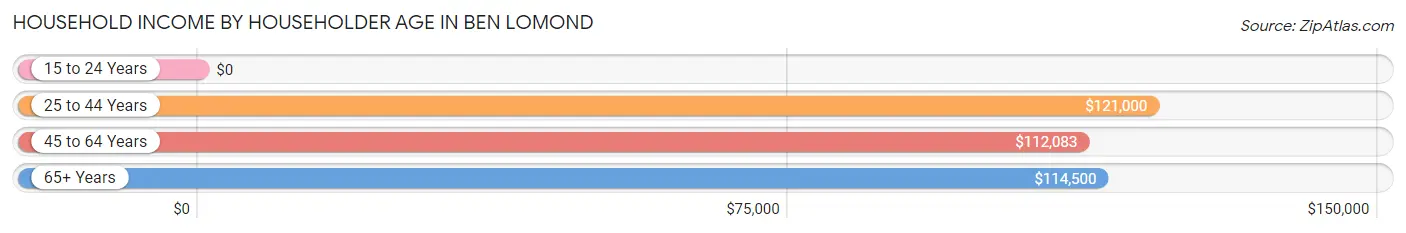
| Income Bracket | # Households | Median Income |
| 15 to 24 Years | 0 (0.0%) | $0 |
| 25 to 44 Years | 654 (24.8%) | $121,000 |
| 45 to 64 Years | 1,121 (42.5%) | $112,083 |
| 65+ Years | 864 (32.7%) | $114,500 |
| Total | 2,639 (100.0%) | $115,797 |
Poverty in Ben Lomond
Income Below Poverty by Sex and Age in Ben Lomond
With 3.5% poverty level for males and 3.0% for females among the residents of Ben Lomond, 18 to 24 year old males and 18 to 24 year old females are the most vulnerable to poverty, with 43 males (10.6%) and 16 females (13.8%) in their respective age groups living below the poverty level.
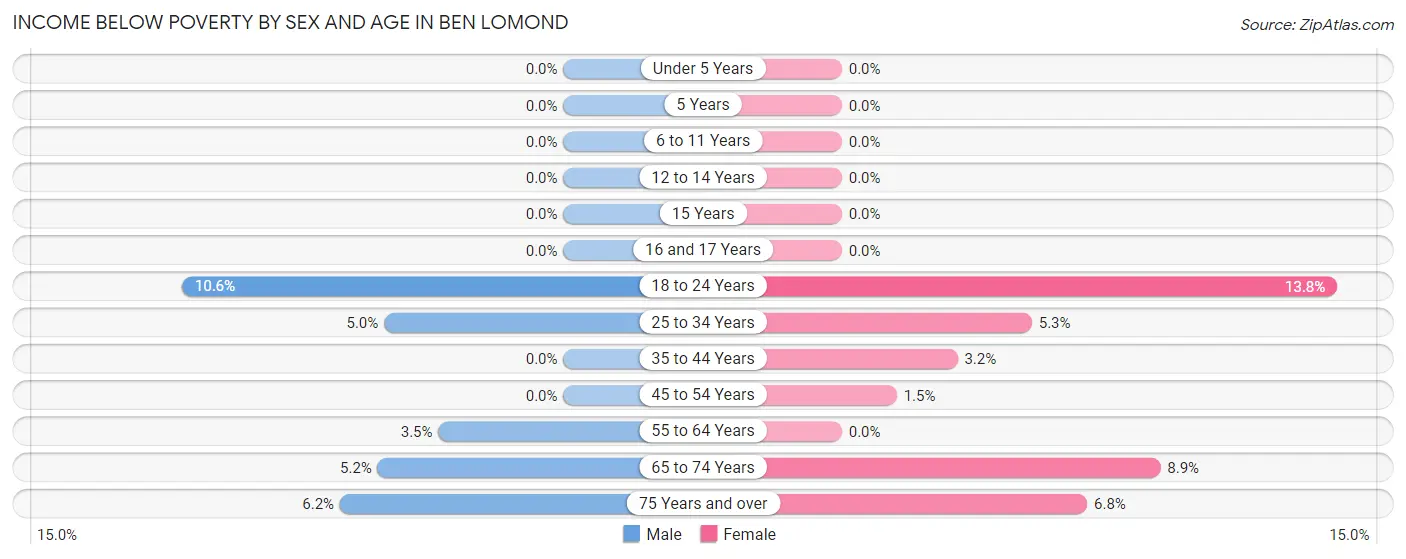
| Age Bracket | Male | Female |
| Under 5 Years | 0 (0.0%) | 0 (0.0%) |
| 5 Years | 0 (0.0%) | 0 (0.0%) |
| 6 to 11 Years | 0 (0.0%) | 0 (0.0%) |
| 12 to 14 Years | 0 (0.0%) | 0 (0.0%) |
| 15 Years | 0 (0.0%) | 0 (0.0%) |
| 16 and 17 Years | 0 (0.0%) | 0 (0.0%) |
| 18 to 24 Years | 43 (10.6%) | 16 (13.8%) |
| 25 to 34 Years | 21 (5.0%) | 22 (5.3%) |
| 35 to 44 Years | 0 (0.0%) | 10 (3.2%) |
| 45 to 54 Years | 0 (0.0%) | 10 (1.5%) |
| 55 to 64 Years | 20 (3.5%) | 0 (0.0%) |
| 65 to 74 Years | 31 (5.2%) | 37 (8.9%) |
| 75 Years and over | 14 (6.2%) | 11 (6.8%) |
| Total | 129 (3.5%) | 106 (3.0%) |
Income Above Poverty by Sex and Age in Ben Lomond
According to the poverty statistics in Ben Lomond, males aged under 5 years and females aged under 5 years are the age groups that are most secure financially, with 100.0% of males and 100.0% of females in these age groups living above the poverty line.
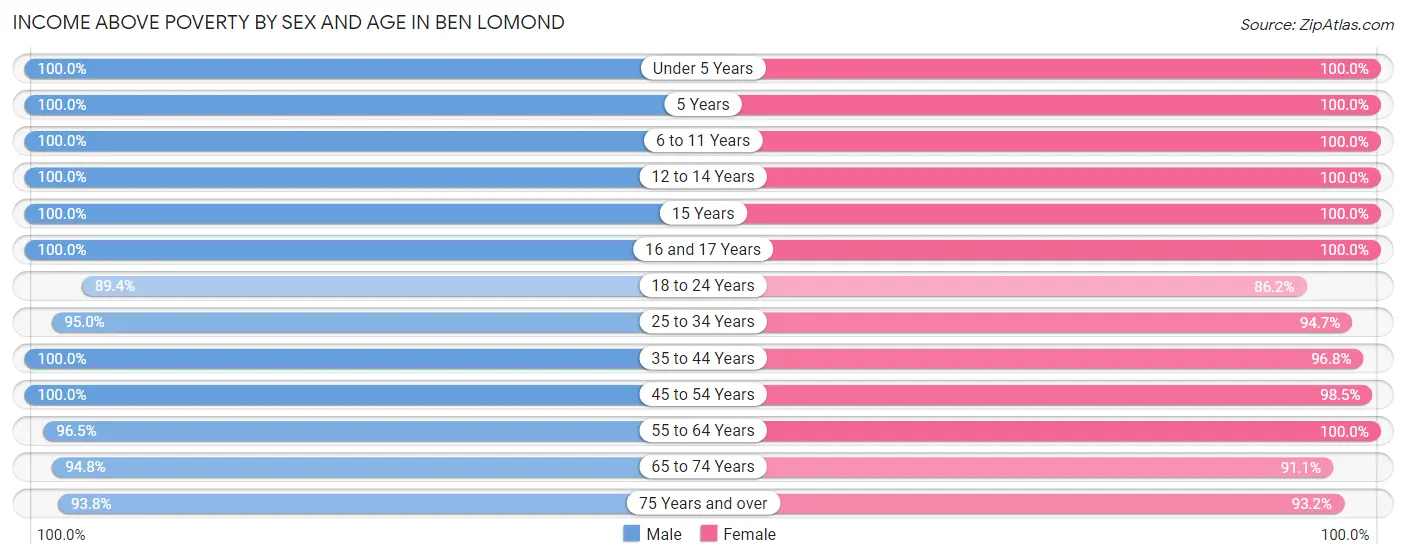
| Age Bracket | Male | Female |
| Under 5 Years | 269 (100.0%) | 163 (100.0%) |
| 5 Years | 4 (100.0%) | 14 (100.0%) |
| 6 to 11 Years | 244 (100.0%) | 137 (100.0%) |
| 12 to 14 Years | 114 (100.0%) | 231 (100.0%) |
| 15 Years | 45 (100.0%) | 224 (100.0%) |
| 16 and 17 Years | 42 (100.0%) | 73 (100.0%) |
| 18 to 24 Years | 362 (89.4%) | 100 (86.2%) |
| 25 to 34 Years | 400 (95.0%) | 394 (94.7%) |
| 35 to 44 Years | 345 (100.0%) | 301 (96.8%) |
| 45 to 54 Years | 373 (100.0%) | 644 (98.5%) |
| 55 to 64 Years | 554 (96.5%) | 591 (100.0%) |
| 65 to 74 Years | 569 (94.8%) | 380 (91.1%) |
| 75 Years and over | 211 (93.8%) | 150 (93.2%) |
| Total | 3,532 (96.5%) | 3,402 (97.0%) |
Income Below Poverty Among Married-Couple Families in Ben Lomond
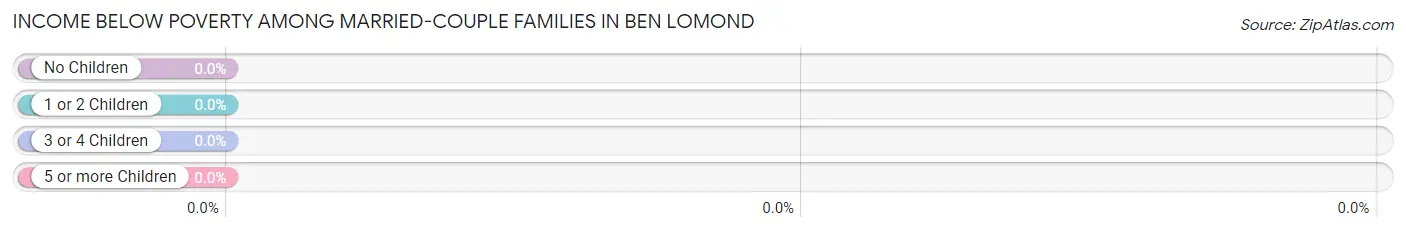
| Children | Above Poverty | Below Poverty |
| No Children | 964 (100.0%) | 0 (0.0%) |
| 1 or 2 Children | 376 (100.0%) | 0 (0.0%) |
| 3 or 4 Children | 68 (100.0%) | 0 (0.0%) |
| 5 or more Children | 4 (100.0%) | 0 (0.0%) |
| Total | 1,412 (100.0%) | 0 (0.0%) |
Income Below Poverty Among Single-Parent Households in Ben Lomond
| Children | Single Father | Single Mother |
| No Children | 0 (0.0%) | 0 (0.0%) |
| 1 or 2 Children | 0 (0.0%) | 0 (0.0%) |
| 3 or 4 Children | 0 (0.0%) | 0 (0.0%) |
| 5 or more Children | 0 (0.0%) | 0 (0.0%) |
| Total | 0 (0.0%) | 0 (0.0%) |
Income Below Poverty Among Married-Couple vs Single-Parent Households in Ben Lomond
| Children | Married-Couple Families | Single-Parent Households |
| No Children | 0 (0.0%) | 0 (0.0%) |
| 1 or 2 Children | 0 (0.0%) | 0 (0.0%) |
| 3 or 4 Children | 0 (0.0%) | 0 (0.0%) |
| 5 or more Children | 0 (0.0%) | 0 (0.0%) |
| Total | 0 (0.0%) | 0 (0.0%) |
Race in Ben Lomond
The most populous races in Ben Lomond are White / Caucasian (6,559 | 90.5%), Hispanic or Latino (805 | 11.1%), and Two or more Races (298 | 4.1%).
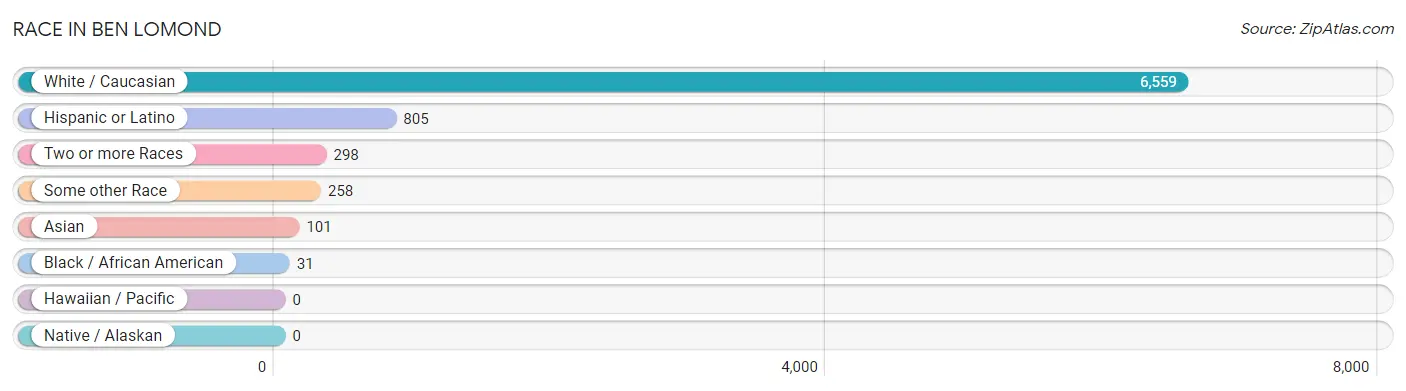
| Race | # Population | % Population |
| Asian | 101 | 1.4% |
| Black / African American | 31 | 0.4% |
| Hawaiian / Pacific | 0 | 0.0% |
| Hispanic or Latino | 805 | 11.1% |
| Native / Alaskan | 0 | 0.0% |
| White / Caucasian | 6,559 | 90.5% |
| Two or more Races | 298 | 4.1% |
| Some other Race | 258 | 3.6% |
| Total | 7,247 | 100.0% |
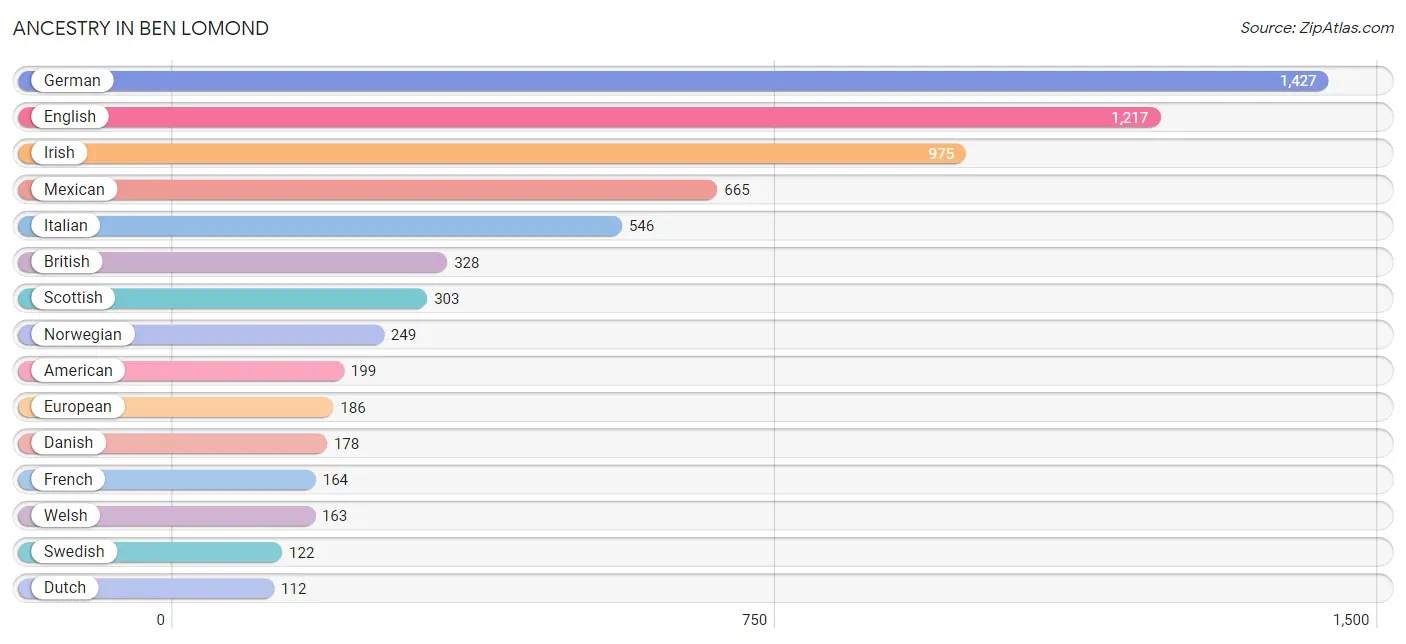
Ancestry in Ben Lomond
The most populous ancestries reported in Ben Lomond are German (1,427 | 19.7%), English (1,217 | 16.8%), Irish (975 | 13.5%), Mexican (665 | 9.2%), and Italian (546 | 7.5%), together accounting for 66.6% of all Ben Lomond residents.
| Ancestry | # Population | % Population |
| Afghan | 41 | 0.6% |
| African | 10 | 0.1% |
| American | 199 | 2.8% |
| Arab | 34 | 0.5% |
| Austrian | 25 | 0.3% |
| Belgian | 7 | 0.1% |
| Bhutanese | 7 | 0.1% |
| British | 328 | 4.5% |
| Burmese | 23 | 0.3% |
| Cajun | 59 | 0.8% |
| Canadian | 13 | 0.2% |
| Celtic | 21 | 0.3% |
| Central American | 62 | 0.9% |
| Cherokee | 15 | 0.2% |
| Choctaw | 9 | 0.1% |
| Colombian | 32 | 0.4% |
| Croatian | 11 | 0.2% |
| Czech | 90 | 1.2% |
| Danish | 178 | 2.5% |
| Dutch | 112 | 1.5% |
| Eastern European | 14 | 0.2% |
| English | 1,217 | 16.8% |
| European | 186 | 2.6% |
| Filipino | 6 | 0.1% |
| Finnish | 14 | 0.2% |
| French | 164 | 2.3% |
| French Canadian | 13 | 0.2% |
| German | 1,427 | 19.7% |
| Greek | 79 | 1.1% |
| Honduran | 24 | 0.3% |
| Hungarian | 14 | 0.2% |
| Indian (Asian) | 41 | 0.6% |
| Iranian | 18 | 0.3% |
| Irish | 975 | 13.5% |
| Italian | 546 | 7.5% |
| Korean | 44 | 0.6% |
| Lithuanian | 22 | 0.3% |
| Macedonian | 17 | 0.2% |
| Mexican | 665 | 9.2% |
| Northern European | 9 | 0.1% |
| Norwegian | 249 | 3.4% |
| Palestinian | 23 | 0.3% |
| Polish | 107 | 1.5% |
| Portuguese | 75 | 1.0% |
| Romanian | 33 | 0.5% |
| Russian | 11 | 0.2% |
| Salvadoran | 38 | 0.5% |
| Scandinavian | 52 | 0.7% |
| Scotch-Irish | 68 | 0.9% |
| Scottish | 303 | 4.2% |
| Slovene | 6 | 0.1% |
| South African | 21 | 0.3% |
| South American | 32 | 0.4% |
| Spaniard | 46 | 0.6% |
| Subsaharan African | 31 | 0.4% |
| Swedish | 122 | 1.7% |
| Thai | 41 | 0.6% |
| Turkish | 89 | 1.2% |
| Ukrainian | 14 | 0.2% |
| Welsh | 163 | 2.2% | View All 60 Rows |
Immigrants in Ben Lomond
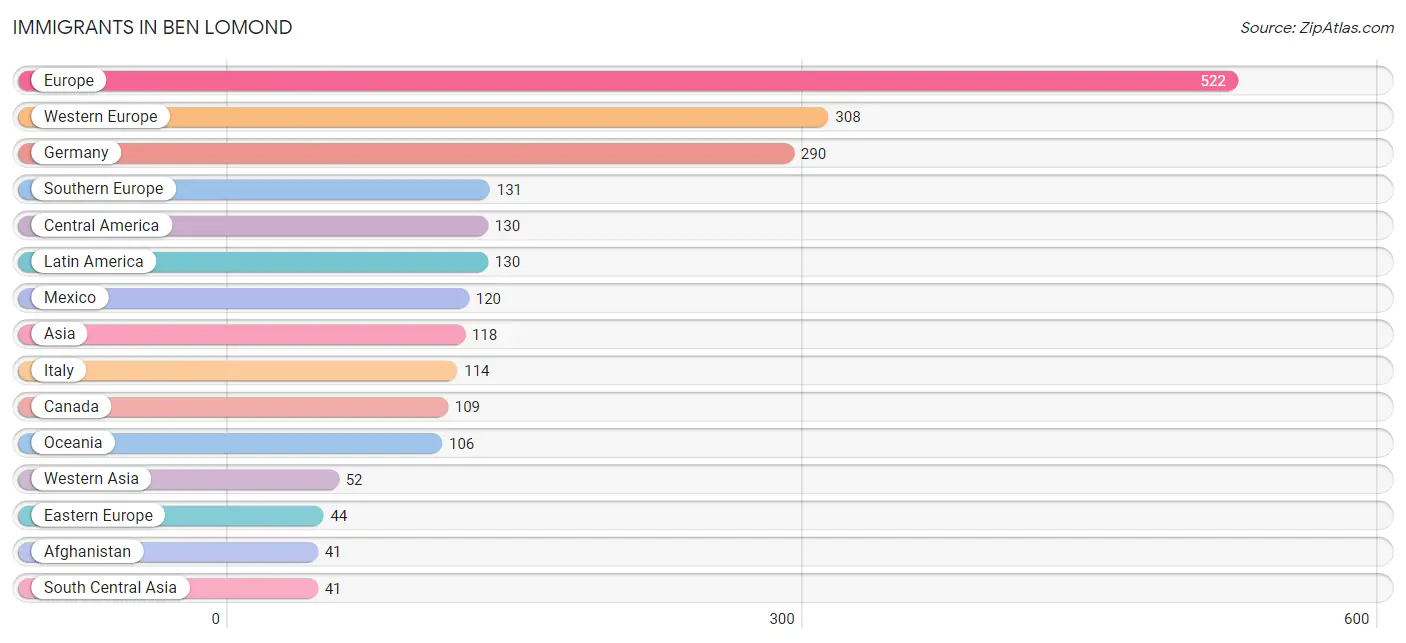
The most numerous immigrant groups reported in Ben Lomond came from Europe (522 | 7.2%), Western Europe (308 | 4.3%), Germany (290 | 4.0%), Southern Europe (131 | 1.8%), and Central America (130 | 1.8%), together accounting for 19.1% of all Ben Lomond residents.
| Immigration Origin | # Population | % Population |
| Afghanistan | 41 | 0.6% |
| Africa | 11 | 0.2% |
| Asia | 118 | 1.6% |
| Australia | 7 | 0.1% |
| Canada | 109 | 1.5% |
| Central America | 130 | 1.8% |
| China | 12 | 0.2% |
| Czechoslovakia | 30 | 0.4% |
| Denmark | 9 | 0.1% |
| Eastern Asia | 12 | 0.2% |
| Eastern Europe | 44 | 0.6% |
| El Salvador | 10 | 0.1% |
| England | 30 | 0.4% |
| Europe | 522 | 7.2% |
| France | 18 | 0.3% |
| Germany | 290 | 4.0% |
| Greece | 17 | 0.2% |
| Italy | 114 | 1.6% |
| Latin America | 130 | 1.8% |
| Mexico | 120 | 1.7% |
| Northern Europe | 39 | 0.5% |
| Oceania | 106 | 1.5% |
| Philippines | 13 | 0.2% |
| South Africa | 11 | 0.2% |
| South Central Asia | 41 | 0.6% |
| South Eastern Asia | 13 | 0.2% |
| Southern Europe | 131 | 1.8% |
| Turkey | 29 | 0.4% |
| Ukraine | 14 | 0.2% |
| Western Asia | 52 | 0.7% |
| Western Europe | 308 | 4.3% | View All 31 Rows |
Sex and Age in Ben Lomond
Sex and Age in Ben Lomond
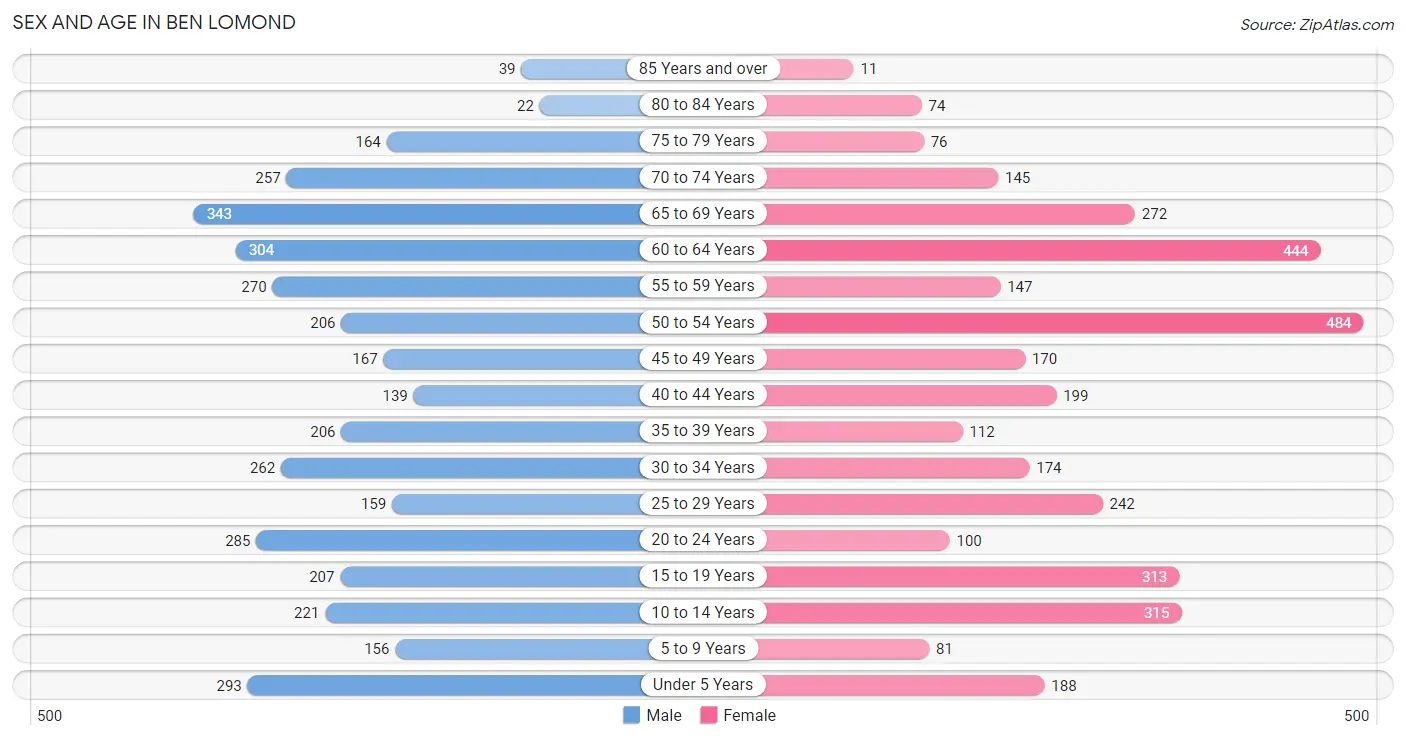
The most populous age groups in Ben Lomond are 65 to 69 Years (343 | 9.3%) for men and 50 to 54 Years (484 | 13.7%) for women.
| Age Bracket | Male | Female |
| Under 5 Years | 293 (7.9%) | 188 (5.3%) |
| 5 to 9 Years | 156 (4.2%) | 81 (2.3%) |
| 10 to 14 Years | 221 (6.0%) | 315 (8.9%) |
| 15 to 19 Years | 207 (5.6%) | 313 (8.8%) |
| 20 to 24 Years | 285 (7.7%) | 100 (2.8%) |
| 25 to 29 Years | 159 (4.3%) | 242 (6.8%) |
| 30 to 34 Years | 262 (7.1%) | 174 (4.9%) |
| 35 to 39 Years | 206 (5.6%) | 112 (3.2%) |
| 40 to 44 Years | 139 (3.8%) | 199 (5.6%) |
| 45 to 49 Years | 167 (4.5%) | 170 (4.8%) |
| 50 to 54 Years | 206 (5.6%) | 484 (13.7%) |
| 55 to 59 Years | 270 (7.3%) | 147 (4.1%) |
| 60 to 64 Years | 304 (8.2%) | 444 (12.5%) |
| 65 to 69 Years | 343 (9.3%) | 272 (7.7%) |
| 70 to 74 Years | 257 (7.0%) | 145 (4.1%) |
| 75 to 79 Years | 164 (4.4%) | 76 (2.1%) |
| 80 to 84 Years | 22 (0.6%) | 74 (2.1%) |
| 85 Years and over | 39 (1.1%) | 11 (0.3%) |
| Total | 3,700 (100.0%) | 3,547 (100.0%) |
Families and Households in Ben Lomond
Median Family Size in Ben Lomond
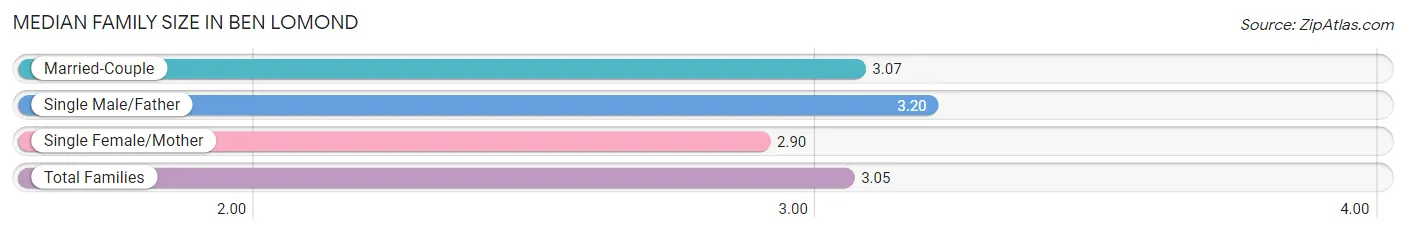
The median family size in Ben Lomond is 3.05 persons per family, with single male/father families (113 | 6.2%) accounting for the largest median family size of 3.2 persons per family. On the other hand, single female/mother families (310 | 16.9%) represent the smallest median family size with 2.90 persons per family.
| Family Type | # Families | Family Size |
| Married-Couple | 1,412 (76.9%) | 3.07 |
| Single Male/Father | 113 (6.2%) | 3.20 |
| Single Female/Mother | 310 (16.9%) | 2.90 |
| Total Families | 1,835 (100.0%) | 3.05 |
Median Household Size in Ben Lomond
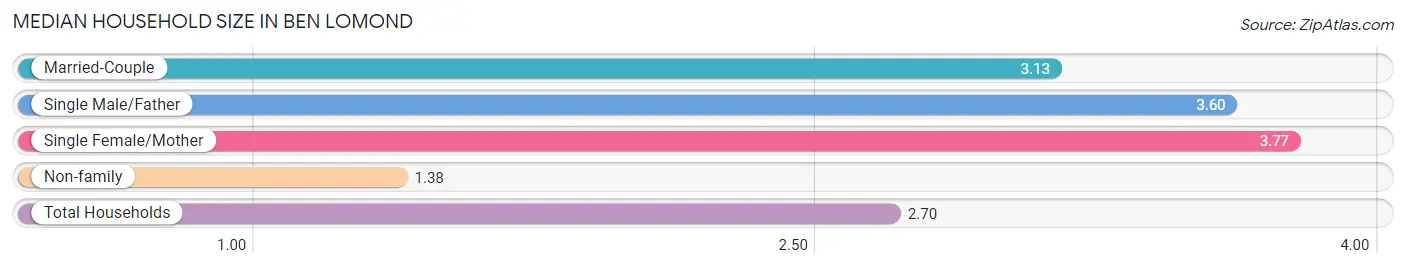
The median household size in Ben Lomond is 2.70 persons per household, with single female/mother households (310 | 11.7%) accounting for the largest median household size of 3.77 persons per household. non-family households (804 | 30.5%) represent the smallest median household size with 1.38 persons per household.
| Household Type | # Households | Household Size |
| Married-Couple | 1,412 (53.5%) | 3.13 |
| Single Male/Father | 113 (4.3%) | 3.60 |
| Single Female/Mother | 310 (11.7%) | 3.77 |
| Non-family | 804 (30.5%) | 1.38 |
| Total Households | 2,639 (100.0%) | 2.70 |
Household Size by Marriage Status in Ben Lomond
Out of a total of 2,639 households in Ben Lomond, 1,835 (69.5%) are family households, while 804 (30.5%) are nonfamily households. The most numerous type of family households are 2-person households, comprising 778, and the most common type of nonfamily households are 1-person households, comprising 579.
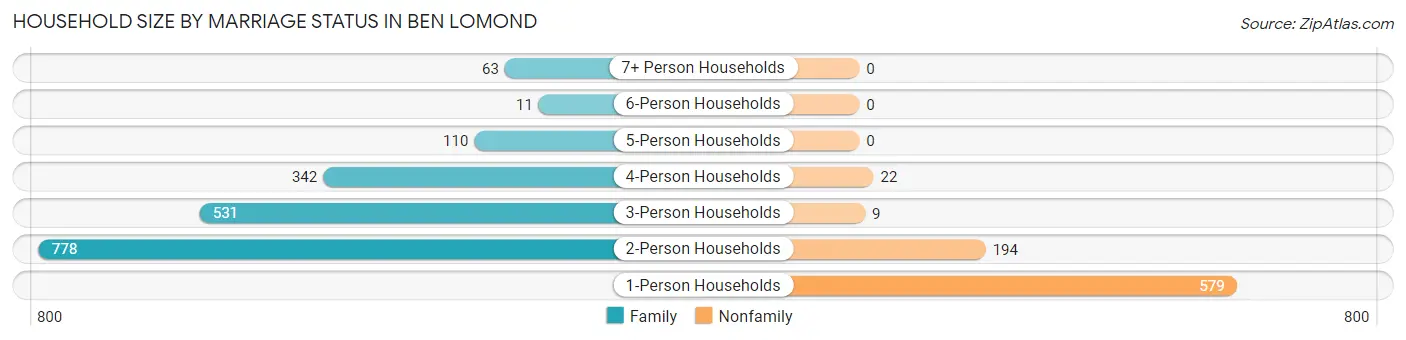
| Household Size | Family Households | Nonfamily Households |
| 1-Person Households | - | 579 (21.9%) |
| 2-Person Households | 778 (29.5%) | 194 (7.3%) |
| 3-Person Households | 531 (20.1%) | 9 (0.3%) |
| 4-Person Households | 342 (13.0%) | 22 (0.8%) |
| 5-Person Households | 110 (4.2%) | 0 (0.0%) |
| 6-Person Households | 11 (0.4%) | 0 (0.0%) |
| 7+ Person Households | 63 (2.4%) | 0 (0.0%) |
| Total | 1,835 (69.5%) | 804 (30.5%) |
Female Fertility in Ben Lomond
Fertility by Age in Ben Lomond
Average fertility rate in Ben Lomond is 95.0 births per 1,000 women. Women in the age bracket of 20 to 34 years have the highest fertility rate with 211.0 births per 1,000 women. Women in the age bracket of 20 to 34 years acount for 74.7% of all women with births.
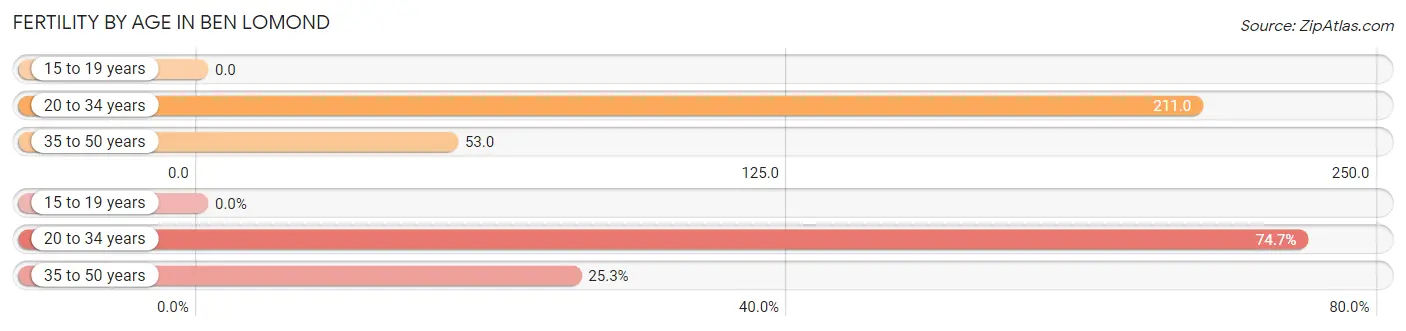
| Age Bracket | Women with Births | Births / 1,000 Women |
| 15 to 19 years | 0 (0.0%) | 0.0 |
| 20 to 34 years | 109 (74.7%) | 211.0 |
| 35 to 50 years | 37 (25.3%) | 53.0 |
| Total | 146 (100.0%) | 95.0 |
Fertility by Age by Marriage Status in Ben Lomond
38.4% of women with births (146) in Ben Lomond are married. The highest percentage of unmarried women with births falls into 20 to 34 years age bracket with 82.6% of them unmarried at the time of birth, while the lowest percentage of unmarried women with births belong to 35 to 50 years age bracket with 0.0% of them unmarried.
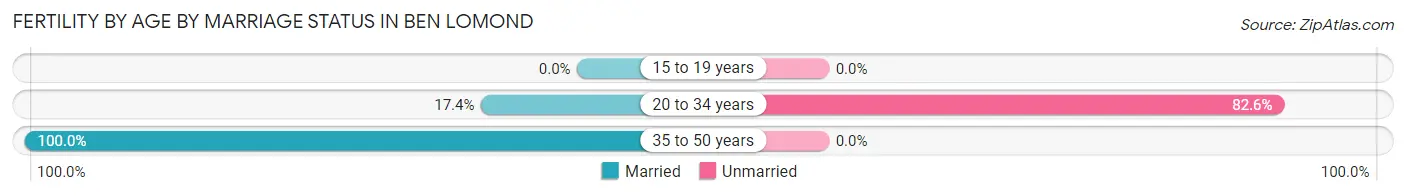
| Age Bracket | Married | Unmarried |
| 15 to 19 years | 0 (0.0%) | 0 (0.0%) |
| 20 to 34 years | 19 (17.4%) | 90 (82.6%) |
| 35 to 50 years | 37 (100.0%) | 0 (0.0%) |
| Total | 56 (38.4%) | 90 (61.6%) |
Fertility by Education in Ben Lomond
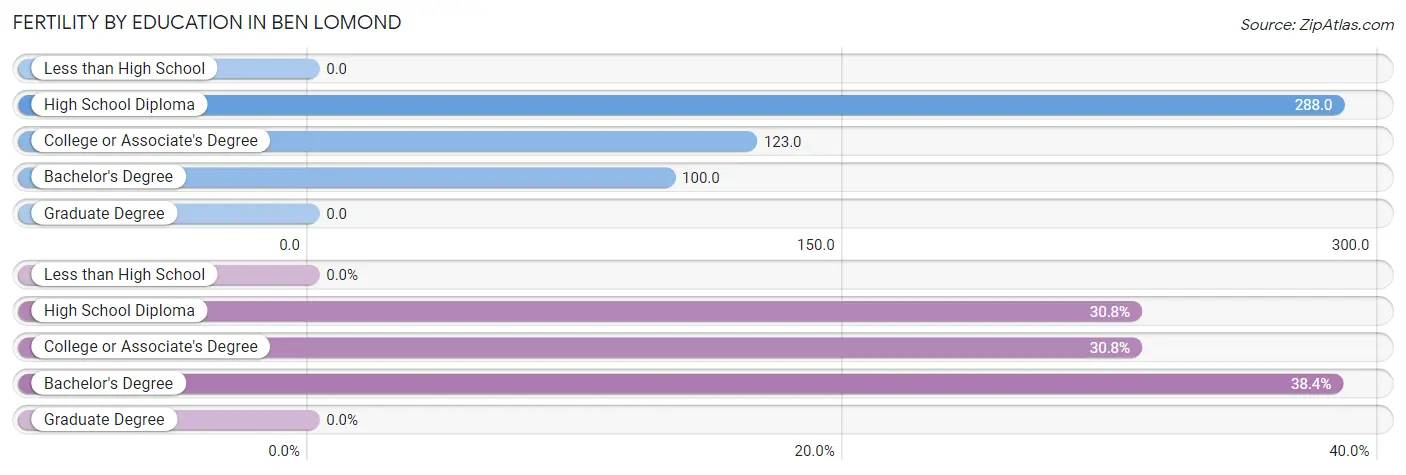
| Educational Attainment | Women with Births | Births / 1,000 Women |
| Less than High School | 0 (0.0%) | 0.0 |
| High School Diploma | 45 (30.8%) | 288.0 |
| College or Associate's Degree | 45 (30.8%) | 123.0 |
| Bachelor's Degree | 56 (38.4%) | 100.0 |
| Graduate Degree | 0 (0.0%) | 0.0 |
| Total | 146 (100.0%) | 95.0 |
Fertility by Education by Marriage Status in Ben Lomond
61.6% of women with births in Ben Lomond are unmarried. Women with the educational attainment of bachelor's degree are most likely to be married with 100.0% of them married at childbirth, while women with the educational attainment of high school diploma are least likely to be married with 100.0% of them unmarried at childbirth.
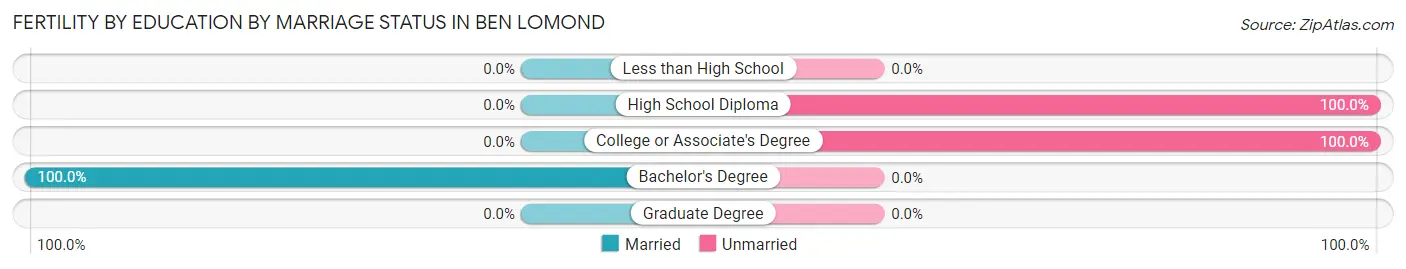
| Educational Attainment | Married | Unmarried |
| Less than High School | 0 (0.0%) | 0 (0.0%) |
| High School Diploma | 0 (0.0%) | 45 (100.0%) |
| College or Associate's Degree | 0 (0.0%) | 45 (100.0%) |
| Bachelor's Degree | 56 (100.0%) | 0 (0.0%) |
| Graduate Degree | 0 (0.0%) | 0 (0.0%) |
| Total | 56 (38.4%) | 90 (61.6%) |
Employment Characteristics in Ben Lomond
Employment by Class of Employer in Ben Lomond
Among the 3,504 employed individuals in Ben Lomond, private company employees (2,128 | 60.7%), self-employed (not incorporated) (373 | 10.6%), and local government employees (332 | 9.5%) make up the most common classes of employment.
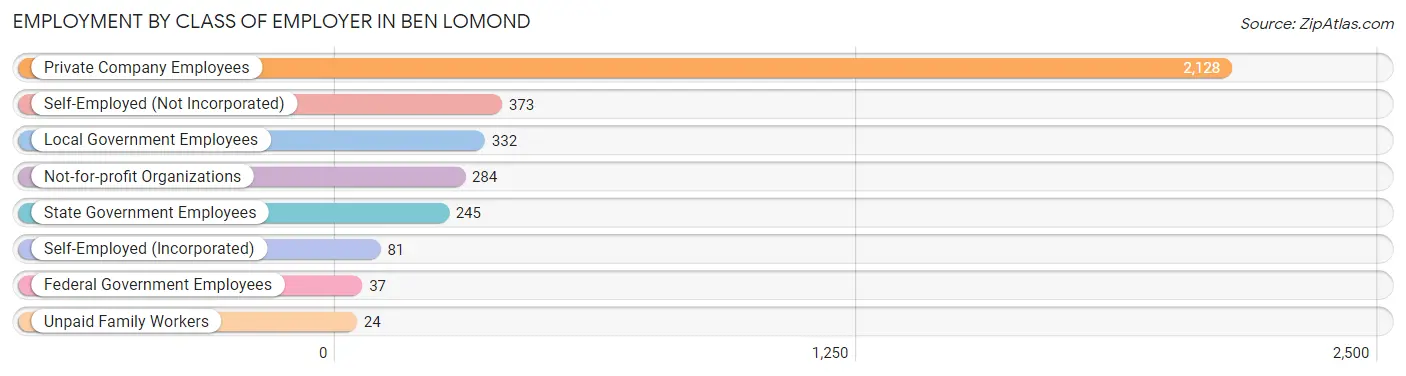
| Employer Class | # Employees | % Employees |
| Private Company Employees | 2,128 | 60.7% |
| Self-Employed (Incorporated) | 81 | 2.3% |
| Self-Employed (Not Incorporated) | 373 | 10.6% |
| Not-for-profit Organizations | 284 | 8.1% |
| Local Government Employees | 332 | 9.5% |
| State Government Employees | 245 | 7.0% |
| Federal Government Employees | 37 | 1.1% |
| Unpaid Family Workers | 24 | 0.7% |
| Total | 3,504 | 100.0% |
Employment Status by Age in Ben Lomond
According to the labor force statistics for Ben Lomond, out of the total population over 16 years of age (5,724), 68.6% or 3,927 individuals are in the labor force, with 8.4% or 330 of them unemployed. The age group with the highest labor force participation rate is 45 to 54 years, with 93.4% or 959 individuals in the labor force. Within the labor force, the 20 to 24 years age range has the highest percentage of unemployed individuals, with 19.3% or 62 of them being unemployed.
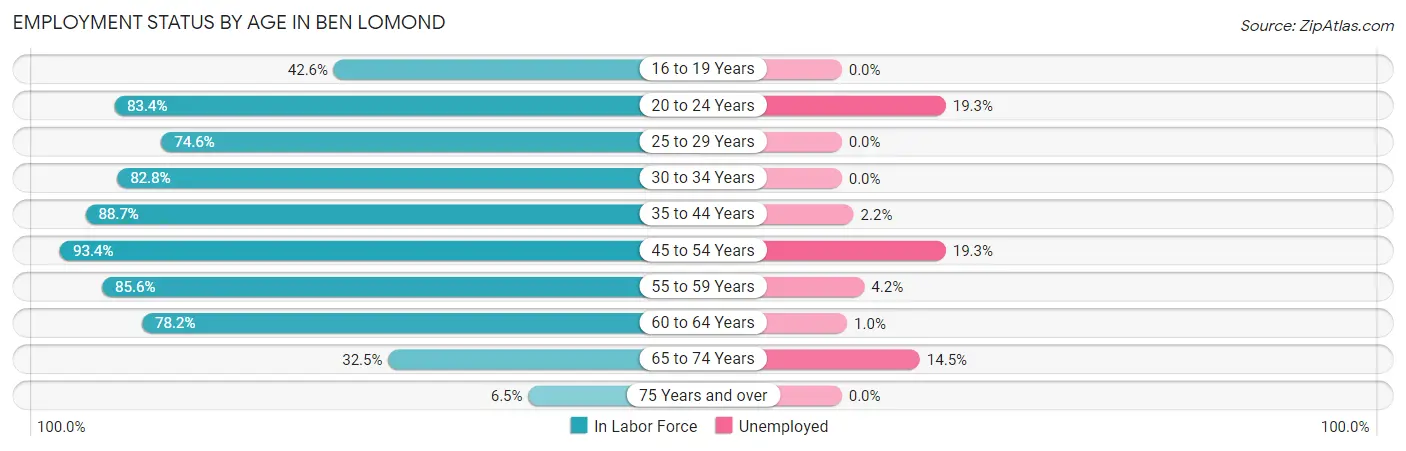
| Age Bracket | In Labor Force | Unemployed |
| 16 to 19 Years | 107 (42.6%) | 0 (0.0%) |
| 20 to 24 Years | 321 (83.4%) | 62 (19.3%) |
| 25 to 29 Years | 299 (74.6%) | 0 (0.0%) |
| 30 to 34 Years | 361 (82.8%) | 0 (0.0%) |
| 35 to 44 Years | 582 (88.7%) | 13 (2.2%) |
| 45 to 54 Years | 959 (93.4%) | 185 (19.3%) |
| 55 to 59 Years | 357 (85.6%) | 15 (4.2%) |
| 60 to 64 Years | 585 (78.2%) | 6 (1.0%) |
| 65 to 74 Years | 331 (32.5%) | 48 (14.5%) |
| 75 Years and over | 25 (6.5%) | 0 (0.0%) |
| Total | 3,927 (68.6%) | 330 (8.4%) |
Employment Status by Educational Attainment in Ben Lomond
According to labor force statistics for Ben Lomond, 85.3% of individuals (3,143) out of the total population between 25 and 64 years of age (3,685) are in the labor force, with 7.0% or 220 of them being unemployed. The group with the highest labor force participation rate are those with the educational attainment of bachelor's degree or higher, with 90.2% or 1,477 individuals in the labor force. Within the labor force, individuals with bachelor's degree or higher education have the highest percentage of unemployment, with 13.7% or 202 of them being unemployed.
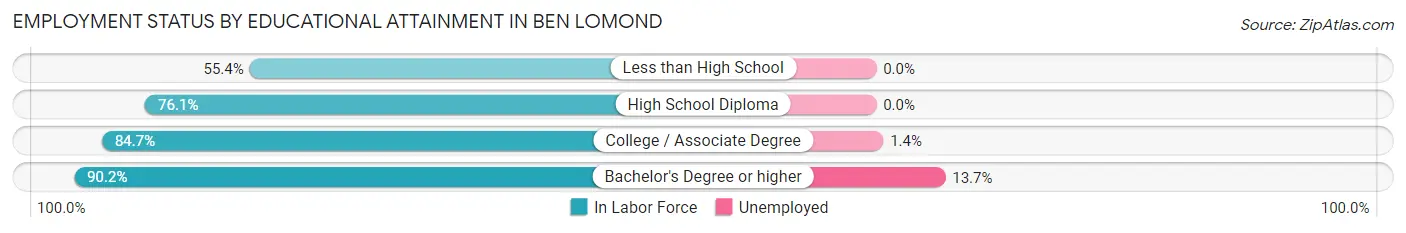
| Educational Attainment | In Labor Force | Unemployed |
| Less than High School | 46 (55.4%) | 0 (0.0%) |
| High School Diploma | 379 (76.1%) | 0 (0.0%) |
| College / Associate Degree | 1,242 (84.7%) | 21 (1.4%) |
| Bachelor's Degree or higher | 1,477 (90.2%) | 224 (13.7%) |
| Total | 3,143 (85.3%) | 258 (7.0%) |
Employment Occupations by Sex in Ben Lomond
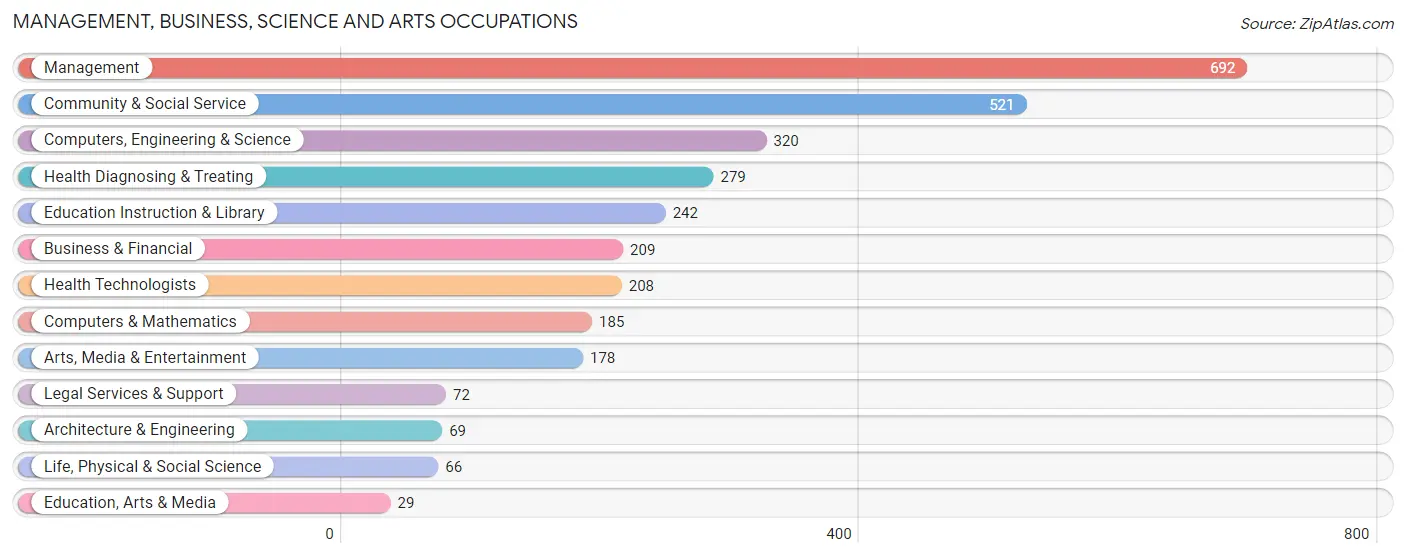
Management, Business, Science and Arts Occupations
The most common Management, Business, Science and Arts occupations in Ben Lomond are Management (692 | 19.2%), Community & Social Service (521 | 14.5%), Computers, Engineering & Science (320 | 8.9%), Health Diagnosing & Treating (279 | 7.7%), and Education Instruction & Library (242 | 6.7%).
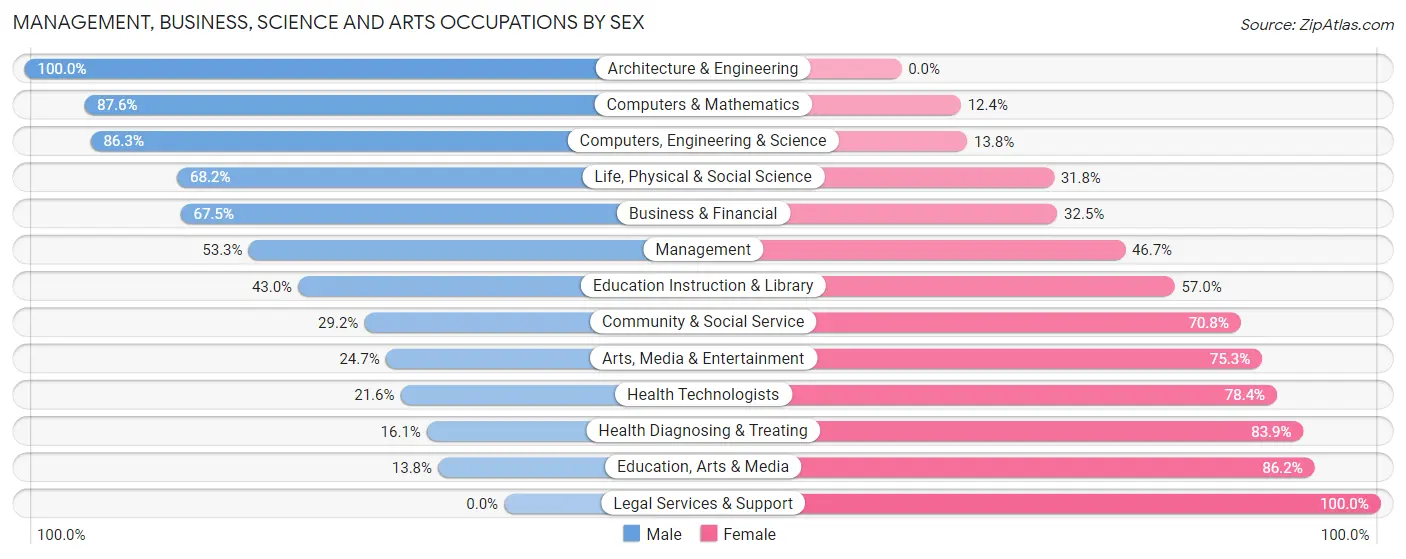
Management, Business, Science and Arts Occupations by Sex
Within the Management, Business, Science and Arts occupations in Ben Lomond, the most male-oriented occupations are Architecture & Engineering (100.0%), Computers & Mathematics (87.6%), and Computers, Engineering & Science (86.3%), while the most female-oriented occupations are Legal Services & Support (100.0%), Education, Arts & Media (86.2%), and Health Diagnosing & Treating (83.9%).
| Occupation | Male | Female |
| Management | 369 (53.3%) | 323 (46.7%) |
| Business & Financial | 141 (67.5%) | 68 (32.5%) |
| Computers, Engineering & Science | 276 (86.3%) | 44 (13.8%) |
| Computers & Mathematics | 162 (87.6%) | 23 (12.4%) |
| Architecture & Engineering | 69 (100.0%) | 0 (0.0%) |
| Life, Physical & Social Science | 45 (68.2%) | 21 (31.8%) |
| Community & Social Service | 152 (29.2%) | 369 (70.8%) |
| Education, Arts & Media | 4 (13.8%) | 25 (86.2%) |
| Legal Services & Support | 0 (0.0%) | 72 (100.0%) |
| Education Instruction & Library | 104 (43.0%) | 138 (57.0%) |
| Arts, Media & Entertainment | 44 (24.7%) | 134 (75.3%) |
| Health Diagnosing & Treating | 45 (16.1%) | 234 (83.9%) |
| Health Technologists | 45 (21.6%) | 163 (78.4%) |
| Total (Category) | 983 (48.6%) | 1,038 (51.4%) |
| Total (Overall) | 1,950 (54.2%) | 1,648 (45.8%) |
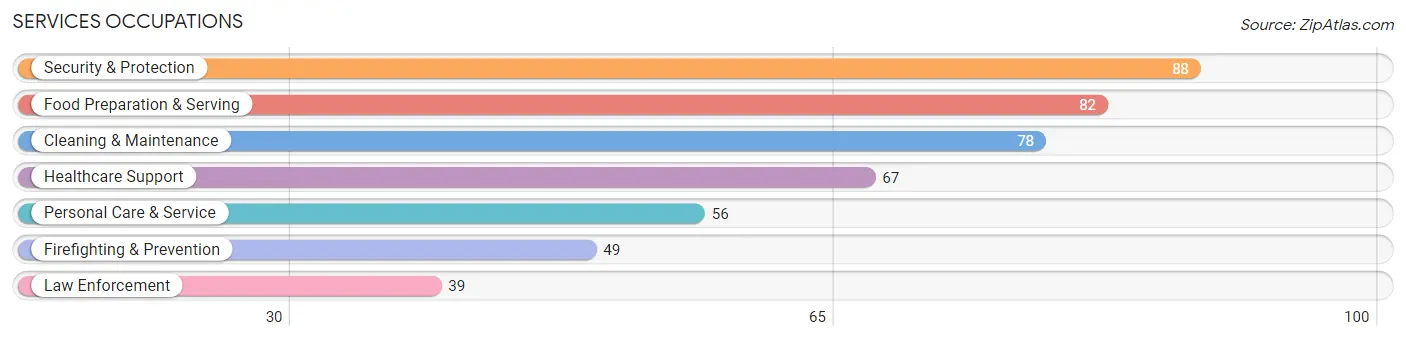
Services Occupations
The most common Services occupations in Ben Lomond are Security & Protection (88 | 2.5%), Food Preparation & Serving (82 | 2.3%), Cleaning & Maintenance (78 | 2.2%), Healthcare Support (67 | 1.9%), and Personal Care & Service (56 | 1.6%).
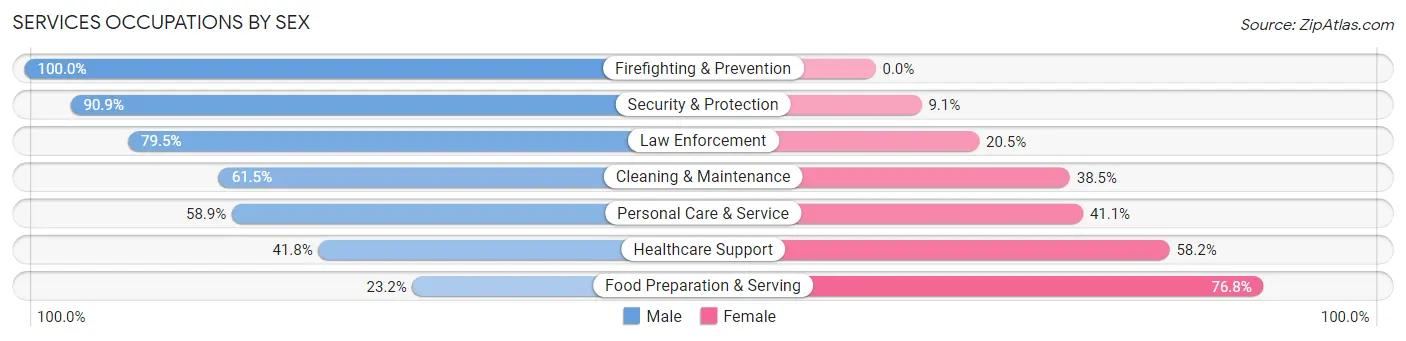
Services Occupations by Sex
Within the Services occupations in Ben Lomond, the most male-oriented occupations are Firefighting & Prevention (100.0%), Security & Protection (90.9%), and Law Enforcement (79.5%), while the most female-oriented occupations are Food Preparation & Serving (76.8%), Healthcare Support (58.2%), and Personal Care & Service (41.1%).
| Occupation | Male | Female |
| Healthcare Support | 28 (41.8%) | 39 (58.2%) |
| Security & Protection | 80 (90.9%) | 8 (9.1%) |
| Firefighting & Prevention | 49 (100.0%) | 0 (0.0%) |
| Law Enforcement | 31 (79.5%) | 8 (20.5%) |
| Food Preparation & Serving | 19 (23.2%) | 63 (76.8%) |
| Cleaning & Maintenance | 48 (61.5%) | 30 (38.5%) |
| Personal Care & Service | 33 (58.9%) | 23 (41.1%) |
| Total (Category) | 208 (56.1%) | 163 (43.9%) |
| Total (Overall) | 1,950 (54.2%) | 1,648 (45.8%) |
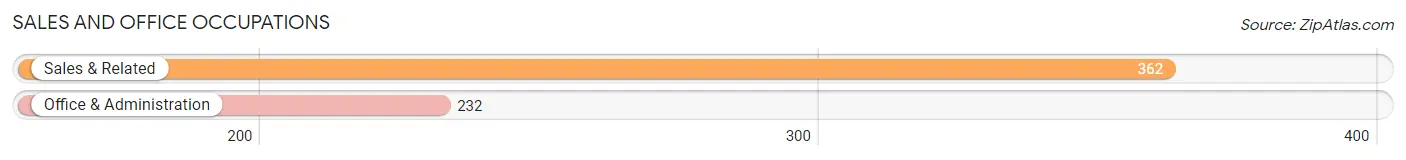
Sales and Office Occupations
The most common Sales and Office occupations in Ben Lomond are Sales & Related (362 | 10.1%), and Office & Administration (232 | 6.5%).
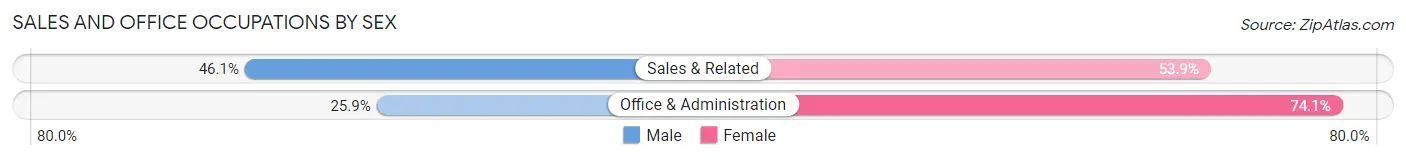
Sales and Office Occupations by Sex
| Occupation | Male | Female |
| Sales & Related | 167 (46.1%) | 195 (53.9%) |
| Office & Administration | 60 (25.9%) | 172 (74.1%) |
| Total (Category) | 227 (38.2%) | 367 (61.8%) |
| Total (Overall) | 1,950 (54.2%) | 1,648 (45.8%) |
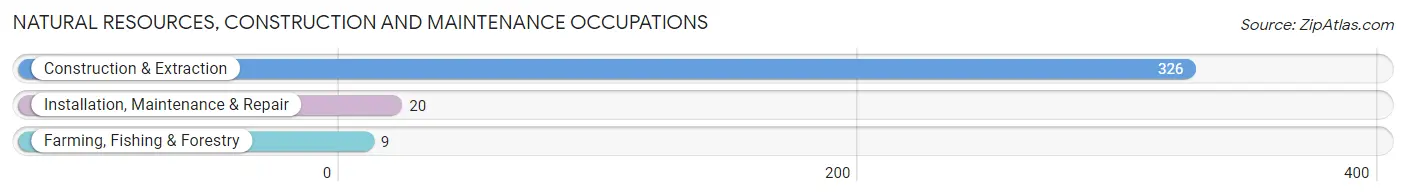
Natural Resources, Construction and Maintenance Occupations
The most common Natural Resources, Construction and Maintenance occupations in Ben Lomond are Construction & Extraction (326 | 9.1%), Installation, Maintenance & Repair (20 | 0.6%), and Farming, Fishing & Forestry (9 | 0.3%).
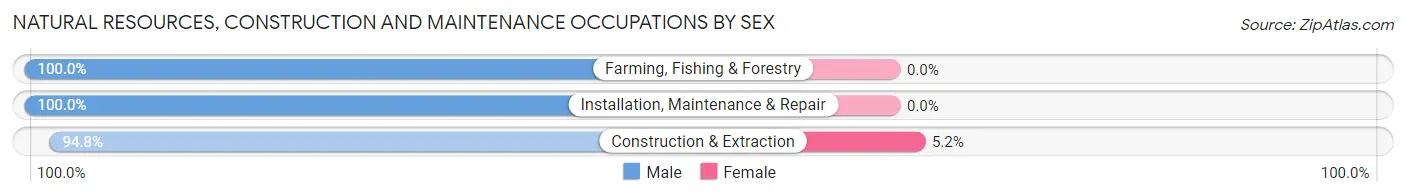
Natural Resources, Construction and Maintenance Occupations by Sex
| Occupation | Male | Female |
| Farming, Fishing & Forestry | 9 (100.0%) | 0 (0.0%) |
| Construction & Extraction | 309 (94.8%) | 17 (5.2%) |
| Installation, Maintenance & Repair | 20 (100.0%) | 0 (0.0%) |
| Total (Category) | 338 (95.2%) | 17 (4.8%) |
| Total (Overall) | 1,950 (54.2%) | 1,648 (45.8%) |
Production, Transportation and Moving Occupations
The most common Production, Transportation and Moving occupations in Ben Lomond are Transportation (105 | 2.9%), Material Moving (81 | 2.2%), and Production (71 | 2.0%).
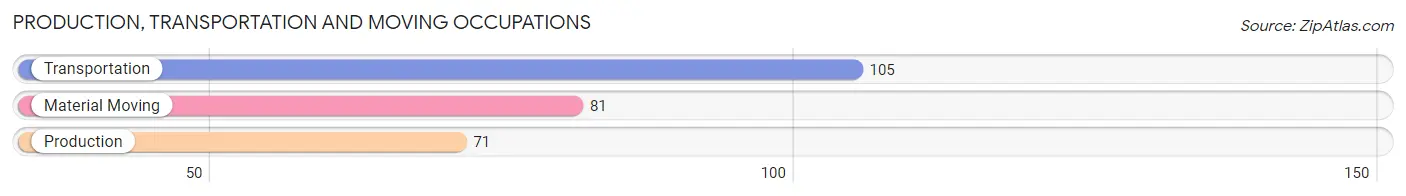
Production, Transportation and Moving Occupations by Sex
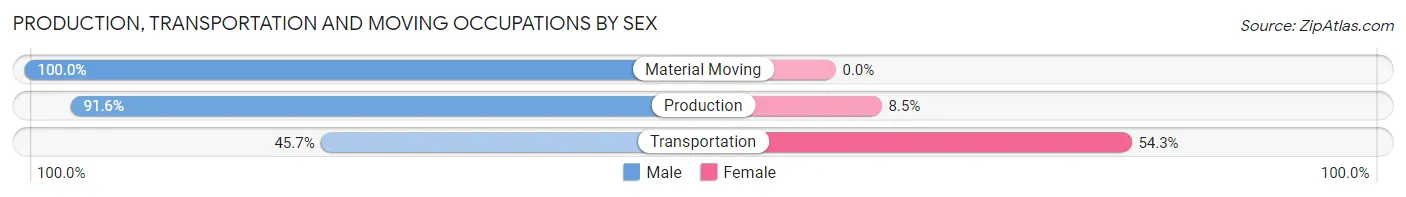
| Occupation | Male | Female |
| Production | 65 (91.5%) | 6 (8.5%) |
| Transportation | 48 (45.7%) | 57 (54.3%) |
| Material Moving | 81 (100.0%) | 0 (0.0%) |
| Total (Category) | 194 (75.5%) | 63 (24.5%) |
| Total (Overall) | 1,950 (54.2%) | 1,648 (45.8%) |
Employment Industries by Sex in Ben Lomond
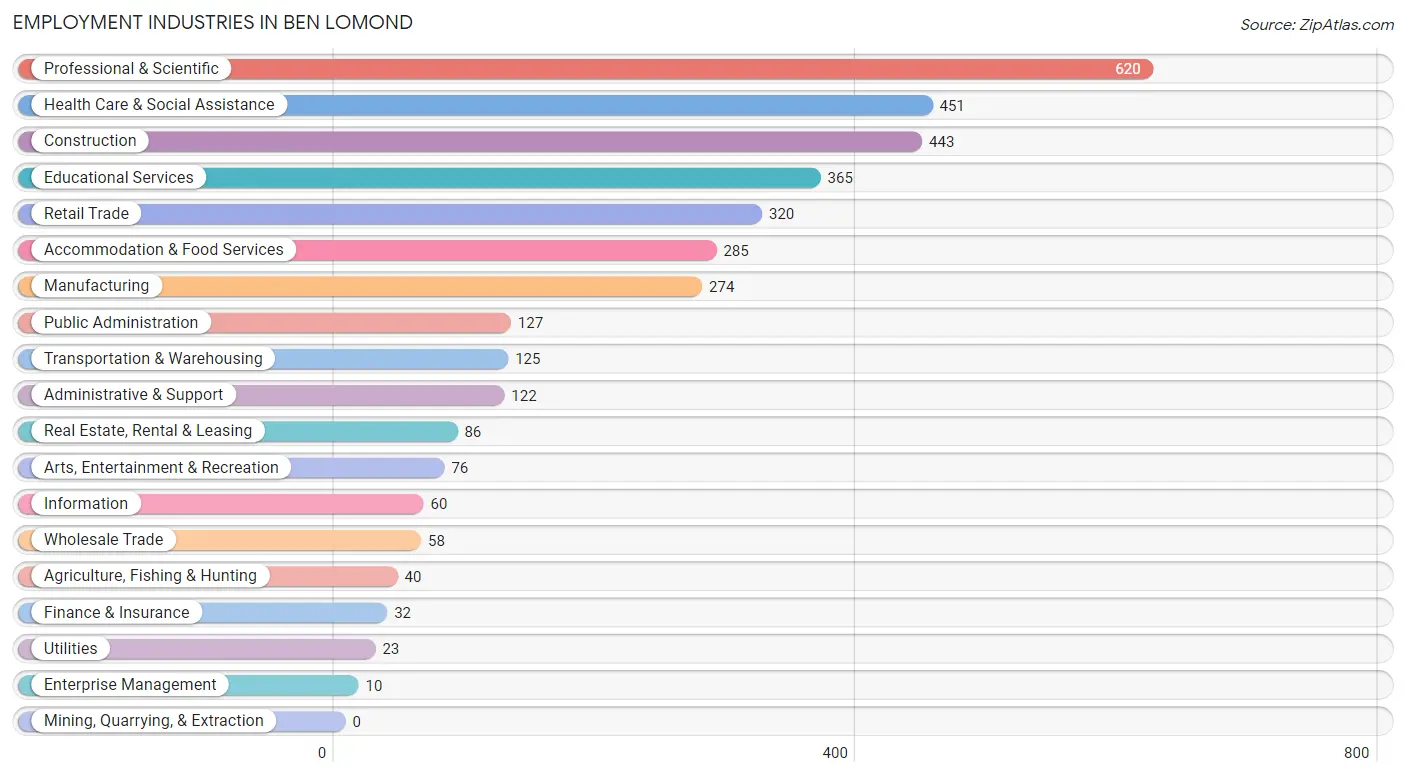
Employment Industries in Ben Lomond
The major employment industries in Ben Lomond include Professional & Scientific (620 | 17.2%), Health Care & Social Assistance (451 | 12.5%), Construction (443 | 12.3%), Educational Services (365 | 10.1%), and Retail Trade (320 | 8.9%).
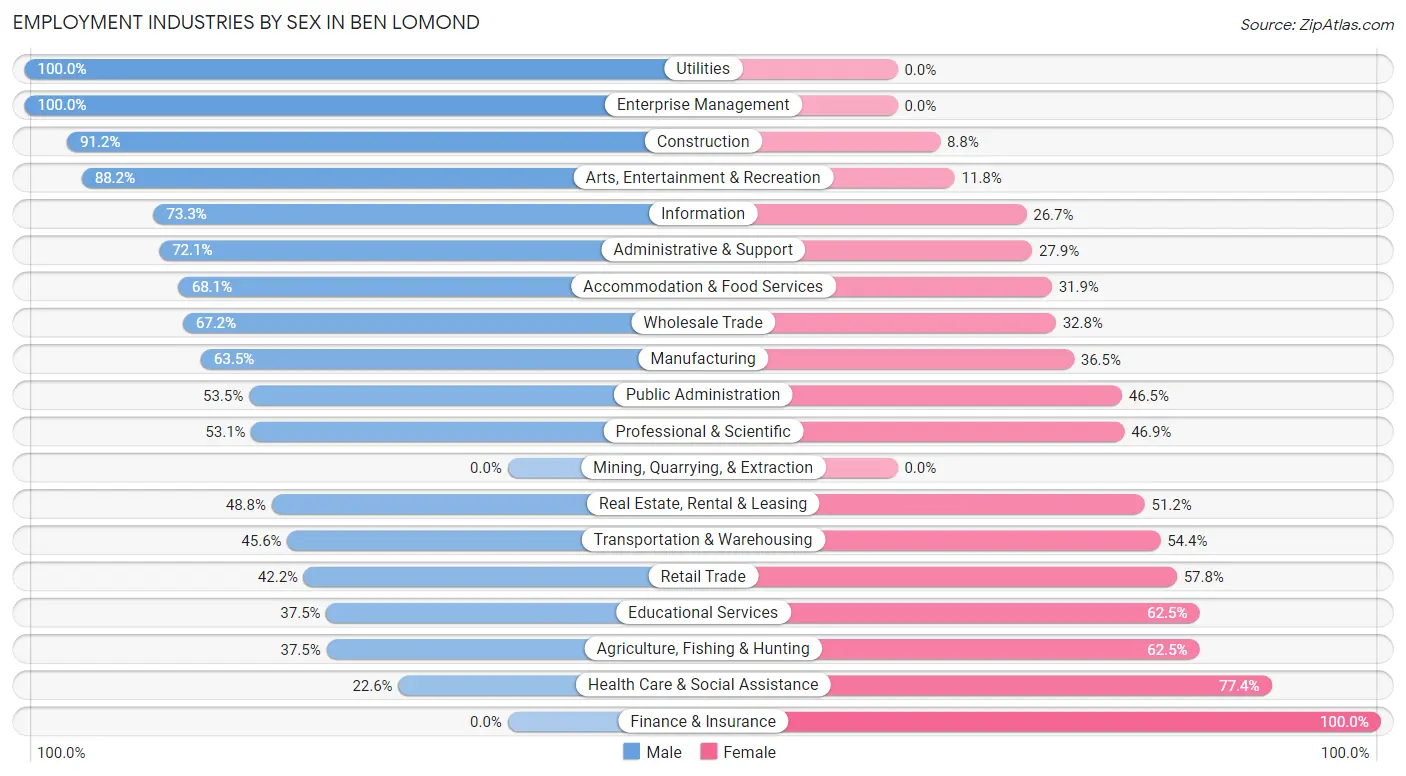
Employment Industries by Sex in Ben Lomond
The Ben Lomond industries that see more men than women are Utilities (100.0%), Enterprise Management (100.0%), and Construction (91.2%), whereas the industries that tend to have a higher number of women are Finance & Insurance (100.0%), Health Care & Social Assistance (77.4%), and Agriculture, Fishing & Hunting (62.5%).
| Industry | Male | Female |
| Agriculture, Fishing & Hunting | 15 (37.5%) | 25 (62.5%) |
| Mining, Quarrying, & Extraction | 0 (0.0%) | 0 (0.0%) |
| Construction | 404 (91.2%) | 39 (8.8%) |
| Manufacturing | 174 (63.5%) | 100 (36.5%) |
| Wholesale Trade | 39 (67.2%) | 19 (32.8%) |
| Retail Trade | 135 (42.2%) | 185 (57.8%) |
| Transportation & Warehousing | 57 (45.6%) | 68 (54.4%) |
| Utilities | 23 (100.0%) | 0 (0.0%) |
| Information | 44 (73.3%) | 16 (26.7%) |
| Finance & Insurance | 0 (0.0%) | 32 (100.0%) |
| Real Estate, Rental & Leasing | 42 (48.8%) | 44 (51.2%) |
| Professional & Scientific | 329 (53.1%) | 291 (46.9%) |
| Enterprise Management | 10 (100.0%) | 0 (0.0%) |
| Administrative & Support | 88 (72.1%) | 34 (27.9%) |
| Educational Services | 137 (37.5%) | 228 (62.5%) |
| Health Care & Social Assistance | 102 (22.6%) | 349 (77.4%) |
| Arts, Entertainment & Recreation | 67 (88.2%) | 9 (11.8%) |
| Accommodation & Food Services | 194 (68.1%) | 91 (31.9%) |
| Public Administration | 68 (53.5%) | 59 (46.5%) |
| Total | 1,950 (54.2%) | 1,648 (45.8%) |
Education in Ben Lomond
School Enrollment in Ben Lomond
The most common levels of schooling among the 1,696 students in Ben Lomond are high school (517 | 30.5%), middle school (462 | 27.2%), and college / undergraduate (330 | 19.5%).
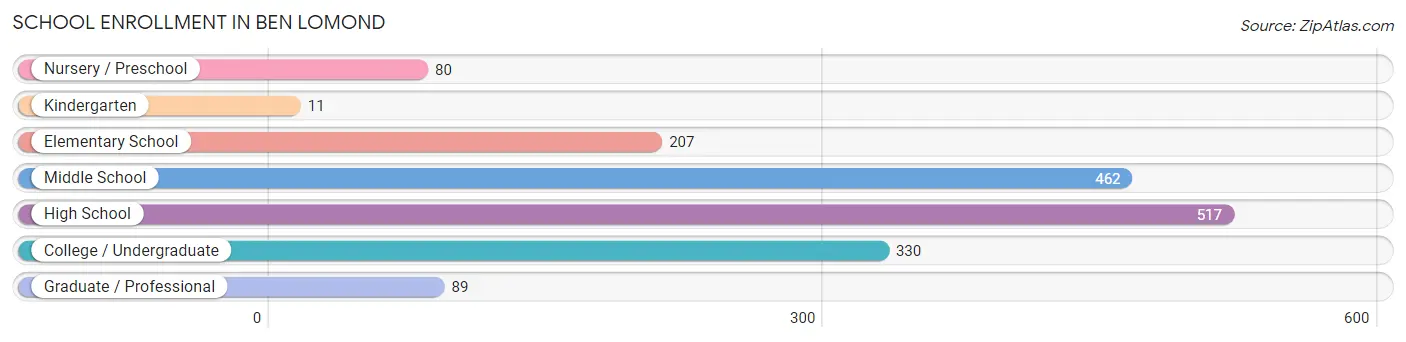
| School Level | # Students | % Students |
| Nursery / Preschool | 80 | 4.7% |
| Kindergarten | 11 | 0.6% |
| Elementary School | 207 | 12.2% |
| Middle School | 462 | 27.2% |
| High School | 517 | 30.5% |
| College / Undergraduate | 330 | 19.5% |
| Graduate / Professional | 89 | 5.2% |
| Total | 1,696 | 100.0% |
School Enrollment by Age by Funding Source in Ben Lomond
Out of a total of 1,696 students who are enrolled in schools in Ben Lomond, 287 (16.9%) attend a private institution, while the remaining 1,409 (83.1%) are enrolled in public schools. The age group of 3 to 4 year olds has the highest likelihood of being enrolled in private schools, with 49 (79.0% in the age bracket) enrolled. Conversely, the age group of 35 years and over has the lowest likelihood of being enrolled in a private school, with 148 (100.0% in the age bracket) attending a public institution.
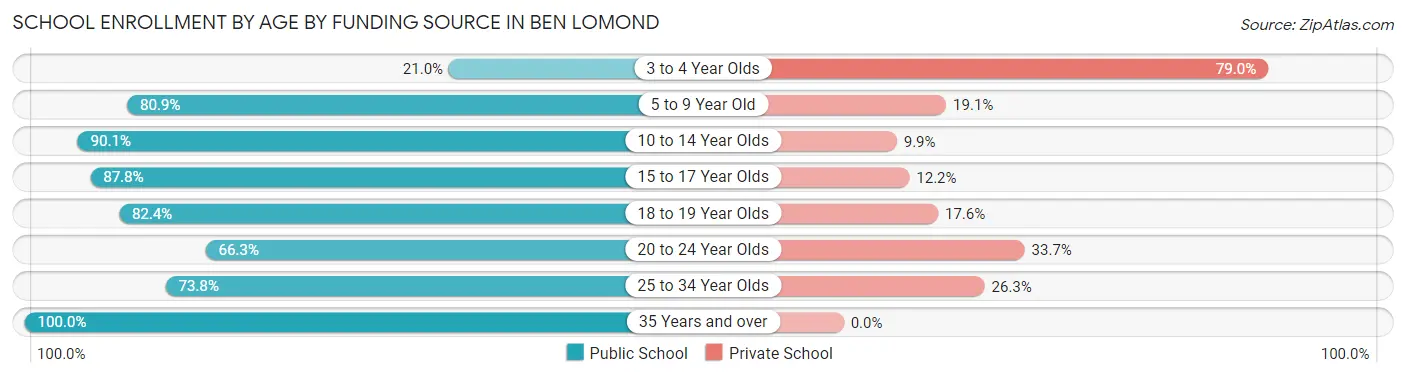
| Age Bracket | Public School | Private School |
| 3 to 4 Year Olds | 13 (21.0%) | 49 (79.0%) |
| 5 to 9 Year Old | 178 (80.9%) | 42 (19.1%) |
| 10 to 14 Year Olds | 483 (90.1%) | 53 (9.9%) |
| 15 to 17 Year Olds | 337 (87.8%) | 47 (12.2%) |
| 18 to 19 Year Olds | 75 (82.4%) | 16 (17.6%) |
| 20 to 24 Year Olds | 116 (66.3%) | 59 (33.7%) |
| 25 to 34 Year Olds | 59 (73.8%) | 21 (26.3%) |
| 35 Years and over | 148 (100.0%) | 0 (0.0%) |
| Total | 1,409 (83.1%) | 287 (16.9%) |
Educational Attainment by Field of Study in Ben Lomond
Science & technology (407 | 16.4%), business (363 | 14.7%), arts & humanities (283 | 11.4%), literature & languages (241 | 9.7%), and engineering (173 | 7.0%) are the most common fields of study among 2,476 individuals in Ben Lomond who have obtained a bachelor's degree or higher.
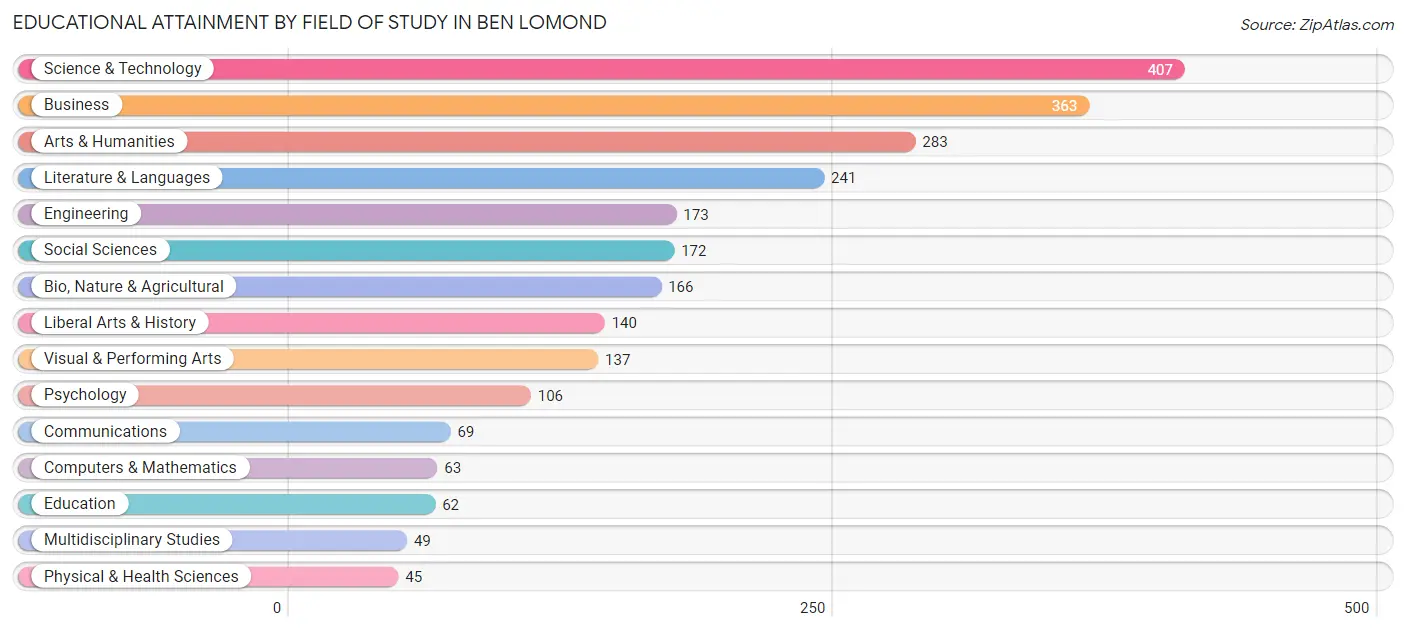
| Field of Study | # Graduates | % Graduates |
| Computers & Mathematics | 63 | 2.5% |
| Bio, Nature & Agricultural | 166 | 6.7% |
| Physical & Health Sciences | 45 | 1.8% |
| Psychology | 106 | 4.3% |
| Social Sciences | 172 | 7.0% |
| Engineering | 173 | 7.0% |
| Multidisciplinary Studies | 49 | 2.0% |
| Science & Technology | 407 | 16.4% |
| Business | 363 | 14.7% |
| Education | 62 | 2.5% |
| Literature & Languages | 241 | 9.7% |
| Liberal Arts & History | 140 | 5.7% |
| Visual & Performing Arts | 137 | 5.5% |
| Communications | 69 | 2.8% |
| Arts & Humanities | 283 | 11.4% |
| Total | 2,476 | 100.0% |
Transportation & Commute in Ben Lomond
Vehicle Availability by Sex in Ben Lomond
The most prevalent vehicle ownership categories in Ben Lomond are males with 2 vehicles (780, accounting for 40.4%) and females with 2 vehicles (667, making up 50.0%).
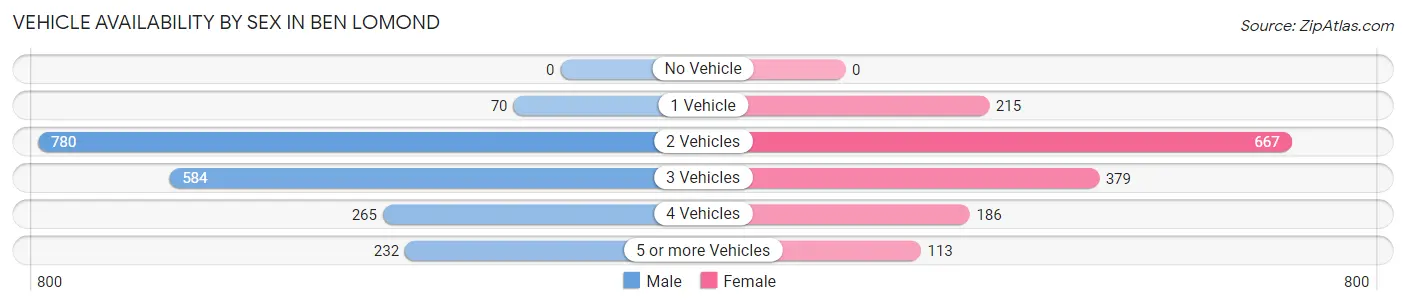
| Vehicles Available | Male | Female |
| No Vehicle | 0 (0.0%) | 0 (0.0%) |
| 1 Vehicle | 70 (3.6%) | 215 (13.8%) |
| 2 Vehicles | 780 (40.4%) | 667 (42.8%) |
| 3 Vehicles | 584 (30.2%) | 379 (24.3%) |
| 4 Vehicles | 265 (13.7%) | 186 (11.9%) |
| 5 or more Vehicles | 232 (12.0%) | 113 (7.2%) |
| Total | 1,931 (100.0%) | 1,560 (100.0%) |
Commute Time in Ben Lomond
The most frequently occuring commute durations in Ben Lomond are 20 to 24 minutes (654 commuters, 21.8%), 45 to 59 minutes (447 commuters, 14.9%), and 30 to 34 minutes (397 commuters, 13.3%).
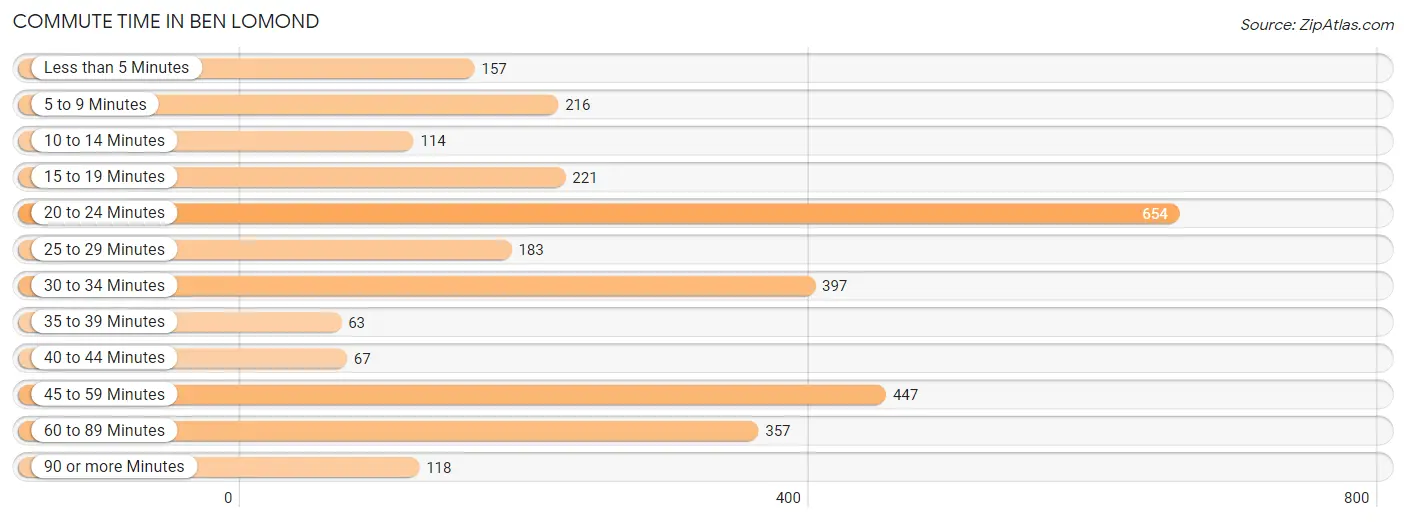
| Commute Time | # Commuters | % Commuters |
| Less than 5 Minutes | 157 | 5.2% |
| 5 to 9 Minutes | 216 | 7.2% |
| 10 to 14 Minutes | 114 | 3.8% |
| 15 to 19 Minutes | 221 | 7.4% |
| 20 to 24 Minutes | 654 | 21.8% |
| 25 to 29 Minutes | 183 | 6.1% |
| 30 to 34 Minutes | 397 | 13.3% |
| 35 to 39 Minutes | 63 | 2.1% |
| 40 to 44 Minutes | 67 | 2.2% |
| 45 to 59 Minutes | 447 | 14.9% |
| 60 to 89 Minutes | 357 | 11.9% |
| 90 or more Minutes | 118 | 3.9% |
Commute Time by Sex in Ben Lomond
The most common commute times in Ben Lomond are 45 to 59 minutes (348 commuters, 20.6%) for males and 20 to 24 minutes (336 commuters, 25.7%) for females.
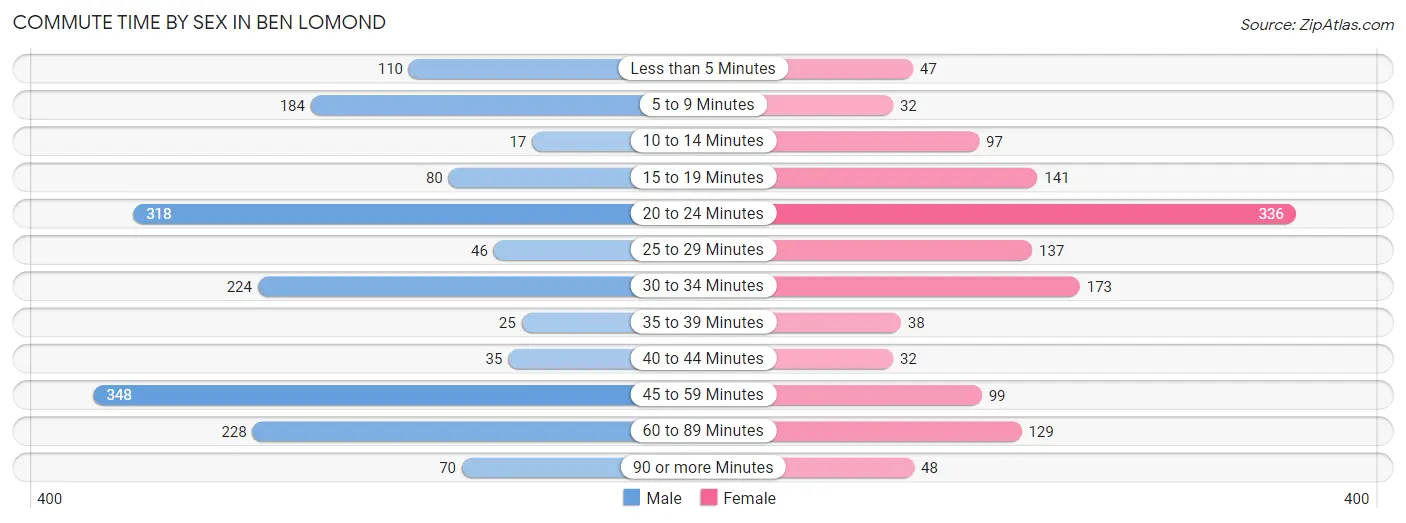
| Commute Time | Male | Female |
| Less than 5 Minutes | 110 (6.5%) | 47 (3.6%) |
| 5 to 9 Minutes | 184 (10.9%) | 32 (2.4%) |
| 10 to 14 Minutes | 17 (1.0%) | 97 (7.4%) |
| 15 to 19 Minutes | 80 (4.8%) | 141 (10.8%) |
| 20 to 24 Minutes | 318 (18.9%) | 336 (25.7%) |
| 25 to 29 Minutes | 46 (2.7%) | 137 (10.5%) |
| 30 to 34 Minutes | 224 (13.3%) | 173 (13.2%) |
| 35 to 39 Minutes | 25 (1.5%) | 38 (2.9%) |
| 40 to 44 Minutes | 35 (2.1%) | 32 (2.4%) |
| 45 to 59 Minutes | 348 (20.6%) | 99 (7.6%) |
| 60 to 89 Minutes | 228 (13.5%) | 129 (9.9%) |
| 90 or more Minutes | 70 (4.2%) | 48 (3.7%) |
Time of Departure to Work by Sex in Ben Lomond
The most frequent times of departure to work in Ben Lomond are 8:00 AM to 8:29 AM (251, 14.9%) for males and 7:00 AM to 7:29 AM (255, 19.5%) for females.
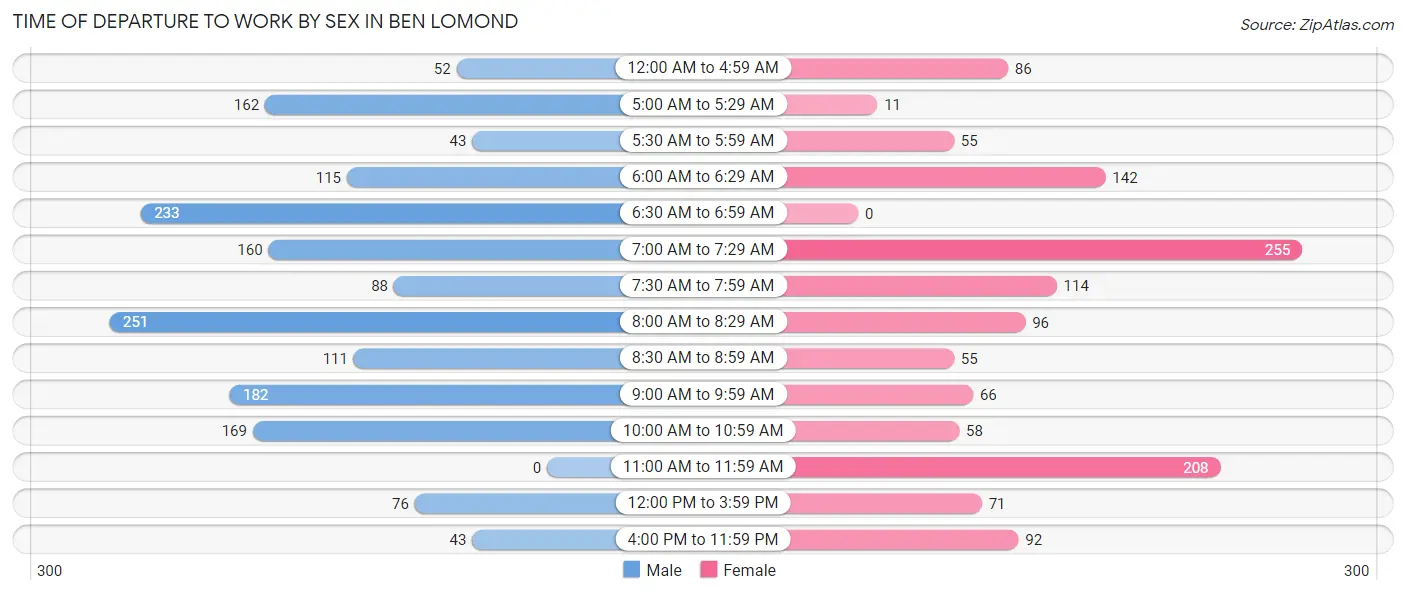
| Time of Departure | Male | Female |
| 12:00 AM to 4:59 AM | 52 (3.1%) | 86 (6.6%) |
| 5:00 AM to 5:29 AM | 162 (9.6%) | 11 (0.8%) |
| 5:30 AM to 5:59 AM | 43 (2.5%) | 55 (4.2%) |
| 6:00 AM to 6:29 AM | 115 (6.8%) | 142 (10.8%) |
| 6:30 AM to 6:59 AM | 233 (13.8%) | 0 (0.0%) |
| 7:00 AM to 7:29 AM | 160 (9.5%) | 255 (19.5%) |
| 7:30 AM to 7:59 AM | 88 (5.2%) | 114 (8.7%) |
| 8:00 AM to 8:29 AM | 251 (14.9%) | 96 (7.3%) |
| 8:30 AM to 8:59 AM | 111 (6.6%) | 55 (4.2%) |
| 9:00 AM to 9:59 AM | 182 (10.8%) | 66 (5.0%) |
| 10:00 AM to 10:59 AM | 169 (10.0%) | 58 (4.4%) |
| 11:00 AM to 11:59 AM | 0 (0.0%) | 208 (15.9%) |
| 12:00 PM to 3:59 PM | 76 (4.5%) | 71 (5.4%) |
| 4:00 PM to 11:59 PM | 43 (2.5%) | 92 (7.0%) |
| Total | 1,685 (100.0%) | 1,309 (100.0%) |
Housing Occupancy in Ben Lomond
Occupancy by Ownership in Ben Lomond
Of the total 2,639 dwellings in Ben Lomond, owner-occupied units account for 1,825 (69.2%), while renter-occupied units make up 814 (30.8%).
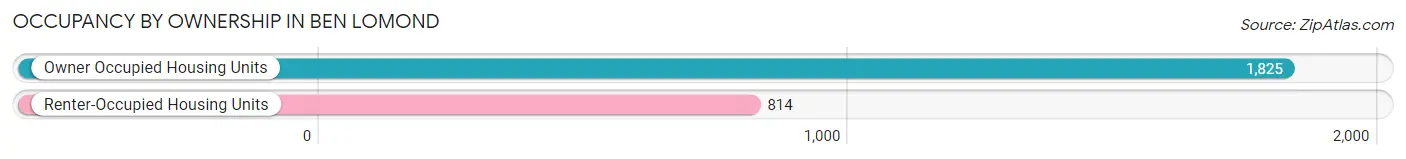
| Occupancy | # Housing Units | % Housing Units |
| Owner Occupied Housing Units | 1,825 | 69.2% |
| Renter-Occupied Housing Units | 814 | 30.8% |
| Total Occupied Housing Units | 2,639 | 100.0% |
Occupancy by Household Size in Ben Lomond
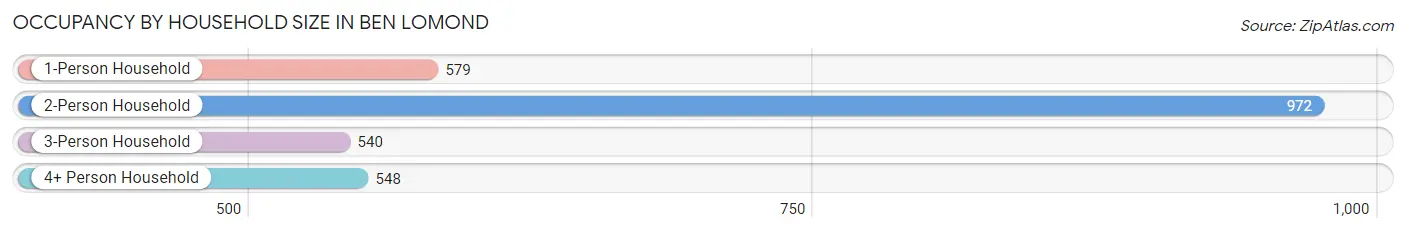
| Household Size | # Housing Units | % Housing Units |
| 1-Person Household | 579 | 21.9% |
| 2-Person Household | 972 | 36.8% |
| 3-Person Household | 540 | 20.5% |
| 4+ Person Household | 548 | 20.8% |
| Total Housing Units | 2,639 | 100.0% |
Occupancy by Ownership by Household Size in Ben Lomond
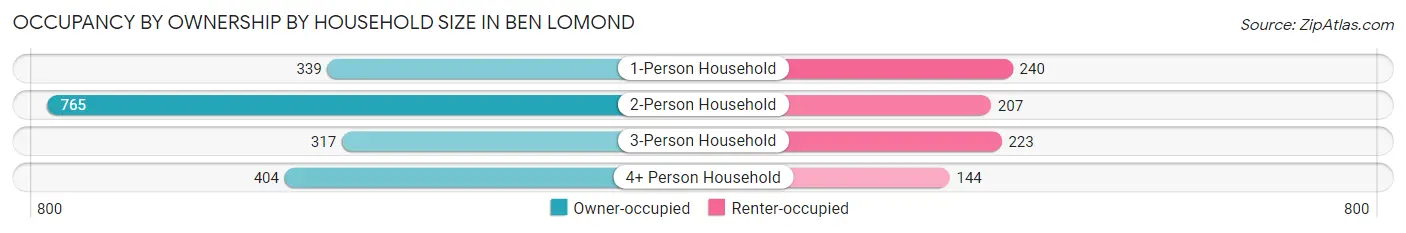
| Household Size | Owner-occupied | Renter-occupied |
| 1-Person Household | 339 (58.6%) | 240 (41.4%) |
| 2-Person Household | 765 (78.7%) | 207 (21.3%) |
| 3-Person Household | 317 (58.7%) | 223 (41.3%) |
| 4+ Person Household | 404 (73.7%) | 144 (26.3%) |
| Total Housing Units | 1,825 (69.2%) | 814 (30.8%) |
Occupancy by Educational Attainment in Ben Lomond
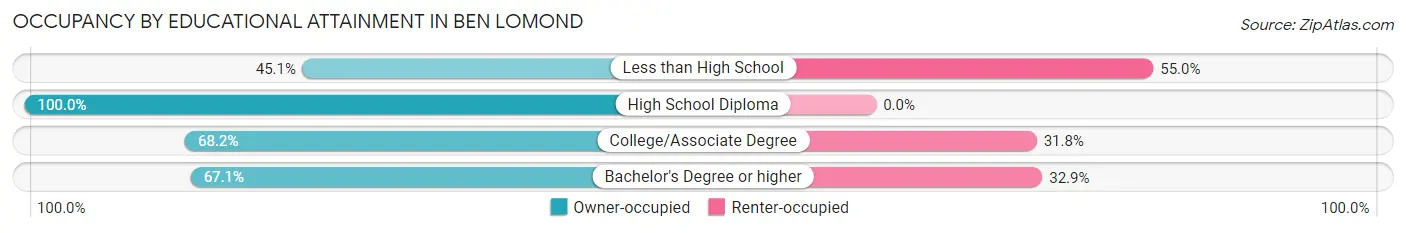
| Household Size | Owner-occupied | Renter-occupied |
| Less than High School | 50 (45.1%) | 61 (54.9%) |
| High School Diploma | 210 (100.0%) | 0 (0.0%) |
| College/Associate Degree | 649 (68.2%) | 303 (31.8%) |
| Bachelor's Degree or higher | 916 (67.1%) | 450 (32.9%) |
Occupancy by Age of Householder in Ben Lomond
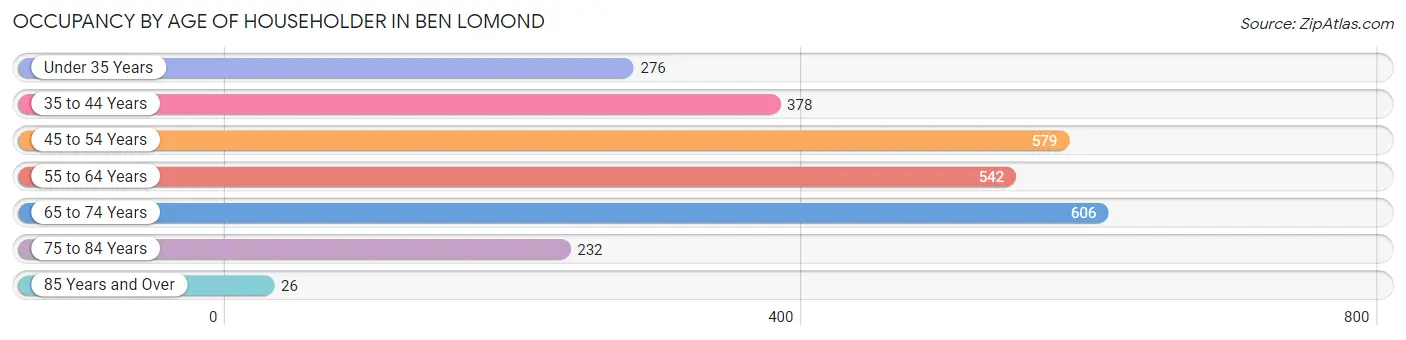
| Age Bracket | # Households | % Households |
| Under 35 Years | 276 | 10.5% |
| 35 to 44 Years | 378 | 14.3% |
| 45 to 54 Years | 579 | 21.9% |
| 55 to 64 Years | 542 | 20.5% |
| 65 to 74 Years | 606 | 23.0% |
| 75 to 84 Years | 232 | 8.8% |
| 85 Years and Over | 26 | 1.0% |
| Total | 2,639 | 100.0% |
Housing Finances in Ben Lomond
Median Income by Occupancy in Ben Lomond
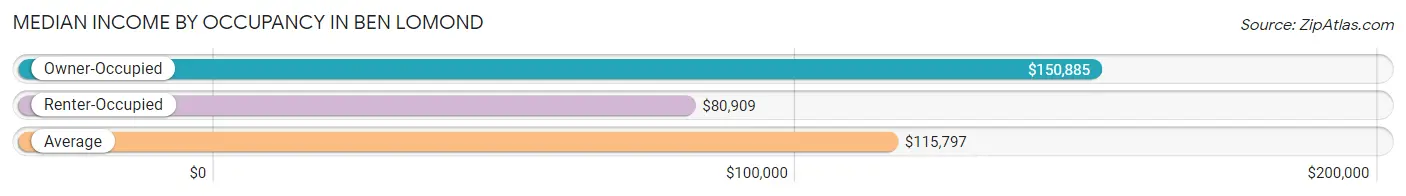
| Occupancy Type | # Households | Median Income |
| Owner-Occupied | 1,825 (69.2%) | $150,885 |
| Renter-Occupied | 814 (30.8%) | $80,909 |
| Average | 2,639 (100.0%) | $115,797 |
Occupancy by Householder Income Bracket in Ben Lomond
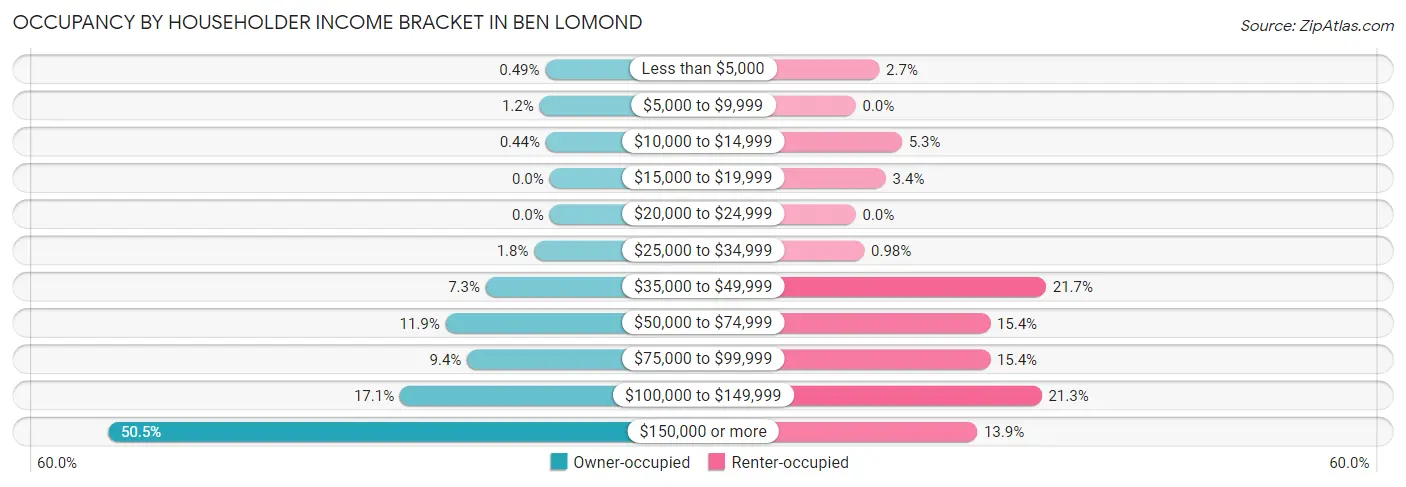
| Income Bracket | Owner-occupied | Renter-occupied |
| Less than $5,000 | 9 (0.5%) | 22 (2.7%) |
| $5,000 to $9,999 | 21 (1.1%) | 0 (0.0%) |
| $10,000 to $14,999 | 8 (0.4%) | 43 (5.3%) |
| $15,000 to $19,999 | 0 (0.0%) | 28 (3.4%) |
| $20,000 to $24,999 | 0 (0.0%) | 0 (0.0%) |
| $25,000 to $34,999 | 32 (1.8%) | 8 (1.0%) |
| $35,000 to $49,999 | 133 (7.3%) | 177 (21.7%) |
| $50,000 to $74,999 | 217 (11.9%) | 125 (15.4%) |
| $75,000 to $99,999 | 172 (9.4%) | 125 (15.4%) |
| $100,000 to $149,999 | 312 (17.1%) | 173 (21.2%) |
| $150,000 or more | 921 (50.5%) | 113 (13.9%) |
| Total | 1,825 (100.0%) | 814 (100.0%) |
Monthly Housing Cost Tiers in Ben Lomond
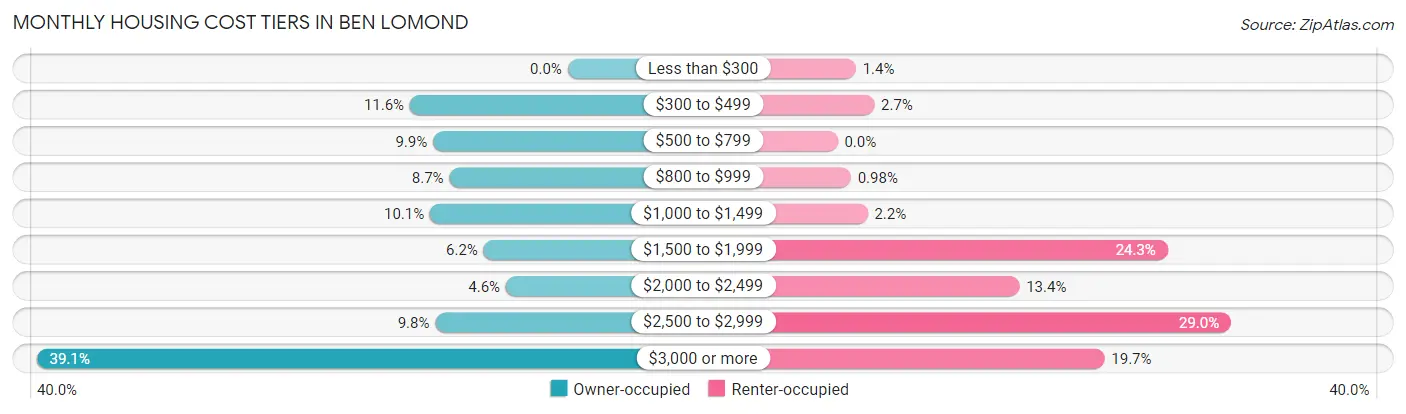
| Monthly Cost | Owner-occupied | Renter-occupied |
| Less than $300 | 0 (0.0%) | 11 (1.3%) |
| $300 to $499 | 212 (11.6%) | 22 (2.7%) |
| $500 to $799 | 181 (9.9%) | 0 (0.0%) |
| $800 to $999 | 159 (8.7%) | 8 (1.0%) |
| $1,000 to $1,499 | 185 (10.1%) | 18 (2.2%) |
| $1,500 to $1,999 | 113 (6.2%) | 198 (24.3%) |
| $2,000 to $2,499 | 83 (4.5%) | 109 (13.4%) |
| $2,500 to $2,999 | 178 (9.8%) | 236 (29.0%) |
| $3,000 or more | 714 (39.1%) | 160 (19.7%) |
| Total | 1,825 (100.0%) | 814 (100.0%) |
Physical Housing Characteristics in Ben Lomond
Housing Structures in Ben Lomond
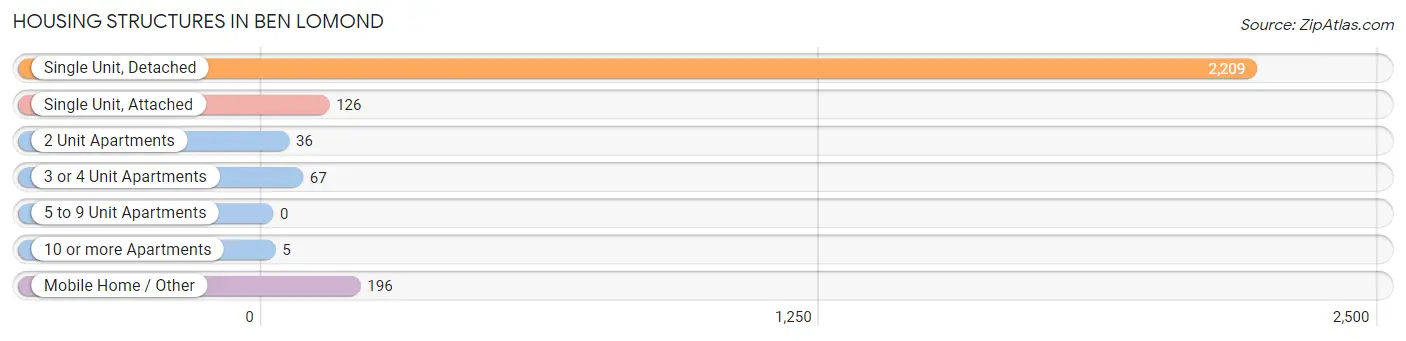
| Structure Type | # Housing Units | % Housing Units |
| Single Unit, Detached | 2,209 | 83.7% |
| Single Unit, Attached | 126 | 4.8% |
| 2 Unit Apartments | 36 | 1.4% |
| 3 or 4 Unit Apartments | 67 | 2.5% |
| 5 to 9 Unit Apartments | 0 | 0.0% |
| 10 or more Apartments | 5 | 0.2% |
| Mobile Home / Other | 196 | 7.4% |
| Total | 2,639 | 100.0% |
Housing Structures by Occupancy in Ben Lomond
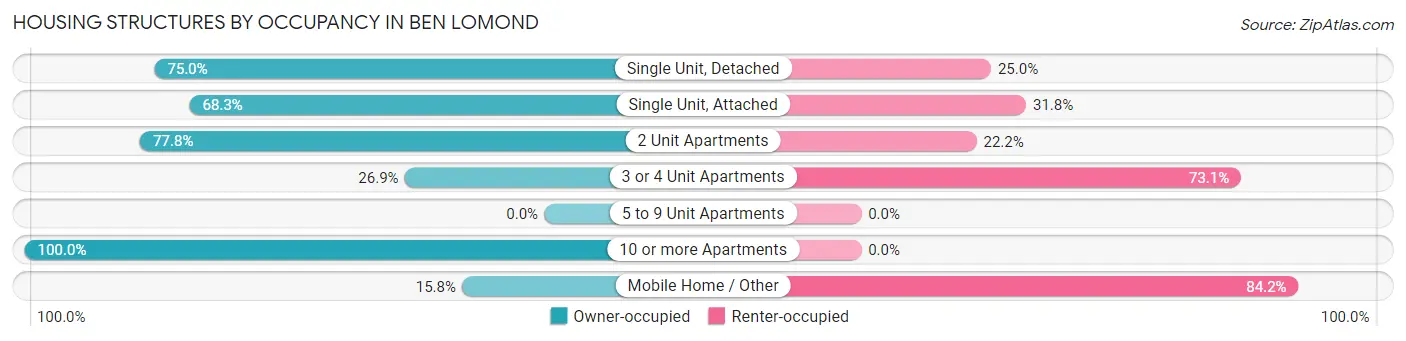
| Structure Type | Owner-occupied | Renter-occupied |
| Single Unit, Detached | 1,657 (75.0%) | 552 (25.0%) |
| Single Unit, Attached | 86 (68.2%) | 40 (31.8%) |
| 2 Unit Apartments | 28 (77.8%) | 8 (22.2%) |
| 3 or 4 Unit Apartments | 18 (26.9%) | 49 (73.1%) |
| 5 to 9 Unit Apartments | 0 (0.0%) | 0 (0.0%) |
| 10 or more Apartments | 5 (100.0%) | 0 (0.0%) |
| Mobile Home / Other | 31 (15.8%) | 165 (84.2%) |
| Total | 1,825 (69.2%) | 814 (30.8%) |
Housing Structures by Number of Rooms in Ben Lomond
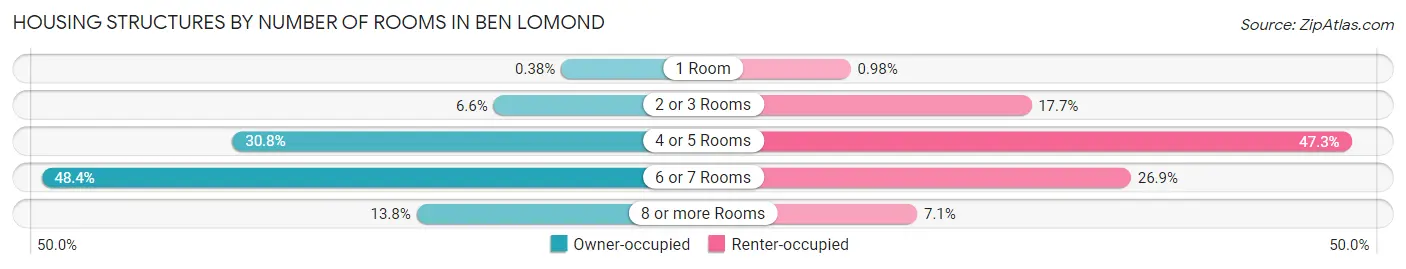
| Number of Rooms | Owner-occupied | Renter-occupied |
| 1 Room | 7 (0.4%) | 8 (1.0%) |
| 2 or 3 Rooms | 121 (6.6%) | 144 (17.7%) |
| 4 or 5 Rooms | 562 (30.8%) | 385 (47.3%) |
| 6 or 7 Rooms | 884 (48.4%) | 219 (26.9%) |
| 8 or more Rooms | 251 (13.8%) | 58 (7.1%) |
| Total | 1,825 (100.0%) | 814 (100.0%) |
Housing Structure by Heating Type in Ben Lomond
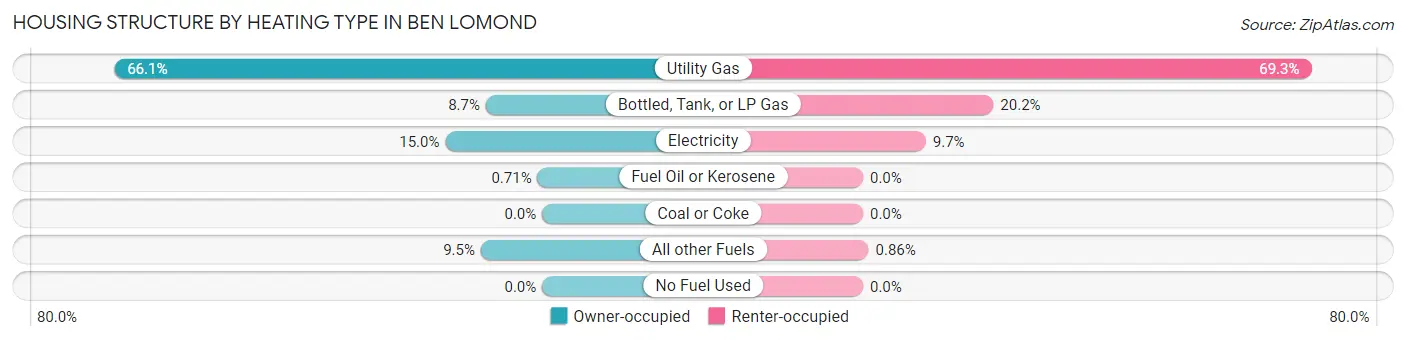
| Heating Type | Owner-occupied | Renter-occupied |
| Utility Gas | 1,207 (66.1%) | 564 (69.3%) |
| Bottled, Tank, or LP Gas | 159 (8.7%) | 164 (20.2%) |
| Electricity | 273 (15.0%) | 79 (9.7%) |
| Fuel Oil or Kerosene | 13 (0.7%) | 0 (0.0%) |
| Coal or Coke | 0 (0.0%) | 0 (0.0%) |
| All other Fuels | 173 (9.5%) | 7 (0.9%) |
| No Fuel Used | 0 (0.0%) | 0 (0.0%) |
| Total | 1,825 (100.0%) | 814 (100.0%) |
Household Vehicle Usage in Ben Lomond
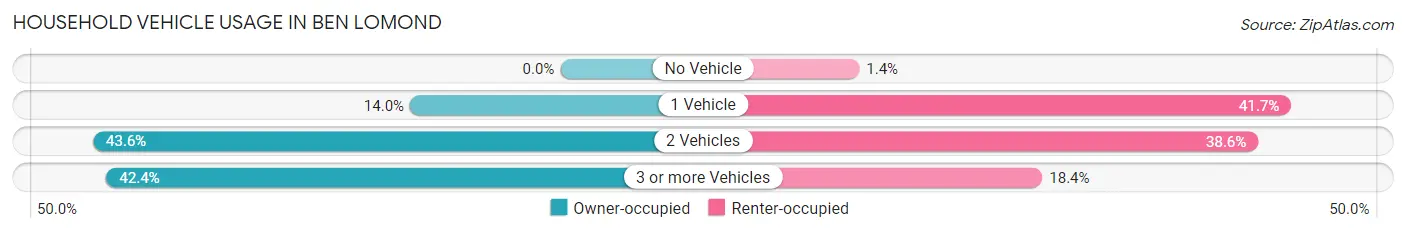
| Vehicles per Household | Owner-occupied | Renter-occupied |
| No Vehicle | 0 (0.0%) | 11 (1.3%) |
| 1 Vehicle | 256 (14.0%) | 339 (41.6%) |
| 2 Vehicles | 796 (43.6%) | 314 (38.6%) |
| 3 or more Vehicles | 773 (42.4%) | 150 (18.4%) |
| Total | 1,825 (100.0%) | 814 (100.0%) |
Real Estate & Mortgages in Ben Lomond
Real Estate and Mortgage Overview in Ben Lomond
| Characteristic | Without Mortgage | With Mortgage |
| Housing Units | 642 | 1,183 |
| Median Property Value | $871,400 | $914,800 |
| Median Household Income | $93,490 | $784 |
| Monthly Housing Costs | $684 | $714 |
| Real Estate Taxes | $3,074 | $0 |
Property Value by Mortgage Status in Ben Lomond
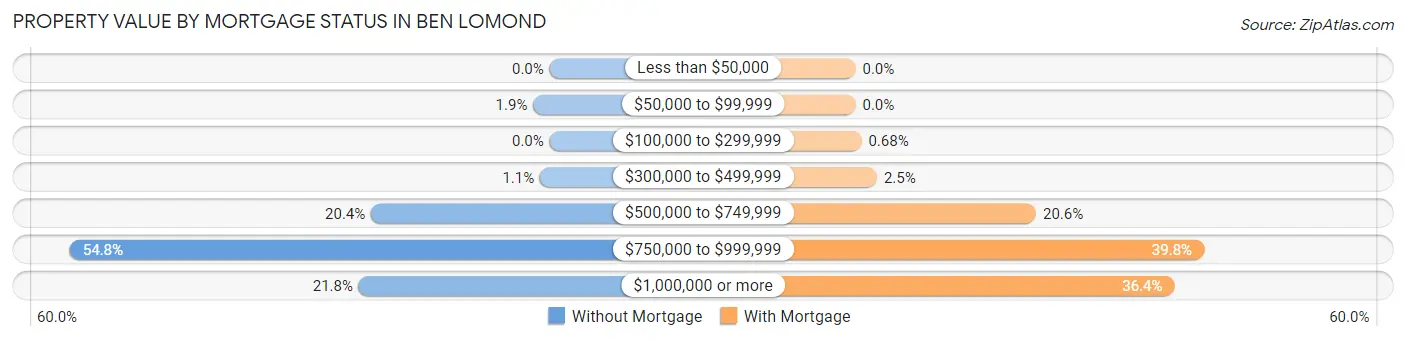
| Property Value | Without Mortgage | With Mortgage |
| Less than $50,000 | 0 (0.0%) | 0 (0.0%) |
| $50,000 to $99,999 | 12 (1.9%) | 0 (0.0%) |
| $100,000 to $299,999 | 0 (0.0%) | 8 (0.7%) |
| $300,000 to $499,999 | 7 (1.1%) | 29 (2.5%) |
| $500,000 to $749,999 | 131 (20.4%) | 244 (20.6%) |
| $750,000 to $999,999 | 352 (54.8%) | 471 (39.8%) |
| $1,000,000 or more | 140 (21.8%) | 431 (36.4%) |
| Total | 642 (100.0%) | 1,183 (100.0%) |
Household Income by Mortgage Status in Ben Lomond
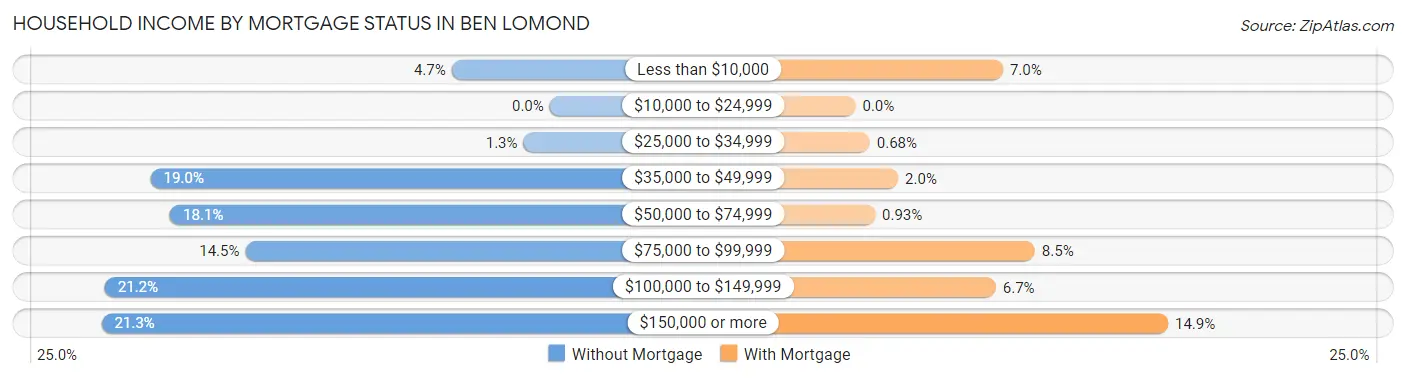
| Household Income | Without Mortgage | With Mortgage |
| Less than $10,000 | 30 (4.7%) | 83 (7.0%) |
| $10,000 to $24,999 | 0 (0.0%) | 0 (0.0%) |
| $25,000 to $34,999 | 8 (1.3%) | 8 (0.7%) |
| $35,000 to $49,999 | 122 (19.0%) | 24 (2.0%) |
| $50,000 to $74,999 | 116 (18.1%) | 11 (0.9%) |
| $75,000 to $99,999 | 93 (14.5%) | 101 (8.5%) |
| $100,000 to $149,999 | 136 (21.2%) | 79 (6.7%) |
| $150,000 or more | 137 (21.3%) | 176 (14.9%) |
| Total | 642 (100.0%) | 1,183 (100.0%) |
Property Value to Household Income Ratio in Ben Lomond
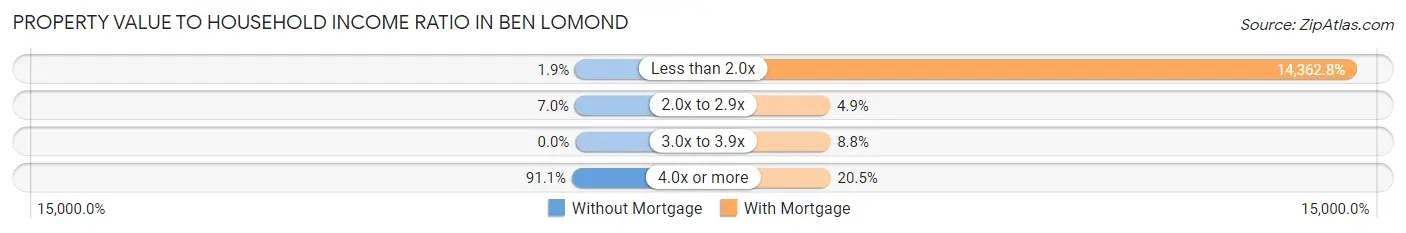
| Value-to-Income Ratio | Without Mortgage | With Mortgage |
| Less than 2.0x | 12 (1.9%) | 169,912 (14,362.8%) |
| 2.0x to 2.9x | 45 (7.0%) | 58 (4.9%) |
| 3.0x to 3.9x | 0 (0.0%) | 104 (8.8%) |
| 4.0x or more | 585 (91.1%) | 242 (20.5%) |
| Total | 642 (100.0%) | 1,183 (100.0%) |
Real Estate Taxes by Mortgage Status in Ben Lomond
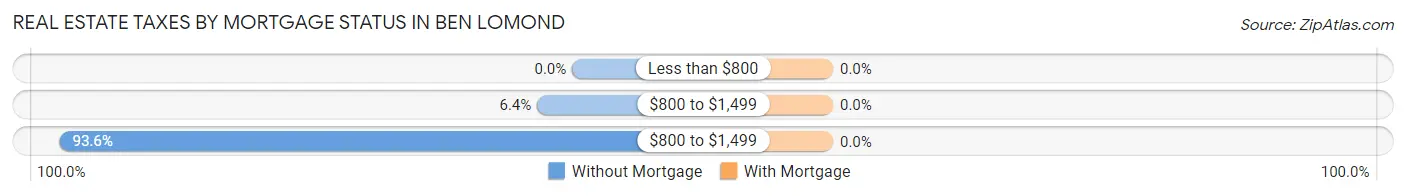
| Property Taxes | Without Mortgage | With Mortgage |
| Less than $800 | 0 (0.0%) | 0 (0.0%) |
| $800 to $1,499 | 41 (6.4%) | 0 (0.0%) |
| $800 to $1,499 | 601 (93.6%) | 0 (0.0%) |
| Total | 642 (100.0%) | 1,183 (100.0%) |
Health & Disability in Ben Lomond
Health Insurance Coverage by Age in Ben Lomond
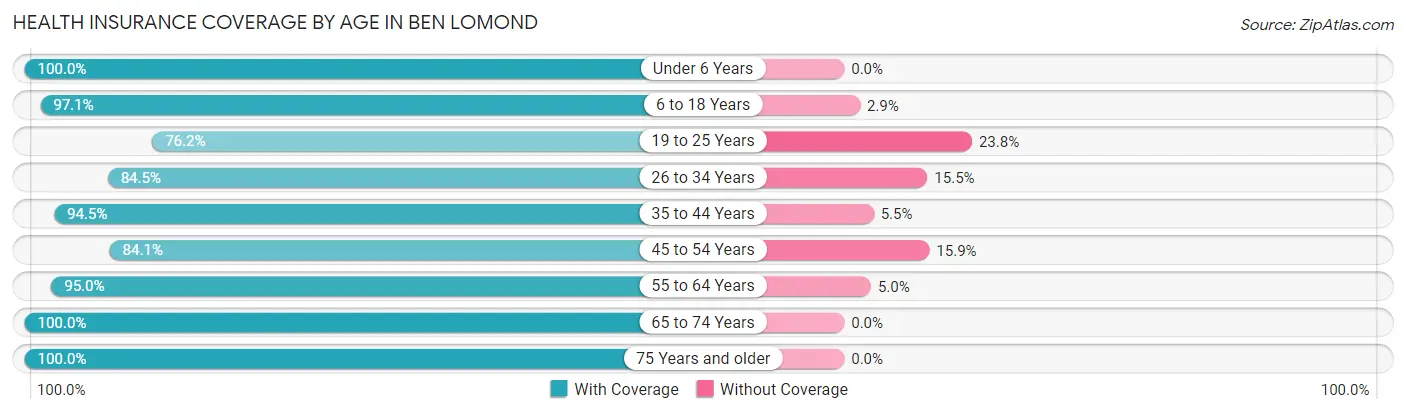
| Age Bracket | With Coverage | Without Coverage |
| Under 6 Years | 499 (100.0%) | 0 (0.0%) |
| 6 to 18 Years | 1,194 (97.1%) | 36 (2.9%) |
| 19 to 25 Years | 400 (76.2%) | 125 (23.8%) |
| 26 to 34 Years | 627 (84.5%) | 115 (15.5%) |
| 35 to 44 Years | 620 (94.5%) | 36 (5.5%) |
| 45 to 54 Years | 864 (84.1%) | 163 (15.9%) |
| 55 to 64 Years | 1,107 (95.0%) | 58 (5.0%) |
| 65 to 74 Years | 1,017 (100.0%) | 0 (0.0%) |
| 75 Years and older | 386 (100.0%) | 0 (0.0%) |
| Total | 6,714 (92.6%) | 533 (7.3%) |
Health Insurance Coverage by Citizenship Status in Ben Lomond
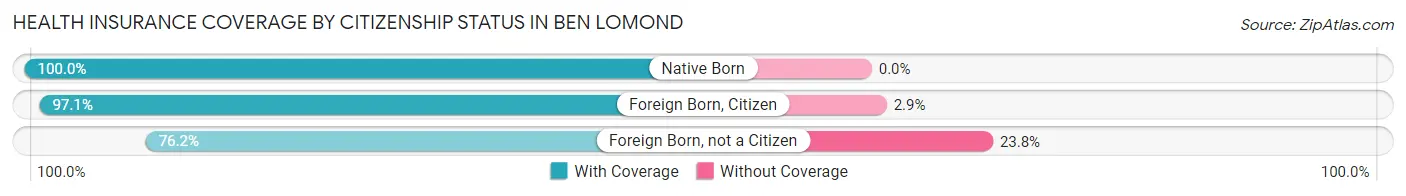
| Citizenship Status | With Coverage | Without Coverage |
| Native Born | 499 (100.0%) | 0 (0.0%) |
| Foreign Born, Citizen | 1,194 (97.1%) | 36 (2.9%) |
| Foreign Born, not a Citizen | 400 (76.2%) | 125 (23.8%) |
Health Insurance Coverage by Household Income in Ben Lomond
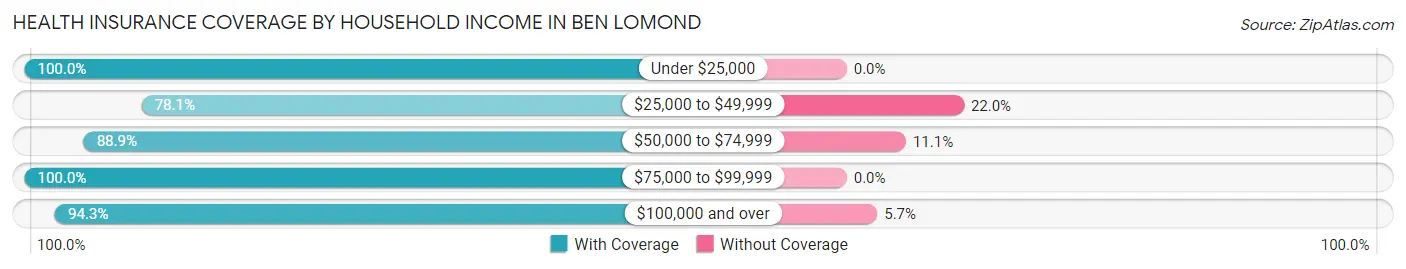
| Household Income | With Coverage | Without Coverage |
| Under $25,000 | 131 (100.0%) | 0 (0.0%) |
| $25,000 to $49,999 | 736 (78.0%) | 207 (22.0%) |
| $50,000 to $74,999 | 449 (88.9%) | 56 (11.1%) |
| $75,000 to $99,999 | 811 (100.0%) | 0 (0.0%) |
| $100,000 and over | 4,455 (94.3%) | 270 (5.7%) |
Public vs Private Health Insurance Coverage by Age in Ben Lomond
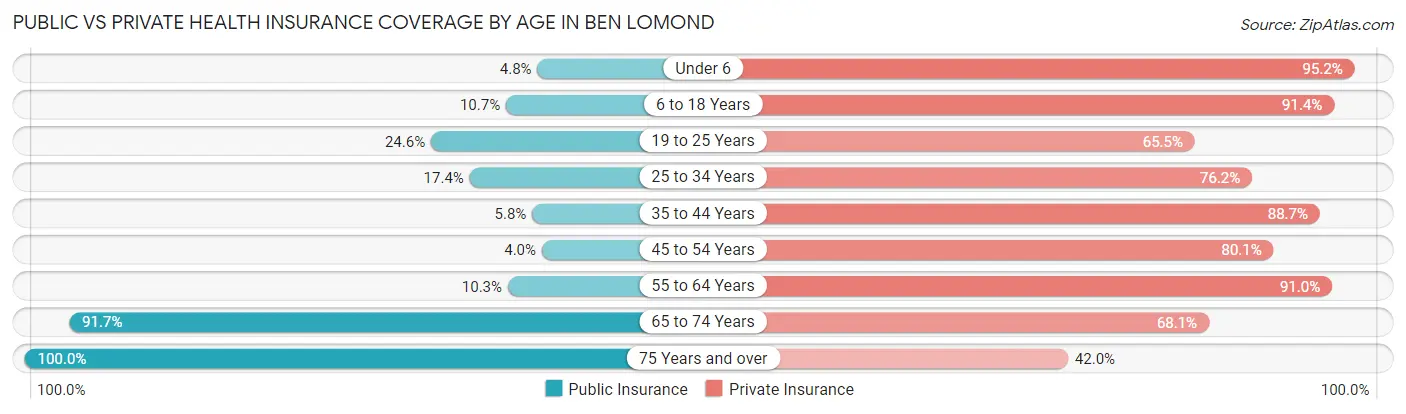
| Age Bracket | Public Insurance | Private Insurance |
| Under 6 | 24 (4.8%) | 475 (95.2%) |
| 6 to 18 Years | 131 (10.6%) | 1,124 (91.4%) |
| 19 to 25 Years | 129 (24.6%) | 344 (65.5%) |
| 25 to 34 Years | 129 (17.4%) | 565 (76.1%) |
| 35 to 44 Years | 38 (5.8%) | 582 (88.7%) |
| 45 to 54 Years | 41 (4.0%) | 823 (80.1%) |
| 55 to 64 Years | 120 (10.3%) | 1,060 (91.0%) |
| 65 to 74 Years | 933 (91.7%) | 693 (68.1%) |
| 75 Years and over | 386 (100.0%) | 162 (42.0%) |
| Total | 1,931 (26.7%) | 5,828 (80.4%) |
Disability Status by Sex by Age in Ben Lomond
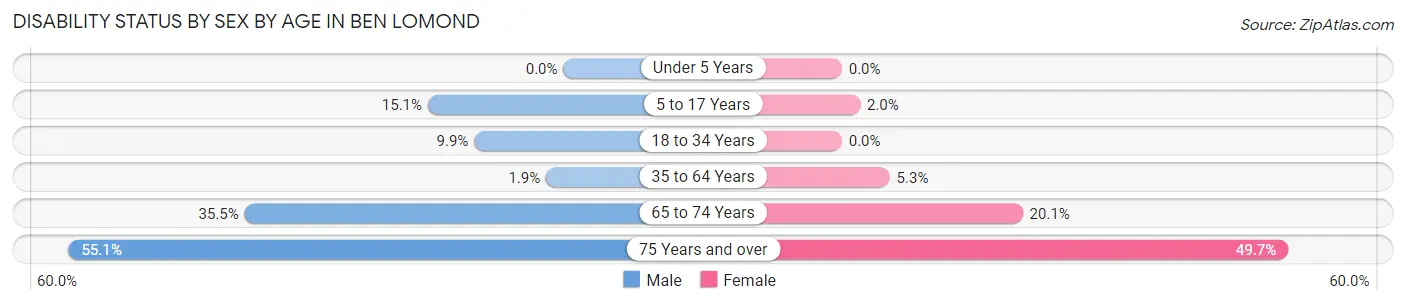
| Age Bracket | Male | Female |
| Under 5 Years | 0 (0.0%) | 0 (0.0%) |
| 5 to 17 Years | 70 (15.1%) | 14 (2.0%) |
| 18 to 34 Years | 82 (9.9%) | 0 (0.0%) |
| 35 to 64 Years | 25 (1.9%) | 83 (5.3%) |
| 65 to 74 Years | 213 (35.5%) | 84 (20.1%) |
| 75 Years and over | 124 (55.1%) | 80 (49.7%) |
Disability Class by Sex by Age in Ben Lomond
Disability Class: Hearing Difficulty
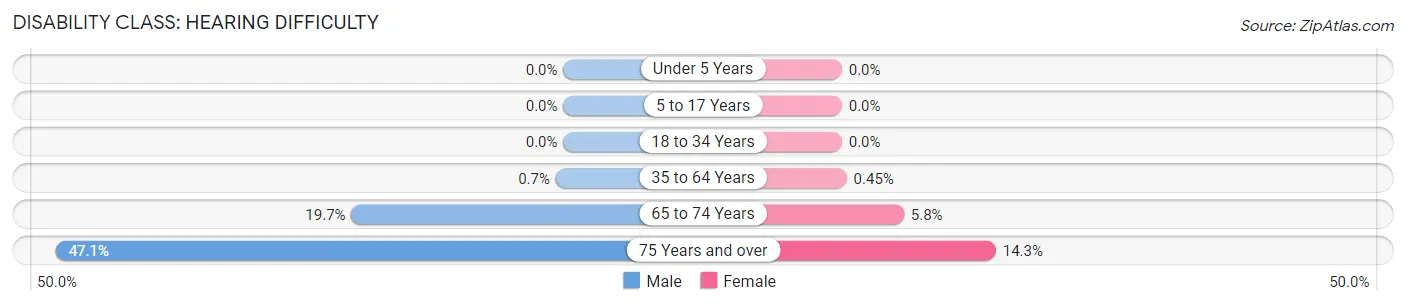
| Age Bracket | Male | Female |
| Under 5 Years | 0 (0.0%) | 0 (0.0%) |
| 5 to 17 Years | 0 (0.0%) | 0 (0.0%) |
| 18 to 34 Years | 0 (0.0%) | 0 (0.0%) |
| 35 to 64 Years | 9 (0.7%) | 7 (0.4%) |
| 65 to 74 Years | 118 (19.7%) | 24 (5.8%) |
| 75 Years and over | 106 (47.1%) | 23 (14.3%) |
Disability Class: Vision Difficulty
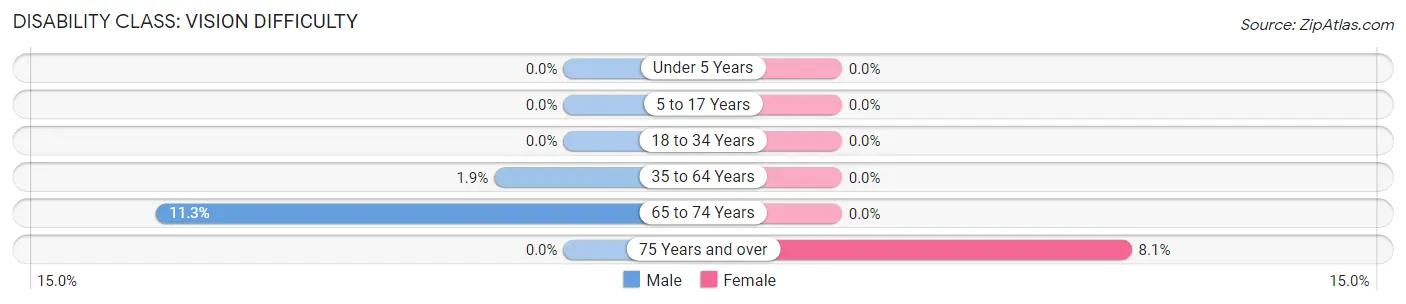
| Age Bracket | Male | Female |
| Under 5 Years | 0 (0.0%) | 0 (0.0%) |
| 5 to 17 Years | 0 (0.0%) | 0 (0.0%) |
| 18 to 34 Years | 0 (0.0%) | 0 (0.0%) |
| 35 to 64 Years | 25 (1.9%) | 0 (0.0%) |
| 65 to 74 Years | 68 (11.3%) | 0 (0.0%) |
| 75 Years and over | 0 (0.0%) | 13 (8.1%) |
Disability Class: Cognitive Difficulty
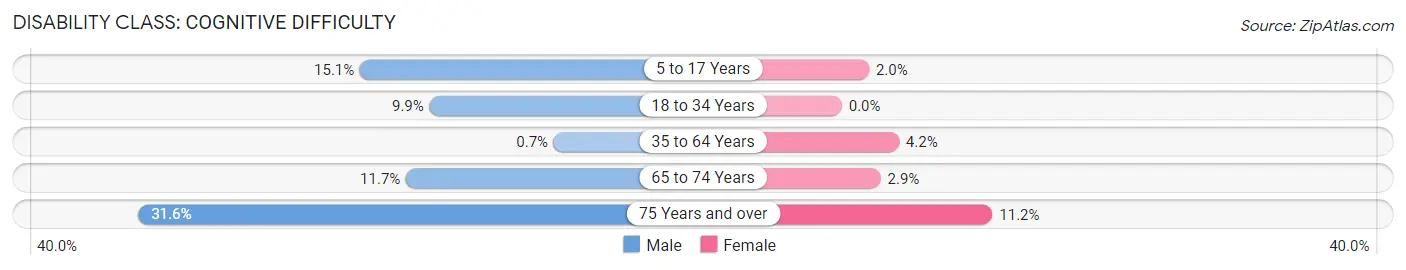
| Age Bracket | Male | Female |
| 5 to 17 Years | 70 (15.1%) | 14 (2.0%) |
| 18 to 34 Years | 82 (9.9%) | 0 (0.0%) |
| 35 to 64 Years | 9 (0.7%) | 66 (4.2%) |
| 65 to 74 Years | 70 (11.7%) | 12 (2.9%) |
| 75 Years and over | 71 (31.6%) | 18 (11.2%) |
Disability Class: Ambulatory Difficulty
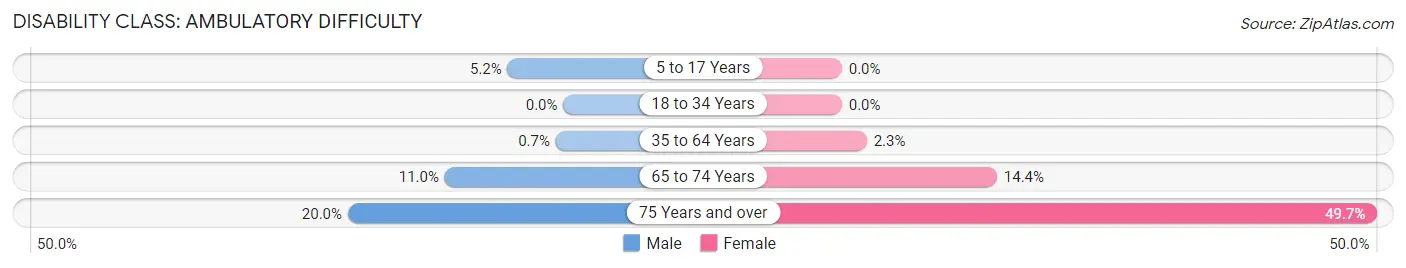
| Age Bracket | Male | Female |
| 5 to 17 Years | 24 (5.2%) | 0 (0.0%) |
| 18 to 34 Years | 0 (0.0%) | 0 (0.0%) |
| 35 to 64 Years | 9 (0.7%) | 36 (2.3%) |
| 65 to 74 Years | 66 (11.0%) | 60 (14.4%) |
| 75 Years and over | 45 (20.0%) | 80 (49.7%) |
Disability Class: Self-Care Difficulty
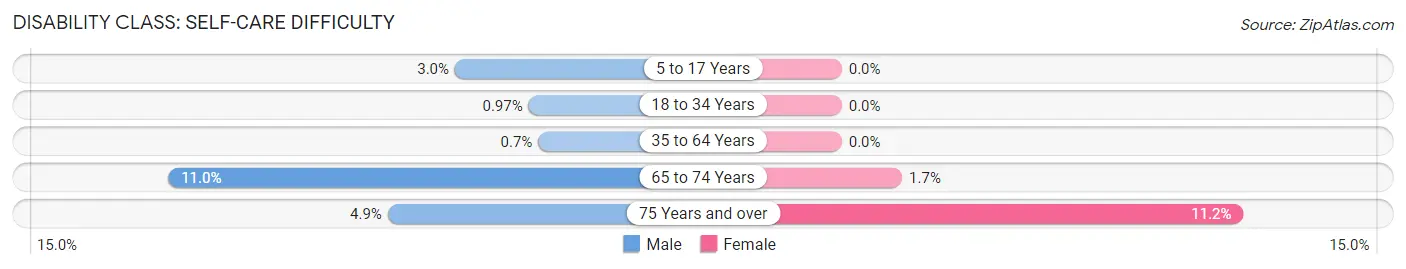
| Age Bracket | Male | Female |
| 5 to 17 Years | 14 (3.0%) | 0 (0.0%) |
| 18 to 34 Years | 8 (1.0%) | 0 (0.0%) |
| 35 to 64 Years | 9 (0.7%) | 0 (0.0%) |
| 65 to 74 Years | 66 (11.0%) | 7 (1.7%) |
| 75 Years and over | 11 (4.9%) | 18 (11.2%) |
Technology Access in Ben Lomond
Computing Device Access in Ben Lomond
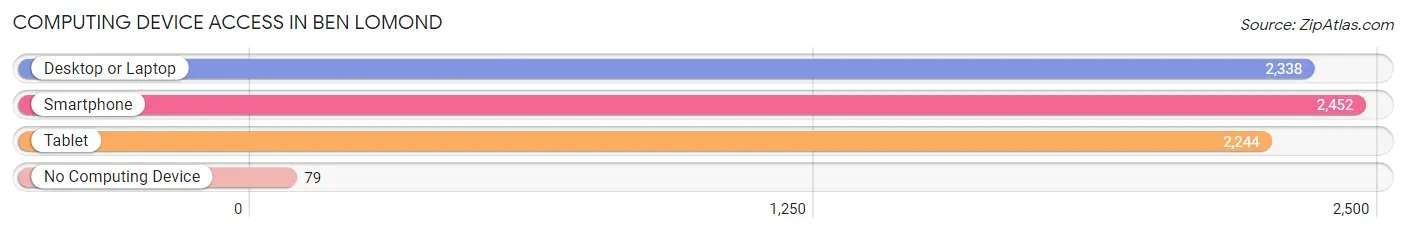
| Device Type | # Households | % Households |
| Desktop or Laptop | 2,338 | 88.6% |
| Smartphone | 2,452 | 92.9% |
| Tablet | 2,244 | 85.0% |
| No Computing Device | 79 | 3.0% |
| Total | 2,639 | 100.0% |
Internet Access in Ben Lomond
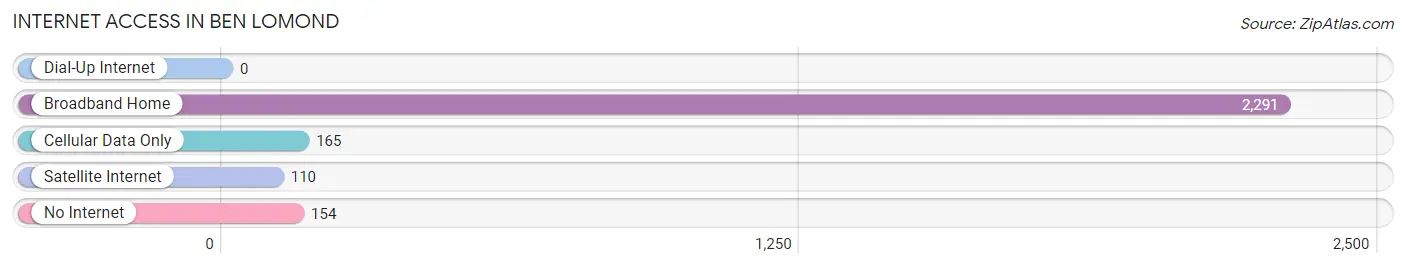
| Internet Type | # Households | % Households |
| Dial-Up Internet | 0 | 0.0% |
| Broadband Home | 2,291 | 86.8% |
| Cellular Data Only | 165 | 6.2% |
| Satellite Internet | 110 | 4.2% |
| No Internet | 154 | 5.8% |
| Total | 2,639 | 100.0% |
Ben Lomond Summary
Ben Lomond is a census-designated place (CDP) in Santa Cruz County, California, United States. The population was 5,387 at the 2010 census. It is located in the San Lorenzo Valley, about 9 miles (14 km) northwest of the county seat, Santa Cruz.
History
Ben Lomond was originally inhabited by the Ohlone people, who lived in the area for thousands of years. The first European settlers arrived in the area in the late 1700s, and the town was officially founded in 1856. The town was named after Ben Lomond Mountain, which was named after the mountain of the same name in Scotland.
The town was originally a logging and lumber town, and the lumber industry was the main source of income for the town until the late 20th century. In the late 20th century, the town began to transition to a more tourist-oriented economy, with many small businesses catering to visitors.
Geography
Ben Lomond is located in the San Lorenzo Valley, about 9 miles (14 km) northwest of the county seat, Santa Cruz. The town is situated at an elevation of 1,000 feet (305 m) above sea level. The town is surrounded by the Santa Cruz Mountains, and is located near the San Lorenzo River.
The climate in Ben Lomond is mild and temperate, with warm summers and cool winters. The average annual temperature is around 60°F (15°C).
Economy
The economy of Ben Lomond is largely based on tourism. The town is home to several small businesses, including restaurants, cafes, and shops. The town is also home to several wineries and vineyards, which attract visitors from all over the world.
The town is also home to several small farms, which produce a variety of fruits and vegetables. The town is also home to several nurseries, which produce a variety of plants and flowers.
Demographics
As of the 2010 census, the population of Ben Lomond was 5,387. The racial makeup of the town was 87.3% White, 0.7% African American, 0.7% Native American, 4.2% Asian, 0.2% Pacific Islander, 3.2% from other races, and 4.0% from two or more races. Hispanic or Latino of any race were 10.2% of the population.
The median income for a household in Ben Lomond was $50,972, and the median income for a family was $60,972. The per capita income for the town was $25,972. About 8.2% of families and 11.2% of the population were below the poverty line, including 15.2% of those under age 18 and 5.2% of those age 65 or over.
Common Questions
What is Per Capita Income in Ben Lomond?
Per Capita income in Ben Lomond is $57,364.
What is the Median Family Income in Ben Lomond?
Median Family Income in Ben Lomond is $136,576.
What is the Median Household income in Ben Lomond?
Median Household Income in Ben Lomond is $115,797.
What is Income or Wage Gap in Ben Lomond?
Income or Wage Gap in Ben Lomond is 40.9%.
Women in Ben Lomond earn 59.1 cents for every dollar earned by a man.
What is Inequality or Gini Index in Ben Lomond?
Inequality or Gini Index in Ben Lomond is 0.41.
What is the Total Population of Ben Lomond?
Total Population of Ben Lomond is 7,247.
What is the Total Male Population of Ben Lomond?
Total Male Population of Ben Lomond is 3,700.
What is the Total Female Population of Ben Lomond?
Total Female Population of Ben Lomond is 3,547.
What is the Ratio of Males per 100 Females in Ben Lomond?
There are 104.31 Males per 100 Females in Ben Lomond.
What is the Ratio of Females per 100 Males in Ben Lomond?
There are 95.86 Females per 100 Males in Ben Lomond.
What is the Median Population Age in Ben Lomond?
Median Population Age in Ben Lomond is 44.5 Years.
What is the Average Family Size in Ben Lomond
Average Family Size in Ben Lomond is 3.0 People.
What is the Average Household Size in Ben Lomond
Average Household Size in Ben Lomond is 2.7 People.
How Large is the Labor Force in Ben Lomond?
There are 3,927 People in the Labor Forcein in Ben Lomond.
What is the Percentage of People in the Labor Force in Ben Lomond?
68.6% of People are in the Labor Force in Ben Lomond.
What is the Unemployment Rate in Ben Lomond?
Unemployment Rate in Ben Lomond is 8.4%.