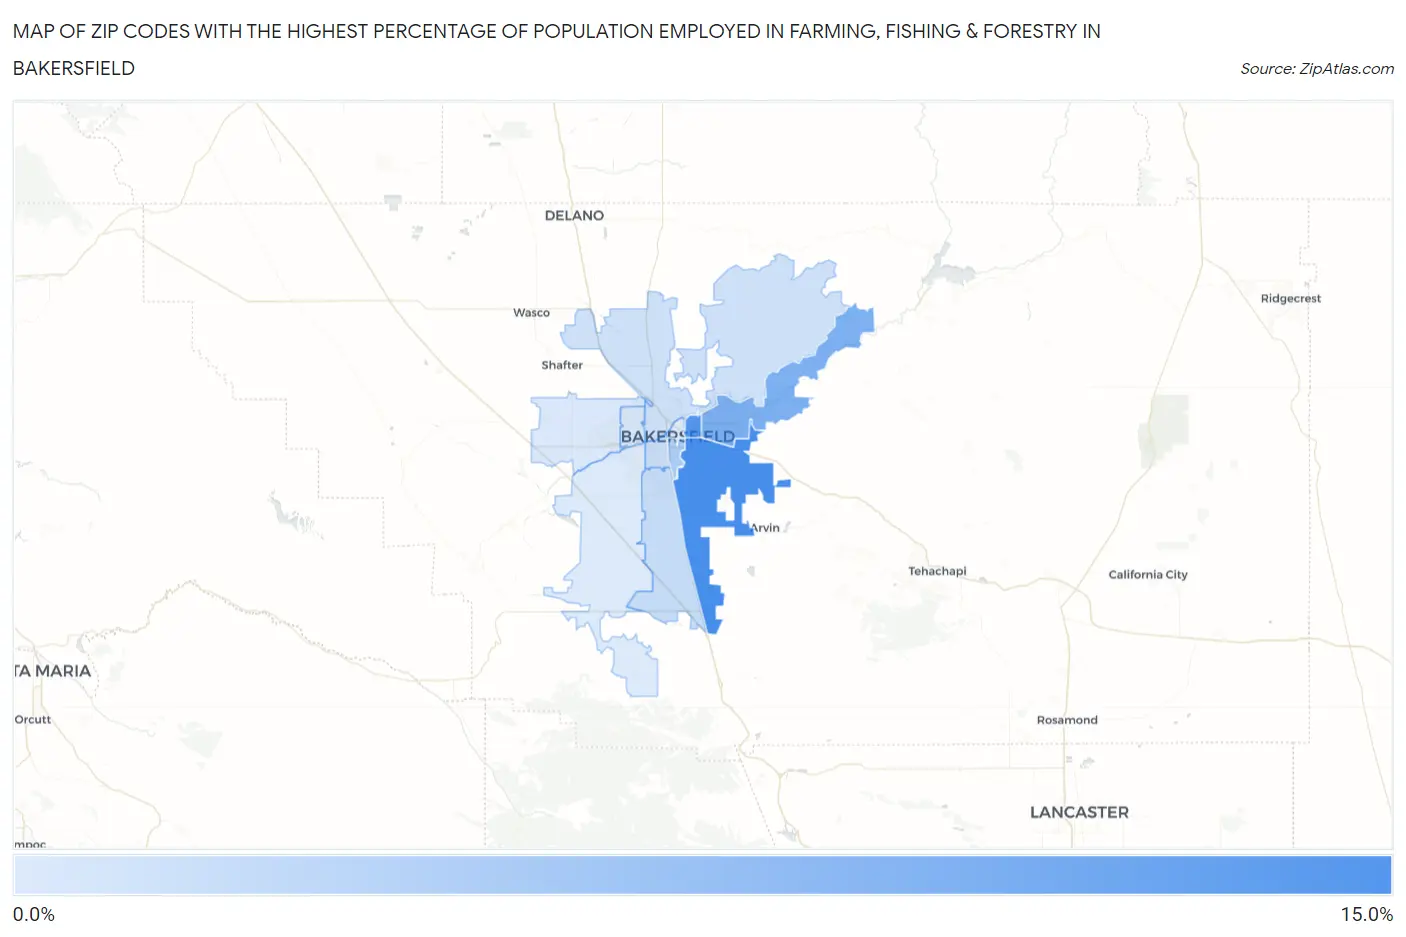
Zip Codes with the Highest Percentage of Population Employed in Farming, Fishing & Forestry in Bakersfield, CA
RELATED REPORTS & OPTIONS
Farming, Fishing & Forestry
Bakersfield
Compare Zip Codes
Map of Zip Codes with the Highest Percentage of Population Employed in Farming, Fishing & Forestry in Bakersfield
0.0%
15.0%
Zip Codes with the Highest Percentage of Population Employed in Farming, Fishing & Forestry in Bakersfield, CA
| Zip Code | % Employed | vs State | vs National | |
| 1. | 93307 | 15.0% | 1.4%(+13.6)#108 | 0.61%(+14.4)#650 |
| 2. | 93305 | 13.9% | 1.4%(+12.5)#120 | 0.61%(+13.3)#731 |
| 3. | 93306 | 9.7% | 1.4%(+8.25)#162 | 0.61%(+9.06)#1,263 |
| 4. | 93304 | 4.7% | 1.4%(+3.30)#254 | 0.61%(+4.11)#3,138 |
| 5. | 93313 | 2.5% | 1.4%(+1.12)#340 | 0.61%(+1.92)#5,504 |
| 6. | 93309 | 2.0% | 1.4%(+0.602)#382 | 0.61%(+1.41)#6,533 |
| 7. | 93308 | 1.6% | 1.4%(+0.211)#408 | 0.61%(+1.02)#7,522 |
| 8. | 93312 | 0.79% | 1.4%(-0.621)#566 | 0.61%(+0.184)#10,847 |
| 9. | 93314 | 0.51% | 1.4%(-0.899)#682 | 0.61%(-0.095)#12,747 |
| 10. | 93311 | 0.40% | 1.4%(-1.01)#754 | 0.61%(-0.202)#13,720 |
| 11. | 93301 | 0.35% | 1.4%(-1.06)#797 | 0.61%(-0.253)#14,237 |
1
Common Questions
What are the Top 10 Zip Codes with the Highest Percentage of Population Employed in Farming, Fishing & Forestry in Bakersfield, CA?
Top 10 Zip Codes with the Highest Percentage of Population Employed in Farming, Fishing & Forestry in Bakersfield, CA are:
What zip code has the Highest Percentage of Population Employed in Farming, Fishing & Forestry in Bakersfield, CA?
93307 has the Highest Percentage of Population Employed in Farming, Fishing & Forestry in Bakersfield, CA with 15.0%.
What is the Percentage of Population Employed in Farming, Fishing & Forestry in Bakersfield, CA?
Percentage of Population Employed in Farming, Fishing & Forestry in Bakersfield is 3.5%.
What is the Percentage of Population Employed in Farming, Fishing & Forestry in California?
Percentage of Population Employed in Farming, Fishing & Forestry in California is 1.4%.
What is the Percentage of Population Employed in Farming, Fishing & Forestry in the United States?
Percentage of Population Employed in Farming, Fishing & Forestry in the United States is 0.61%.