Arroyo Grande, CA Map & Demographics
Arroyo Grande Map
Arroyo Grande Overview
$45,578
PER CAPITA INCOME
$123,614
AVG FAMILY INCOME
$99,143
AVG HOUSEHOLD INCOME
33.3%
WAGE / INCOME GAP [ % ]
66.7¢/ $1
WAGE / INCOME GAP [ $ ]
$9,611
FAMILY INCOME DEFICIT
0.40
INEQUALITY / GINI INDEX
18,435
TOTAL POPULATION
8,595
MALE POPULATION
9,840
FEMALE POPULATION
87.35
MALES / 100 FEMALES
114.49
FEMALES / 100 MALES
45.3
MEDIAN AGE
3.0
AVG FAMILY SIZE
2.4
AVG HOUSEHOLD SIZE
8,932
LABOR FORCE [ PEOPLE ]
58.1%
PERCENT IN LABOR FORCE
2.2%
UNEMPLOYMENT RATE
Arroyo Grande Zip Codes
Arroyo Grande Area Codes
Income in Arroyo Grande
Income Overview in Arroyo Grande
Per Capita Income in Arroyo Grande is $45,578, while median incomes of families and households are $123,614 and $99,143 respectively.
| Characteristic | Number | Measure |
| Per Capita Income | 18,435 | $45,578 |
| Median Family Income | 5,090 | $123,614 |
| Mean Family Income | 5,090 | $133,659 |
| Median Household Income | 7,504 | $99,143 |
| Mean Household Income | 7,504 | $111,161 |
| Income Deficit | 5,090 | $9,611 |
| Wage / Income Gap (%) | 18,435 | 33.29% |
| Wage / Income Gap ($) | 18,435 | 66.71¢ per $1 |
| Gini / Inequality Index | 18,435 | 0.40 |
Earnings by Sex in Arroyo Grande
Average Earnings in Arroyo Grande are $49,371, $58,496 for men and $39,022 for women, a difference of 33.3%.
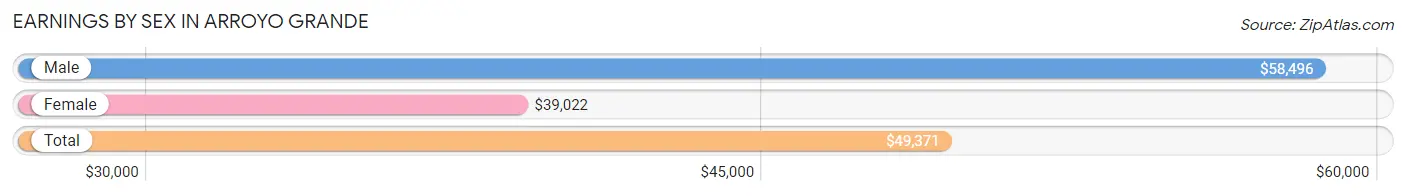
| Sex | Number | Average Earnings |
| Male | 5,081 (53.9%) | $58,496 |
| Female | 4,350 (46.1%) | $39,022 |
| Total | 9,431 (100.0%) | $49,371 |
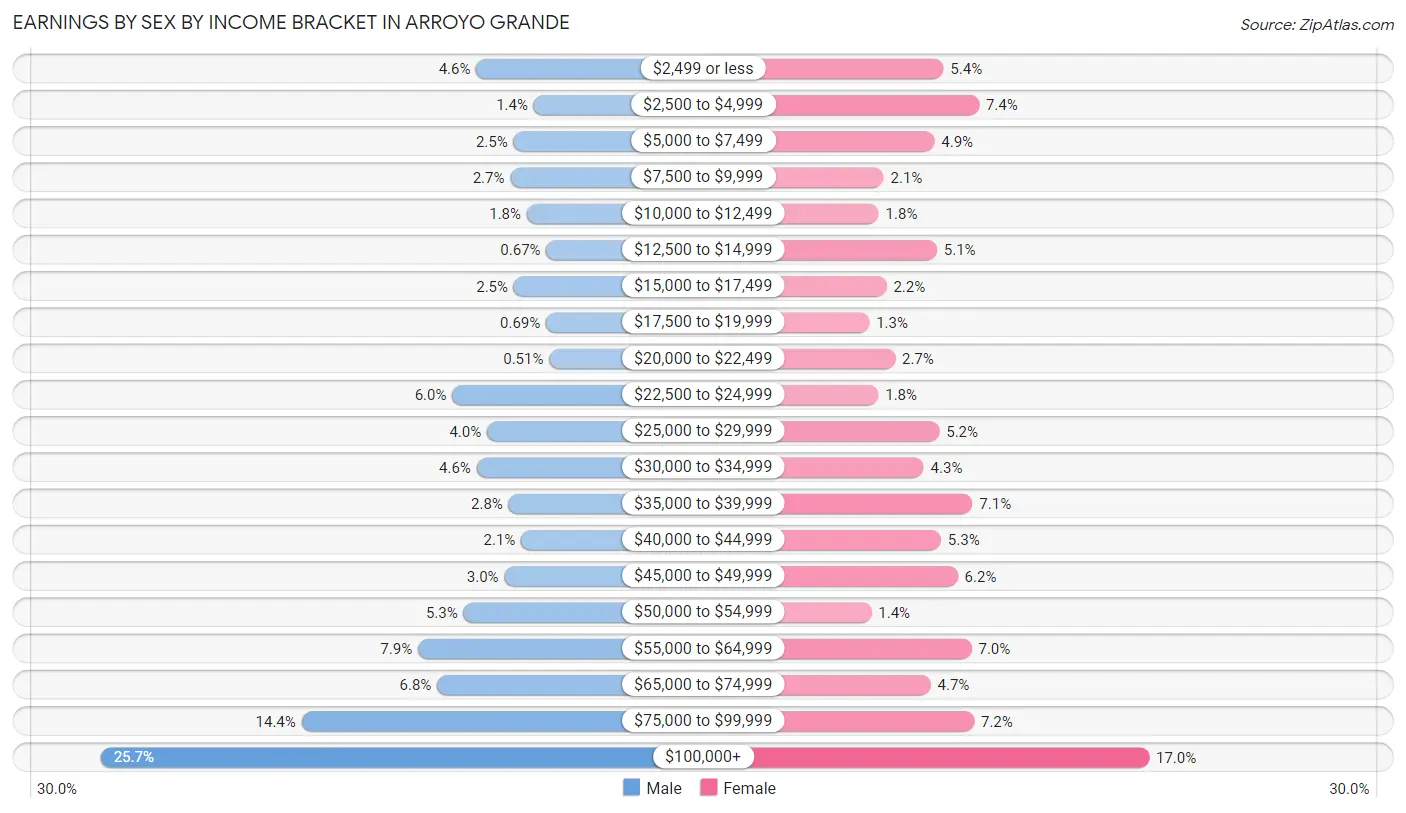
Earnings by Sex by Income Bracket in Arroyo Grande
The most common earnings brackets in Arroyo Grande are $100,000+ for men (1,307 | 25.7%) and $100,000+ for women (739 | 17.0%).
| Income | Male | Female |
| $2,499 or less | 234 (4.6%) | 236 (5.4%) |
| $2,500 to $4,999 | 70 (1.4%) | 323 (7.4%) |
| $5,000 to $7,499 | 128 (2.5%) | 214 (4.9%) |
| $7,500 to $9,999 | 137 (2.7%) | 90 (2.1%) |
| $10,000 to $12,499 | 90 (1.8%) | 78 (1.8%) |
| $12,500 to $14,999 | 34 (0.7%) | 220 (5.1%) |
| $15,000 to $17,499 | 127 (2.5%) | 97 (2.2%) |
| $17,500 to $19,999 | 35 (0.7%) | 55 (1.3%) |
| $20,000 to $22,499 | 26 (0.5%) | 118 (2.7%) |
| $22,500 to $24,999 | 303 (6.0%) | 77 (1.8%) |
| $25,000 to $29,999 | 204 (4.0%) | 226 (5.2%) |
| $30,000 to $34,999 | 233 (4.6%) | 188 (4.3%) |
| $35,000 to $39,999 | 142 (2.8%) | 307 (7.1%) |
| $40,000 to $44,999 | 106 (2.1%) | 230 (5.3%) |
| $45,000 to $49,999 | 154 (3.0%) | 271 (6.2%) |
| $50,000 to $54,999 | 271 (5.3%) | 60 (1.4%) |
| $55,000 to $64,999 | 401 (7.9%) | 305 (7.0%) |
| $65,000 to $74,999 | 346 (6.8%) | 205 (4.7%) |
| $75,000 to $99,999 | 733 (14.4%) | 311 (7.1%) |
| $100,000+ | 1,307 (25.7%) | 739 (17.0%) |
| Total | 5,081 (100.0%) | 4,350 (100.0%) |
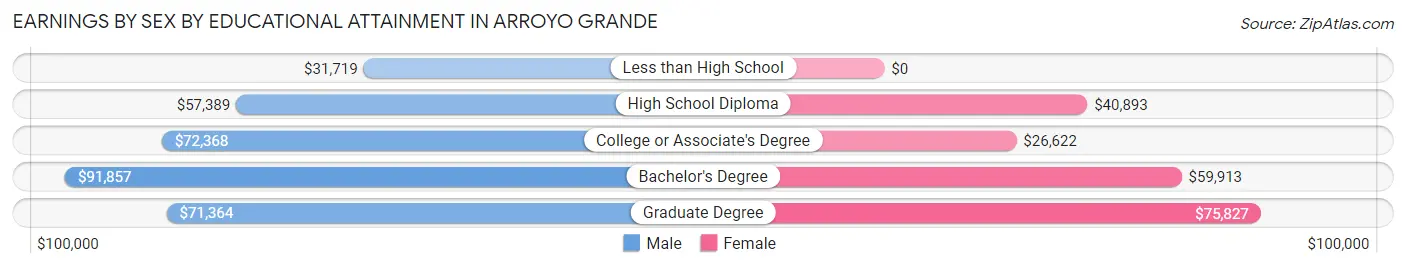
Earnings by Sex by Educational Attainment in Arroyo Grande
Average earnings in Arroyo Grande are $76,196 for men and $45,694 for women, a difference of 40.0%. Men with an educational attainment of bachelor's degree enjoy the highest average annual earnings of $91,857, while those with less than high school education earn the least with $31,719. Women with an educational attainment of graduate degree earn the most with the average annual earnings of $75,827, while those with college or associate's degree education have the smallest earnings of $26,622.
| Educational Attainment | Male Income | Female Income |
| Less than High School | $31,719 | $0 |
| High School Diploma | $57,389 | $40,893 |
| College or Associate's Degree | $72,368 | $26,622 |
| Bachelor's Degree | $91,857 | $59,913 |
| Graduate Degree | $71,364 | $75,827 |
| Total | $76,196 | $45,694 |
Family Income in Arroyo Grande
Family Income Brackets in Arroyo Grande
According to the Arroyo Grande family income data, there are 1,451 families falling into the $100,000 to $149,999 income range, which is the most common income bracket and makes up 28.5% of all families. Conversely, the less than $10,000 income bracket is the least frequent group with only 61 families (1.2%) belonging to this category.
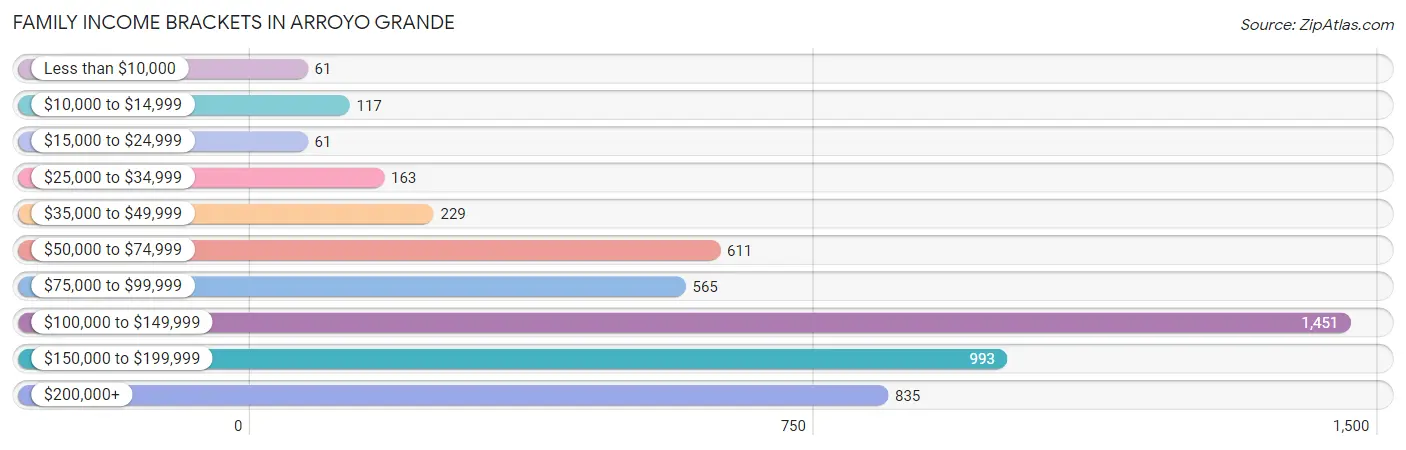
| Income Bracket | # Families | % Families |
| Less than $10,000 | 61 | 1.2% |
| $10,000 to $14,999 | 117 | 2.3% |
| $15,000 to $24,999 | 61 | 1.2% |
| $25,000 to $34,999 | 163 | 3.2% |
| $35,000 to $49,999 | 229 | 4.5% |
| $50,000 to $74,999 | 611 | 12.0% |
| $75,000 to $99,999 | 565 | 11.1% |
| $100,000 to $149,999 | 1,451 | 28.5% |
| $150,000 to $199,999 | 993 | 19.5% |
| $200,000+ | 835 | 16.4% |
Family Income by Famaliy Size in Arroyo Grande
6-person families (151 | 3.0%) account for the highest median family income in Arroyo Grande with $250,001 per family, while 2-person families (2,615 | 51.4%) have the highest median income of $57,520 per family member.
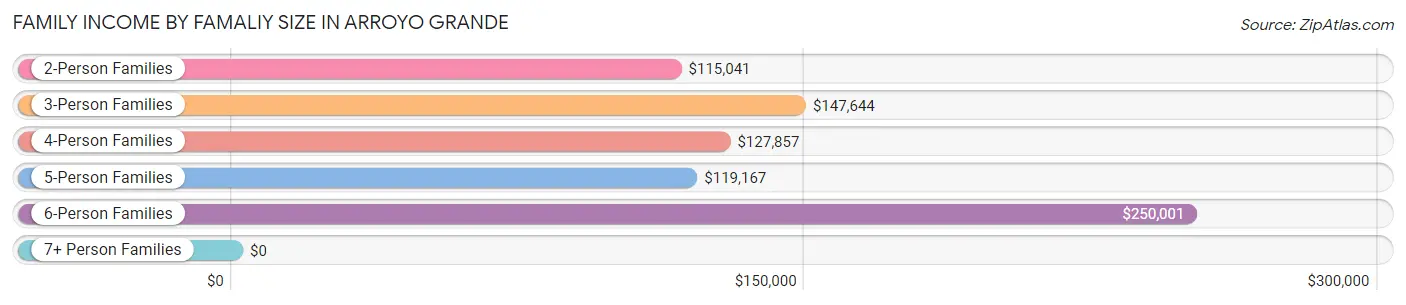
| Income Bracket | # Families | Median Income |
| 2-Person Families | 2,615 (51.4%) | $115,041 |
| 3-Person Families | 1,256 (24.7%) | $147,644 |
| 4-Person Families | 742 (14.6%) | $127,857 |
| 5-Person Families | 306 (6.0%) | $119,167 |
| 6-Person Families | 151 (3.0%) | $250,001 |
| 7+ Person Families | 20 (0.4%) | $0 |
| Total | 5,090 (100.0%) | $123,614 |
Family Income by Number of Earners in Arroyo Grande
The median family income in Arroyo Grande is $123,614, with families comprising 3+ earners (599) having the highest median family income of $166,058, while families with no earners (998) have the lowest median family income of $65,625, accounting for 11.8% and 19.6% of families, respectively.
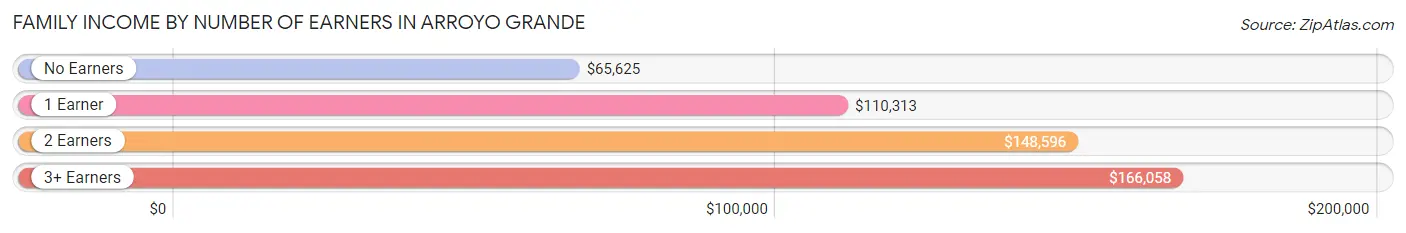
| Number of Earners | # Families | Median Income |
| No Earners | 998 (19.6%) | $65,625 |
| 1 Earner | 1,293 (25.4%) | $110,313 |
| 2 Earners | 2,200 (43.2%) | $148,596 |
| 3+ Earners | 599 (11.8%) | $166,058 |
| Total | 5,090 (100.0%) | $123,614 |
Household Income in Arroyo Grande
Household Income Brackets in Arroyo Grande
With 1,673 households falling in the category, the $100,000 to $149,999 income range is the most frequent in Arroyo Grande, accounting for 22.3% of all households. In contrast, only 203 households (2.7%) fall into the $10,000 to $14,999 income bracket, making it the least populous group.
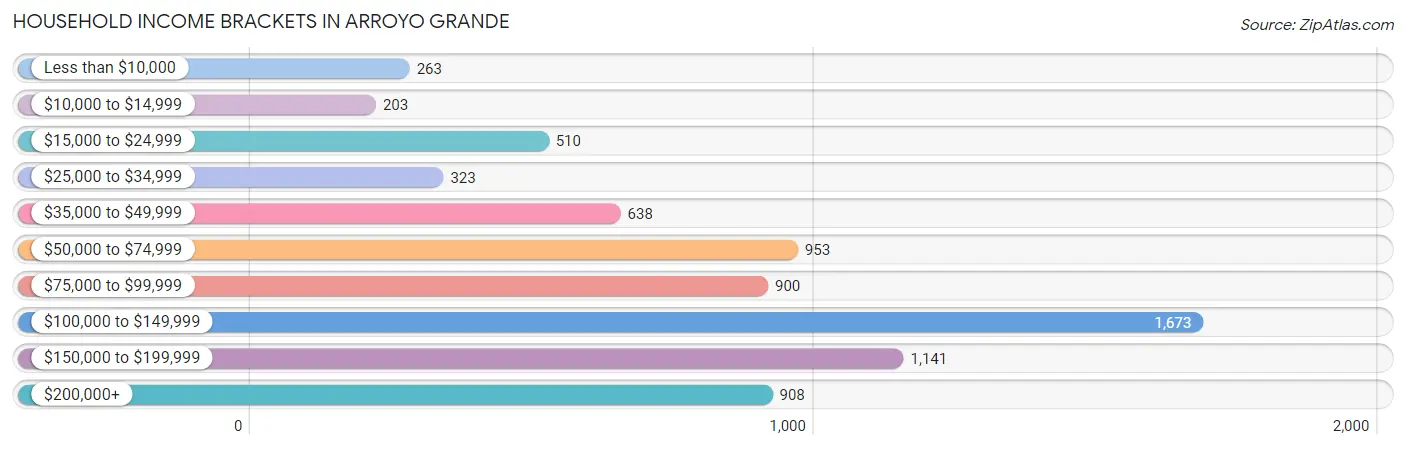
| Income Bracket | # Households | % Households |
| Less than $10,000 | 263 | 3.5% |
| $10,000 to $14,999 | 203 | 2.7% |
| $15,000 to $24,999 | 510 | 6.8% |
| $25,000 to $34,999 | 323 | 4.3% |
| $35,000 to $49,999 | 638 | 8.5% |
| $50,000 to $74,999 | 953 | 12.7% |
| $75,000 to $99,999 | 900 | 12.0% |
| $100,000 to $149,999 | 1,673 | 22.3% |
| $150,000 to $199,999 | 1,141 | 15.2% |
| $200,000+ | 908 | 12.1% |
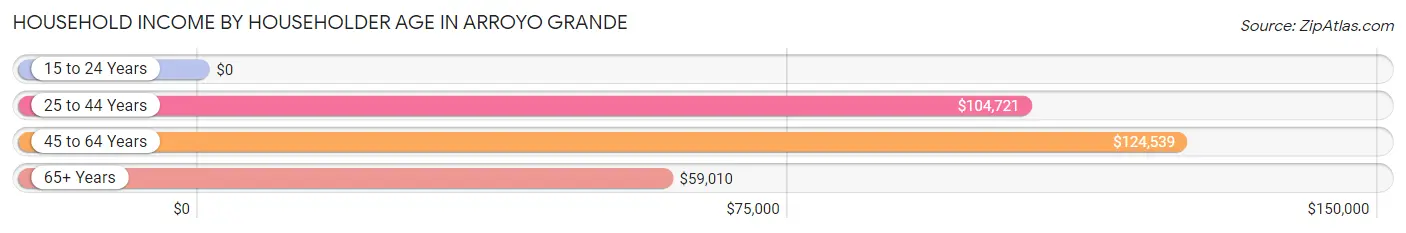
Household Income by Householder Age in Arroyo Grande
The median household income in Arroyo Grande is $99,143, with the highest median household income of $124,539 found in the 45 to 64 years age bracket for the primary householder. A total of 2,577 households (34.3%) fall into this category. Meanwhile, the 15 to 24 years age bracket for the primary householder has the lowest median household income of $0, with 251 households (3.3%) in this group.
| Income Bracket | # Households | Median Income |
| 15 to 24 Years | 251 (3.3%) | $0 |
| 25 to 44 Years | 1,917 (25.6%) | $104,721 |
| 45 to 64 Years | 2,577 (34.3%) | $124,539 |
| 65+ Years | 2,759 (36.8%) | $59,010 |
| Total | 7,504 (100.0%) | $99,143 |
Poverty in Arroyo Grande
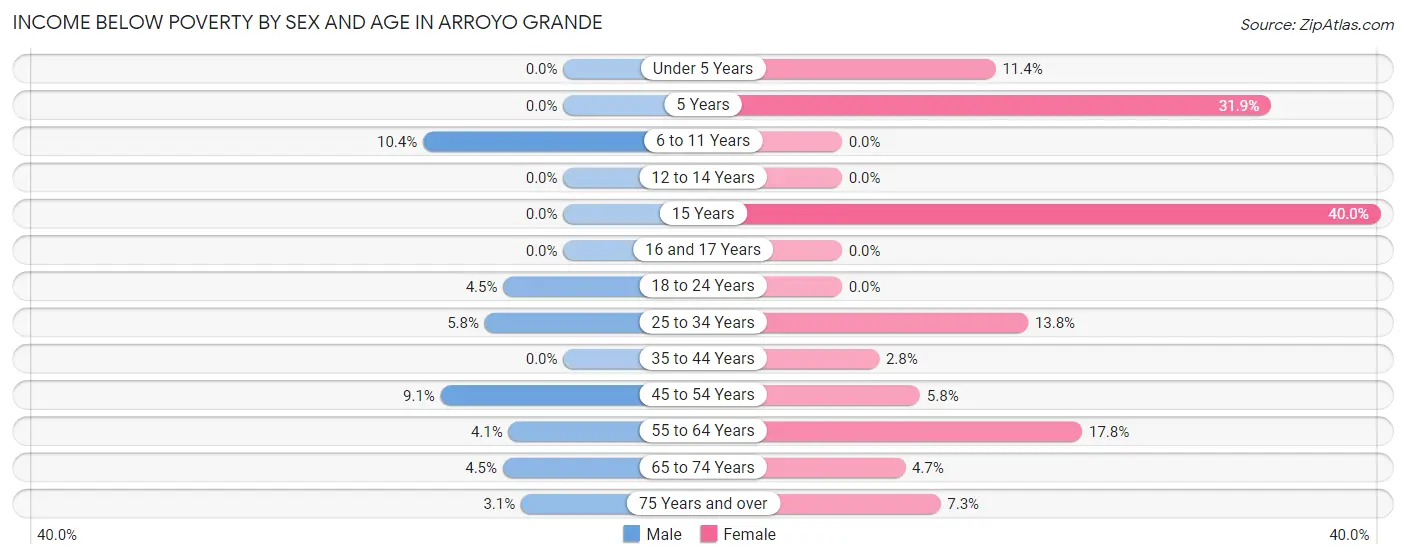
Income Below Poverty by Sex and Age in Arroyo Grande
With 4.2% poverty level for males and 7.6% for females among the residents of Arroyo Grande, 6 to 11 year old males and 15 year old females are the most vulnerable to poverty, with 45 males (10.4%) and 28 females (40.0%) in their respective age groups living below the poverty level.
| Age Bracket | Male | Female |
| Under 5 Years | 0 (0.0%) | 60 (11.4%) |
| 5 Years | 0 (0.0%) | 29 (31.9%) |
| 6 to 11 Years | 45 (10.4%) | 0 (0.0%) |
| 12 to 14 Years | 0 (0.0%) | 0 (0.0%) |
| 15 Years | 0 (0.0%) | 28 (40.0%) |
| 16 and 17 Years | 0 (0.0%) | 0 (0.0%) |
| 18 to 24 Years | 48 (4.5%) | 0 (0.0%) |
| 25 to 34 Years | 50 (5.8%) | 143 (13.8%) |
| 35 to 44 Years | 0 (0.0%) | 31 (2.8%) |
| 45 to 54 Years | 96 (9.1%) | 66 (5.8%) |
| 55 to 64 Years | 53 (4.1%) | 226 (17.8%) |
| 65 to 74 Years | 47 (4.5%) | 66 (4.7%) |
| 75 Years and over | 23 (3.1%) | 87 (7.3%) |
| Total | 362 (4.2%) | 736 (7.6%) |
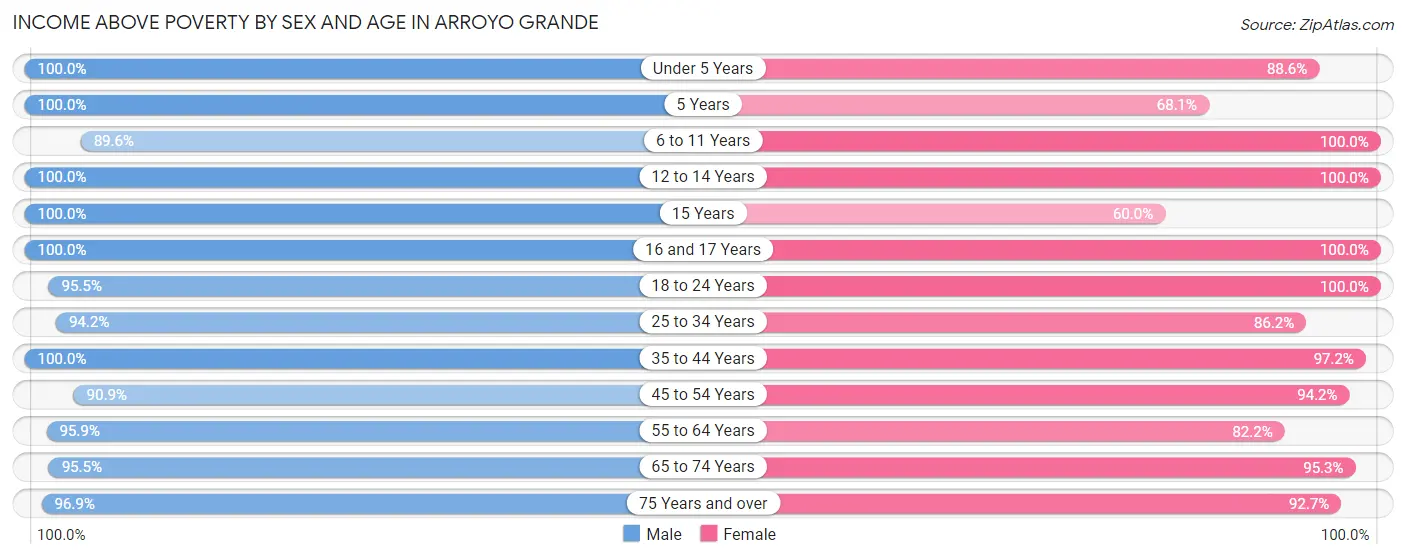
Income Above Poverty by Sex and Age in Arroyo Grande
According to the poverty statistics in Arroyo Grande, males aged under 5 years and females aged 6 to 11 years are the age groups that are most secure financially, with 100.0% of males and 100.0% of females in these age groups living above the poverty line.
| Age Bracket | Male | Female |
| Under 5 Years | 248 (100.0%) | 466 (88.6%) |
| 5 Years | 120 (100.0%) | 62 (68.1%) |
| 6 to 11 Years | 387 (89.6%) | 609 (100.0%) |
| 12 to 14 Years | 392 (100.0%) | 404 (100.0%) |
| 15 Years | 114 (100.0%) | 42 (60.0%) |
| 16 and 17 Years | 323 (100.0%) | 230 (100.0%) |
| 18 to 24 Years | 1,028 (95.5%) | 607 (100.0%) |
| 25 to 34 Years | 807 (94.2%) | 892 (86.2%) |
| 35 to 44 Years | 865 (100.0%) | 1,094 (97.2%) |
| 45 to 54 Years | 958 (90.9%) | 1,072 (94.2%) |
| 55 to 64 Years | 1,249 (95.9%) | 1,041 (82.2%) |
| 65 to 74 Years | 999 (95.5%) | 1,341 (95.3%) |
| 75 Years and over | 709 (96.9%) | 1,102 (92.7%) |
| Total | 8,199 (95.8%) | 8,962 (92.4%) |
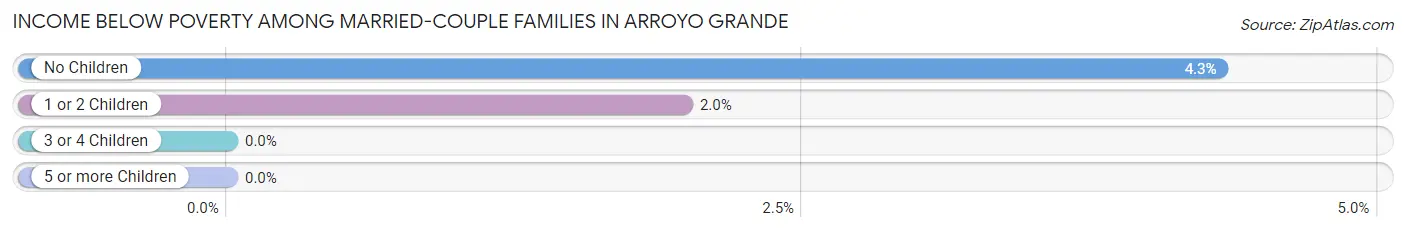
Income Below Poverty Among Married-Couple Families in Arroyo Grande
The poverty statistics for married-couple families in Arroyo Grande show that 3.4% or 137 of the total 4,083 families live below the poverty line. Families with no children have the highest poverty rate of 4.3%, comprising of 111 families. On the other hand, families with 3 or 4 children have the lowest poverty rate of 0.0%, which includes 0 families.
| Children | Above Poverty | Below Poverty |
| No Children | 2,463 (95.7%) | 111 (4.3%) |
| 1 or 2 Children | 1,288 (98.0%) | 26 (2.0%) |
| 3 or 4 Children | 195 (100.0%) | 0 (0.0%) |
| 5 or more Children | 0 (0.0%) | 0 (0.0%) |
| Total | 3,946 (96.6%) | 137 (3.4%) |
Income Below Poverty Among Single-Parent Households in Arroyo Grande
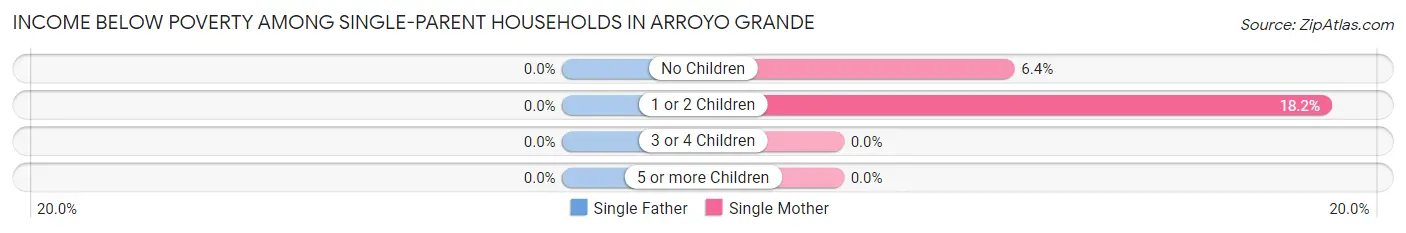
| Children | Single Father | Single Mother |
| No Children | 0 (0.0%) | 14 (6.4%) |
| 1 or 2 Children | 0 (0.0%) | 64 (18.2%) |
| 3 or 4 Children | 0 (0.0%) | 0 (0.0%) |
| 5 or more Children | 0 (0.0%) | 0 (0.0%) |
| Total | 0 (0.0%) | 78 (13.4%) |
Income Below Poverty Among Married-Couple vs Single-Parent Households in Arroyo Grande
The poverty data for Arroyo Grande shows that 137 of the married-couple family households (3.4%) and 78 of the single-parent households (7.7%) are living below the poverty level. Within the married-couple family households, those with no children have the highest poverty rate, with 111 households (4.3%) falling below the poverty line. Among the single-parent households, those with 1 or 2 children have the highest poverty rate, with 64 household (11.7%) living below poverty.
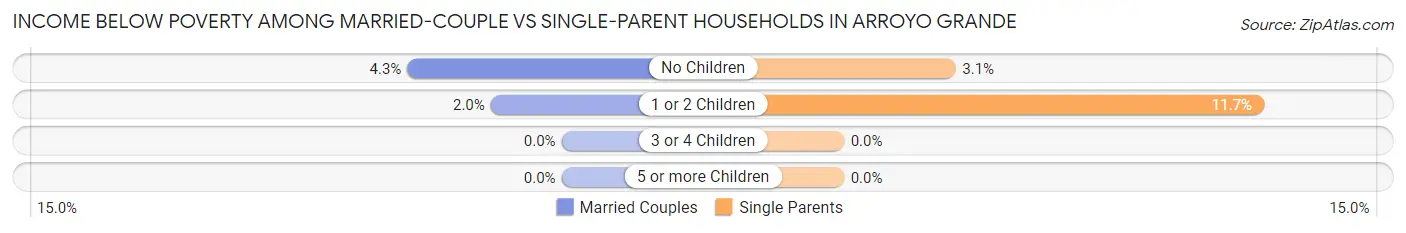
| Children | Married-Couple Families | Single-Parent Households |
| No Children | 111 (4.3%) | 14 (3.1%) |
| 1 or 2 Children | 26 (2.0%) | 64 (11.7%) |
| 3 or 4 Children | 0 (0.0%) | 0 (0.0%) |
| 5 or more Children | 0 (0.0%) | 0 (0.0%) |
| Total | 137 (3.4%) | 78 (7.7%) |
Race in Arroyo Grande
The most populous races in Arroyo Grande are White / Caucasian (14,438 | 78.3%), Hispanic or Latino (2,977 | 16.2%), and Two or more Races (2,667 | 14.5%).
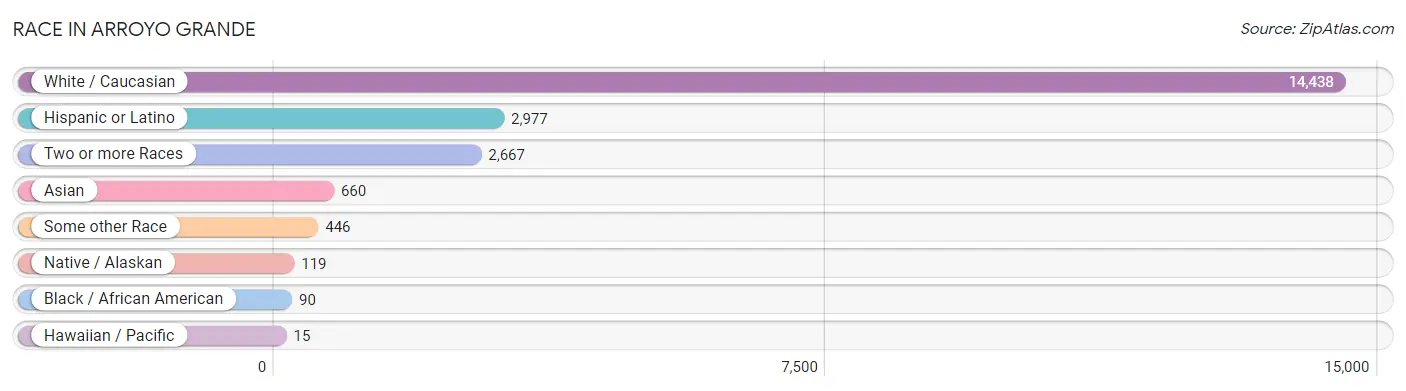
| Race | # Population | % Population |
| Asian | 660 | 3.6% |
| Black / African American | 90 | 0.5% |
| Hawaiian / Pacific | 15 | 0.1% |
| Hispanic or Latino | 2,977 | 16.2% |
| Native / Alaskan | 119 | 0.6% |
| White / Caucasian | 14,438 | 78.3% |
| Two or more Races | 2,667 | 14.5% |
| Some other Race | 446 | 2.4% |
| Total | 18,435 | 100.0% |
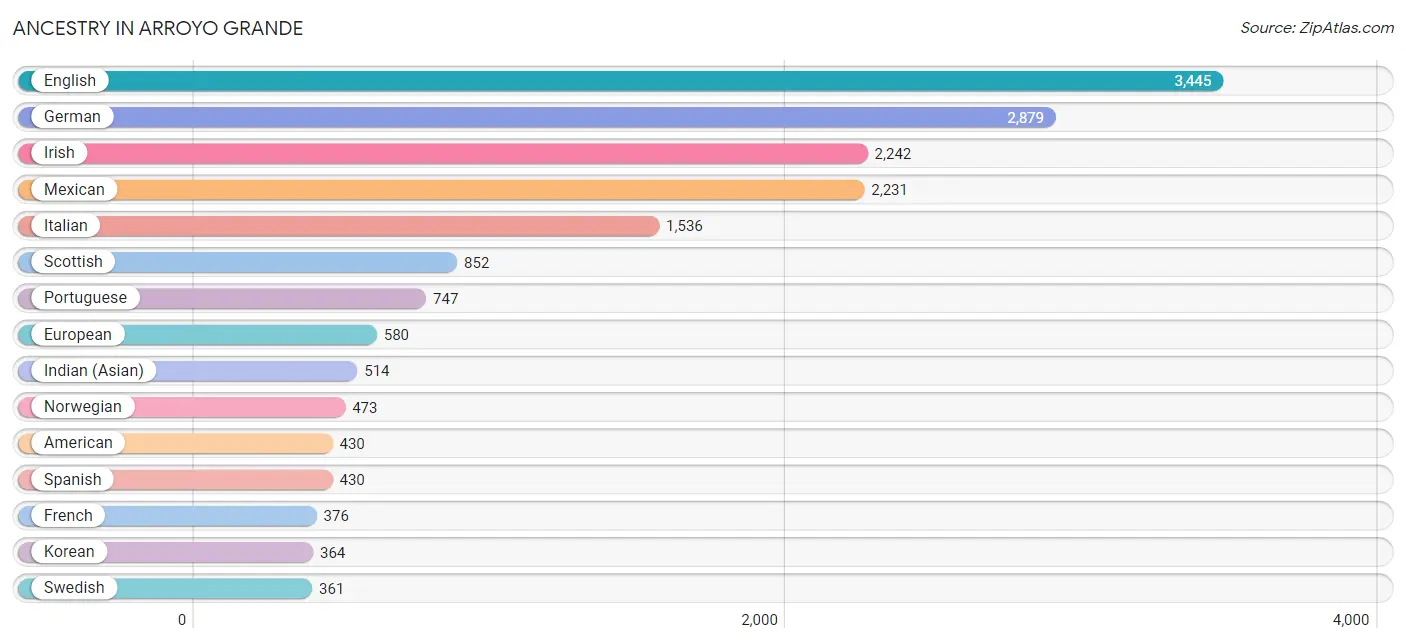
Ancestry in Arroyo Grande
The most populous ancestries reported in Arroyo Grande are English (3,445 | 18.7%), German (2,879 | 15.6%), Irish (2,242 | 12.2%), Mexican (2,231 | 12.1%), and Italian (1,536 | 8.3%), together accounting for 66.9% of all Arroyo Grande residents.
| Ancestry | # Population | % Population |
| American | 430 | 2.3% |
| Arab | 145 | 0.8% |
| Armenian | 113 | 0.6% |
| Austrian | 108 | 0.6% |
| Basque | 46 | 0.3% |
| Belgian | 12 | 0.1% |
| Belizean | 40 | 0.2% |
| Bhutanese | 235 | 1.3% |
| Blackfeet | 14 | 0.1% |
| British | 125 | 0.7% |
| British West Indian | 28 | 0.2% |
| Bulgarian | 69 | 0.4% |
| Burmese | 27 | 0.2% |
| Canadian | 68 | 0.4% |
| Central American | 33 | 0.2% |
| Central American Indian | 15 | 0.1% |
| Cherokee | 290 | 1.6% |
| Chickasaw | 20 | 0.1% |
| Costa Rican | 19 | 0.1% |
| Croatian | 45 | 0.2% |
| Czech | 101 | 0.5% |
| Czechoslovakian | 19 | 0.1% |
| Danish | 140 | 0.8% |
| Dutch | 240 | 1.3% |
| Eastern European | 16 | 0.1% |
| Egyptian | 122 | 0.7% |
| English | 3,445 | 18.7% |
| European | 580 | 3.2% |
| Filipino | 48 | 0.3% |
| Finnish | 118 | 0.6% |
| French | 376 | 2.0% |
| French Canadian | 14 | 0.1% |
| German | 2,879 | 15.6% |
| Greek | 217 | 1.2% |
| Guamanian / Chamorro | 15 | 0.1% |
| Guatemalan | 14 | 0.1% |
| Guyanese | 28 | 0.2% |
| Hungarian | 88 | 0.5% |
| Indian (Asian) | 514 | 2.8% |
| Iranian | 19 | 0.1% |
| Irish | 2,242 | 12.2% |
| Italian | 1,536 | 8.3% |
| Korean | 364 | 2.0% |
| Luxembourger | 14 | 0.1% |
| Mexican | 2,231 | 12.1% |
| Native Hawaiian | 31 | 0.2% |
| Northern European | 120 | 0.6% |
| Norwegian | 473 | 2.6% |
| Pakistani | 23 | 0.1% |
| Pennsylvania German | 2 | 0.0% |
| Peruvian | 12 | 0.1% |
| Polish | 264 | 1.4% |
| Portuguese | 747 | 4.1% |
| Puerto Rican | 75 | 0.4% |
| Romanian | 8 | 0.0% |
| Russian | 149 | 0.8% |
| Samoan | 31 | 0.2% |
| Scandinavian | 87 | 0.5% |
| Scotch-Irish | 90 | 0.5% |
| Scottish | 852 | 4.6% |
| Slovak | 10 | 0.1% |
| Slovene | 24 | 0.1% |
| South American | 12 | 0.1% |
| Spaniard | 180 | 1.0% |
| Spanish | 430 | 2.3% |
| Sri Lankan | 244 | 1.3% |
| Subsaharan African | 4 | 0.0% |
| Swedish | 361 | 2.0% |
| Swiss | 101 | 0.5% |
| Thai | 93 | 0.5% |
| Ukrainian | 25 | 0.1% |
| Welsh | 79 | 0.4% |
| Zimbabwean | 4 | 0.0% | View All 73 Rows |
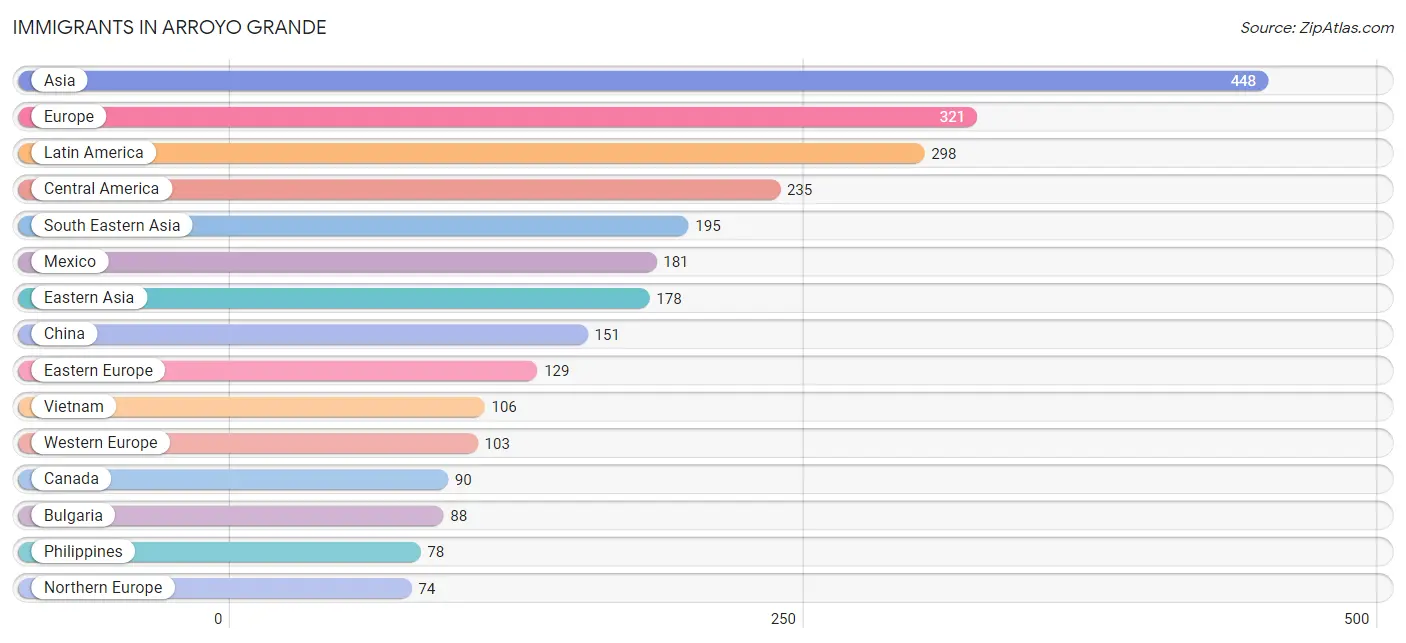
Immigrants in Arroyo Grande
The most numerous immigrant groups reported in Arroyo Grande came from Asia (448 | 2.4%), Europe (321 | 1.7%), Latin America (298 | 1.6%), Central America (235 | 1.3%), and South Eastern Asia (195 | 1.1%), together accounting for 8.1% of all Arroyo Grande residents.
| Immigration Origin | # Population | % Population |
| Africa | 4 | 0.0% |
| Armenia | 2 | 0.0% |
| Asia | 448 | 2.4% |
| Australia | 4 | 0.0% |
| Belgium | 12 | 0.1% |
| Belize | 40 | 0.2% |
| Bulgaria | 88 | 0.5% |
| Canada | 90 | 0.5% |
| Caribbean | 7 | 0.0% |
| Central America | 235 | 1.3% |
| China | 151 | 0.8% |
| Eastern Africa | 4 | 0.0% |
| Eastern Asia | 178 | 1.0% |
| Eastern Europe | 129 | 0.7% |
| England | 56 | 0.3% |
| Europe | 321 | 1.7% |
| France | 54 | 0.3% |
| Germany | 37 | 0.2% |
| Guatemala | 14 | 0.1% |
| Hungary | 16 | 0.1% |
| India | 54 | 0.3% |
| Iran | 19 | 0.1% |
| Italy | 15 | 0.1% |
| Korea | 27 | 0.2% |
| Latin America | 298 | 1.6% |
| Malaysia | 11 | 0.1% |
| Mexico | 181 | 1.0% |
| Northern Europe | 74 | 0.4% |
| Norway | 1 | 0.0% |
| Oceania | 4 | 0.0% |
| Peru | 56 | 0.3% |
| Philippines | 78 | 0.4% |
| Russia | 25 | 0.1% |
| South America | 56 | 0.3% |
| South Central Asia | 73 | 0.4% |
| South Eastern Asia | 195 | 1.1% |
| Southern Europe | 15 | 0.1% |
| Taiwan | 15 | 0.1% |
| Trinidad and Tobago | 7 | 0.0% |
| Vietnam | 106 | 0.6% |
| Western Asia | 2 | 0.0% |
| Western Europe | 103 | 0.6% |
| Zimbabwe | 4 | 0.0% | View All 43 Rows |
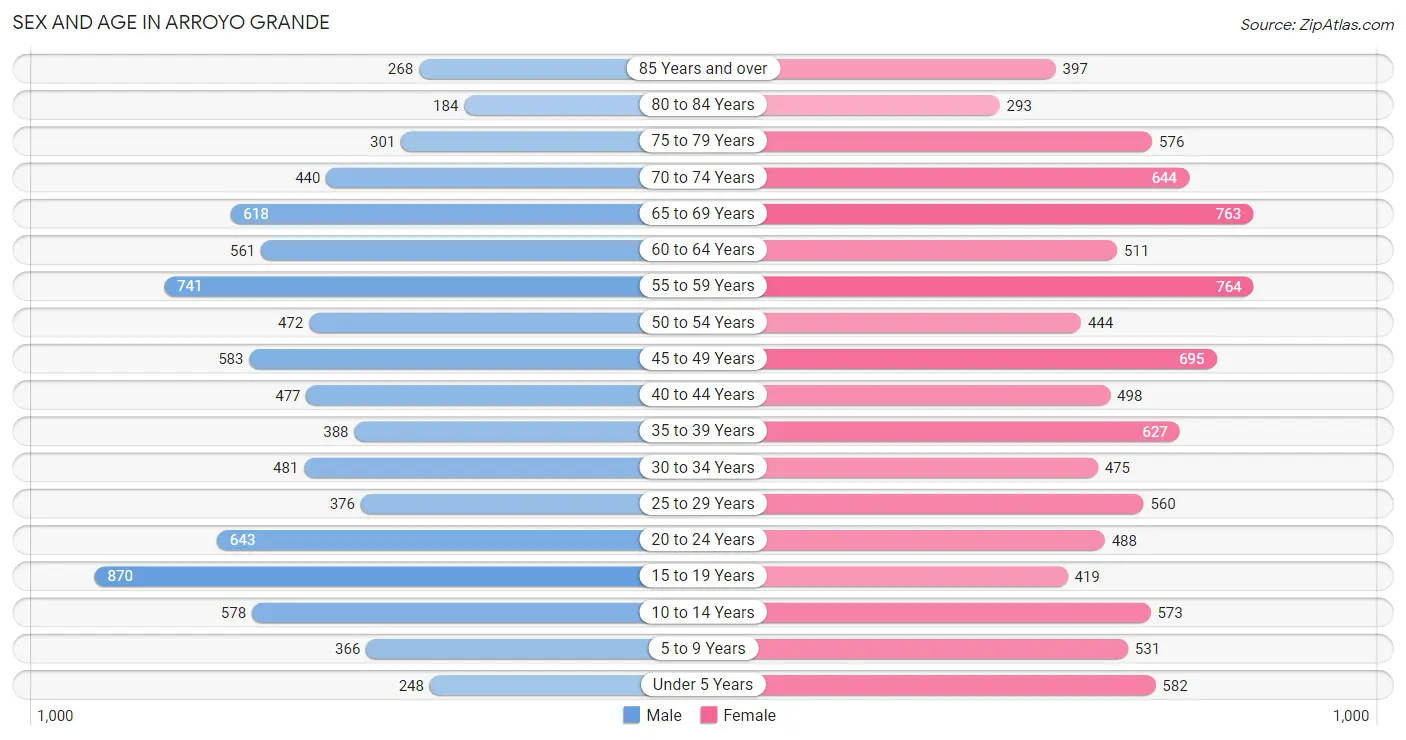
Sex and Age in Arroyo Grande
Sex and Age in Arroyo Grande
The most populous age groups in Arroyo Grande are 15 to 19 Years (870 | 10.1%) for men and 55 to 59 Years (764 | 7.8%) for women.
| Age Bracket | Male | Female |
| Under 5 Years | 248 (2.9%) | 582 (5.9%) |
| 5 to 9 Years | 366 (4.3%) | 531 (5.4%) |
| 10 to 14 Years | 578 (6.7%) | 573 (5.8%) |
| 15 to 19 Years | 870 (10.1%) | 419 (4.3%) |
| 20 to 24 Years | 643 (7.5%) | 488 (5.0%) |
| 25 to 29 Years | 376 (4.4%) | 560 (5.7%) |
| 30 to 34 Years | 481 (5.6%) | 475 (4.8%) |
| 35 to 39 Years | 388 (4.5%) | 627 (6.4%) |
| 40 to 44 Years | 477 (5.6%) | 498 (5.1%) |
| 45 to 49 Years | 583 (6.8%) | 695 (7.1%) |
| 50 to 54 Years | 472 (5.5%) | 444 (4.5%) |
| 55 to 59 Years | 741 (8.6%) | 764 (7.8%) |
| 60 to 64 Years | 561 (6.5%) | 511 (5.2%) |
| 65 to 69 Years | 618 (7.2%) | 763 (7.7%) |
| 70 to 74 Years | 440 (5.1%) | 644 (6.5%) |
| 75 to 79 Years | 301 (3.5%) | 576 (5.9%) |
| 80 to 84 Years | 184 (2.1%) | 293 (3.0%) |
| 85 Years and over | 268 (3.1%) | 397 (4.0%) |
| Total | 8,595 (100.0%) | 9,840 (100.0%) |
Families and Households in Arroyo Grande
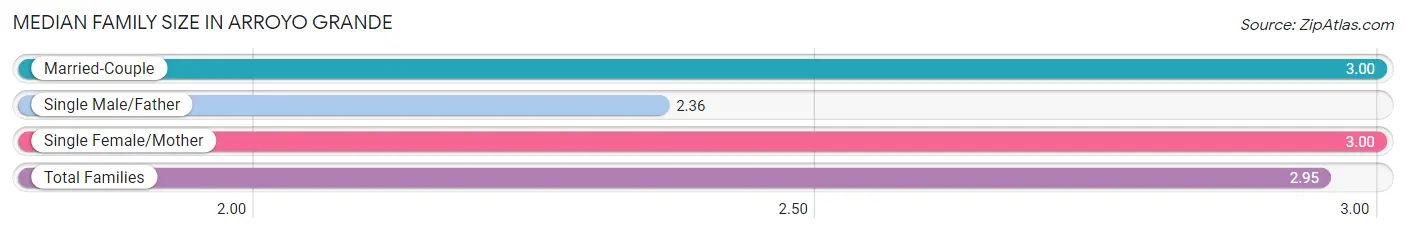
Median Family Size in Arroyo Grande
The median family size in Arroyo Grande is 2.95 persons per family, with married-couple families (4,083 | 80.2%) accounting for the largest median family size of 3 persons per family. On the other hand, single male/father families (424 | 8.3%) represent the smallest median family size with 2.36 persons per family.
| Family Type | # Families | Family Size |
| Married-Couple | 4,083 (80.2%) | 3.00 |
| Single Male/Father | 424 (8.3%) | 2.36 |
| Single Female/Mother | 583 (11.5%) | 3.00 |
| Total Families | 5,090 (100.0%) | 2.95 |
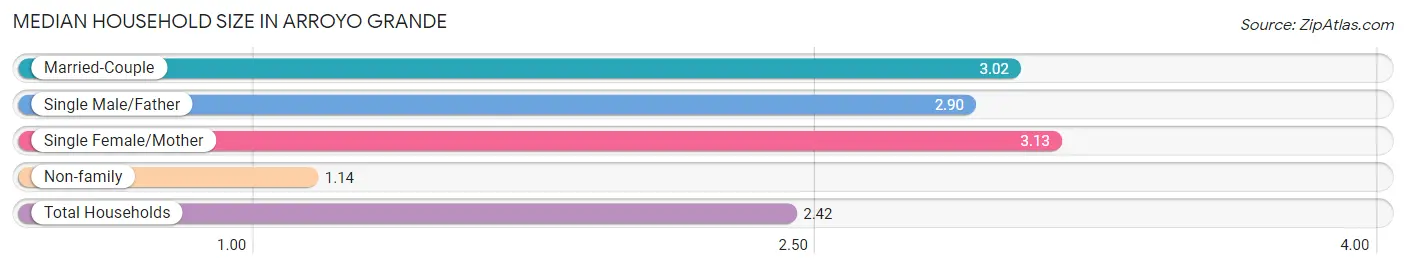
Median Household Size in Arroyo Grande
The median household size in Arroyo Grande is 2.42 persons per household, with single female/mother households (583 | 7.8%) accounting for the largest median household size of 3.13 persons per household. non-family households (2,414 | 32.2%) represent the smallest median household size with 1.14 persons per household.
| Household Type | # Households | Household Size |
| Married-Couple | 4,083 (54.4%) | 3.02 |
| Single Male/Father | 424 (5.7%) | 2.90 |
| Single Female/Mother | 583 (7.8%) | 3.13 |
| Non-family | 2,414 (32.2%) | 1.14 |
| Total Households | 7,504 (100.0%) | 2.42 |
Household Size by Marriage Status in Arroyo Grande
Out of a total of 7,504 households in Arroyo Grande, 5,090 (67.8%) are family households, while 2,414 (32.2%) are nonfamily households. The most numerous type of family households are 2-person households, comprising 2,481, and the most common type of nonfamily households are 1-person households, comprising 2,115.
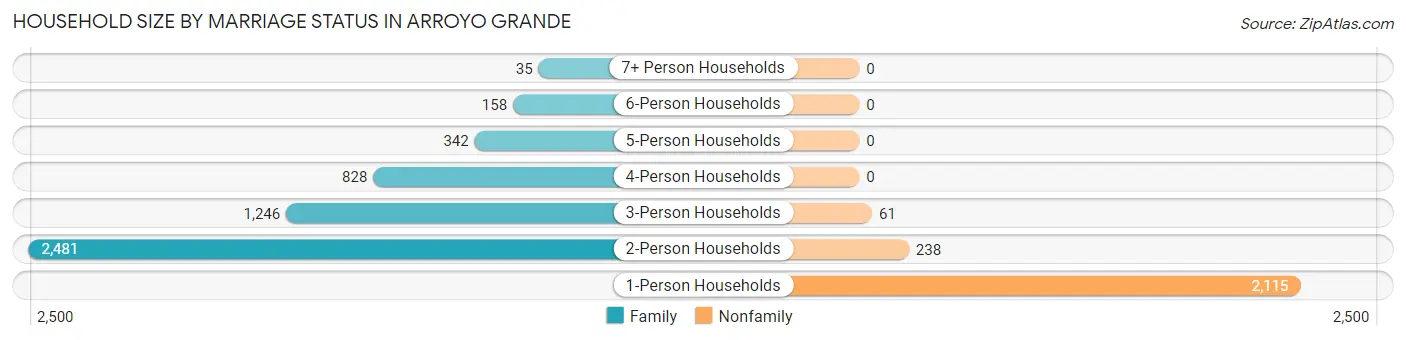
| Household Size | Family Households | Nonfamily Households |
| 1-Person Households | - | 2,115 (28.2%) |
| 2-Person Households | 2,481 (33.1%) | 238 (3.2%) |
| 3-Person Households | 1,246 (16.6%) | 61 (0.8%) |
| 4-Person Households | 828 (11.0%) | 0 (0.0%) |
| 5-Person Households | 342 (4.6%) | 0 (0.0%) |
| 6-Person Households | 158 (2.1%) | 0 (0.0%) |
| 7+ Person Households | 35 (0.5%) | 0 (0.0%) |
| Total | 5,090 (67.8%) | 2,414 (32.2%) |
Female Fertility in Arroyo Grande
Fertility by Age in Arroyo Grande
Average fertility rate in Arroyo Grande is 67.0 births per 1,000 women. Women in the age bracket of 20 to 34 years have the highest fertility rate with 121.0 births per 1,000 women. Women in the age bracket of 20 to 34 years acount for 72.3% of all women with births.
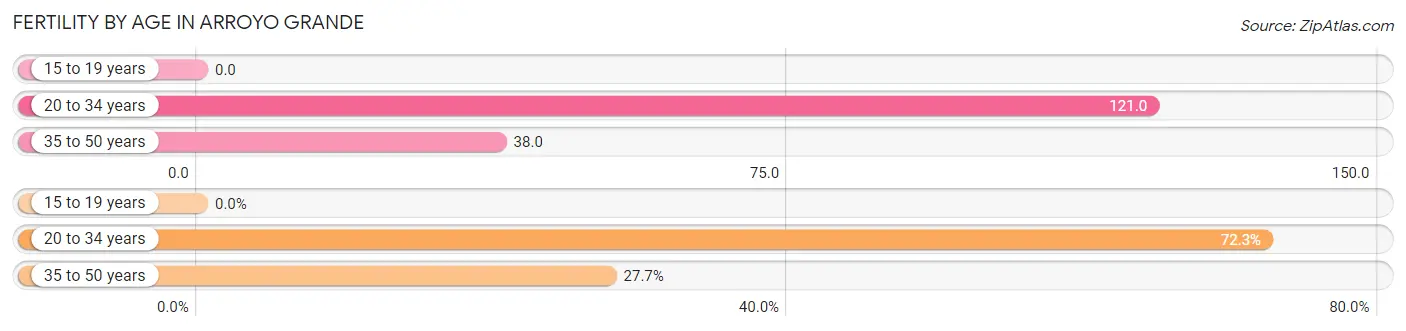
| Age Bracket | Women with Births | Births / 1,000 Women |
| 15 to 19 years | 0 (0.0%) | 0.0 |
| 20 to 34 years | 185 (72.3%) | 121.0 |
| 35 to 50 years | 71 (27.7%) | 38.0 |
| Total | 256 (100.0%) | 67.0 |
Fertility by Age by Marriage Status in Arroyo Grande
64.1% of women with births (256) in Arroyo Grande are married. The highest percentage of unmarried women with births falls into 20 to 34 years age bracket with 49.7% of them unmarried at the time of birth, while the lowest percentage of unmarried women with births belong to 35 to 50 years age bracket with 0.0% of them unmarried.
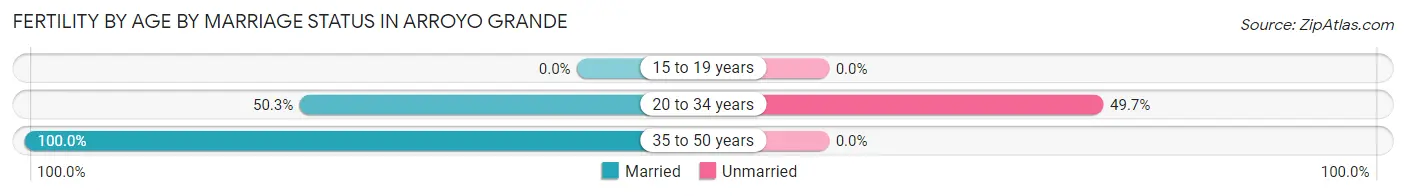
| Age Bracket | Married | Unmarried |
| 15 to 19 years | 0 (0.0%) | 0 (0.0%) |
| 20 to 34 years | 93 (50.3%) | 92 (49.7%) |
| 35 to 50 years | 71 (100.0%) | 0 (0.0%) |
| Total | 164 (64.1%) | 92 (35.9%) |
Fertility by Education in Arroyo Grande
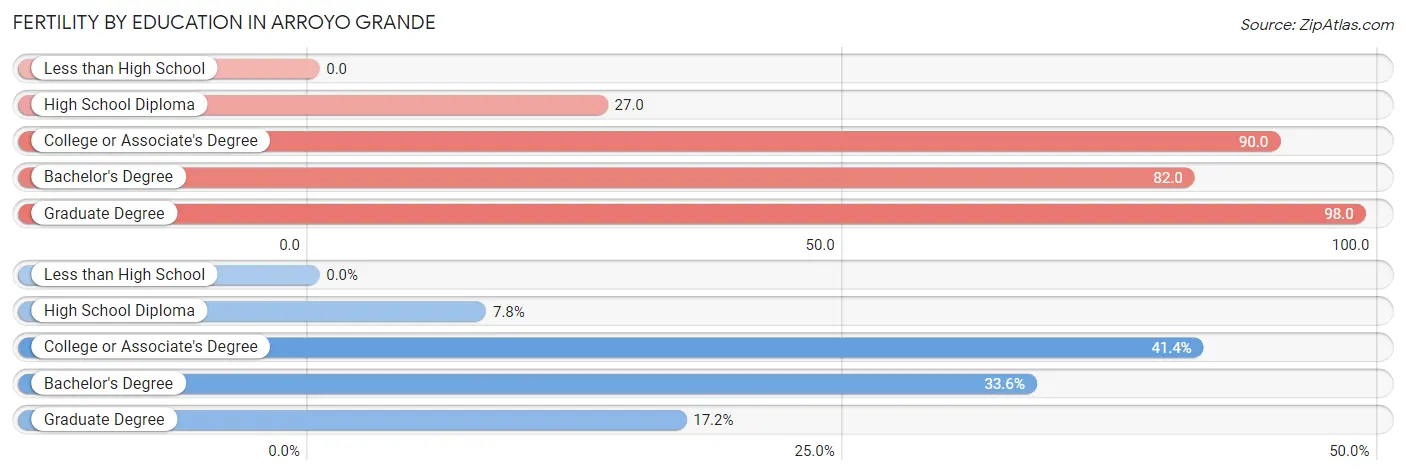
| Educational Attainment | Women with Births | Births / 1,000 Women |
| Less than High School | 0 (0.0%) | 0.0 |
| High School Diploma | 20 (7.8%) | 27.0 |
| College or Associate's Degree | 106 (41.4%) | 90.0 |
| Bachelor's Degree | 86 (33.6%) | 82.0 |
| Graduate Degree | 44 (17.2%) | 98.0 |
| Total | 256 (100.0%) | 67.0 |
Fertility by Education by Marriage Status in Arroyo Grande
35.9% of women with births in Arroyo Grande are unmarried. Women with the educational attainment of high school diploma are most likely to be married with 100.0% of them married at childbirth, while women with the educational attainment of bachelor's degree are least likely to be married with 54.6% of them unmarried at childbirth.
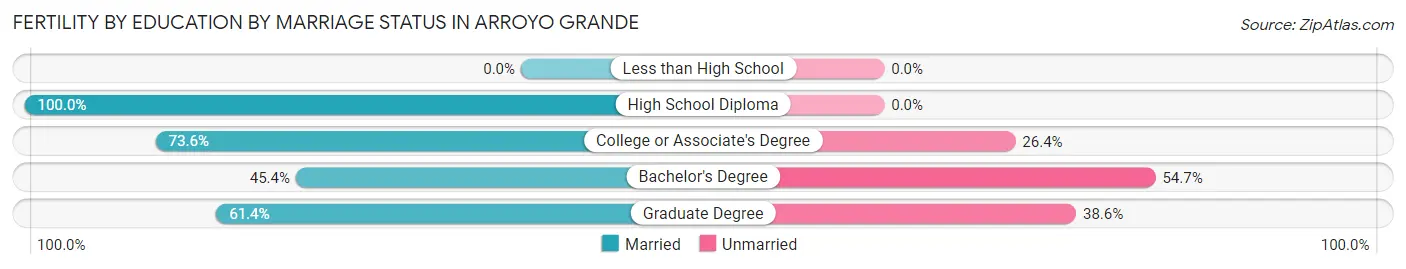
| Educational Attainment | Married | Unmarried |
| Less than High School | 0 (0.0%) | 0 (0.0%) |
| High School Diploma | 20 (100.0%) | 0 (0.0%) |
| College or Associate's Degree | 78 (73.6%) | 28 (26.4%) |
| Bachelor's Degree | 39 (45.4%) | 47 (54.6%) |
| Graduate Degree | 27 (61.4%) | 17 (38.6%) |
| Total | 164 (64.1%) | 92 (35.9%) |
Employment Characteristics in Arroyo Grande
Employment by Class of Employer in Arroyo Grande
Among the 8,575 employed individuals in Arroyo Grande, private company employees (5,416 | 63.2%), local government employees (890 | 10.4%), and self-employed (not incorporated) (746 | 8.7%) make up the most common classes of employment.
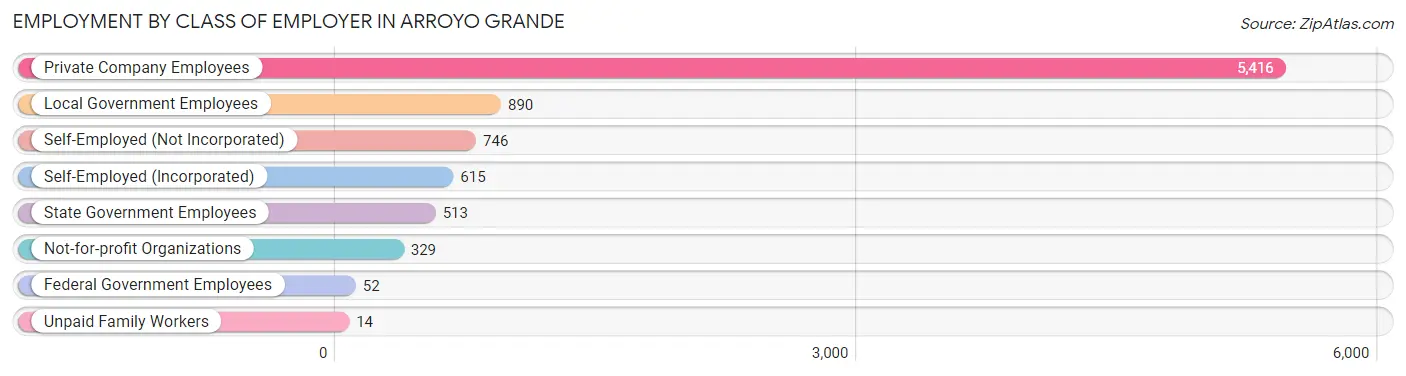
| Employer Class | # Employees | % Employees |
| Private Company Employees | 5,416 | 63.2% |
| Self-Employed (Incorporated) | 615 | 7.2% |
| Self-Employed (Not Incorporated) | 746 | 8.7% |
| Not-for-profit Organizations | 329 | 3.8% |
| Local Government Employees | 890 | 10.4% |
| State Government Employees | 513 | 6.0% |
| Federal Government Employees | 52 | 0.6% |
| Unpaid Family Workers | 14 | 0.2% |
| Total | 8,575 | 100.0% |
Employment Status by Age in Arroyo Grande
According to the labor force statistics for Arroyo Grande, out of the total population over 16 years of age (15,373), 58.1% or 8,932 individuals are in the labor force, with 2.2% or 197 of them unemployed. The age group with the highest labor force participation rate is 45 to 54 years, with 85.3% or 1,871 individuals in the labor force. Within the labor force, the 55 to 59 years age range has the highest percentage of unemployed individuals, with 6.3% or 75 of them being unemployed.
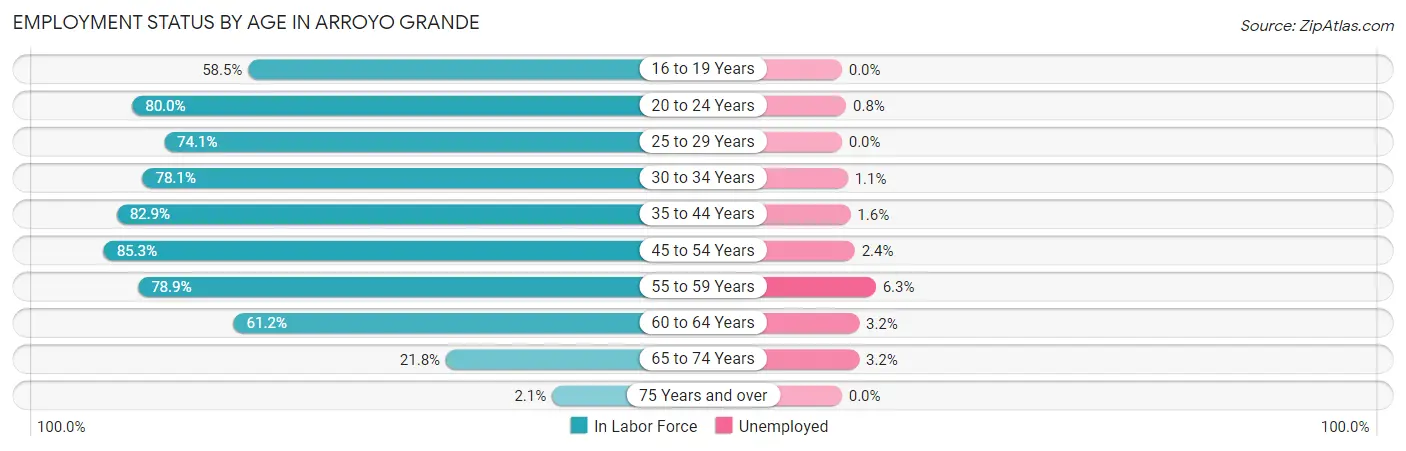
| Age Bracket | In Labor Force | Unemployed |
| 16 to 19 Years | 646 (58.5%) | 0 (0.0%) |
| 20 to 24 Years | 905 (80.0%) | 7 (0.8%) |
| 25 to 29 Years | 694 (74.1%) | 0 (0.0%) |
| 30 to 34 Years | 747 (78.1%) | 8 (1.1%) |
| 35 to 44 Years | 1,650 (82.9%) | 26 (1.6%) |
| 45 to 54 Years | 1,871 (85.3%) | 45 (2.4%) |
| 55 to 59 Years | 1,187 (78.9%) | 75 (6.3%) |
| 60 to 64 Years | 656 (61.2%) | 21 (3.2%) |
| 65 to 74 Years | 537 (21.8%) | 17 (3.2%) |
| 75 Years and over | 42 (2.1%) | 0 (0.0%) |
| Total | 8,932 (58.1%) | 197 (2.2%) |
Employment Status by Educational Attainment in Arroyo Grande
According to labor force statistics for Arroyo Grande, 78.7% of individuals (6,810) out of the total population between 25 and 64 years of age (8,653) are in the labor force, with 2.6% or 177 of them being unemployed. The group with the highest labor force participation rate are those with the educational attainment of bachelor's degree or higher, with 85.4% or 2,949 individuals in the labor force. Within the labor force, individuals with bachelor's degree or higher education have the highest percentage of unemployment, with 3.3% or 97 of them being unemployed.
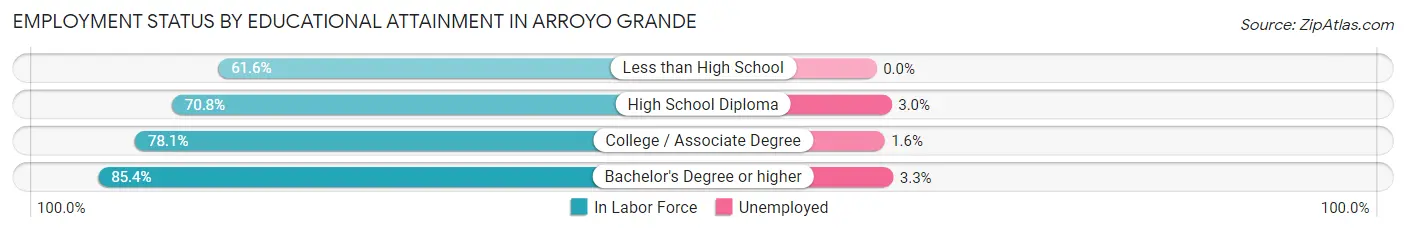
| Educational Attainment | In Labor Force | Unemployed |
| Less than High School | 253 (61.6%) | 0 (0.0%) |
| High School Diploma | 1,316 (70.8%) | 56 (3.0%) |
| College / Associate Degree | 2,288 (78.1%) | 47 (1.6%) |
| Bachelor's Degree or higher | 2,949 (85.4%) | 114 (3.3%) |
| Total | 6,810 (78.7%) | 225 (2.6%) |
Employment Occupations by Sex in Arroyo Grande
Management, Business, Science and Arts Occupations
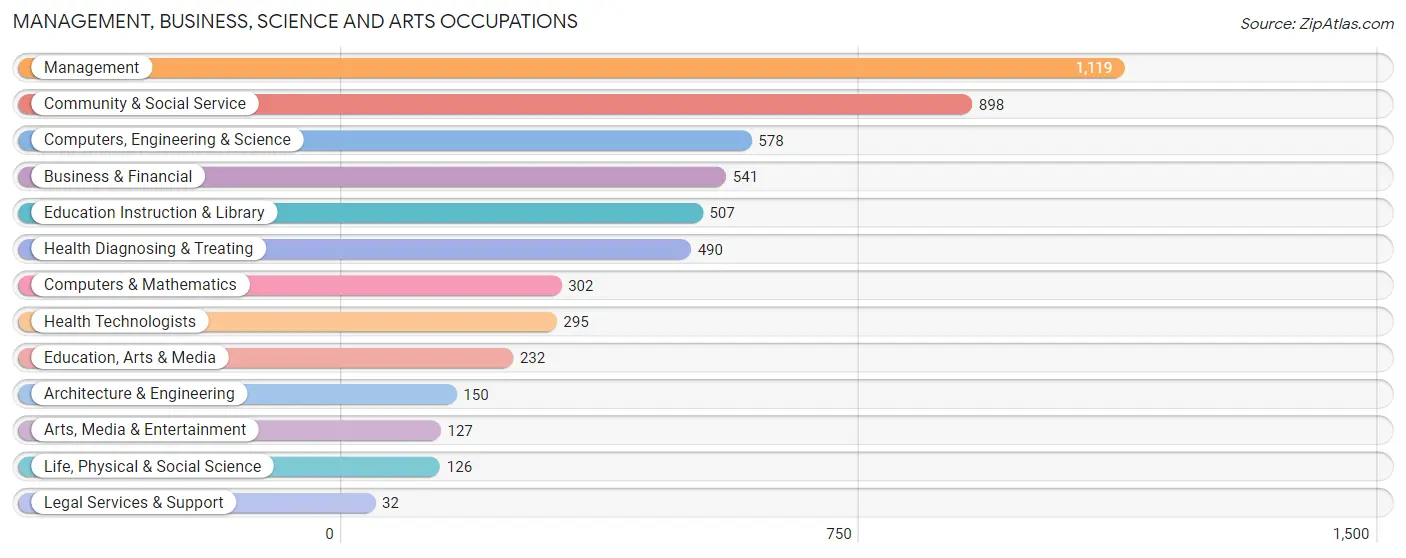
The most common Management, Business, Science and Arts occupations in Arroyo Grande are Management (1,119 | 12.8%), Community & Social Service (898 | 10.3%), Computers, Engineering & Science (578 | 6.6%), Business & Financial (541 | 6.2%), and Education Instruction & Library (507 | 5.8%).
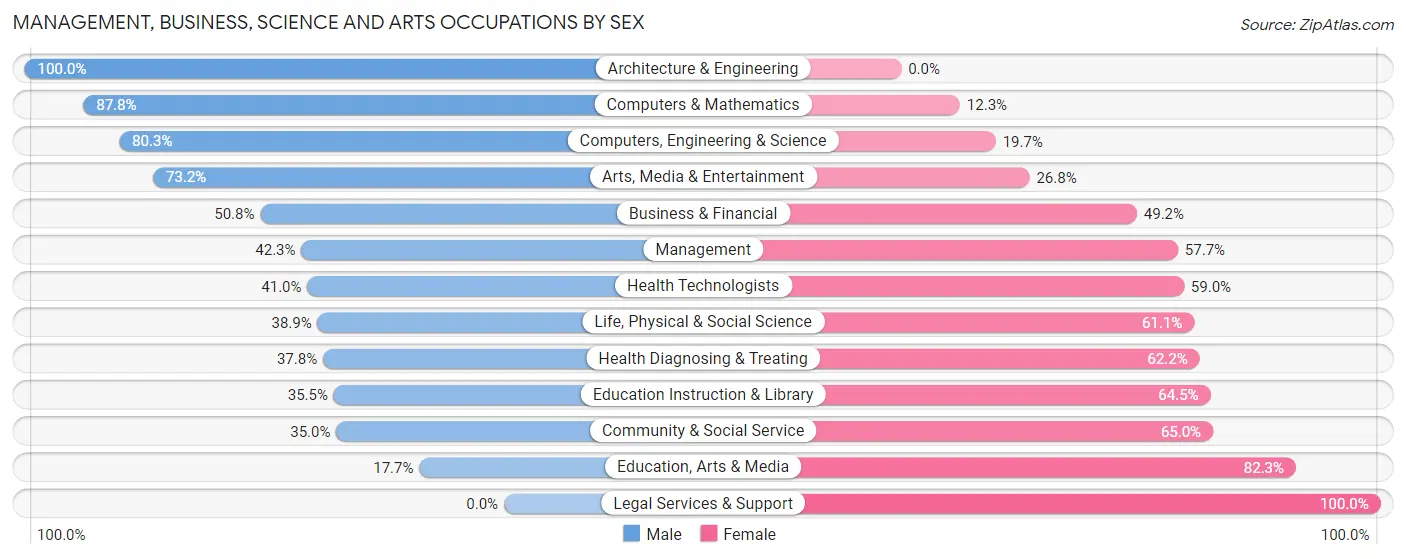
Management, Business, Science and Arts Occupations by Sex
Within the Management, Business, Science and Arts occupations in Arroyo Grande, the most male-oriented occupations are Architecture & Engineering (100.0%), Computers & Mathematics (87.7%), and Computers, Engineering & Science (80.3%), while the most female-oriented occupations are Legal Services & Support (100.0%), Education, Arts & Media (82.3%), and Community & Social Service (65.0%).
| Occupation | Male | Female |
| Management | 473 (42.3%) | 646 (57.7%) |
| Business & Financial | 275 (50.8%) | 266 (49.2%) |
| Computers, Engineering & Science | 464 (80.3%) | 114 (19.7%) |
| Computers & Mathematics | 265 (87.7%) | 37 (12.2%) |
| Architecture & Engineering | 150 (100.0%) | 0 (0.0%) |
| Life, Physical & Social Science | 49 (38.9%) | 77 (61.1%) |
| Community & Social Service | 314 (35.0%) | 584 (65.0%) |
| Education, Arts & Media | 41 (17.7%) | 191 (82.3%) |
| Legal Services & Support | 0 (0.0%) | 32 (100.0%) |
| Education Instruction & Library | 180 (35.5%) | 327 (64.5%) |
| Arts, Media & Entertainment | 93 (73.2%) | 34 (26.8%) |
| Health Diagnosing & Treating | 185 (37.8%) | 305 (62.2%) |
| Health Technologists | 121 (41.0%) | 174 (59.0%) |
| Total (Category) | 1,711 (47.2%) | 1,915 (52.8%) |
| Total (Overall) | 4,867 (55.7%) | 3,863 (44.3%) |
Services Occupations
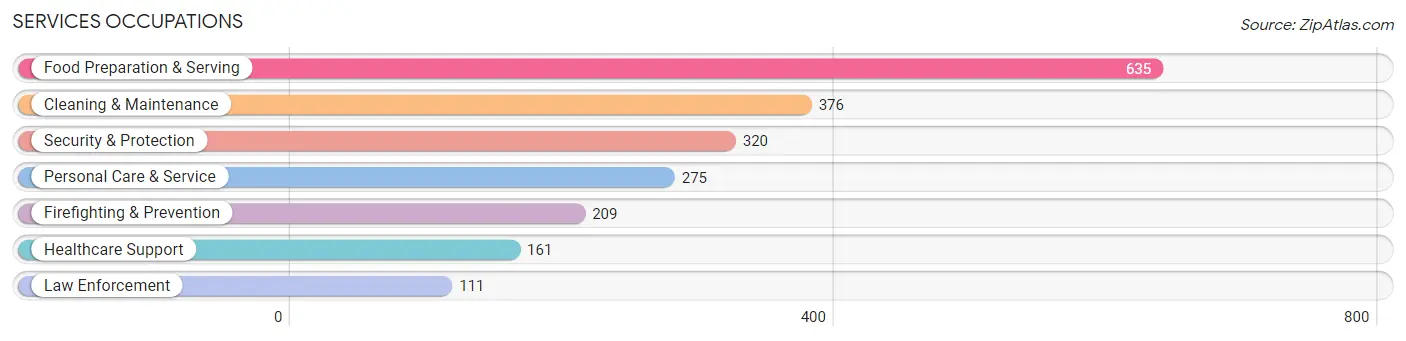
The most common Services occupations in Arroyo Grande are Food Preparation & Serving (635 | 7.3%), Cleaning & Maintenance (376 | 4.3%), Security & Protection (320 | 3.7%), Personal Care & Service (275 | 3.2%), and Firefighting & Prevention (209 | 2.4%).
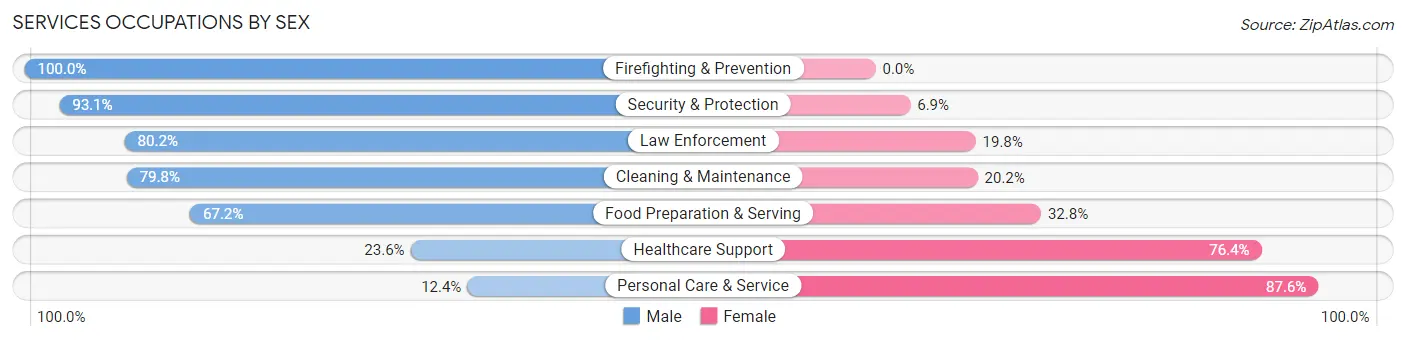
Services Occupations by Sex
Within the Services occupations in Arroyo Grande, the most male-oriented occupations are Firefighting & Prevention (100.0%), Security & Protection (93.1%), and Law Enforcement (80.2%), while the most female-oriented occupations are Personal Care & Service (87.6%), Healthcare Support (76.4%), and Food Preparation & Serving (32.8%).
| Occupation | Male | Female |
| Healthcare Support | 38 (23.6%) | 123 (76.4%) |
| Security & Protection | 298 (93.1%) | 22 (6.9%) |
| Firefighting & Prevention | 209 (100.0%) | 0 (0.0%) |
| Law Enforcement | 89 (80.2%) | 22 (19.8%) |
| Food Preparation & Serving | 427 (67.2%) | 208 (32.8%) |
| Cleaning & Maintenance | 300 (79.8%) | 76 (20.2%) |
| Personal Care & Service | 34 (12.4%) | 241 (87.6%) |
| Total (Category) | 1,097 (62.1%) | 670 (37.9%) |
| Total (Overall) | 4,867 (55.7%) | 3,863 (44.3%) |
Sales and Office Occupations
The most common Sales and Office occupations in Arroyo Grande are Office & Administration (1,283 | 14.7%), and Sales & Related (677 | 7.7%).
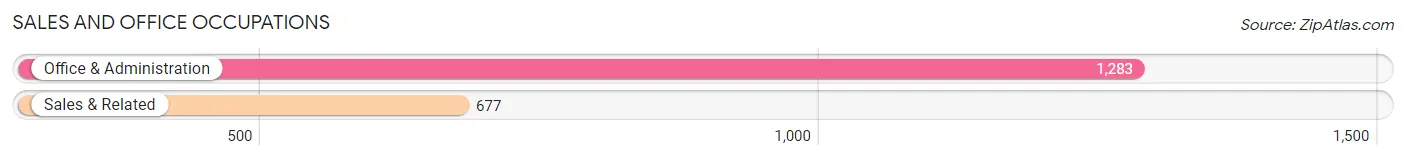
Sales and Office Occupations by Sex

| Occupation | Male | Female |
| Sales & Related | 367 (54.2%) | 310 (45.8%) |
| Office & Administration | 457 (35.6%) | 826 (64.4%) |
| Total (Category) | 824 (42.0%) | 1,136 (58.0%) |
| Total (Overall) | 4,867 (55.7%) | 3,863 (44.3%) |
Natural Resources, Construction and Maintenance Occupations
The most common Natural Resources, Construction and Maintenance occupations in Arroyo Grande are Construction & Extraction (711 | 8.1%), and Installation, Maintenance & Repair (225 | 2.6%).
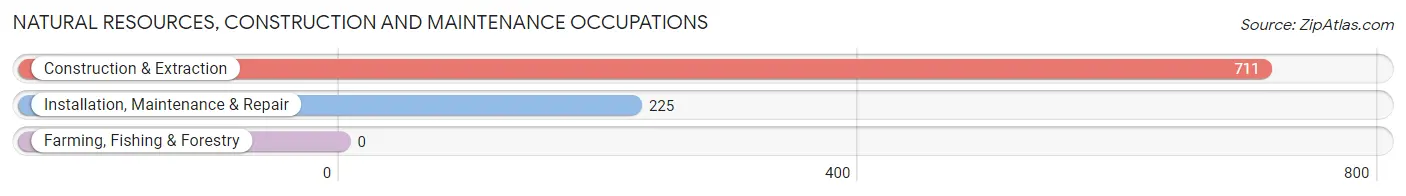
Natural Resources, Construction and Maintenance Occupations by Sex
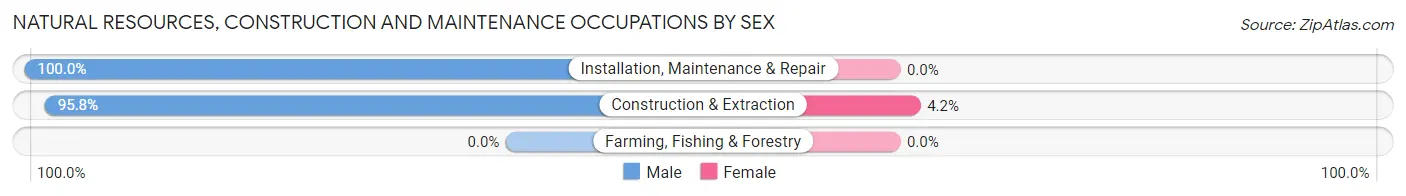
| Occupation | Male | Female |
| Farming, Fishing & Forestry | 0 (0.0%) | 0 (0.0%) |
| Construction & Extraction | 681 (95.8%) | 30 (4.2%) |
| Installation, Maintenance & Repair | 225 (100.0%) | 0 (0.0%) |
| Total (Category) | 906 (96.8%) | 30 (3.2%) |
| Total (Overall) | 4,867 (55.7%) | 3,863 (44.3%) |
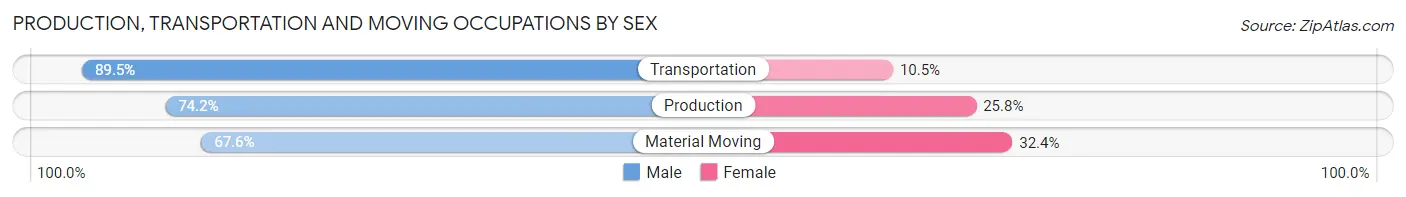
Production, Transportation and Moving Occupations
The most common Production, Transportation and Moving occupations in Arroyo Grande are Production (217 | 2.5%), Material Moving (148 | 1.7%), and Transportation (76 | 0.9%).
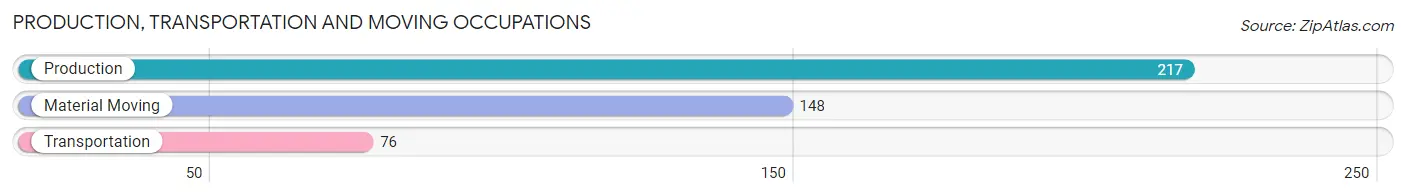
Production, Transportation and Moving Occupations by Sex
| Occupation | Male | Female |
| Production | 161 (74.2%) | 56 (25.8%) |
| Transportation | 68 (89.5%) | 8 (10.5%) |
| Material Moving | 100 (67.6%) | 48 (32.4%) |
| Total (Category) | 329 (74.6%) | 112 (25.4%) |
| Total (Overall) | 4,867 (55.7%) | 3,863 (44.3%) |
Employment Industries by Sex in Arroyo Grande
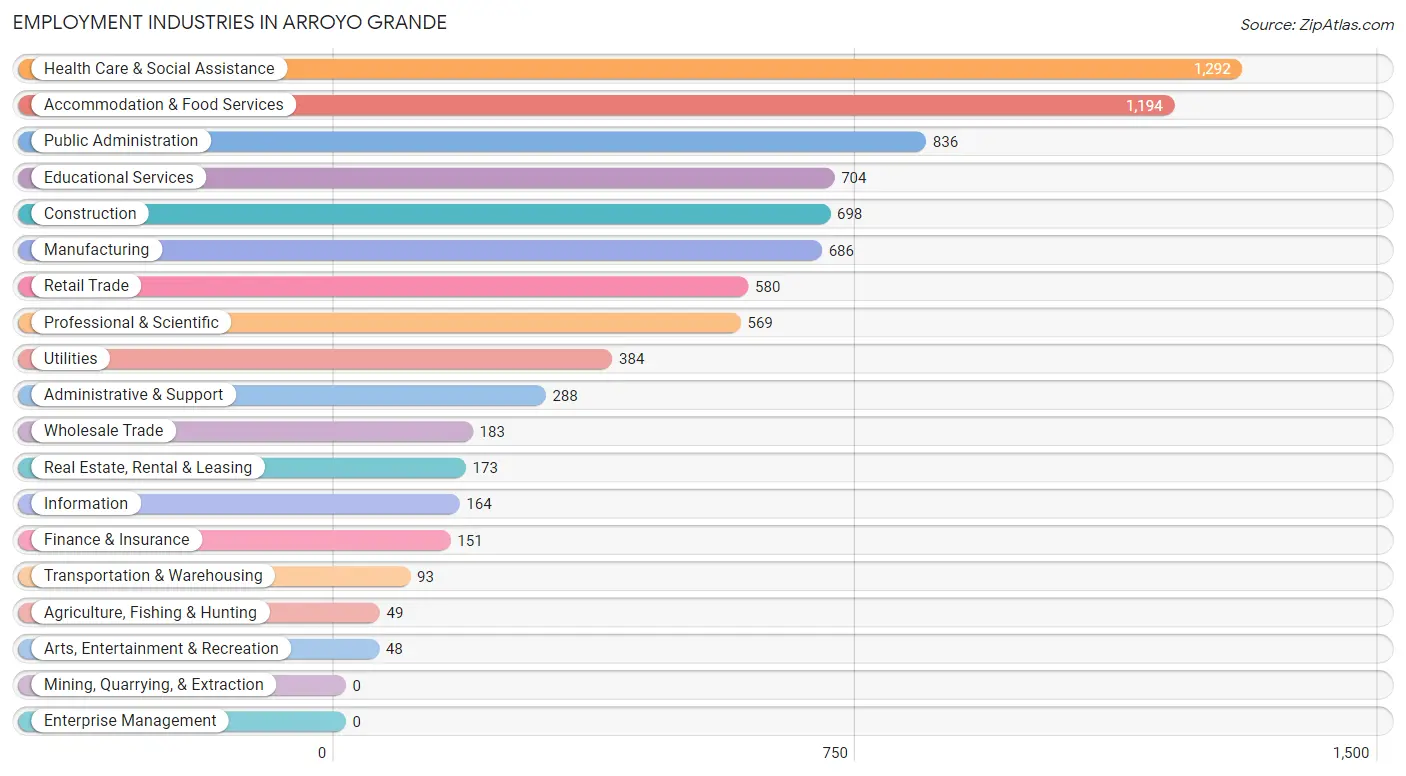
Employment Industries in Arroyo Grande
The major employment industries in Arroyo Grande include Health Care & Social Assistance (1,292 | 14.8%), Accommodation & Food Services (1,194 | 13.7%), Public Administration (836 | 9.6%), Educational Services (704 | 8.1%), and Construction (698 | 8.0%).
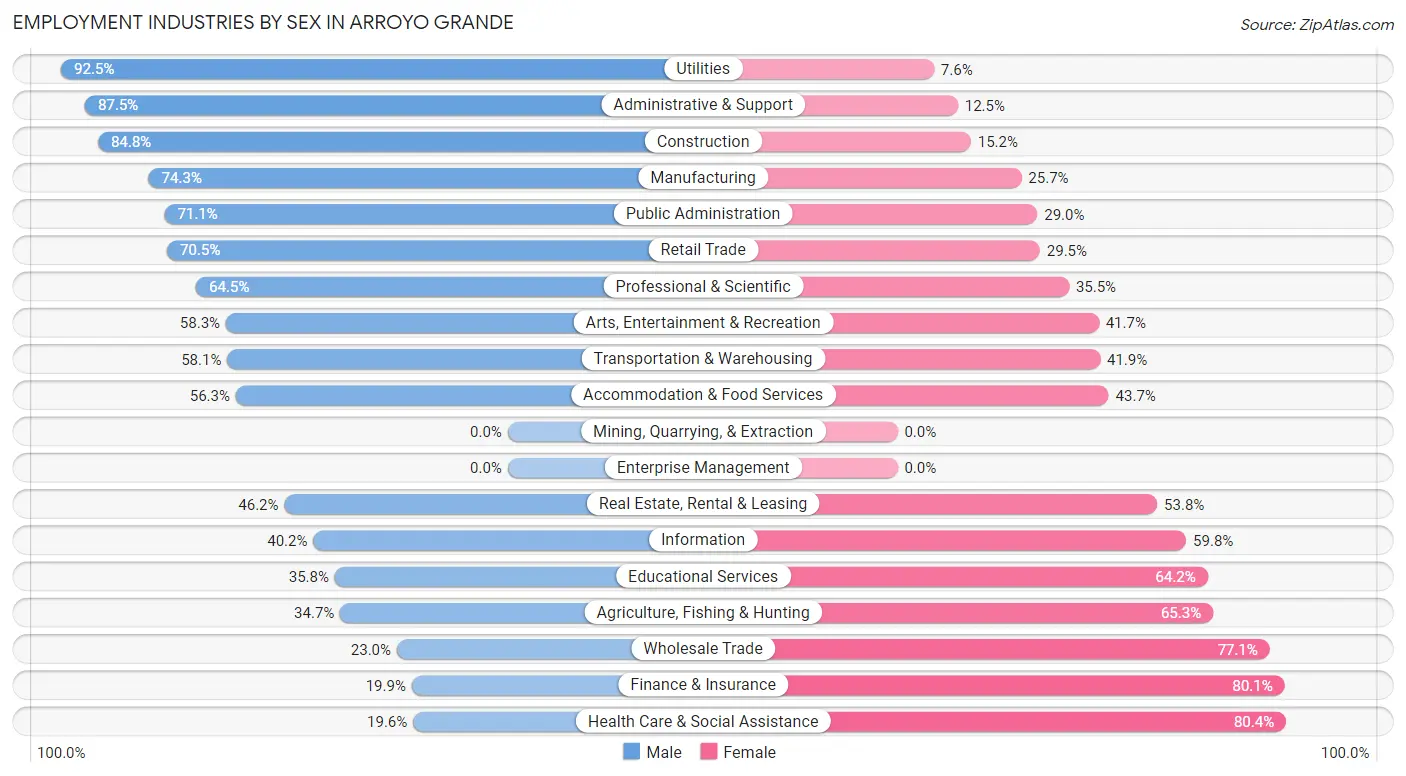
Employment Industries by Sex in Arroyo Grande
The Arroyo Grande industries that see more men than women are Utilities (92.4%), Administrative & Support (87.5%), and Construction (84.8%), whereas the industries that tend to have a higher number of women are Health Care & Social Assistance (80.4%), Finance & Insurance (80.1%), and Wholesale Trade (77.0%).
| Industry | Male | Female |
| Agriculture, Fishing & Hunting | 17 (34.7%) | 32 (65.3%) |
| Mining, Quarrying, & Extraction | 0 (0.0%) | 0 (0.0%) |
| Construction | 592 (84.8%) | 106 (15.2%) |
| Manufacturing | 510 (74.3%) | 176 (25.7%) |
| Wholesale Trade | 42 (23.0%) | 141 (77.0%) |
| Retail Trade | 409 (70.5%) | 171 (29.5%) |
| Transportation & Warehousing | 54 (58.1%) | 39 (41.9%) |
| Utilities | 355 (92.4%) | 29 (7.5%) |
| Information | 66 (40.2%) | 98 (59.8%) |
| Finance & Insurance | 30 (19.9%) | 121 (80.1%) |
| Real Estate, Rental & Leasing | 80 (46.2%) | 93 (53.8%) |
| Professional & Scientific | 367 (64.5%) | 202 (35.5%) |
| Enterprise Management | 0 (0.0%) | 0 (0.0%) |
| Administrative & Support | 252 (87.5%) | 36 (12.5%) |
| Educational Services | 252 (35.8%) | 452 (64.2%) |
| Health Care & Social Assistance | 253 (19.6%) | 1,039 (80.4%) |
| Arts, Entertainment & Recreation | 28 (58.3%) | 20 (41.7%) |
| Accommodation & Food Services | 672 (56.3%) | 522 (43.7%) |
| Public Administration | 594 (71.1%) | 242 (28.9%) |
| Total | 4,867 (55.7%) | 3,863 (44.3%) |
Education in Arroyo Grande
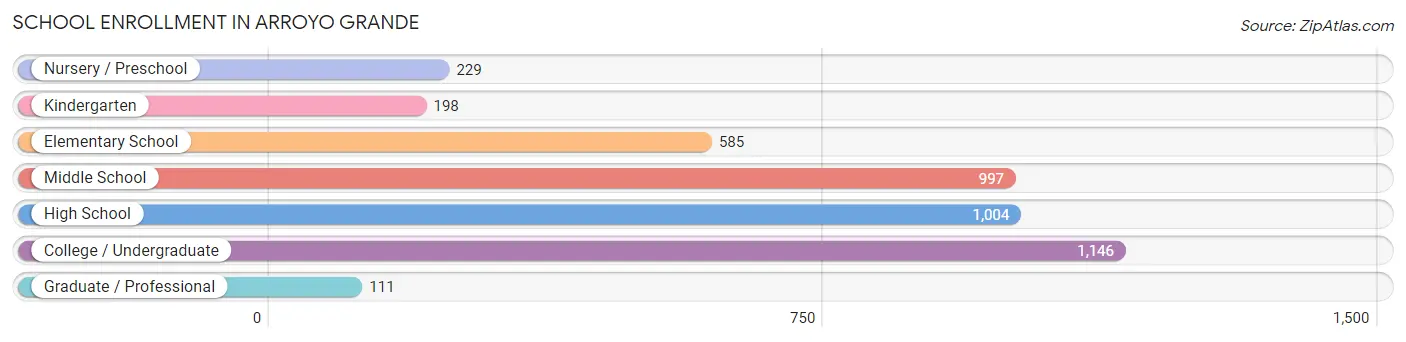
School Enrollment in Arroyo Grande
The most common levels of schooling among the 4,270 students in Arroyo Grande are college / undergraduate (1,146 | 26.8%), high school (1,004 | 23.5%), and middle school (997 | 23.4%).
| School Level | # Students | % Students |
| Nursery / Preschool | 229 | 5.4% |
| Kindergarten | 198 | 4.6% |
| Elementary School | 585 | 13.7% |
| Middle School | 997 | 23.4% |
| High School | 1,004 | 23.5% |
| College / Undergraduate | 1,146 | 26.8% |
| Graduate / Professional | 111 | 2.6% |
| Total | 4,270 | 100.0% |
School Enrollment by Age by Funding Source in Arroyo Grande
Out of a total of 4,270 students who are enrolled in schools in Arroyo Grande, 491 (11.5%) attend a private institution, while the remaining 3,779 (88.5%) are enrolled in public schools. The age group of 3 to 4 year olds has the highest likelihood of being enrolled in private schools, with 154 (95.1% in the age bracket) enrolled. Conversely, the age group of 18 to 19 year olds has the lowest likelihood of being enrolled in a private school, with 391 (100.0% in the age bracket) attending a public institution.
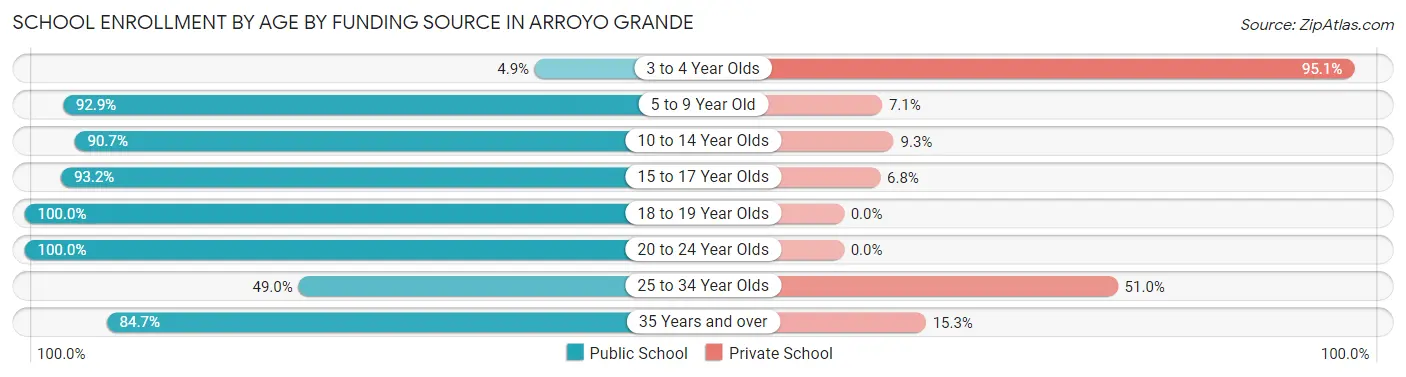
| Age Bracket | Public School | Private School |
| 3 to 4 Year Olds | 8 (4.9%) | 154 (95.1%) |
| 5 to 9 Year Old | 780 (92.9%) | 60 (7.1%) |
| 10 to 14 Year Olds | 1,044 (90.7%) | 107 (9.3%) |
| 15 to 17 Year Olds | 687 (93.2%) | 50 (6.8%) |
| 18 to 19 Year Olds | 391 (100.0%) | 0 (0.0%) |
| 20 to 24 Year Olds | 543 (100.0%) | 0 (0.0%) |
| 25 to 34 Year Olds | 71 (49.0%) | 74 (51.0%) |
| 35 Years and over | 255 (84.7%) | 46 (15.3%) |
| Total | 3,779 (88.5%) | 491 (11.5%) |
Educational Attainment by Field of Study in Arroyo Grande
Business (592 | 10.6%), liberal arts & history (569 | 10.2%), science & technology (541 | 9.7%), education (475 | 8.5%), and bio, nature & agricultural (442 | 7.9%) are the most common fields of study among 5,579 individuals in Arroyo Grande who have obtained a bachelor's degree or higher.
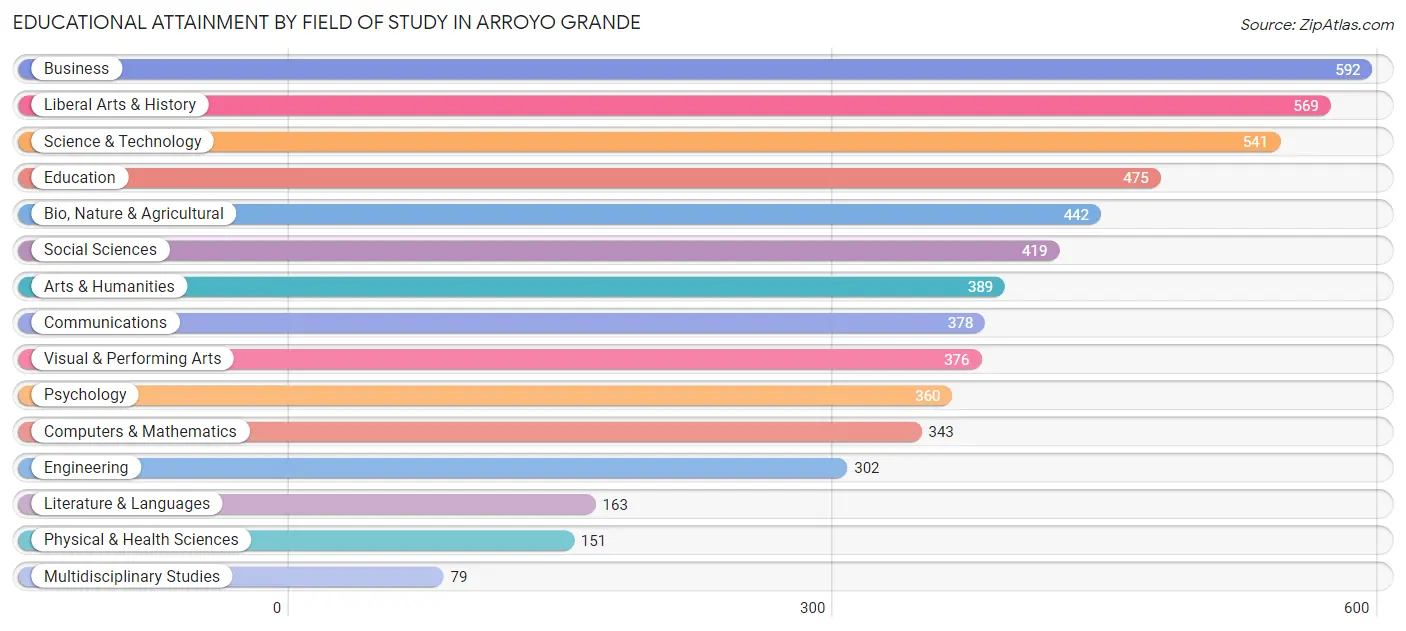
| Field of Study | # Graduates | % Graduates |
| Computers & Mathematics | 343 | 6.1% |
| Bio, Nature & Agricultural | 442 | 7.9% |
| Physical & Health Sciences | 151 | 2.7% |
| Psychology | 360 | 6.5% |
| Social Sciences | 419 | 7.5% |
| Engineering | 302 | 5.4% |
| Multidisciplinary Studies | 79 | 1.4% |
| Science & Technology | 541 | 9.7% |
| Business | 592 | 10.6% |
| Education | 475 | 8.5% |
| Literature & Languages | 163 | 2.9% |
| Liberal Arts & History | 569 | 10.2% |
| Visual & Performing Arts | 376 | 6.7% |
| Communications | 378 | 6.8% |
| Arts & Humanities | 389 | 7.0% |
| Total | 5,579 | 100.0% |
Transportation & Commute in Arroyo Grande
Vehicle Availability by Sex in Arroyo Grande
The most prevalent vehicle ownership categories in Arroyo Grande are males with 2 vehicles (1,778, accounting for 36.8%) and females with 2 vehicles (1,227, making up 47.8%).
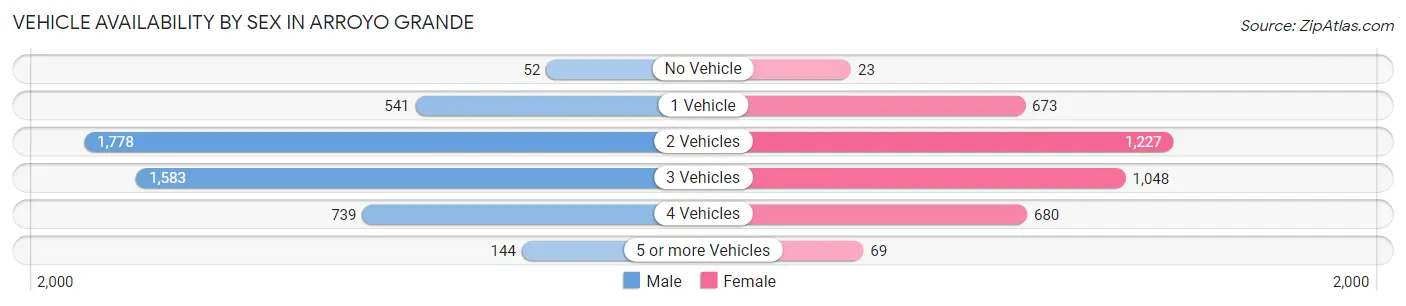
| Vehicles Available | Male | Female |
| No Vehicle | 52 (1.1%) | 23 (0.6%) |
| 1 Vehicle | 541 (11.2%) | 673 (18.1%) |
| 2 Vehicles | 1,778 (36.8%) | 1,227 (33.0%) |
| 3 Vehicles | 1,583 (32.7%) | 1,048 (28.2%) |
| 4 Vehicles | 739 (15.3%) | 680 (18.3%) |
| 5 or more Vehicles | 144 (3.0%) | 69 (1.8%) |
| Total | 4,837 (100.0%) | 3,720 (100.0%) |
Commute Time in Arroyo Grande
The most frequently occuring commute durations in Arroyo Grande are 20 to 24 minutes (1,309 commuters, 17.1%), 5 to 9 minutes (1,308 commuters, 17.1%), and 10 to 14 minutes (1,264 commuters, 16.5%).
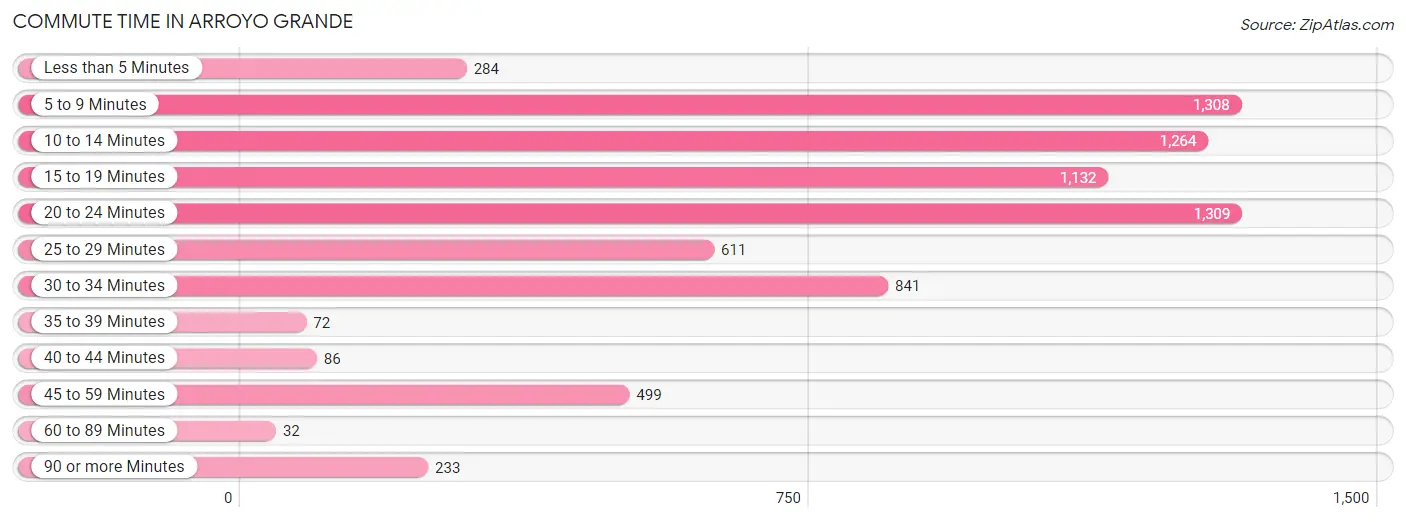
| Commute Time | # Commuters | % Commuters |
| Less than 5 Minutes | 284 | 3.7% |
| 5 to 9 Minutes | 1,308 | 17.1% |
| 10 to 14 Minutes | 1,264 | 16.5% |
| 15 to 19 Minutes | 1,132 | 14.8% |
| 20 to 24 Minutes | 1,309 | 17.1% |
| 25 to 29 Minutes | 611 | 8.0% |
| 30 to 34 Minutes | 841 | 11.0% |
| 35 to 39 Minutes | 72 | 0.9% |
| 40 to 44 Minutes | 86 | 1.1% |
| 45 to 59 Minutes | 499 | 6.5% |
| 60 to 89 Minutes | 32 | 0.4% |
| 90 or more Minutes | 233 | 3.0% |
Commute Time by Sex in Arroyo Grande
The most common commute times in Arroyo Grande are 20 to 24 minutes (828 commuters, 19.0%) for males and 5 to 9 minutes (766 commuters, 23.1%) for females.
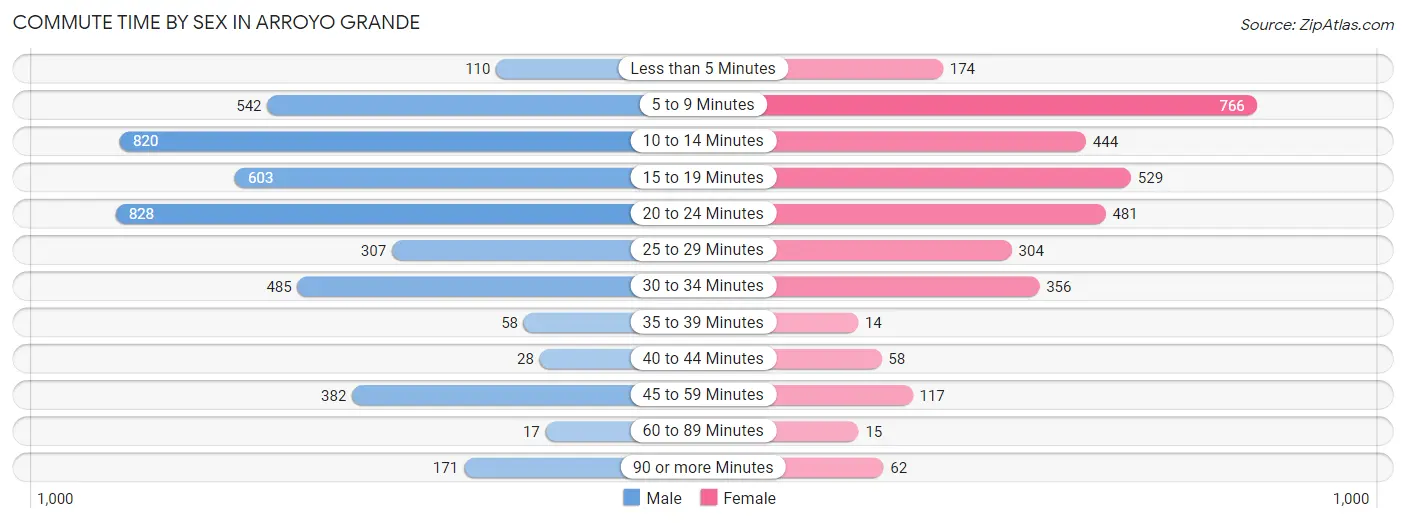
| Commute Time | Male | Female |
| Less than 5 Minutes | 110 (2.5%) | 174 (5.2%) |
| 5 to 9 Minutes | 542 (12.5%) | 766 (23.1%) |
| 10 to 14 Minutes | 820 (18.9%) | 444 (13.4%) |
| 15 to 19 Minutes | 603 (13.9%) | 529 (15.9%) |
| 20 to 24 Minutes | 828 (19.0%) | 481 (14.5%) |
| 25 to 29 Minutes | 307 (7.1%) | 304 (9.2%) |
| 30 to 34 Minutes | 485 (11.2%) | 356 (10.7%) |
| 35 to 39 Minutes | 58 (1.3%) | 14 (0.4%) |
| 40 to 44 Minutes | 28 (0.6%) | 58 (1.8%) |
| 45 to 59 Minutes | 382 (8.8%) | 117 (3.5%) |
| 60 to 89 Minutes | 17 (0.4%) | 15 (0.4%) |
| 90 or more Minutes | 171 (3.9%) | 62 (1.9%) |
Time of Departure to Work by Sex in Arroyo Grande
The most frequent times of departure to work in Arroyo Grande are 7:30 AM to 7:59 AM (795, 18.3%) for males and 7:30 AM to 7:59 AM (652, 19.6%) for females.
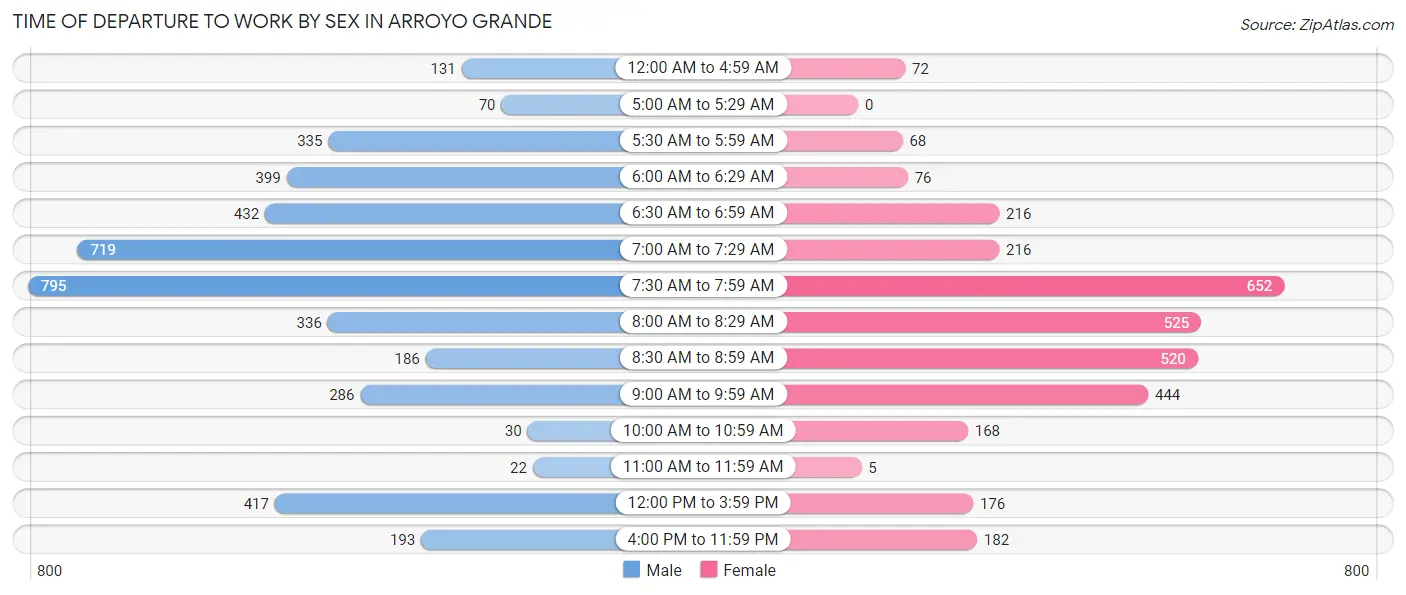
| Time of Departure | Male | Female |
| 12:00 AM to 4:59 AM | 131 (3.0%) | 72 (2.2%) |
| 5:00 AM to 5:29 AM | 70 (1.6%) | 0 (0.0%) |
| 5:30 AM to 5:59 AM | 335 (7.7%) | 68 (2.1%) |
| 6:00 AM to 6:29 AM | 399 (9.2%) | 76 (2.3%) |
| 6:30 AM to 6:59 AM | 432 (9.9%) | 216 (6.5%) |
| 7:00 AM to 7:29 AM | 719 (16.5%) | 216 (6.5%) |
| 7:30 AM to 7:59 AM | 795 (18.3%) | 652 (19.6%) |
| 8:00 AM to 8:29 AM | 336 (7.7%) | 525 (15.8%) |
| 8:30 AM to 8:59 AM | 186 (4.3%) | 520 (15.7%) |
| 9:00 AM to 9:59 AM | 286 (6.6%) | 444 (13.4%) |
| 10:00 AM to 10:59 AM | 30 (0.7%) | 168 (5.1%) |
| 11:00 AM to 11:59 AM | 22 (0.5%) | 5 (0.2%) |
| 12:00 PM to 3:59 PM | 417 (9.6%) | 176 (5.3%) |
| 4:00 PM to 11:59 PM | 193 (4.4%) | 182 (5.5%) |
| Total | 4,351 (100.0%) | 3,320 (100.0%) |
Housing Occupancy in Arroyo Grande
Occupancy by Ownership in Arroyo Grande
Of the total 7,504 dwellings in Arroyo Grande, owner-occupied units account for 4,708 (62.7%), while renter-occupied units make up 2,796 (37.3%).
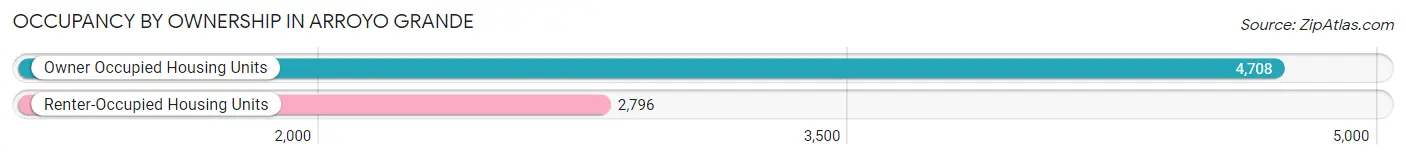
| Occupancy | # Housing Units | % Housing Units |
| Owner Occupied Housing Units | 4,708 | 62.7% |
| Renter-Occupied Housing Units | 2,796 | 37.3% |
| Total Occupied Housing Units | 7,504 | 100.0% |
Occupancy by Household Size in Arroyo Grande
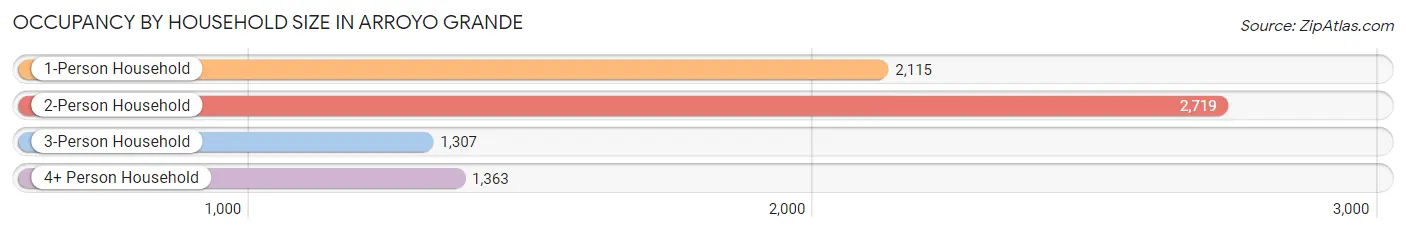
| Household Size | # Housing Units | % Housing Units |
| 1-Person Household | 2,115 | 28.2% |
| 2-Person Household | 2,719 | 36.2% |
| 3-Person Household | 1,307 | 17.4% |
| 4+ Person Household | 1,363 | 18.2% |
| Total Housing Units | 7,504 | 100.0% |
Occupancy by Ownership by Household Size in Arroyo Grande
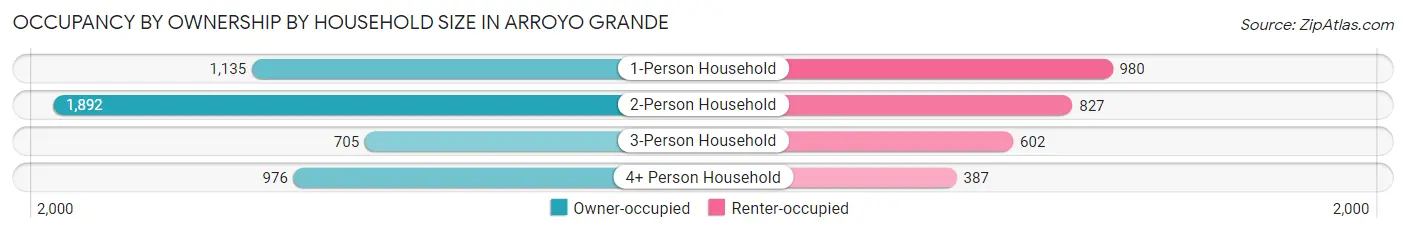
| Household Size | Owner-occupied | Renter-occupied |
| 1-Person Household | 1,135 (53.7%) | 980 (46.3%) |
| 2-Person Household | 1,892 (69.6%) | 827 (30.4%) |
| 3-Person Household | 705 (53.9%) | 602 (46.1%) |
| 4+ Person Household | 976 (71.6%) | 387 (28.4%) |
| Total Housing Units | 4,708 (62.7%) | 2,796 (37.3%) |
Occupancy by Educational Attainment in Arroyo Grande
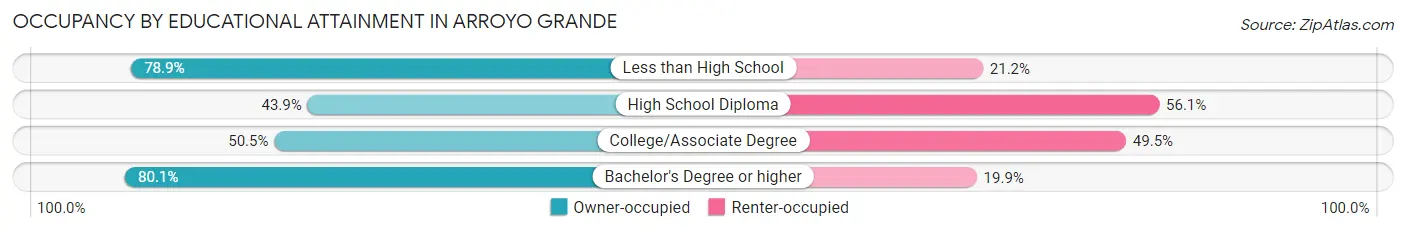
| Household Size | Owner-occupied | Renter-occupied |
| Less than High School | 179 (78.8%) | 48 (21.1%) |
| High School Diploma | 576 (43.9%) | 736 (56.1%) |
| College/Associate Degree | 1,405 (50.5%) | 1,378 (49.5%) |
| Bachelor's Degree or higher | 2,548 (80.1%) | 634 (19.9%) |
Occupancy by Age of Householder in Arroyo Grande
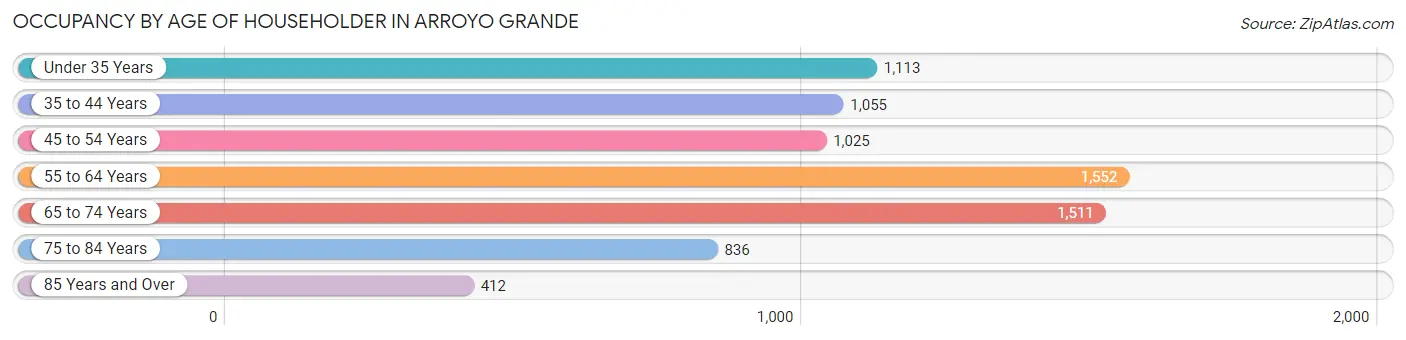
| Age Bracket | # Households | % Households |
| Under 35 Years | 1,113 | 14.8% |
| 35 to 44 Years | 1,055 | 14.1% |
| 45 to 54 Years | 1,025 | 13.7% |
| 55 to 64 Years | 1,552 | 20.7% |
| 65 to 74 Years | 1,511 | 20.1% |
| 75 to 84 Years | 836 | 11.1% |
| 85 Years and Over | 412 | 5.5% |
| Total | 7,504 | 100.0% |
Housing Finances in Arroyo Grande
Median Income by Occupancy in Arroyo Grande
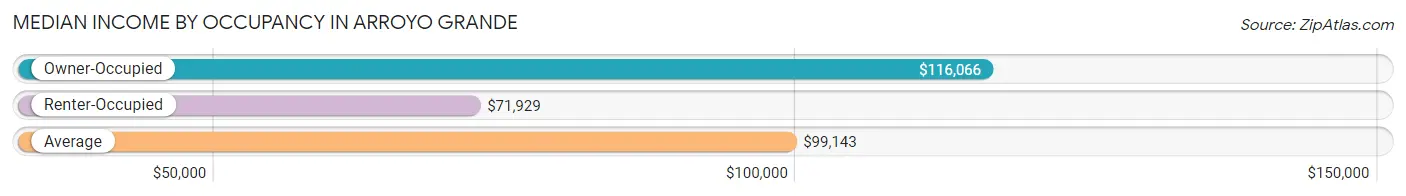
| Occupancy Type | # Households | Median Income |
| Owner-Occupied | 4,708 (62.7%) | $116,066 |
| Renter-Occupied | 2,796 (37.3%) | $71,929 |
| Average | 7,504 (100.0%) | $99,143 |
Occupancy by Householder Income Bracket in Arroyo Grande
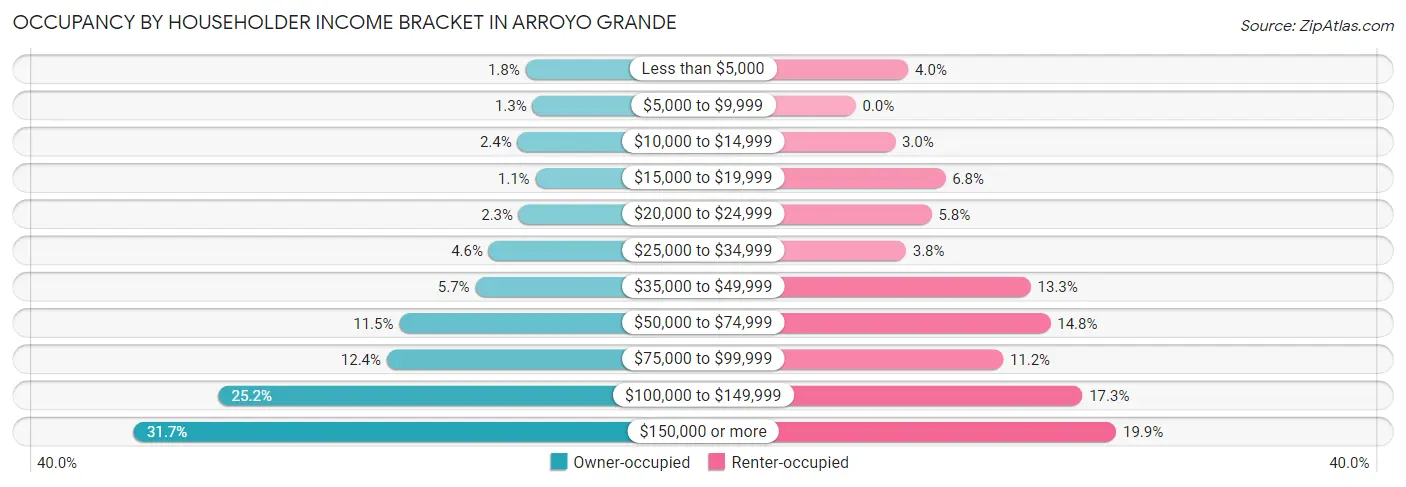
| Income Bracket | Owner-occupied | Renter-occupied |
| Less than $5,000 | 86 (1.8%) | 112 (4.0%) |
| $5,000 to $9,999 | 61 (1.3%) | 0 (0.0%) |
| $10,000 to $14,999 | 115 (2.4%) | 84 (3.0%) |
| $15,000 to $19,999 | 51 (1.1%) | 191 (6.8%) |
| $20,000 to $24,999 | 110 (2.3%) | 162 (5.8%) |
| $25,000 to $34,999 | 218 (4.6%) | 107 (3.8%) |
| $35,000 to $49,999 | 266 (5.7%) | 373 (13.3%) |
| $50,000 to $74,999 | 539 (11.5%) | 415 (14.8%) |
| $75,000 to $99,999 | 584 (12.4%) | 314 (11.2%) |
| $100,000 to $149,999 | 1,187 (25.2%) | 483 (17.3%) |
| $150,000 or more | 1,491 (31.7%) | 555 (19.9%) |
| Total | 4,708 (100.0%) | 2,796 (100.0%) |
Monthly Housing Cost Tiers in Arroyo Grande
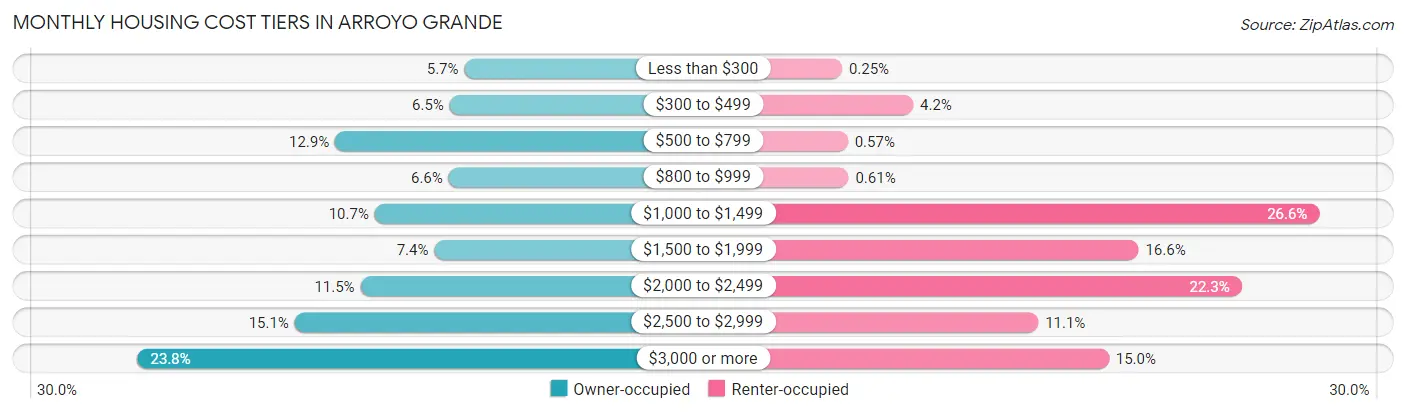
| Monthly Cost | Owner-occupied | Renter-occupied |
| Less than $300 | 269 (5.7%) | 7 (0.3%) |
| $300 to $499 | 307 (6.5%) | 117 (4.2%) |
| $500 to $799 | 605 (12.9%) | 16 (0.6%) |
| $800 to $999 | 310 (6.6%) | 17 (0.6%) |
| $1,000 to $1,499 | 502 (10.7%) | 744 (26.6%) |
| $1,500 to $1,999 | 347 (7.4%) | 465 (16.6%) |
| $2,000 to $2,499 | 539 (11.5%) | 624 (22.3%) |
| $2,500 to $2,999 | 710 (15.1%) | 310 (11.1%) |
| $3,000 or more | 1,119 (23.8%) | 419 (15.0%) |
| Total | 4,708 (100.0%) | 2,796 (100.0%) |
Physical Housing Characteristics in Arroyo Grande
Housing Structures in Arroyo Grande
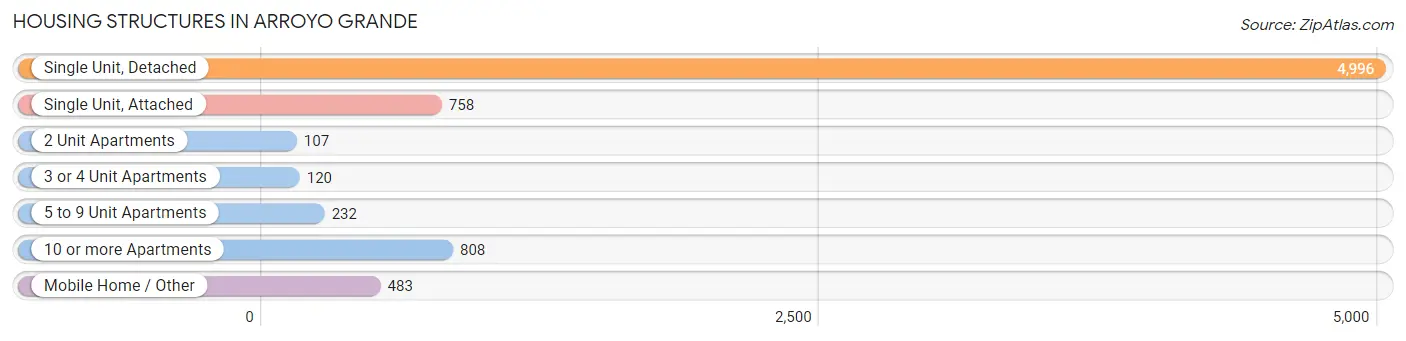
| Structure Type | # Housing Units | % Housing Units |
| Single Unit, Detached | 4,996 | 66.6% |
| Single Unit, Attached | 758 | 10.1% |
| 2 Unit Apartments | 107 | 1.4% |
| 3 or 4 Unit Apartments | 120 | 1.6% |
| 5 to 9 Unit Apartments | 232 | 3.1% |
| 10 or more Apartments | 808 | 10.8% |
| Mobile Home / Other | 483 | 6.4% |
| Total | 7,504 | 100.0% |
Housing Structures by Occupancy in Arroyo Grande
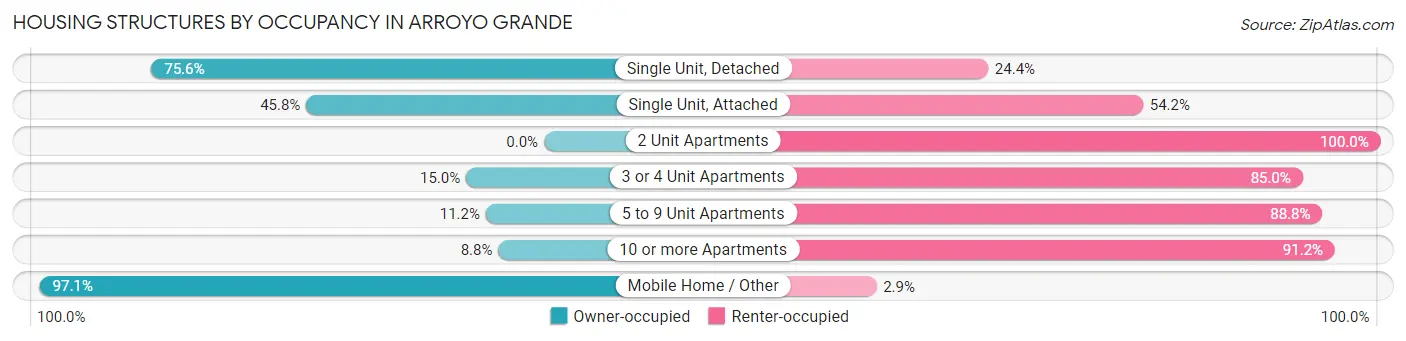
| Structure Type | Owner-occupied | Renter-occupied |
| Single Unit, Detached | 3,777 (75.6%) | 1,219 (24.4%) |
| Single Unit, Attached | 347 (45.8%) | 411 (54.2%) |
| 2 Unit Apartments | 0 (0.0%) | 107 (100.0%) |
| 3 or 4 Unit Apartments | 18 (15.0%) | 102 (85.0%) |
| 5 to 9 Unit Apartments | 26 (11.2%) | 206 (88.8%) |
| 10 or more Apartments | 71 (8.8%) | 737 (91.2%) |
| Mobile Home / Other | 469 (97.1%) | 14 (2.9%) |
| Total | 4,708 (62.7%) | 2,796 (37.3%) |
Housing Structures by Number of Rooms in Arroyo Grande
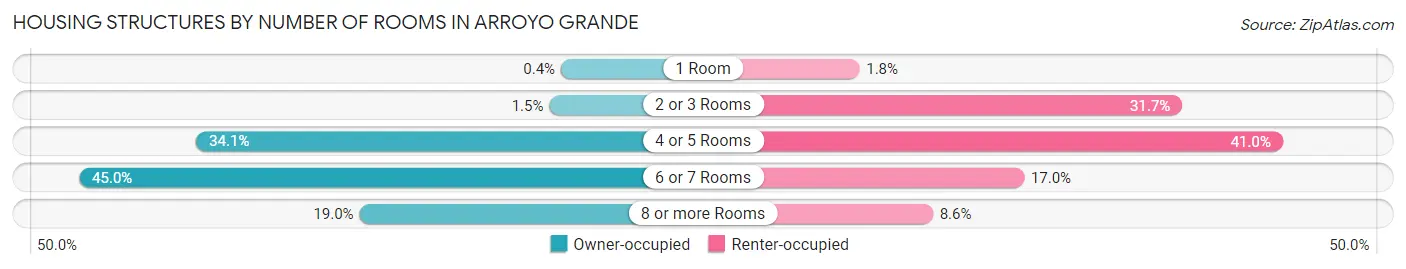
| Number of Rooms | Owner-occupied | Renter-occupied |
| 1 Room | 19 (0.4%) | 50 (1.8%) |
| 2 or 3 Rooms | 69 (1.5%) | 885 (31.7%) |
| 4 or 5 Rooms | 1,607 (34.1%) | 1,145 (40.9%) |
| 6 or 7 Rooms | 2,117 (45.0%) | 476 (17.0%) |
| 8 or more Rooms | 896 (19.0%) | 240 (8.6%) |
| Total | 4,708 (100.0%) | 2,796 (100.0%) |
Housing Structure by Heating Type in Arroyo Grande
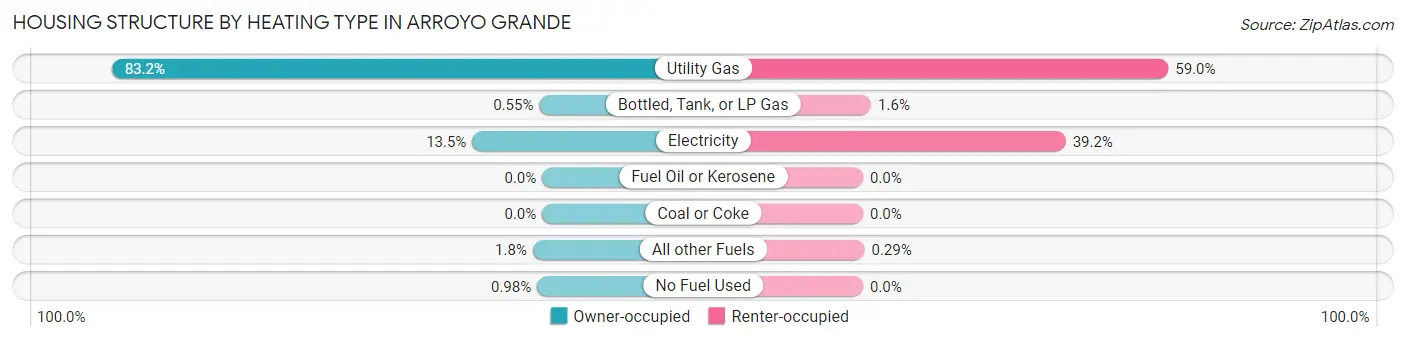
| Heating Type | Owner-occupied | Renter-occupied |
| Utility Gas | 3,915 (83.2%) | 1,649 (59.0%) |
| Bottled, Tank, or LP Gas | 26 (0.5%) | 44 (1.6%) |
| Electricity | 636 (13.5%) | 1,095 (39.2%) |
| Fuel Oil or Kerosene | 0 (0.0%) | 0 (0.0%) |
| Coal or Coke | 0 (0.0%) | 0 (0.0%) |
| All other Fuels | 85 (1.8%) | 8 (0.3%) |
| No Fuel Used | 46 (1.0%) | 0 (0.0%) |
| Total | 4,708 (100.0%) | 2,796 (100.0%) |
Household Vehicle Usage in Arroyo Grande
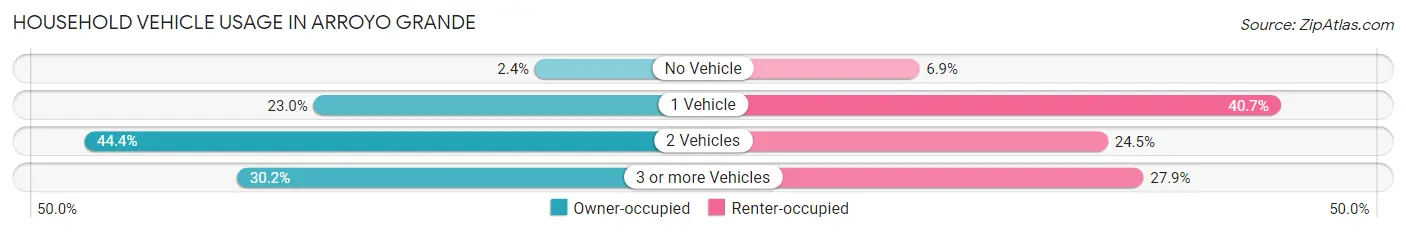
| Vehicles per Household | Owner-occupied | Renter-occupied |
| No Vehicle | 111 (2.4%) | 194 (6.9%) |
| 1 Vehicle | 1,084 (23.0%) | 1,137 (40.7%) |
| 2 Vehicles | 2,092 (44.4%) | 686 (24.5%) |
| 3 or more Vehicles | 1,421 (30.2%) | 779 (27.9%) |
| Total | 4,708 (100.0%) | 2,796 (100.0%) |
Real Estate & Mortgages in Arroyo Grande
Real Estate and Mortgage Overview in Arroyo Grande
| Characteristic | Without Mortgage | With Mortgage |
| Housing Units | 1,720 | 2,988 |
| Median Property Value | $690,500 | $739,200 |
| Median Household Income | $75,360 | $1,202 |
| Monthly Housing Costs | $655 | $1,119 |
| Real Estate Taxes | $3,908 | $10 |
Property Value by Mortgage Status in Arroyo Grande
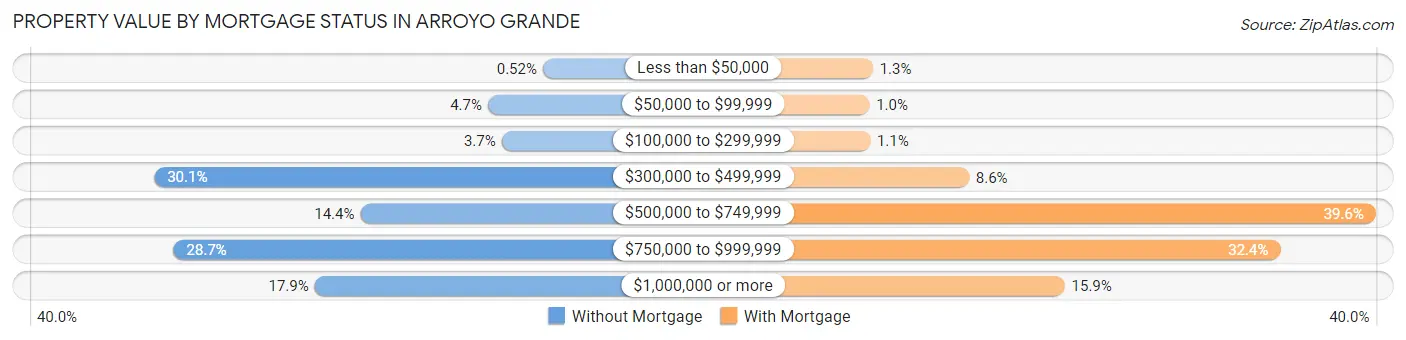
| Property Value | Without Mortgage | With Mortgage |
| Less than $50,000 | 9 (0.5%) | 39 (1.3%) |
| $50,000 to $99,999 | 81 (4.7%) | 31 (1.0%) |
| $100,000 to $299,999 | 63 (3.7%) | 33 (1.1%) |
| $300,000 to $499,999 | 518 (30.1%) | 258 (8.6%) |
| $500,000 to $749,999 | 248 (14.4%) | 1,184 (39.6%) |
| $750,000 to $999,999 | 493 (28.7%) | 967 (32.4%) |
| $1,000,000 or more | 308 (17.9%) | 476 (15.9%) |
| Total | 1,720 (100.0%) | 2,988 (100.0%) |
Household Income by Mortgage Status in Arroyo Grande
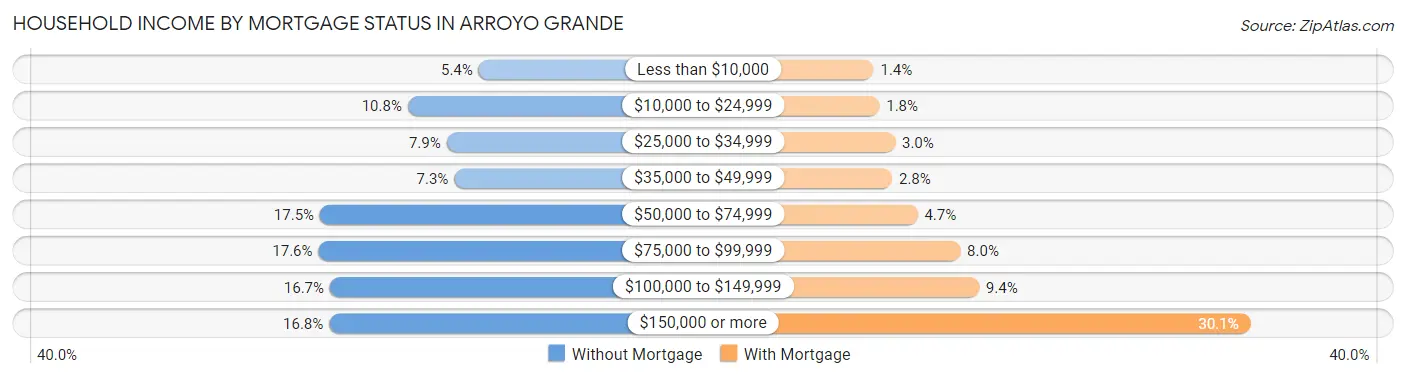
| Household Income | Without Mortgage | With Mortgage |
| Less than $10,000 | 93 (5.4%) | 41 (1.4%) |
| $10,000 to $24,999 | 186 (10.8%) | 54 (1.8%) |
| $25,000 to $34,999 | 135 (7.9%) | 90 (3.0%) |
| $35,000 to $49,999 | 125 (7.3%) | 83 (2.8%) |
| $50,000 to $74,999 | 301 (17.5%) | 141 (4.7%) |
| $75,000 to $99,999 | 303 (17.6%) | 238 (8.0%) |
| $100,000 to $149,999 | 288 (16.7%) | 281 (9.4%) |
| $150,000 or more | 289 (16.8%) | 899 (30.1%) |
| Total | 1,720 (100.0%) | 2,988 (100.0%) |
Property Value to Household Income Ratio in Arroyo Grande
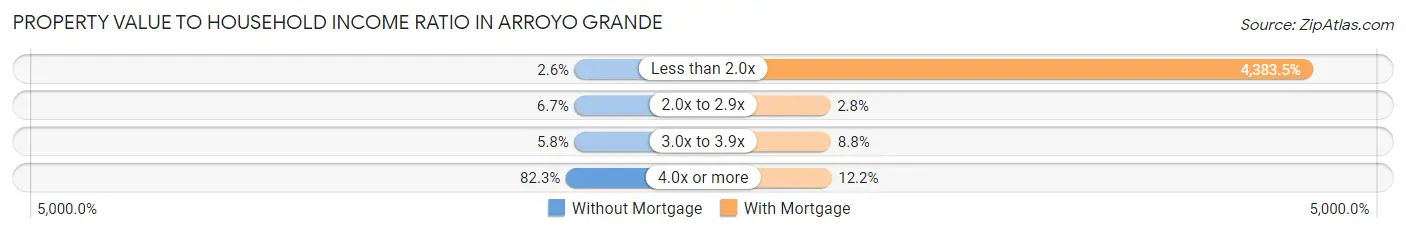
| Value-to-Income Ratio | Without Mortgage | With Mortgage |
| Less than 2.0x | 45 (2.6%) | 130,978 (4,383.5%) |
| 2.0x to 2.9x | 115 (6.7%) | 83 (2.8%) |
| 3.0x to 3.9x | 99 (5.8%) | 262 (8.8%) |
| 4.0x or more | 1,415 (82.3%) | 365 (12.2%) |
| Total | 1,720 (100.0%) | 2,988 (100.0%) |
Real Estate Taxes by Mortgage Status in Arroyo Grande
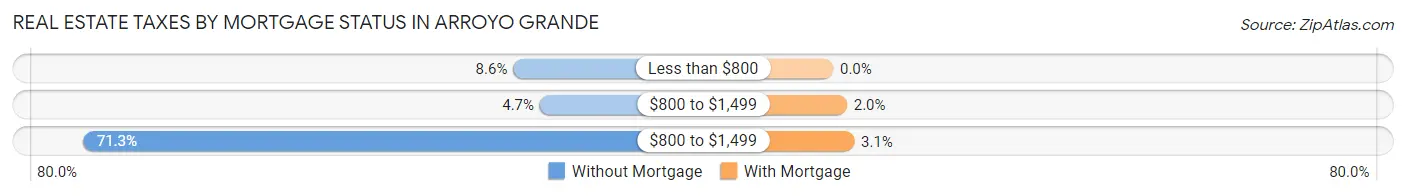
| Property Taxes | Without Mortgage | With Mortgage |
| Less than $800 | 148 (8.6%) | 0 (0.0%) |
| $800 to $1,499 | 81 (4.7%) | 60 (2.0%) |
| $800 to $1,499 | 1,227 (71.3%) | 92 (3.1%) |
| Total | 1,720 (100.0%) | 2,988 (100.0%) |
Health & Disability in Arroyo Grande
Health Insurance Coverage by Age in Arroyo Grande
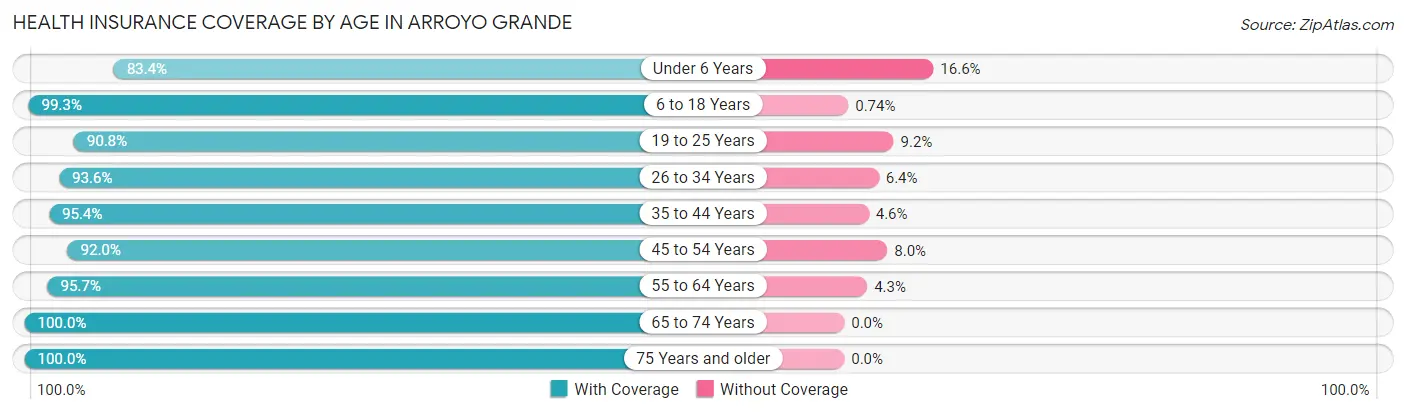
| Age Bracket | With Coverage | Without Coverage |
| Under 6 Years | 868 (83.4%) | 173 (16.6%) |
| 6 to 18 Years | 2,946 (99.3%) | 22 (0.7%) |
| 19 to 25 Years | 1,314 (90.8%) | 133 (9.2%) |
| 26 to 34 Years | 1,614 (93.6%) | 111 (6.4%) |
| 35 to 44 Years | 1,899 (95.4%) | 91 (4.6%) |
| 45 to 54 Years | 2,016 (92.0%) | 176 (8.0%) |
| 55 to 64 Years | 2,459 (95.7%) | 110 (4.3%) |
| 65 to 74 Years | 2,453 (100.0%) | 0 (0.0%) |
| 75 Years and older | 1,921 (100.0%) | 0 (0.0%) |
| Total | 17,490 (95.5%) | 816 (4.5%) |
Health Insurance Coverage by Citizenship Status in Arroyo Grande
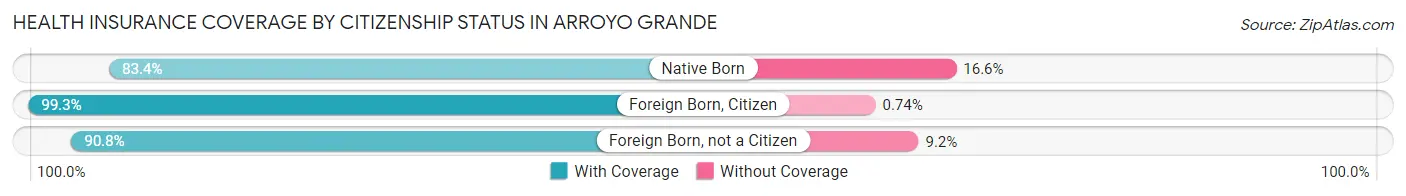
| Citizenship Status | With Coverage | Without Coverage |
| Native Born | 868 (83.4%) | 173 (16.6%) |
| Foreign Born, Citizen | 2,946 (99.3%) | 22 (0.7%) |
| Foreign Born, not a Citizen | 1,314 (90.8%) | 133 (9.2%) |
Health Insurance Coverage by Household Income in Arroyo Grande
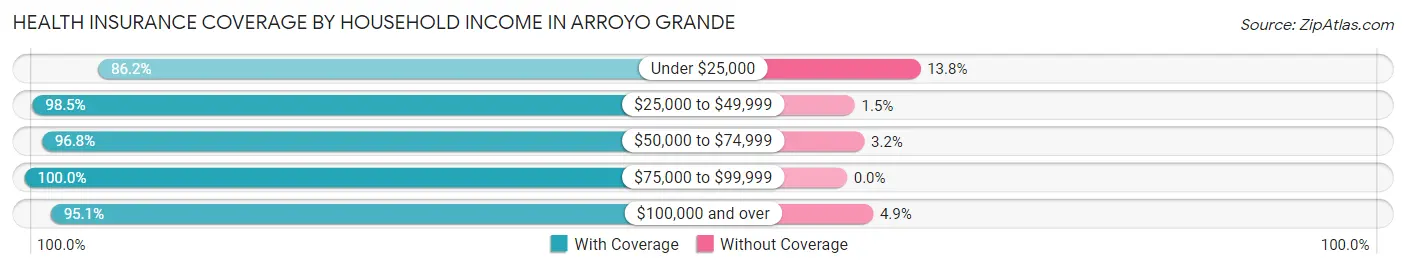
| Household Income | With Coverage | Without Coverage |
| Under $25,000 | 1,072 (86.2%) | 171 (13.8%) |
| $25,000 to $49,999 | 1,548 (98.5%) | 23 (1.5%) |
| $50,000 to $74,999 | 1,822 (96.8%) | 61 (3.2%) |
| $75,000 to $99,999 | 2,098 (100.0%) | 0 (0.0%) |
| $100,000 and over | 10,794 (95.1%) | 556 (4.9%) |
Public vs Private Health Insurance Coverage by Age in Arroyo Grande
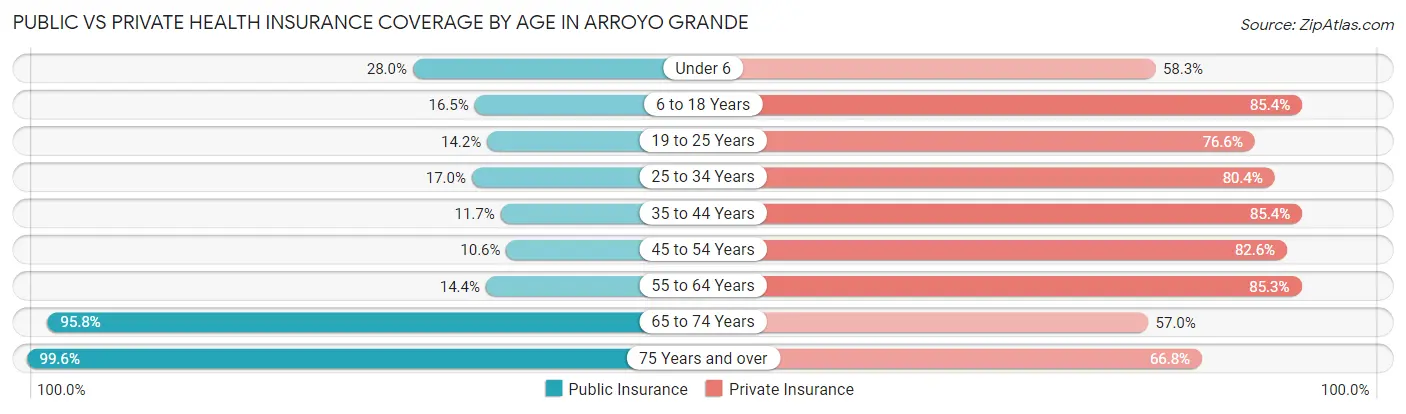
| Age Bracket | Public Insurance | Private Insurance |
| Under 6 | 291 (28.0%) | 607 (58.3%) |
| 6 to 18 Years | 489 (16.5%) | 2,535 (85.4%) |
| 19 to 25 Years | 205 (14.2%) | 1,109 (76.6%) |
| 25 to 34 Years | 293 (17.0%) | 1,386 (80.3%) |
| 35 to 44 Years | 232 (11.7%) | 1,700 (85.4%) |
| 45 to 54 Years | 232 (10.6%) | 1,811 (82.6%) |
| 55 to 64 Years | 370 (14.4%) | 2,191 (85.3%) |
| 65 to 74 Years | 2,349 (95.8%) | 1,397 (57.0%) |
| 75 Years and over | 1,914 (99.6%) | 1,284 (66.8%) |
| Total | 6,375 (34.8%) | 14,020 (76.6%) |
Disability Status by Sex by Age in Arroyo Grande
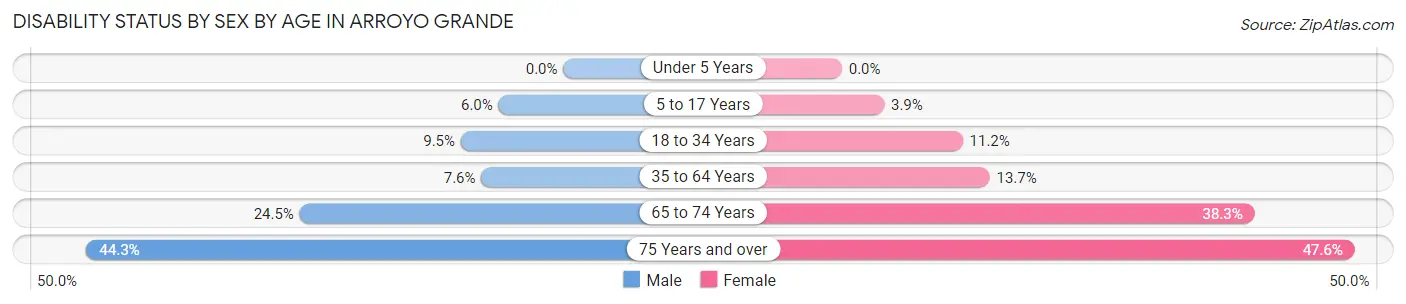
| Age Bracket | Male | Female |
| Under 5 Years | 0 (0.0%) | 0 (0.0%) |
| 5 to 17 Years | 83 (6.0%) | 55 (3.9%) |
| 18 to 34 Years | 183 (9.5%) | 184 (11.2%) |
| 35 to 64 Years | 245 (7.6%) | 484 (13.7%) |
| 65 to 74 Years | 256 (24.5%) | 539 (38.3%) |
| 75 Years and over | 324 (44.3%) | 566 (47.6%) |
Disability Class by Sex by Age in Arroyo Grande
Disability Class: Hearing Difficulty
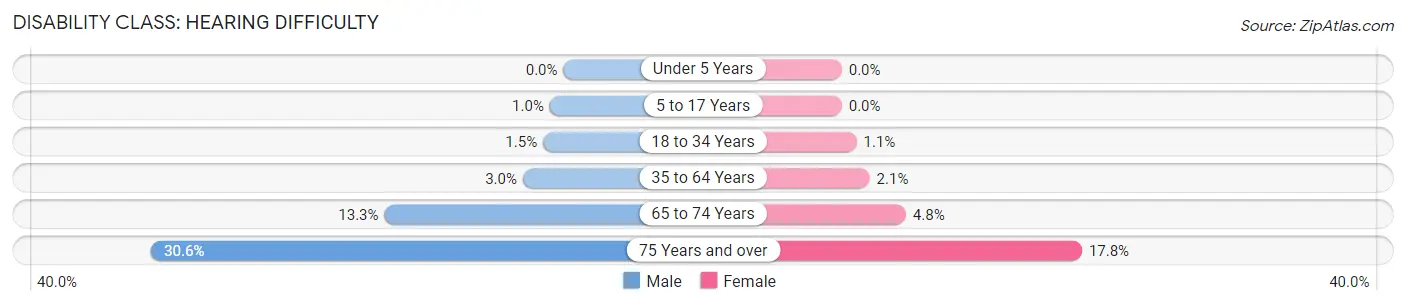
| Age Bracket | Male | Female |
| Under 5 Years | 0 (0.0%) | 0 (0.0%) |
| 5 to 17 Years | 14 (1.0%) | 0 (0.0%) |
| 18 to 34 Years | 29 (1.5%) | 18 (1.1%) |
| 35 to 64 Years | 97 (3.0%) | 73 (2.1%) |
| 65 to 74 Years | 139 (13.3%) | 67 (4.8%) |
| 75 Years and over | 224 (30.6%) | 212 (17.8%) |
Disability Class: Vision Difficulty
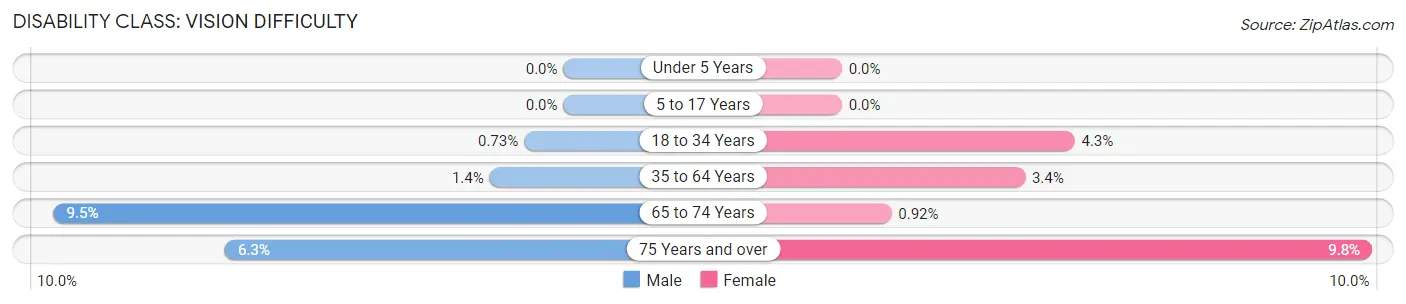
| Age Bracket | Male | Female |
| Under 5 Years | 0 (0.0%) | 0 (0.0%) |
| 5 to 17 Years | 0 (0.0%) | 0 (0.0%) |
| 18 to 34 Years | 14 (0.7%) | 71 (4.3%) |
| 35 to 64 Years | 44 (1.4%) | 120 (3.4%) |
| 65 to 74 Years | 99 (9.5%) | 13 (0.9%) |
| 75 Years and over | 46 (6.3%) | 117 (9.8%) |
Disability Class: Cognitive Difficulty
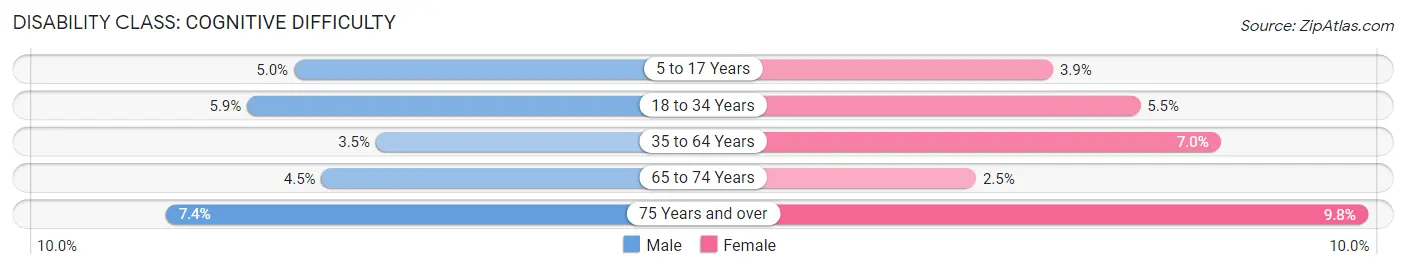
| Age Bracket | Male | Female |
| 5 to 17 Years | 69 (5.0%) | 55 (3.9%) |
| 18 to 34 Years | 113 (5.9%) | 91 (5.5%) |
| 35 to 64 Years | 112 (3.5%) | 248 (7.0%) |
| 65 to 74 Years | 47 (4.5%) | 35 (2.5%) |
| 75 Years and over | 54 (7.4%) | 116 (9.8%) |
Disability Class: Ambulatory Difficulty
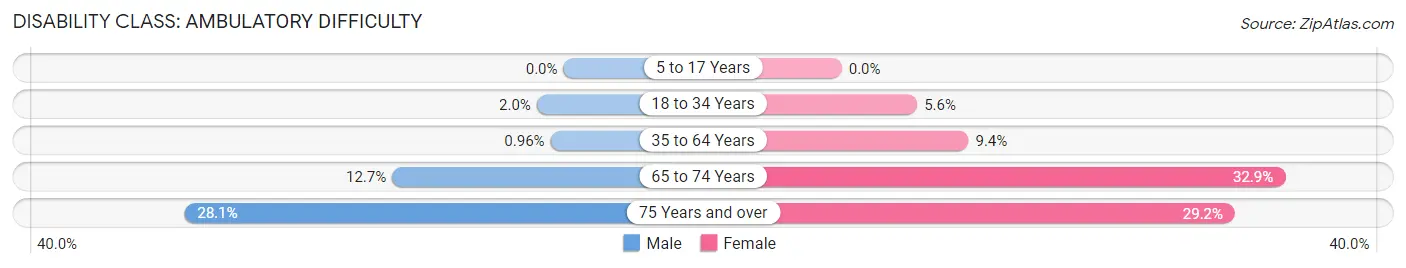
| Age Bracket | Male | Female |
| 5 to 17 Years | 0 (0.0%) | 0 (0.0%) |
| 18 to 34 Years | 38 (2.0%) | 92 (5.6%) |
| 35 to 64 Years | 31 (1.0%) | 332 (9.4%) |
| 65 to 74 Years | 133 (12.7%) | 463 (32.9%) |
| 75 Years and over | 206 (28.1%) | 347 (29.2%) |
Disability Class: Self-Care Difficulty
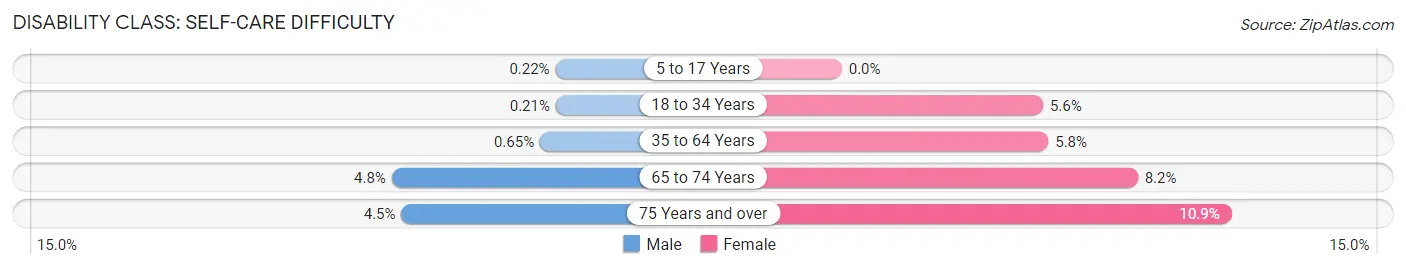
| Age Bracket | Male | Female |
| 5 to 17 Years | 3 (0.2%) | 0 (0.0%) |
| 18 to 34 Years | 4 (0.2%) | 92 (5.6%) |
| 35 to 64 Years | 21 (0.6%) | 203 (5.8%) |
| 65 to 74 Years | 50 (4.8%) | 116 (8.2%) |
| 75 Years and over | 33 (4.5%) | 129 (10.8%) |
Technology Access in Arroyo Grande
Computing Device Access in Arroyo Grande
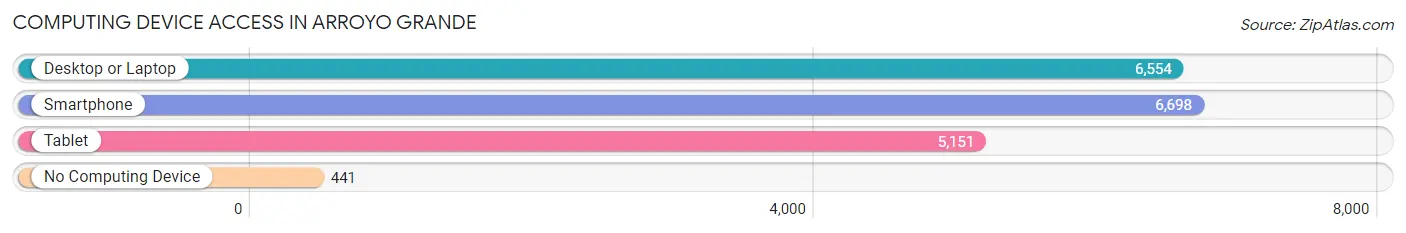
| Device Type | # Households | % Households |
| Desktop or Laptop | 6,554 | 87.3% |
| Smartphone | 6,698 | 89.3% |
| Tablet | 5,151 | 68.6% |
| No Computing Device | 441 | 5.9% |
| Total | 7,504 | 100.0% |
Internet Access in Arroyo Grande
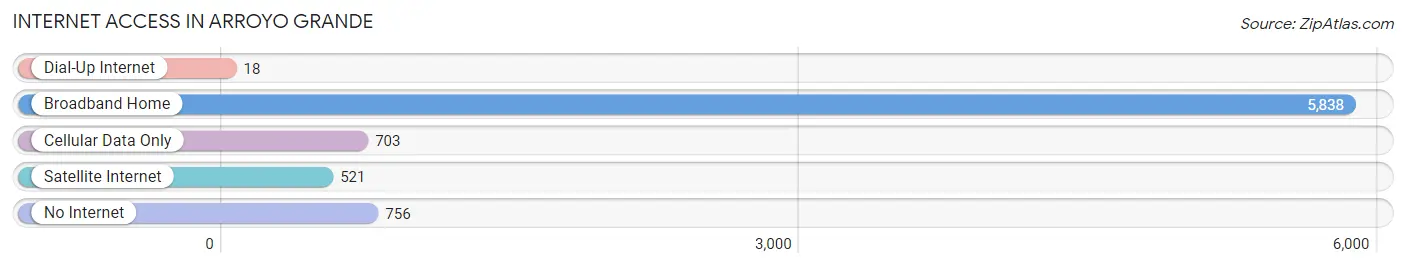
| Internet Type | # Households | % Households |
| Dial-Up Internet | 18 | 0.2% |
| Broadband Home | 5,838 | 77.8% |
| Cellular Data Only | 703 | 9.4% |
| Satellite Internet | 521 | 6.9% |
| No Internet | 756 | 10.1% |
| Total | 7,504 | 100.0% |
Arroyo Grande Summary
Arroyo Grande is a city located in San Luis Obispo County, California, United States. The population was 17,716 at the 2010 census, up from 13,254 at the 2000 census. Arroyo Grande is located on the Pacific Ocean about halfway between Los Angeles and San Francisco, at an elevation of 85 feet (26 m).
History
Arroyo Grande was founded in 1875 by pioneers who were attracted to the area by the fertile soil and abundant water. The town was originally called "La Cañada de los Osos" (The Canyon of the Bears) because of the large number of bears that roamed the area. The name was later changed to Arroyo Grande, which means "big creek" in Spanish.
The town was incorporated in 1911 and has since grown to become a thriving community. The city is home to a variety of businesses, including agriculture, tourism, and light manufacturing.
Geography
Arroyo Grande is located at 35°10′17″N 120°35′25″W (35.171445, -120.590278). According to the United States Census Bureau, the city has a total area of 5.7 square miles (14.8 km2), of which, 5.6 square miles (14.6 km2) of it is land and 0.1 square miles (0.2 km2) of it (1.45%) is water.
The city is located on the Pacific Coast, about halfway between Los Angeles and San Francisco. It is bordered by the cities of Grover Beach to the north and Pismo Beach to the south.
Economy
Arroyo Grande is a diverse and vibrant community with a strong economy. The city is home to a variety of businesses, including agriculture, tourism, and light manufacturing.
Agriculture is a major part of the local economy. The city is home to a number of farms and ranches, including vegetable farms, vineyards, and cattle ranches. The city is also home to a number of wineries and tasting rooms.
Tourism is also an important part of the local economy. The city is home to a number of attractions, including the Heritage House Museum, the Arroyo Grande Village, and the Oceano Dunes State Vehicular Recreation Area.
Demographics
As of the census of 2000, there were 13,254 people, 5,072 households, and 3,541 families residing in the city. The population density was 2,341.2 people per square mile (902.3/km2). There were 5,272 housing units at an average density of 937.2 per square mile (362.3/km2). The racial makeup of the city was 79.2% White, 0.7% African American, 0.7% Native American, 1.2% Asian, 0.2% Pacific Islander, 14.2% from other races, and 3.8% from two or more races. Hispanic or Latino of any race were 24.2% of the population.
There were 5,072 households, out of which 33.2% had children under the age of 18 living with them, 51.2% were married couples living together, 12.2% had a female householder with no husband present, and 32.2% were non-families. 25.7% of all households were made up of individuals, and 11.2% had someone living alone who was 65 years of age or older. The average household size was 2.60 and the average family size was 3.13.
In the city, the population was spread out, with 26.2% under the age of 18, 8.2% from 18 to 24, 28.7% from 25 to 44, 22.2% from 45 to 64, and 14.7% who were 65 years of age or older. The median age was 37 years. For every 100 females, there were 94.2 males. For every 100 females age 18 and over, there were 90.7 males.
The median income for a household in the city was $45,837, and the median income for a family was $51,845. Males had a median income of $37,841 versus $27,945 for females. The per capita income for the city was $21,945. About 8.2% of families and 11.2% of the population were below the poverty line, including 15.2% of those under age 18 and 6.2% of those age 65 or over.
Common Questions
What is Per Capita Income in Arroyo Grande?
Per Capita income in Arroyo Grande is $45,578.
What is the Median Family Income in Arroyo Grande?
Median Family Income in Arroyo Grande is $123,614.
What is the Median Household income in Arroyo Grande?
Median Household Income in Arroyo Grande is $99,143.
What is Income or Wage Gap in Arroyo Grande?
Income or Wage Gap in Arroyo Grande is 33.3%.
Women in Arroyo Grande earn 66.7 cents for every dollar earned by a man.
What is Family Income Deficit in Arroyo Grande?
Family Income Deficit in Arroyo Grande is $9,611.
Families that are below poverty line in Arroyo Grande earn $9,611 less on average than the poverty threshold level.
What is Inequality or Gini Index in Arroyo Grande?
Inequality or Gini Index in Arroyo Grande is 0.40.
What is the Total Population of Arroyo Grande?
Total Population of Arroyo Grande is 18,435.
What is the Total Male Population of Arroyo Grande?
Total Male Population of Arroyo Grande is 8,595.
What is the Total Female Population of Arroyo Grande?
Total Female Population of Arroyo Grande is 9,840.
What is the Ratio of Males per 100 Females in Arroyo Grande?
There are 87.35 Males per 100 Females in Arroyo Grande.
What is the Ratio of Females per 100 Males in Arroyo Grande?
There are 114.49 Females per 100 Males in Arroyo Grande.
What is the Median Population Age in Arroyo Grande?
Median Population Age in Arroyo Grande is 45.3 Years.
What is the Average Family Size in Arroyo Grande
Average Family Size in Arroyo Grande is 3.0 People.
What is the Average Household Size in Arroyo Grande
Average Household Size in Arroyo Grande is 2.4 People.
How Large is the Labor Force in Arroyo Grande?
There are 8,932 People in the Labor Forcein in Arroyo Grande.
What is the Percentage of People in the Labor Force in Arroyo Grande?
58.1% of People are in the Labor Force in Arroyo Grande.
What is the Unemployment Rate in Arroyo Grande?
Unemployment Rate in Arroyo Grande is 2.2%.