Armona, CA Map & Demographics
Armona Map
Armona Overview
$16,971
PER CAPITA INCOME
$58,443
AVG FAMILY INCOME
$55,197
AVG HOUSEHOLD INCOME
5.0%
WAGE / INCOME GAP [ % ]
95.0¢/ $1
WAGE / INCOME GAP [ $ ]
$8,944
FAMILY INCOME DEFICIT
0.38
INEQUALITY / GINI INDEX
4,367
TOTAL POPULATION
2,390
MALE POPULATION
1,977
FEMALE POPULATION
120.89
MALES / 100 FEMALES
82.72
FEMALES / 100 MALES
26.4
MEDIAN AGE
4.6
AVG FAMILY SIZE
4.2
AVG HOUSEHOLD SIZE
1,805
LABOR FORCE [ PEOPLE ]
61.8%
PERCENT IN LABOR FORCE
8.9%
UNEMPLOYMENT RATE
Armona Zip Codes
Armona Area Codes
Income in Armona
Income Overview in Armona
Per Capita Income in Armona is $16,971, while median incomes of families and households are $58,443 and $55,197 respectively.
| Characteristic | Number | Measure |
| Per Capita Income | 4,367 | $16,971 |
| Median Family Income | 848 | $58,443 |
| Mean Family Income | 848 | $68,559 |
| Median Household Income | 1,035 | $55,197 |
| Mean Household Income | 1,035 | $67,546 |
| Income Deficit | 848 | $8,944 |
| Wage / Income Gap (%) | 4,367 | 5.00% |
| Wage / Income Gap ($) | 4,367 | 95.00¢ per $1 |
| Gini / Inequality Index | 4,367 | 0.38 |
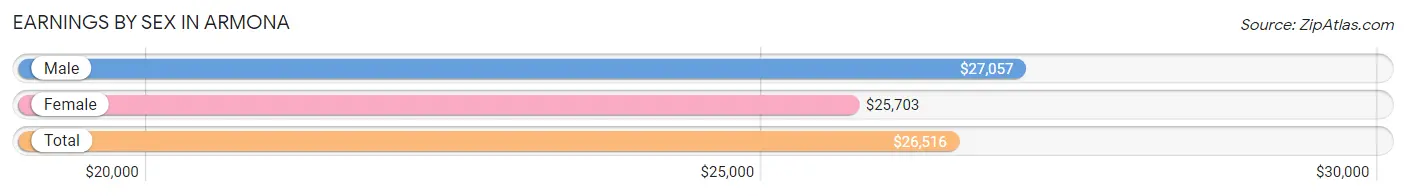
Earnings by Sex in Armona
Average Earnings in Armona are $26,516, $27,057 for men and $25,703 for women, a difference of 5.0%.
| Sex | Number | Average Earnings |
| Male | 1,057 (57.2%) | $27,057 |
| Female | 792 (42.8%) | $25,703 |
| Total | 1,849 (100.0%) | $26,516 |
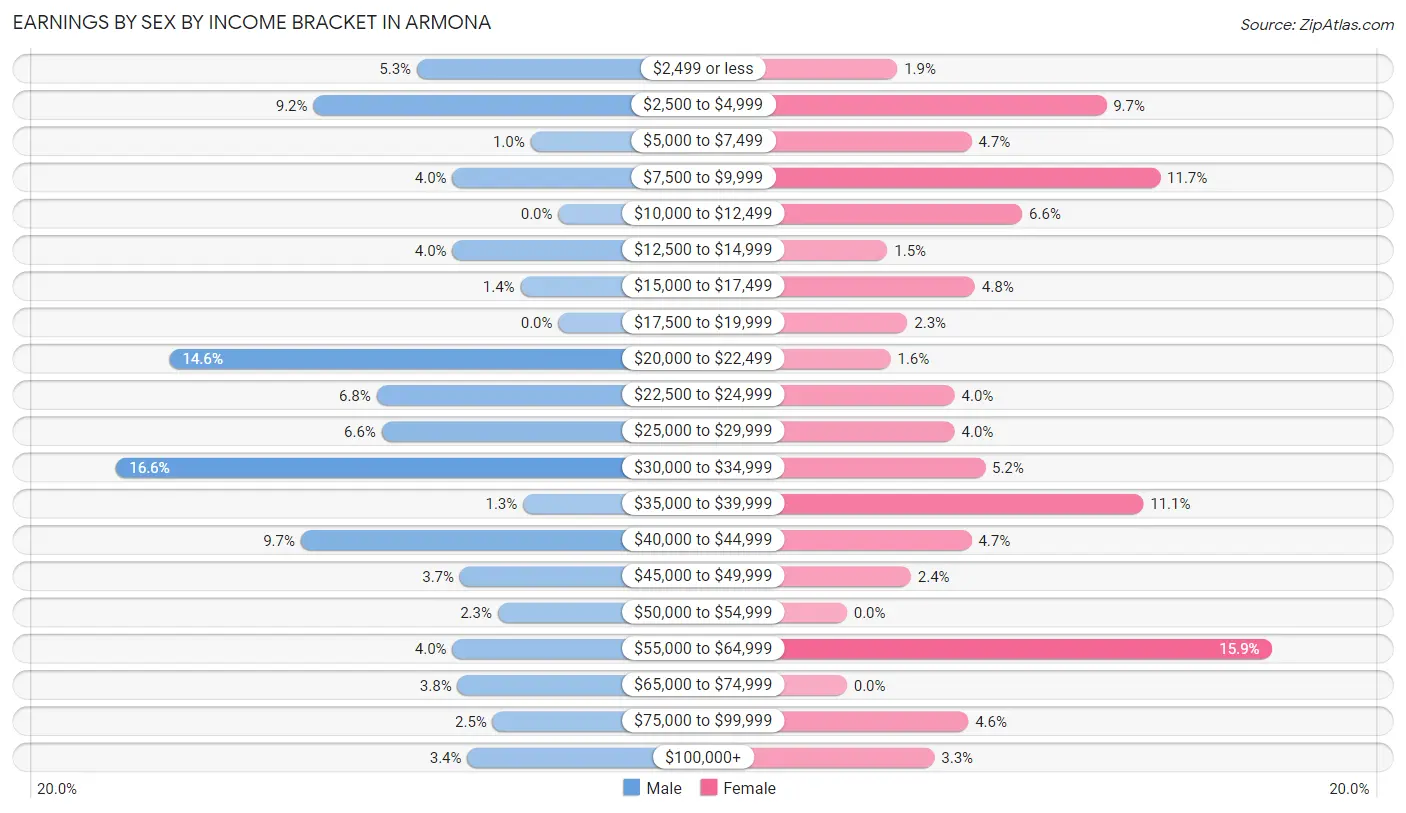
Earnings by Sex by Income Bracket in Armona
The most common earnings brackets in Armona are $30,000 to $34,999 for men (175 | 16.6%) and $55,000 to $64,999 for women (126 | 15.9%).
| Income | Male | Female |
| $2,499 or less | 56 (5.3%) | 15 (1.9%) |
| $2,500 to $4,999 | 97 (9.2%) | 77 (9.7%) |
| $5,000 to $7,499 | 11 (1.0%) | 37 (4.7%) |
| $7,500 to $9,999 | 42 (4.0%) | 93 (11.7%) |
| $10,000 to $12,499 | 0 (0.0%) | 52 (6.6%) |
| $12,500 to $14,999 | 42 (4.0%) | 12 (1.5%) |
| $15,000 to $17,499 | 15 (1.4%) | 38 (4.8%) |
| $17,500 to $19,999 | 0 (0.0%) | 18 (2.3%) |
| $20,000 to $22,499 | 154 (14.6%) | 13 (1.6%) |
| $22,500 to $24,999 | 72 (6.8%) | 32 (4.0%) |
| $25,000 to $29,999 | 70 (6.6%) | 32 (4.0%) |
| $30,000 to $34,999 | 175 (16.6%) | 41 (5.2%) |
| $35,000 to $39,999 | 14 (1.3%) | 88 (11.1%) |
| $40,000 to $44,999 | 102 (9.7%) | 37 (4.7%) |
| $45,000 to $49,999 | 39 (3.7%) | 19 (2.4%) |
| $50,000 to $54,999 | 24 (2.3%) | 0 (0.0%) |
| $55,000 to $64,999 | 42 (4.0%) | 126 (15.9%) |
| $65,000 to $74,999 | 40 (3.8%) | 0 (0.0%) |
| $75,000 to $99,999 | 26 (2.5%) | 36 (4.5%) |
| $100,000+ | 36 (3.4%) | 26 (3.3%) |
| Total | 1,057 (100.0%) | 792 (100.0%) |
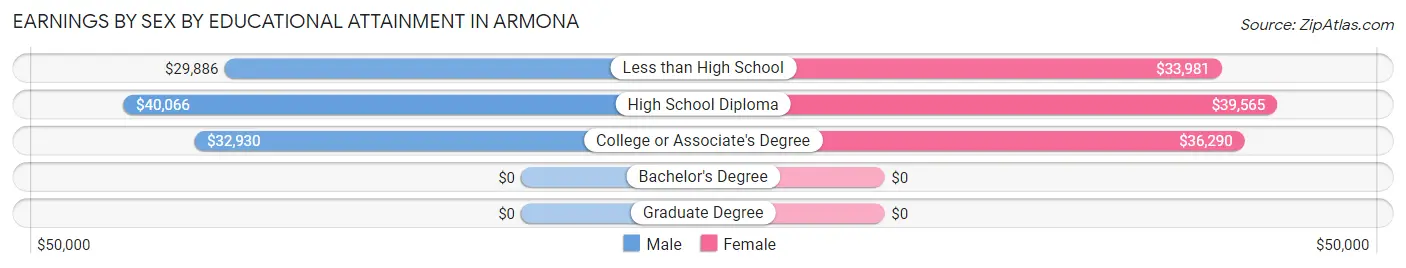
Earnings by Sex by Educational Attainment in Armona
Average earnings in Armona are $32,569 for men and $34,398 for women, a difference of 5.3%. Men with an educational attainment of high school diploma enjoy the highest average annual earnings of $40,066, while those with less than high school education earn the least with $29,886. Women with an educational attainment of high school diploma earn the most with the average annual earnings of $39,565, while those with less than high school education have the smallest earnings of $33,981.
| Educational Attainment | Male Income | Female Income |
| Less than High School | $29,886 | $33,981 |
| High School Diploma | $40,066 | $39,565 |
| College or Associate's Degree | $32,930 | $36,290 |
| Bachelor's Degree | - | - |
| Graduate Degree | - | - |
| Total | $32,569 | $34,398 |
Family Income in Armona
Family Income Brackets in Armona
According to the Armona family income data, there are 197 families falling into the $75,000 to $99,999 income range, which is the most common income bracket and makes up 23.2% of all families.
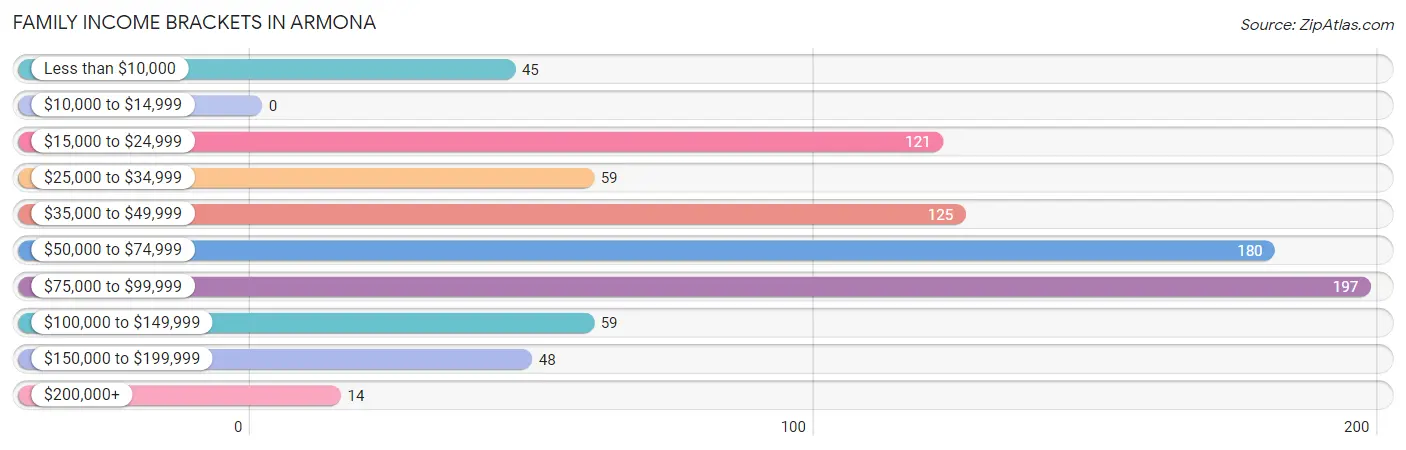
| Income Bracket | # Families | % Families |
| Less than $10,000 | 45 | 5.3% |
| $10,000 to $14,999 | 0 | 0.0% |
| $15,000 to $24,999 | 121 | 14.3% |
| $25,000 to $34,999 | 59 | 7.0% |
| $35,000 to $49,999 | 125 | 14.7% |
| $50,000 to $74,999 | 180 | 21.2% |
| $75,000 to $99,999 | 197 | 23.2% |
| $100,000 to $149,999 | 59 | 7.0% |
| $150,000 to $199,999 | 48 | 5.7% |
| $200,000+ | 14 | 1.7% |
Family Income by Famaliy Size in Armona
7+ person families (83 | 9.8%) account for the highest median family income in Armona with $114,236 per family, while 2-person families (147 | 17.3%) have the highest median income of $19,594 per family member.
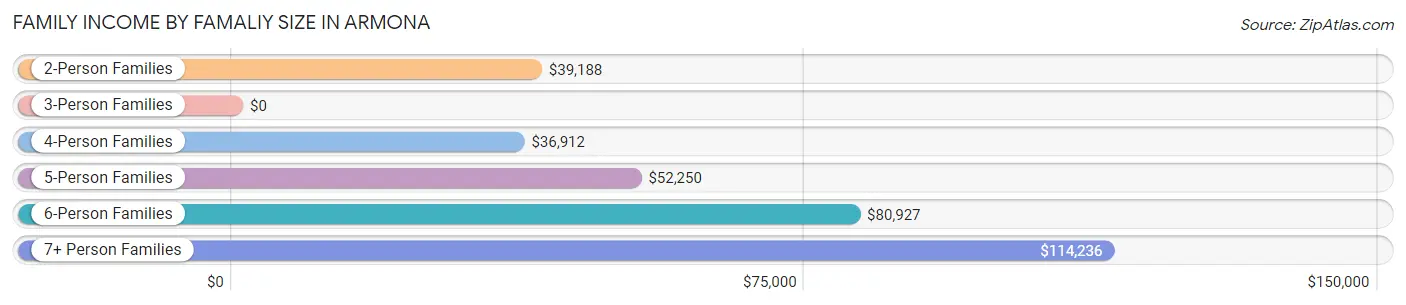
| Income Bracket | # Families | Median Income |
| 2-Person Families | 147 (17.3%) | $39,188 |
| 3-Person Families | 171 (20.2%) | $0 |
| 4-Person Families | 116 (13.7%) | $36,912 |
| 5-Person Families | 201 (23.7%) | $52,250 |
| 6-Person Families | 130 (15.3%) | $80,927 |
| 7+ Person Families | 83 (9.8%) | $114,236 |
| Total | 848 (100.0%) | $58,443 |
Family Income by Number of Earners in Armona
The median family income in Armona is $58,443, with families comprising 3+ earners (131) having the highest median family income of $139,028, while families with no earners (50) have the lowest median family income of $24,167, accounting for 15.4% and 5.9% of families, respectively.
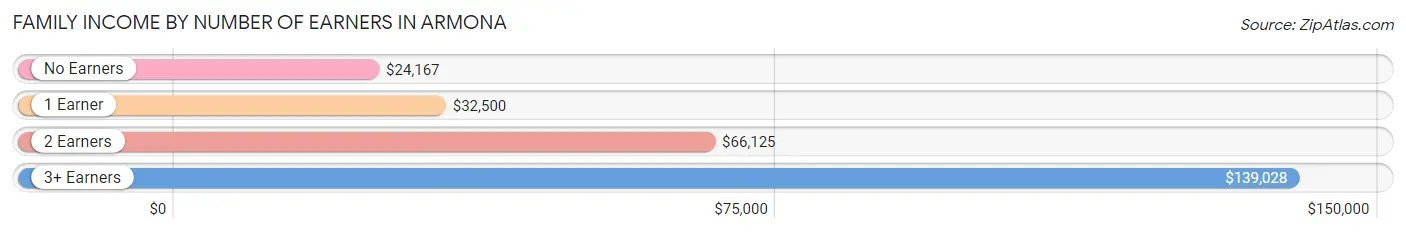
| Number of Earners | # Families | Median Income |
| No Earners | 50 (5.9%) | $24,167 |
| 1 Earner | 304 (35.8%) | $32,500 |
| 2 Earners | 363 (42.8%) | $66,125 |
| 3+ Earners | 131 (15.4%) | $139,028 |
| Total | 848 (100.0%) | $58,443 |
Household Income in Armona
Household Income Brackets in Armona
With 217 households falling in the category, the $50,000 to $74,999 income range is the most frequent in Armona, accounting for 21.0% of all households.
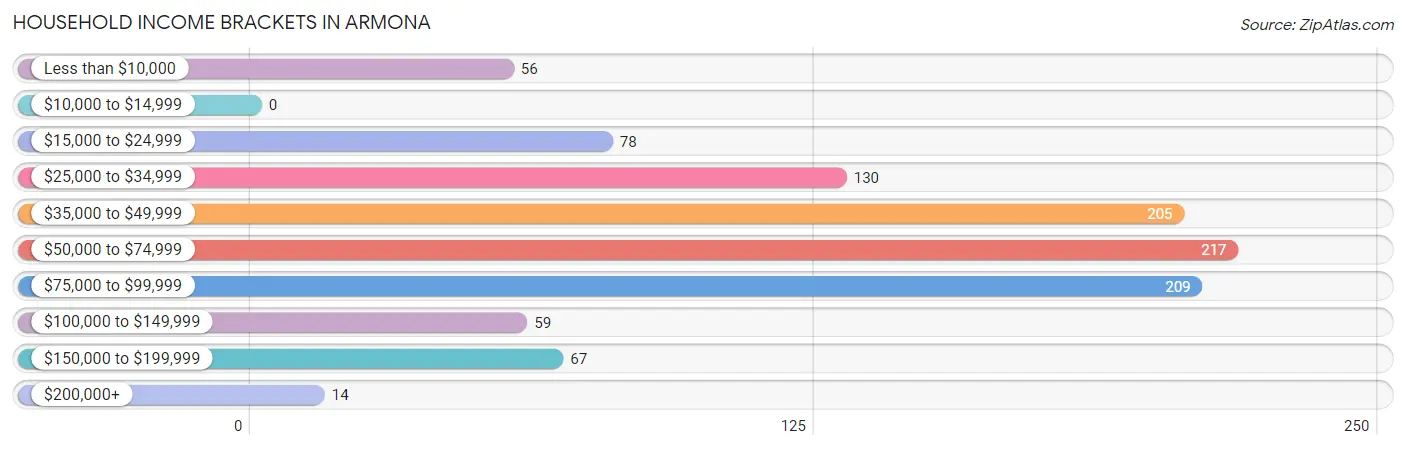
| Income Bracket | # Households | % Households |
| Less than $10,000 | 56 | 5.4% |
| $10,000 to $14,999 | 0 | 0.0% |
| $15,000 to $24,999 | 78 | 7.5% |
| $25,000 to $34,999 | 130 | 12.6% |
| $35,000 to $49,999 | 205 | 19.8% |
| $50,000 to $74,999 | 217 | 21.0% |
| $75,000 to $99,999 | 209 | 20.2% |
| $100,000 to $149,999 | 59 | 5.7% |
| $150,000 to $199,999 | 67 | 6.5% |
| $200,000+ | 14 | 1.4% |
Household Income by Householder Age in Armona
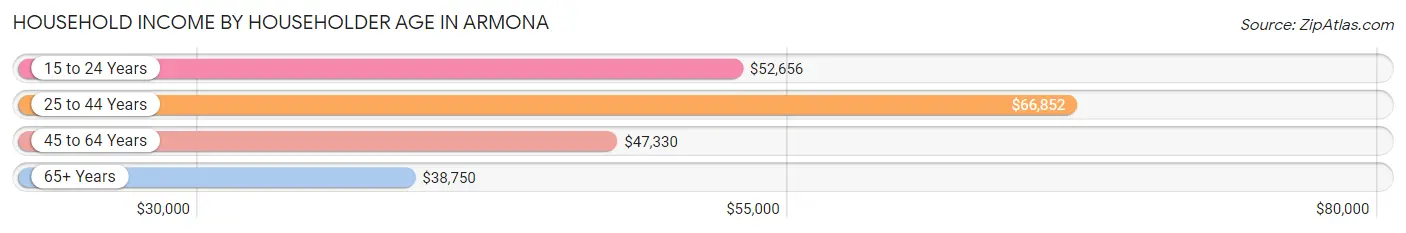
The median household income in Armona is $55,197, with the highest median household income of $66,852 found in the 25 to 44 years age bracket for the primary householder. A total of 428 households (41.3%) fall into this category. Meanwhile, the 65+ years age bracket for the primary householder has the lowest median household income of $38,750, with 102 households (9.9%) in this group.
| Income Bracket | # Households | Median Income |
| 15 to 24 Years | 60 (5.8%) | $52,656 |
| 25 to 44 Years | 428 (41.3%) | $66,852 |
| 45 to 64 Years | 445 (43.0%) | $47,330 |
| 65+ Years | 102 (9.9%) | $38,750 |
| Total | 1,035 (100.0%) | $55,197 |
Poverty in Armona
Income Below Poverty by Sex and Age in Armona
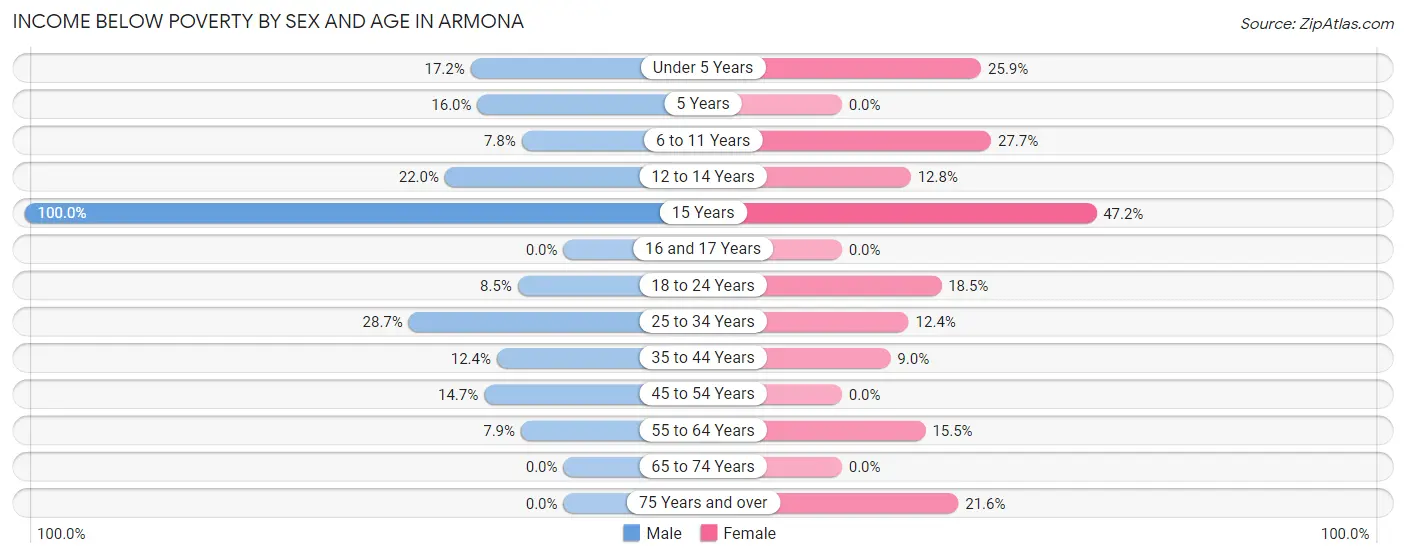
With 13.8% poverty level for males and 14.2% for females among the residents of Armona, 15 year old males and 15 year old females are the most vulnerable to poverty, with 27 males (100.0%) and 17 females (47.2%) in their respective age groups living below the poverty level.
| Age Bracket | Male | Female |
| Under 5 Years | 41 (17.2%) | 30 (25.9%) |
| 5 Years | 15 (16.0%) | 0 (0.0%) |
| 6 to 11 Years | 25 (7.8%) | 64 (27.7%) |
| 12 to 14 Years | 33 (22.0%) | 16 (12.8%) |
| 15 Years | 27 (100.0%) | 17 (47.2%) |
| 16 and 17 Years | 0 (0.0%) | 0 (0.0%) |
| 18 to 24 Years | 32 (8.5%) | 43 (18.4%) |
| 25 to 34 Years | 54 (28.7%) | 33 (12.4%) |
| 35 to 44 Years | 50 (12.3%) | 24 (9.0%) |
| 45 to 54 Years | 29 (14.7%) | 0 (0.0%) |
| 55 to 64 Years | 15 (7.9%) | 34 (15.5%) |
| 65 to 74 Years | 0 (0.0%) | 0 (0.0%) |
| 75 Years and over | 0 (0.0%) | 16 (21.6%) |
| Total | 321 (13.8%) | 277 (14.2%) |
Income Above Poverty by Sex and Age in Armona
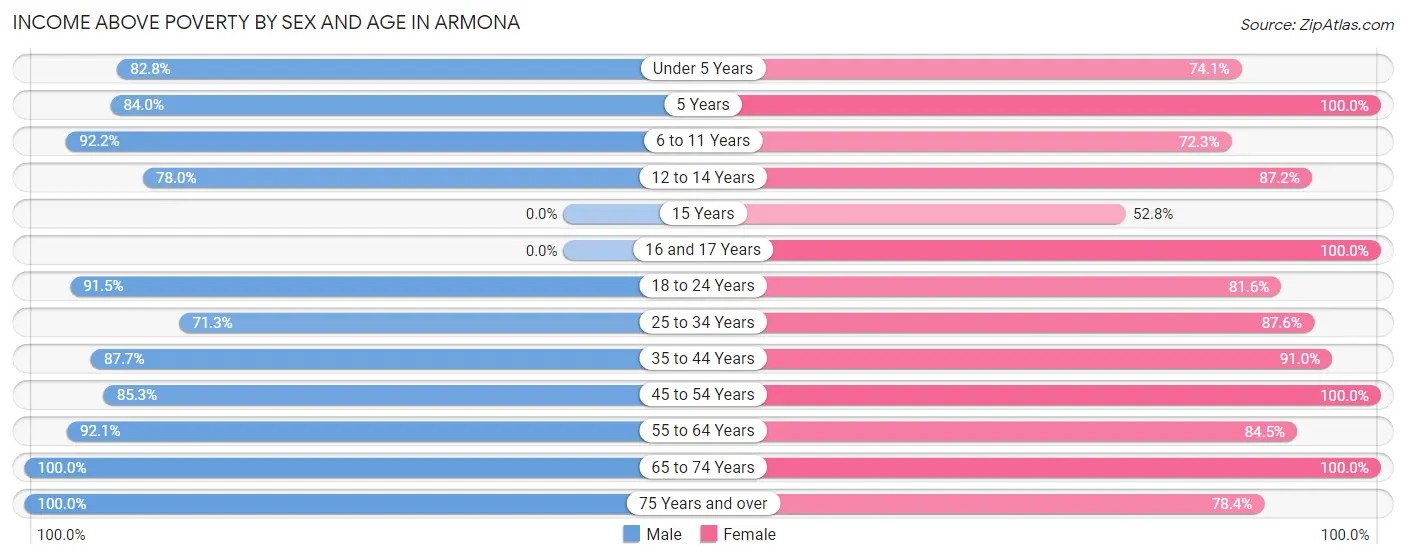
According to the poverty statistics in Armona, males aged 65 to 74 years and females aged 5 years are the age groups that are most secure financially, with 100.0% of males and 100.0% of females in these age groups living above the poverty line.
| Age Bracket | Male | Female |
| Under 5 Years | 197 (82.8%) | 86 (74.1%) |
| 5 Years | 79 (84.0%) | 17 (100.0%) |
| 6 to 11 Years | 297 (92.2%) | 167 (72.3%) |
| 12 to 14 Years | 117 (78.0%) | 109 (87.2%) |
| 15 Years | 0 (0.0%) | 19 (52.8%) |
| 16 and 17 Years | 0 (0.0%) | 72 (100.0%) |
| 18 to 24 Years | 346 (91.5%) | 190 (81.6%) |
| 25 to 34 Years | 134 (71.3%) | 233 (87.6%) |
| 35 to 44 Years | 355 (87.6%) | 242 (91.0%) |
| 45 to 54 Years | 168 (85.3%) | 234 (100.0%) |
| 55 to 64 Years | 175 (92.1%) | 185 (84.5%) |
| 65 to 74 Years | 109 (100.0%) | 55 (100.0%) |
| 75 Years and over | 35 (100.0%) | 58 (78.4%) |
| Total | 2,012 (86.2%) | 1,667 (85.8%) |
Income Below Poverty Among Married-Couple Families in Armona
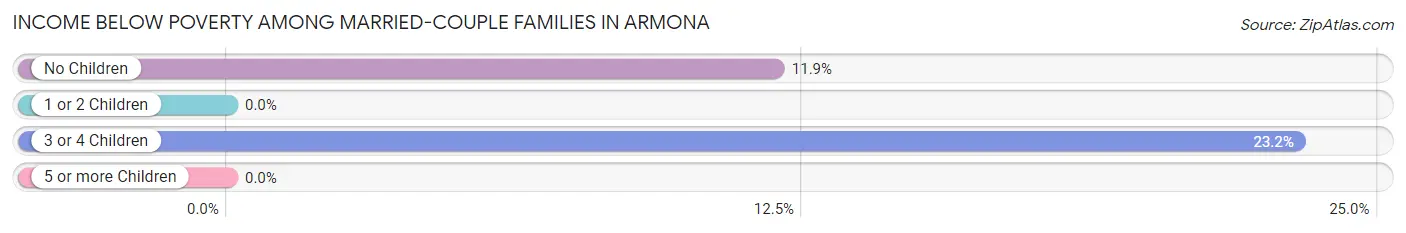
The poverty statistics for married-couple families in Armona show that 12.1% or 74 of the total 610 families live below the poverty line. Families with 3 or 4 children have the highest poverty rate of 23.2%, comprising of 59 families. On the other hand, families with 1 or 2 children have the lowest poverty rate of 0.0%, which includes 0 families.
| Children | Above Poverty | Below Poverty |
| No Children | 111 (88.1%) | 15 (11.9%) |
| 1 or 2 Children | 215 (100.0%) | 0 (0.0%) |
| 3 or 4 Children | 195 (76.8%) | 59 (23.2%) |
| 5 or more Children | 15 (100.0%) | 0 (0.0%) |
| Total | 536 (87.9%) | 74 (12.1%) |
Income Below Poverty Among Single-Parent Households in Armona
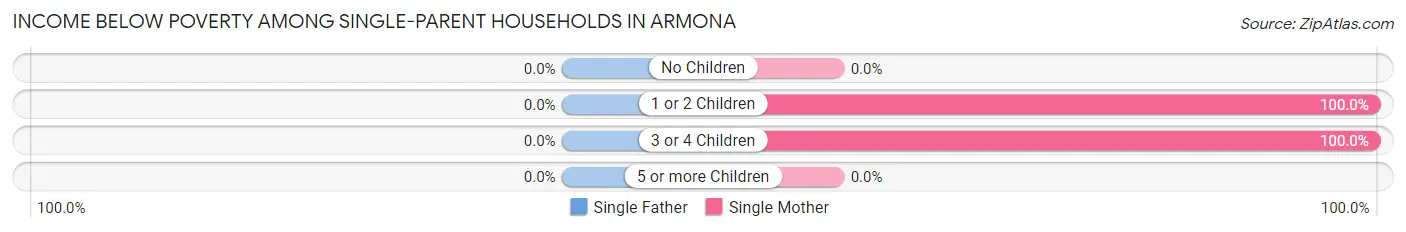
| Children | Single Father | Single Mother |
| No Children | 0 (0.0%) | 0 (0.0%) |
| 1 or 2 Children | 0 (0.0%) | 38 (100.0%) |
| 3 or 4 Children | 0 (0.0%) | 17 (100.0%) |
| 5 or more Children | 0 (0.0%) | 0 (0.0%) |
| Total | 0 (0.0%) | 55 (32.0%) |
Income Below Poverty Among Married-Couple vs Single-Parent Households in Armona
The poverty data for Armona shows that 74 of the married-couple family households (12.1%) and 55 of the single-parent households (23.1%) are living below the poverty level. Within the married-couple family households, those with 3 or 4 children have the highest poverty rate, with 59 households (23.2%) falling below the poverty line. Among the single-parent households, those with 3 or 4 children have the highest poverty rate, with 17 household (100.0%) living below poverty.
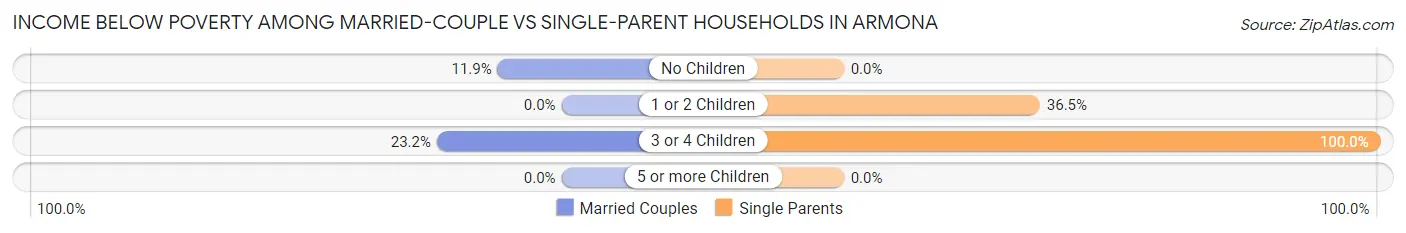
| Children | Married-Couple Families | Single-Parent Households |
| No Children | 15 (11.9%) | 0 (0.0%) |
| 1 or 2 Children | 0 (0.0%) | 38 (36.5%) |
| 3 or 4 Children | 59 (23.2%) | 17 (100.0%) |
| 5 or more Children | 0 (0.0%) | 0 (0.0%) |
| Total | 74 (12.1%) | 55 (23.1%) |
Race in Armona
The most populous races in Armona are Hispanic or Latino (3,407 | 78.0%), White / Caucasian (2,017 | 46.2%), and Some other Race (1,302 | 29.8%).
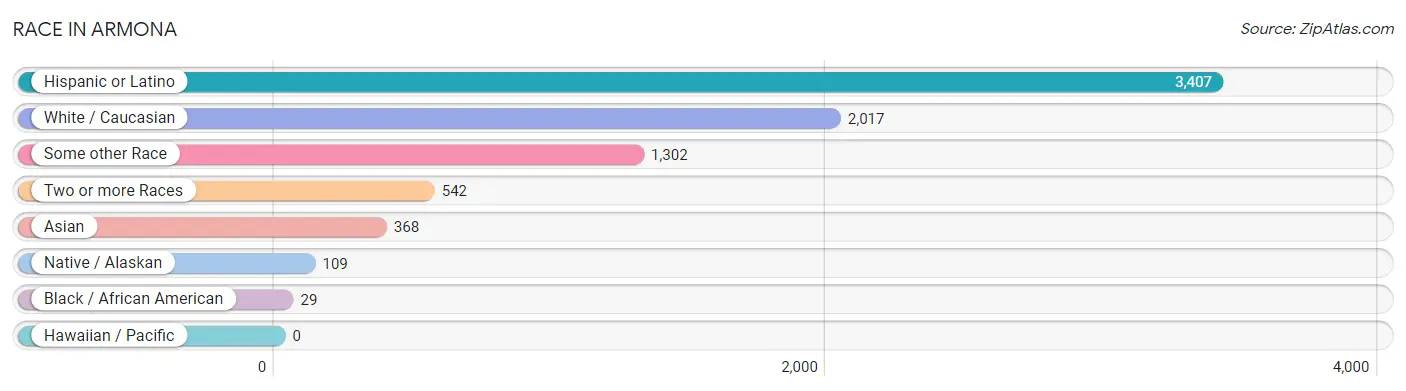
| Race | # Population | % Population |
| Asian | 368 | 8.4% |
| Black / African American | 29 | 0.7% |
| Hawaiian / Pacific | 0 | 0.0% |
| Hispanic or Latino | 3,407 | 78.0% |
| Native / Alaskan | 109 | 2.5% |
| White / Caucasian | 2,017 | 46.2% |
| Two or more Races | 542 | 12.4% |
| Some other Race | 1,302 | 29.8% |
| Total | 4,367 | 100.0% |
Ancestry in Armona
The most populous ancestries reported in Armona are Mexican (3,407 | 78.0%), Bangladeshi (250 | 5.7%), Irish (161 | 3.7%), Indian (Asian) (151 | 3.5%), and Apache (92 | 2.1%), together accounting for 93.0% of all Armona residents.
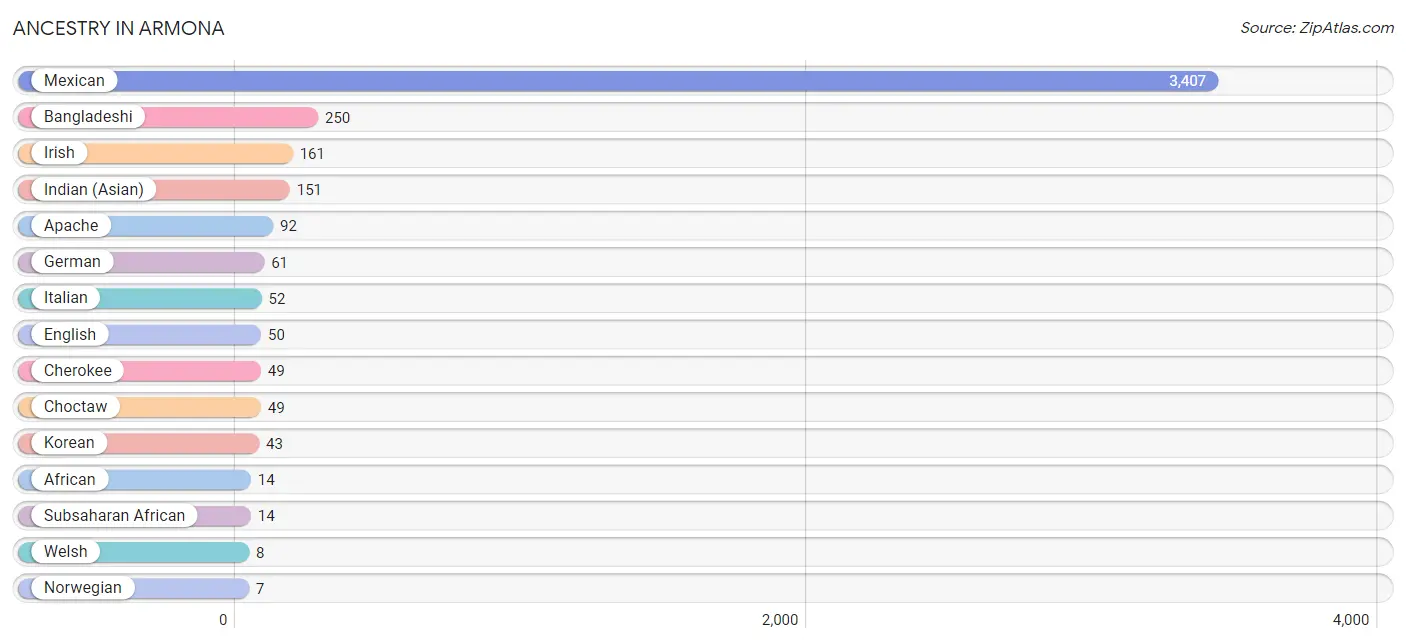
| Ancestry | # Population | % Population |
| African | 14 | 0.3% |
| Apache | 92 | 2.1% |
| Bangladeshi | 250 | 5.7% |
| Cherokee | 49 | 1.1% |
| Choctaw | 49 | 1.1% |
| English | 50 | 1.1% |
| German | 61 | 1.4% |
| Indian (Asian) | 151 | 3.5% |
| Irish | 161 | 3.7% |
| Italian | 52 | 1.2% |
| Korean | 43 | 1.0% |
| Mexican | 3,407 | 78.0% |
| Norwegian | 7 | 0.2% |
| Subsaharan African | 14 | 0.3% |
| Welsh | 8 | 0.2% | View All 15 Rows |
Immigrants in Armona
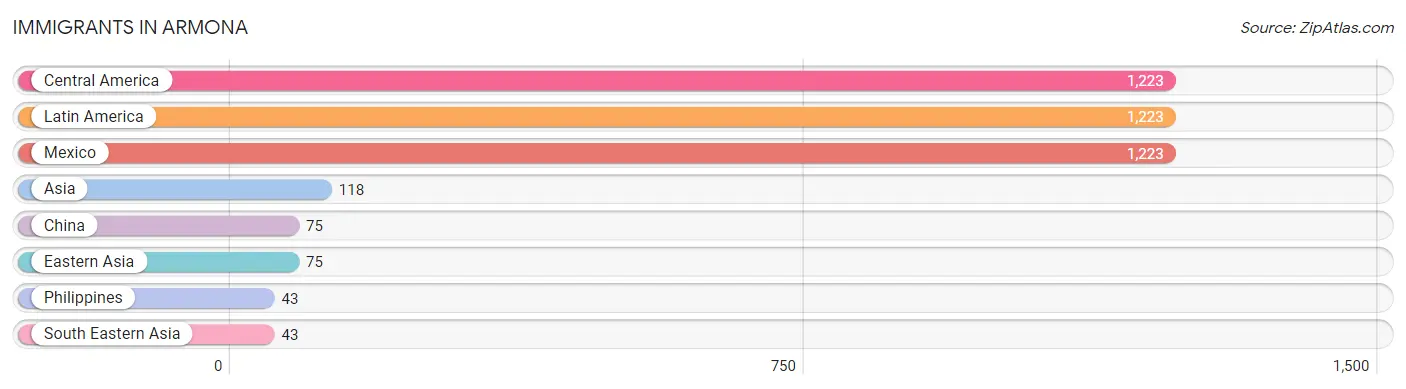
The most numerous immigrant groups reported in Armona came from Central America (1,223 | 28.0%), Latin America (1,223 | 28.0%), Mexico (1,223 | 28.0%), Asia (118 | 2.7%), and China (75 | 1.7%), together accounting for 88.5% of all Armona residents.
| Immigration Origin | # Population | % Population |
| Asia | 118 | 2.7% |
| Central America | 1,223 | 28.0% |
| China | 75 | 1.7% |
| Eastern Asia | 75 | 1.7% |
| Latin America | 1,223 | 28.0% |
| Mexico | 1,223 | 28.0% |
| Philippines | 43 | 1.0% |
| South Eastern Asia | 43 | 1.0% | View All 8 Rows |
Sex and Age in Armona
Sex and Age in Armona
The most populous age groups in Armona are 10 to 14 Years (389 | 16.3%) for men and 15 to 19 Years (250 | 12.7%) for women.
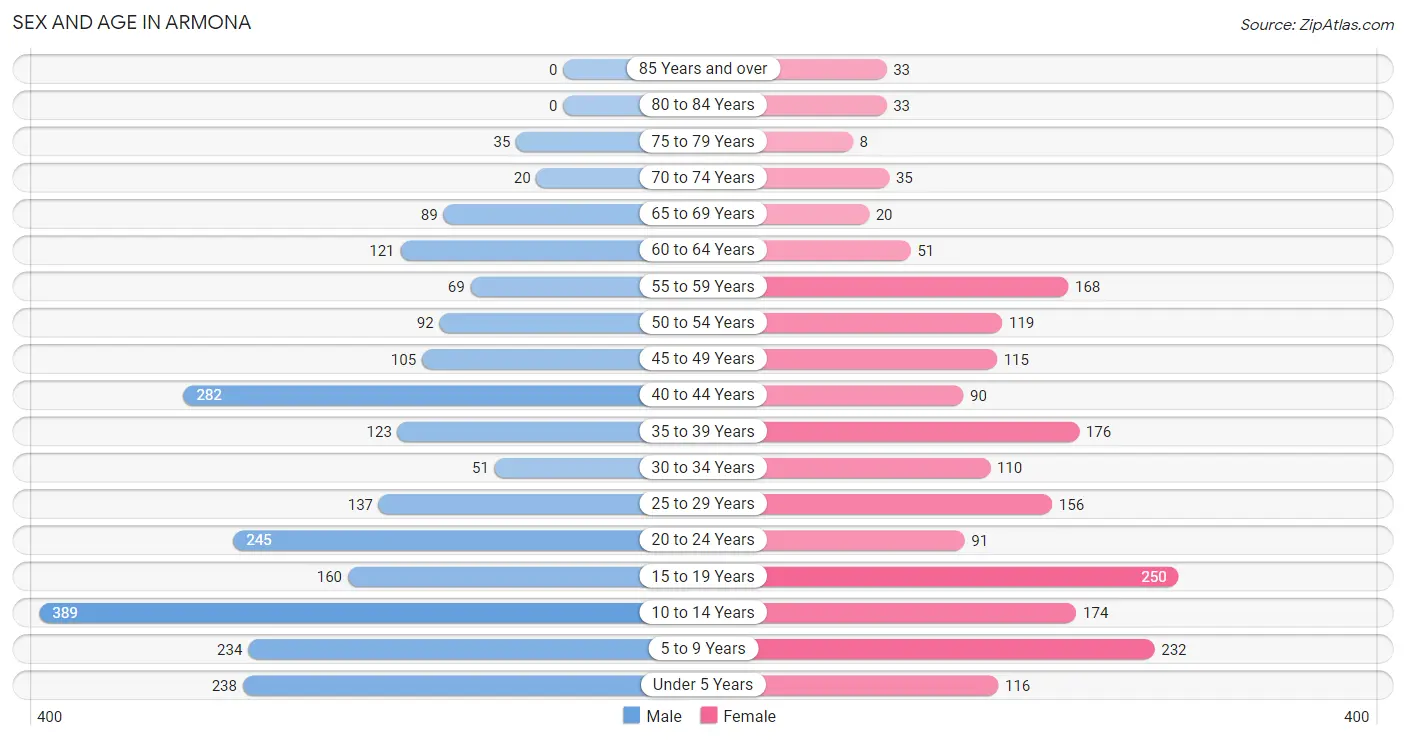
| Age Bracket | Male | Female |
| Under 5 Years | 238 (10.0%) | 116 (5.9%) |
| 5 to 9 Years | 234 (9.8%) | 232 (11.7%) |
| 10 to 14 Years | 389 (16.3%) | 174 (8.8%) |
| 15 to 19 Years | 160 (6.7%) | 250 (12.7%) |
| 20 to 24 Years | 245 (10.2%) | 91 (4.6%) |
| 25 to 29 Years | 137 (5.7%) | 156 (7.9%) |
| 30 to 34 Years | 51 (2.1%) | 110 (5.6%) |
| 35 to 39 Years | 123 (5.1%) | 176 (8.9%) |
| 40 to 44 Years | 282 (11.8%) | 90 (4.5%) |
| 45 to 49 Years | 105 (4.4%) | 115 (5.8%) |
| 50 to 54 Years | 92 (3.8%) | 119 (6.0%) |
| 55 to 59 Years | 69 (2.9%) | 168 (8.5%) |
| 60 to 64 Years | 121 (5.1%) | 51 (2.6%) |
| 65 to 69 Years | 89 (3.7%) | 20 (1.0%) |
| 70 to 74 Years | 20 (0.8%) | 35 (1.8%) |
| 75 to 79 Years | 35 (1.5%) | 8 (0.4%) |
| 80 to 84 Years | 0 (0.0%) | 33 (1.7%) |
| 85 Years and over | 0 (0.0%) | 33 (1.7%) |
| Total | 2,390 (100.0%) | 1,977 (100.0%) |
Families and Households in Armona
Median Family Size in Armona
The median family size in Armona is 4.57 persons per family, with married-couple families (610 | 71.9%) accounting for the largest median family size of 5.2 persons per family. On the other hand, single male/father families (66 | 7.8%) represent the smallest median family size with 2.92 persons per family.
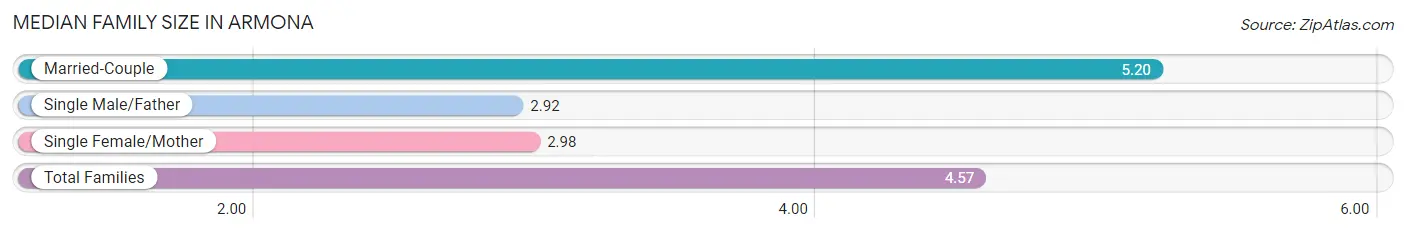
| Family Type | # Families | Family Size |
| Married-Couple | 610 (71.9%) | 5.20 |
| Single Male/Father | 66 (7.8%) | 2.92 |
| Single Female/Mother | 172 (20.3%) | 2.98 |
| Total Families | 848 (100.0%) | 4.57 |
Median Household Size in Armona
The median household size in Armona is 4.22 persons per household, with married-couple households (610 | 58.9%) accounting for the largest median household size of 5.35 persons per household. non-family households (187 | 18.1%) represent the smallest median household size with 1.32 persons per household.
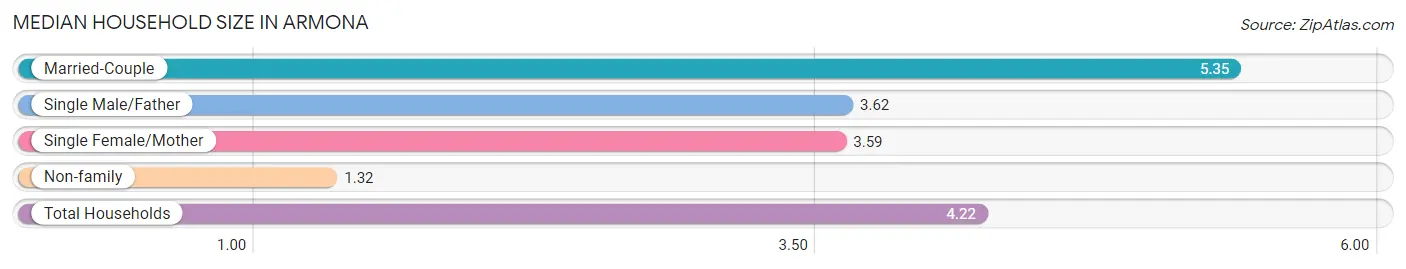
| Household Type | # Households | Household Size |
| Married-Couple | 610 (58.9%) | 5.35 |
| Single Male/Father | 66 (6.4%) | 3.62 |
| Single Female/Mother | 172 (16.6%) | 3.59 |
| Non-family | 187 (18.1%) | 1.32 |
| Total Households | 1,035 (100.0%) | 4.22 |
Household Size by Marriage Status in Armona
Out of a total of 1,035 households in Armona, 848 (81.9%) are family households, while 187 (18.1%) are nonfamily households. The most numerous type of family households are 5-person households, comprising 201, and the most common type of nonfamily households are 1-person households, comprising 155.
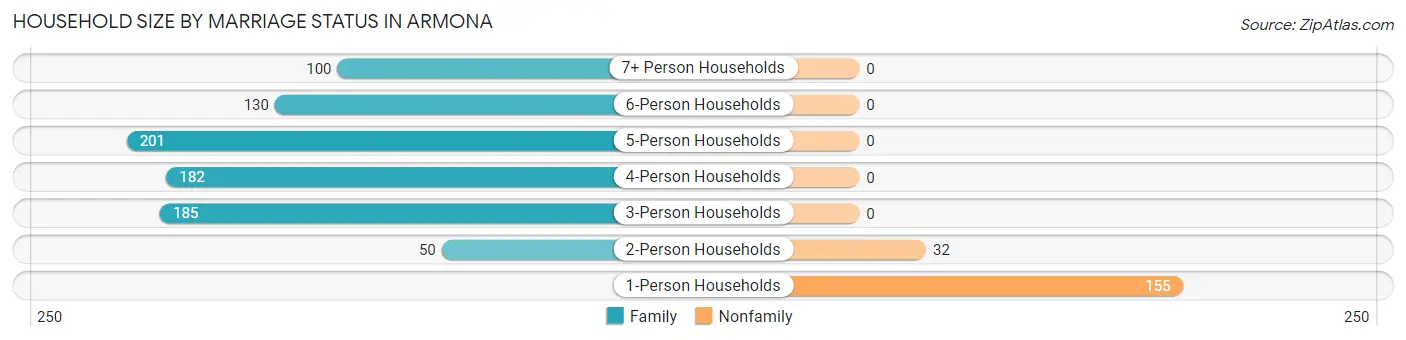
| Household Size | Family Households | Nonfamily Households |
| 1-Person Households | - | 155 (15.0%) |
| 2-Person Households | 50 (4.8%) | 32 (3.1%) |
| 3-Person Households | 185 (17.9%) | 0 (0.0%) |
| 4-Person Households | 182 (17.6%) | 0 (0.0%) |
| 5-Person Households | 201 (19.4%) | 0 (0.0%) |
| 6-Person Households | 130 (12.6%) | 0 (0.0%) |
| 7+ Person Households | 100 (9.7%) | 0 (0.0%) |
| Total | 848 (81.9%) | 187 (18.1%) |
Female Fertility in Armona
Fertility by Age in Armona
Average fertility rate in Armona is 29.0 births per 1,000 women. Women in the age bracket of 20 to 34 years have the highest fertility rate with 84.0 births per 1,000 women. Women in the age bracket of 20 to 34 years acount for 100.0% of all women with births.
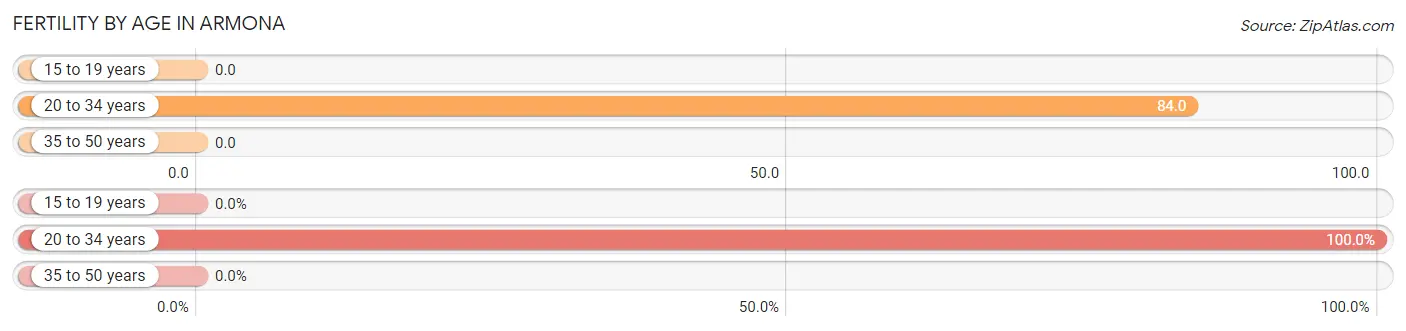
| Age Bracket | Women with Births | Births / 1,000 Women |
| 15 to 19 years | 0 (0.0%) | 0.0 |
| 20 to 34 years | 30 (100.0%) | 84.0 |
| 35 to 50 years | 0 (0.0%) | 0.0 |
| Total | 30 (100.0%) | 29.0 |
Fertility by Age by Marriage Status in Armona
50.0% of women with births (30) in Armona are married. The highest percentage of unmarried women with births falls into 20 to 34 years age bracket with 50.0% of them unmarried at the time of birth, while the lowest percentage of unmarried women with births belong to 20 to 34 years age bracket with 50.0% of them unmarried.
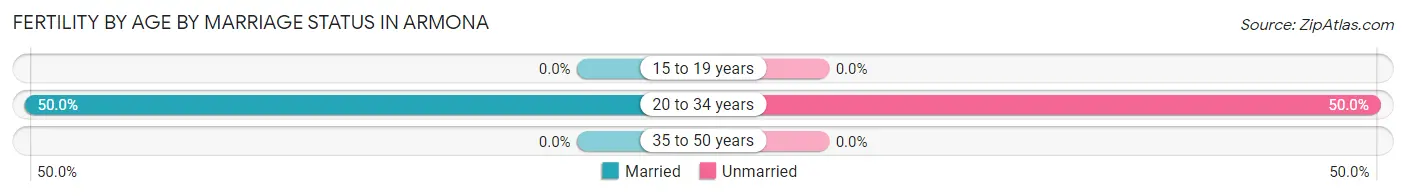
| Age Bracket | Married | Unmarried |
| 15 to 19 years | 0 (0.0%) | 0 (0.0%) |
| 20 to 34 years | 15 (50.0%) | 15 (50.0%) |
| 35 to 50 years | 0 (0.0%) | 0 (0.0%) |
| Total | 15 (50.0%) | 15 (50.0%) |
Fertility by Education in Armona
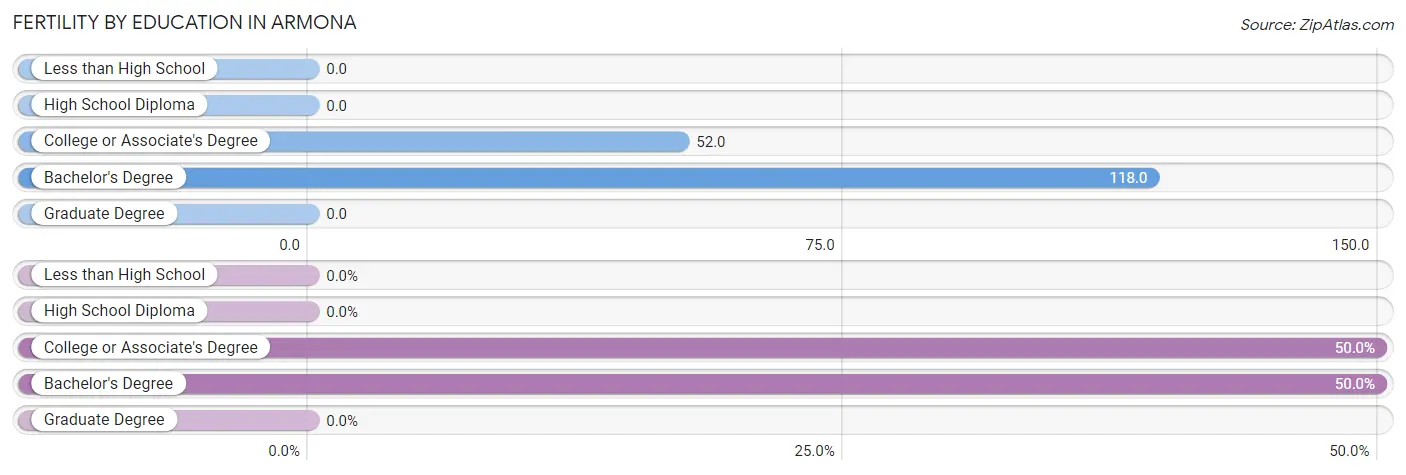
| Educational Attainment | Women with Births | Births / 1,000 Women |
| Less than High School | 0 (0.0%) | 0.0 |
| High School Diploma | 0 (0.0%) | 0.0 |
| College or Associate's Degree | 15 (50.0%) | 52.0 |
| Bachelor's Degree | 15 (50.0%) | 118.0 |
| Graduate Degree | 0 (0.0%) | 0.0 |
| Total | 30 (100.0%) | 29.0 |
Fertility by Education by Marriage Status in Armona
50.0% of women with births in Armona are unmarried. Women with the educational attainment of bachelor's degree are most likely to be married with 100.0% of them married at childbirth, while women with the educational attainment of college or associate's degree are least likely to be married with 100.0% of them unmarried at childbirth.
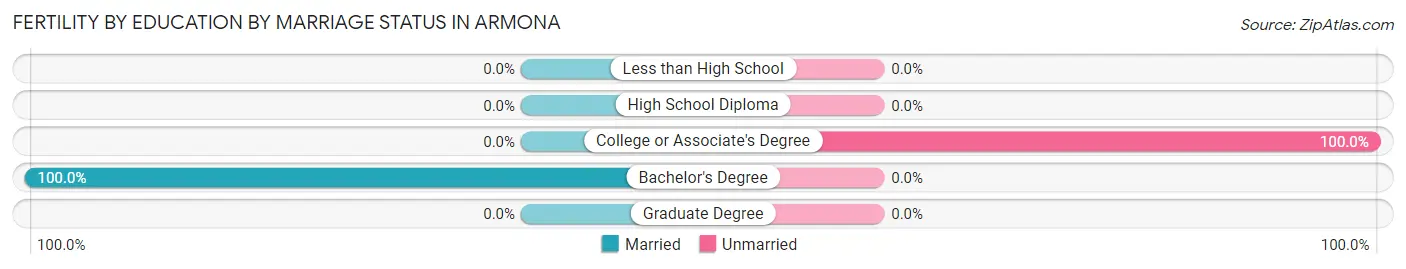
| Educational Attainment | Married | Unmarried |
| Less than High School | 0 (0.0%) | 0 (0.0%) |
| High School Diploma | 0 (0.0%) | 0 (0.0%) |
| College or Associate's Degree | 0 (0.0%) | 15 (100.0%) |
| Bachelor's Degree | 15 (100.0%) | 0 (0.0%) |
| Graduate Degree | 0 (0.0%) | 0 (0.0%) |
| Total | 15 (50.0%) | 15 (50.0%) |
Employment Characteristics in Armona
Employment by Class of Employer in Armona
Among the 1,466 employed individuals in Armona, private company employees (1,105 | 75.4%), not-for-profit organizations (218 | 14.9%), and state government employees (58 | 4.0%) make up the most common classes of employment.
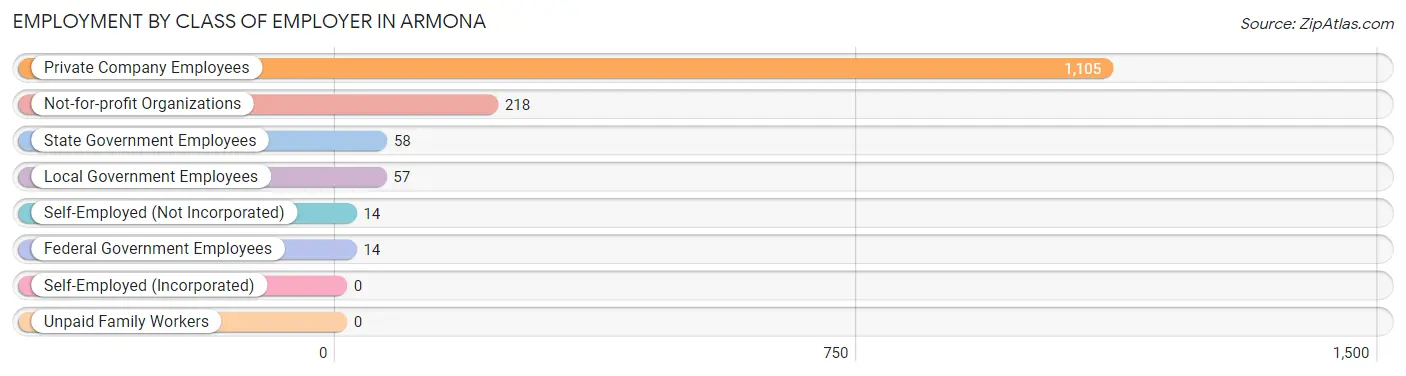
| Employer Class | # Employees | % Employees |
| Private Company Employees | 1,105 | 75.4% |
| Self-Employed (Incorporated) | 0 | 0.0% |
| Self-Employed (Not Incorporated) | 14 | 0.9% |
| Not-for-profit Organizations | 218 | 14.9% |
| Local Government Employees | 57 | 3.9% |
| State Government Employees | 58 | 4.0% |
| Federal Government Employees | 14 | 0.9% |
| Unpaid Family Workers | 0 | 0.0% |
| Total | 1,466 | 100.0% |
Employment Status by Age in Armona
According to the labor force statistics for Armona, out of the total population over 16 years of age (2,921), 61.8% or 1,805 individuals are in the labor force, with 8.9% or 161 of them unemployed. The age group with the highest labor force participation rate is 45 to 54 years, with 85.8% or 370 individuals in the labor force. Within the labor force, the 45 to 54 years age range has the highest percentage of unemployed individuals, with 25.7% or 95 of them being unemployed.
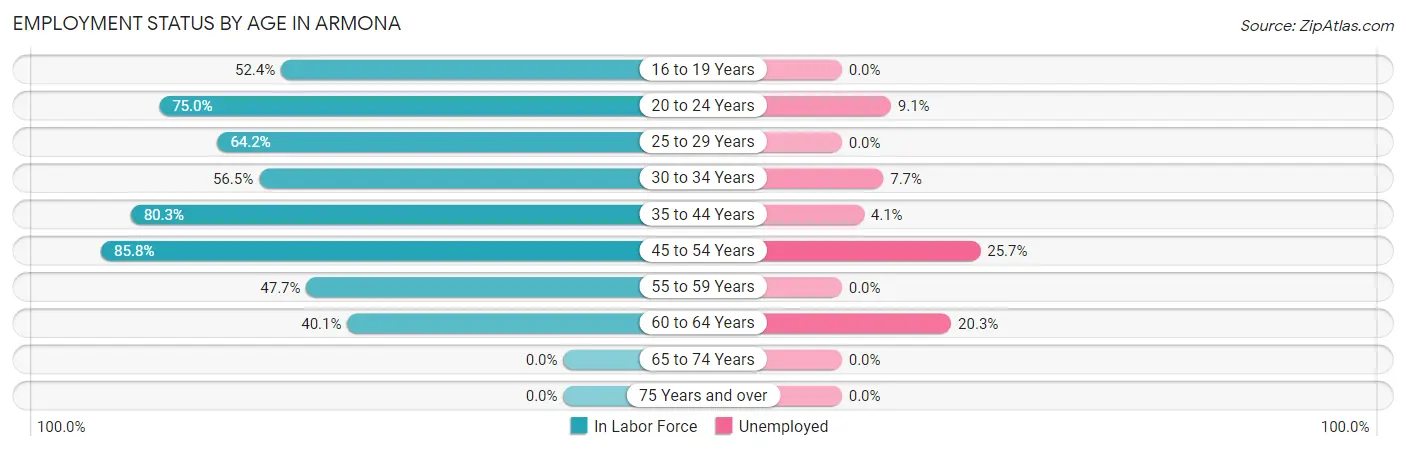
| Age Bracket | In Labor Force | Unemployed |
| 16 to 19 Years | 182 (52.4%) | 0 (0.0%) |
| 20 to 24 Years | 252 (75.0%) | 23 (9.1%) |
| 25 to 29 Years | 188 (64.2%) | 0 (0.0%) |
| 30 to 34 Years | 91 (56.5%) | 7 (7.7%) |
| 35 to 44 Years | 539 (80.3%) | 22 (4.1%) |
| 45 to 54 Years | 370 (85.8%) | 95 (25.7%) |
| 55 to 59 Years | 113 (47.7%) | 0 (0.0%) |
| 60 to 64 Years | 69 (40.1%) | 14 (20.3%) |
| 65 to 74 Years | 0 (0.0%) | 0 (0.0%) |
| 75 Years and over | 0 (0.0%) | 0 (0.0%) |
| Total | 1,805 (61.8%) | 161 (8.9%) |
Employment Status by Educational Attainment in Armona
According to labor force statistics for Armona, 69.7% of individuals (1,370) out of the total population between 25 and 64 years of age (1,965) are in the labor force, with 10.1% or 138 of them being unemployed. The group with the highest labor force participation rate are those with the educational attainment of bachelor's degree or higher, with 92.6% or 150 individuals in the labor force. Within the labor force, individuals with less than high school education have the highest percentage of unemployment, with 17.1% or 77 of them being unemployed.
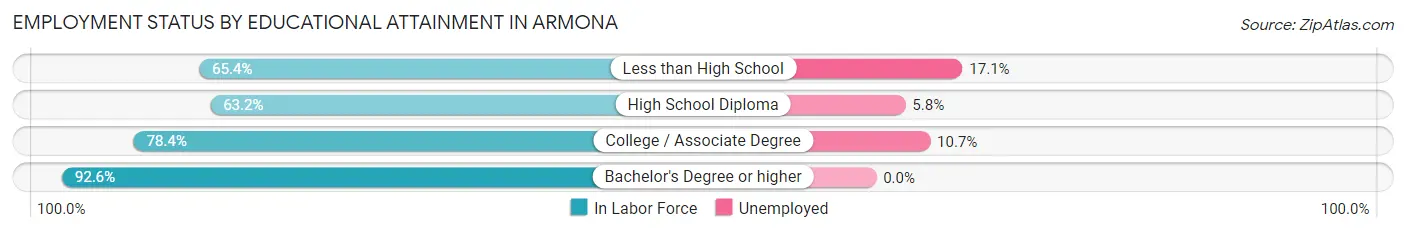
| Educational Attainment | In Labor Force | Unemployed |
| Less than High School | 451 (65.4%) | 118 (17.1%) |
| High School Diploma | 431 (63.2%) | 40 (5.8%) |
| College / Associate Degree | 338 (78.4%) | 46 (10.7%) |
| Bachelor's Degree or higher | 150 (92.6%) | 0 (0.0%) |
| Total | 1,370 (69.7%) | 198 (10.1%) |
Employment Occupations by Sex in Armona
Management, Business, Science and Arts Occupations
The most common Management, Business, Science and Arts occupations in Armona are Management (72 | 4.4%), Community & Social Service (43 | 2.6%), and Education Instruction & Library (43 | 2.6%).
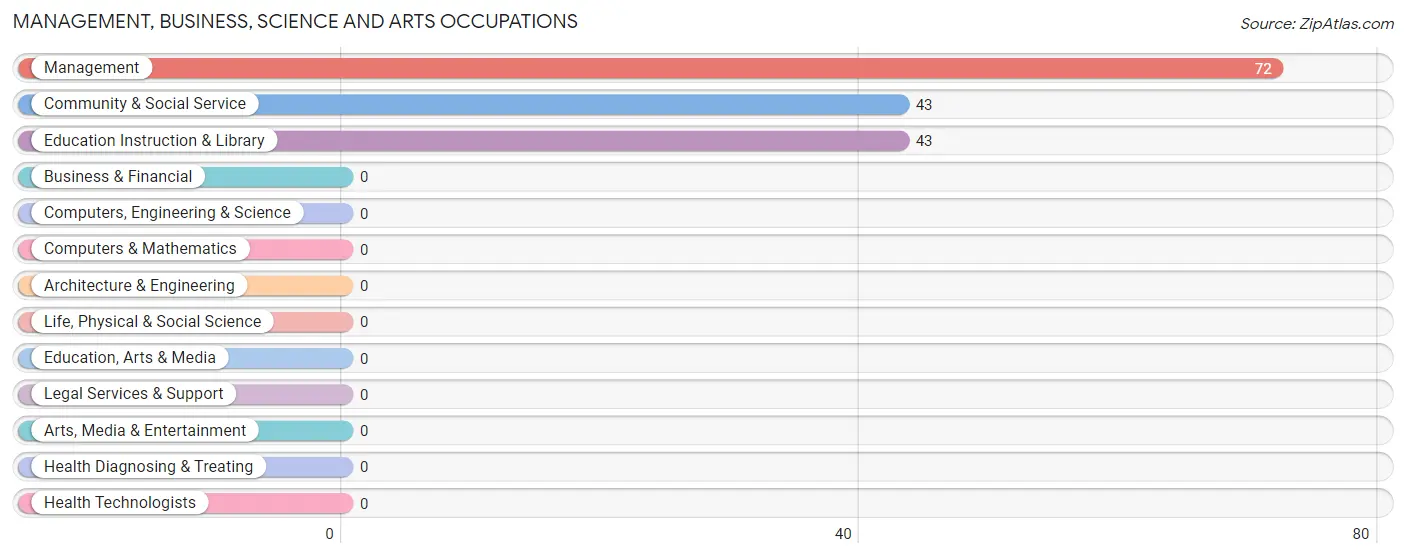
Management, Business, Science and Arts Occupations by Sex
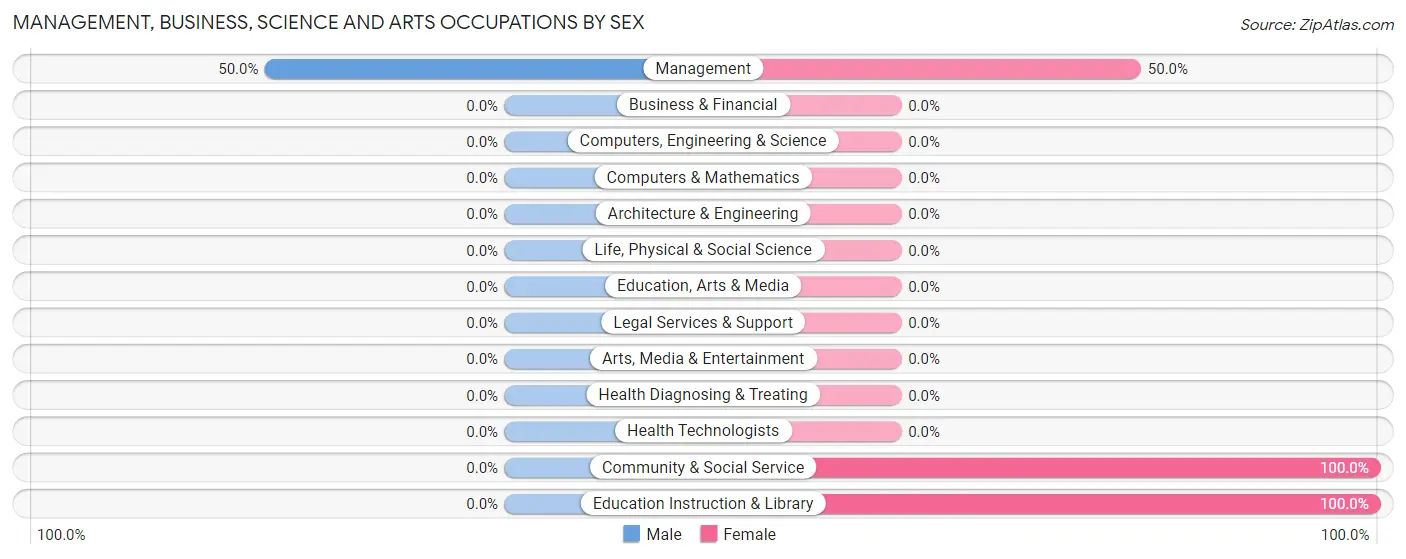
| Occupation | Male | Female |
| Management | 36 (50.0%) | 36 (50.0%) |
| Business & Financial | 0 (0.0%) | 0 (0.0%) |
| Computers, Engineering & Science | 0 (0.0%) | 0 (0.0%) |
| Computers & Mathematics | 0 (0.0%) | 0 (0.0%) |
| Architecture & Engineering | 0 (0.0%) | 0 (0.0%) |
| Life, Physical & Social Science | 0 (0.0%) | 0 (0.0%) |
| Community & Social Service | 0 (0.0%) | 43 (100.0%) |
| Education, Arts & Media | 0 (0.0%) | 0 (0.0%) |
| Legal Services & Support | 0 (0.0%) | 0 (0.0%) |
| Education Instruction & Library | 0 (0.0%) | 43 (100.0%) |
| Arts, Media & Entertainment | 0 (0.0%) | 0 (0.0%) |
| Health Diagnosing & Treating | 0 (0.0%) | 0 (0.0%) |
| Health Technologists | 0 (0.0%) | 0 (0.0%) |
| Total (Category) | 36 (31.3%) | 79 (68.7%) |
| Total (Overall) | 914 (55.6%) | 729 (44.4%) |
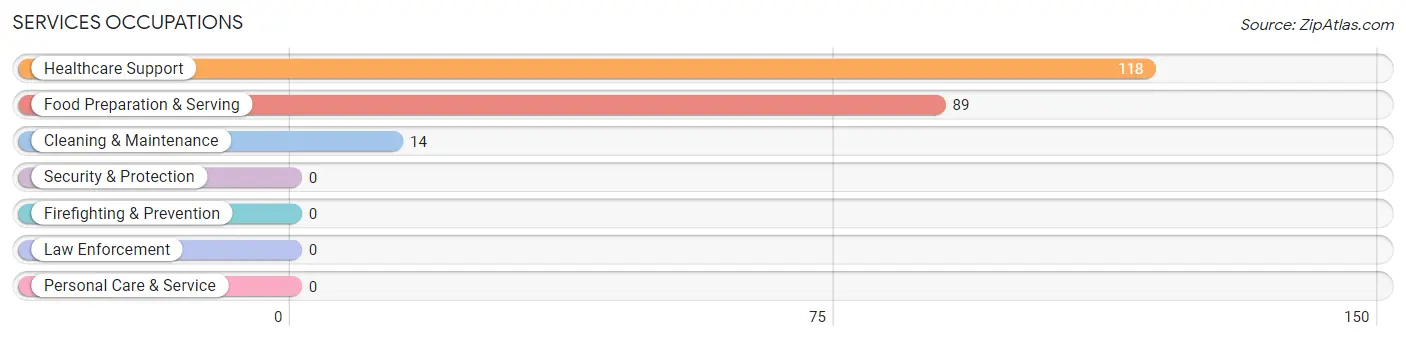
Services Occupations
The most common Services occupations in Armona are Healthcare Support (118 | 7.2%), Food Preparation & Serving (89 | 5.4%), and Cleaning & Maintenance (14 | 0.9%).
Services Occupations by Sex
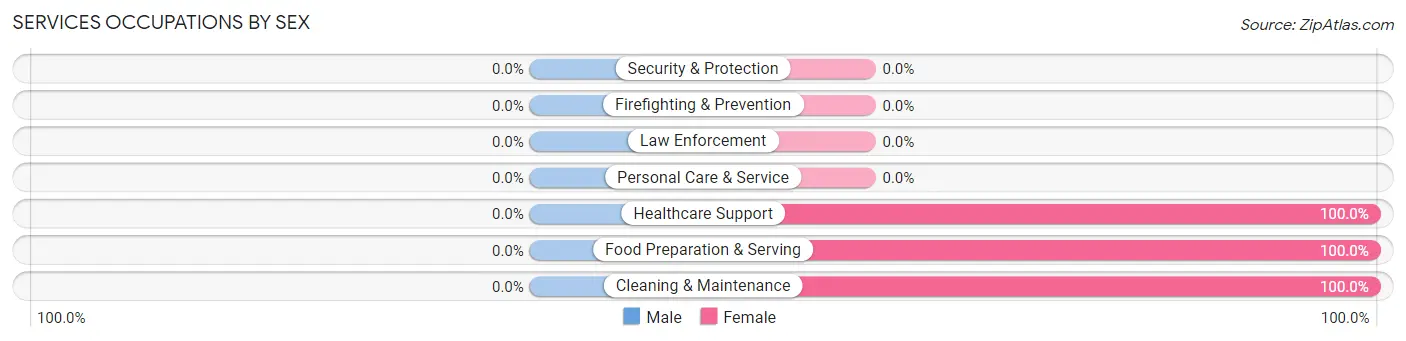
| Occupation | Male | Female |
| Healthcare Support | 0 (0.0%) | 118 (100.0%) |
| Security & Protection | 0 (0.0%) | 0 (0.0%) |
| Firefighting & Prevention | 0 (0.0%) | 0 (0.0%) |
| Law Enforcement | 0 (0.0%) | 0 (0.0%) |
| Food Preparation & Serving | 0 (0.0%) | 89 (100.0%) |
| Cleaning & Maintenance | 0 (0.0%) | 14 (100.0%) |
| Personal Care & Service | 0 (0.0%) | 0 (0.0%) |
| Total (Category) | 0 (0.0%) | 221 (100.0%) |
| Total (Overall) | 914 (55.6%) | 729 (44.4%) |
Sales and Office Occupations
The most common Sales and Office occupations in Armona are Office & Administration (181 | 11.0%), and Sales & Related (172 | 10.5%).
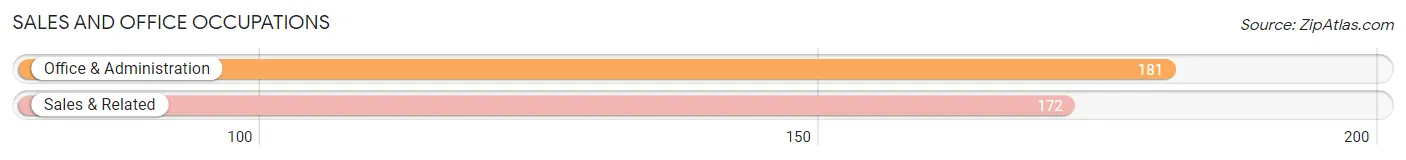
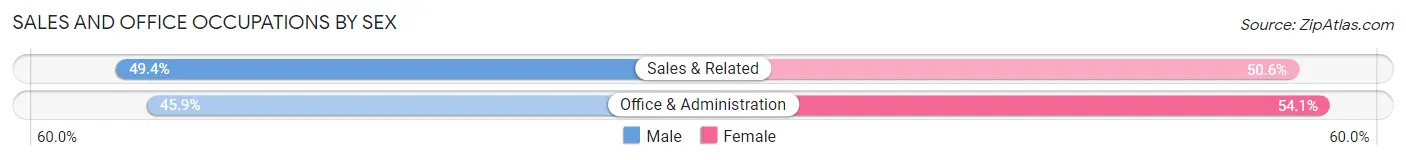
Sales and Office Occupations by Sex
| Occupation | Male | Female |
| Sales & Related | 85 (49.4%) | 87 (50.6%) |
| Office & Administration | 83 (45.9%) | 98 (54.1%) |
| Total (Category) | 168 (47.6%) | 185 (52.4%) |
| Total (Overall) | 914 (55.6%) | 729 (44.4%) |
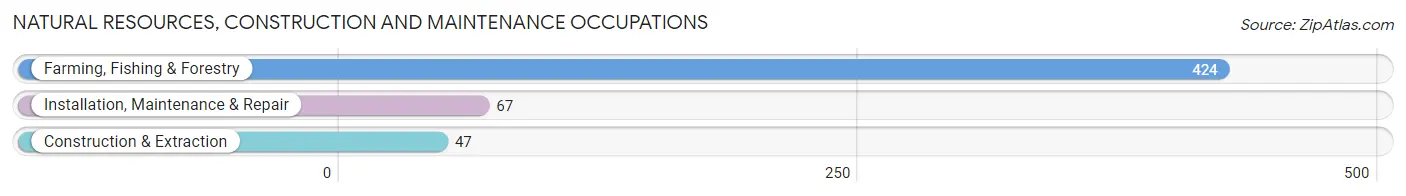
Natural Resources, Construction and Maintenance Occupations
The most common Natural Resources, Construction and Maintenance occupations in Armona are Farming, Fishing & Forestry (424 | 25.8%), Installation, Maintenance & Repair (67 | 4.1%), and Construction & Extraction (47 | 2.9%).
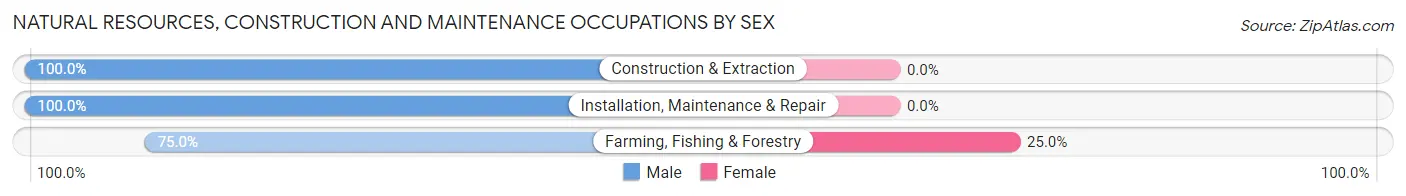
Natural Resources, Construction and Maintenance Occupations by Sex
| Occupation | Male | Female |
| Farming, Fishing & Forestry | 318 (75.0%) | 106 (25.0%) |
| Construction & Extraction | 47 (100.0%) | 0 (0.0%) |
| Installation, Maintenance & Repair | 67 (100.0%) | 0 (0.0%) |
| Total (Category) | 432 (80.3%) | 106 (19.7%) |
| Total (Overall) | 914 (55.6%) | 729 (44.4%) |
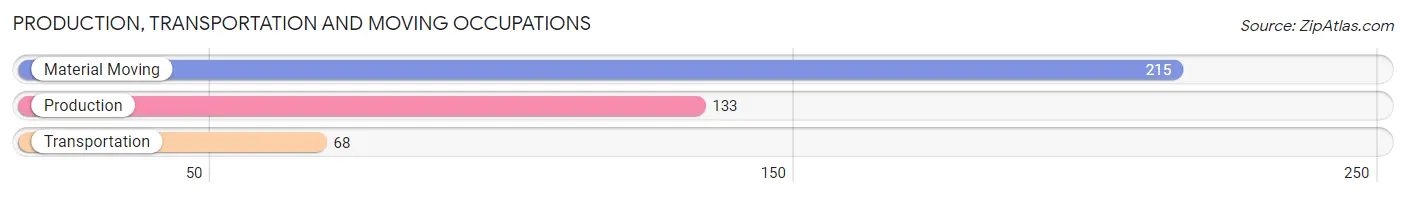
Production, Transportation and Moving Occupations
The most common Production, Transportation and Moving occupations in Armona are Material Moving (215 | 13.1%), Production (133 | 8.1%), and Transportation (68 | 4.1%).
Production, Transportation and Moving Occupations by Sex
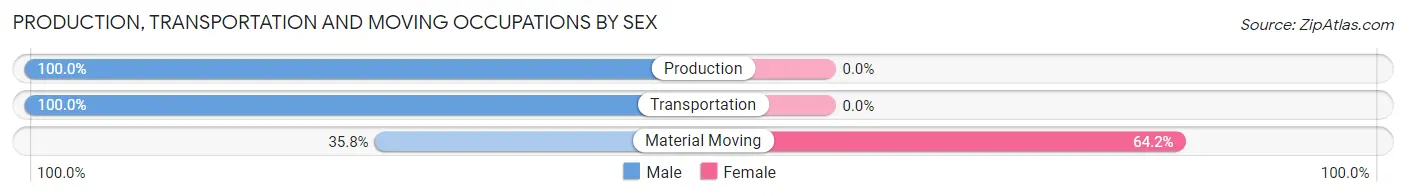
| Occupation | Male | Female |
| Production | 133 (100.0%) | 0 (0.0%) |
| Transportation | 68 (100.0%) | 0 (0.0%) |
| Material Moving | 77 (35.8%) | 138 (64.2%) |
| Total (Category) | 278 (66.8%) | 138 (33.2%) |
| Total (Overall) | 914 (55.6%) | 729 (44.4%) |
Employment Industries by Sex in Armona
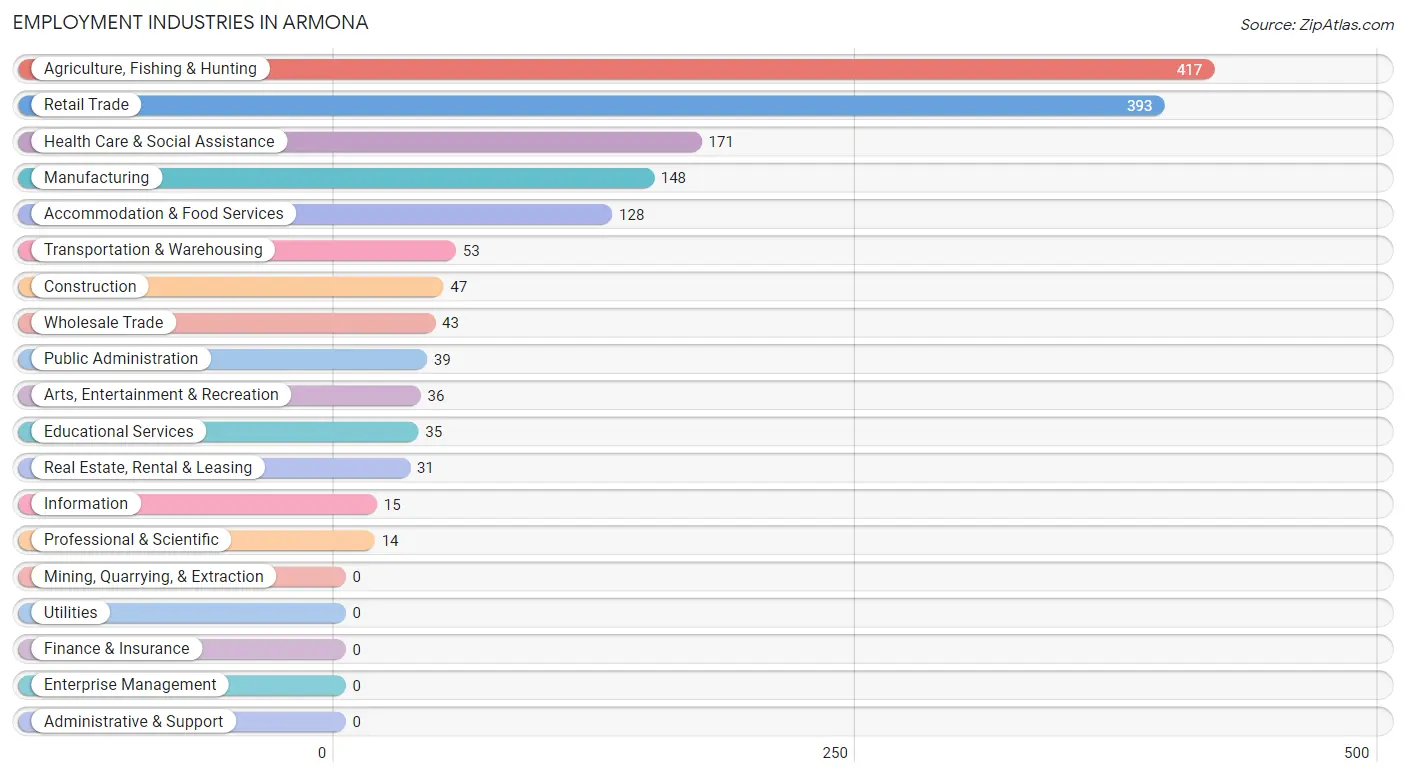
Employment Industries in Armona
The major employment industries in Armona include Agriculture, Fishing & Hunting (417 | 25.4%), Retail Trade (393 | 23.9%), Health Care & Social Assistance (171 | 10.4%), Manufacturing (148 | 9.0%), and Accommodation & Food Services (128 | 7.8%).
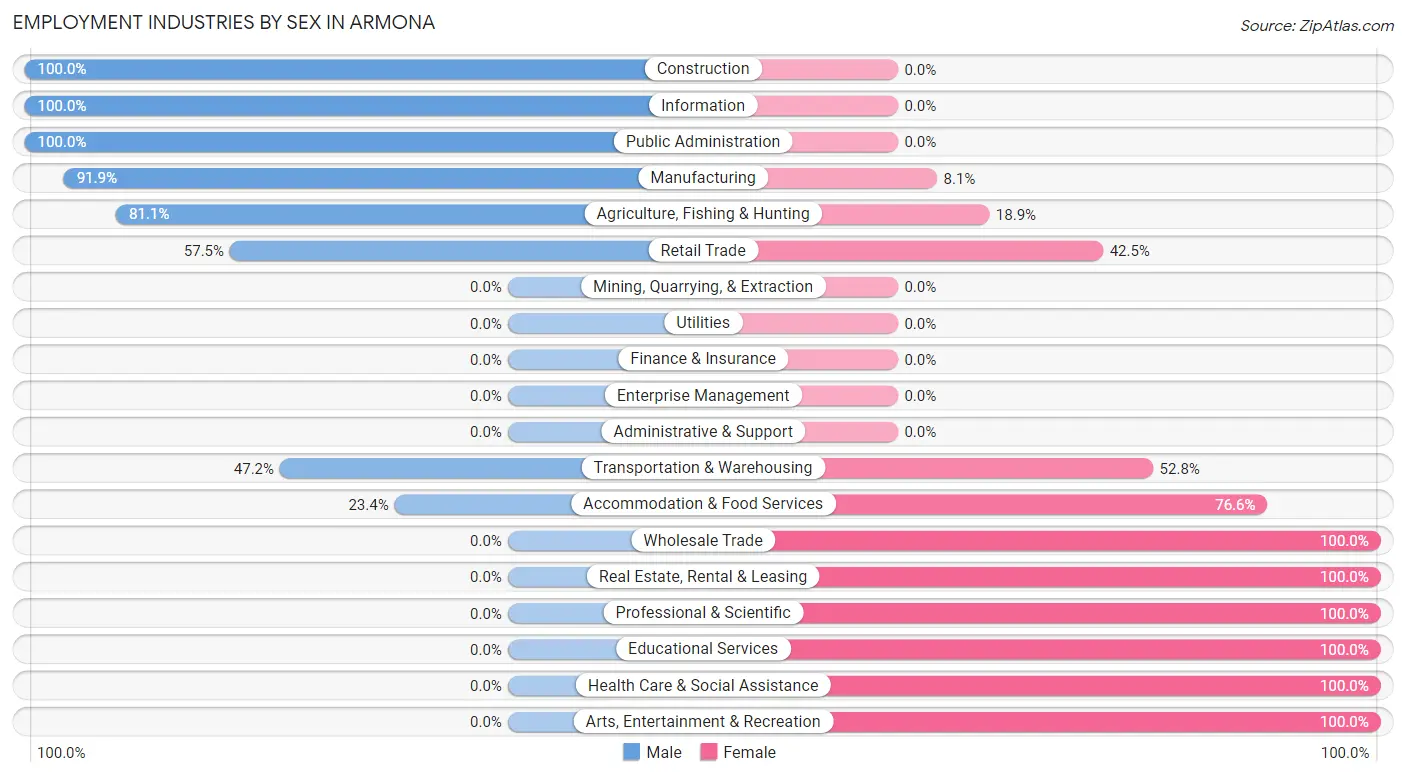
Employment Industries by Sex in Armona
The Armona industries that see more men than women are Construction (100.0%), Information (100.0%), and Public Administration (100.0%), whereas the industries that tend to have a higher number of women are Wholesale Trade (100.0%), Real Estate, Rental & Leasing (100.0%), and Professional & Scientific (100.0%).
| Industry | Male | Female |
| Agriculture, Fishing & Hunting | 338 (81.1%) | 79 (18.9%) |
| Mining, Quarrying, & Extraction | 0 (0.0%) | 0 (0.0%) |
| Construction | 47 (100.0%) | 0 (0.0%) |
| Manufacturing | 136 (91.9%) | 12 (8.1%) |
| Wholesale Trade | 0 (0.0%) | 43 (100.0%) |
| Retail Trade | 226 (57.5%) | 167 (42.5%) |
| Transportation & Warehousing | 25 (47.2%) | 28 (52.8%) |
| Utilities | 0 (0.0%) | 0 (0.0%) |
| Information | 15 (100.0%) | 0 (0.0%) |
| Finance & Insurance | 0 (0.0%) | 0 (0.0%) |
| Real Estate, Rental & Leasing | 0 (0.0%) | 31 (100.0%) |
| Professional & Scientific | 0 (0.0%) | 14 (100.0%) |
| Enterprise Management | 0 (0.0%) | 0 (0.0%) |
| Administrative & Support | 0 (0.0%) | 0 (0.0%) |
| Educational Services | 0 (0.0%) | 35 (100.0%) |
| Health Care & Social Assistance | 0 (0.0%) | 171 (100.0%) |
| Arts, Entertainment & Recreation | 0 (0.0%) | 36 (100.0%) |
| Accommodation & Food Services | 30 (23.4%) | 98 (76.6%) |
| Public Administration | 39 (100.0%) | 0 (0.0%) |
| Total | 914 (55.6%) | 729 (44.4%) |
Education in Armona
School Enrollment in Armona
The most common levels of schooling among the 1,605 students in Armona are high school (379 | 23.6%), middle school (357 | 22.2%), and elementary school (328 | 20.4%).
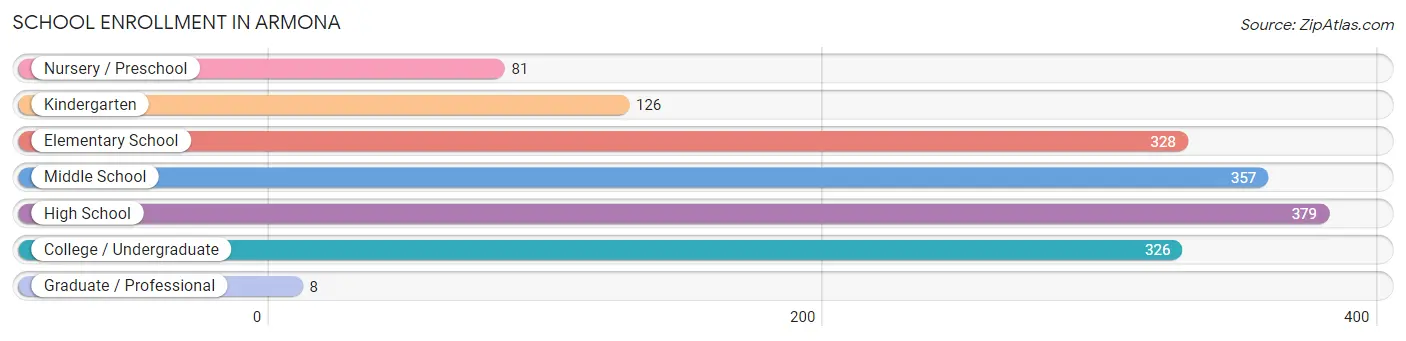
| School Level | # Students | % Students |
| Nursery / Preschool | 81 | 5.1% |
| Kindergarten | 126 | 7.9% |
| Elementary School | 328 | 20.4% |
| Middle School | 357 | 22.2% |
| High School | 379 | 23.6% |
| College / Undergraduate | 326 | 20.3% |
| Graduate / Professional | 8 | 0.5% |
| Total | 1,605 | 100.0% |
School Enrollment by Age by Funding Source in Armona
Out of a total of 1,605 students who are enrolled in schools in Armona, 14 (0.9%) attend a private institution, while the remaining 1,591 (99.1%) are enrolled in public schools. The age group of 10 to 14 year olds has the highest likelihood of being enrolled in private schools, with 15 (2.7% in the age bracket) enrolled. Conversely, the age group of 3 to 4 year olds has the lowest likelihood of being enrolled in a private school, with 66 (100.0% in the age bracket) attending a public institution.
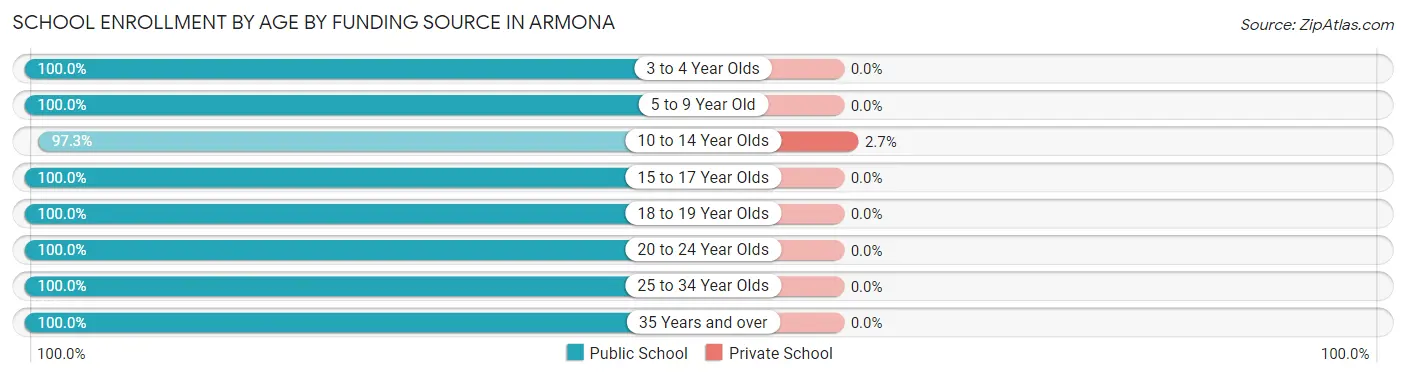
| Age Bracket | Public School | Private School |
| 3 to 4 Year Olds | 66 (100.0%) | 0 (0.0%) |
| 5 to 9 Year Old | 434 (100.0%) | 0 (0.0%) |
| 10 to 14 Year Olds | 548 (97.3%) | 15 (2.7%) |
| 15 to 17 Year Olds | 135 (100.0%) | 0 (0.0%) |
| 18 to 19 Year Olds | 164 (100.0%) | 0 (0.0%) |
| 20 to 24 Year Olds | 163 (100.0%) | 0 (0.0%) |
| 25 to 34 Year Olds | 33 (100.0%) | 0 (0.0%) |
| 35 Years and over | 47 (100.0%) | 0 (0.0%) |
| Total | 1,591 (99.1%) | 14 (0.9%) |
Educational Attainment by Field of Study in Armona
Psychology (91 | 49.7%), arts & humanities (30 | 16.4%), business (20 | 10.9%), science & technology (18 | 9.8%), and liberal arts & history (15 | 8.2%) are the most common fields of study among 183 individuals in Armona who have obtained a bachelor's degree or higher.
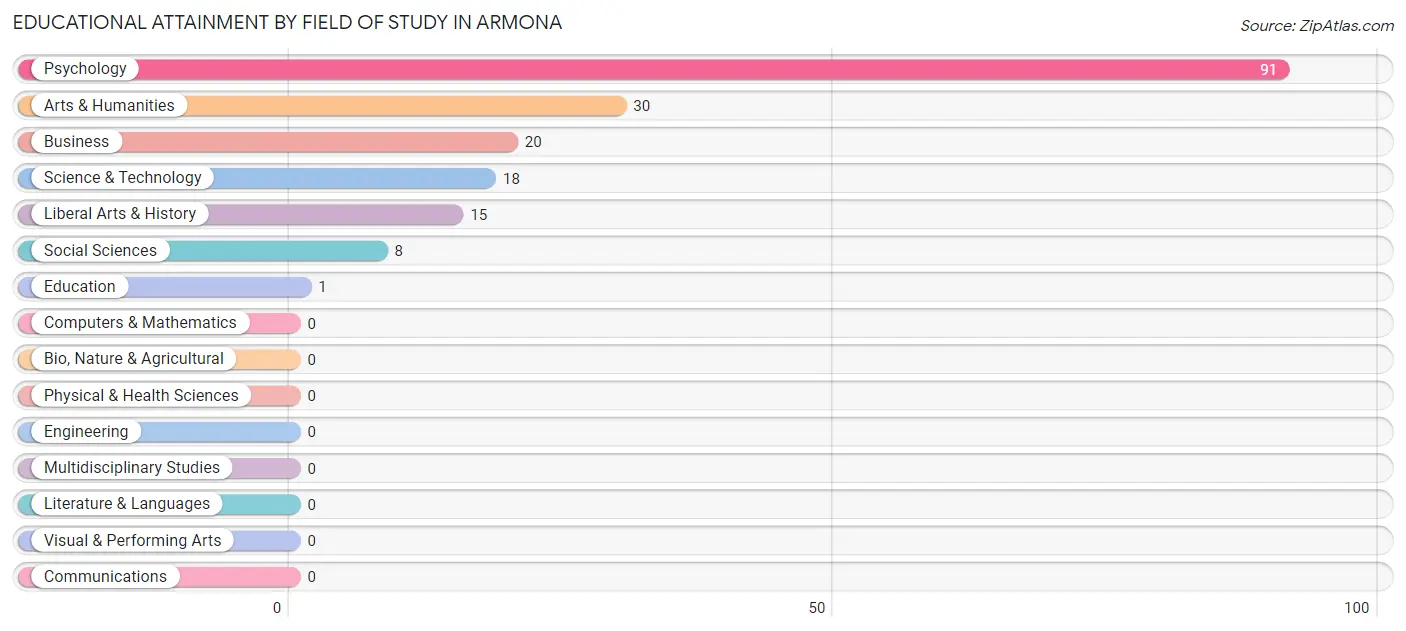
| Field of Study | # Graduates | % Graduates |
| Computers & Mathematics | 0 | 0.0% |
| Bio, Nature & Agricultural | 0 | 0.0% |
| Physical & Health Sciences | 0 | 0.0% |
| Psychology | 91 | 49.7% |
| Social Sciences | 8 | 4.4% |
| Engineering | 0 | 0.0% |
| Multidisciplinary Studies | 0 | 0.0% |
| Science & Technology | 18 | 9.8% |
| Business | 20 | 10.9% |
| Education | 1 | 0.5% |
| Literature & Languages | 0 | 0.0% |
| Liberal Arts & History | 15 | 8.2% |
| Visual & Performing Arts | 0 | 0.0% |
| Communications | 0 | 0.0% |
| Arts & Humanities | 30 | 16.4% |
| Total | 183 | 100.0% |
Transportation & Commute in Armona
Vehicle Availability by Sex in Armona
The most prevalent vehicle ownership categories in Armona are males with 3 vehicles (340, accounting for 43.8%) and females with 3 vehicles (263, making up 49.3%).
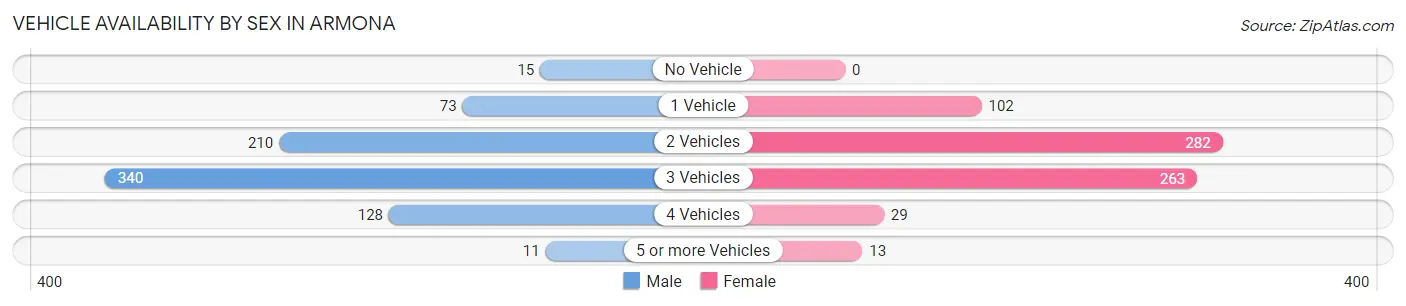
| Vehicles Available | Male | Female |
| No Vehicle | 15 (1.9%) | 0 (0.0%) |
| 1 Vehicle | 73 (9.4%) | 102 (14.8%) |
| 2 Vehicles | 210 (27.0%) | 282 (40.9%) |
| 3 Vehicles | 340 (43.8%) | 263 (38.2%) |
| 4 Vehicles | 128 (16.5%) | 29 (4.2%) |
| 5 or more Vehicles | 11 (1.4%) | 13 (1.9%) |
| Total | 777 (100.0%) | 689 (100.0%) |
Commute Time in Armona
The most frequently occuring commute durations in Armona are 10 to 14 minutes (284 commuters, 19.9%), 5 to 9 minutes (267 commuters, 18.8%), and 15 to 19 minutes (243 commuters, 17.1%).
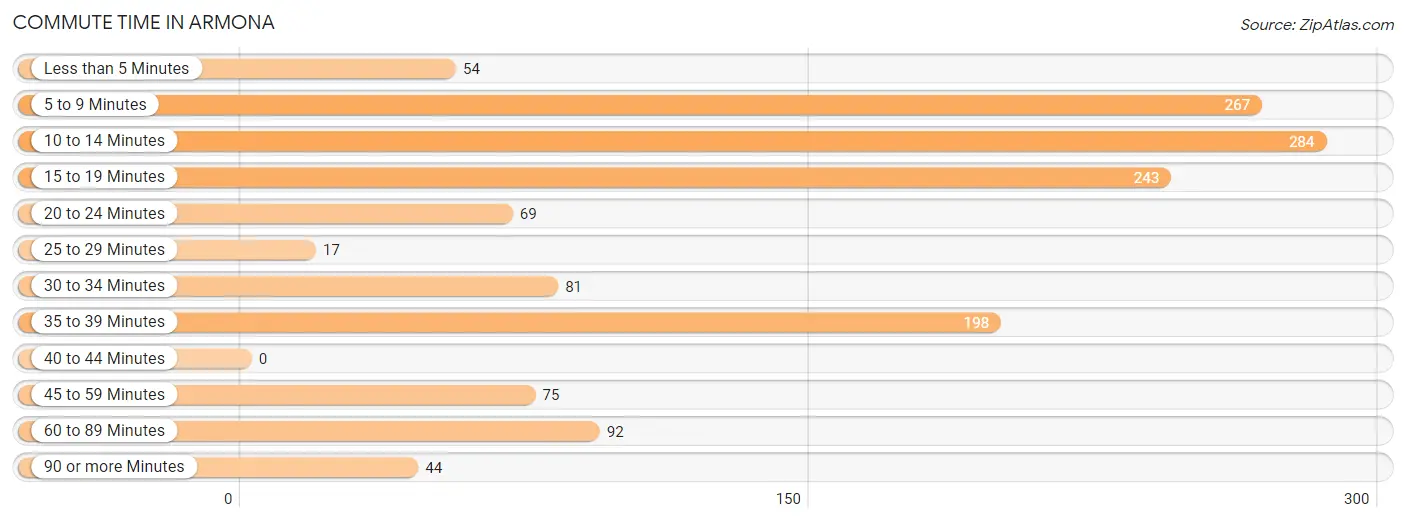
| Commute Time | # Commuters | % Commuters |
| Less than 5 Minutes | 54 | 3.8% |
| 5 to 9 Minutes | 267 | 18.8% |
| 10 to 14 Minutes | 284 | 19.9% |
| 15 to 19 Minutes | 243 | 17.1% |
| 20 to 24 Minutes | 69 | 4.9% |
| 25 to 29 Minutes | 17 | 1.2% |
| 30 to 34 Minutes | 81 | 5.7% |
| 35 to 39 Minutes | 198 | 13.9% |
| 40 to 44 Minutes | 0 | 0.0% |
| 45 to 59 Minutes | 75 | 5.3% |
| 60 to 89 Minutes | 92 | 6.5% |
| 90 or more Minutes | 44 | 3.1% |
Commute Time by Sex in Armona
The most common commute times in Armona are 10 to 14 minutes (171 commuters, 22.0%) for males and 15 to 19 minutes (152 commuters, 23.5%) for females.
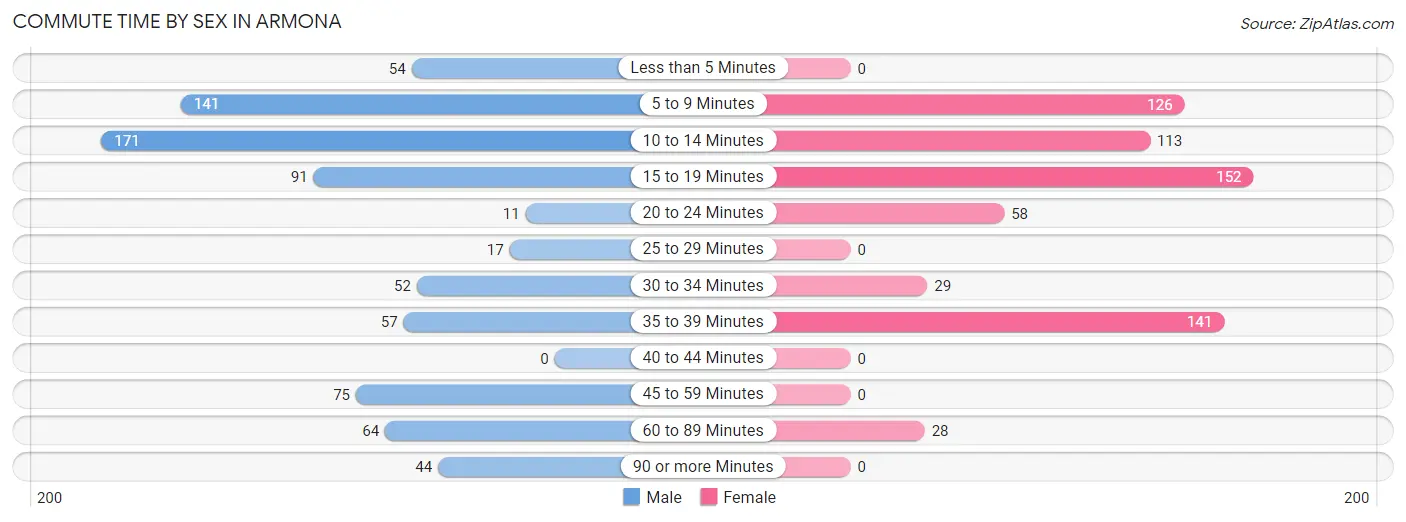
| Commute Time | Male | Female |
| Less than 5 Minutes | 54 (7.0%) | 0 (0.0%) |
| 5 to 9 Minutes | 141 (18.1%) | 126 (19.5%) |
| 10 to 14 Minutes | 171 (22.0%) | 113 (17.5%) |
| 15 to 19 Minutes | 91 (11.7%) | 152 (23.5%) |
| 20 to 24 Minutes | 11 (1.4%) | 58 (9.0%) |
| 25 to 29 Minutes | 17 (2.2%) | 0 (0.0%) |
| 30 to 34 Minutes | 52 (6.7%) | 29 (4.5%) |
| 35 to 39 Minutes | 57 (7.3%) | 141 (21.8%) |
| 40 to 44 Minutes | 0 (0.0%) | 0 (0.0%) |
| 45 to 59 Minutes | 75 (9.7%) | 0 (0.0%) |
| 60 to 89 Minutes | 64 (8.2%) | 28 (4.3%) |
| 90 or more Minutes | 44 (5.7%) | 0 (0.0%) |
Time of Departure to Work by Sex in Armona
The most frequent times of departure to work in Armona are 5:00 AM to 5:29 AM (189, 24.3%) for males and 5:00 AM to 5:29 AM (159, 24.6%) for females.
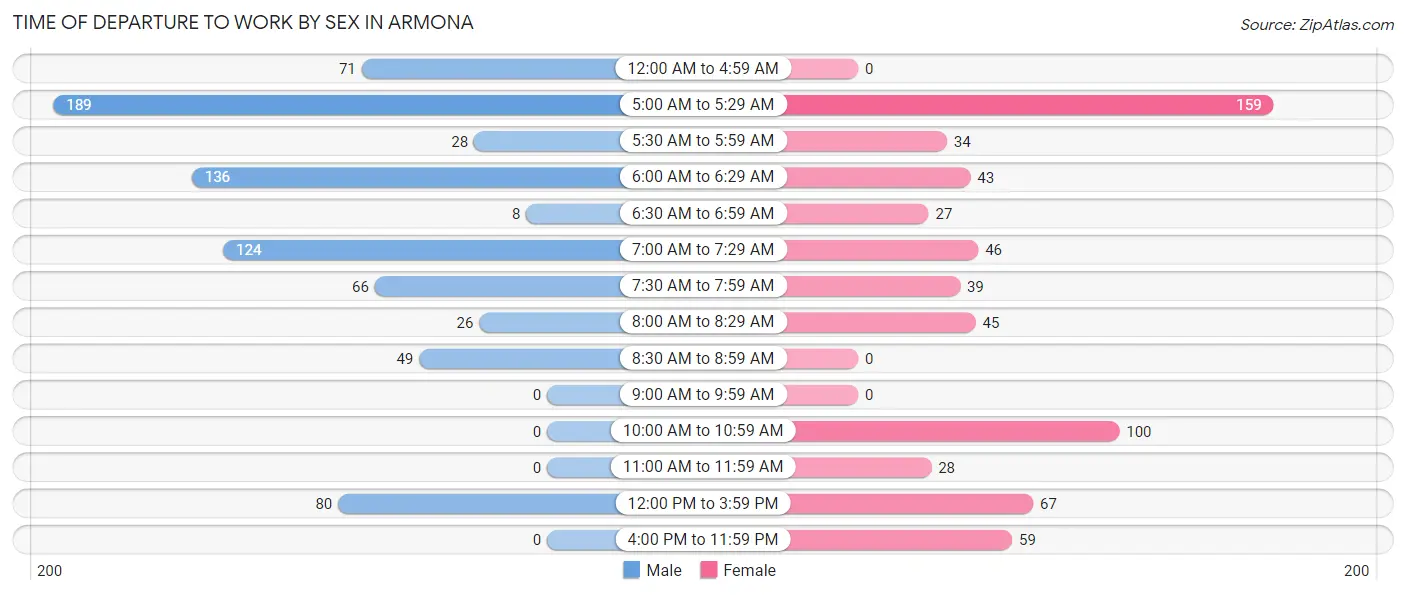
| Time of Departure | Male | Female |
| 12:00 AM to 4:59 AM | 71 (9.1%) | 0 (0.0%) |
| 5:00 AM to 5:29 AM | 189 (24.3%) | 159 (24.6%) |
| 5:30 AM to 5:59 AM | 28 (3.6%) | 34 (5.3%) |
| 6:00 AM to 6:29 AM | 136 (17.5%) | 43 (6.7%) |
| 6:30 AM to 6:59 AM | 8 (1.0%) | 27 (4.2%) |
| 7:00 AM to 7:29 AM | 124 (16.0%) | 46 (7.1%) |
| 7:30 AM to 7:59 AM | 66 (8.5%) | 39 (6.0%) |
| 8:00 AM to 8:29 AM | 26 (3.4%) | 45 (7.0%) |
| 8:30 AM to 8:59 AM | 49 (6.3%) | 0 (0.0%) |
| 9:00 AM to 9:59 AM | 0 (0.0%) | 0 (0.0%) |
| 10:00 AM to 10:59 AM | 0 (0.0%) | 100 (15.5%) |
| 11:00 AM to 11:59 AM | 0 (0.0%) | 28 (4.3%) |
| 12:00 PM to 3:59 PM | 80 (10.3%) | 67 (10.4%) |
| 4:00 PM to 11:59 PM | 0 (0.0%) | 59 (9.1%) |
| Total | 777 (100.0%) | 647 (100.0%) |
Housing Occupancy in Armona
Occupancy by Ownership in Armona
Of the total 1,035 dwellings in Armona, owner-occupied units account for 672 (64.9%), while renter-occupied units make up 363 (35.1%).
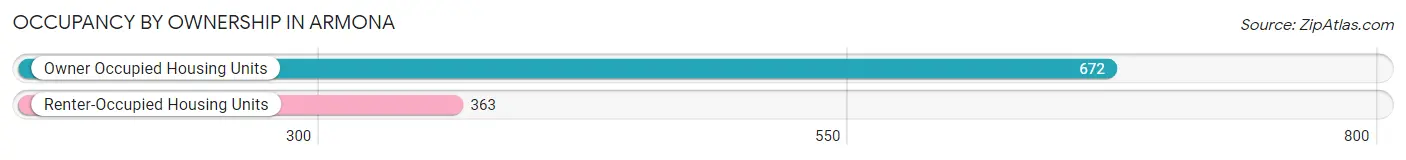
| Occupancy | # Housing Units | % Housing Units |
| Owner Occupied Housing Units | 672 | 64.9% |
| Renter-Occupied Housing Units | 363 | 35.1% |
| Total Occupied Housing Units | 1,035 | 100.0% |
Occupancy by Household Size in Armona
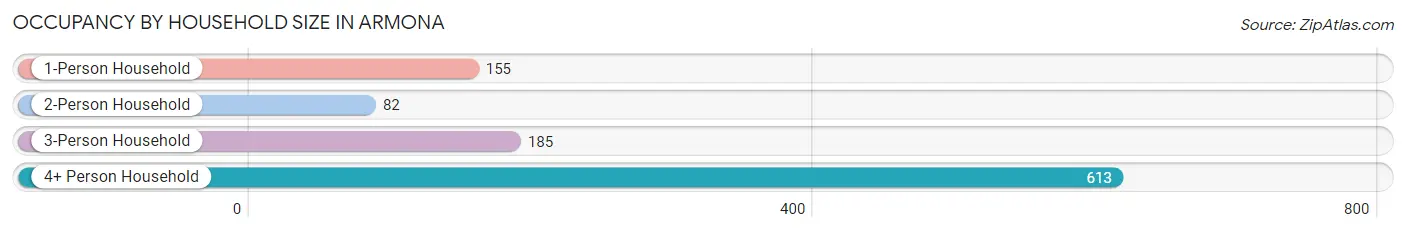
| Household Size | # Housing Units | % Housing Units |
| 1-Person Household | 155 | 15.0% |
| 2-Person Household | 82 | 7.9% |
| 3-Person Household | 185 | 17.9% |
| 4+ Person Household | 613 | 59.2% |
| Total Housing Units | 1,035 | 100.0% |
Occupancy by Ownership by Household Size in Armona
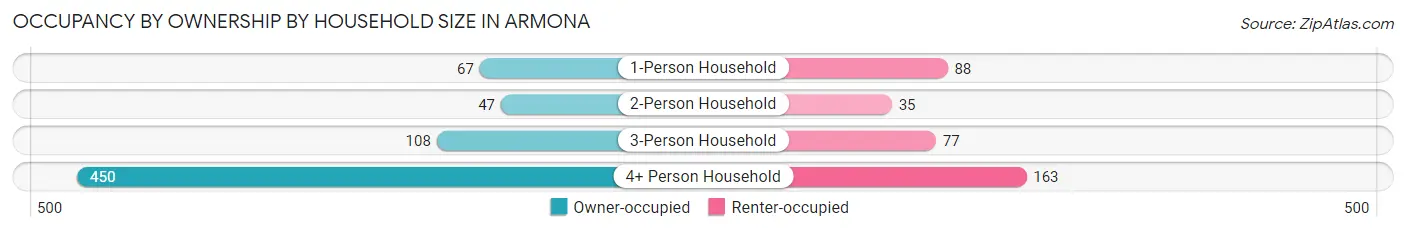
| Household Size | Owner-occupied | Renter-occupied |
| 1-Person Household | 67 (43.2%) | 88 (56.8%) |
| 2-Person Household | 47 (57.3%) | 35 (42.7%) |
| 3-Person Household | 108 (58.4%) | 77 (41.6%) |
| 4+ Person Household | 450 (73.4%) | 163 (26.6%) |
| Total Housing Units | 672 (64.9%) | 363 (35.1%) |
Occupancy by Educational Attainment in Armona
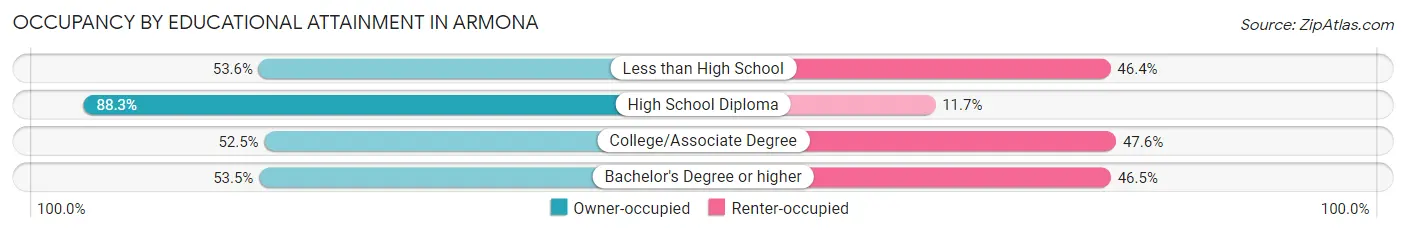
| Household Size | Owner-occupied | Renter-occupied |
| Less than High School | 158 (53.6%) | 137 (46.4%) |
| High School Diploma | 309 (88.3%) | 41 (11.7%) |
| College/Associate Degree | 182 (52.4%) | 165 (47.5%) |
| Bachelor's Degree or higher | 23 (53.5%) | 20 (46.5%) |
Occupancy by Age of Householder in Armona
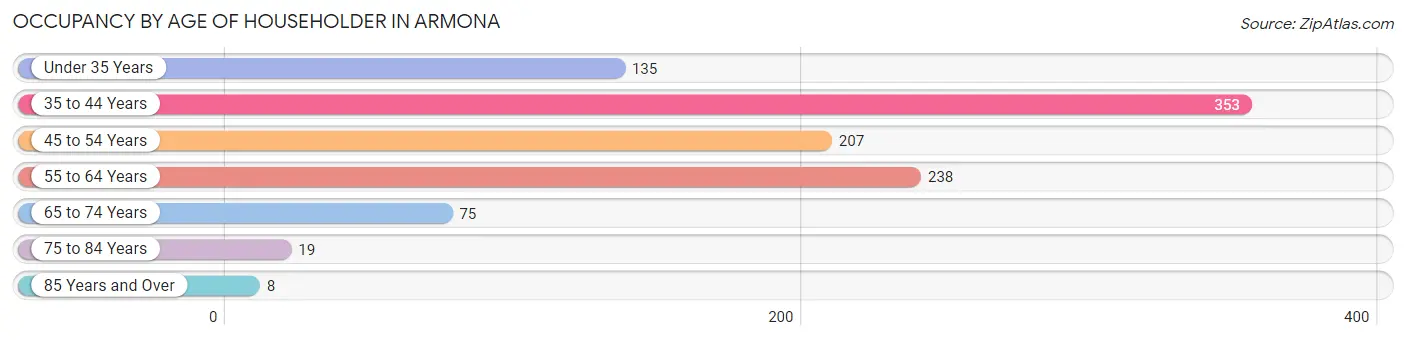
| Age Bracket | # Households | % Households |
| Under 35 Years | 135 | 13.0% |
| 35 to 44 Years | 353 | 34.1% |
| 45 to 54 Years | 207 | 20.0% |
| 55 to 64 Years | 238 | 23.0% |
| 65 to 74 Years | 75 | 7.2% |
| 75 to 84 Years | 19 | 1.8% |
| 85 Years and Over | 8 | 0.8% |
| Total | 1,035 | 100.0% |
Housing Finances in Armona
Median Income by Occupancy in Armona
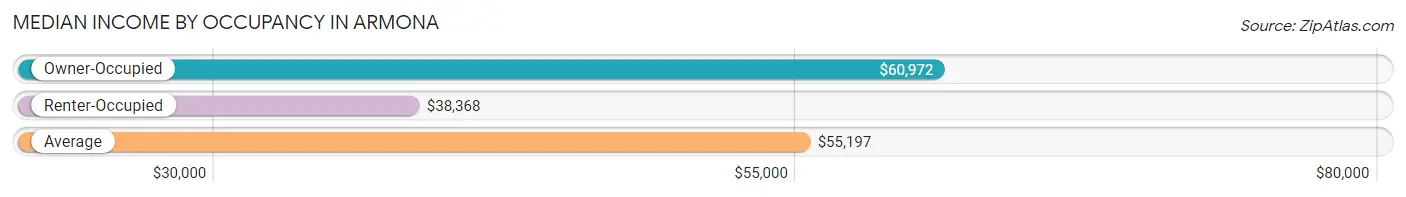
| Occupancy Type | # Households | Median Income |
| Owner-Occupied | 672 (64.9%) | $60,972 |
| Renter-Occupied | 363 (35.1%) | $38,368 |
| Average | 1,035 (100.0%) | $55,197 |
Occupancy by Householder Income Bracket in Armona
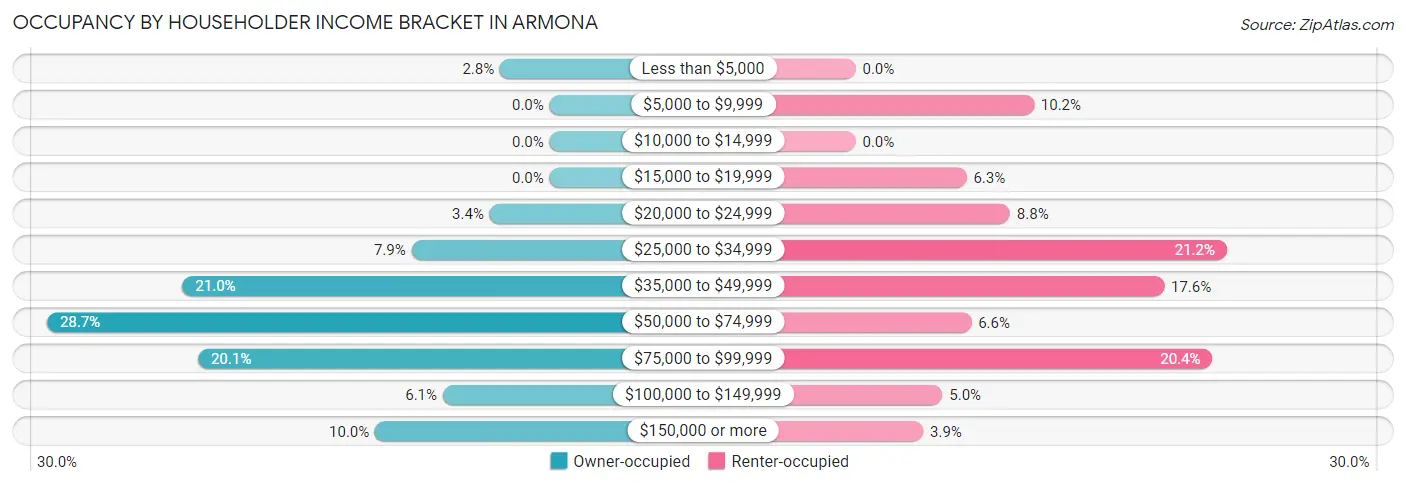
| Income Bracket | Owner-occupied | Renter-occupied |
| Less than $5,000 | 19 (2.8%) | 0 (0.0%) |
| $5,000 to $9,999 | 0 (0.0%) | 37 (10.2%) |
| $10,000 to $14,999 | 0 (0.0%) | 0 (0.0%) |
| $15,000 to $19,999 | 0 (0.0%) | 23 (6.3%) |
| $20,000 to $24,999 | 23 (3.4%) | 32 (8.8%) |
| $25,000 to $34,999 | 53 (7.9%) | 77 (21.2%) |
| $35,000 to $49,999 | 141 (21.0%) | 64 (17.6%) |
| $50,000 to $74,999 | 193 (28.7%) | 24 (6.6%) |
| $75,000 to $99,999 | 135 (20.1%) | 74 (20.4%) |
| $100,000 to $149,999 | 41 (6.1%) | 18 (5.0%) |
| $150,000 or more | 67 (10.0%) | 14 (3.9%) |
| Total | 672 (100.0%) | 363 (100.0%) |
Monthly Housing Cost Tiers in Armona
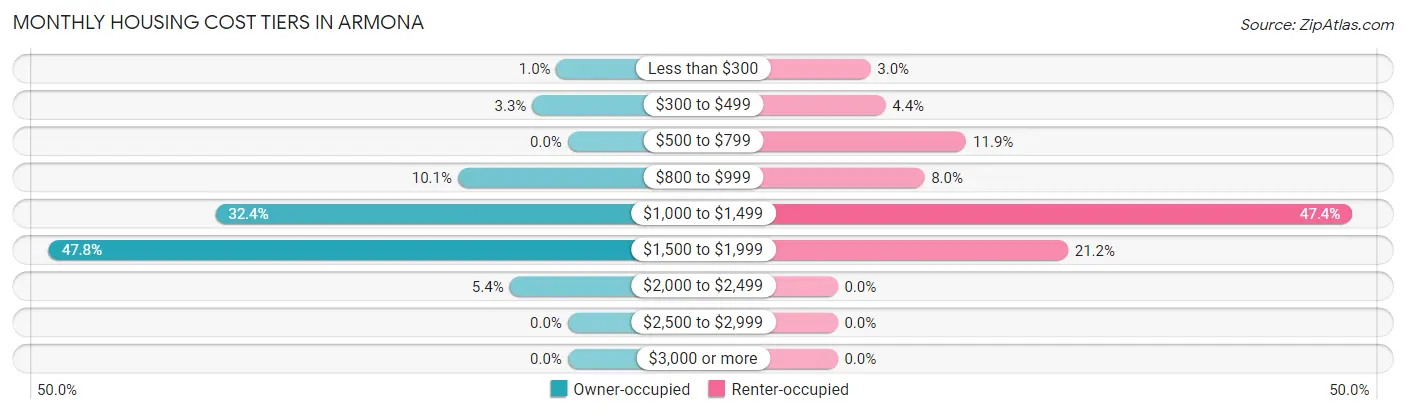
| Monthly Cost | Owner-occupied | Renter-occupied |
| Less than $300 | 7 (1.0%) | 11 (3.0%) |
| $300 to $499 | 22 (3.3%) | 16 (4.4%) |
| $500 to $799 | 0 (0.0%) | 43 (11.8%) |
| $800 to $999 | 68 (10.1%) | 29 (8.0%) |
| $1,000 to $1,499 | 218 (32.4%) | 172 (47.4%) |
| $1,500 to $1,999 | 321 (47.8%) | 77 (21.2%) |
| $2,000 to $2,499 | 36 (5.4%) | 0 (0.0%) |
| $2,500 to $2,999 | 0 (0.0%) | 0 (0.0%) |
| $3,000 or more | 0 (0.0%) | 0 (0.0%) |
| Total | 672 (100.0%) | 363 (100.0%) |
Physical Housing Characteristics in Armona
Housing Structures in Armona
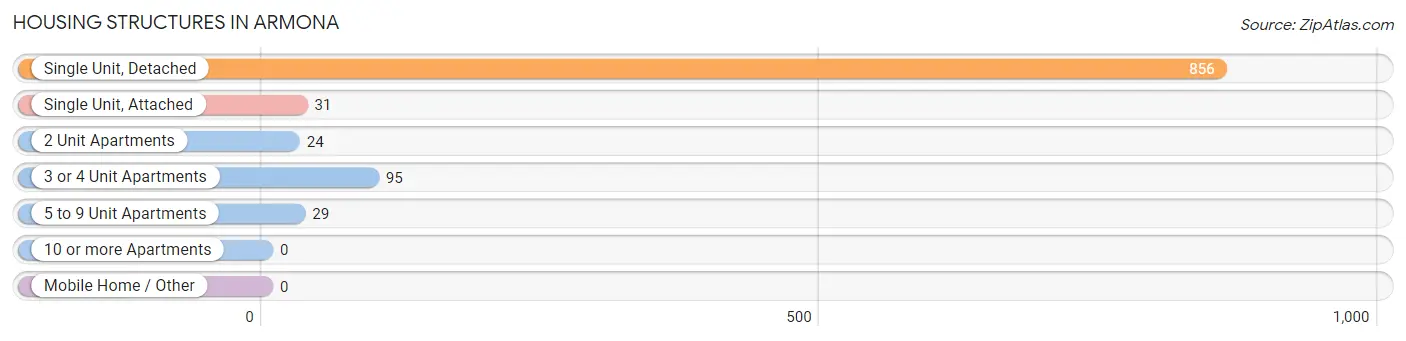
| Structure Type | # Housing Units | % Housing Units |
| Single Unit, Detached | 856 | 82.7% |
| Single Unit, Attached | 31 | 3.0% |
| 2 Unit Apartments | 24 | 2.3% |
| 3 or 4 Unit Apartments | 95 | 9.2% |
| 5 to 9 Unit Apartments | 29 | 2.8% |
| 10 or more Apartments | 0 | 0.0% |
| Mobile Home / Other | 0 | 0.0% |
| Total | 1,035 | 100.0% |
Housing Structures by Occupancy in Armona
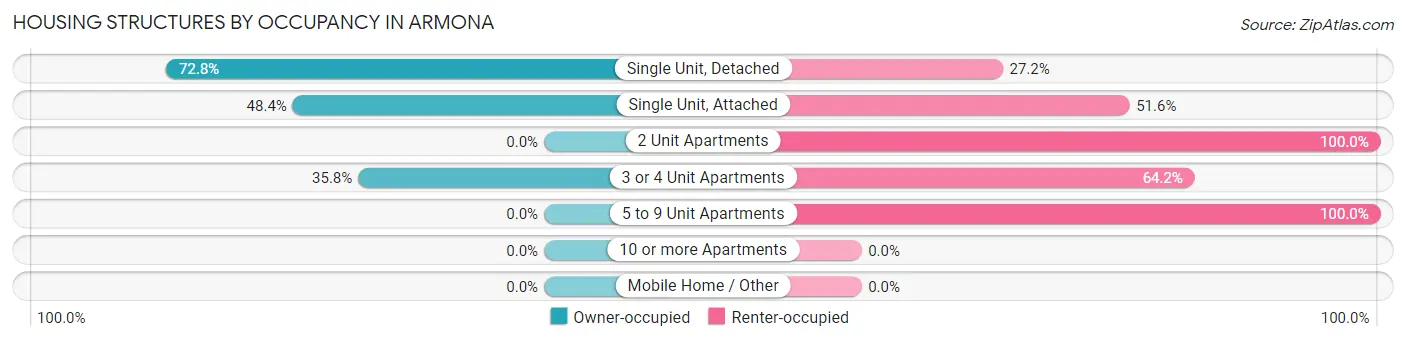
| Structure Type | Owner-occupied | Renter-occupied |
| Single Unit, Detached | 623 (72.8%) | 233 (27.2%) |
| Single Unit, Attached | 15 (48.4%) | 16 (51.6%) |
| 2 Unit Apartments | 0 (0.0%) | 24 (100.0%) |
| 3 or 4 Unit Apartments | 34 (35.8%) | 61 (64.2%) |
| 5 to 9 Unit Apartments | 0 (0.0%) | 29 (100.0%) |
| 10 or more Apartments | 0 (0.0%) | 0 (0.0%) |
| Mobile Home / Other | 0 (0.0%) | 0 (0.0%) |
| Total | 672 (64.9%) | 363 (35.1%) |
Housing Structures by Number of Rooms in Armona
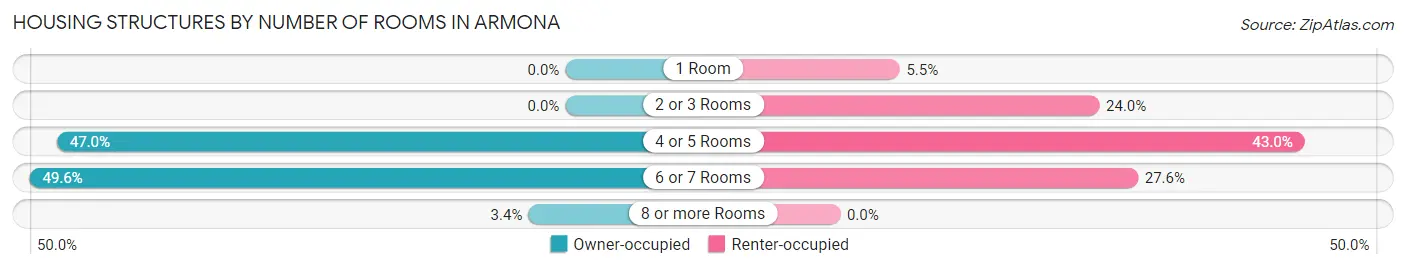
| Number of Rooms | Owner-occupied | Renter-occupied |
| 1 Room | 0 (0.0%) | 20 (5.5%) |
| 2 or 3 Rooms | 0 (0.0%) | 87 (24.0%) |
| 4 or 5 Rooms | 316 (47.0%) | 156 (43.0%) |
| 6 or 7 Rooms | 333 (49.5%) | 100 (27.6%) |
| 8 or more Rooms | 23 (3.4%) | 0 (0.0%) |
| Total | 672 (100.0%) | 363 (100.0%) |
Housing Structure by Heating Type in Armona
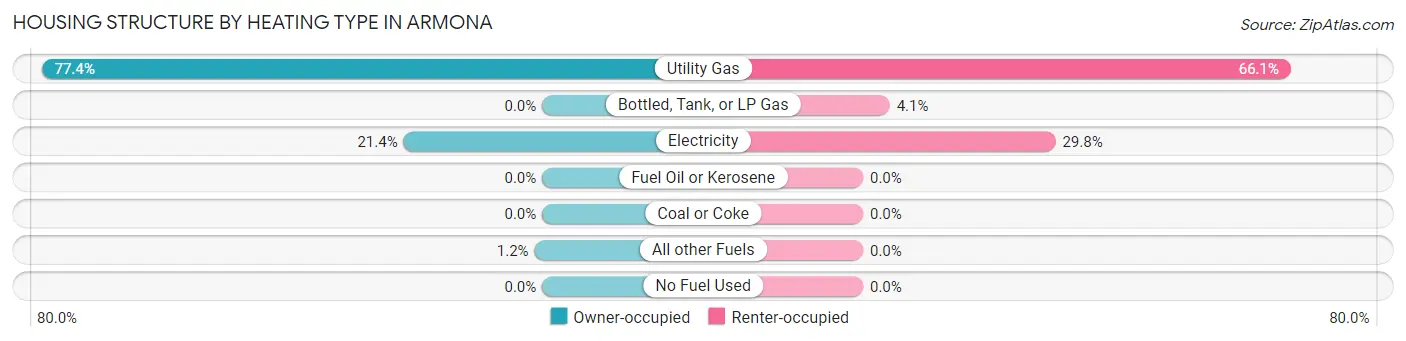
| Heating Type | Owner-occupied | Renter-occupied |
| Utility Gas | 520 (77.4%) | 240 (66.1%) |
| Bottled, Tank, or LP Gas | 0 (0.0%) | 15 (4.1%) |
| Electricity | 144 (21.4%) | 108 (29.7%) |
| Fuel Oil or Kerosene | 0 (0.0%) | 0 (0.0%) |
| Coal or Coke | 0 (0.0%) | 0 (0.0%) |
| All other Fuels | 8 (1.2%) | 0 (0.0%) |
| No Fuel Used | 0 (0.0%) | 0 (0.0%) |
| Total | 672 (100.0%) | 363 (100.0%) |
Household Vehicle Usage in Armona
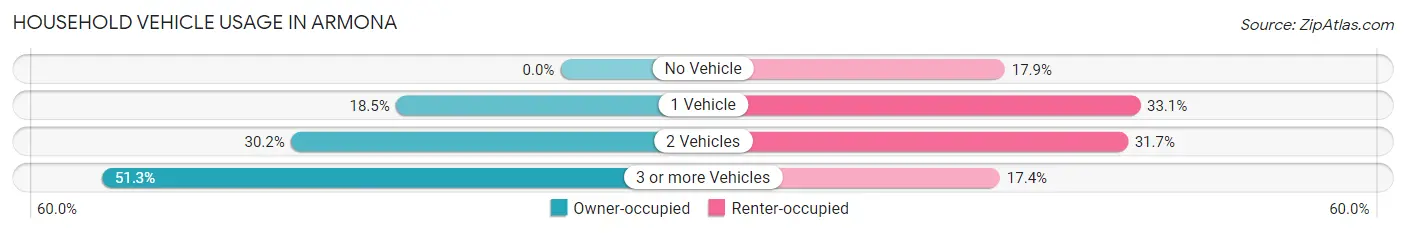
| Vehicles per Household | Owner-occupied | Renter-occupied |
| No Vehicle | 0 (0.0%) | 65 (17.9%) |
| 1 Vehicle | 124 (18.4%) | 120 (33.1%) |
| 2 Vehicles | 203 (30.2%) | 115 (31.7%) |
| 3 or more Vehicles | 345 (51.3%) | 63 (17.4%) |
| Total | 672 (100.0%) | 363 (100.0%) |
Real Estate & Mortgages in Armona
Real Estate and Mortgage Overview in Armona
| Characteristic | Without Mortgage | With Mortgage |
| Housing Units | 29 | 643 |
| Median Property Value | $226,800 | $219,500 |
| Median Household Income | $39,821 | $67 |
| Monthly Housing Costs | $367 | $0 |
| Real Estate Taxes | - | - |
Property Value by Mortgage Status in Armona
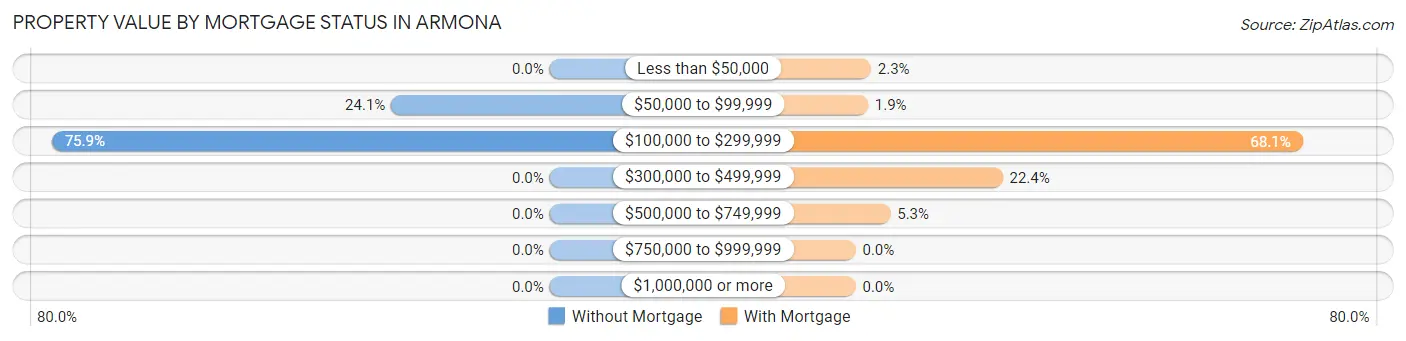
| Property Value | Without Mortgage | With Mortgage |
| Less than $50,000 | 0 (0.0%) | 15 (2.3%) |
| $50,000 to $99,999 | 7 (24.1%) | 12 (1.9%) |
| $100,000 to $299,999 | 22 (75.9%) | 438 (68.1%) |
| $300,000 to $499,999 | 0 (0.0%) | 144 (22.4%) |
| $500,000 to $749,999 | 0 (0.0%) | 34 (5.3%) |
| $750,000 to $999,999 | 0 (0.0%) | 0 (0.0%) |
| $1,000,000 or more | 0 (0.0%) | 0 (0.0%) |
| Total | 29 (100.0%) | 643 (100.0%) |
Household Income by Mortgage Status in Armona
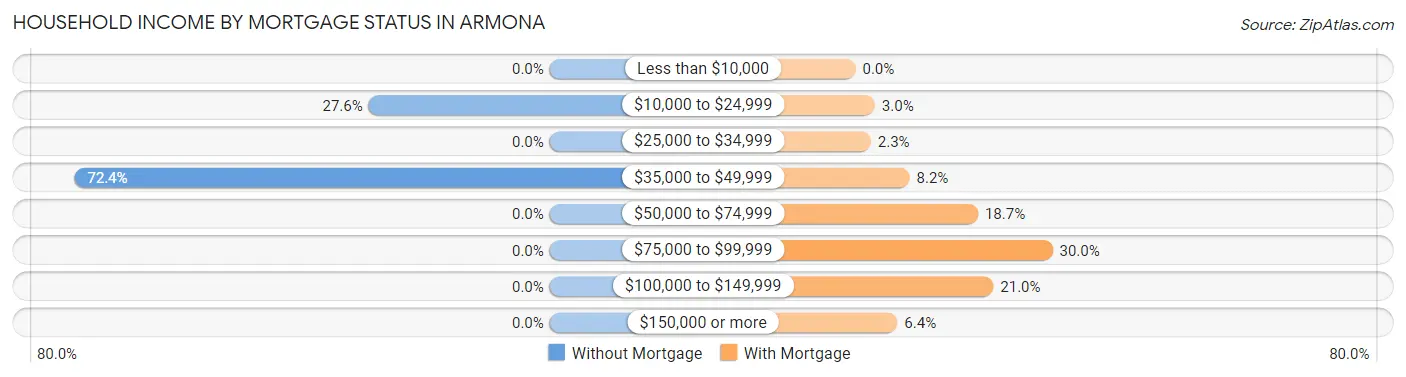
| Household Income | Without Mortgage | With Mortgage |
| Less than $10,000 | 0 (0.0%) | 0 (0.0%) |
| $10,000 to $24,999 | 8 (27.6%) | 19 (2.9%) |
| $25,000 to $34,999 | 0 (0.0%) | 15 (2.3%) |
| $35,000 to $49,999 | 21 (72.4%) | 53 (8.2%) |
| $50,000 to $74,999 | 0 (0.0%) | 120 (18.7%) |
| $75,000 to $99,999 | 0 (0.0%) | 193 (30.0%) |
| $100,000 to $149,999 | 0 (0.0%) | 135 (21.0%) |
| $150,000 or more | 0 (0.0%) | 41 (6.4%) |
| Total | 29 (100.0%) | 643 (100.0%) |
Property Value to Household Income Ratio in Armona
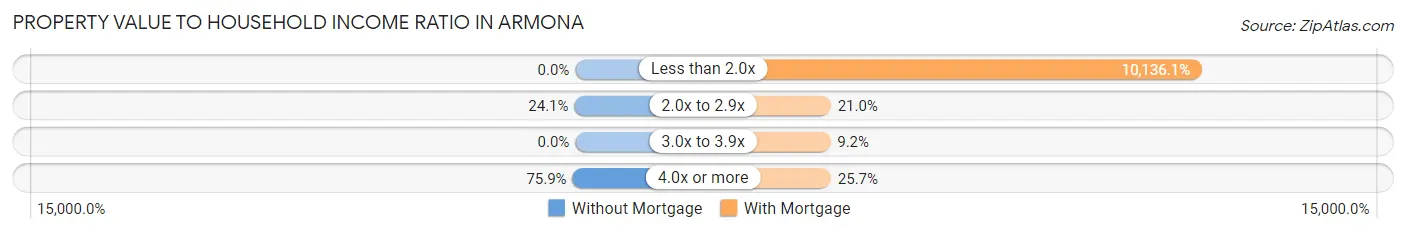
| Value-to-Income Ratio | Without Mortgage | With Mortgage |
| Less than 2.0x | 0 (0.0%) | 65,175 (10,136.1%) |
| 2.0x to 2.9x | 7 (24.1%) | 135 (21.0%) |
| 3.0x to 3.9x | 0 (0.0%) | 59 (9.2%) |
| 4.0x or more | 22 (75.9%) | 165 (25.7%) |
| Total | 29 (100.0%) | 643 (100.0%) |
Real Estate Taxes by Mortgage Status in Armona
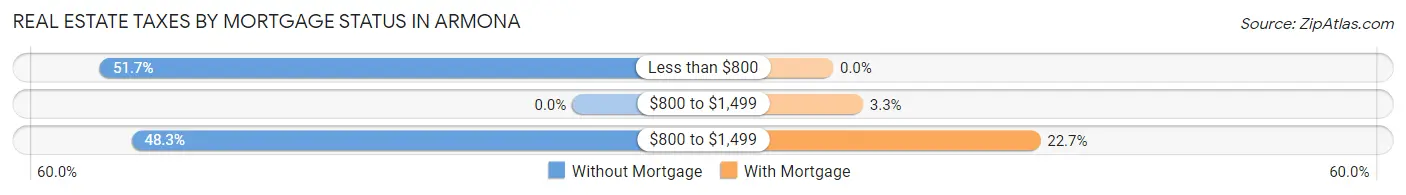
| Property Taxes | Without Mortgage | With Mortgage |
| Less than $800 | 15 (51.7%) | 0 (0.0%) |
| $800 to $1,499 | 0 (0.0%) | 21 (3.3%) |
| $800 to $1,499 | 14 (48.3%) | 146 (22.7%) |
| Total | 29 (100.0%) | 643 (100.0%) |
Health & Disability in Armona
Health Insurance Coverage by Age in Armona
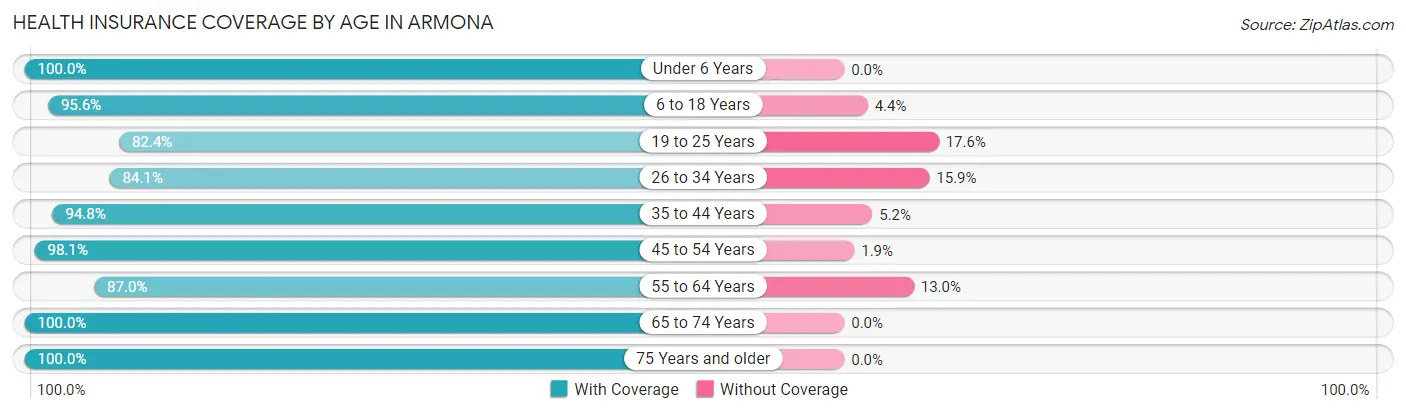
| Age Bracket | With Coverage | Without Coverage |
| Under 6 Years | 465 (100.0%) | 0 (0.0%) |
| 6 to 18 Years | 1,097 (95.6%) | 50 (4.4%) |
| 19 to 25 Years | 426 (82.4%) | 91 (17.6%) |
| 26 to 34 Years | 382 (84.1%) | 72 (15.9%) |
| 35 to 44 Years | 636 (94.8%) | 35 (5.2%) |
| 45 to 54 Years | 423 (98.1%) | 8 (1.9%) |
| 55 to 64 Years | 356 (87.0%) | 53 (13.0%) |
| 65 to 74 Years | 164 (100.0%) | 0 (0.0%) |
| 75 Years and older | 109 (100.0%) | 0 (0.0%) |
| Total | 4,058 (92.9%) | 309 (7.1%) |
Health Insurance Coverage by Citizenship Status in Armona
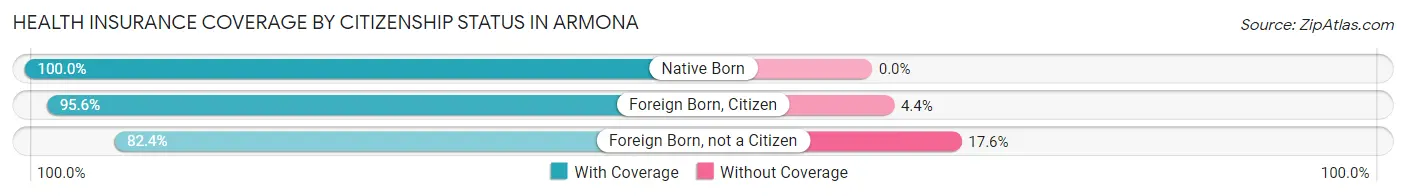
| Citizenship Status | With Coverage | Without Coverage |
| Native Born | 465 (100.0%) | 0 (0.0%) |
| Foreign Born, Citizen | 1,097 (95.6%) | 50 (4.4%) |
| Foreign Born, not a Citizen | 426 (82.4%) | 91 (17.6%) |
Health Insurance Coverage by Household Income in Armona
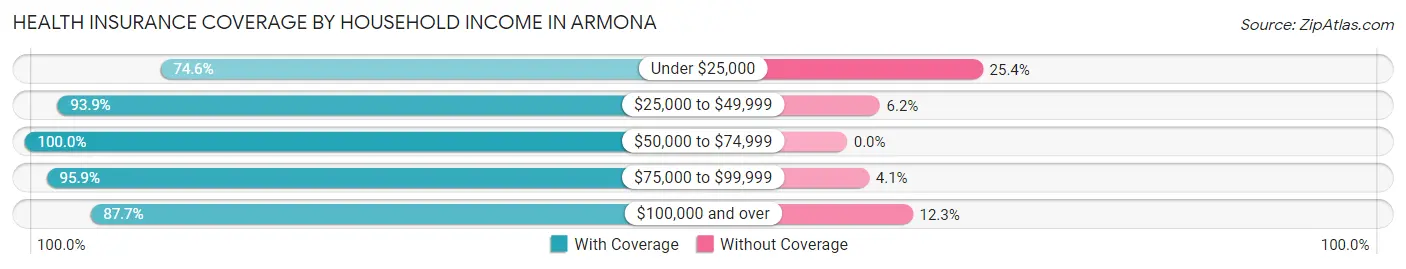
| Household Income | With Coverage | Without Coverage |
| Under $25,000 | 252 (74.6%) | 86 (25.4%) |
| $25,000 to $49,999 | 1,068 (93.9%) | 70 (6.1%) |
| $50,000 to $74,999 | 971 (100.0%) | 0 (0.0%) |
| $75,000 to $99,999 | 974 (95.9%) | 42 (4.1%) |
| $100,000 and over | 791 (87.7%) | 111 (12.3%) |
Public vs Private Health Insurance Coverage by Age in Armona
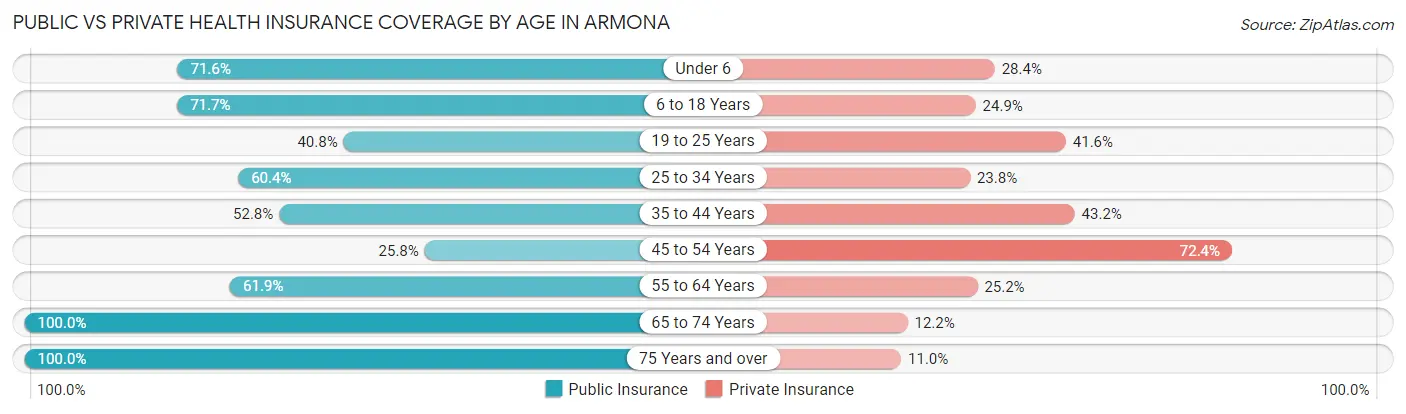
| Age Bracket | Public Insurance | Private Insurance |
| Under 6 | 333 (71.6%) | 132 (28.4%) |
| 6 to 18 Years | 822 (71.7%) | 285 (24.8%) |
| 19 to 25 Years | 211 (40.8%) | 215 (41.6%) |
| 25 to 34 Years | 274 (60.4%) | 108 (23.8%) |
| 35 to 44 Years | 354 (52.8%) | 290 (43.2%) |
| 45 to 54 Years | 111 (25.8%) | 312 (72.4%) |
| 55 to 64 Years | 253 (61.9%) | 103 (25.2%) |
| 65 to 74 Years | 164 (100.0%) | 20 (12.2%) |
| 75 Years and over | 109 (100.0%) | 12 (11.0%) |
| Total | 2,631 (60.3%) | 1,477 (33.8%) |
Disability Status by Sex by Age in Armona
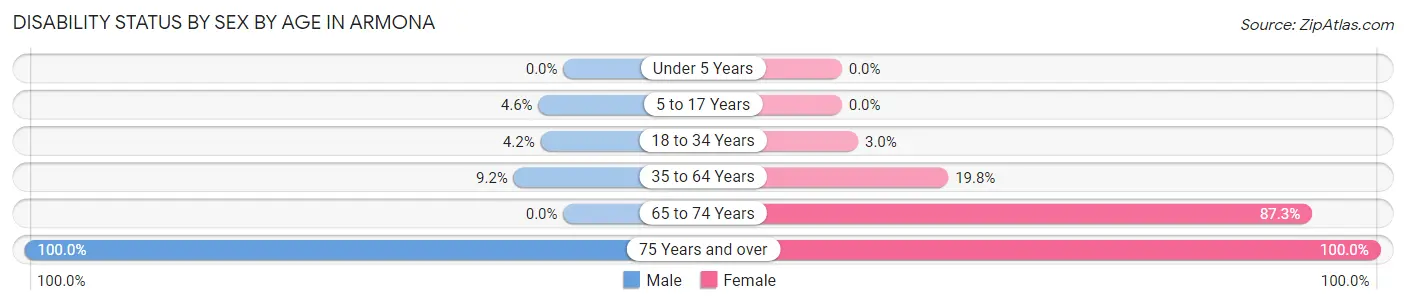
| Age Bracket | Male | Female |
| Under 5 Years | 0 (0.0%) | 0 (0.0%) |
| 5 to 17 Years | 30 (4.6%) | 0 (0.0%) |
| 18 to 34 Years | 24 (4.2%) | 15 (3.0%) |
| 35 to 64 Years | 73 (9.2%) | 142 (19.8%) |
| 65 to 74 Years | 0 (0.0%) | 48 (87.3%) |
| 75 Years and over | 35 (100.0%) | 74 (100.0%) |
Disability Class by Sex by Age in Armona
Disability Class: Hearing Difficulty
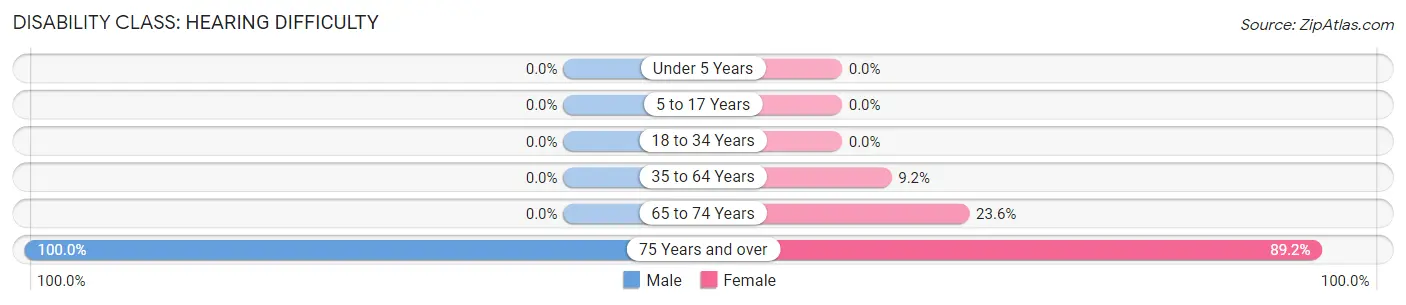
| Age Bracket | Male | Female |
| Under 5 Years | 0 (0.0%) | 0 (0.0%) |
| 5 to 17 Years | 0 (0.0%) | 0 (0.0%) |
| 18 to 34 Years | 0 (0.0%) | 0 (0.0%) |
| 35 to 64 Years | 0 (0.0%) | 66 (9.2%) |
| 65 to 74 Years | 0 (0.0%) | 13 (23.6%) |
| 75 Years and over | 35 (100.0%) | 66 (89.2%) |
Disability Class: Vision Difficulty
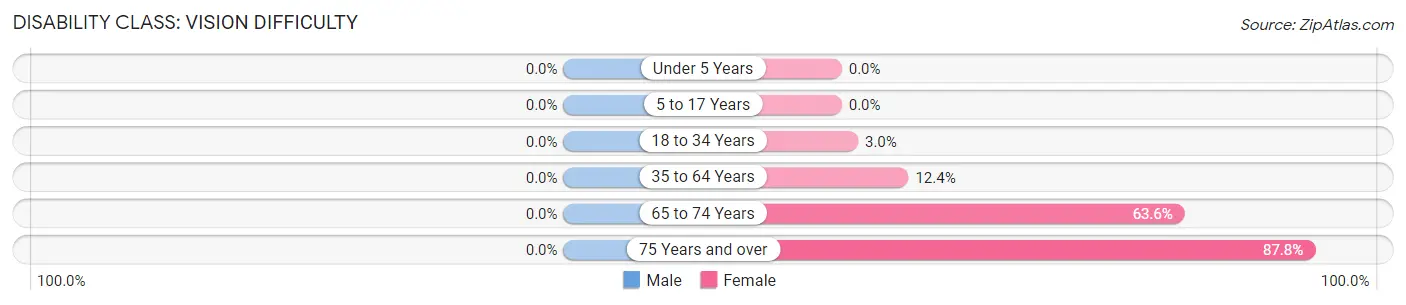
| Age Bracket | Male | Female |
| Under 5 Years | 0 (0.0%) | 0 (0.0%) |
| 5 to 17 Years | 0 (0.0%) | 0 (0.0%) |
| 18 to 34 Years | 0 (0.0%) | 15 (3.0%) |
| 35 to 64 Years | 0 (0.0%) | 89 (12.4%) |
| 65 to 74 Years | 0 (0.0%) | 35 (63.6%) |
| 75 Years and over | 0 (0.0%) | 65 (87.8%) |
Disability Class: Cognitive Difficulty
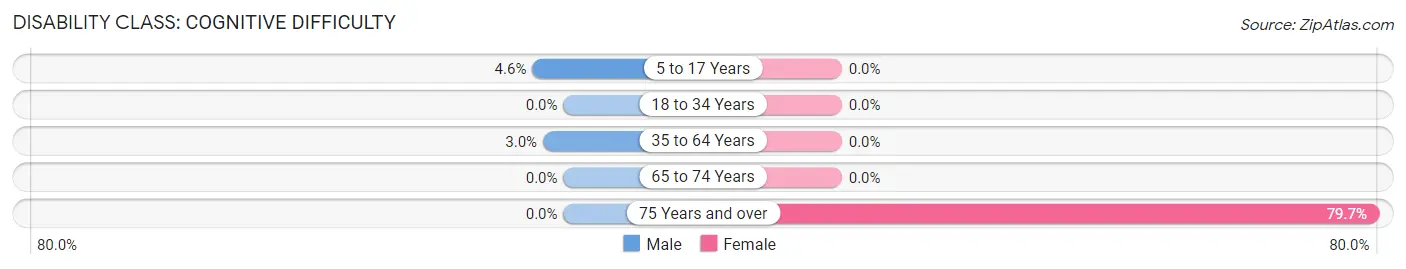
| Age Bracket | Male | Female |
| 5 to 17 Years | 30 (4.6%) | 0 (0.0%) |
| 18 to 34 Years | 0 (0.0%) | 0 (0.0%) |
| 35 to 64 Years | 24 (3.0%) | 0 (0.0%) |
| 65 to 74 Years | 0 (0.0%) | 0 (0.0%) |
| 75 Years and over | 0 (0.0%) | 59 (79.7%) |
Disability Class: Ambulatory Difficulty
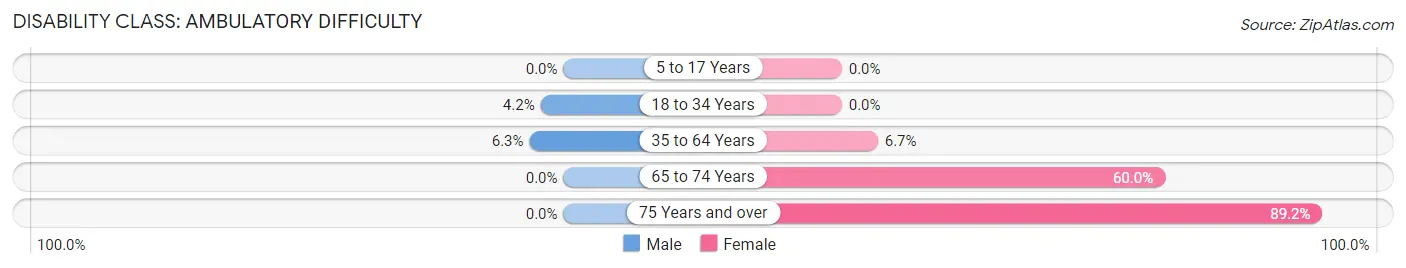
| Age Bracket | Male | Female |
| 5 to 17 Years | 0 (0.0%) | 0 (0.0%) |
| 18 to 34 Years | 24 (4.2%) | 0 (0.0%) |
| 35 to 64 Years | 50 (6.3%) | 48 (6.7%) |
| 65 to 74 Years | 0 (0.0%) | 33 (60.0%) |
| 75 Years and over | 0 (0.0%) | 66 (89.2%) |
Disability Class: Self-Care Difficulty
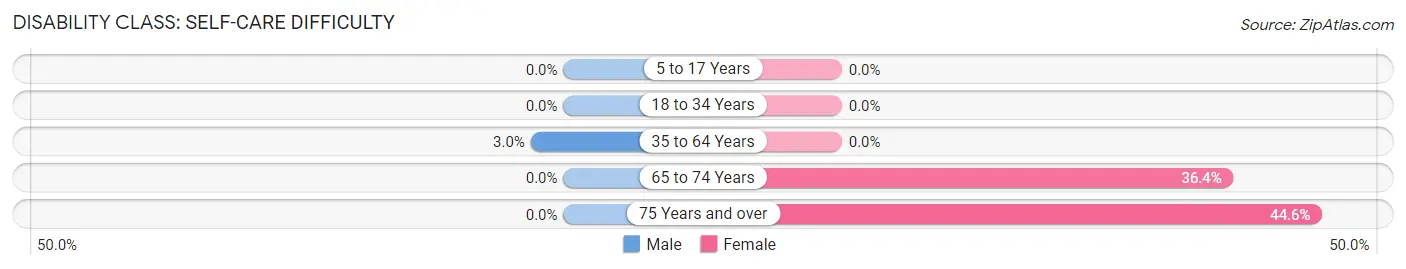
| Age Bracket | Male | Female |
| 5 to 17 Years | 0 (0.0%) | 0 (0.0%) |
| 18 to 34 Years | 0 (0.0%) | 0 (0.0%) |
| 35 to 64 Years | 24 (3.0%) | 0 (0.0%) |
| 65 to 74 Years | 0 (0.0%) | 20 (36.4%) |
| 75 Years and over | 0 (0.0%) | 33 (44.6%) |
Technology Access in Armona
Computing Device Access in Armona
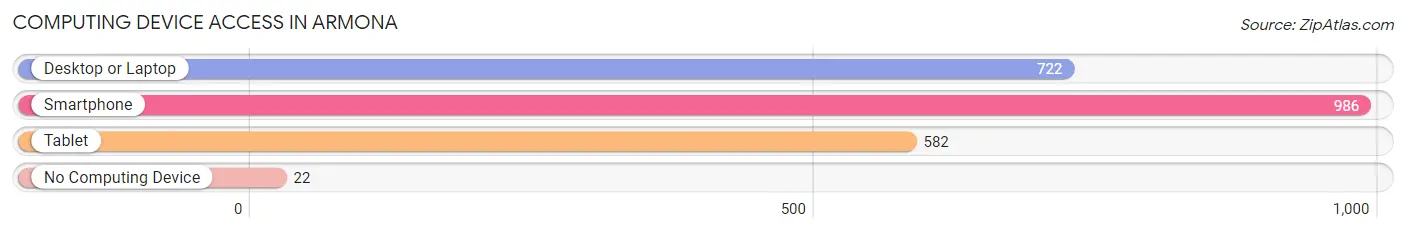
| Device Type | # Households | % Households |
| Desktop or Laptop | 722 | 69.8% |
| Smartphone | 986 | 95.3% |
| Tablet | 582 | 56.2% |
| No Computing Device | 22 | 2.1% |
| Total | 1,035 | 100.0% |
Internet Access in Armona
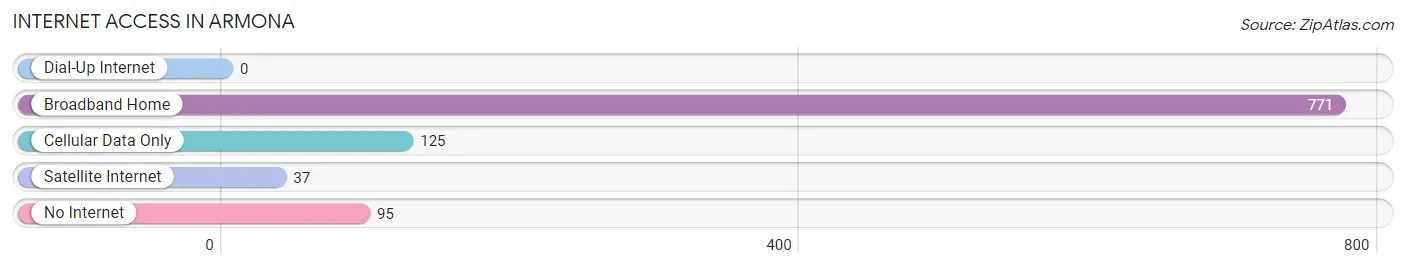
| Internet Type | # Households | % Households |
| Dial-Up Internet | 0 | 0.0% |
| Broadband Home | 771 | 74.5% |
| Cellular Data Only | 125 | 12.1% |
| Satellite Internet | 37 | 3.6% |
| No Internet | 95 | 9.2% |
| Total | 1,035 | 100.0% |
Armona Summary
Armona, California is a small unincorporated community located in Kings County, California. It is situated in the San Joaquin Valley, approximately 10 miles west of Hanford and 15 miles south of Lemoore. The population of Armona was estimated to be 4,845 in 2019.
History
Armona was founded in 1891 by the Southern Pacific Railroad. The town was named after the Armona family, who were among the first settlers in the area. The Armona family owned a large ranch in the area, and the town was built around it.
The town was originally a farming community, with many of the residents working in the fields. In the early 1900s, the town began to grow as more people moved to the area. The town was incorporated in 1912, and the first post office was established in 1913.
In the 1950s, the town began to experience a population boom as more people moved to the area to take advantage of the agricultural opportunities. The town continued to grow throughout the 1960s and 1970s, and by the 1980s, Armona had become a popular destination for tourists.
Geography
Armona is located in the San Joaquin Valley, approximately 10 miles west of Hanford and 15 miles south of Lemoore. The town is situated on the banks of the Kings River, and is surrounded by agricultural land. The climate in Armona is hot and dry, with temperatures ranging from the mid-90s in the summer to the mid-50s in the winter.
Economy
The economy of Armona is largely based on agriculture. The town is home to a number of farms, which produce a variety of crops, including cotton, alfalfa, corn, and wheat. In addition, the town is home to a number of businesses, including restaurants, grocery stores, and gas stations.
Demographics
As of 2019, the population of Armona was estimated to be 4,845. The population is largely Hispanic, with approximately 75% of the population identifying as Hispanic or Latino. The median household income in Armona is $41,945, and the median age is 33.
Conclusion
Armona, California is a small unincorporated community located in Kings County, California. It is situated in the San Joaquin Valley, approximately 10 miles west of Hanford and 15 miles south of Lemoore. The population of Armona was estimated to be 4,845 in 2019. The economy of Armona is largely based on agriculture, and the population is largely Hispanic. Armona is a popular destination for tourists, and is home to a number of businesses, including restaurants, grocery stores, and gas stations.
Common Questions
What is Per Capita Income in Armona?
Per Capita income in Armona is $16,971.
What is the Median Family Income in Armona?
Median Family Income in Armona is $58,443.
What is the Median Household income in Armona?
Median Household Income in Armona is $55,197.
What is Income or Wage Gap in Armona?
Income or Wage Gap in Armona is 5.0%.
Women in Armona earn 95.0 cents for every dollar earned by a man.
What is Family Income Deficit in Armona?
Family Income Deficit in Armona is $8,944.
Families that are below poverty line in Armona earn $8,944 less on average than the poverty threshold level.
What is Inequality or Gini Index in Armona?
Inequality or Gini Index in Armona is 0.38.
What is the Total Population of Armona?
Total Population of Armona is 4,367.
What is the Total Male Population of Armona?
Total Male Population of Armona is 2,390.
What is the Total Female Population of Armona?
Total Female Population of Armona is 1,977.
What is the Ratio of Males per 100 Females in Armona?
There are 120.89 Males per 100 Females in Armona.
What is the Ratio of Females per 100 Males in Armona?
There are 82.72 Females per 100 Males in Armona.
What is the Median Population Age in Armona?
Median Population Age in Armona is 26.4 Years.
What is the Average Family Size in Armona
Average Family Size in Armona is 4.6 People.
What is the Average Household Size in Armona
Average Household Size in Armona is 4.2 People.
How Large is the Labor Force in Armona?
There are 1,805 People in the Labor Forcein in Armona.
What is the Percentage of People in the Labor Force in Armona?
61.8% of People are in the Labor Force in Armona.
What is the Unemployment Rate in Armona?
Unemployment Rate in Armona is 8.9%.