Arbuckle, CA Map & Demographics
Arbuckle Map
Arbuckle Overview
$24,207
PER CAPITA INCOME
$81,123
AVG FAMILY INCOME
$80,563
AVG HOUSEHOLD INCOME
45.9%
WAGE / INCOME GAP [ % ]
54.1¢/ $1
WAGE / INCOME GAP [ $ ]
0.33
INEQUALITY / GINI INDEX
3,072
TOTAL POPULATION
1,652
MALE POPULATION
1,420
FEMALE POPULATION
116.34
MALES / 100 FEMALES
85.96
FEMALES / 100 MALES
29.6
MEDIAN AGE
4.8
AVG FAMILY SIZE
4.1
AVG HOUSEHOLD SIZE
1,547
LABOR FORCE [ PEOPLE ]
66.4%
PERCENT IN LABOR FORCE
1.5%
UNEMPLOYMENT RATE
Arbuckle Zip Codes
Arbuckle Area Codes
Income in Arbuckle
Income Overview in Arbuckle
Per Capita Income in Arbuckle is $24,207, while median incomes of families and households are $81,123 and $80,563 respectively.
| Characteristic | Number | Measure |
| Per Capita Income | 3,072 | $24,207 |
| Median Family Income | 595 | $81,123 |
| Mean Family Income | 595 | $96,879 |
| Median Household Income | 751 | $80,563 |
| Mean Household Income | 751 | $89,346 |
| Income Deficit | 595 | $0 |
| Wage / Income Gap (%) | 3,072 | 45.85% |
| Wage / Income Gap ($) | 3,072 | 54.15¢ per $1 |
| Gini / Inequality Index | 3,072 | 0.33 |
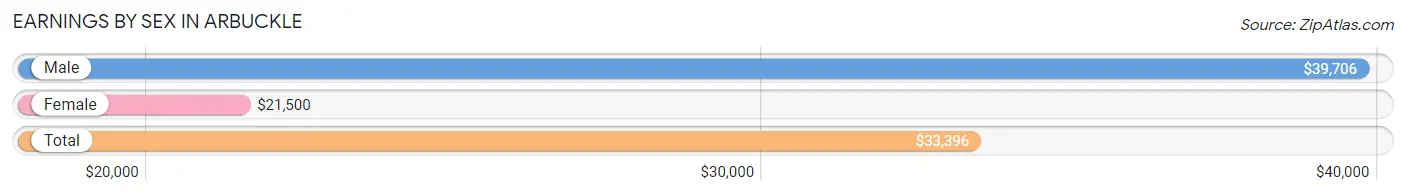
Earnings by Sex in Arbuckle
Average Earnings in Arbuckle are $33,396, $39,706 for men and $21,500 for women, a difference of 45.9%.
| Sex | Number | Average Earnings |
| Male | 938 (58.3%) | $39,706 |
| Female | 670 (41.7%) | $21,500 |
| Total | 1,608 (100.0%) | $33,396 |
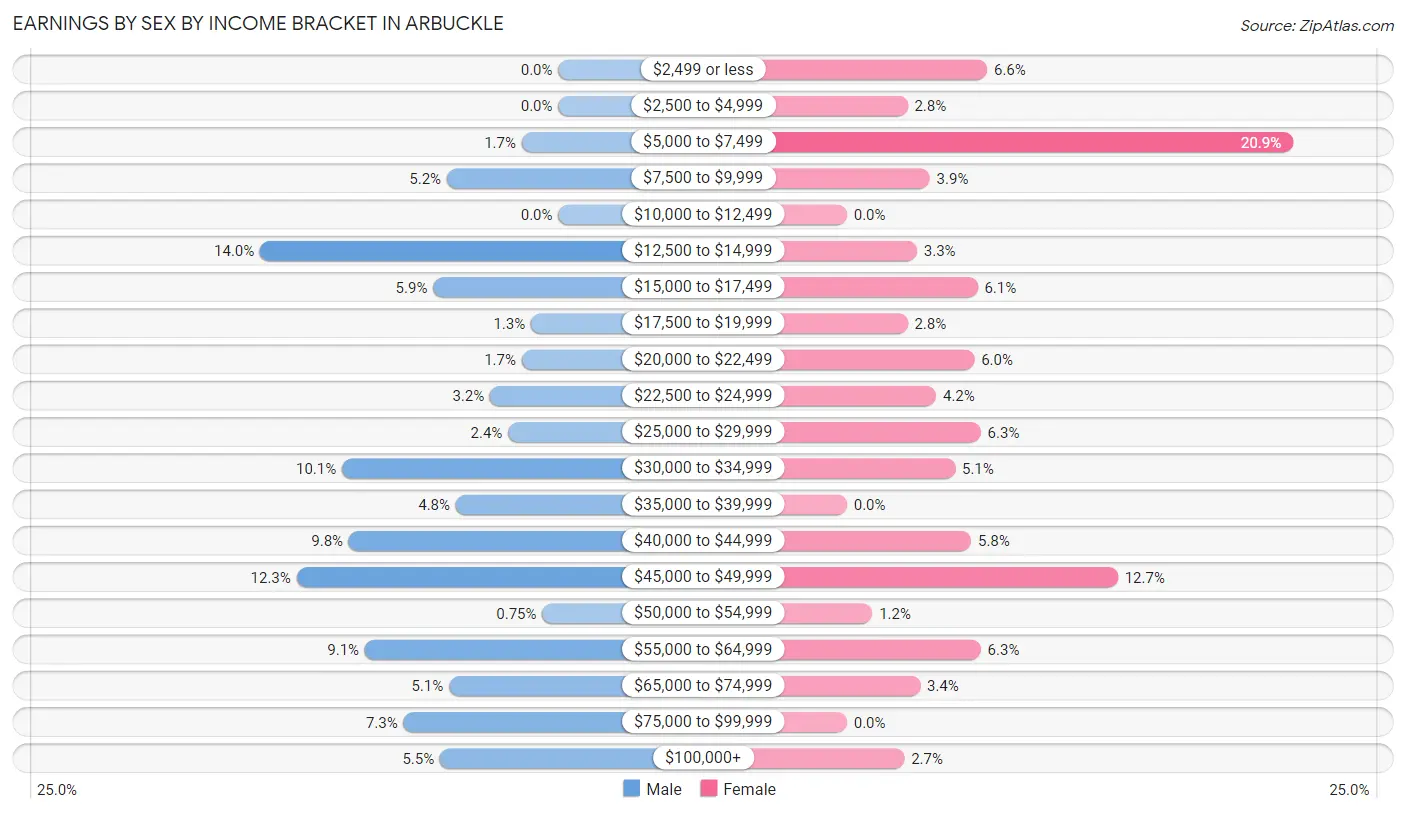
Earnings by Sex by Income Bracket in Arbuckle
The most common earnings brackets in Arbuckle are $12,500 to $14,999 for men (131 | 14.0%) and $5,000 to $7,499 for women (140 | 20.9%).
| Income | Male | Female |
| $2,499 or less | 0 (0.0%) | 44 (6.6%) |
| $2,500 to $4,999 | 0 (0.0%) | 19 (2.8%) |
| $5,000 to $7,499 | 16 (1.7%) | 140 (20.9%) |
| $7,500 to $9,999 | 49 (5.2%) | 26 (3.9%) |
| $10,000 to $12,499 | 0 (0.0%) | 0 (0.0%) |
| $12,500 to $14,999 | 131 (14.0%) | 22 (3.3%) |
| $15,000 to $17,499 | 55 (5.9%) | 41 (6.1%) |
| $17,500 to $19,999 | 12 (1.3%) | 19 (2.8%) |
| $20,000 to $22,499 | 16 (1.7%) | 40 (6.0%) |
| $22,500 to $24,999 | 30 (3.2%) | 28 (4.2%) |
| $25,000 to $29,999 | 22 (2.4%) | 42 (6.3%) |
| $30,000 to $34,999 | 95 (10.1%) | 34 (5.1%) |
| $35,000 to $39,999 | 45 (4.8%) | 0 (0.0%) |
| $40,000 to $44,999 | 92 (9.8%) | 39 (5.8%) |
| $45,000 to $49,999 | 115 (12.3%) | 85 (12.7%) |
| $50,000 to $54,999 | 7 (0.7%) | 8 (1.2%) |
| $55,000 to $64,999 | 85 (9.1%) | 42 (6.3%) |
| $65,000 to $74,999 | 48 (5.1%) | 23 (3.4%) |
| $75,000 to $99,999 | 68 (7.2%) | 0 (0.0%) |
| $100,000+ | 52 (5.5%) | 18 (2.7%) |
| Total | 938 (100.0%) | 670 (100.0%) |
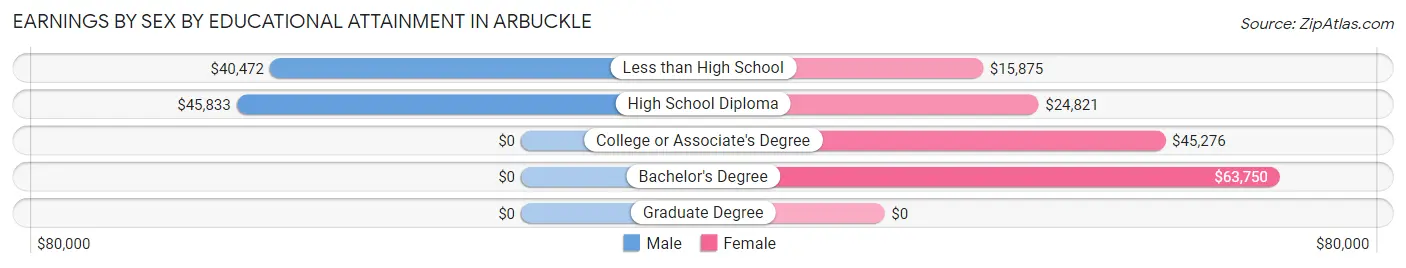
Earnings by Sex by Educational Attainment in Arbuckle
Average earnings in Arbuckle are $42,064 for men and $28,661 for women, a difference of 31.9%. Men with an educational attainment of high school diploma enjoy the highest average annual earnings of $45,833, while those with less than high school education earn the least with $40,472. Women with an educational attainment of bachelor's degree earn the most with the average annual earnings of $63,750, while those with less than high school education have the smallest earnings of $15,875.
| Educational Attainment | Male Income | Female Income |
| Less than High School | $40,472 | $15,875 |
| High School Diploma | $45,833 | $24,821 |
| College or Associate's Degree | - | - |
| Bachelor's Degree | - | - |
| Graduate Degree | - | - |
| Total | $42,064 | $28,661 |
Family Income in Arbuckle
Family Income Brackets in Arbuckle
According to the Arbuckle family income data, there are 159 families falling into the $75,000 to $99,999 income range, which is the most common income bracket and makes up 26.7% of all families.
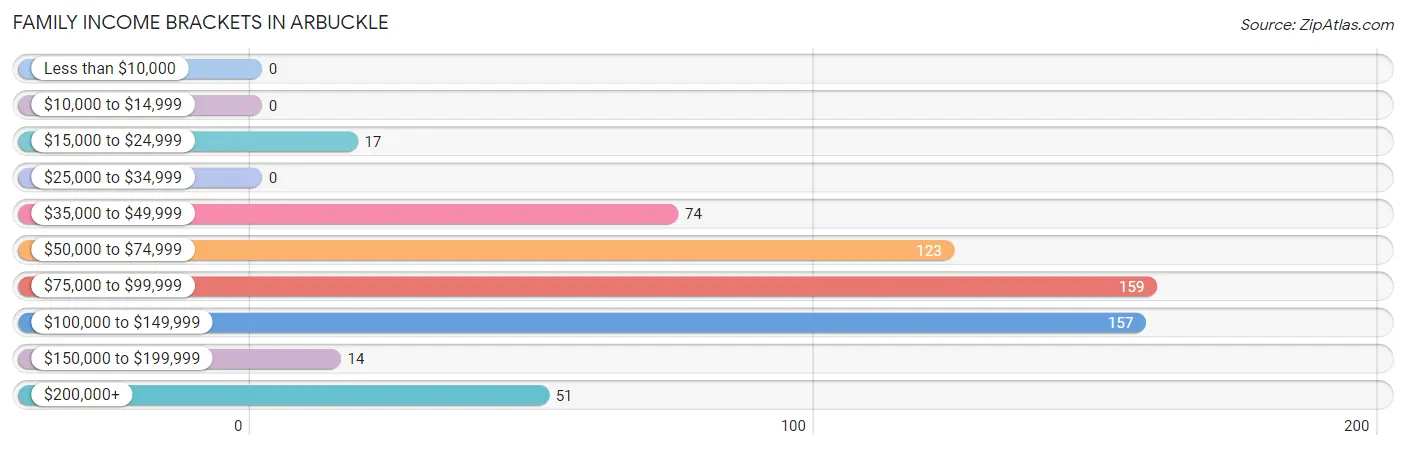
| Income Bracket | # Families | % Families |
| Less than $10,000 | 0 | 0.0% |
| $10,000 to $14,999 | 0 | 0.0% |
| $15,000 to $24,999 | 17 | 2.9% |
| $25,000 to $34,999 | 0 | 0.0% |
| $35,000 to $49,999 | 74 | 12.4% |
| $50,000 to $74,999 | 123 | 20.7% |
| $75,000 to $99,999 | 159 | 26.7% |
| $100,000 to $149,999 | 157 | 26.4% |
| $150,000 to $199,999 | 14 | 2.4% |
| $200,000+ | 51 | 8.6% |
Family Income by Famaliy Size in Arbuckle
3-person families (87 | 14.6%) account for the highest median family income in Arbuckle with $116,250 per family, while 2-person families (114 | 19.2%) have the highest median income of $41,666 per family member.
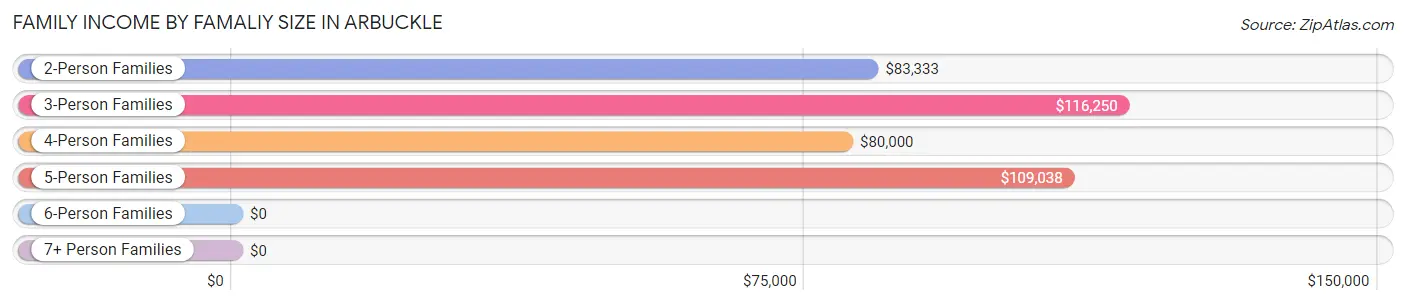
| Income Bracket | # Families | Median Income |
| 2-Person Families | 114 (19.2%) | $83,333 |
| 3-Person Families | 87 (14.6%) | $116,250 |
| 4-Person Families | 210 (35.3%) | $80,000 |
| 5-Person Families | 88 (14.8%) | $109,038 |
| 6-Person Families | 40 (6.7%) | $0 |
| 7+ Person Families | 56 (9.4%) | $0 |
| Total | 595 (100.0%) | $81,123 |
Family Income by Number of Earners in Arbuckle
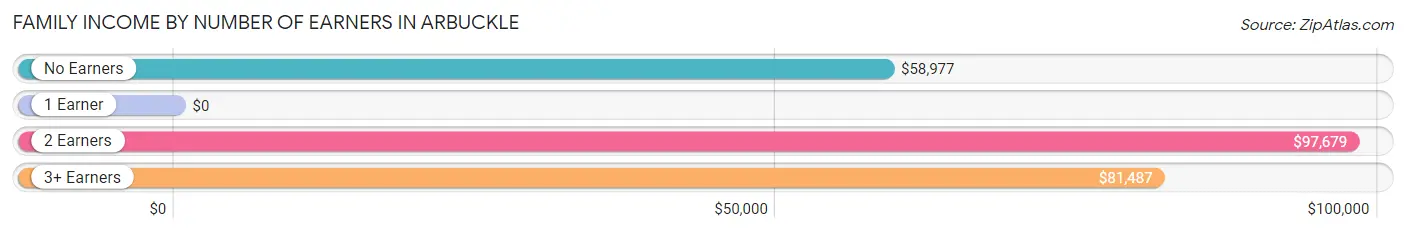
| Number of Earners | # Families | Median Income |
| No Earners | 46 (7.7%) | $58,977 |
| 1 Earner | 99 (16.6%) | $0 |
| 2 Earners | 243 (40.8%) | $97,679 |
| 3+ Earners | 207 (34.8%) | $81,487 |
| Total | 595 (100.0%) | $81,123 |
Household Income in Arbuckle
Household Income Brackets in Arbuckle
With 199 households falling in the category, the $100,000 to $149,999 income range is the most frequent in Arbuckle, accounting for 26.5% of all households.
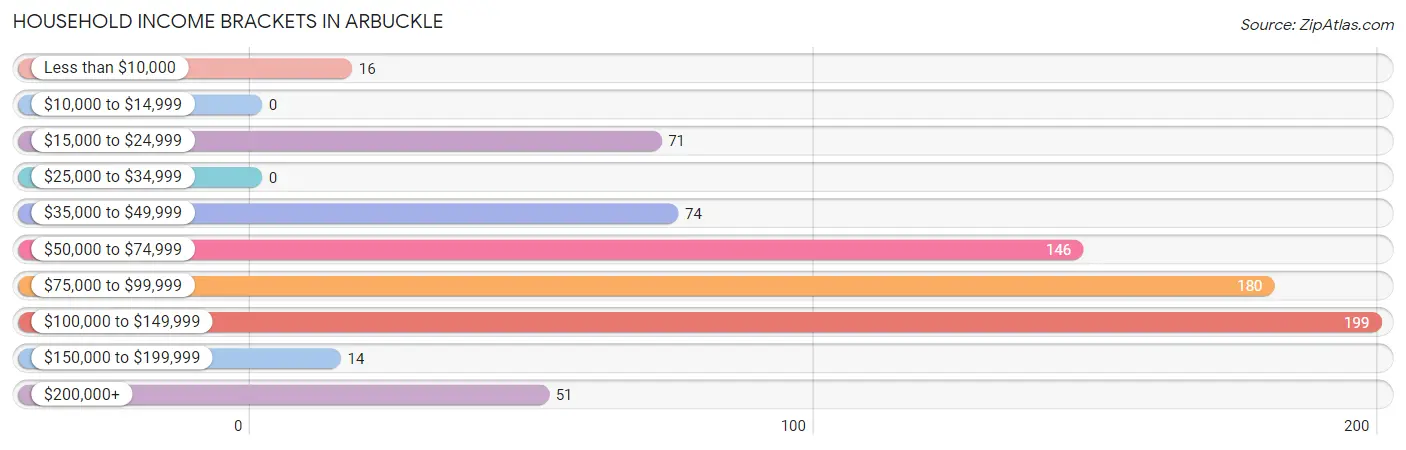
| Income Bracket | # Households | % Households |
| Less than $10,000 | 16 | 2.1% |
| $10,000 to $14,999 | 0 | 0.0% |
| $15,000 to $24,999 | 71 | 9.5% |
| $25,000 to $34,999 | 0 | 0.0% |
| $35,000 to $49,999 | 74 | 9.9% |
| $50,000 to $74,999 | 146 | 19.4% |
| $75,000 to $99,999 | 180 | 24.0% |
| $100,000 to $149,999 | 199 | 26.5% |
| $150,000 to $199,999 | 14 | 1.9% |
| $200,000+ | 51 | 6.8% |
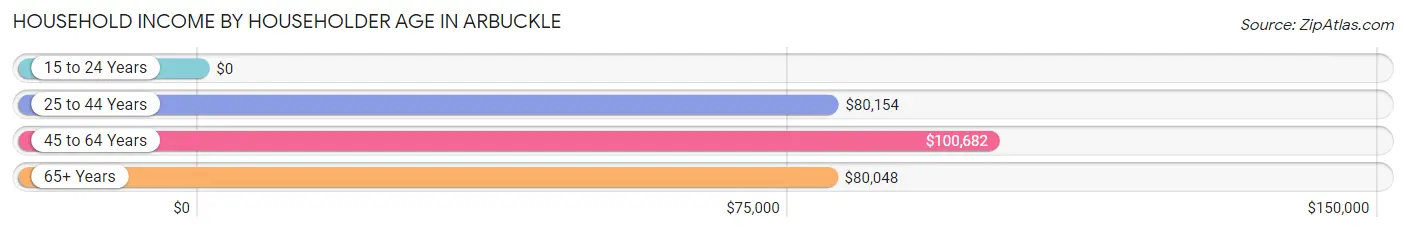
Household Income by Householder Age in Arbuckle
The median household income in Arbuckle is $80,563, with the highest median household income of $100,682 found in the 45 to 64 years age bracket for the primary householder. A total of 216 households (28.8%) fall into this category. Meanwhile, the 15 to 24 years age bracket for the primary householder has the lowest median household income of $0, with 26 households (3.5%) in this group.
| Income Bracket | # Households | Median Income |
| 15 to 24 Years | 26 (3.5%) | $0 |
| 25 to 44 Years | 346 (46.1%) | $80,154 |
| 45 to 64 Years | 216 (28.8%) | $100,682 |
| 65+ Years | 163 (21.7%) | $80,048 |
| Total | 751 (100.0%) | $80,563 |
Poverty in Arbuckle
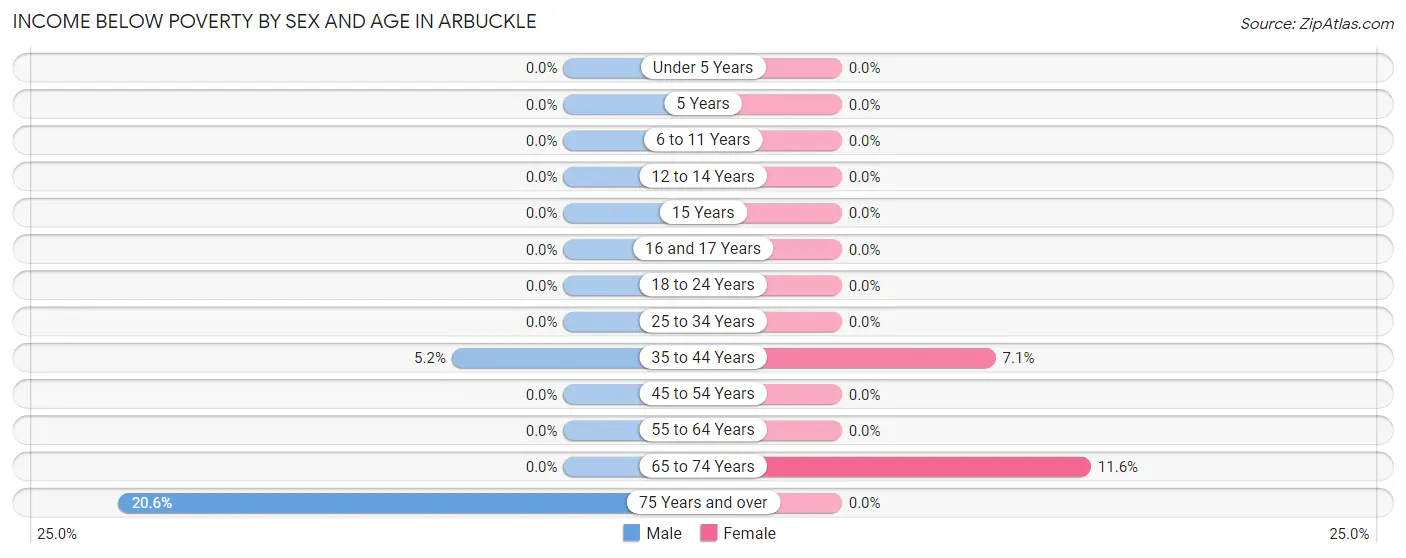
Income Below Poverty by Sex and Age in Arbuckle
With 1.4% poverty level for males and 2.3% for females among the residents of Arbuckle, 75 year old and over males and 65 to 74 year old females are the most vulnerable to poverty, with 13 males (20.6%) and 17 females (11.6%) in their respective age groups living below the poverty level.
| Age Bracket | Male | Female |
| Under 5 Years | 0 (0.0%) | 0 (0.0%) |
| 5 Years | 0 (0.0%) | 0 (0.0%) |
| 6 to 11 Years | 0 (0.0%) | 0 (0.0%) |
| 12 to 14 Years | 0 (0.0%) | 0 (0.0%) |
| 15 Years | 0 (0.0%) | 0 (0.0%) |
| 16 and 17 Years | 0 (0.0%) | 0 (0.0%) |
| 18 to 24 Years | 0 (0.0%) | 0 (0.0%) |
| 25 to 34 Years | 0 (0.0%) | 0 (0.0%) |
| 35 to 44 Years | 10 (5.2%) | 16 (7.1%) |
| 45 to 54 Years | 0 (0.0%) | 0 (0.0%) |
| 55 to 64 Years | 0 (0.0%) | 0 (0.0%) |
| 65 to 74 Years | 0 (0.0%) | 17 (11.6%) |
| 75 Years and over | 13 (20.6%) | 0 (0.0%) |
| Total | 23 (1.4%) | 33 (2.3%) |
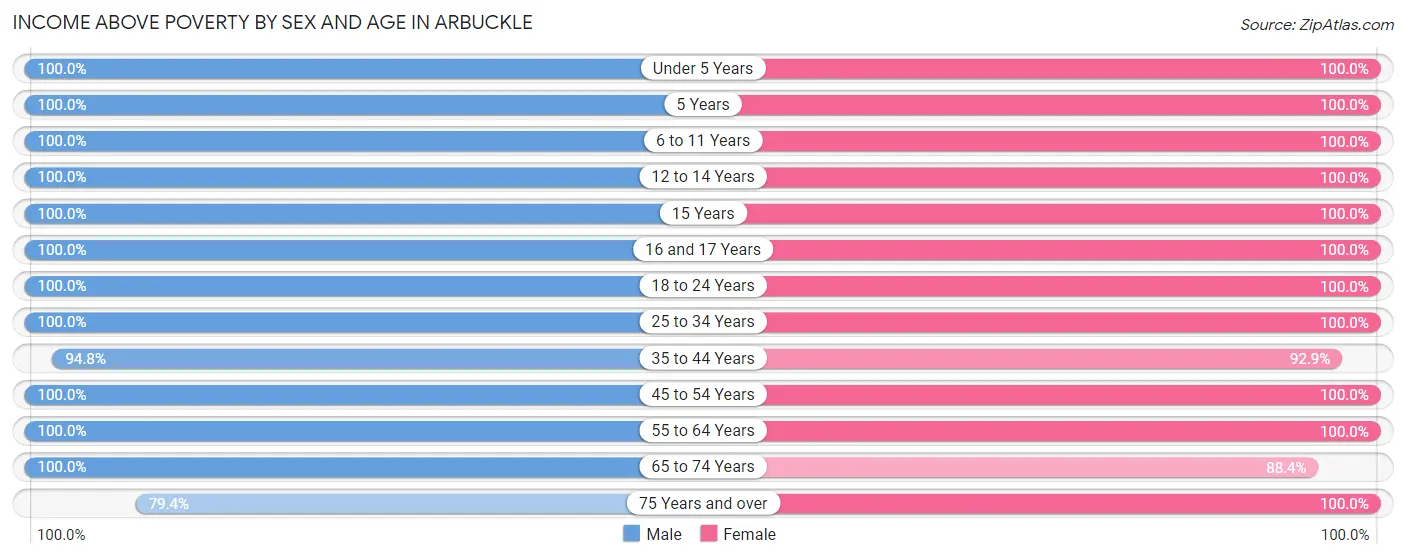
Income Above Poverty by Sex and Age in Arbuckle
According to the poverty statistics in Arbuckle, males aged under 5 years and females aged under 5 years are the age groups that are most secure financially, with 100.0% of males and 100.0% of females in these age groups living above the poverty line.
| Age Bracket | Male | Female |
| Under 5 Years | 114 (100.0%) | 143 (100.0%) |
| 5 Years | 26 (100.0%) | 22 (100.0%) |
| 6 to 11 Years | 182 (100.0%) | 85 (100.0%) |
| 12 to 14 Years | 55 (100.0%) | 67 (100.0%) |
| 15 Years | 33 (100.0%) | 15 (100.0%) |
| 16 and 17 Years | 19 (100.0%) | 7 (100.0%) |
| 18 to 24 Years | 285 (100.0%) | 220 (100.0%) |
| 25 to 34 Years | 258 (100.0%) | 209 (100.0%) |
| 35 to 44 Years | 183 (94.8%) | 208 (92.9%) |
| 45 to 54 Years | 199 (100.0%) | 167 (100.0%) |
| 55 to 64 Years | 154 (100.0%) | 88 (100.0%) |
| 65 to 74 Years | 71 (100.0%) | 130 (88.4%) |
| 75 Years and over | 50 (79.4%) | 26 (100.0%) |
| Total | 1,629 (98.6%) | 1,387 (97.7%) |
Income Below Poverty Among Married-Couple Families in Arbuckle
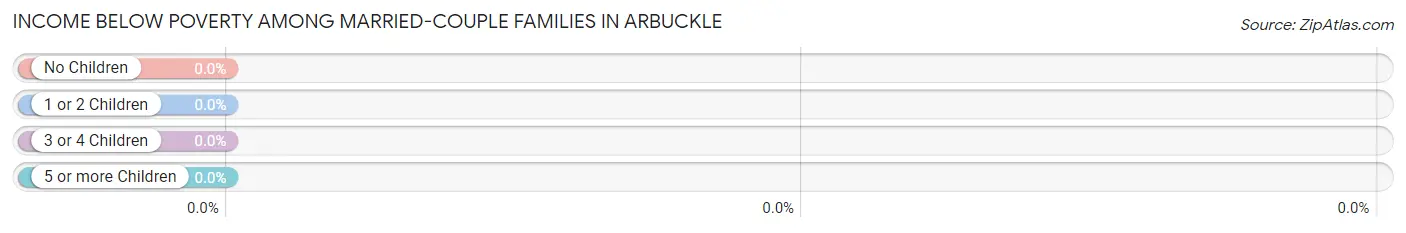
| Children | Above Poverty | Below Poverty |
| No Children | 136 (100.0%) | 0 (0.0%) |
| 1 or 2 Children | 232 (100.0%) | 0 (0.0%) |
| 3 or 4 Children | 86 (100.0%) | 0 (0.0%) |
| 5 or more Children | 0 (0.0%) | 0 (0.0%) |
| Total | 454 (100.0%) | 0 (0.0%) |
Income Below Poverty Among Single-Parent Households in Arbuckle
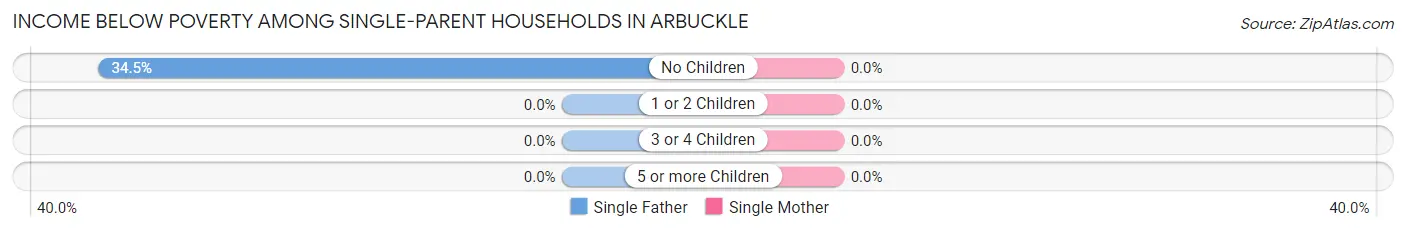
| Children | Single Father | Single Mother |
| No Children | 10 (34.5%) | 0 (0.0%) |
| 1 or 2 Children | 0 (0.0%) | 0 (0.0%) |
| 3 or 4 Children | 0 (0.0%) | 0 (0.0%) |
| 5 or more Children | 0 (0.0%) | 0 (0.0%) |
| Total | 10 (27.8%) | 0 (0.0%) |
Income Below Poverty Among Married-Couple vs Single-Parent Households in Arbuckle
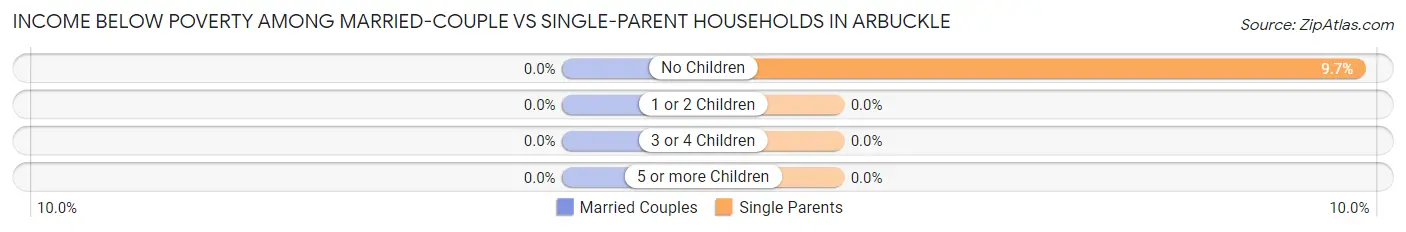
| Children | Married-Couple Families | Single-Parent Households |
| No Children | 0 (0.0%) | 10 (9.7%) |
| 1 or 2 Children | 0 (0.0%) | 0 (0.0%) |
| 3 or 4 Children | 0 (0.0%) | 0 (0.0%) |
| 5 or more Children | 0 (0.0%) | 0 (0.0%) |
| Total | 0 (0.0%) | 10 (7.1%) |
Race in Arbuckle
The most populous races in Arbuckle are Hispanic or Latino (2,299 | 74.8%), White / Caucasian (1,768 | 57.6%), and Some other Race (729 | 23.7%).
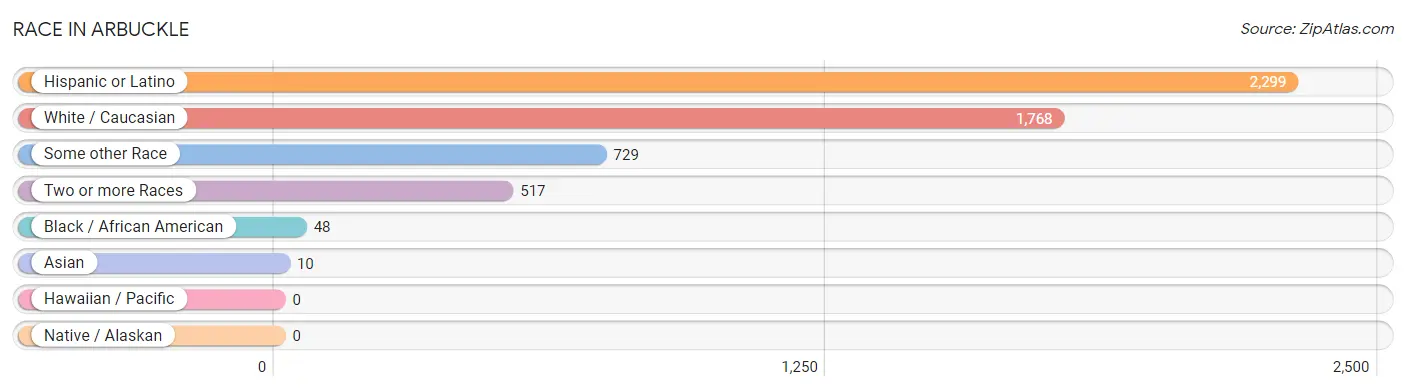
| Race | # Population | % Population |
| Asian | 10 | 0.3% |
| Black / African American | 48 | 1.6% |
| Hawaiian / Pacific | 0 | 0.0% |
| Hispanic or Latino | 2,299 | 74.8% |
| Native / Alaskan | 0 | 0.0% |
| White / Caucasian | 1,768 | 57.6% |
| Two or more Races | 517 | 16.8% |
| Some other Race | 729 | 23.7% |
| Total | 3,072 | 100.0% |
Ancestry in Arbuckle
The most populous ancestries reported in Arbuckle are Mexican (2,278 | 74.2%), German (228 | 7.4%), Irish (164 | 5.3%), English (99 | 3.2%), and Scottish (93 | 3.0%), together accounting for 93.2% of all Arbuckle residents.
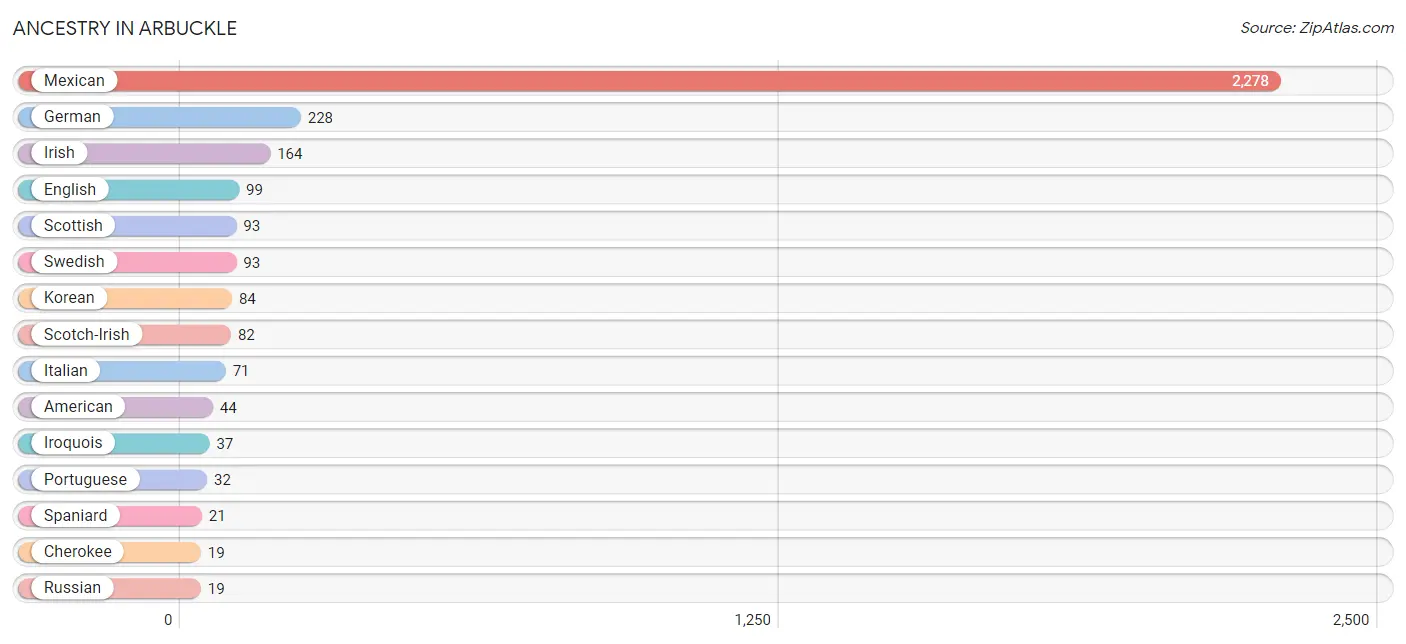
| Ancestry | # Population | % Population |
| American | 44 | 1.4% |
| Austrian | 8 | 0.3% |
| Cherokee | 19 | 0.6% |
| English | 99 | 3.2% |
| European | 15 | 0.5% |
| French | 7 | 0.2% |
| French Canadian | 9 | 0.3% |
| German | 228 | 7.4% |
| Greek | 10 | 0.3% |
| Irish | 164 | 5.3% |
| Iroquois | 37 | 1.2% |
| Italian | 71 | 2.3% |
| Korean | 84 | 2.7% |
| Mexican | 2,278 | 74.2% |
| Mexican American Indian | 7 | 0.2% |
| Norwegian | 10 | 0.3% |
| Portuguese | 32 | 1.0% |
| Russian | 19 | 0.6% |
| Scotch-Irish | 82 | 2.7% |
| Scottish | 93 | 3.0% |
| Spaniard | 21 | 0.7% |
| Swedish | 93 | 3.0% |
| Thai | 10 | 0.3% | View All 23 Rows |
Immigrants in Arbuckle
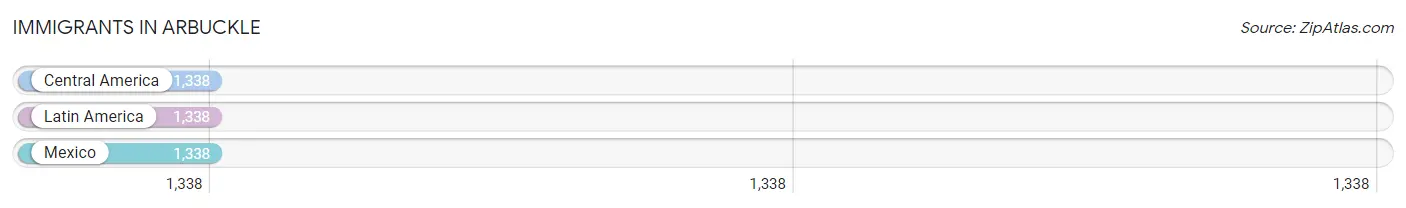
The most numerous immigrant groups reported in Arbuckle came from Central America (1,338 | 43.5%), Latin America (1,338 | 43.5%), and Mexico (1,338 | 43.5%), together accounting for 130.6% of all Arbuckle residents.
| Immigration Origin | # Population | % Population |
| Central America | 1,338 | 43.5% |
| Latin America | 1,338 | 43.5% |
| Mexico | 1,338 | 43.5% | View All 3 Rows |
Sex and Age in Arbuckle
Sex and Age in Arbuckle
The most populous age groups in Arbuckle are 20 to 24 Years (249 | 15.1%) for men and 40 to 44 Years (163 | 11.5%) for women.
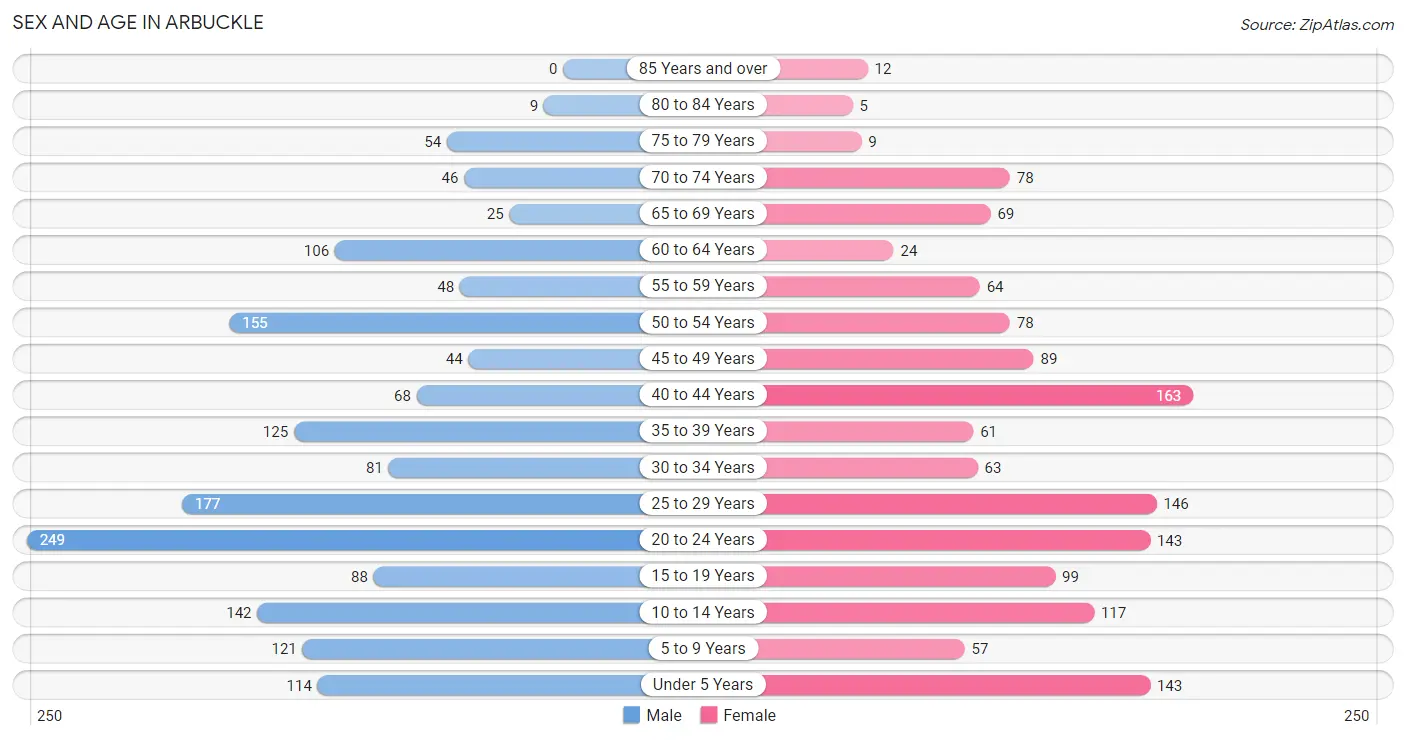
| Age Bracket | Male | Female |
| Under 5 Years | 114 (6.9%) | 143 (10.1%) |
| 5 to 9 Years | 121 (7.3%) | 57 (4.0%) |
| 10 to 14 Years | 142 (8.6%) | 117 (8.2%) |
| 15 to 19 Years | 88 (5.3%) | 99 (7.0%) |
| 20 to 24 Years | 249 (15.1%) | 143 (10.1%) |
| 25 to 29 Years | 177 (10.7%) | 146 (10.3%) |
| 30 to 34 Years | 81 (4.9%) | 63 (4.4%) |
| 35 to 39 Years | 125 (7.6%) | 61 (4.3%) |
| 40 to 44 Years | 68 (4.1%) | 163 (11.5%) |
| 45 to 49 Years | 44 (2.7%) | 89 (6.3%) |
| 50 to 54 Years | 155 (9.4%) | 78 (5.5%) |
| 55 to 59 Years | 48 (2.9%) | 64 (4.5%) |
| 60 to 64 Years | 106 (6.4%) | 24 (1.7%) |
| 65 to 69 Years | 25 (1.5%) | 69 (4.9%) |
| 70 to 74 Years | 46 (2.8%) | 78 (5.5%) |
| 75 to 79 Years | 54 (3.3%) | 9 (0.6%) |
| 80 to 84 Years | 9 (0.5%) | 5 (0.4%) |
| 85 Years and over | 0 (0.0%) | 12 (0.9%) |
| Total | 1,652 (100.0%) | 1,420 (100.0%) |
Families and Households in Arbuckle
Median Family Size in Arbuckle
The median family size in Arbuckle is 4.80 persons per family, with single female/mother families (105 | 17.6%) accounting for the largest median family size of 4.86 persons per family. On the other hand, single male/father families (36 | 6.0%) represent the smallest median family size with 3.97 persons per family.
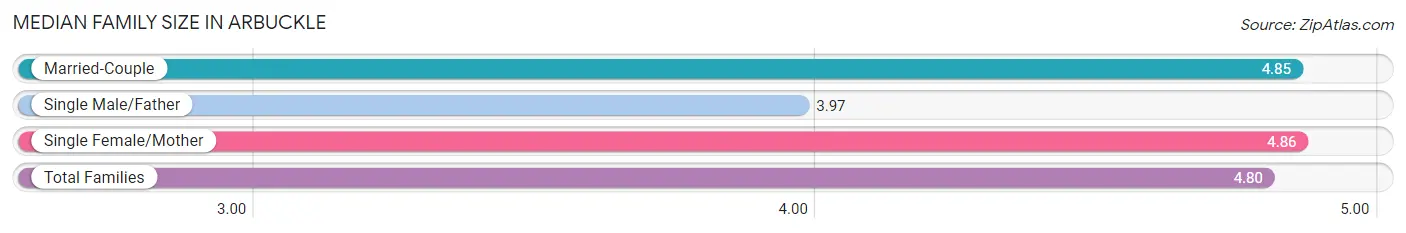
| Family Type | # Families | Family Size |
| Married-Couple | 454 (76.3%) | 4.85 |
| Single Male/Father | 36 (6.0%) | 3.97 |
| Single Female/Mother | 105 (17.6%) | 4.86 |
| Total Families | 595 (100.0%) | 4.80 |
Median Household Size in Arbuckle
The median household size in Arbuckle is 4.09 persons per household, with single female/mother households (105 | 14.0%) accounting for the largest median household size of 4.86 persons per household. non-family households (156 | 20.8%) represent the smallest median household size with 1.39 persons per household.
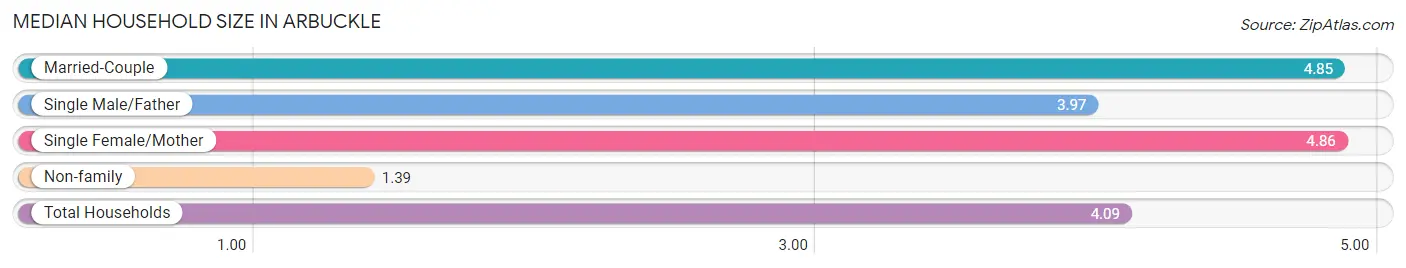
| Household Type | # Households | Household Size |
| Married-Couple | 454 (60.5%) | 4.85 |
| Single Male/Father | 36 (4.8%) | 3.97 |
| Single Female/Mother | 105 (14.0%) | 4.86 |
| Non-family | 156 (20.8%) | 1.39 |
| Total Households | 751 (100.0%) | 4.09 |
Household Size by Marriage Status in Arbuckle
Out of a total of 751 households in Arbuckle, 595 (79.2%) are family households, while 156 (20.8%) are nonfamily households. The most numerous type of family households are 4-person households, comprising 210, and the most common type of nonfamily households are 1-person households, comprising 121.
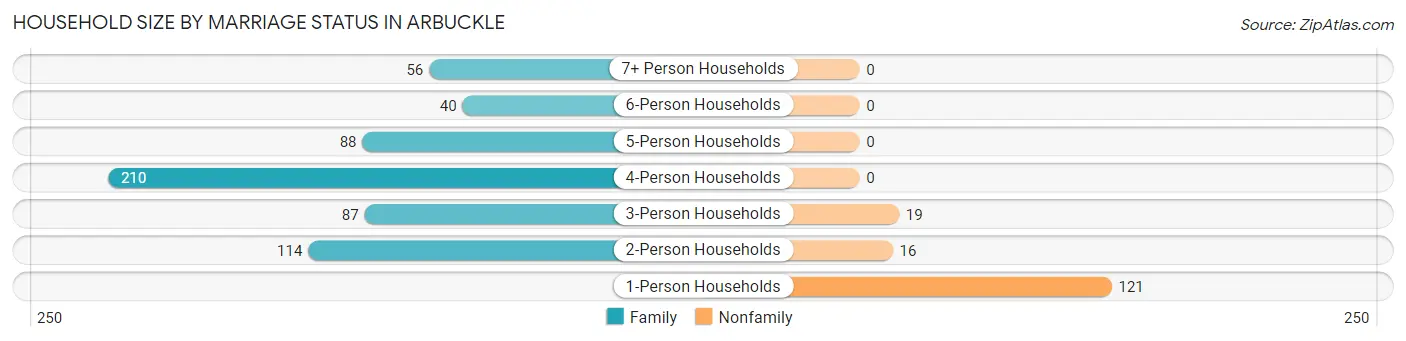
| Household Size | Family Households | Nonfamily Households |
| 1-Person Households | - | 121 (16.1%) |
| 2-Person Households | 114 (15.2%) | 16 (2.1%) |
| 3-Person Households | 87 (11.6%) | 19 (2.5%) |
| 4-Person Households | 210 (28.0%) | 0 (0.0%) |
| 5-Person Households | 88 (11.7%) | 0 (0.0%) |
| 6-Person Households | 40 (5.3%) | 0 (0.0%) |
| 7+ Person Households | 56 (7.5%) | 0 (0.0%) |
| Total | 595 (79.2%) | 156 (20.8%) |
Female Fertility in Arbuckle
Fertility by Age in Arbuckle
Average fertility rate in Arbuckle is 41.0 births per 1,000 women. Women in the age bracket of 20 to 34 years have the highest fertility rate with 60.0 births per 1,000 women. Women in the age bracket of 20 to 34 years acount for 67.7% of all women with births.
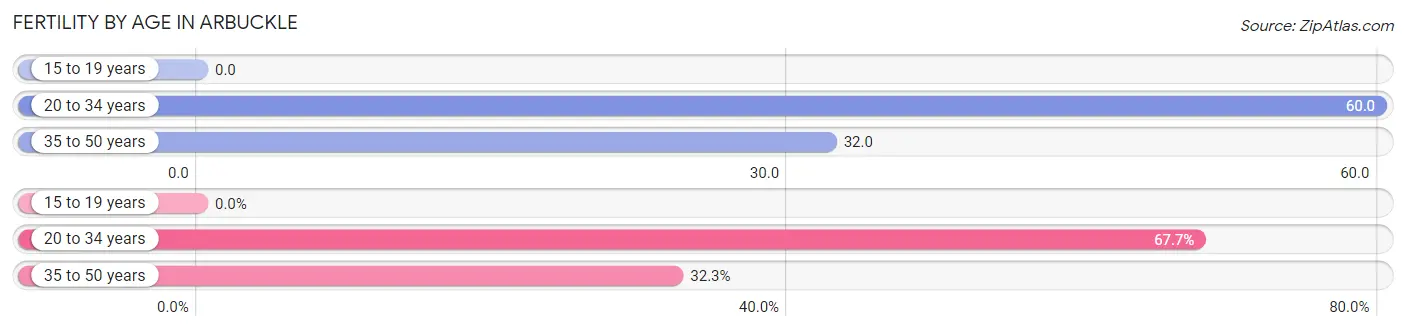
| Age Bracket | Women with Births | Births / 1,000 Women |
| 15 to 19 years | 0 (0.0%) | 0.0 |
| 20 to 34 years | 21 (67.7%) | 60.0 |
| 35 to 50 years | 10 (32.3%) | 32.0 |
| Total | 31 (100.0%) | 41.0 |
Fertility by Age by Marriage Status in Arbuckle
64.5% of women with births (31) in Arbuckle are married. The highest percentage of unmarried women with births falls into 20 to 34 years age bracket with 52.4% of them unmarried at the time of birth, while the lowest percentage of unmarried women with births belong to 35 to 50 years age bracket with 0.0% of them unmarried.
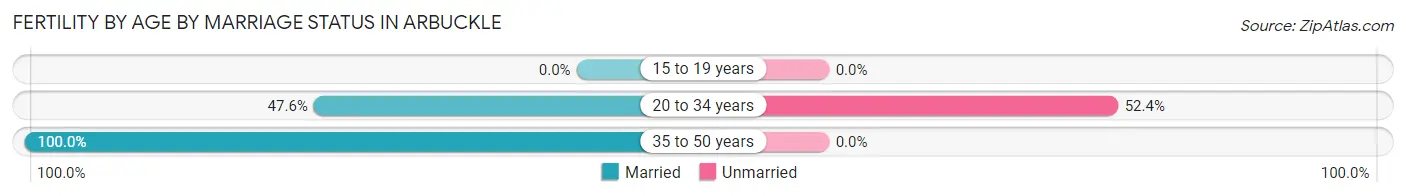
| Age Bracket | Married | Unmarried |
| 15 to 19 years | 0 (0.0%) | 0 (0.0%) |
| 20 to 34 years | 10 (47.6%) | 11 (52.4%) |
| 35 to 50 years | 10 (100.0%) | 0 (0.0%) |
| Total | 20 (64.5%) | 11 (35.5%) |
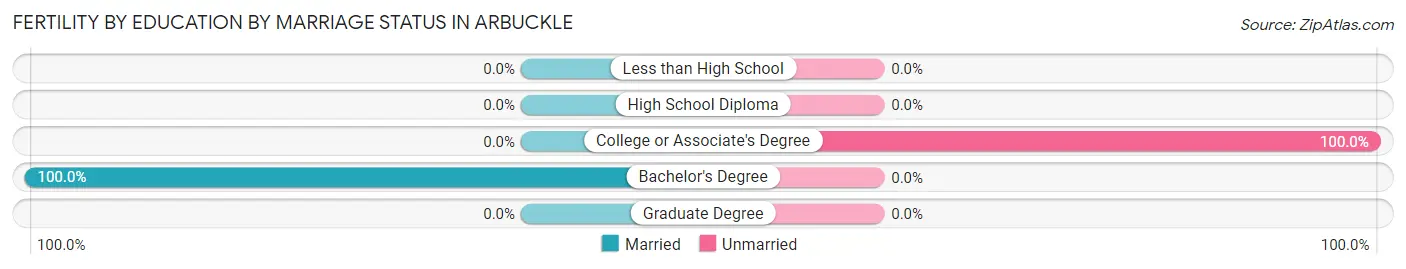
Fertility by Education in Arbuckle
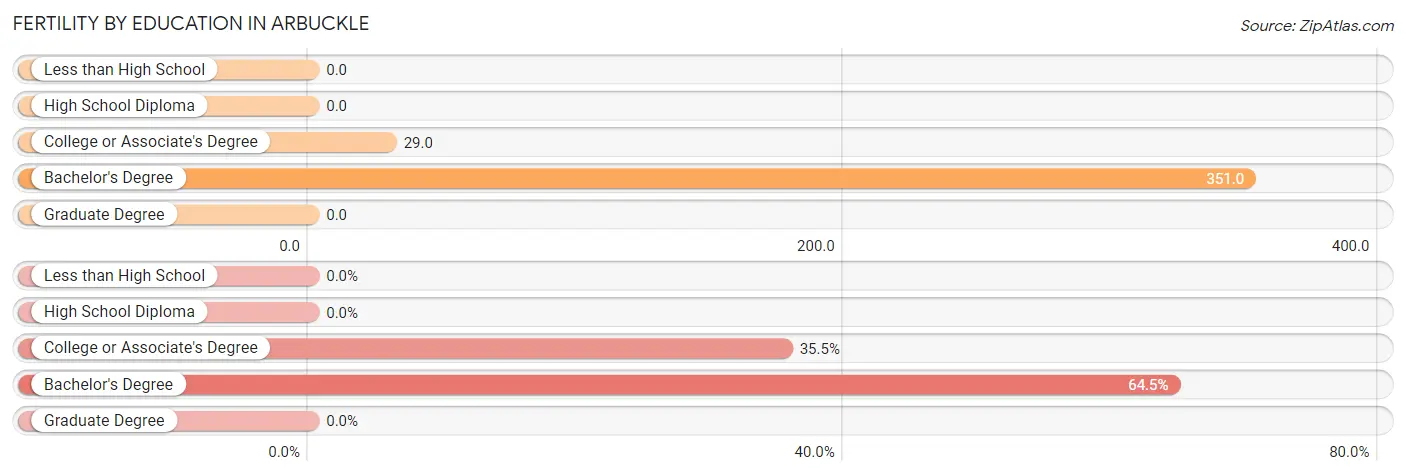
| Educational Attainment | Women with Births | Births / 1,000 Women |
| Less than High School | 0 (0.0%) | 0.0 |
| High School Diploma | 0 (0.0%) | 0.0 |
| College or Associate's Degree | 11 (35.5%) | 29.0 |
| Bachelor's Degree | 20 (64.5%) | 351.0 |
| Graduate Degree | 0 (0.0%) | 0.0 |
| Total | 31 (100.0%) | 41.0 |
Fertility by Education by Marriage Status in Arbuckle
35.5% of women with births in Arbuckle are unmarried. Women with the educational attainment of bachelor's degree are most likely to be married with 100.0% of them married at childbirth, while women with the educational attainment of college or associate's degree are least likely to be married with 100.0% of them unmarried at childbirth.
| Educational Attainment | Married | Unmarried |
| Less than High School | 0 (0.0%) | 0 (0.0%) |
| High School Diploma | 0 (0.0%) | 0 (0.0%) |
| College or Associate's Degree | 0 (0.0%) | 11 (100.0%) |
| Bachelor's Degree | 20 (100.0%) | 0 (0.0%) |
| Graduate Degree | 0 (0.0%) | 0 (0.0%) |
| Total | 20 (64.5%) | 11 (35.5%) |
Employment Characteristics in Arbuckle
Employment by Class of Employer in Arbuckle
Among the 1,515 employed individuals in Arbuckle, private company employees (1,165 | 76.9%), local government employees (126 | 8.3%), and self-employed (not incorporated) (82 | 5.4%) make up the most common classes of employment.
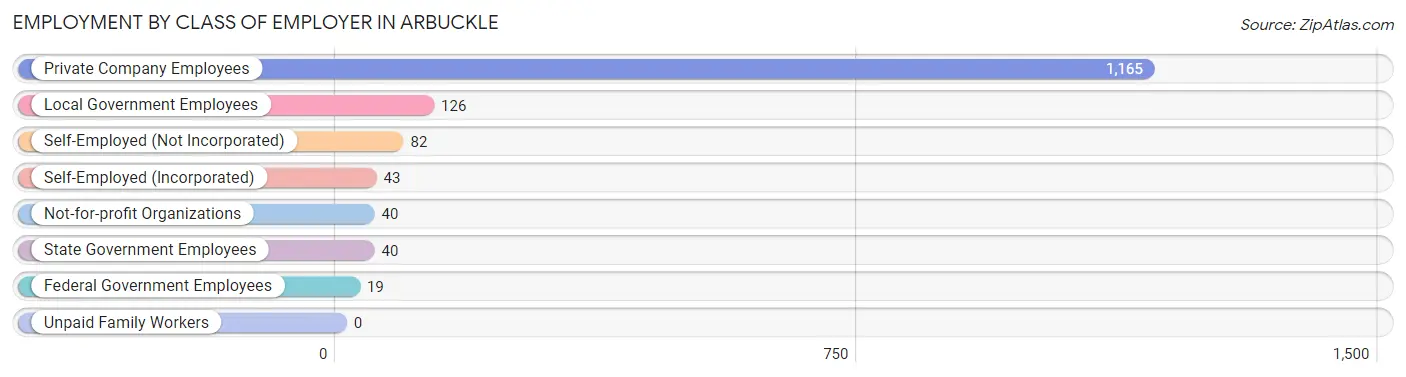
| Employer Class | # Employees | % Employees |
| Private Company Employees | 1,165 | 76.9% |
| Self-Employed (Incorporated) | 43 | 2.8% |
| Self-Employed (Not Incorporated) | 82 | 5.4% |
| Not-for-profit Organizations | 40 | 2.6% |
| Local Government Employees | 126 | 8.3% |
| State Government Employees | 40 | 2.6% |
| Federal Government Employees | 19 | 1.3% |
| Unpaid Family Workers | 0 | 0.0% |
| Total | 1,515 | 100.0% |
Employment Status by Age in Arbuckle
According to the labor force statistics for Arbuckle, out of the total population over 16 years of age (2,330), 66.4% or 1,547 individuals are in the labor force, with 1.5% or 23 of them unemployed. The age group with the highest labor force participation rate is 25 to 29 years, with 83.0% or 268 individuals in the labor force. Within the labor force, the 45 to 54 years age range has the highest percentage of unemployed individuals, with 4.6% or 13 of them being unemployed.
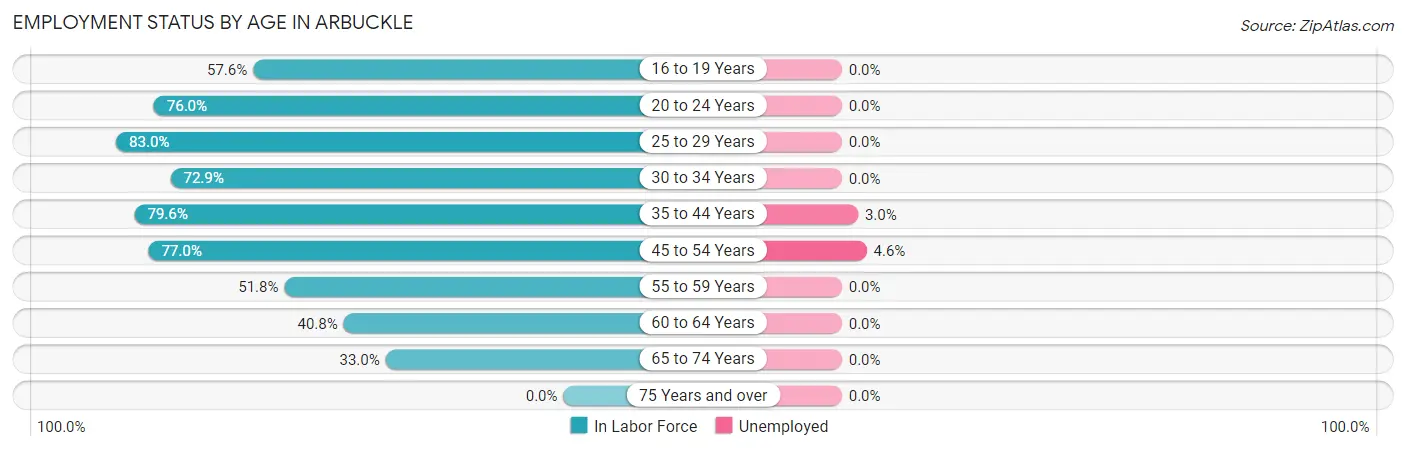
| Age Bracket | In Labor Force | Unemployed |
| 16 to 19 Years | 80 (57.6%) | 0 (0.0%) |
| 20 to 24 Years | 298 (76.0%) | 0 (0.0%) |
| 25 to 29 Years | 268 (83.0%) | 0 (0.0%) |
| 30 to 34 Years | 105 (72.9%) | 0 (0.0%) |
| 35 to 44 Years | 332 (79.6%) | 10 (3.0%) |
| 45 to 54 Years | 282 (77.0%) | 13 (4.6%) |
| 55 to 59 Years | 58 (51.8%) | 0 (0.0%) |
| 60 to 64 Years | 53 (40.8%) | 0 (0.0%) |
| 65 to 74 Years | 72 (33.0%) | 0 (0.0%) |
| 75 Years and over | 0 (0.0%) | 0 (0.0%) |
| Total | 1,547 (66.4%) | 23 (1.5%) |
Employment Status by Educational Attainment in Arbuckle
According to labor force statistics for Arbuckle, 73.6% of individuals (1,098) out of the total population between 25 and 64 years of age (1,492) are in the labor force, with 2.1% or 23 of them being unemployed. The group with the highest labor force participation rate are those with the educational attainment of high school diploma, with 88.0% or 265 individuals in the labor force. Within the labor force, individuals with high school diploma education have the highest percentage of unemployment, with 8.7% or 23 of them being unemployed.
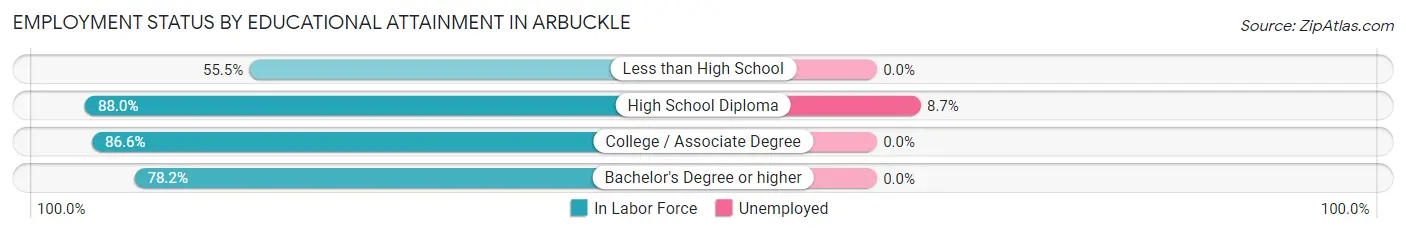
| Educational Attainment | In Labor Force | Unemployed |
| Less than High School | 336 (55.5%) | 0 (0.0%) |
| High School Diploma | 265 (88.0%) | 26 (8.7%) |
| College / Associate Degree | 400 (86.6%) | 0 (0.0%) |
| Bachelor's Degree or higher | 97 (78.2%) | 0 (0.0%) |
| Total | 1,098 (73.6%) | 31 (2.1%) |
Employment Occupations by Sex in Arbuckle
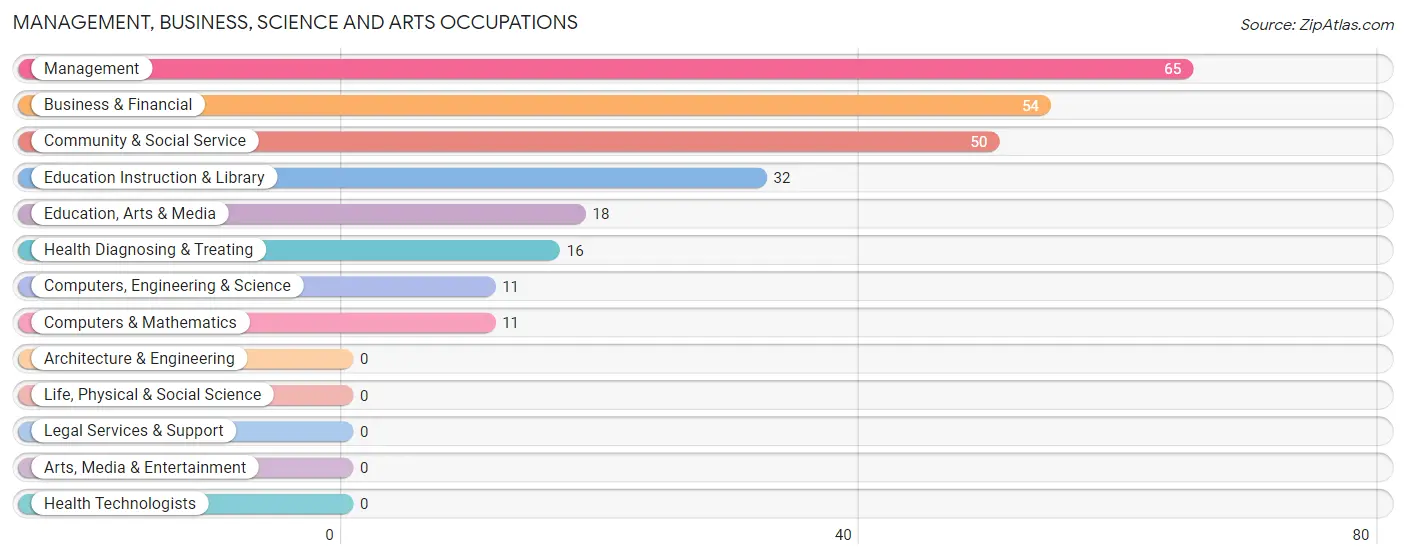
Management, Business, Science and Arts Occupations
The most common Management, Business, Science and Arts occupations in Arbuckle are Management (65 | 4.3%), Business & Financial (54 | 3.5%), Community & Social Service (50 | 3.3%), Education Instruction & Library (32 | 2.1%), and Education, Arts & Media (18 | 1.2%).
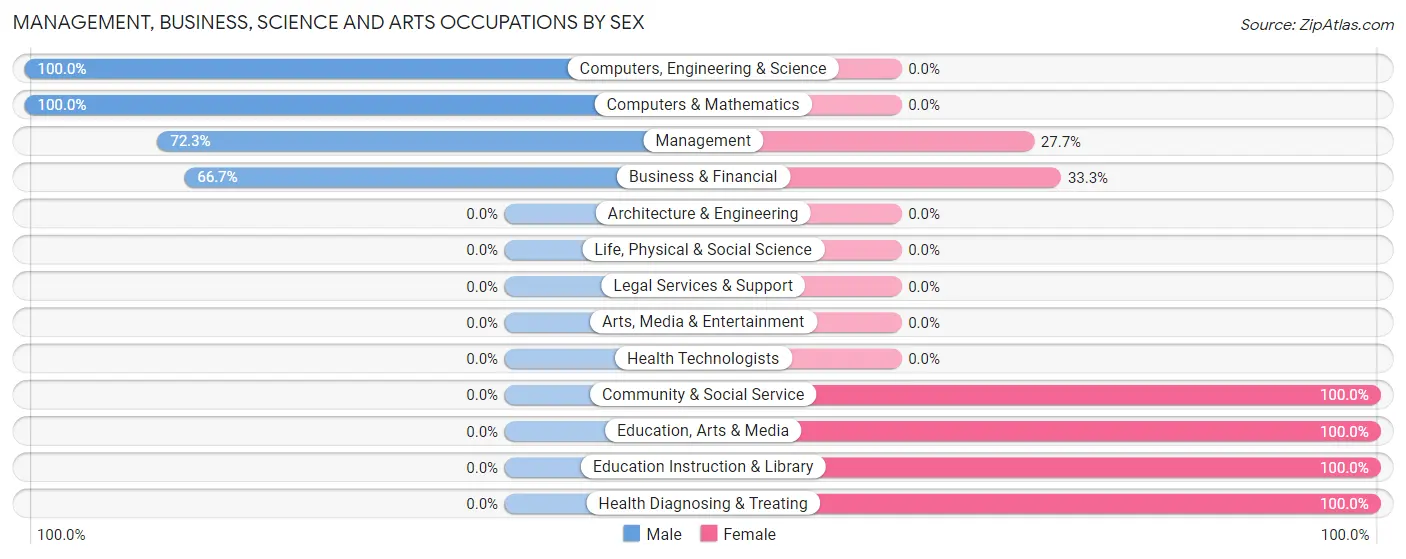
Management, Business, Science and Arts Occupations by Sex
Within the Management, Business, Science and Arts occupations in Arbuckle, the most male-oriented occupations are Computers, Engineering & Science (100.0%), Computers & Mathematics (100.0%), and Management (72.3%), while the most female-oriented occupations are Community & Social Service (100.0%), Education, Arts & Media (100.0%), and Education Instruction & Library (100.0%).
| Occupation | Male | Female |
| Management | 47 (72.3%) | 18 (27.7%) |
| Business & Financial | 36 (66.7%) | 18 (33.3%) |
| Computers, Engineering & Science | 11 (100.0%) | 0 (0.0%) |
| Computers & Mathematics | 11 (100.0%) | 0 (0.0%) |
| Architecture & Engineering | 0 (0.0%) | 0 (0.0%) |
| Life, Physical & Social Science | 0 (0.0%) | 0 (0.0%) |
| Community & Social Service | 0 (0.0%) | 50 (100.0%) |
| Education, Arts & Media | 0 (0.0%) | 18 (100.0%) |
| Legal Services & Support | 0 (0.0%) | 0 (0.0%) |
| Education Instruction & Library | 0 (0.0%) | 32 (100.0%) |
| Arts, Media & Entertainment | 0 (0.0%) | 0 (0.0%) |
| Health Diagnosing & Treating | 0 (0.0%) | 16 (100.0%) |
| Health Technologists | 0 (0.0%) | 0 (0.0%) |
| Total (Category) | 94 (48.0%) | 102 (52.0%) |
| Total (Overall) | 938 (61.5%) | 587 (38.5%) |
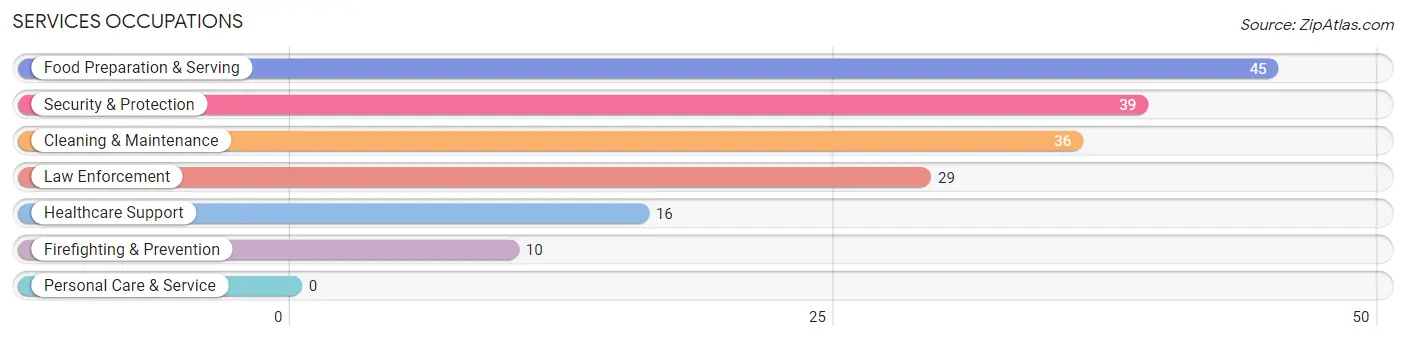
Services Occupations
The most common Services occupations in Arbuckle are Food Preparation & Serving (45 | 2.9%), Security & Protection (39 | 2.6%), Cleaning & Maintenance (36 | 2.4%), Law Enforcement (29 | 1.9%), and Healthcare Support (16 | 1.1%).
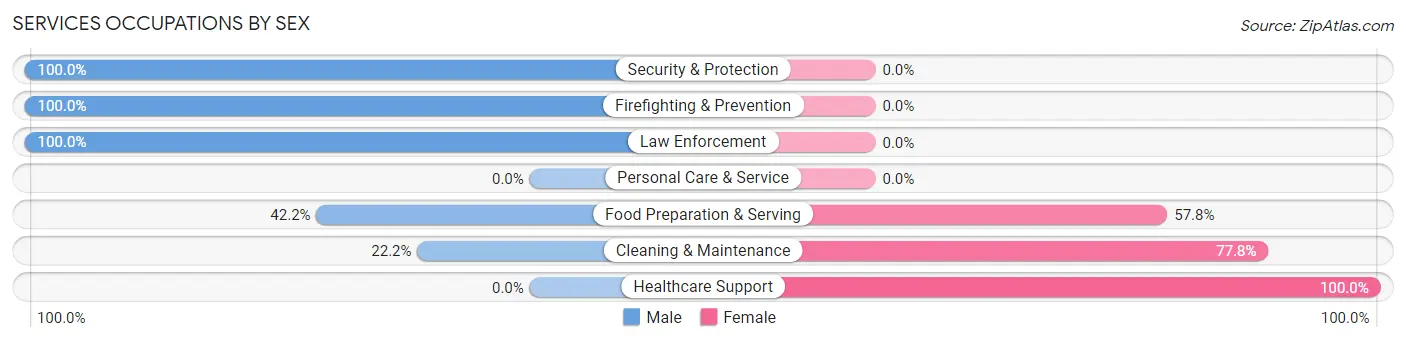
Services Occupations by Sex
Within the Services occupations in Arbuckle, the most male-oriented occupations are Security & Protection (100.0%), Firefighting & Prevention (100.0%), and Law Enforcement (100.0%), while the most female-oriented occupations are Healthcare Support (100.0%), Cleaning & Maintenance (77.8%), and Food Preparation & Serving (57.8%).
| Occupation | Male | Female |
| Healthcare Support | 0 (0.0%) | 16 (100.0%) |
| Security & Protection | 39 (100.0%) | 0 (0.0%) |
| Firefighting & Prevention | 10 (100.0%) | 0 (0.0%) |
| Law Enforcement | 29 (100.0%) | 0 (0.0%) |
| Food Preparation & Serving | 19 (42.2%) | 26 (57.8%) |
| Cleaning & Maintenance | 8 (22.2%) | 28 (77.8%) |
| Personal Care & Service | 0 (0.0%) | 0 (0.0%) |
| Total (Category) | 66 (48.5%) | 70 (51.5%) |
| Total (Overall) | 938 (61.5%) | 587 (38.5%) |
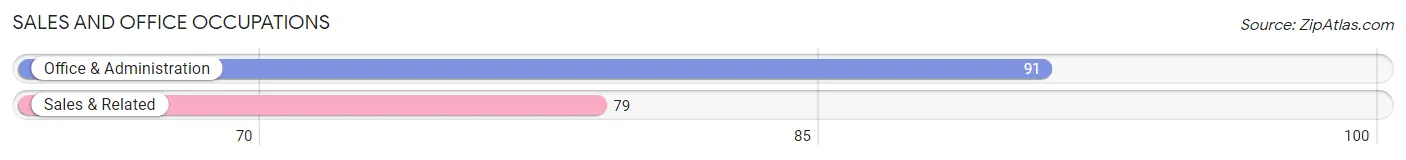
Sales and Office Occupations
The most common Sales and Office occupations in Arbuckle are Office & Administration (91 | 6.0%), and Sales & Related (79 | 5.2%).
Sales and Office Occupations by Sex
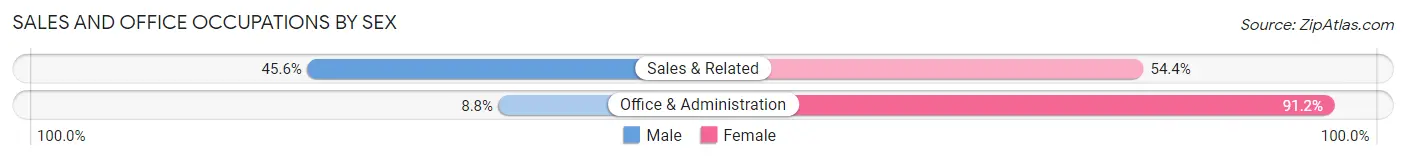
| Occupation | Male | Female |
| Sales & Related | 36 (45.6%) | 43 (54.4%) |
| Office & Administration | 8 (8.8%) | 83 (91.2%) |
| Total (Category) | 44 (25.9%) | 126 (74.1%) |
| Total (Overall) | 938 (61.5%) | 587 (38.5%) |
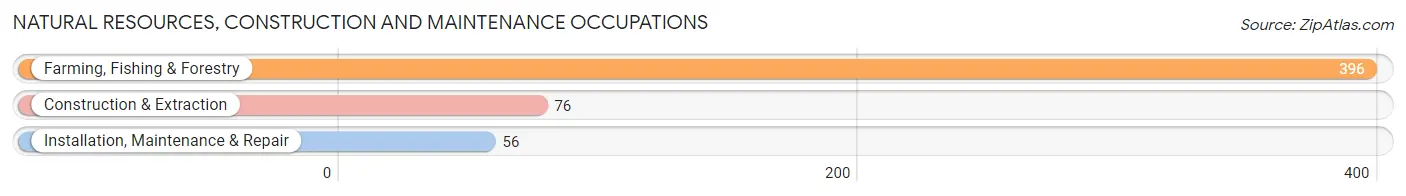
Natural Resources, Construction and Maintenance Occupations
The most common Natural Resources, Construction and Maintenance occupations in Arbuckle are Farming, Fishing & Forestry (396 | 26.0%), Construction & Extraction (76 | 5.0%), and Installation, Maintenance & Repair (56 | 3.7%).
Natural Resources, Construction and Maintenance Occupations by Sex
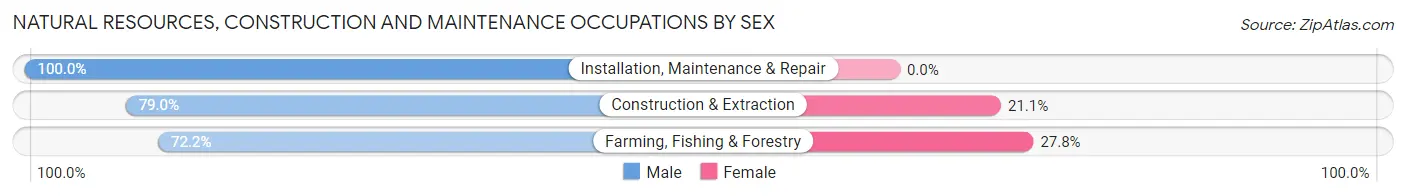
| Occupation | Male | Female |
| Farming, Fishing & Forestry | 286 (72.2%) | 110 (27.8%) |
| Construction & Extraction | 60 (78.9%) | 16 (21.0%) |
| Installation, Maintenance & Repair | 56 (100.0%) | 0 (0.0%) |
| Total (Category) | 402 (76.1%) | 126 (23.9%) |
| Total (Overall) | 938 (61.5%) | 587 (38.5%) |
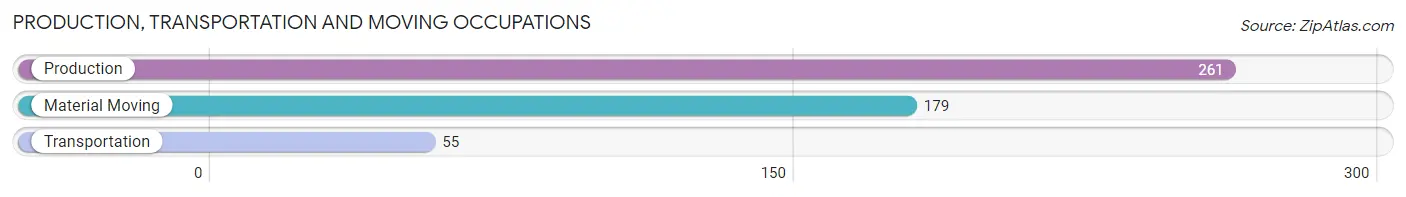
Production, Transportation and Moving Occupations
The most common Production, Transportation and Moving occupations in Arbuckle are Production (261 | 17.1%), Material Moving (179 | 11.7%), and Transportation (55 | 3.6%).
Production, Transportation and Moving Occupations by Sex
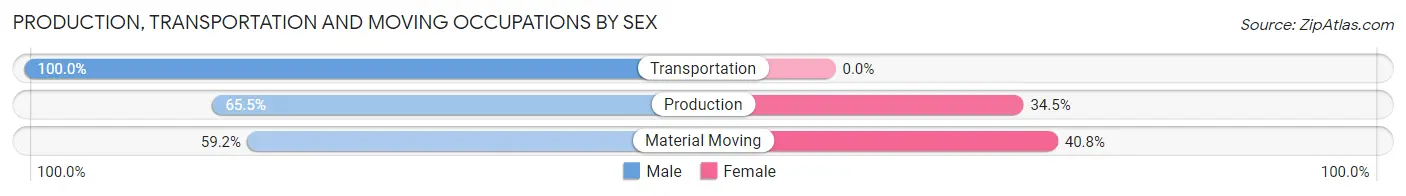
| Occupation | Male | Female |
| Production | 171 (65.5%) | 90 (34.5%) |
| Transportation | 55 (100.0%) | 0 (0.0%) |
| Material Moving | 106 (59.2%) | 73 (40.8%) |
| Total (Category) | 332 (67.1%) | 163 (32.9%) |
| Total (Overall) | 938 (61.5%) | 587 (38.5%) |
Employment Industries by Sex in Arbuckle
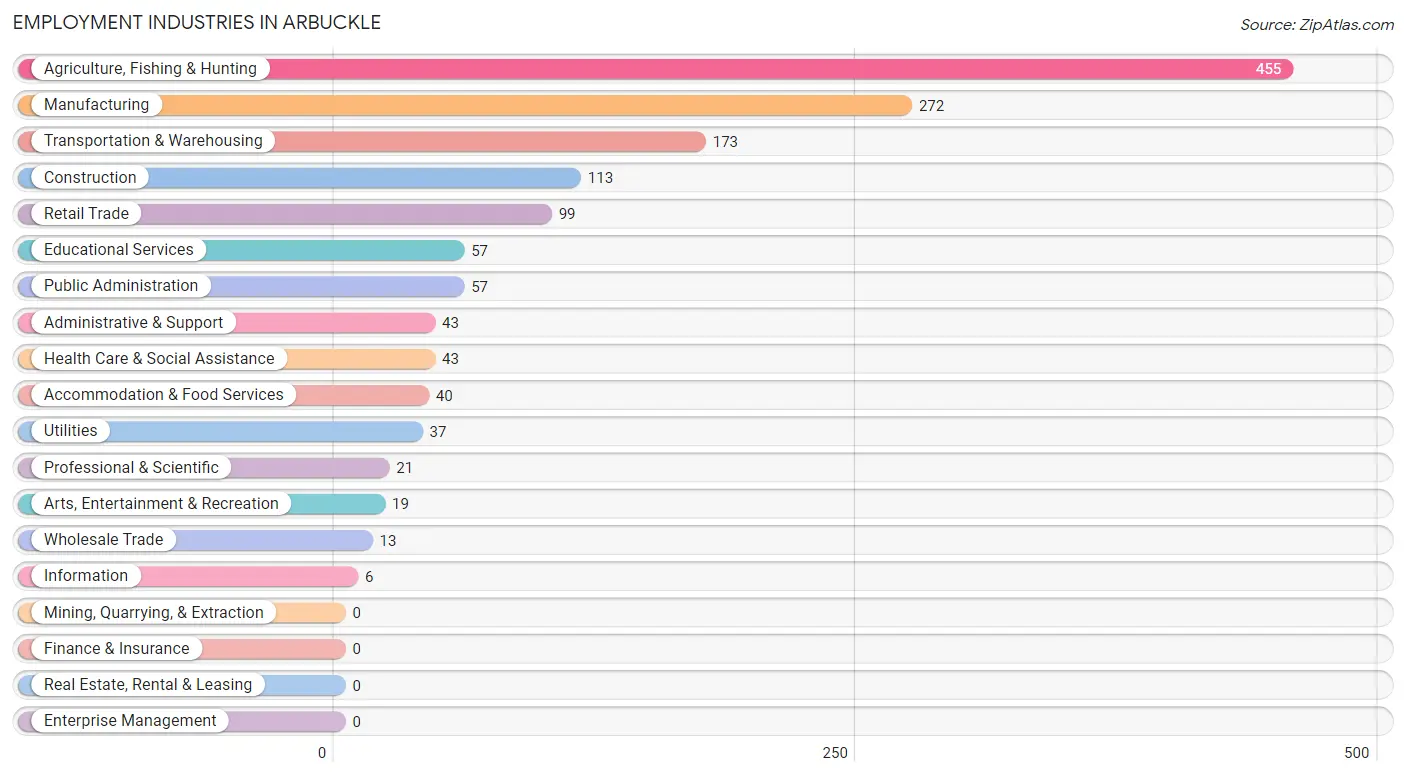
Employment Industries in Arbuckle
The major employment industries in Arbuckle include Agriculture, Fishing & Hunting (455 | 29.8%), Manufacturing (272 | 17.8%), Transportation & Warehousing (173 | 11.3%), Construction (113 | 7.4%), and Retail Trade (99 | 6.5%).
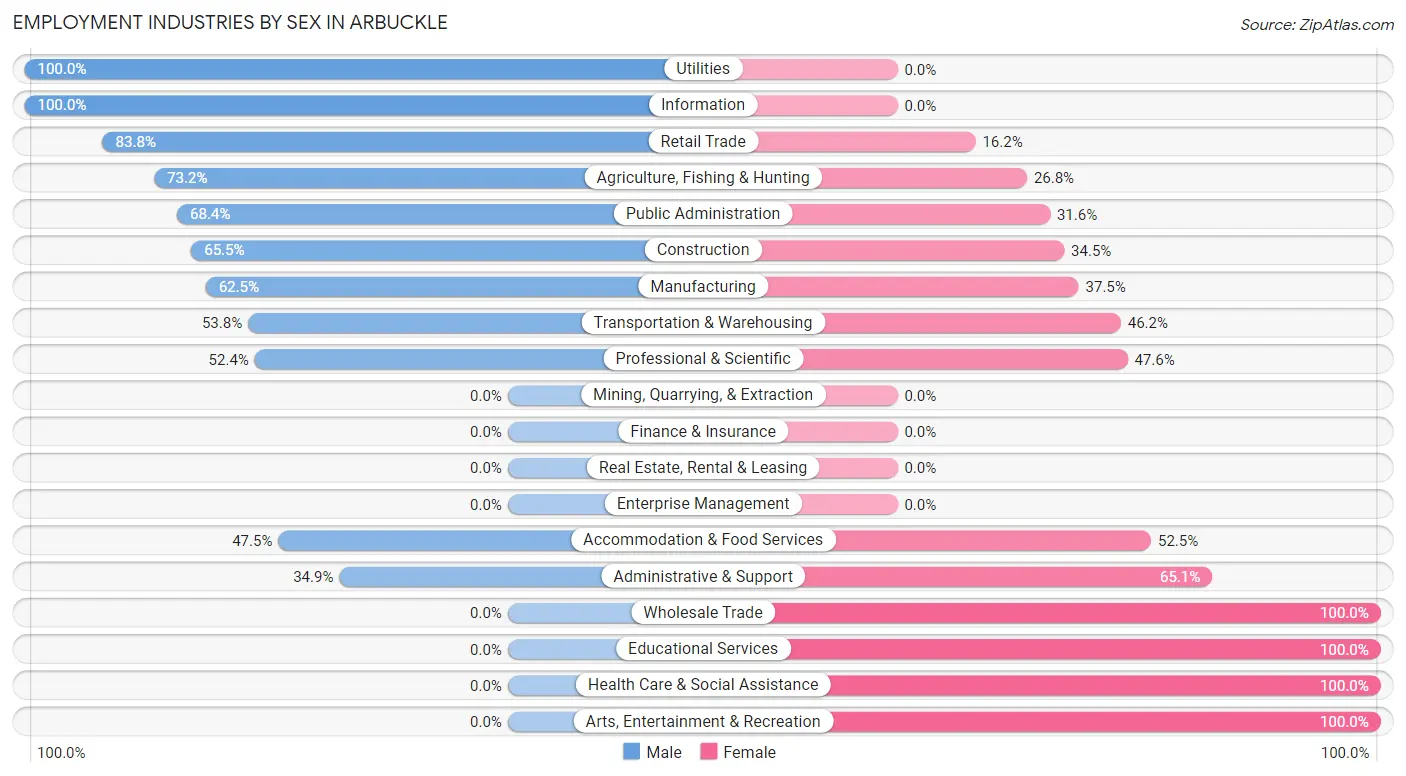
Employment Industries by Sex in Arbuckle
The Arbuckle industries that see more men than women are Utilities (100.0%), Information (100.0%), and Retail Trade (83.8%), whereas the industries that tend to have a higher number of women are Wholesale Trade (100.0%), Educational Services (100.0%), and Health Care & Social Assistance (100.0%).
| Industry | Male | Female |
| Agriculture, Fishing & Hunting | 333 (73.2%) | 122 (26.8%) |
| Mining, Quarrying, & Extraction | 0 (0.0%) | 0 (0.0%) |
| Construction | 74 (65.5%) | 39 (34.5%) |
| Manufacturing | 170 (62.5%) | 102 (37.5%) |
| Wholesale Trade | 0 (0.0%) | 13 (100.0%) |
| Retail Trade | 83 (83.8%) | 16 (16.2%) |
| Transportation & Warehousing | 93 (53.8%) | 80 (46.2%) |
| Utilities | 37 (100.0%) | 0 (0.0%) |
| Information | 6 (100.0%) | 0 (0.0%) |
| Finance & Insurance | 0 (0.0%) | 0 (0.0%) |
| Real Estate, Rental & Leasing | 0 (0.0%) | 0 (0.0%) |
| Professional & Scientific | 11 (52.4%) | 10 (47.6%) |
| Enterprise Management | 0 (0.0%) | 0 (0.0%) |
| Administrative & Support | 15 (34.9%) | 28 (65.1%) |
| Educational Services | 0 (0.0%) | 57 (100.0%) |
| Health Care & Social Assistance | 0 (0.0%) | 43 (100.0%) |
| Arts, Entertainment & Recreation | 0 (0.0%) | 19 (100.0%) |
| Accommodation & Food Services | 19 (47.5%) | 21 (52.5%) |
| Public Administration | 39 (68.4%) | 18 (31.6%) |
| Total | 938 (61.5%) | 587 (38.5%) |
Education in Arbuckle
School Enrollment in Arbuckle
The most common levels of schooling among the 627 students in Arbuckle are middle school (236 | 37.6%), high school (124 | 19.8%), and elementary school (123 | 19.6%).
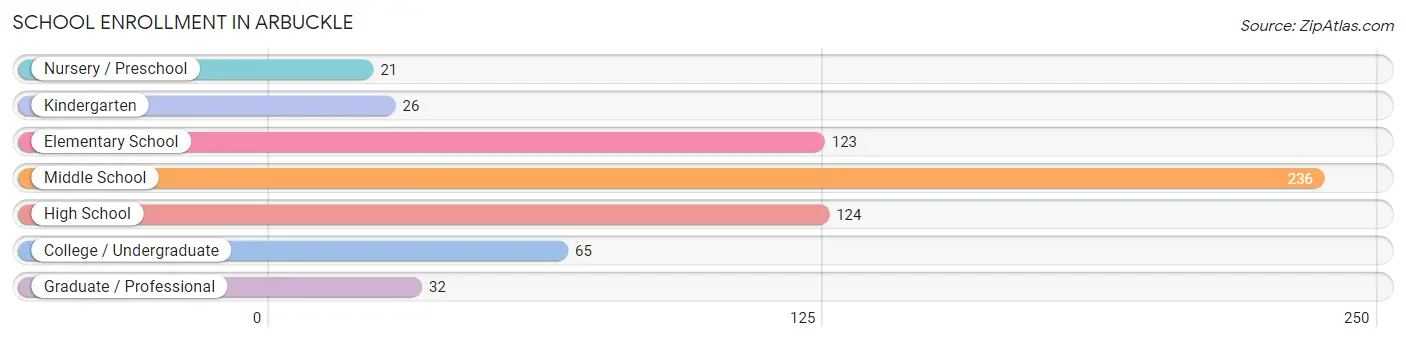
| School Level | # Students | % Students |
| Nursery / Preschool | 21 | 3.4% |
| Kindergarten | 26 | 4.2% |
| Elementary School | 123 | 19.6% |
| Middle School | 236 | 37.6% |
| High School | 124 | 19.8% |
| College / Undergraduate | 65 | 10.4% |
| Graduate / Professional | 32 | 5.1% |
| Total | 627 | 100.0% |
School Enrollment by Age by Funding Source in Arbuckle
Out of a total of 627 students who are enrolled in schools in Arbuckle, 43 (6.9%) attend a private institution, while the remaining 584 (93.1%) are enrolled in public schools. The age group of 3 to 4 year olds has the highest likelihood of being enrolled in private schools, with 21 (100.0% in the age bracket) enrolled. Conversely, the age group of 5 to 9 year old has the lowest likelihood of being enrolled in a private school, with 133 (100.0% in the age bracket) attending a public institution.
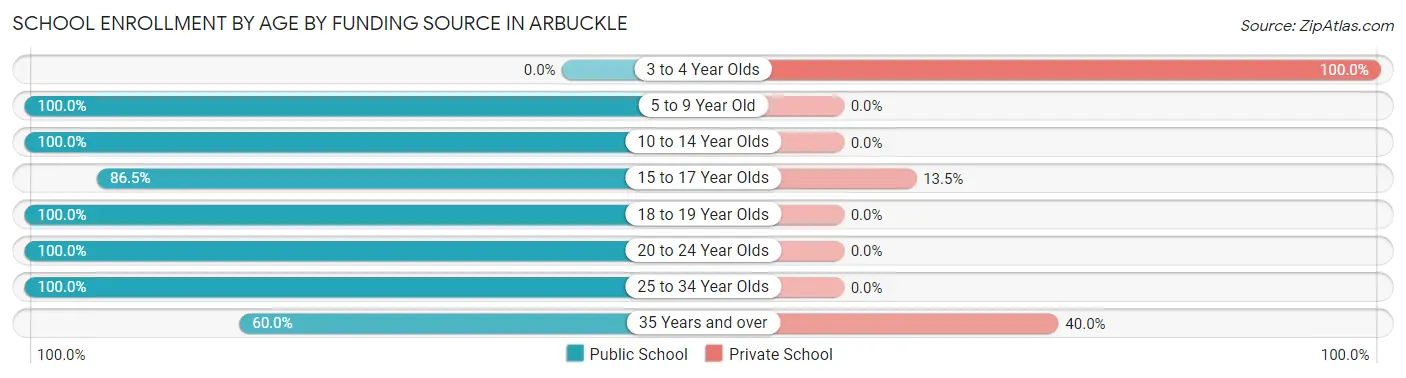
| Age Bracket | Public School | Private School |
| 3 to 4 Year Olds | 0 (0.0%) | 21 (100.0%) |
| 5 to 9 Year Old | 133 (100.0%) | 0 (0.0%) |
| 10 to 14 Year Olds | 252 (100.0%) | 0 (0.0%) |
| 15 to 17 Year Olds | 64 (86.5%) | 10 (13.5%) |
| 18 to 19 Year Olds | 77 (100.0%) | 0 (0.0%) |
| 20 to 24 Year Olds | 17 (100.0%) | 0 (0.0%) |
| 25 to 34 Year Olds | 23 (100.0%) | 0 (0.0%) |
| 35 Years and over | 18 (60.0%) | 12 (40.0%) |
| Total | 584 (93.1%) | 43 (6.9%) |
Educational Attainment by Field of Study in Arbuckle
Liberal arts & history (56 | 32.6%), social sciences (39 | 22.7%), arts & humanities (21 | 12.2%), engineering (18 | 10.5%), and science & technology (11 | 6.4%) are the most common fields of study among 172 individuals in Arbuckle who have obtained a bachelor's degree or higher.
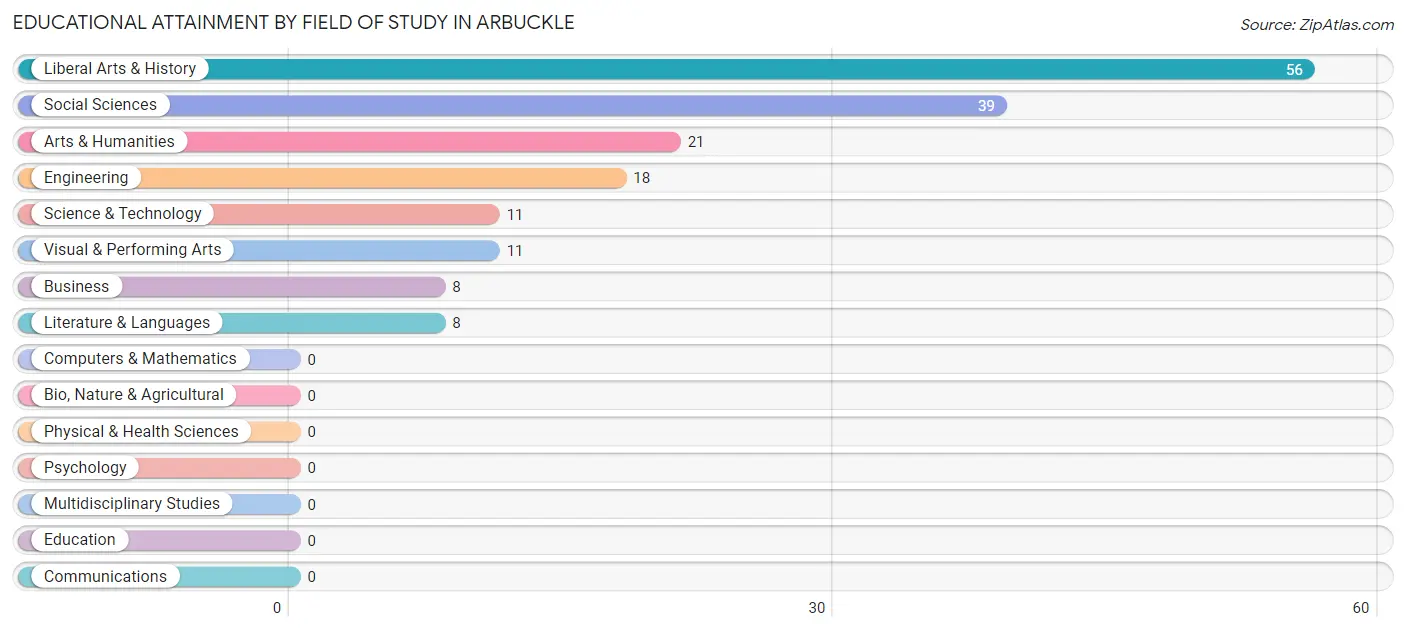
| Field of Study | # Graduates | % Graduates |
| Computers & Mathematics | 0 | 0.0% |
| Bio, Nature & Agricultural | 0 | 0.0% |
| Physical & Health Sciences | 0 | 0.0% |
| Psychology | 0 | 0.0% |
| Social Sciences | 39 | 22.7% |
| Engineering | 18 | 10.5% |
| Multidisciplinary Studies | 0 | 0.0% |
| Science & Technology | 11 | 6.4% |
| Business | 8 | 4.6% |
| Education | 0 | 0.0% |
| Literature & Languages | 8 | 4.6% |
| Liberal Arts & History | 56 | 32.6% |
| Visual & Performing Arts | 11 | 6.4% |
| Communications | 0 | 0.0% |
| Arts & Humanities | 21 | 12.2% |
| Total | 172 | 100.0% |
Transportation & Commute in Arbuckle
Vehicle Availability by Sex in Arbuckle
The most prevalent vehicle ownership categories in Arbuckle are males with 3 vehicles (414, accounting for 44.1%) and females with 3 vehicles (295, making up 71.8%).
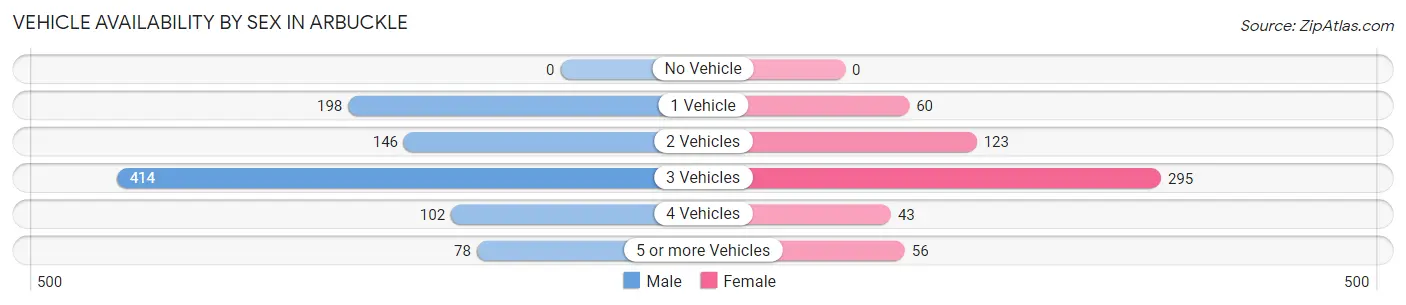
| Vehicles Available | Male | Female |
| No Vehicle | 0 (0.0%) | 0 (0.0%) |
| 1 Vehicle | 198 (21.1%) | 60 (10.4%) |
| 2 Vehicles | 146 (15.6%) | 123 (21.3%) |
| 3 Vehicles | 414 (44.1%) | 295 (51.1%) |
| 4 Vehicles | 102 (10.9%) | 43 (7.4%) |
| 5 or more Vehicles | 78 (8.3%) | 56 (9.7%) |
| Total | 938 (100.0%) | 577 (100.0%) |
Commute Time in Arbuckle
The most frequently occuring commute durations in Arbuckle are 30 to 34 minutes (376 commuters, 26.2%), 5 to 9 minutes (270 commuters, 18.8%), and 10 to 14 minutes (249 commuters, 17.4%).
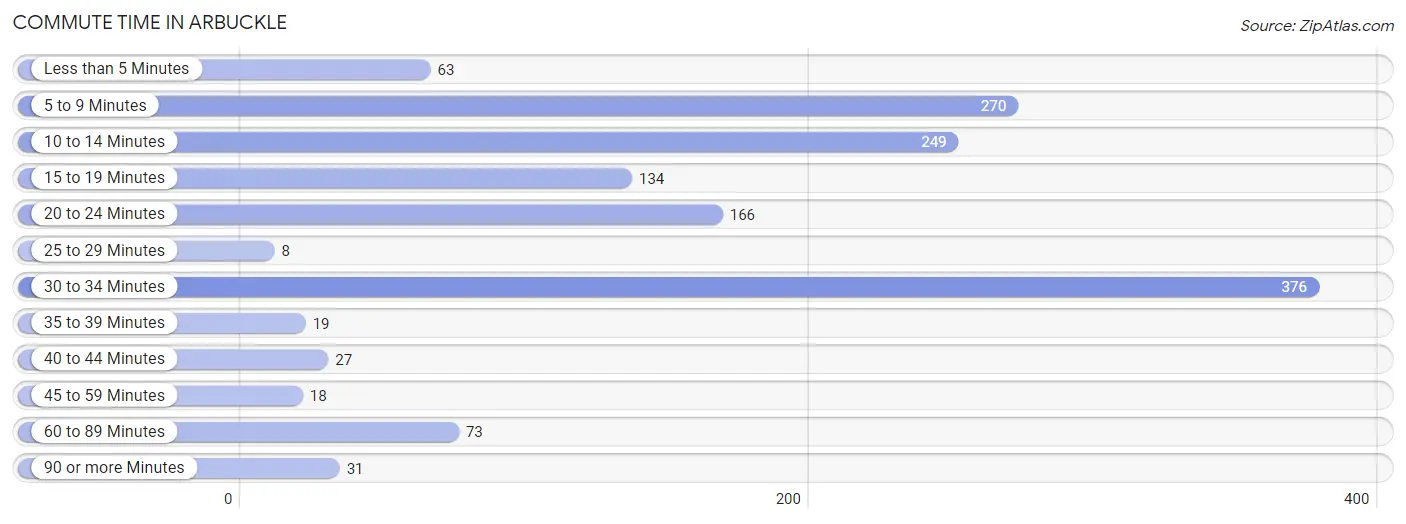
| Commute Time | # Commuters | % Commuters |
| Less than 5 Minutes | 63 | 4.4% |
| 5 to 9 Minutes | 270 | 18.8% |
| 10 to 14 Minutes | 249 | 17.4% |
| 15 to 19 Minutes | 134 | 9.3% |
| 20 to 24 Minutes | 166 | 11.6% |
| 25 to 29 Minutes | 8 | 0.6% |
| 30 to 34 Minutes | 376 | 26.2% |
| 35 to 39 Minutes | 19 | 1.3% |
| 40 to 44 Minutes | 27 | 1.9% |
| 45 to 59 Minutes | 18 | 1.3% |
| 60 to 89 Minutes | 73 | 5.1% |
| 90 or more Minutes | 31 | 2.2% |
Commute Time by Sex in Arbuckle
The most common commute times in Arbuckle are 30 to 34 minutes (236 commuters, 26.9%) for males and 5 to 9 minutes (173 commuters, 31.0%) for females.
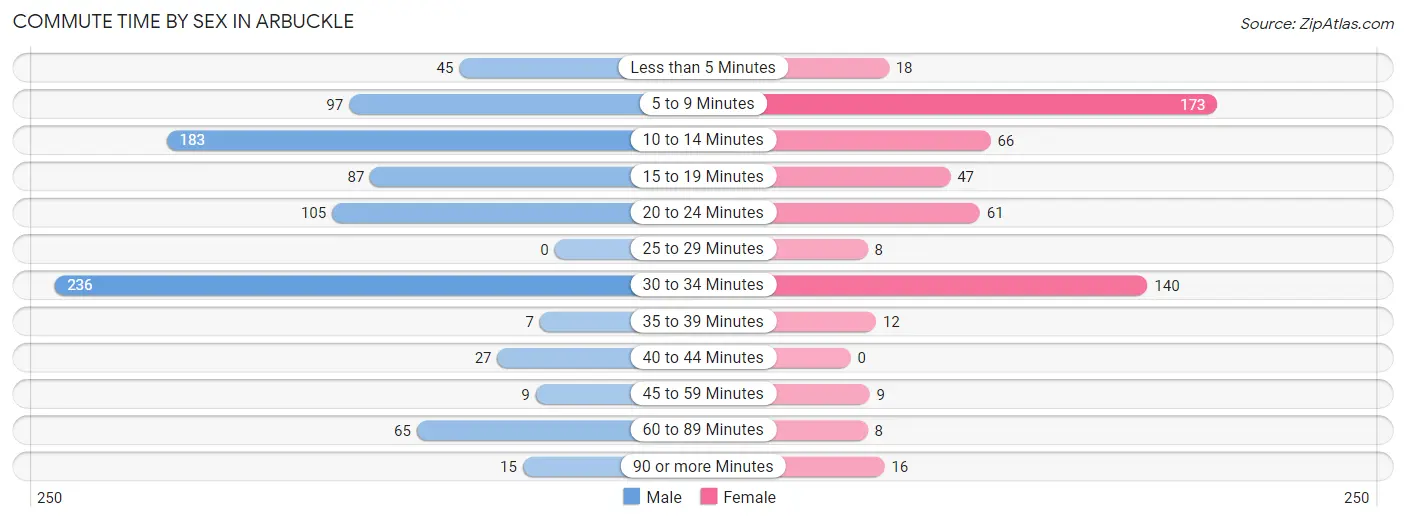
| Commute Time | Male | Female |
| Less than 5 Minutes | 45 (5.1%) | 18 (3.2%) |
| 5 to 9 Minutes | 97 (11.1%) | 173 (31.0%) |
| 10 to 14 Minutes | 183 (20.9%) | 66 (11.8%) |
| 15 to 19 Minutes | 87 (9.9%) | 47 (8.4%) |
| 20 to 24 Minutes | 105 (12.0%) | 61 (10.9%) |
| 25 to 29 Minutes | 0 (0.0%) | 8 (1.4%) |
| 30 to 34 Minutes | 236 (26.9%) | 140 (25.1%) |
| 35 to 39 Minutes | 7 (0.8%) | 12 (2.1%) |
| 40 to 44 Minutes | 27 (3.1%) | 0 (0.0%) |
| 45 to 59 Minutes | 9 (1.0%) | 9 (1.6%) |
| 60 to 89 Minutes | 65 (7.4%) | 8 (1.4%) |
| 90 or more Minutes | 15 (1.7%) | 16 (2.9%) |
Time of Departure to Work by Sex in Arbuckle
The most frequent times of departure to work in Arbuckle are 5:00 AM to 5:29 AM (202, 23.1%) for males and 5:30 AM to 5:59 AM (140, 25.1%) for females.
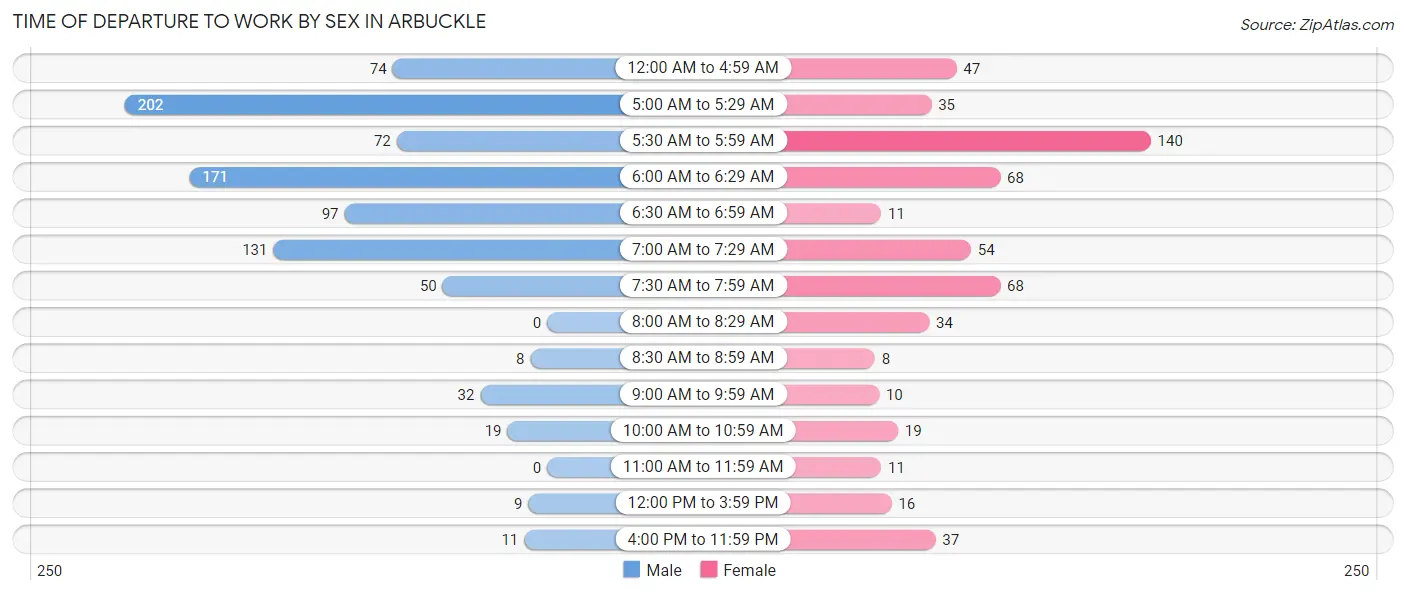
| Time of Departure | Male | Female |
| 12:00 AM to 4:59 AM | 74 (8.5%) | 47 (8.4%) |
| 5:00 AM to 5:29 AM | 202 (23.1%) | 35 (6.3%) |
| 5:30 AM to 5:59 AM | 72 (8.2%) | 140 (25.1%) |
| 6:00 AM to 6:29 AM | 171 (19.5%) | 68 (12.2%) |
| 6:30 AM to 6:59 AM | 97 (11.1%) | 11 (2.0%) |
| 7:00 AM to 7:29 AM | 131 (14.9%) | 54 (9.7%) |
| 7:30 AM to 7:59 AM | 50 (5.7%) | 68 (12.2%) |
| 8:00 AM to 8:29 AM | 0 (0.0%) | 34 (6.1%) |
| 8:30 AM to 8:59 AM | 8 (0.9%) | 8 (1.4%) |
| 9:00 AM to 9:59 AM | 32 (3.6%) | 10 (1.8%) |
| 10:00 AM to 10:59 AM | 19 (2.2%) | 19 (3.4%) |
| 11:00 AM to 11:59 AM | 0 (0.0%) | 11 (2.0%) |
| 12:00 PM to 3:59 PM | 9 (1.0%) | 16 (2.9%) |
| 4:00 PM to 11:59 PM | 11 (1.3%) | 37 (6.6%) |
| Total | 876 (100.0%) | 558 (100.0%) |
Housing Occupancy in Arbuckle
Occupancy by Ownership in Arbuckle
Of the total 751 dwellings in Arbuckle, owner-occupied units account for 491 (65.4%), while renter-occupied units make up 260 (34.6%).
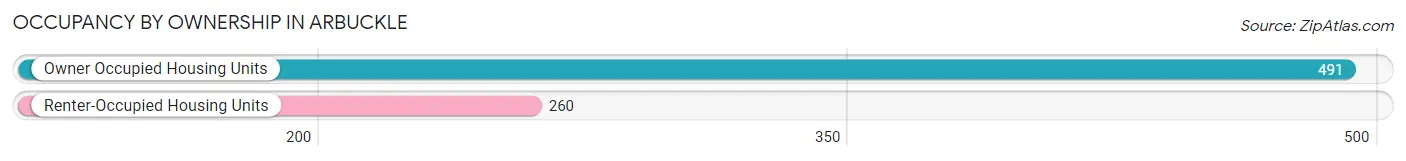
| Occupancy | # Housing Units | % Housing Units |
| Owner Occupied Housing Units | 491 | 65.4% |
| Renter-Occupied Housing Units | 260 | 34.6% |
| Total Occupied Housing Units | 751 | 100.0% |
Occupancy by Household Size in Arbuckle
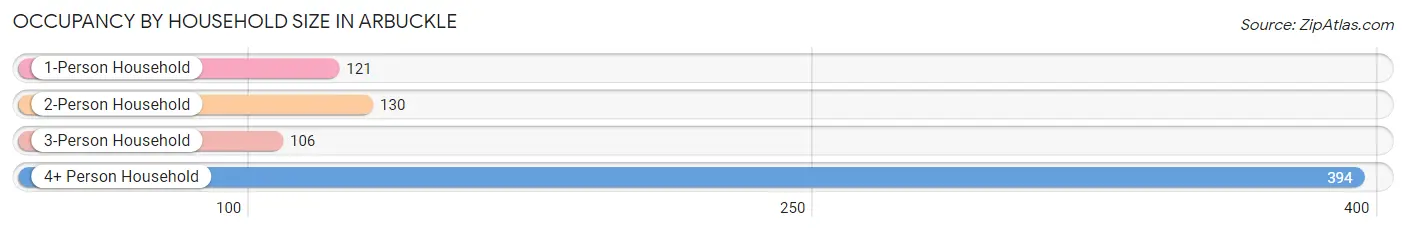
| Household Size | # Housing Units | % Housing Units |
| 1-Person Household | 121 | 16.1% |
| 2-Person Household | 130 | 17.3% |
| 3-Person Household | 106 | 14.1% |
| 4+ Person Household | 394 | 52.5% |
| Total Housing Units | 751 | 100.0% |
Occupancy by Ownership by Household Size in Arbuckle
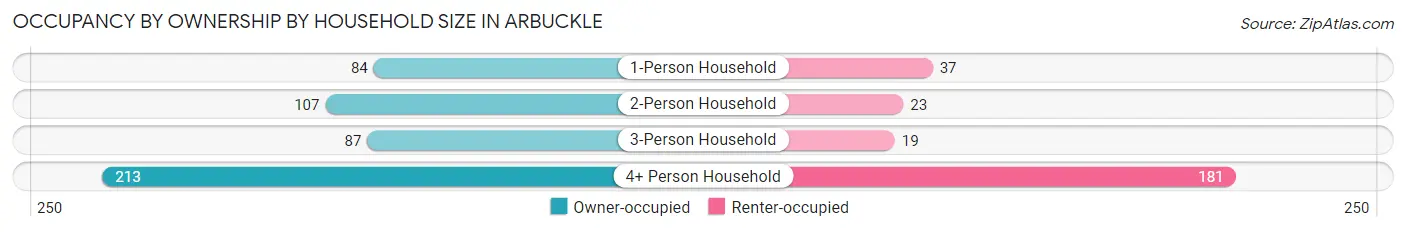
| Household Size | Owner-occupied | Renter-occupied |
| 1-Person Household | 84 (69.4%) | 37 (30.6%) |
| 2-Person Household | 107 (82.3%) | 23 (17.7%) |
| 3-Person Household | 87 (82.1%) | 19 (17.9%) |
| 4+ Person Household | 213 (54.1%) | 181 (45.9%) |
| Total Housing Units | 491 (65.4%) | 260 (34.6%) |
Occupancy by Educational Attainment in Arbuckle
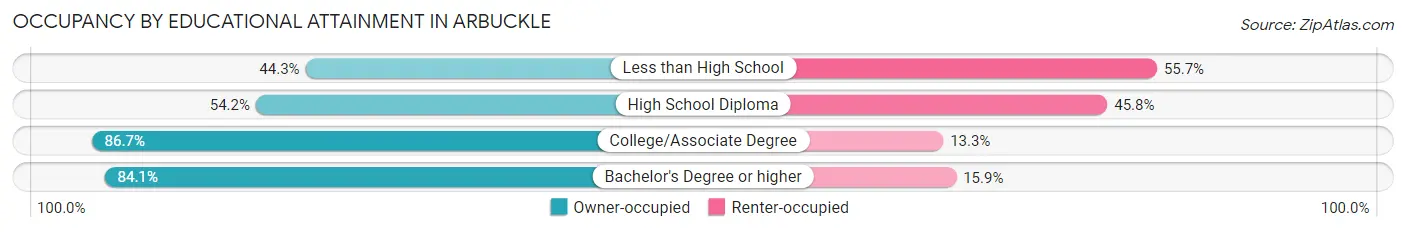
| Household Size | Owner-occupied | Renter-occupied |
| Less than High School | 125 (44.3%) | 157 (55.7%) |
| High School Diploma | 65 (54.2%) | 55 (45.8%) |
| College/Associate Degree | 248 (86.7%) | 38 (13.3%) |
| Bachelor's Degree or higher | 53 (84.1%) | 10 (15.9%) |
Occupancy by Age of Householder in Arbuckle
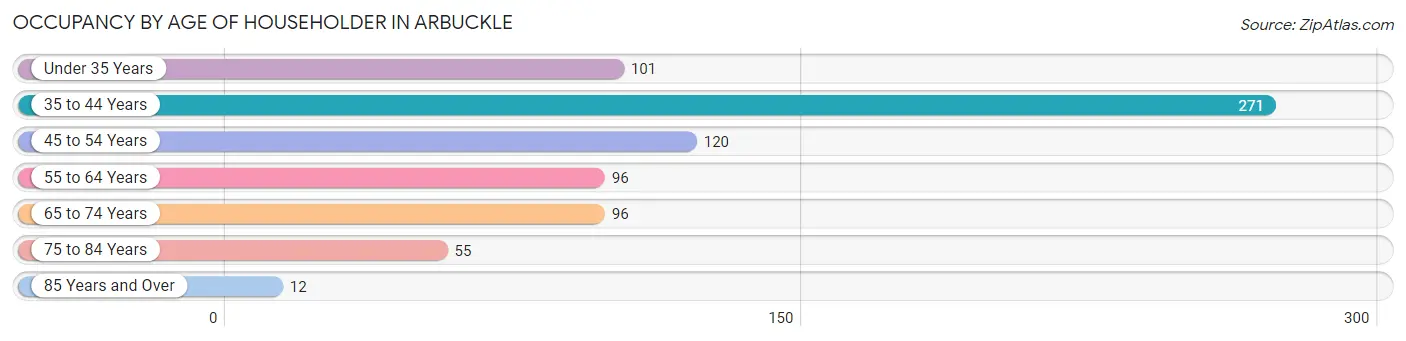
| Age Bracket | # Households | % Households |
| Under 35 Years | 101 | 13.5% |
| 35 to 44 Years | 271 | 36.1% |
| 45 to 54 Years | 120 | 16.0% |
| 55 to 64 Years | 96 | 12.8% |
| 65 to 74 Years | 96 | 12.8% |
| 75 to 84 Years | 55 | 7.3% |
| 85 Years and Over | 12 | 1.6% |
| Total | 751 | 100.0% |
Housing Finances in Arbuckle
Median Income by Occupancy in Arbuckle
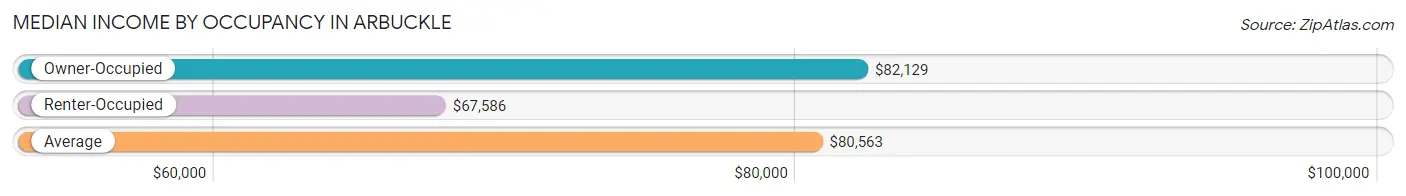
| Occupancy Type | # Households | Median Income |
| Owner-Occupied | 491 (65.4%) | $82,129 |
| Renter-Occupied | 260 (34.6%) | $67,586 |
| Average | 751 (100.0%) | $80,563 |
Occupancy by Householder Income Bracket in Arbuckle
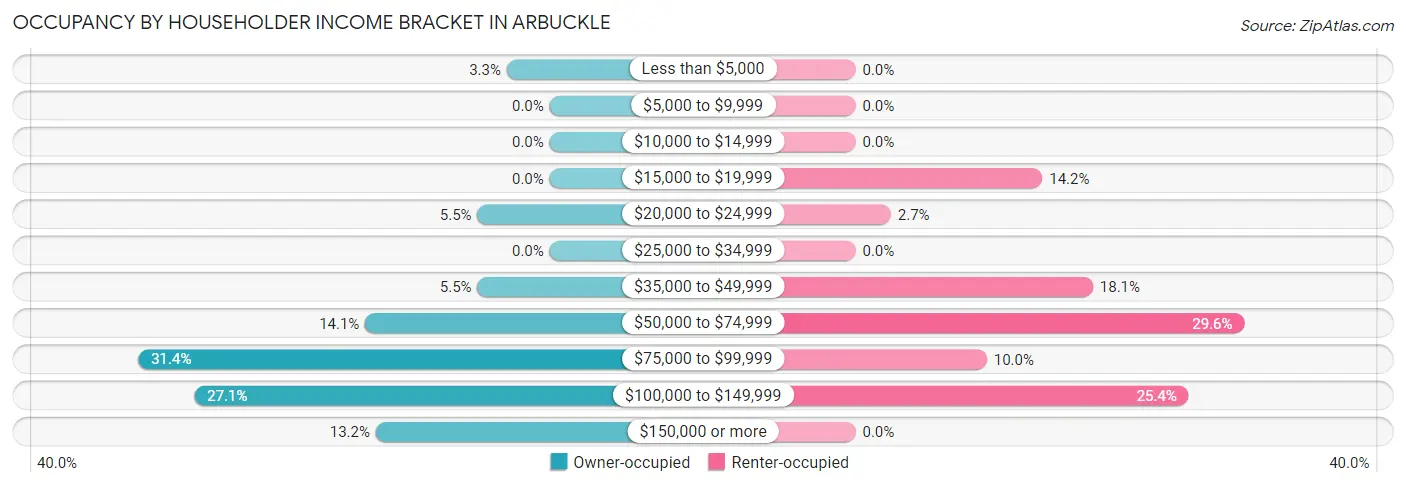
| Income Bracket | Owner-occupied | Renter-occupied |
| Less than $5,000 | 16 (3.3%) | 0 (0.0%) |
| $5,000 to $9,999 | 0 (0.0%) | 0 (0.0%) |
| $10,000 to $14,999 | 0 (0.0%) | 0 (0.0%) |
| $15,000 to $19,999 | 0 (0.0%) | 37 (14.2%) |
| $20,000 to $24,999 | 27 (5.5%) | 7 (2.7%) |
| $25,000 to $34,999 | 0 (0.0%) | 0 (0.0%) |
| $35,000 to $49,999 | 27 (5.5%) | 47 (18.1%) |
| $50,000 to $74,999 | 69 (14.1%) | 77 (29.6%) |
| $75,000 to $99,999 | 154 (31.4%) | 26 (10.0%) |
| $100,000 to $149,999 | 133 (27.1%) | 66 (25.4%) |
| $150,000 or more | 65 (13.2%) | 0 (0.0%) |
| Total | 491 (100.0%) | 260 (100.0%) |
Monthly Housing Cost Tiers in Arbuckle
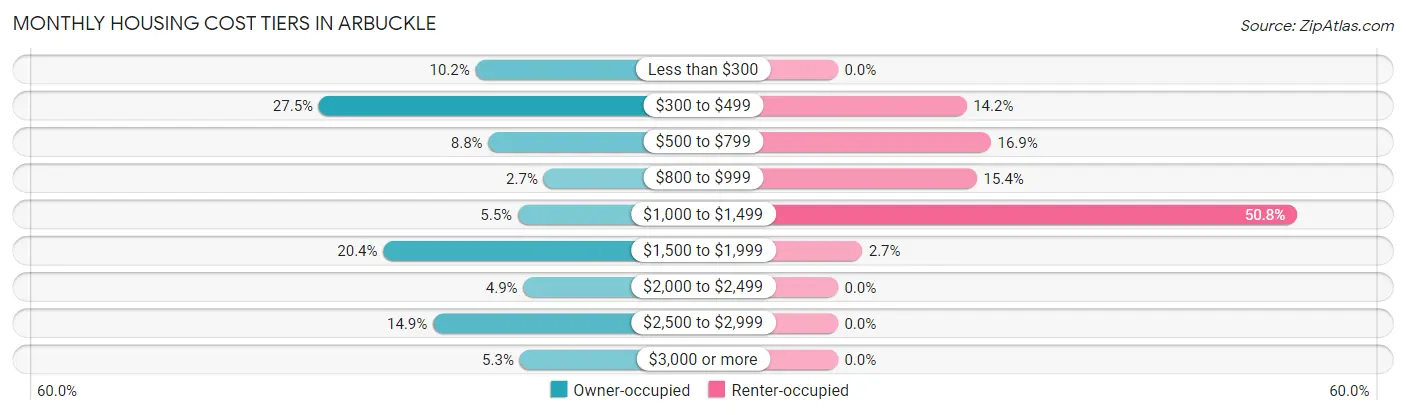
| Monthly Cost | Owner-occupied | Renter-occupied |
| Less than $300 | 50 (10.2%) | 0 (0.0%) |
| $300 to $499 | 135 (27.5%) | 37 (14.2%) |
| $500 to $799 | 43 (8.8%) | 44 (16.9%) |
| $800 to $999 | 13 (2.6%) | 40 (15.4%) |
| $1,000 to $1,499 | 27 (5.5%) | 132 (50.8%) |
| $1,500 to $1,999 | 100 (20.4%) | 7 (2.7%) |
| $2,000 to $2,499 | 24 (4.9%) | 0 (0.0%) |
| $2,500 to $2,999 | 73 (14.9%) | 0 (0.0%) |
| $3,000 or more | 26 (5.3%) | 0 (0.0%) |
| Total | 491 (100.0%) | 260 (100.0%) |
Physical Housing Characteristics in Arbuckle
Housing Structures in Arbuckle
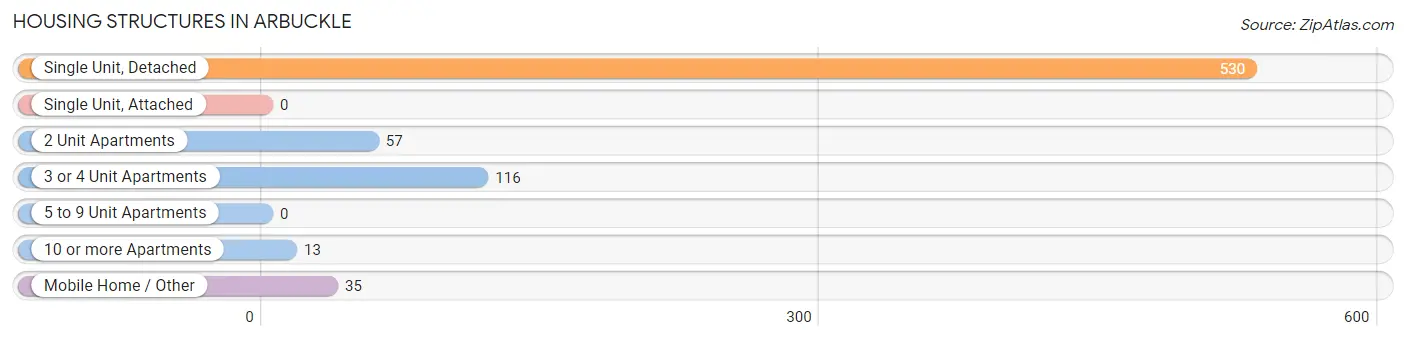
| Structure Type | # Housing Units | % Housing Units |
| Single Unit, Detached | 530 | 70.6% |
| Single Unit, Attached | 0 | 0.0% |
| 2 Unit Apartments | 57 | 7.6% |
| 3 or 4 Unit Apartments | 116 | 15.4% |
| 5 to 9 Unit Apartments | 0 | 0.0% |
| 10 or more Apartments | 13 | 1.7% |
| Mobile Home / Other | 35 | 4.7% |
| Total | 751 | 100.0% |
Housing Structures by Occupancy in Arbuckle
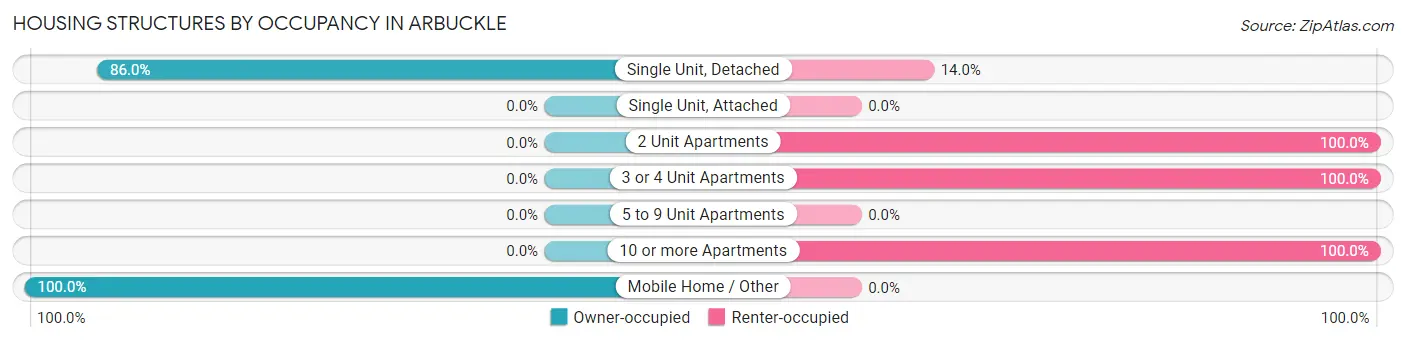
| Structure Type | Owner-occupied | Renter-occupied |
| Single Unit, Detached | 456 (86.0%) | 74 (14.0%) |
| Single Unit, Attached | 0 (0.0%) | 0 (0.0%) |
| 2 Unit Apartments | 0 (0.0%) | 57 (100.0%) |
| 3 or 4 Unit Apartments | 0 (0.0%) | 116 (100.0%) |
| 5 to 9 Unit Apartments | 0 (0.0%) | 0 (0.0%) |
| 10 or more Apartments | 0 (0.0%) | 13 (100.0%) |
| Mobile Home / Other | 35 (100.0%) | 0 (0.0%) |
| Total | 491 (65.4%) | 260 (34.6%) |
Housing Structures by Number of Rooms in Arbuckle
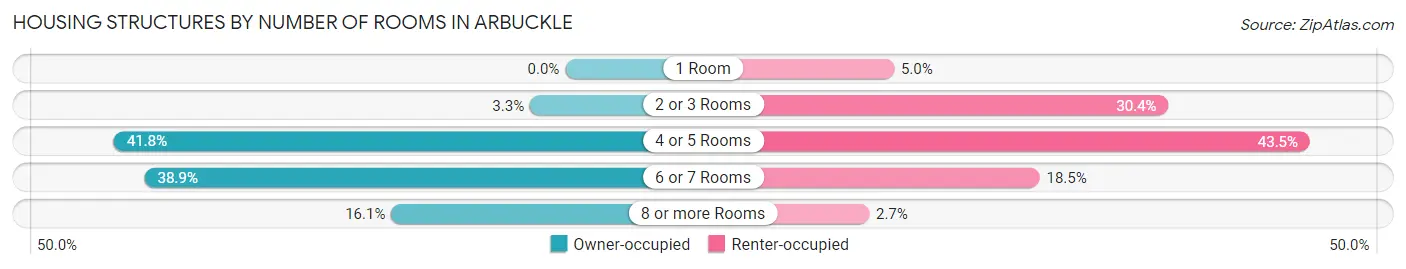
| Number of Rooms | Owner-occupied | Renter-occupied |
| 1 Room | 0 (0.0%) | 13 (5.0%) |
| 2 or 3 Rooms | 16 (3.3%) | 79 (30.4%) |
| 4 or 5 Rooms | 205 (41.7%) | 113 (43.5%) |
| 6 or 7 Rooms | 191 (38.9%) | 48 (18.5%) |
| 8 or more Rooms | 79 (16.1%) | 7 (2.7%) |
| Total | 491 (100.0%) | 260 (100.0%) |
Housing Structure by Heating Type in Arbuckle
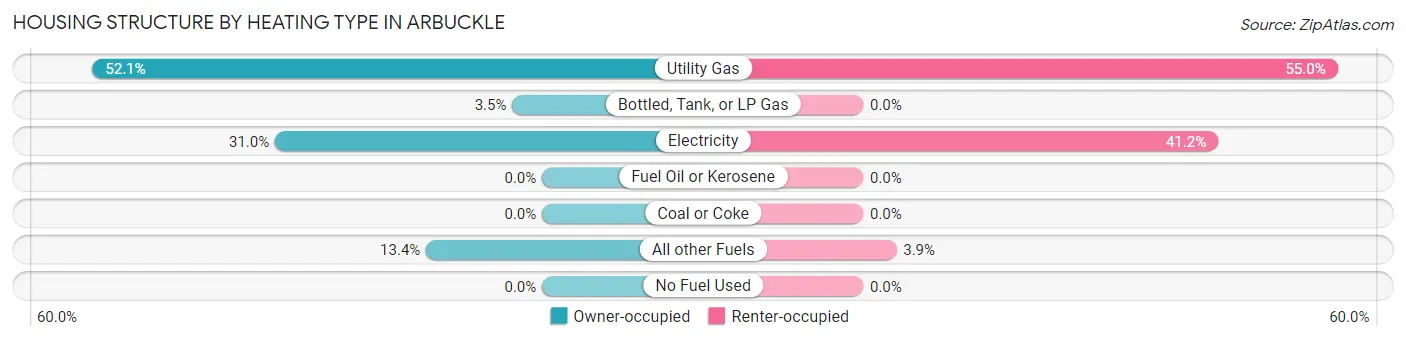
| Heating Type | Owner-occupied | Renter-occupied |
| Utility Gas | 256 (52.1%) | 143 (55.0%) |
| Bottled, Tank, or LP Gas | 17 (3.5%) | 0 (0.0%) |
| Electricity | 152 (31.0%) | 107 (41.1%) |
| Fuel Oil or Kerosene | 0 (0.0%) | 0 (0.0%) |
| Coal or Coke | 0 (0.0%) | 0 (0.0%) |
| All other Fuels | 66 (13.4%) | 10 (3.8%) |
| No Fuel Used | 0 (0.0%) | 0 (0.0%) |
| Total | 491 (100.0%) | 260 (100.0%) |
Household Vehicle Usage in Arbuckle
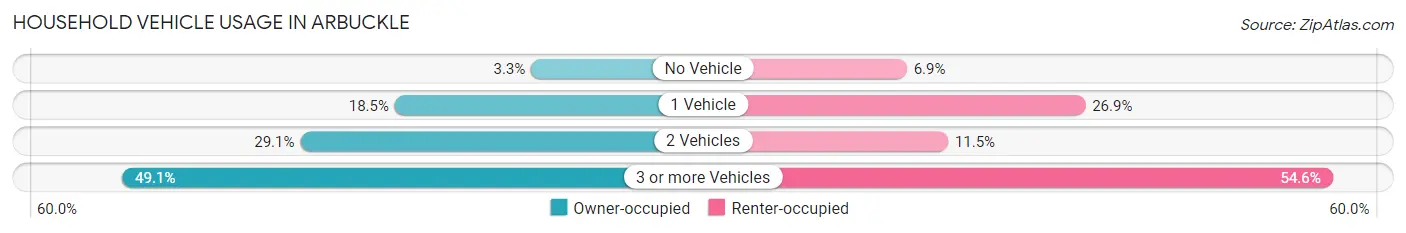
| Vehicles per Household | Owner-occupied | Renter-occupied |
| No Vehicle | 16 (3.3%) | 18 (6.9%) |
| 1 Vehicle | 91 (18.5%) | 70 (26.9%) |
| 2 Vehicles | 143 (29.1%) | 30 (11.5%) |
| 3 or more Vehicles | 241 (49.1%) | 142 (54.6%) |
| Total | 491 (100.0%) | 260 (100.0%) |
Real Estate & Mortgages in Arbuckle
Real Estate and Mortgage Overview in Arbuckle
| Characteristic | Without Mortgage | With Mortgage |
| Housing Units | 230 | 261 |
| Median Property Value | $346,400 | $356,600 |
| Median Household Income | $81,179 | $57 |
| Monthly Housing Costs | $434 | $26 |
| Real Estate Taxes | $1,554 | $10 |
Property Value by Mortgage Status in Arbuckle
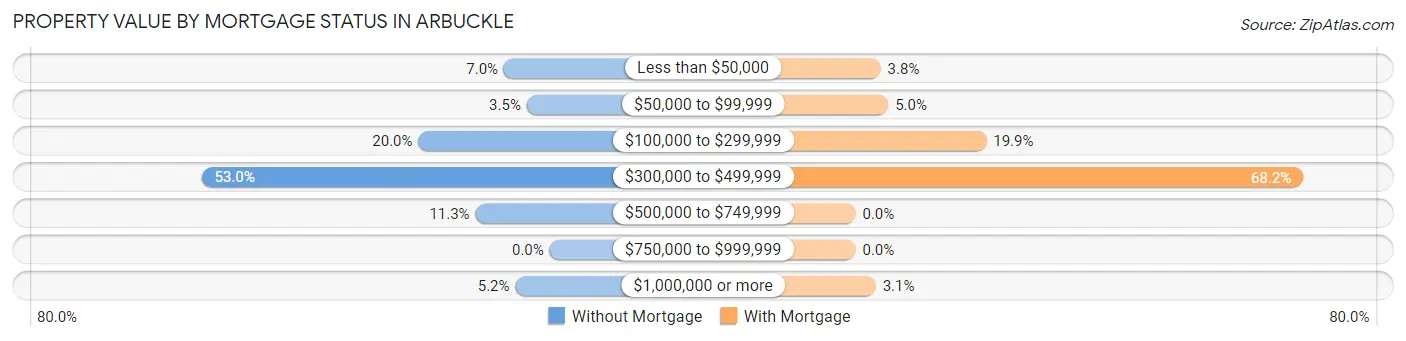
| Property Value | Without Mortgage | With Mortgage |
| Less than $50,000 | 16 (7.0%) | 10 (3.8%) |
| $50,000 to $99,999 | 8 (3.5%) | 13 (5.0%) |
| $100,000 to $299,999 | 46 (20.0%) | 52 (19.9%) |
| $300,000 to $499,999 | 122 (53.0%) | 178 (68.2%) |
| $500,000 to $749,999 | 26 (11.3%) | 0 (0.0%) |
| $750,000 to $999,999 | 0 (0.0%) | 0 (0.0%) |
| $1,000,000 or more | 12 (5.2%) | 8 (3.1%) |
| Total | 230 (100.0%) | 261 (100.0%) |
Household Income by Mortgage Status in Arbuckle
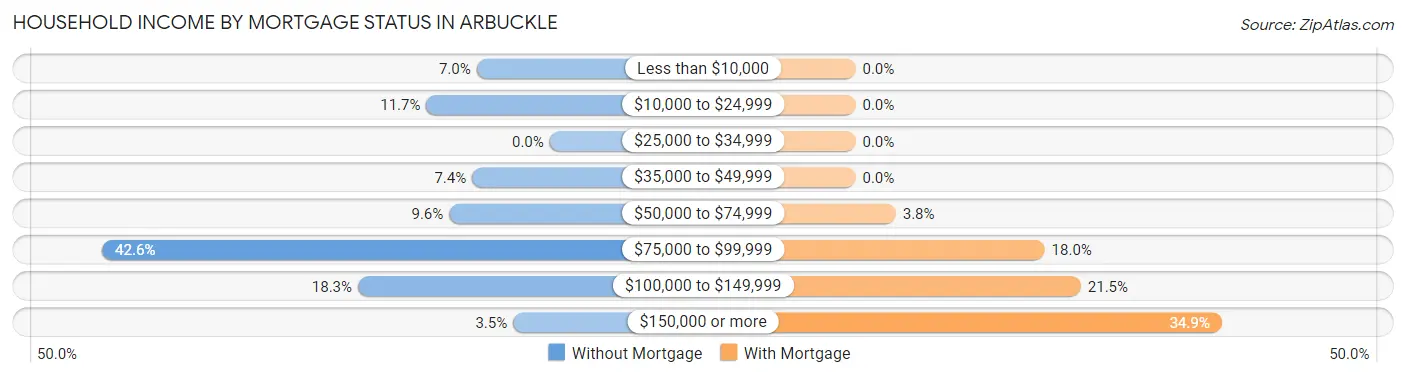
| Household Income | Without Mortgage | With Mortgage |
| Less than $10,000 | 16 (7.0%) | 0 (0.0%) |
| $10,000 to $24,999 | 27 (11.7%) | 0 (0.0%) |
| $25,000 to $34,999 | 0 (0.0%) | 0 (0.0%) |
| $35,000 to $49,999 | 17 (7.4%) | 0 (0.0%) |
| $50,000 to $74,999 | 22 (9.6%) | 10 (3.8%) |
| $75,000 to $99,999 | 98 (42.6%) | 47 (18.0%) |
| $100,000 to $149,999 | 42 (18.3%) | 56 (21.5%) |
| $150,000 or more | 8 (3.5%) | 91 (34.9%) |
| Total | 230 (100.0%) | 261 (100.0%) |
Property Value to Household Income Ratio in Arbuckle
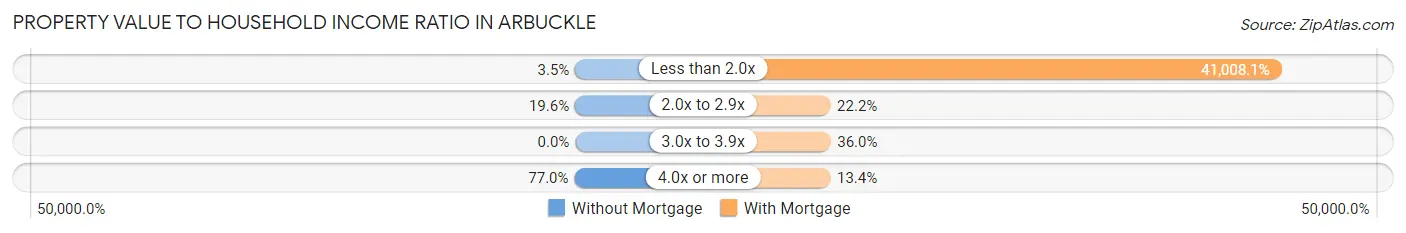
| Value-to-Income Ratio | Without Mortgage | With Mortgage |
| Less than 2.0x | 8 (3.5%) | 107,031 (41,008.0%) |
| 2.0x to 2.9x | 45 (19.6%) | 58 (22.2%) |
| 3.0x to 3.9x | 0 (0.0%) | 94 (36.0%) |
| 4.0x or more | 177 (77.0%) | 35 (13.4%) |
| Total | 230 (100.0%) | 261 (100.0%) |
Real Estate Taxes by Mortgage Status in Arbuckle
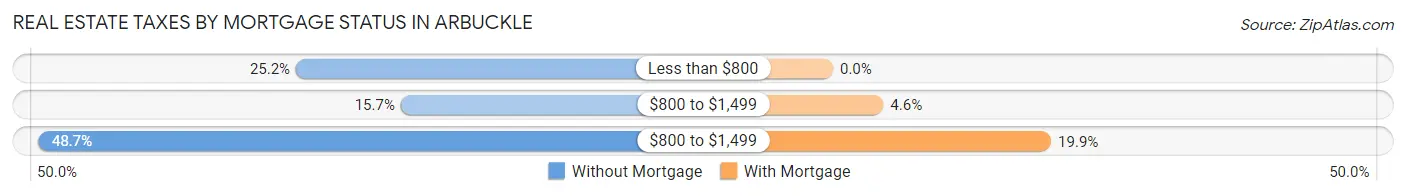
| Property Taxes | Without Mortgage | With Mortgage |
| Less than $800 | 58 (25.2%) | 0 (0.0%) |
| $800 to $1,499 | 36 (15.7%) | 12 (4.6%) |
| $800 to $1,499 | 112 (48.7%) | 52 (19.9%) |
| Total | 230 (100.0%) | 261 (100.0%) |
Health & Disability in Arbuckle
Health Insurance Coverage by Age in Arbuckle
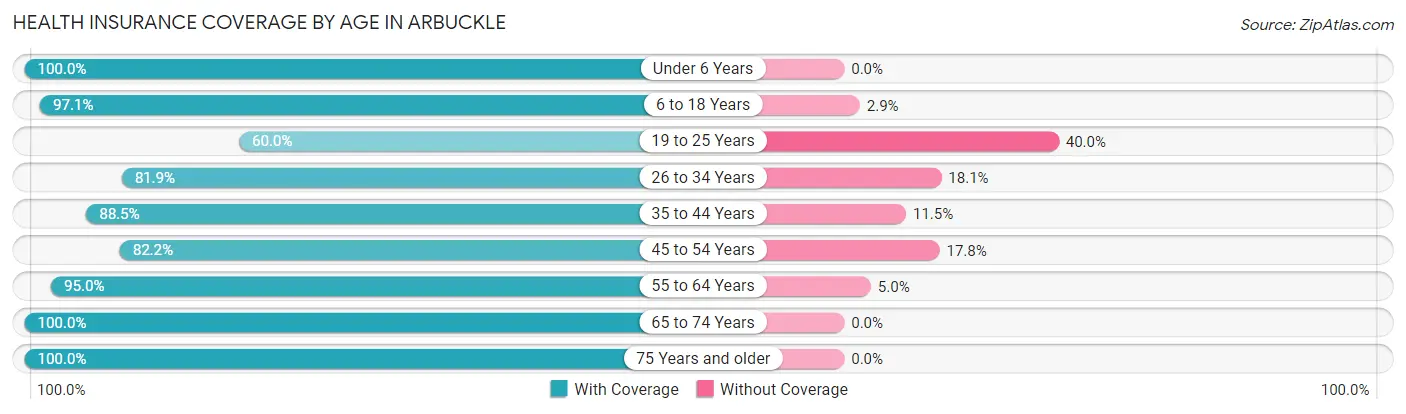
| Age Bracket | With Coverage | Without Coverage |
| Under 6 Years | 305 (100.0%) | 0 (0.0%) |
| 6 to 18 Years | 502 (97.1%) | 15 (2.9%) |
| 19 to 25 Years | 309 (60.0%) | 206 (40.0%) |
| 26 to 34 Years | 330 (81.9%) | 73 (18.1%) |
| 35 to 44 Years | 369 (88.5%) | 48 (11.5%) |
| 45 to 54 Years | 301 (82.2%) | 65 (17.8%) |
| 55 to 64 Years | 230 (95.0%) | 12 (5.0%) |
| 65 to 74 Years | 218 (100.0%) | 0 (0.0%) |
| 75 Years and older | 89 (100.0%) | 0 (0.0%) |
| Total | 2,653 (86.4%) | 419 (13.6%) |
Health Insurance Coverage by Citizenship Status in Arbuckle
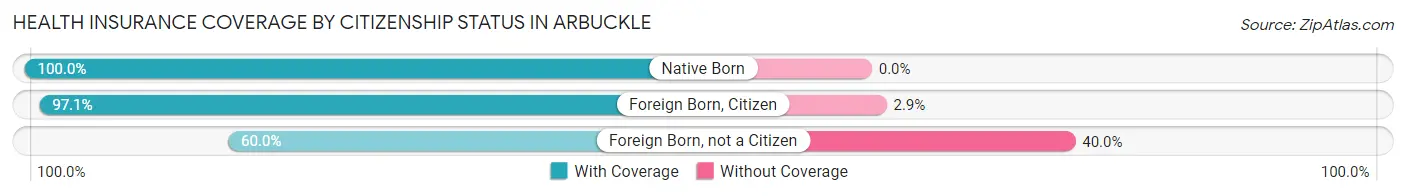
| Citizenship Status | With Coverage | Without Coverage |
| Native Born | 305 (100.0%) | 0 (0.0%) |
| Foreign Born, Citizen | 502 (97.1%) | 15 (2.9%) |
| Foreign Born, not a Citizen | 309 (60.0%) | 206 (40.0%) |
Health Insurance Coverage by Household Income in Arbuckle
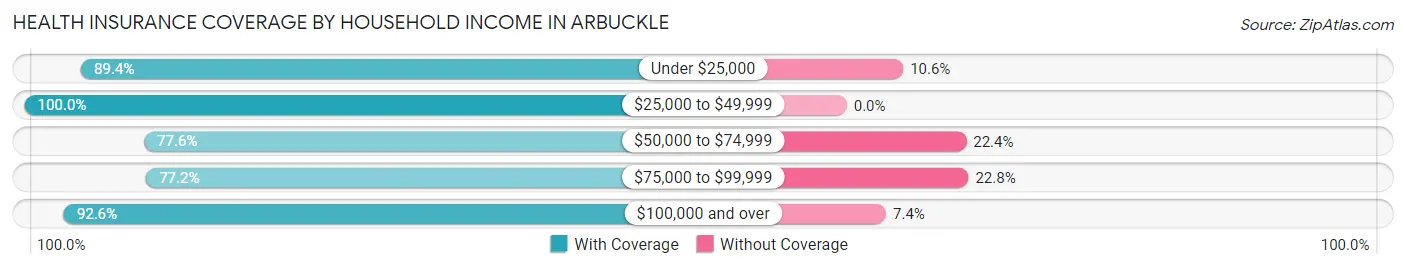
| Household Income | With Coverage | Without Coverage |
| Under $25,000 | 110 (89.4%) | 13 (10.6%) |
| $25,000 to $49,999 | 338 (100.0%) | 0 (0.0%) |
| $50,000 to $74,999 | 496 (77.6%) | 143 (22.4%) |
| $75,000 to $99,999 | 589 (77.2%) | 174 (22.8%) |
| $100,000 and over | 1,120 (92.6%) | 89 (7.4%) |
Public vs Private Health Insurance Coverage by Age in Arbuckle
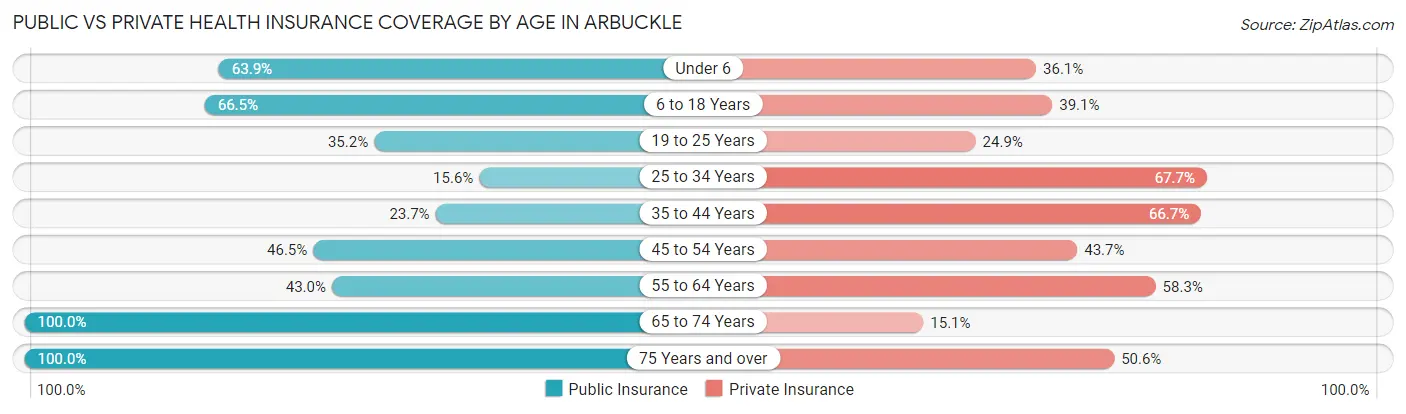
| Age Bracket | Public Insurance | Private Insurance |
| Under 6 | 195 (63.9%) | 110 (36.1%) |
| 6 to 18 Years | 344 (66.5%) | 202 (39.1%) |
| 19 to 25 Years | 181 (35.1%) | 128 (24.8%) |
| 25 to 34 Years | 63 (15.6%) | 273 (67.7%) |
| 35 to 44 Years | 99 (23.7%) | 278 (66.7%) |
| 45 to 54 Years | 170 (46.5%) | 160 (43.7%) |
| 55 to 64 Years | 104 (43.0%) | 141 (58.3%) |
| 65 to 74 Years | 218 (100.0%) | 33 (15.1%) |
| 75 Years and over | 89 (100.0%) | 45 (50.6%) |
| Total | 1,463 (47.6%) | 1,370 (44.6%) |
Disability Status by Sex by Age in Arbuckle
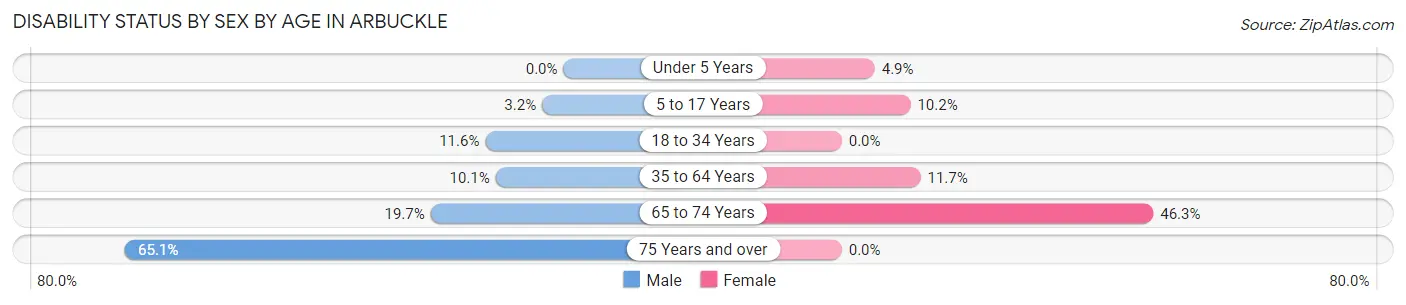
| Age Bracket | Male | Female |
| Under 5 Years | 0 (0.0%) | 7 (4.9%) |
| 5 to 17 Years | 10 (3.2%) | 20 (10.2%) |
| 18 to 34 Years | 63 (11.6%) | 0 (0.0%) |
| 35 to 64 Years | 55 (10.1%) | 56 (11.7%) |
| 65 to 74 Years | 14 (19.7%) | 68 (46.3%) |
| 75 Years and over | 41 (65.1%) | 0 (0.0%) |
Disability Class by Sex by Age in Arbuckle
Disability Class: Hearing Difficulty
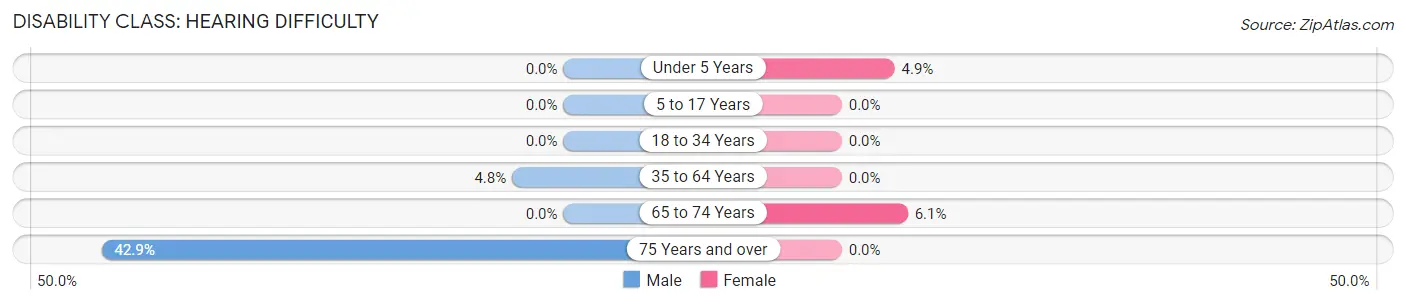
| Age Bracket | Male | Female |
| Under 5 Years | 0 (0.0%) | 7 (4.9%) |
| 5 to 17 Years | 0 (0.0%) | 0 (0.0%) |
| 18 to 34 Years | 0 (0.0%) | 0 (0.0%) |
| 35 to 64 Years | 26 (4.8%) | 0 (0.0%) |
| 65 to 74 Years | 0 (0.0%) | 9 (6.1%) |
| 75 Years and over | 27 (42.9%) | 0 (0.0%) |
Disability Class: Vision Difficulty
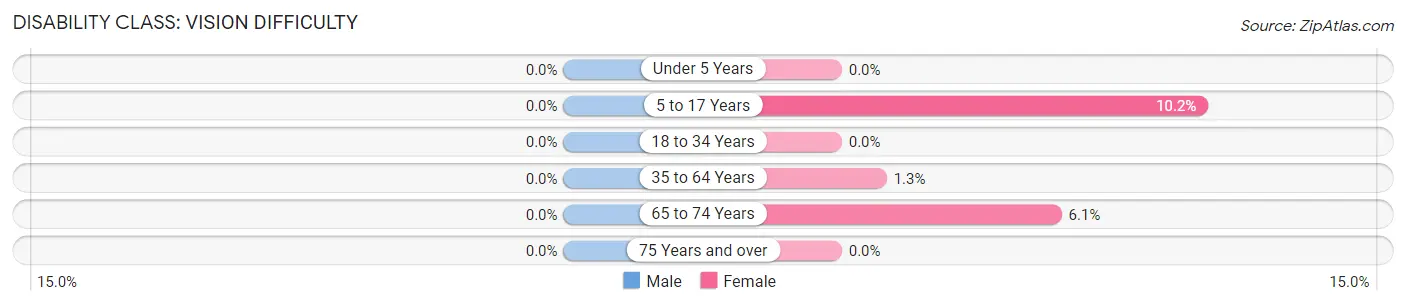
| Age Bracket | Male | Female |
| Under 5 Years | 0 (0.0%) | 0 (0.0%) |
| 5 to 17 Years | 0 (0.0%) | 20 (10.2%) |
| 18 to 34 Years | 0 (0.0%) | 0 (0.0%) |
| 35 to 64 Years | 0 (0.0%) | 6 (1.3%) |
| 65 to 74 Years | 0 (0.0%) | 9 (6.1%) |
| 75 Years and over | 0 (0.0%) | 0 (0.0%) |
Disability Class: Cognitive Difficulty
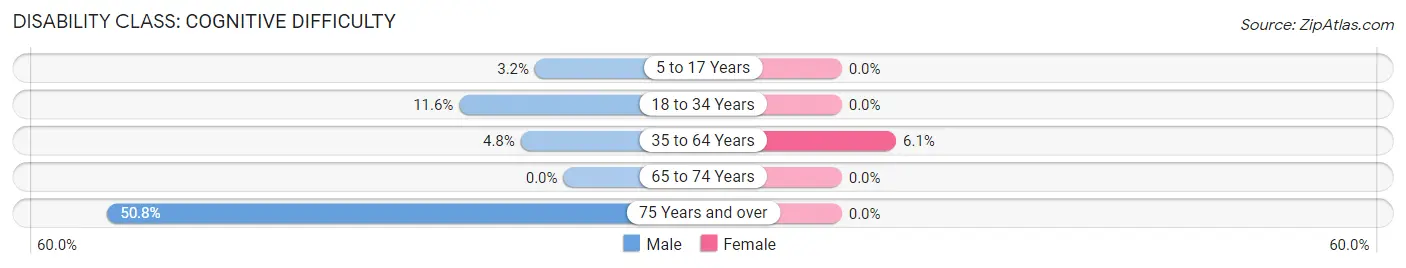
| Age Bracket | Male | Female |
| 5 to 17 Years | 10 (3.2%) | 0 (0.0%) |
| 18 to 34 Years | 63 (11.6%) | 0 (0.0%) |
| 35 to 64 Years | 26 (4.8%) | 29 (6.0%) |
| 65 to 74 Years | 0 (0.0%) | 0 (0.0%) |
| 75 Years and over | 32 (50.8%) | 0 (0.0%) |
Disability Class: Ambulatory Difficulty
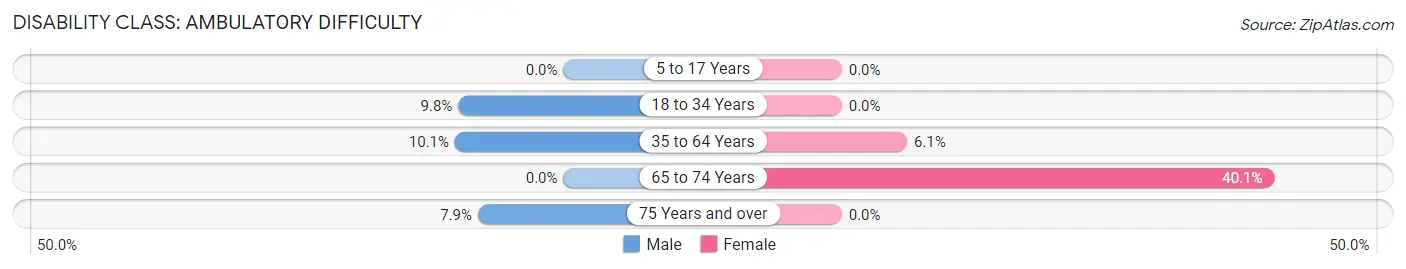
| Age Bracket | Male | Female |
| 5 to 17 Years | 0 (0.0%) | 0 (0.0%) |
| 18 to 34 Years | 53 (9.8%) | 0 (0.0%) |
| 35 to 64 Years | 55 (10.1%) | 29 (6.0%) |
| 65 to 74 Years | 0 (0.0%) | 59 (40.1%) |
| 75 Years and over | 5 (7.9%) | 0 (0.0%) |
Disability Class: Self-Care Difficulty
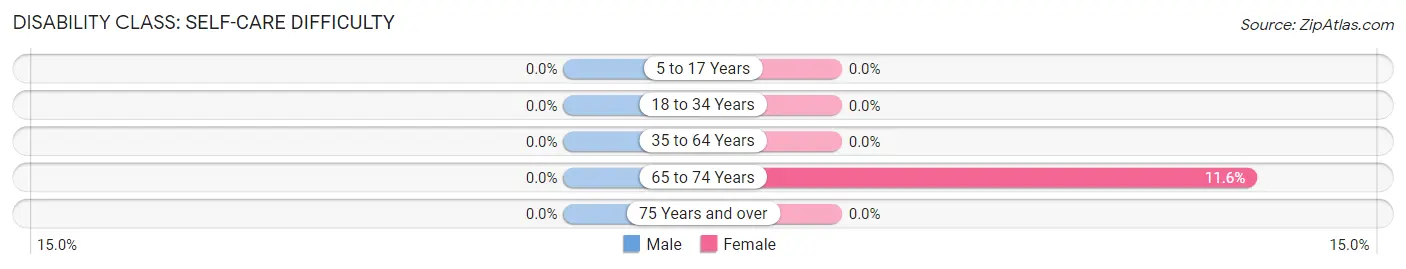
| Age Bracket | Male | Female |
| 5 to 17 Years | 0 (0.0%) | 0 (0.0%) |
| 18 to 34 Years | 0 (0.0%) | 0 (0.0%) |
| 35 to 64 Years | 0 (0.0%) | 0 (0.0%) |
| 65 to 74 Years | 0 (0.0%) | 17 (11.6%) |
| 75 Years and over | 0 (0.0%) | 0 (0.0%) |
Technology Access in Arbuckle
Computing Device Access in Arbuckle
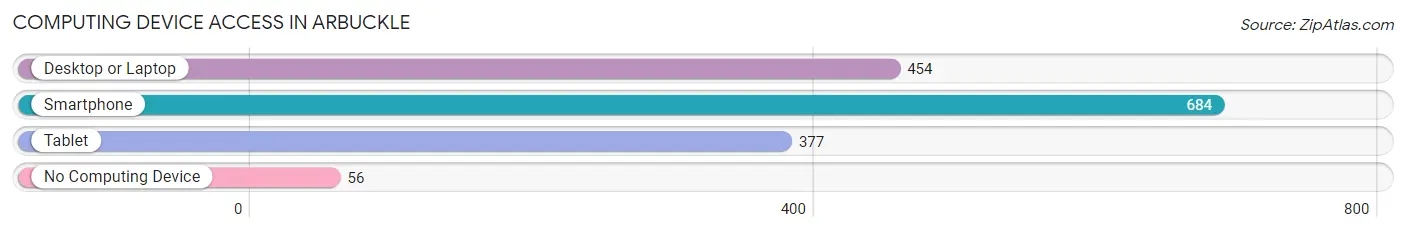
| Device Type | # Households | % Households |
| Desktop or Laptop | 454 | 60.5% |
| Smartphone | 684 | 91.1% |
| Tablet | 377 | 50.2% |
| No Computing Device | 56 | 7.5% |
| Total | 751 | 100.0% |
Internet Access in Arbuckle
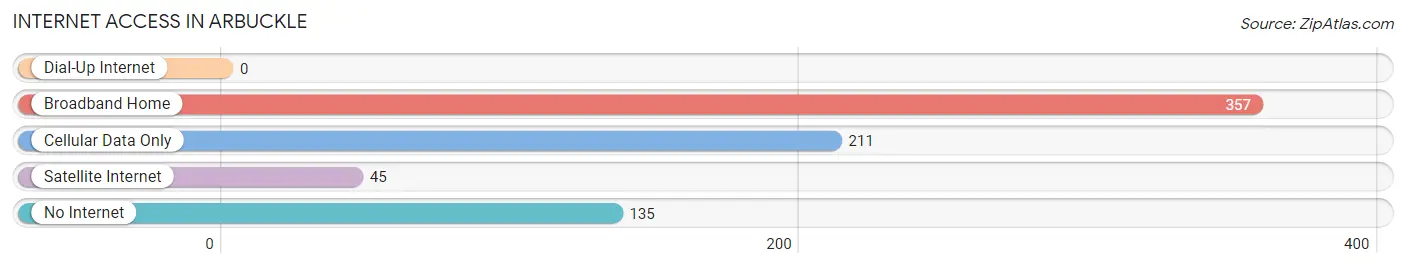
| Internet Type | # Households | % Households |
| Dial-Up Internet | 0 | 0.0% |
| Broadband Home | 357 | 47.5% |
| Cellular Data Only | 211 | 28.1% |
| Satellite Internet | 45 | 6.0% |
| No Internet | 135 | 18.0% |
| Total | 751 | 100.0% |
Arbuckle Summary
Arbuckle, California is a small town located in Colusa County, California. It is situated in the Sacramento Valley, approximately halfway between Sacramento and Chico. The town has a population of 1,154 people, according to the 2010 census.
History
Arbuckle was founded in 1868 by William Arbuckle, a rancher from Missouri. He purchased the land from the local Native American tribes and established a ranch. The town was named after him. In 1872, the first post office was established in Arbuckle. The town was incorporated in 1891.
In the early 1900s, Arbuckle was a thriving agricultural community. The town was known for its production of wheat, barley, and other grains. The town also had a thriving dairy industry. In the 1920s, the town began to decline as the agricultural industry shifted to other areas.
Geography
Arbuckle is located in the Sacramento Valley, approximately halfway between Sacramento and Chico. The town is situated at an elevation of approximately 200 feet above sea level. The climate is generally mild, with hot summers and cool winters.
The town is surrounded by rolling hills and farmland. The nearby Cache Creek runs through the town. The Cache Creek Wildlife Area is located nearby, providing a habitat for a variety of wildlife.
Economy
The economy of Arbuckle is largely based on agriculture. The town is known for its production of wheat, barley, and other grains. The town also has a thriving dairy industry.
In recent years, the town has seen an increase in tourism. The nearby Cache Creek Wildlife Area attracts visitors from all over the state. The town also has several wineries and tasting rooms.
Demographics
As of the 2010 census, the population of Arbuckle was 1,154. The racial makeup of the town was 75.3% White, 0.7% African American, 0.7% Native American, 0.3% Asian, 0.1% Pacific Islander, and 22.2% from other races. The median household income was $37,917.
The town is served by the Colusa County Unified School District. The town has one elementary school, one middle school, and one high school. The town also has a library and a community center.
Conclusion
Arbuckle, California is a small town located in Colusa County, California. It is situated in the Sacramento Valley, approximately halfway between Sacramento and Chico. The town has a population of 1,154 people, according to the 2010 census. The economy of Arbuckle is largely based on agriculture, with a thriving dairy industry and production of wheat, barley, and other grains. The town also has a growing tourism industry, with several wineries and tasting rooms. The town is served by the Colusa County Unified School District and has a library and a community center.
Common Questions
What is Per Capita Income in Arbuckle?
Per Capita income in Arbuckle is $24,207.
What is the Median Family Income in Arbuckle?
Median Family Income in Arbuckle is $81,123.
What is the Median Household income in Arbuckle?
Median Household Income in Arbuckle is $80,563.
What is Income or Wage Gap in Arbuckle?
Income or Wage Gap in Arbuckle is 45.9%.
Women in Arbuckle earn 54.1 cents for every dollar earned by a man.
What is Inequality or Gini Index in Arbuckle?
Inequality or Gini Index in Arbuckle is 0.33.
What is the Total Population of Arbuckle?
Total Population of Arbuckle is 3,072.
What is the Total Male Population of Arbuckle?
Total Male Population of Arbuckle is 1,652.
What is the Total Female Population of Arbuckle?
Total Female Population of Arbuckle is 1,420.
What is the Ratio of Males per 100 Females in Arbuckle?
There are 116.34 Males per 100 Females in Arbuckle.
What is the Ratio of Females per 100 Males in Arbuckle?
There are 85.96 Females per 100 Males in Arbuckle.
What is the Median Population Age in Arbuckle?
Median Population Age in Arbuckle is 29.6 Years.
What is the Average Family Size in Arbuckle
Average Family Size in Arbuckle is 4.8 People.
What is the Average Household Size in Arbuckle
Average Household Size in Arbuckle is 4.1 People.
How Large is the Labor Force in Arbuckle?
There are 1,547 People in the Labor Forcein in Arbuckle.
What is the Percentage of People in the Labor Force in Arbuckle?
66.4% of People are in the Labor Force in Arbuckle.
What is the Unemployment Rate in Arbuckle?
Unemployment Rate in Arbuckle is 1.5%.