Zip Codes with the Highest Percentage of Population Employed in Farming, Fishing & Forestry in Apple Valley, CA
RELATED REPORTS & OPTIONS
Farming, Fishing & Forestry
Apple Valley
Compare Zip Codes
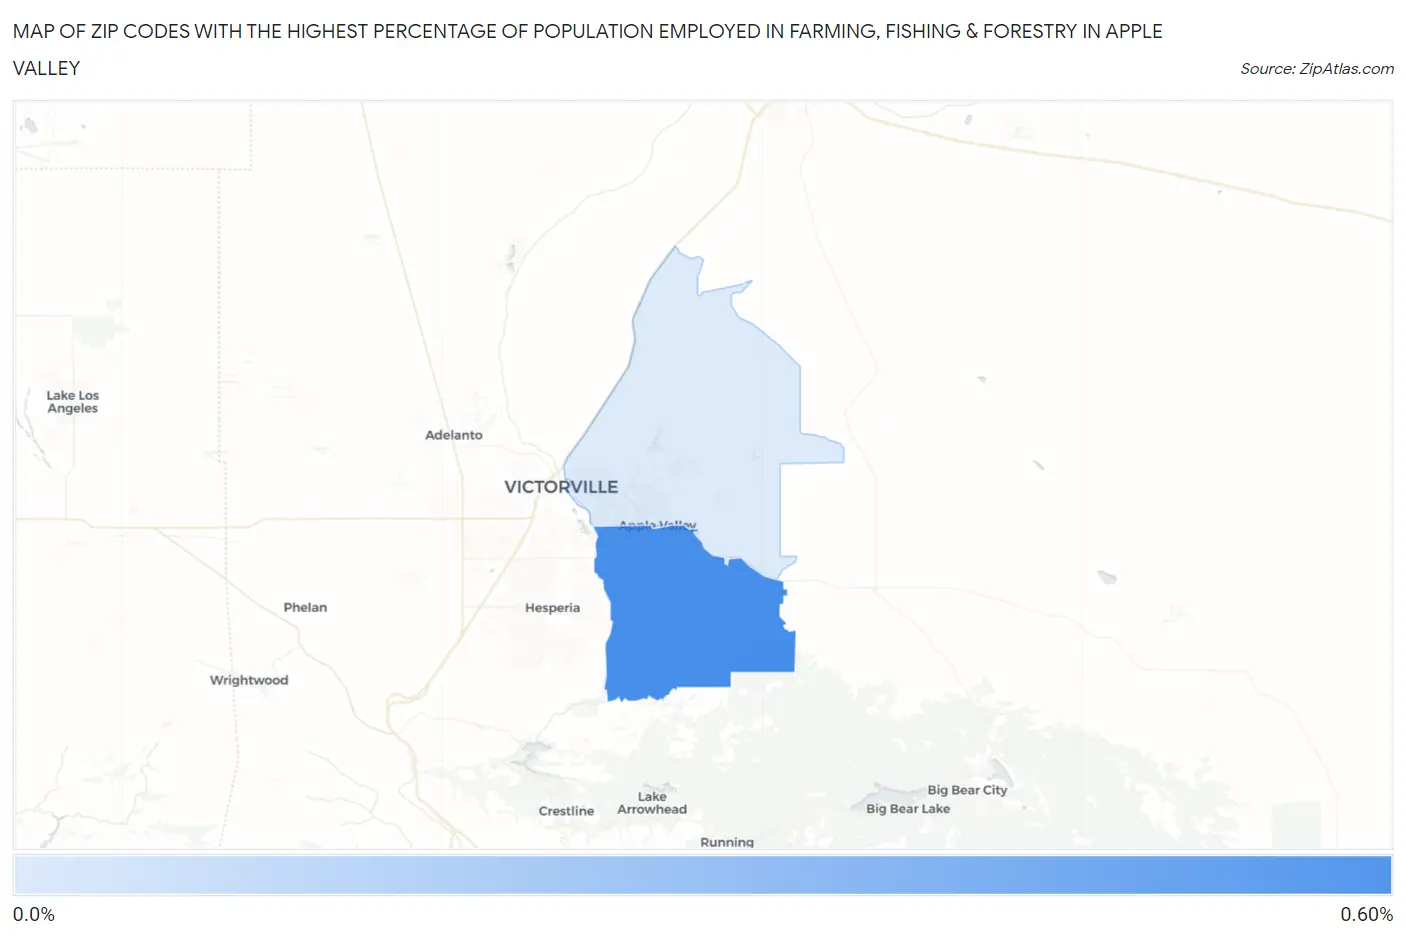
Map of Zip Codes with the Highest Percentage of Population Employed in Farming, Fishing & Forestry in Apple Valley
0.0%
0.60%
Zip Codes with the Highest Percentage of Population Employed in Farming, Fishing & Forestry in Apple Valley, CA
| Zip Code | % Employed | vs State | vs National | |
| 1. | 92308 | 0.53% | 1.4%(-0.884)#676 | 0.61%(-0.079)#12,631 |
| 2. | 92307 | 0.0063% | 1.4%(-1.40)#1,199 | 0.61%(-0.599)#19,194 |
1
Common Questions
What are the Top Zip Codes with the Highest Percentage of Population Employed in Farming, Fishing & Forestry in Apple Valley, CA?
Top Zip Codes with the Highest Percentage of Population Employed in Farming, Fishing & Forestry in Apple Valley, CA are:
What zip code has the Highest Percentage of Population Employed in Farming, Fishing & Forestry in Apple Valley, CA?
92308 has the Highest Percentage of Population Employed in Farming, Fishing & Forestry in Apple Valley, CA with 0.53%.
What is the Percentage of Population Employed in Farming, Fishing & Forestry in Apple Valley, CA?
Percentage of Population Employed in Farming, Fishing & Forestry in Apple Valley is 0.28%.
What is the Percentage of Population Employed in Farming, Fishing & Forestry in California?
Percentage of Population Employed in Farming, Fishing & Forestry in California is 1.4%.
What is the Percentage of Population Employed in Farming, Fishing & Forestry in the United States?
Percentage of Population Employed in Farming, Fishing & Forestry in the United States is 0.61%.