Amesti, CA Map & Demographics
Amesti Map
Amesti Overview
$38,014
PER CAPITA INCOME
$100,750
AVG FAMILY INCOME
$101,141
AVG HOUSEHOLD INCOME
13.2%
WAGE / INCOME GAP [ % ]
86.8¢/ $1
WAGE / INCOME GAP [ $ ]
0.47
INEQUALITY / GINI INDEX
3,048
TOTAL POPULATION
1,625
MALE POPULATION
1,423
FEMALE POPULATION
114.20
MALES / 100 FEMALES
87.57
FEMALES / 100 MALES
34.5
MEDIAN AGE
4.0
AVG FAMILY SIZE
3.6
AVG HOUSEHOLD SIZE
1,509
LABOR FORCE [ PEOPLE ]
60.7%
PERCENT IN LABOR FORCE
6.8%
UNEMPLOYMENT RATE
Income in Amesti
Income Overview in Amesti
Per Capita Income in Amesti is $38,014, while median incomes of families and households are $100,750 and $101,141 respectively.
| Characteristic | Number | Measure |
| Per Capita Income | 3,048 | $38,014 |
| Median Family Income | 664 | $100,750 |
| Mean Family Income | 664 | $147,643 |
| Median Household Income | 845 | $101,141 |
| Mean Household Income | 845 | $133,271 |
| Income Deficit | 664 | $0 |
| Wage / Income Gap (%) | 3,048 | 13.16% |
| Wage / Income Gap ($) | 3,048 | 86.84¢ per $1 |
| Gini / Inequality Index | 3,048 | 0.47 |
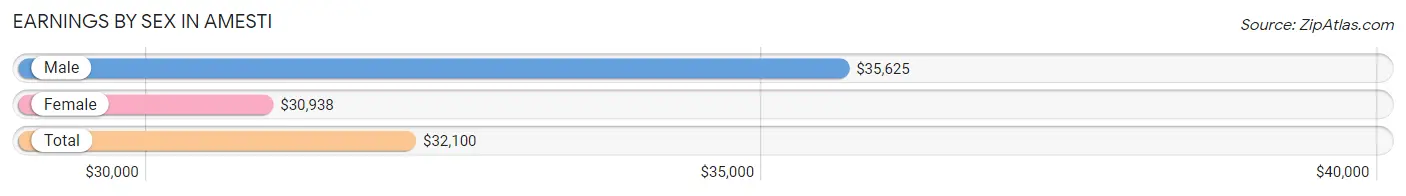
Earnings by Sex in Amesti
Average Earnings in Amesti are $32,100, $35,625 for men and $30,938 for women, a difference of 13.2%.
| Sex | Number | Average Earnings |
| Male | 780 (51.4%) | $35,625 |
| Female | 736 (48.5%) | $30,938 |
| Total | 1,516 (100.0%) | $32,100 |
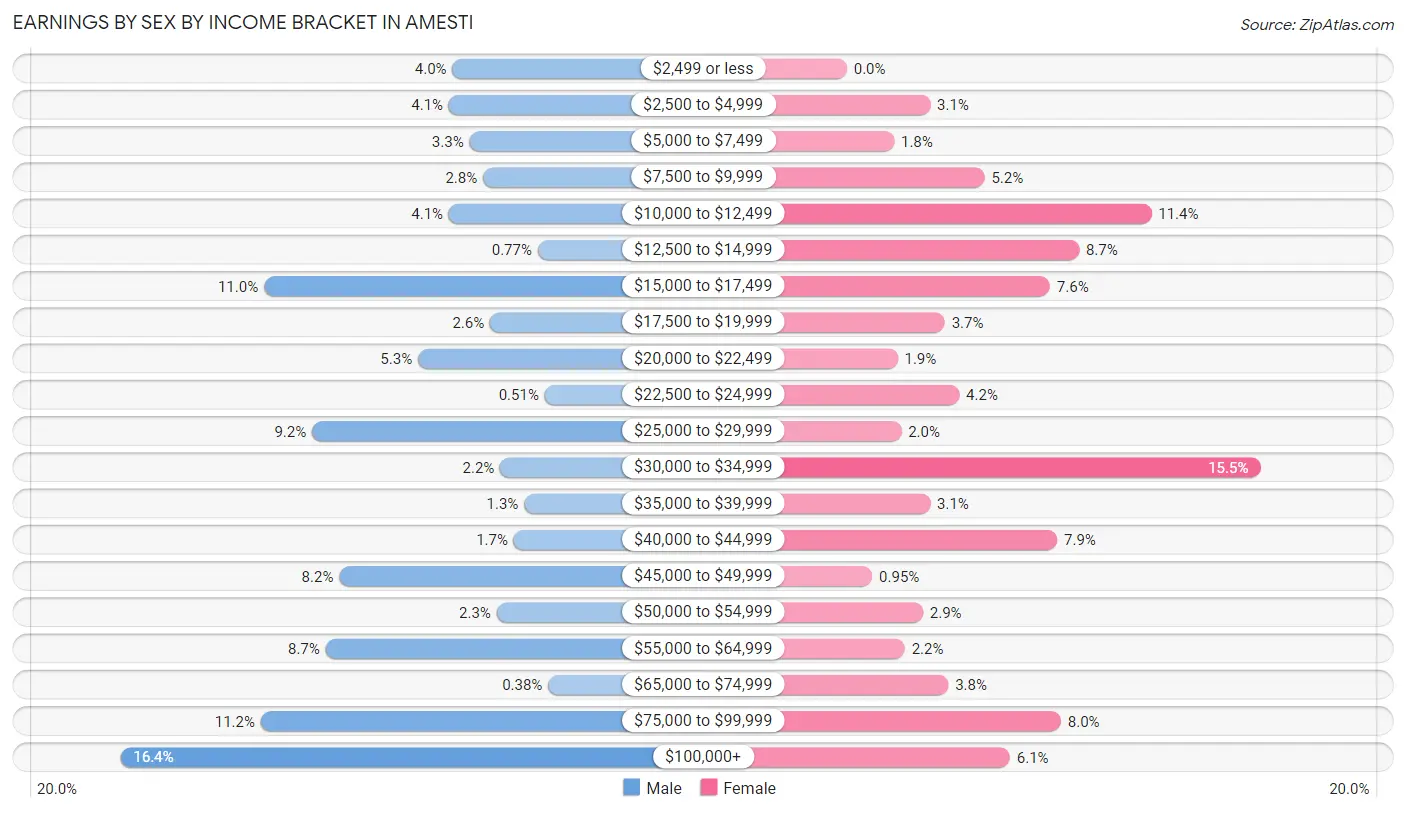
Earnings by Sex by Income Bracket in Amesti
The most common earnings brackets in Amesti are $100,000+ for men (128 | 16.4%) and $30,000 to $34,999 for women (114 | 15.5%).
| Income | Male | Female |
| $2,499 or less | 31 (4.0%) | 0 (0.0%) |
| $2,500 to $4,999 | 32 (4.1%) | 23 (3.1%) |
| $5,000 to $7,499 | 26 (3.3%) | 13 (1.8%) |
| $7,500 to $9,999 | 22 (2.8%) | 38 (5.2%) |
| $10,000 to $12,499 | 32 (4.1%) | 84 (11.4%) |
| $12,500 to $14,999 | 6 (0.8%) | 64 (8.7%) |
| $15,000 to $17,499 | 86 (11.0%) | 56 (7.6%) |
| $17,500 to $19,999 | 20 (2.6%) | 27 (3.7%) |
| $20,000 to $22,499 | 41 (5.3%) | 14 (1.9%) |
| $22,500 to $24,999 | 4 (0.5%) | 31 (4.2%) |
| $25,000 to $29,999 | 72 (9.2%) | 15 (2.0%) |
| $30,000 to $34,999 | 17 (2.2%) | 114 (15.5%) |
| $35,000 to $39,999 | 10 (1.3%) | 23 (3.1%) |
| $40,000 to $44,999 | 13 (1.7%) | 58 (7.9%) |
| $45,000 to $49,999 | 64 (8.2%) | 7 (0.9%) |
| $50,000 to $54,999 | 18 (2.3%) | 21 (2.9%) |
| $55,000 to $64,999 | 68 (8.7%) | 16 (2.2%) |
| $65,000 to $74,999 | 3 (0.4%) | 28 (3.8%) |
| $75,000 to $99,999 | 87 (11.2%) | 59 (8.0%) |
| $100,000+ | 128 (16.4%) | 45 (6.1%) |
| Total | 780 (100.0%) | 736 (100.0%) |
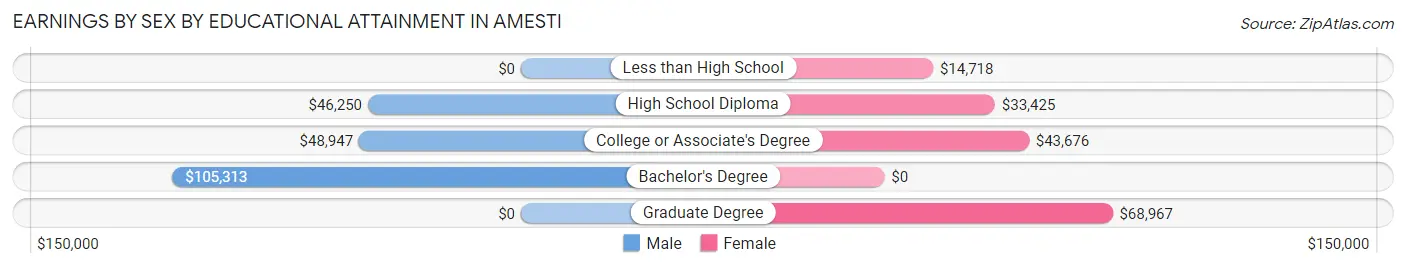
Earnings by Sex by Educational Attainment in Amesti
Average earnings in Amesti are $48,345 for men and $33,319 for women, a difference of 31.1%. Men with an educational attainment of bachelor's degree enjoy the highest average annual earnings of $105,313, while those with high school diploma education earn the least with $46,250. Women with an educational attainment of graduate degree earn the most with the average annual earnings of $68,967, while those with less than high school education have the smallest earnings of $14,718.
| Educational Attainment | Male Income | Female Income |
| Less than High School | - | - |
| High School Diploma | $46,250 | $33,425 |
| College or Associate's Degree | $48,947 | $43,676 |
| Bachelor's Degree | $105,313 | $0 |
| Graduate Degree | - | - |
| Total | $48,345 | $33,319 |
Family Income in Amesti
Family Income Brackets in Amesti
According to the Amesti family income data, there are 144 families falling into the $100,000 to $149,999 income range, which is the most common income bracket and makes up 21.7% of all families. Conversely, the $10,000 to $14,999 income bracket is the least frequent group with only 3 families (0.4%) belonging to this category.
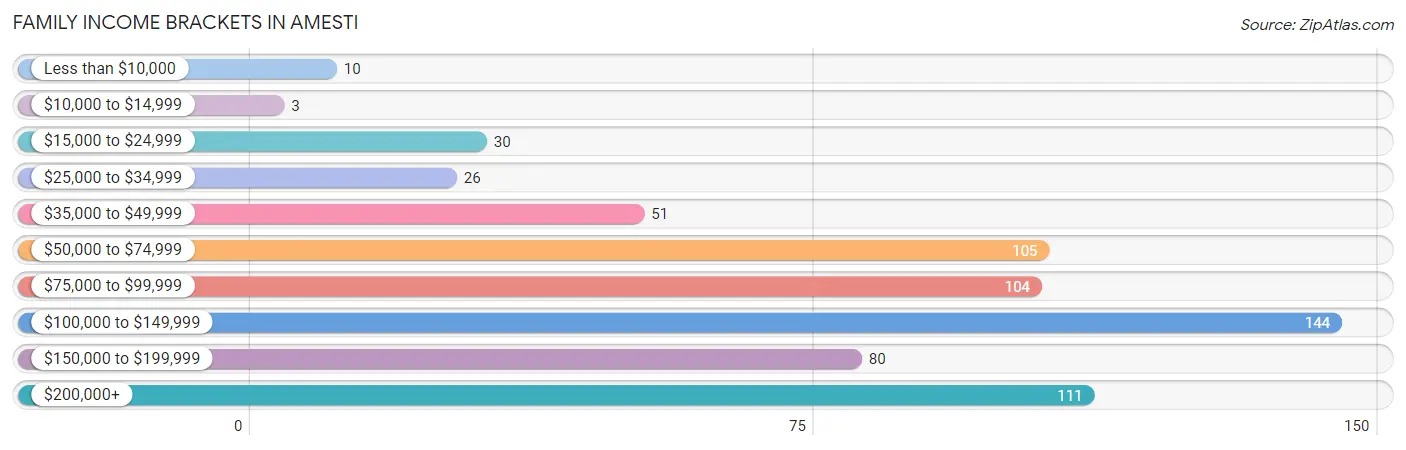
| Income Bracket | # Families | % Families |
| Less than $10,000 | 10 | 1.5% |
| $10,000 to $14,999 | 3 | 0.5% |
| $15,000 to $24,999 | 30 | 4.5% |
| $25,000 to $34,999 | 26 | 3.9% |
| $35,000 to $49,999 | 51 | 7.7% |
| $50,000 to $74,999 | 105 | 15.8% |
| $75,000 to $99,999 | 104 | 15.7% |
| $100,000 to $149,999 | 144 | 21.7% |
| $150,000 to $199,999 | 80 | 12.0% |
| $200,000+ | 111 | 16.7% |
Family Income by Famaliy Size in Amesti
5-person families (83 | 12.5%) account for the highest median family income in Amesti with $146,771 per family, while 2-person families (217 | 32.7%) have the highest median income of $50,625 per family member.
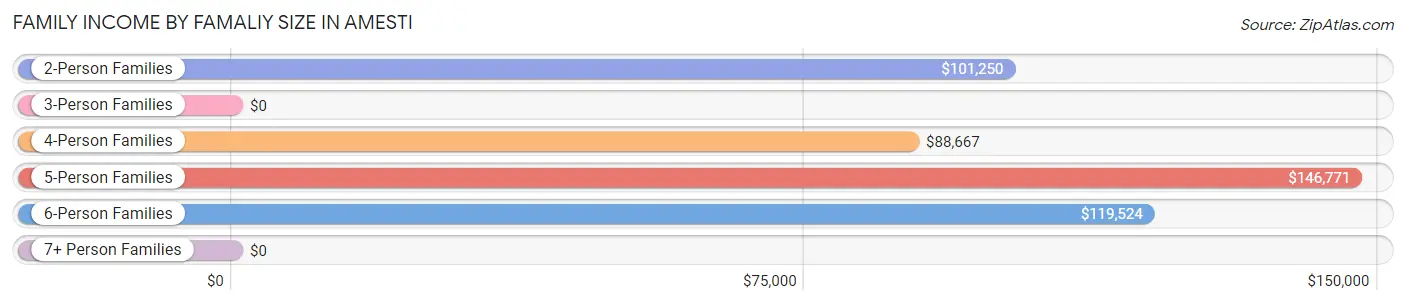
| Income Bracket | # Families | Median Income |
| 2-Person Families | 217 (32.7%) | $101,250 |
| 3-Person Families | 71 (10.7%) | $0 |
| 4-Person Families | 184 (27.7%) | $88,667 |
| 5-Person Families | 83 (12.5%) | $146,771 |
| 6-Person Families | 52 (7.8%) | $119,524 |
| 7+ Person Families | 57 (8.6%) | $0 |
| Total | 664 (100.0%) | $100,750 |
Family Income by Number of Earners in Amesti
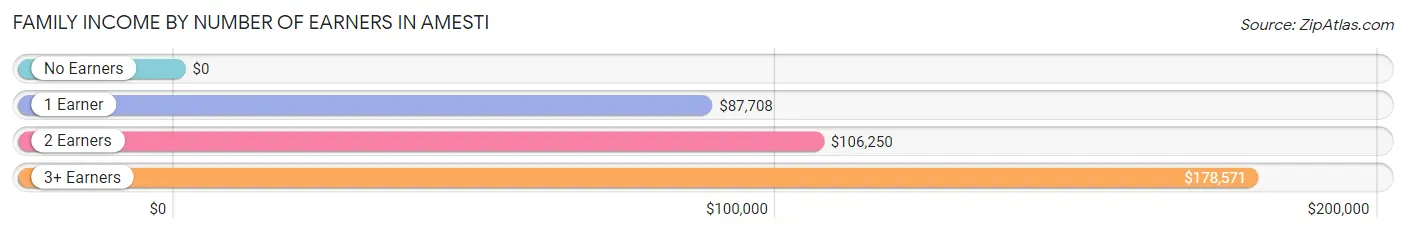
| Number of Earners | # Families | Median Income |
| No Earners | 121 (18.2%) | $0 |
| 1 Earner | 145 (21.8%) | $87,708 |
| 2 Earners | 294 (44.3%) | $106,250 |
| 3+ Earners | 104 (15.7%) | $178,571 |
| Total | 664 (100.0%) | $100,750 |
Household Income in Amesti
Household Income Brackets in Amesti
With 221 households falling in the category, the $100,000 to $149,999 income range is the most frequent in Amesti, accounting for 26.2% of all households. In contrast, only 11 households (1.3%) fall into the $10,000 to $14,999 income bracket, making it the least populous group.
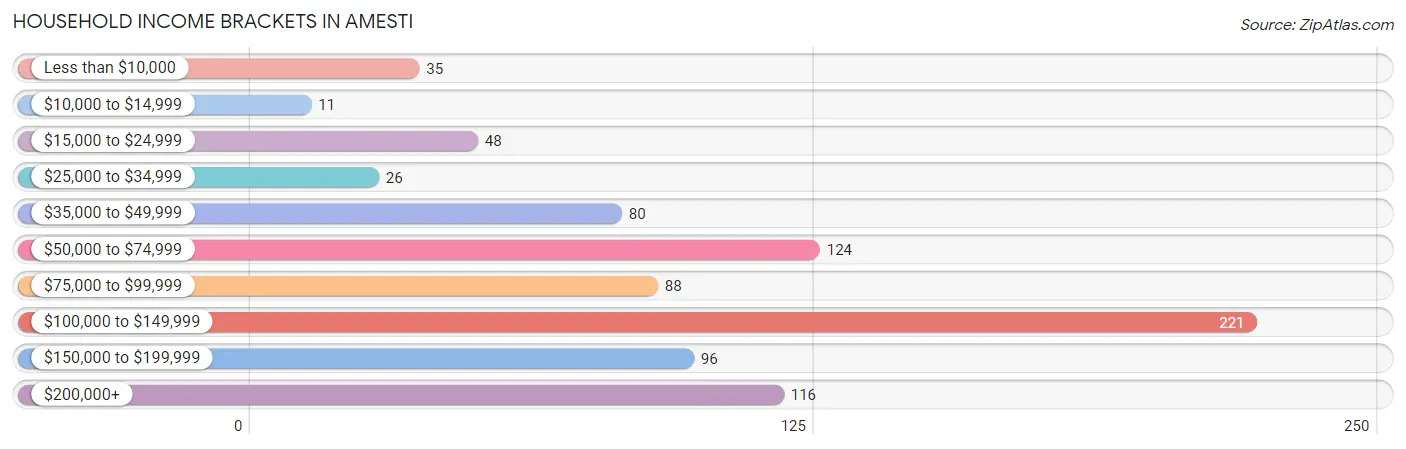
| Income Bracket | # Households | % Households |
| Less than $10,000 | 35 | 4.1% |
| $10,000 to $14,999 | 11 | 1.3% |
| $15,000 to $24,999 | 48 | 5.7% |
| $25,000 to $34,999 | 26 | 3.1% |
| $35,000 to $49,999 | 80 | 9.5% |
| $50,000 to $74,999 | 124 | 14.7% |
| $75,000 to $99,999 | 88 | 10.4% |
| $100,000 to $149,999 | 221 | 26.2% |
| $150,000 to $199,999 | 96 | 11.4% |
| $200,000+ | 116 | 13.7% |
Household Income by Householder Age in Amesti
The median household income in Amesti is $101,141, with the highest median household income of $118,294 found in the 45 to 64 years age bracket for the primary householder. A total of 388 households (45.9%) fall into this category.
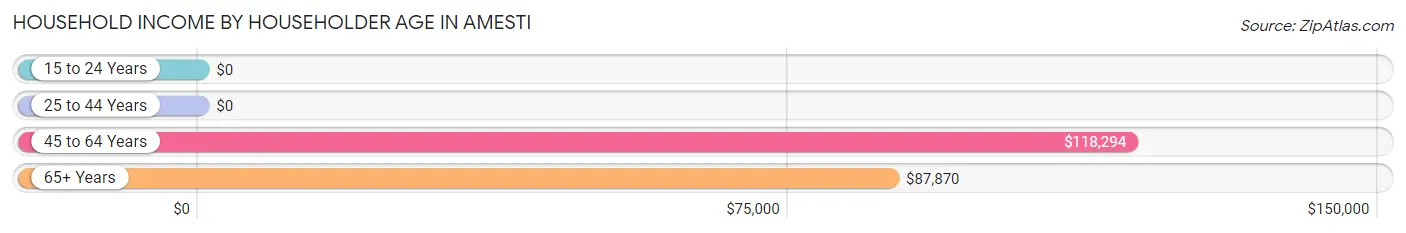
| Income Bracket | # Households | Median Income |
| 15 to 24 Years | 0 (0.0%) | $0 |
| 25 to 44 Years | 155 (18.3%) | $0 |
| 45 to 64 Years | 388 (45.9%) | $118,294 |
| 65+ Years | 302 (35.7%) | $87,870 |
| Total | 845 (100.0%) | $101,141 |
Poverty in Amesti
Income Below Poverty by Sex and Age in Amesti
With 16.1% poverty level for males and 15.5% for females among the residents of Amesti, 15 year old males and 6 to 11 year old females are the most vulnerable to poverty, with 38 males (100.0%) and 53 females (51.0%) in their respective age groups living below the poverty level.
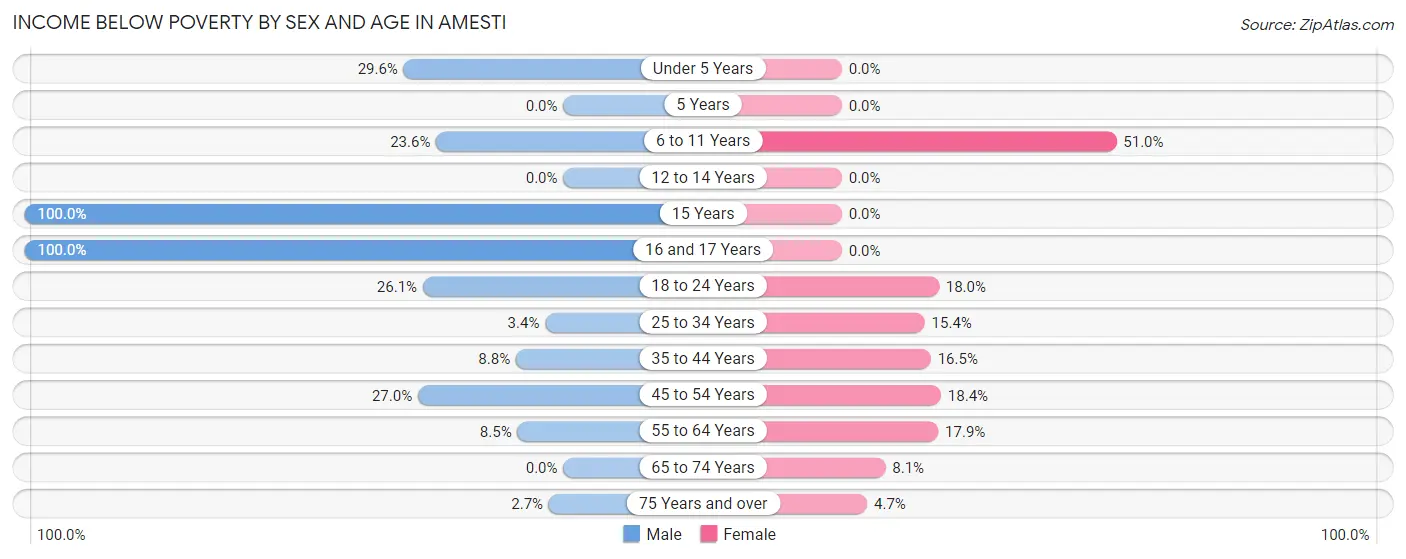
| Age Bracket | Male | Female |
| Under 5 Years | 8 (29.6%) | 0 (0.0%) |
| 5 Years | 0 (0.0%) | 0 (0.0%) |
| 6 to 11 Years | 46 (23.6%) | 53 (51.0%) |
| 12 to 14 Years | 0 (0.0%) | 0 (0.0%) |
| 15 Years | 38 (100.0%) | 0 (0.0%) |
| 16 and 17 Years | 11 (100.0%) | 0 (0.0%) |
| 18 to 24 Years | 85 (26.1%) | 38 (18.0%) |
| 25 to 34 Years | 9 (3.4%) | 20 (15.4%) |
| 35 to 44 Years | 8 (8.8%) | 35 (16.5%) |
| 45 to 54 Years | 34 (27.0%) | 23 (18.4%) |
| 55 to 64 Years | 20 (8.5%) | 34 (17.9%) |
| 65 to 74 Years | 0 (0.0%) | 11 (8.1%) |
| 75 Years and over | 3 (2.7%) | 7 (4.7%) |
| Total | 262 (16.1%) | 221 (15.5%) |
Income Above Poverty by Sex and Age in Amesti
According to the poverty statistics in Amesti, males aged 5 years and females aged under 5 years are the age groups that are most secure financially, with 100.0% of males and 100.0% of females in these age groups living above the poverty line.
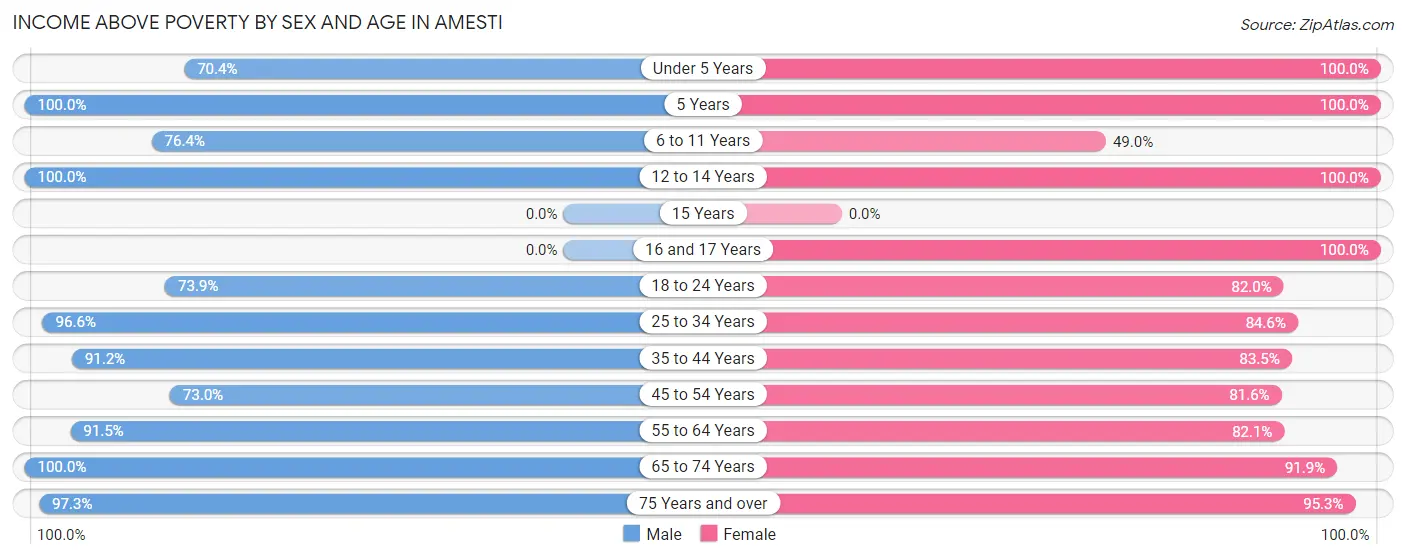
| Age Bracket | Male | Female |
| Under 5 Years | 19 (70.4%) | 57 (100.0%) |
| 5 Years | 11 (100.0%) | 10 (100.0%) |
| 6 to 11 Years | 149 (76.4%) | 51 (49.0%) |
| 12 to 14 Years | 67 (100.0%) | 53 (100.0%) |
| 15 Years | 0 (0.0%) | 0 (0.0%) |
| 16 and 17 Years | 0 (0.0%) | 46 (100.0%) |
| 18 to 24 Years | 241 (73.9%) | 173 (82.0%) |
| 25 to 34 Years | 259 (96.6%) | 110 (84.6%) |
| 35 to 44 Years | 83 (91.2%) | 177 (83.5%) |
| 45 to 54 Years | 92 (73.0%) | 102 (81.6%) |
| 55 to 64 Years | 215 (91.5%) | 156 (82.1%) |
| 65 to 74 Years | 118 (100.0%) | 125 (91.9%) |
| 75 Years and over | 109 (97.3%) | 142 (95.3%) |
| Total | 1,363 (83.9%) | 1,202 (84.5%) |
Income Below Poverty Among Married-Couple Families in Amesti
The poverty statistics for married-couple families in Amesti show that 10.1% or 52 of the total 513 families live below the poverty line. Families with 1 or 2 children have the highest poverty rate of 24.6%, comprising of 34 families. On the other hand, families with no children have the lowest poverty rate of 4.0%, which includes 13 families.
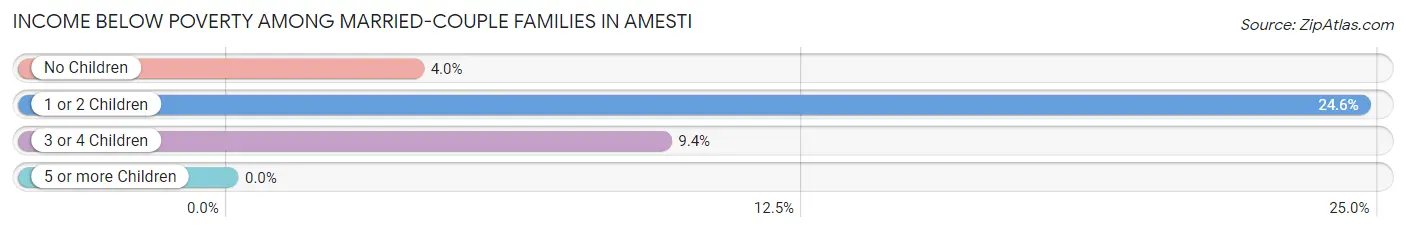
| Children | Above Poverty | Below Poverty |
| No Children | 309 (96.0%) | 13 (4.0%) |
| 1 or 2 Children | 104 (75.4%) | 34 (24.6%) |
| 3 or 4 Children | 48 (90.6%) | 5 (9.4%) |
| 5 or more Children | 0 (0.0%) | 0 (0.0%) |
| Total | 461 (89.9%) | 52 (10.1%) |
Income Below Poverty Among Single-Parent Households in Amesti
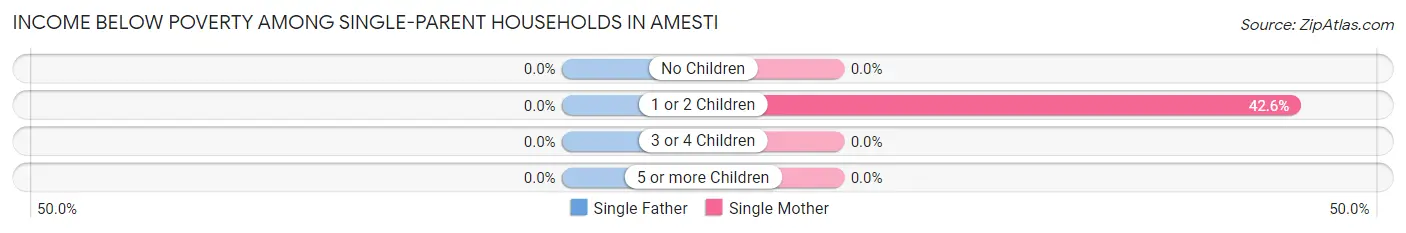
| Children | Single Father | Single Mother |
| No Children | 0 (0.0%) | 0 (0.0%) |
| 1 or 2 Children | 0 (0.0%) | 23 (42.6%) |
| 3 or 4 Children | 0 (0.0%) | 0 (0.0%) |
| 5 or more Children | 0 (0.0%) | 0 (0.0%) |
| Total | 0 (0.0%) | 23 (19.7%) |
Income Below Poverty Among Married-Couple vs Single-Parent Households in Amesti
The poverty data for Amesti shows that 52 of the married-couple family households (10.1%) and 23 of the single-parent households (15.2%) are living below the poverty level. Within the married-couple family households, those with 1 or 2 children have the highest poverty rate, with 34 households (24.6%) falling below the poverty line. Among the single-parent households, those with 1 or 2 children have the highest poverty rate, with 23 household (27.4%) living below poverty.
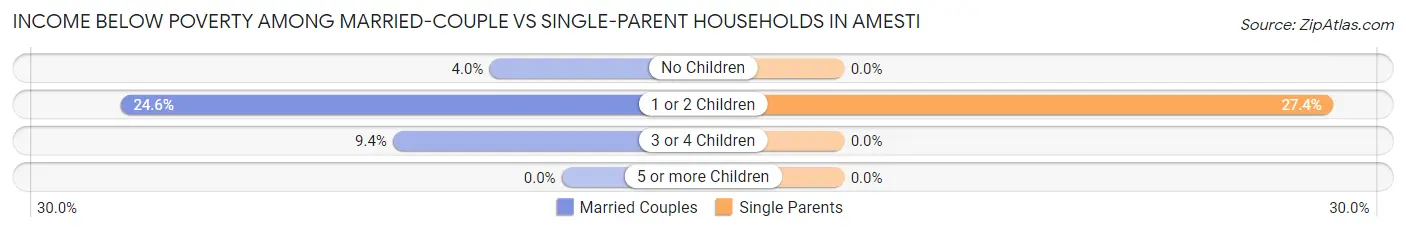
| Children | Married-Couple Families | Single-Parent Households |
| No Children | 13 (4.0%) | 0 (0.0%) |
| 1 or 2 Children | 34 (24.6%) | 23 (27.4%) |
| 3 or 4 Children | 5 (9.4%) | 0 (0.0%) |
| 5 or more Children | 0 (0.0%) | 0 (0.0%) |
| Total | 52 (10.1%) | 23 (15.2%) |
Race in Amesti
The most populous races in Amesti are White / Caucasian (1,873 | 61.5%), Hispanic or Latino (1,725 | 56.6%), and Some other Race (610 | 20.0%).
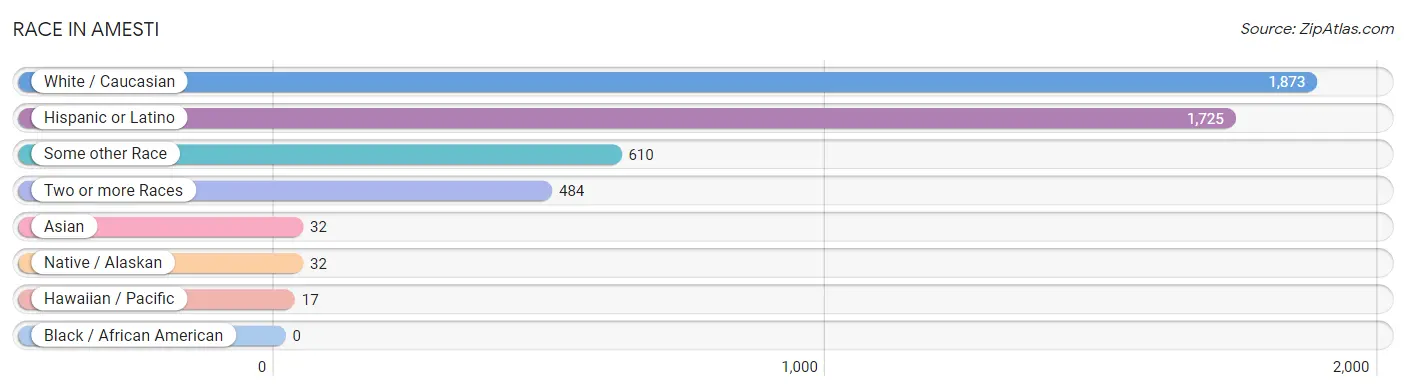
| Race | # Population | % Population |
| Asian | 32 | 1.1% |
| Black / African American | 0 | 0.0% |
| Hawaiian / Pacific | 17 | 0.6% |
| Hispanic or Latino | 1,725 | 56.6% |
| Native / Alaskan | 32 | 1.1% |
| White / Caucasian | 1,873 | 61.5% |
| Two or more Races | 484 | 15.9% |
| Some other Race | 610 | 20.0% |
| Total | 3,048 | 100.0% |
Ancestry in Amesti
The most populous ancestries reported in Amesti are Mexican (1,679 | 55.1%), Italian (297 | 9.7%), English (247 | 8.1%), Irish (237 | 7.8%), and German (158 | 5.2%), together accounting for 85.9% of all Amesti residents.
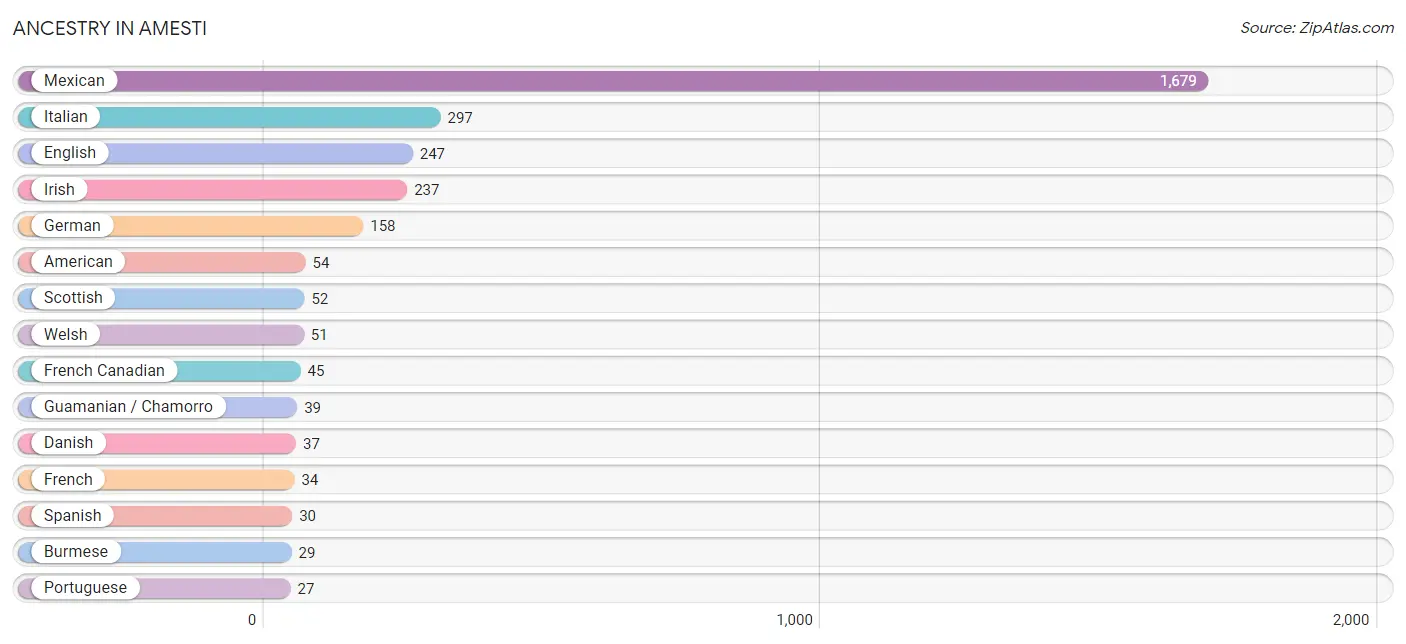
| Ancestry | # Population | % Population |
| American | 54 | 1.8% |
| Bhutanese | 16 | 0.5% |
| British | 22 | 0.7% |
| Burmese | 29 | 0.9% |
| Canadian | 3 | 0.1% |
| Central American | 7 | 0.2% |
| Cherokee | 21 | 0.7% |
| Chilean | 6 | 0.2% |
| Croatian | 4 | 0.1% |
| Danish | 37 | 1.2% |
| English | 247 | 8.1% |
| European | 20 | 0.7% |
| French | 34 | 1.1% |
| French Canadian | 45 | 1.5% |
| German | 158 | 5.2% |
| Guamanian / Chamorro | 39 | 1.3% |
| Hungarian | 15 | 0.5% |
| Irish | 237 | 7.8% |
| Italian | 297 | 9.7% |
| Korean | 23 | 0.7% |
| Mexican | 1,679 | 55.1% |
| Mexican American Indian | 14 | 0.5% |
| Nicaraguan | 7 | 0.2% |
| Norwegian | 20 | 0.7% |
| Polish | 3 | 0.1% |
| Portuguese | 27 | 0.9% |
| Puerto Rican | 3 | 0.1% |
| Samoan | 14 | 0.5% |
| Scandinavian | 13 | 0.4% |
| Scotch-Irish | 10 | 0.3% |
| Scottish | 52 | 1.7% |
| Slavic | 3 | 0.1% |
| South American | 6 | 0.2% |
| Spanish | 30 | 1.0% |
| Swedish | 15 | 0.5% |
| Swiss | 6 | 0.2% |
| Welsh | 51 | 1.7% | View All 37 Rows |
Immigrants in Amesti
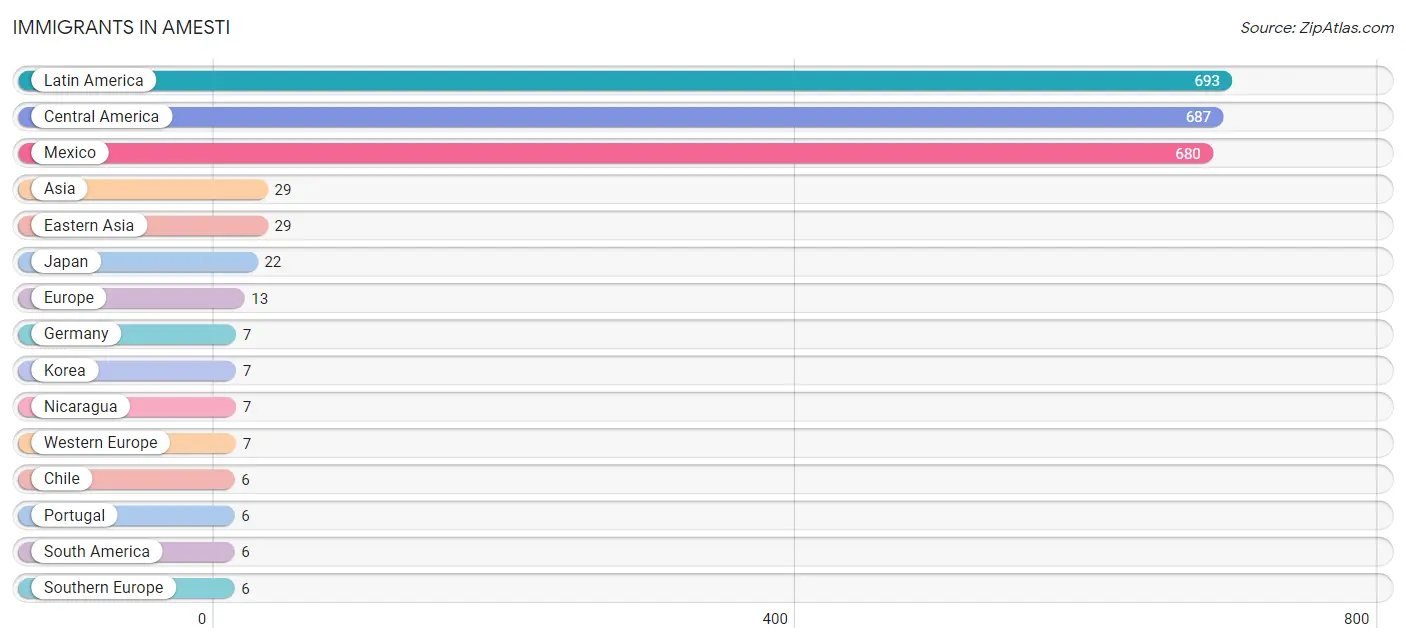
The most numerous immigrant groups reported in Amesti came from Latin America (693 | 22.7%), Central America (687 | 22.5%), Mexico (680 | 22.3%), Asia (29 | 0.9%), and Eastern Asia (29 | 0.9%), together accounting for 69.5% of all Amesti residents.
| Immigration Origin | # Population | % Population |
| Asia | 29 | 0.9% |
| Central America | 687 | 22.5% |
| Chile | 6 | 0.2% |
| Eastern Asia | 29 | 0.9% |
| Europe | 13 | 0.4% |
| Germany | 7 | 0.2% |
| Japan | 22 | 0.7% |
| Korea | 7 | 0.2% |
| Latin America | 693 | 22.7% |
| Mexico | 680 | 22.3% |
| Nicaragua | 7 | 0.2% |
| Portugal | 6 | 0.2% |
| South America | 6 | 0.2% |
| Southern Europe | 6 | 0.2% |
| Western Europe | 7 | 0.2% | View All 15 Rows |
Sex and Age in Amesti
Sex and Age in Amesti
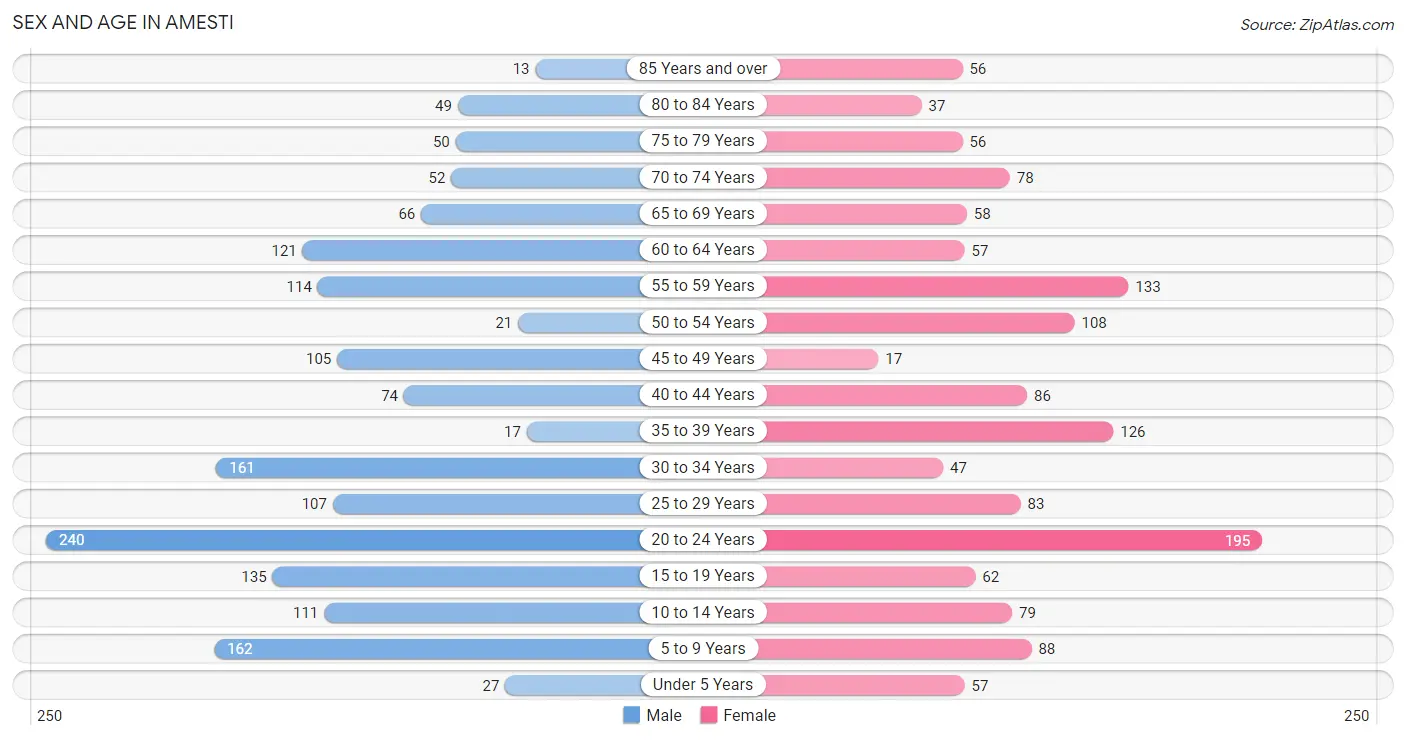
The most populous age groups in Amesti are 20 to 24 Years (240 | 14.8%) for men and 20 to 24 Years (195 | 13.7%) for women.
| Age Bracket | Male | Female |
| Under 5 Years | 27 (1.7%) | 57 (4.0%) |
| 5 to 9 Years | 162 (10.0%) | 88 (6.2%) |
| 10 to 14 Years | 111 (6.8%) | 79 (5.6%) |
| 15 to 19 Years | 135 (8.3%) | 62 (4.4%) |
| 20 to 24 Years | 240 (14.8%) | 195 (13.7%) |
| 25 to 29 Years | 107 (6.6%) | 83 (5.8%) |
| 30 to 34 Years | 161 (9.9%) | 47 (3.3%) |
| 35 to 39 Years | 17 (1.1%) | 126 (8.8%) |
| 40 to 44 Years | 74 (4.5%) | 86 (6.0%) |
| 45 to 49 Years | 105 (6.5%) | 17 (1.2%) |
| 50 to 54 Years | 21 (1.3%) | 108 (7.6%) |
| 55 to 59 Years | 114 (7.0%) | 133 (9.3%) |
| 60 to 64 Years | 121 (7.4%) | 57 (4.0%) |
| 65 to 69 Years | 66 (4.1%) | 58 (4.1%) |
| 70 to 74 Years | 52 (3.2%) | 78 (5.5%) |
| 75 to 79 Years | 50 (3.1%) | 56 (3.9%) |
| 80 to 84 Years | 49 (3.0%) | 37 (2.6%) |
| 85 Years and over | 13 (0.8%) | 56 (3.9%) |
| Total | 1,625 (100.0%) | 1,423 (100.0%) |
Families and Households in Amesti
Median Family Size in Amesti
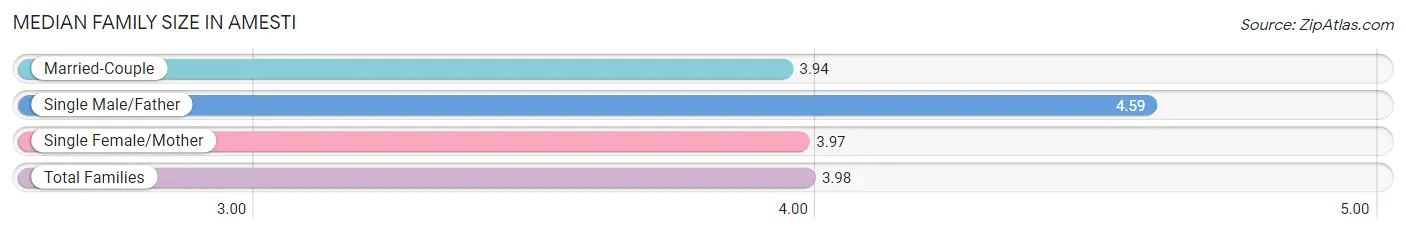
The median family size in Amesti is 3.98 persons per family, with single male/father families (34 | 5.1%) accounting for the largest median family size of 4.59 persons per family. On the other hand, married-couple families (513 | 77.3%) represent the smallest median family size with 3.94 persons per family.
| Family Type | # Families | Family Size |
| Married-Couple | 513 (77.3%) | 3.94 |
| Single Male/Father | 34 (5.1%) | 4.59 |
| Single Female/Mother | 117 (17.6%) | 3.97 |
| Total Families | 664 (100.0%) | 3.98 |
Median Household Size in Amesti
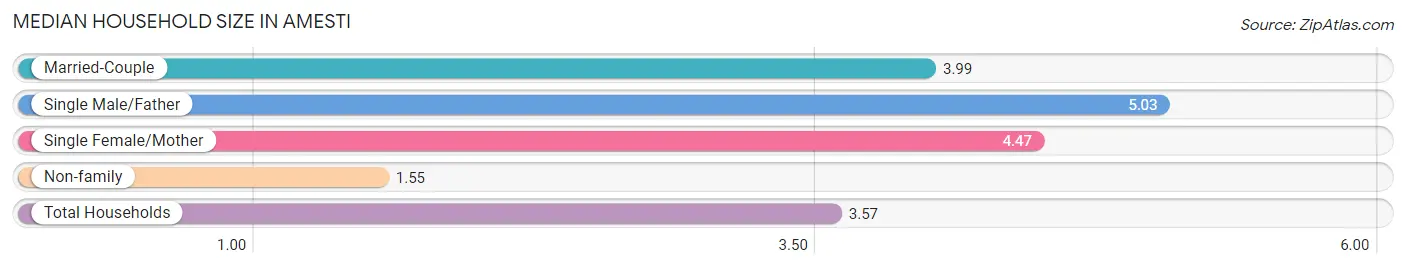
The median household size in Amesti is 3.57 persons per household, with single male/father households (34 | 4.0%) accounting for the largest median household size of 5.03 persons per household. non-family households (181 | 21.4%) represent the smallest median household size with 1.55 persons per household.
| Household Type | # Households | Household Size |
| Married-Couple | 513 (60.7%) | 3.99 |
| Single Male/Father | 34 (4.0%) | 5.03 |
| Single Female/Mother | 117 (13.9%) | 4.47 |
| Non-family | 181 (21.4%) | 1.55 |
| Total Households | 845 (100.0%) | 3.57 |
Household Size by Marriage Status in Amesti
Out of a total of 845 households in Amesti, 664 (78.6%) are family households, while 181 (21.4%) are nonfamily households. The most numerous type of family households are 2-person households, comprising 204, and the most common type of nonfamily households are 1-person households, comprising 137.
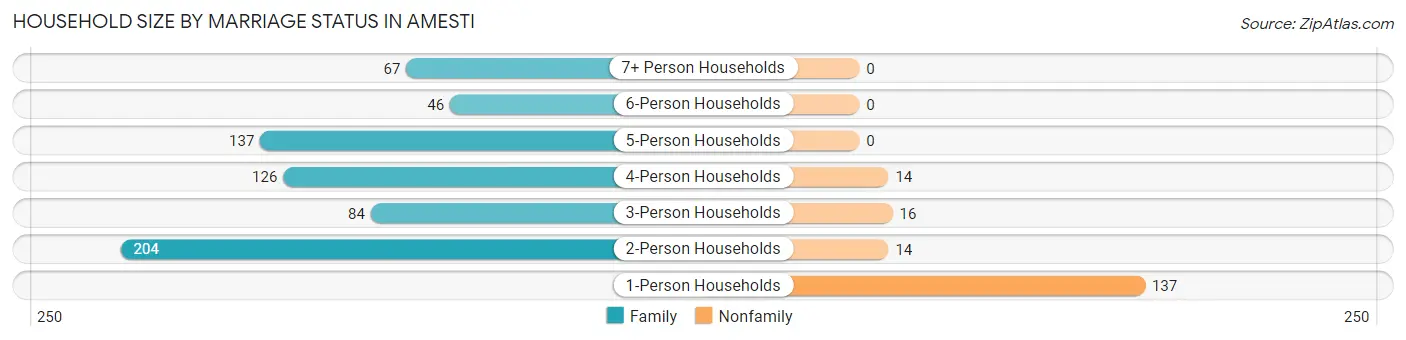
| Household Size | Family Households | Nonfamily Households |
| 1-Person Households | - | 137 (16.2%) |
| 2-Person Households | 204 (24.1%) | 14 (1.7%) |
| 3-Person Households | 84 (9.9%) | 16 (1.9%) |
| 4-Person Households | 126 (14.9%) | 14 (1.7%) |
| 5-Person Households | 137 (16.2%) | 0 (0.0%) |
| 6-Person Households | 46 (5.4%) | 0 (0.0%) |
| 7+ Person Households | 67 (7.9%) | 0 (0.0%) |
| Total | 664 (78.6%) | 181 (21.4%) |
Female Fertility in Amesti
Fertility by Age in Amesti
Average fertility rate in Amesti is 64.0 births per 1,000 women. Women in the age bracket of 35 to 50 years have the highest fertility rate with 147.0 births per 1,000 women. Women in the age bracket of 35 to 50 years acount for 92.7% of all women with births.
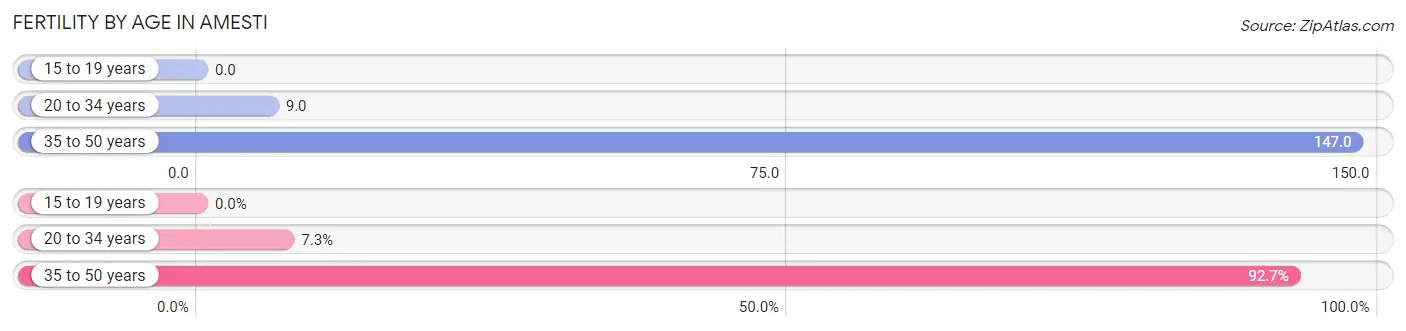
| Age Bracket | Women with Births | Births / 1,000 Women |
| 15 to 19 years | 0 (0.0%) | 0.0 |
| 20 to 34 years | 3 (7.3%) | 9.0 |
| 35 to 50 years | 38 (92.7%) | 147.0 |
| Total | 41 (100.0%) | 64.0 |
Fertility by Age by Marriage Status in Amesti
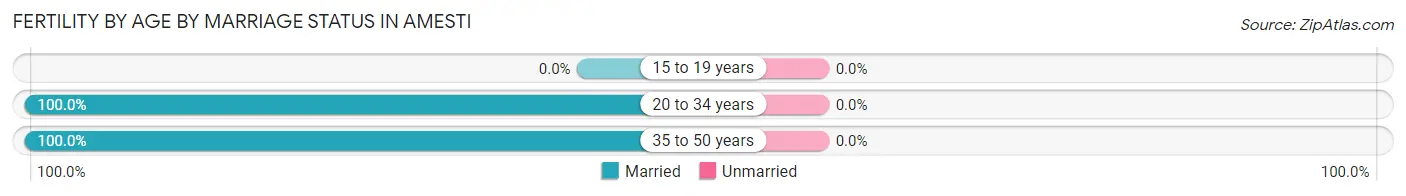
| Age Bracket | Married | Unmarried |
| 15 to 19 years | 0 (0.0%) | 0 (0.0%) |
| 20 to 34 years | 3 (100.0%) | 0 (0.0%) |
| 35 to 50 years | 38 (100.0%) | 0 (0.0%) |
| Total | 41 (100.0%) | 0 (0.0%) |
Fertility by Education in Amesti
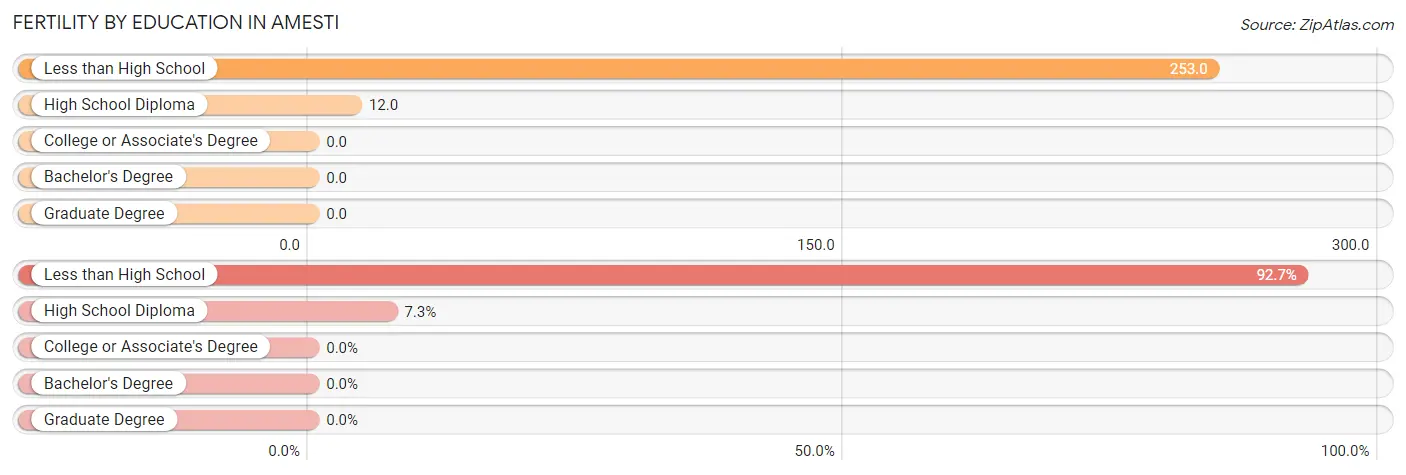
| Educational Attainment | Women with Births | Births / 1,000 Women |
| Less than High School | 38 (92.7%) | 253.0 |
| High School Diploma | 3 (7.3%) | 12.0 |
| College or Associate's Degree | 0 (0.0%) | 0.0 |
| Bachelor's Degree | 0 (0.0%) | 0.0 |
| Graduate Degree | 0 (0.0%) | 0.0 |
| Total | 41 (100.0%) | 64.0 |
Fertility by Education by Marriage Status in Amesti
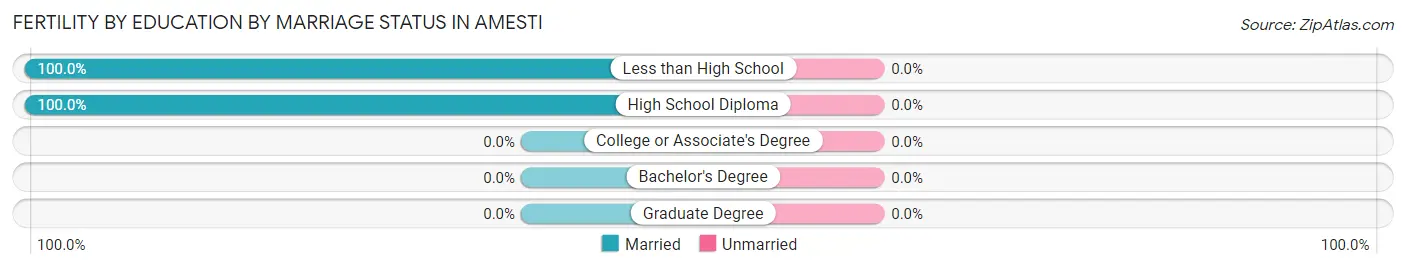
| Educational Attainment | Married | Unmarried |
| Less than High School | 38 (100.0%) | 0 (0.0%) |
| High School Diploma | 3 (100.0%) | 0 (0.0%) |
| College or Associate's Degree | 0 (0.0%) | 0 (0.0%) |
| Bachelor's Degree | 0 (0.0%) | 0 (0.0%) |
| Graduate Degree | 0 (0.0%) | 0 (0.0%) |
| Total | 41 (100.0%) | 0 (0.0%) |
Employment Characteristics in Amesti
Employment by Class of Employer in Amesti
Among the 1,331 employed individuals in Amesti, private company employees (987 | 74.2%), local government employees (96 | 7.2%), and self-employed (not incorporated) (94 | 7.1%) make up the most common classes of employment.
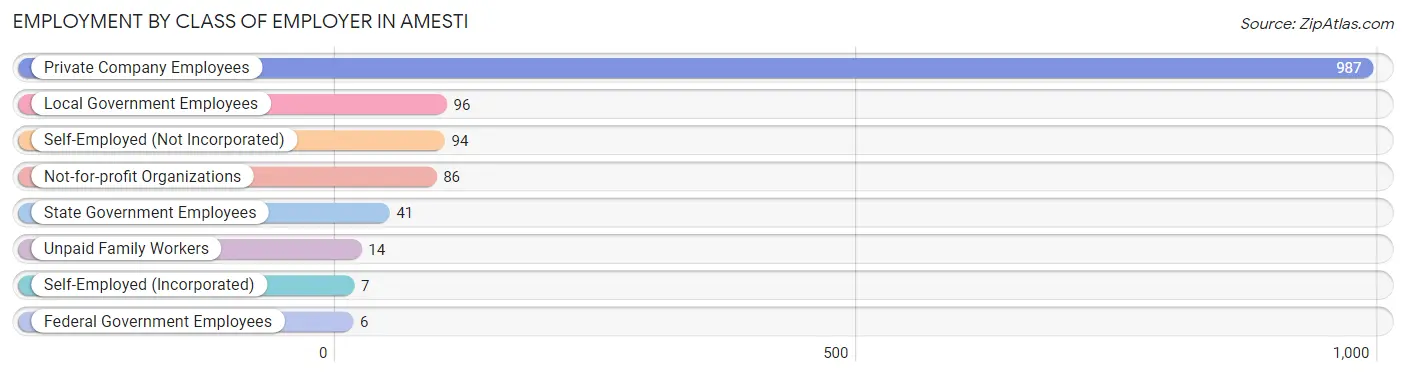
| Employer Class | # Employees | % Employees |
| Private Company Employees | 987 | 74.2% |
| Self-Employed (Incorporated) | 7 | 0.5% |
| Self-Employed (Not Incorporated) | 94 | 7.1% |
| Not-for-profit Organizations | 86 | 6.5% |
| Local Government Employees | 96 | 7.2% |
| State Government Employees | 41 | 3.1% |
| Federal Government Employees | 6 | 0.4% |
| Unpaid Family Workers | 14 | 1.1% |
| Total | 1,331 | 100.0% |
Employment Status by Age in Amesti
According to the labor force statistics for Amesti, out of the total population over 16 years of age (2,486), 60.7% or 1,509 individuals are in the labor force, with 6.8% or 103 of them unemployed. The age group with the highest labor force participation rate is 45 to 54 years, with 90.4% or 227 individuals in the labor force. Within the labor force, the 35 to 44 years age range has the highest percentage of unemployed individuals, with 12.9% or 27 of them being unemployed.
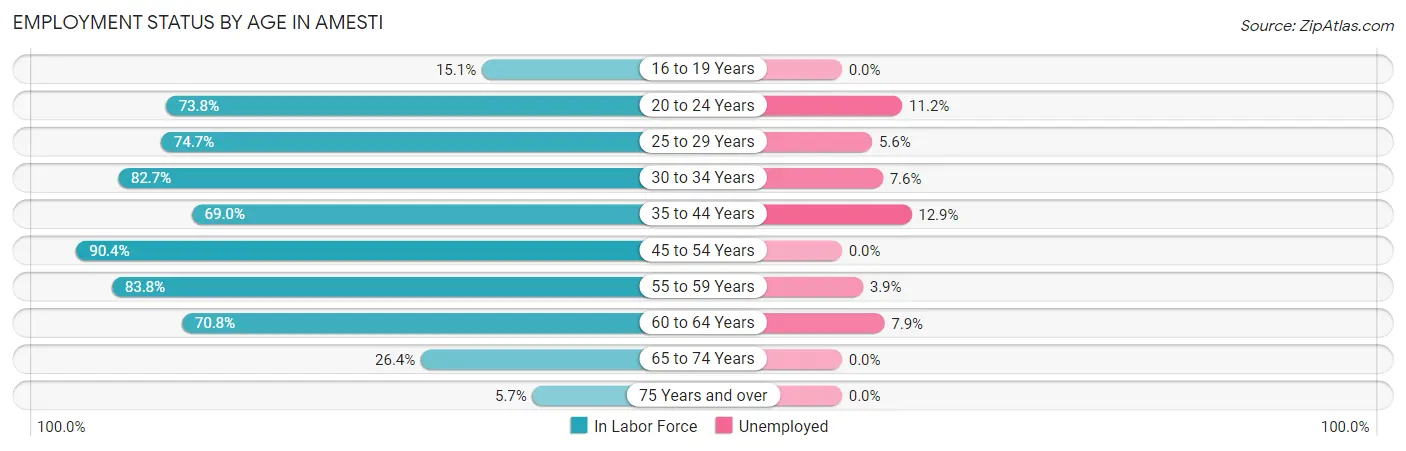
| Age Bracket | In Labor Force | Unemployed |
| 16 to 19 Years | 24 (15.1%) | 0 (0.0%) |
| 20 to 24 Years | 321 (73.8%) | 36 (11.2%) |
| 25 to 29 Years | 142 (74.7%) | 8 (5.6%) |
| 30 to 34 Years | 172 (82.7%) | 13 (7.6%) |
| 35 to 44 Years | 209 (69.0%) | 27 (12.9%) |
| 45 to 54 Years | 227 (90.4%) | 0 (0.0%) |
| 55 to 59 Years | 207 (83.8%) | 8 (3.9%) |
| 60 to 64 Years | 126 (70.8%) | 10 (7.9%) |
| 65 to 74 Years | 67 (26.4%) | 0 (0.0%) |
| 75 Years and over | 15 (5.7%) | 0 (0.0%) |
| Total | 1,509 (60.7%) | 103 (6.8%) |
Employment Status by Educational Attainment in Amesti
According to labor force statistics for Amesti, 78.6% of individuals (1,082) out of the total population between 25 and 64 years of age (1,377) are in the labor force, with 6.1% or 66 of them being unemployed. The group with the highest labor force participation rate are those with the educational attainment of bachelor's degree or higher, with 87.2% or 191 individuals in the labor force. Within the labor force, individuals with bachelor's degree or higher education have the highest percentage of unemployment, with 16.8% or 32 of them being unemployed.
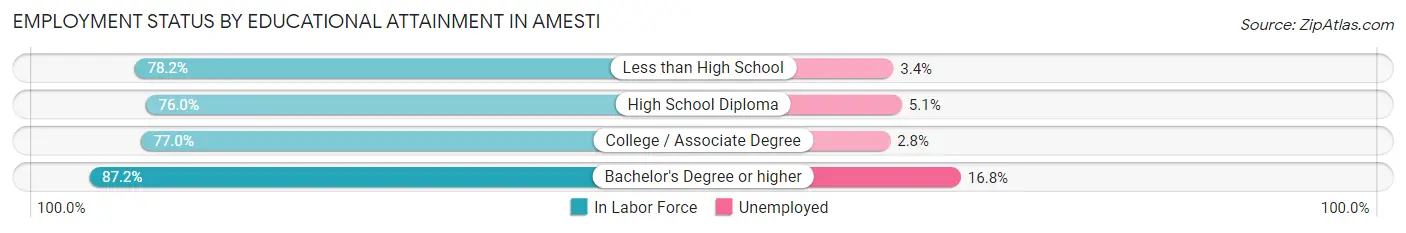
| Educational Attainment | In Labor Force | Unemployed |
| Less than High School | 294 (78.2%) | 13 (3.4%) |
| High School Diploma | 316 (76.0%) | 21 (5.1%) |
| College / Associate Degree | 282 (77.0%) | 10 (2.8%) |
| Bachelor's Degree or higher | 191 (87.2%) | 37 (16.8%) |
| Total | 1,082 (78.6%) | 84 (6.1%) |
Employment Occupations by Sex in Amesti
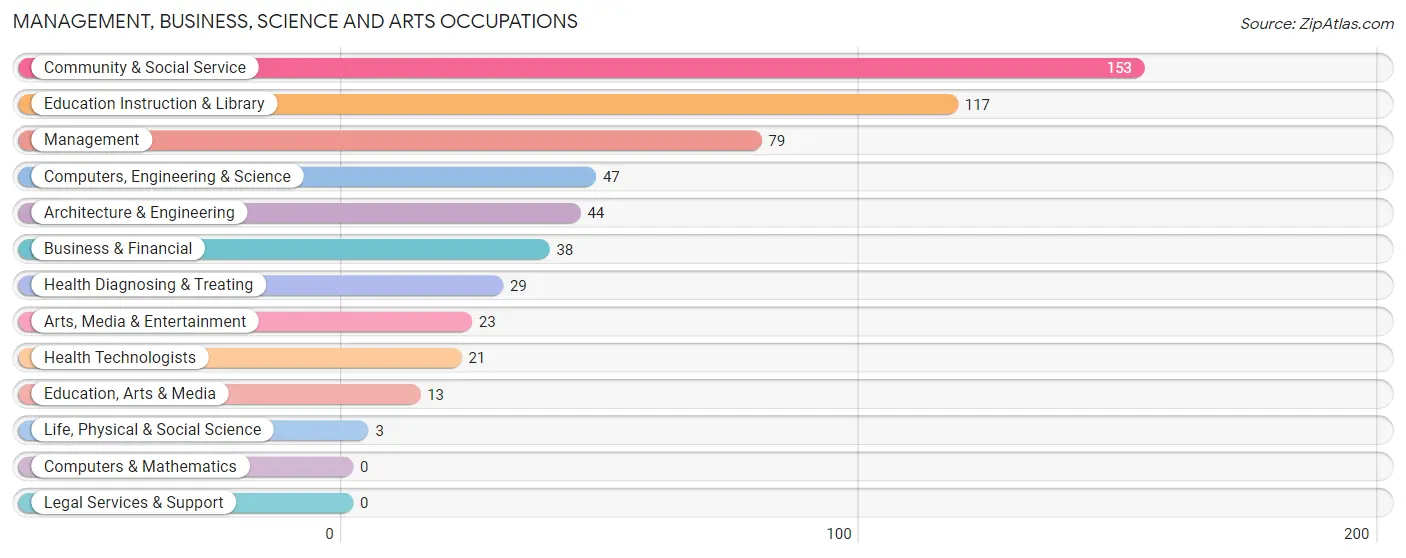
Management, Business, Science and Arts Occupations
The most common Management, Business, Science and Arts occupations in Amesti are Community & Social Service (153 | 10.9%), Education Instruction & Library (117 | 8.3%), Management (79 | 5.6%), Computers, Engineering & Science (47 | 3.3%), and Architecture & Engineering (44 | 3.1%).
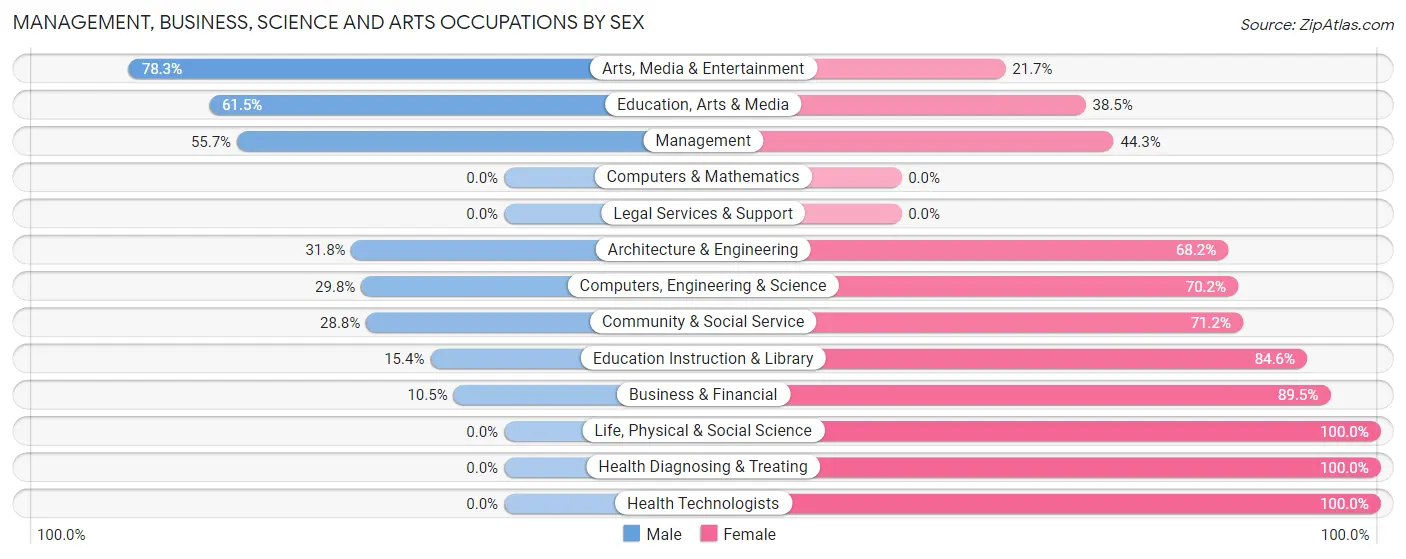
Management, Business, Science and Arts Occupations by Sex
Within the Management, Business, Science and Arts occupations in Amesti, the most male-oriented occupations are Arts, Media & Entertainment (78.3%), Education, Arts & Media (61.5%), and Management (55.7%), while the most female-oriented occupations are Life, Physical & Social Science (100.0%), Health Diagnosing & Treating (100.0%), and Health Technologists (100.0%).
| Occupation | Male | Female |
| Management | 44 (55.7%) | 35 (44.3%) |
| Business & Financial | 4 (10.5%) | 34 (89.5%) |
| Computers, Engineering & Science | 14 (29.8%) | 33 (70.2%) |
| Computers & Mathematics | 0 (0.0%) | 0 (0.0%) |
| Architecture & Engineering | 14 (31.8%) | 30 (68.2%) |
| Life, Physical & Social Science | 0 (0.0%) | 3 (100.0%) |
| Community & Social Service | 44 (28.8%) | 109 (71.2%) |
| Education, Arts & Media | 8 (61.5%) | 5 (38.5%) |
| Legal Services & Support | 0 (0.0%) | 0 (0.0%) |
| Education Instruction & Library | 18 (15.4%) | 99 (84.6%) |
| Arts, Media & Entertainment | 18 (78.3%) | 5 (21.7%) |
| Health Diagnosing & Treating | 0 (0.0%) | 29 (100.0%) |
| Health Technologists | 0 (0.0%) | 21 (100.0%) |
| Total (Category) | 106 (30.6%) | 240 (69.4%) |
| Total (Overall) | 717 (50.9%) | 691 (49.1%) |
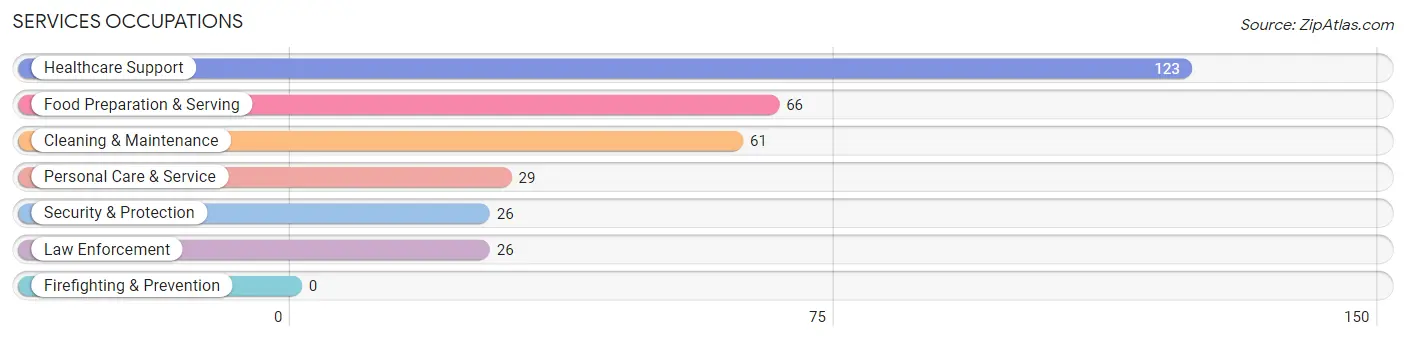
Services Occupations
The most common Services occupations in Amesti are Healthcare Support (123 | 8.7%), Food Preparation & Serving (66 | 4.7%), Cleaning & Maintenance (61 | 4.3%), Personal Care & Service (29 | 2.1%), and Security & Protection (26 | 1.8%).
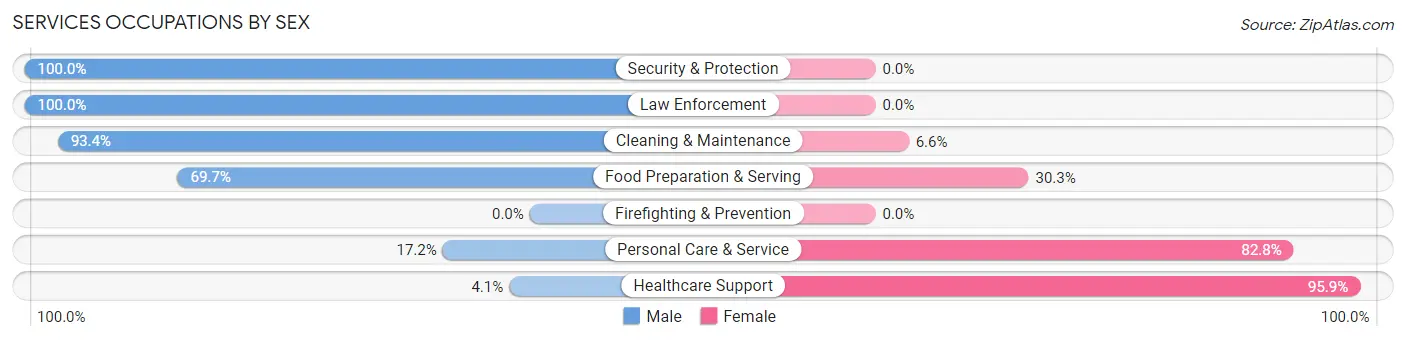
Services Occupations by Sex
Within the Services occupations in Amesti, the most male-oriented occupations are Security & Protection (100.0%), Law Enforcement (100.0%), and Cleaning & Maintenance (93.4%), while the most female-oriented occupations are Healthcare Support (95.9%), Personal Care & Service (82.8%), and Food Preparation & Serving (30.3%).
| Occupation | Male | Female |
| Healthcare Support | 5 (4.1%) | 118 (95.9%) |
| Security & Protection | 26 (100.0%) | 0 (0.0%) |
| Firefighting & Prevention | 0 (0.0%) | 0 (0.0%) |
| Law Enforcement | 26 (100.0%) | 0 (0.0%) |
| Food Preparation & Serving | 46 (69.7%) | 20 (30.3%) |
| Cleaning & Maintenance | 57 (93.4%) | 4 (6.6%) |
| Personal Care & Service | 5 (17.2%) | 24 (82.8%) |
| Total (Category) | 139 (45.6%) | 166 (54.4%) |
| Total (Overall) | 717 (50.9%) | 691 (49.1%) |
Sales and Office Occupations
The most common Sales and Office occupations in Amesti are Office & Administration (185 | 13.1%), and Sales & Related (54 | 3.8%).
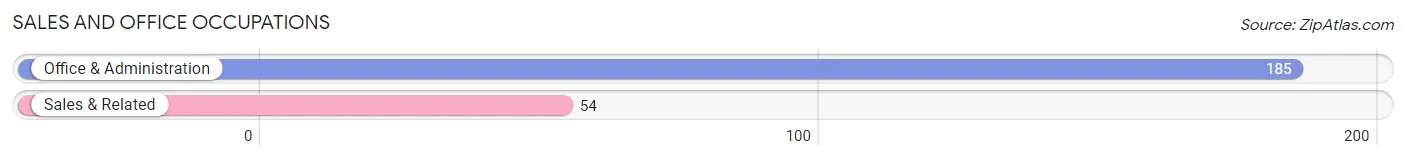
Sales and Office Occupations by Sex
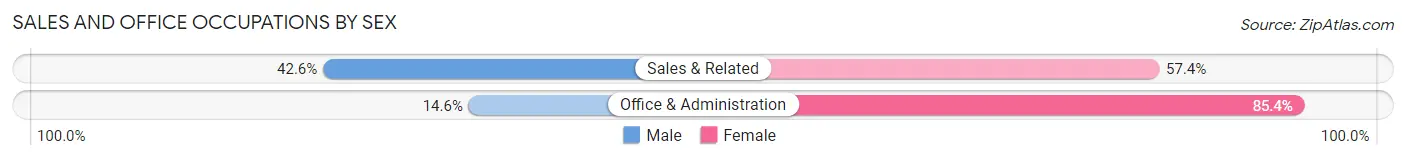
| Occupation | Male | Female |
| Sales & Related | 23 (42.6%) | 31 (57.4%) |
| Office & Administration | 27 (14.6%) | 158 (85.4%) |
| Total (Category) | 50 (20.9%) | 189 (79.1%) |
| Total (Overall) | 717 (50.9%) | 691 (49.1%) |
Natural Resources, Construction and Maintenance Occupations
The most common Natural Resources, Construction and Maintenance occupations in Amesti are Farming, Fishing & Forestry (175 | 12.4%), Construction & Extraction (113 | 8.0%), and Installation, Maintenance & Repair (9 | 0.6%).
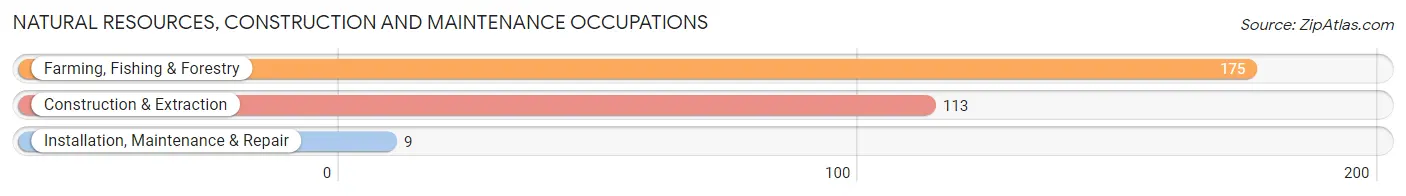
Natural Resources, Construction and Maintenance Occupations by Sex
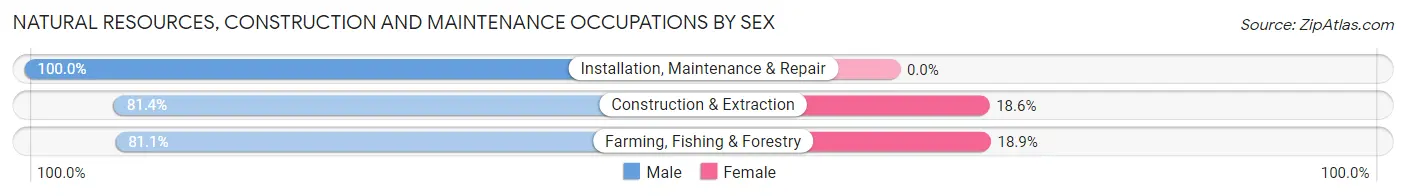
| Occupation | Male | Female |
| Farming, Fishing & Forestry | 142 (81.1%) | 33 (18.9%) |
| Construction & Extraction | 92 (81.4%) | 21 (18.6%) |
| Installation, Maintenance & Repair | 9 (100.0%) | 0 (0.0%) |
| Total (Category) | 243 (81.8%) | 54 (18.2%) |
| Total (Overall) | 717 (50.9%) | 691 (49.1%) |
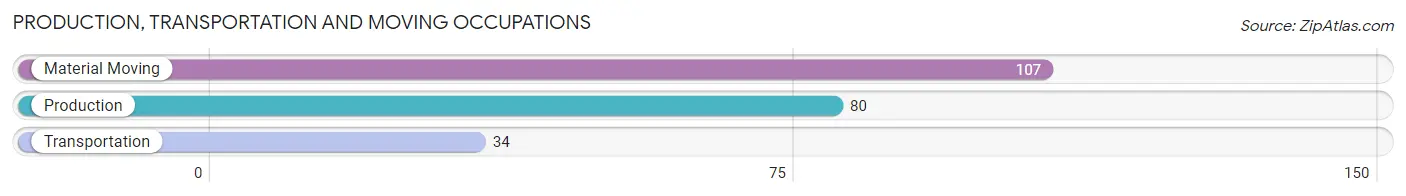
Production, Transportation and Moving Occupations
The most common Production, Transportation and Moving occupations in Amesti are Material Moving (107 | 7.6%), Production (80 | 5.7%), and Transportation (34 | 2.4%).
Production, Transportation and Moving Occupations by Sex
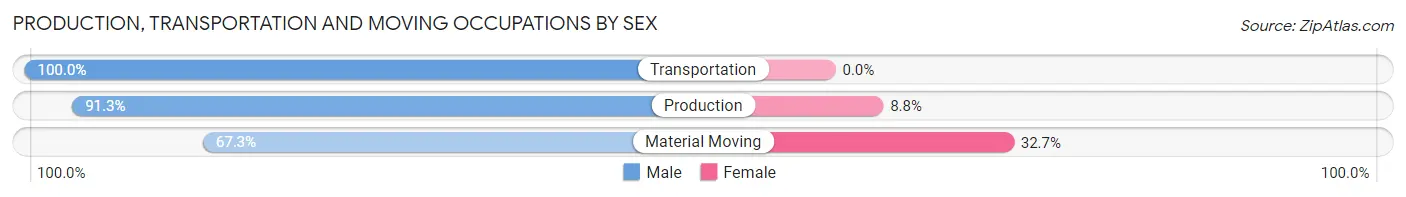
| Occupation | Male | Female |
| Production | 73 (91.2%) | 7 (8.7%) |
| Transportation | 34 (100.0%) | 0 (0.0%) |
| Material Moving | 72 (67.3%) | 35 (32.7%) |
| Total (Category) | 179 (81.0%) | 42 (19.0%) |
| Total (Overall) | 717 (50.9%) | 691 (49.1%) |
Employment Industries by Sex in Amesti
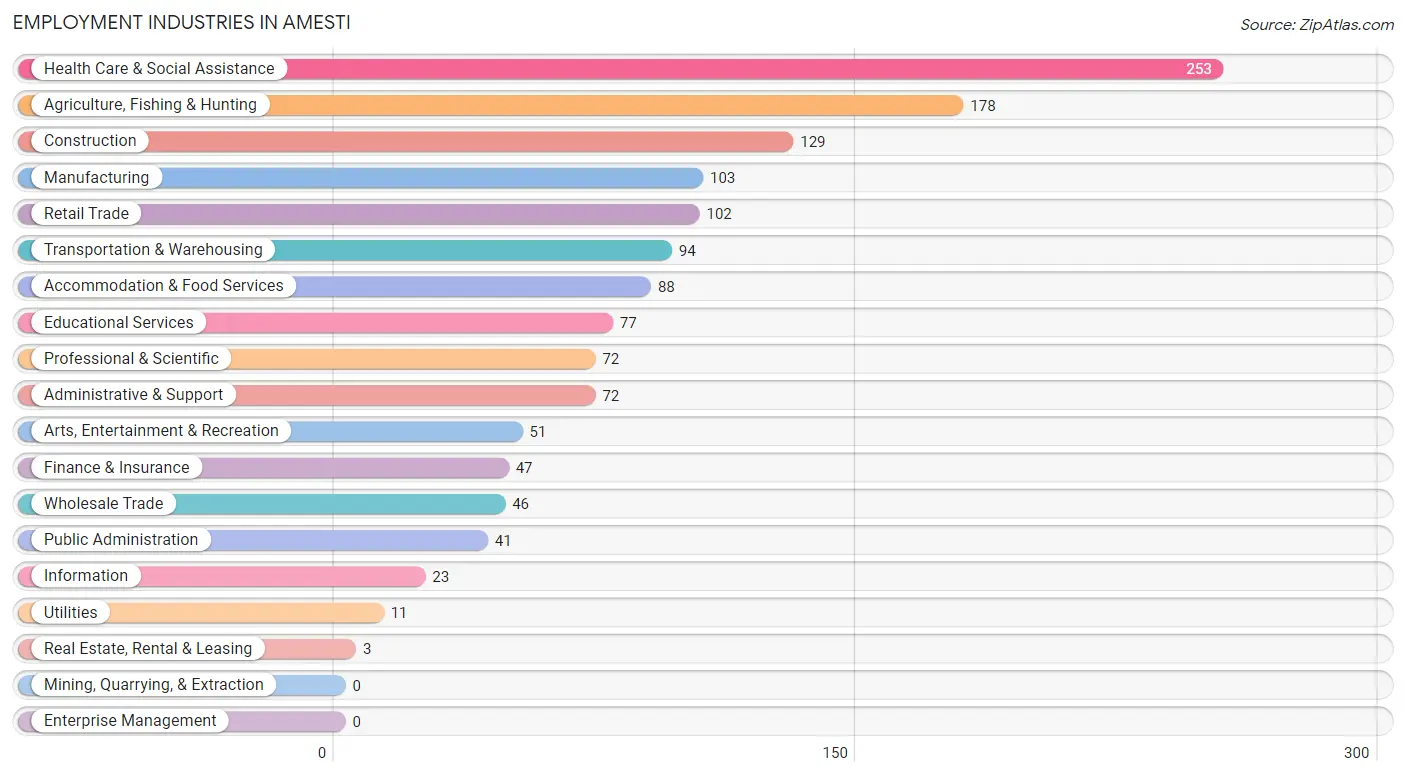
Employment Industries in Amesti
The major employment industries in Amesti include Health Care & Social Assistance (253 | 18.0%), Agriculture, Fishing & Hunting (178 | 12.6%), Construction (129 | 9.2%), Manufacturing (103 | 7.3%), and Retail Trade (102 | 7.2%).
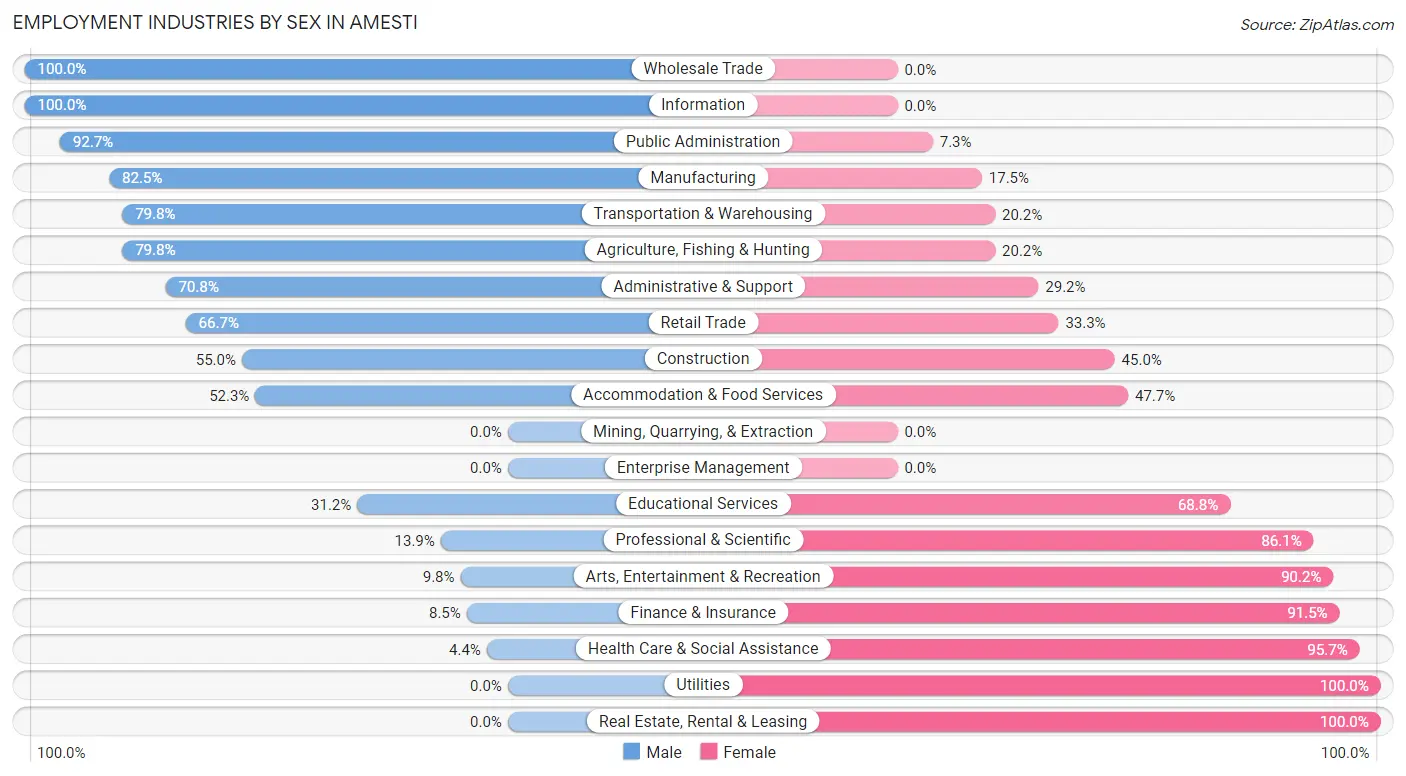
Employment Industries by Sex in Amesti
The Amesti industries that see more men than women are Wholesale Trade (100.0%), Information (100.0%), and Public Administration (92.7%), whereas the industries that tend to have a higher number of women are Utilities (100.0%), Real Estate, Rental & Leasing (100.0%), and Health Care & Social Assistance (95.7%).
| Industry | Male | Female |
| Agriculture, Fishing & Hunting | 142 (79.8%) | 36 (20.2%) |
| Mining, Quarrying, & Extraction | 0 (0.0%) | 0 (0.0%) |
| Construction | 71 (55.0%) | 58 (45.0%) |
| Manufacturing | 85 (82.5%) | 18 (17.5%) |
| Wholesale Trade | 46 (100.0%) | 0 (0.0%) |
| Retail Trade | 68 (66.7%) | 34 (33.3%) |
| Transportation & Warehousing | 75 (79.8%) | 19 (20.2%) |
| Utilities | 0 (0.0%) | 11 (100.0%) |
| Information | 23 (100.0%) | 0 (0.0%) |
| Finance & Insurance | 4 (8.5%) | 43 (91.5%) |
| Real Estate, Rental & Leasing | 0 (0.0%) | 3 (100.0%) |
| Professional & Scientific | 10 (13.9%) | 62 (86.1%) |
| Enterprise Management | 0 (0.0%) | 0 (0.0%) |
| Administrative & Support | 51 (70.8%) | 21 (29.2%) |
| Educational Services | 24 (31.2%) | 53 (68.8%) |
| Health Care & Social Assistance | 11 (4.3%) | 242 (95.7%) |
| Arts, Entertainment & Recreation | 5 (9.8%) | 46 (90.2%) |
| Accommodation & Food Services | 46 (52.3%) | 42 (47.7%) |
| Public Administration | 38 (92.7%) | 3 (7.3%) |
| Total | 717 (50.9%) | 691 (49.1%) |
Education in Amesti
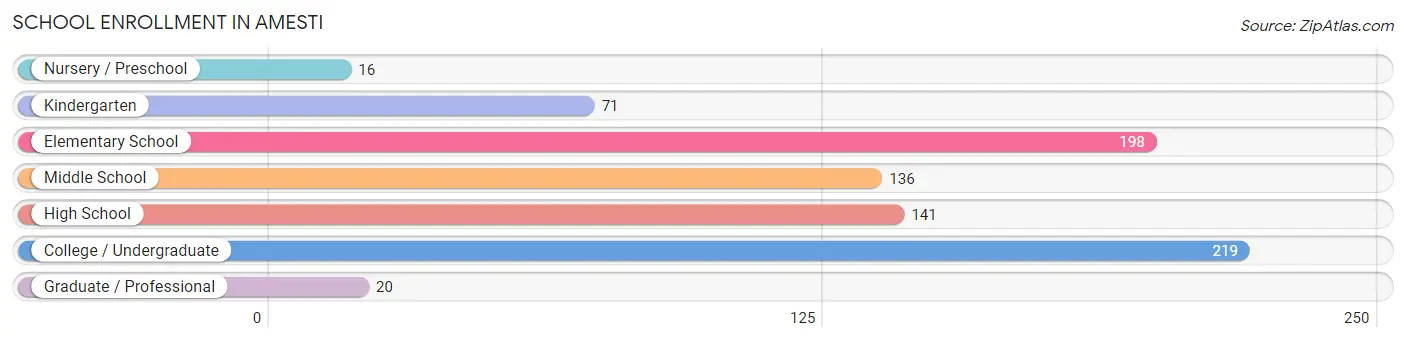
School Enrollment in Amesti
The most common levels of schooling among the 801 students in Amesti are college / undergraduate (219 | 27.3%), elementary school (198 | 24.7%), and high school (141 | 17.6%).
| School Level | # Students | % Students |
| Nursery / Preschool | 16 | 2.0% |
| Kindergarten | 71 | 8.9% |
| Elementary School | 198 | 24.7% |
| Middle School | 136 | 17.0% |
| High School | 141 | 17.6% |
| College / Undergraduate | 219 | 27.3% |
| Graduate / Professional | 20 | 2.5% |
| Total | 801 | 100.0% |
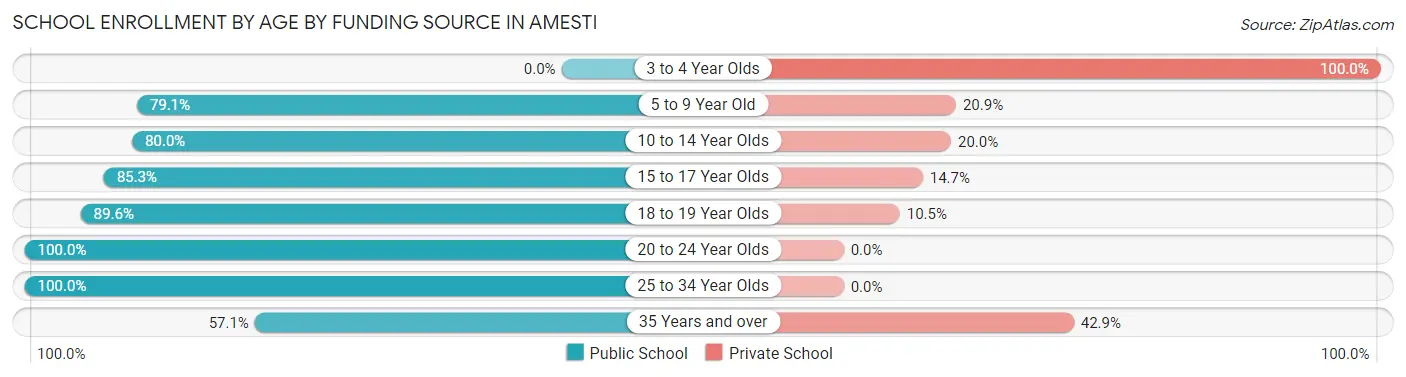
School Enrollment by Age by Funding Source in Amesti
Out of a total of 801 students who are enrolled in schools in Amesti, 120 (15.0%) attend a private institution, while the remaining 681 (85.0%) are enrolled in public schools. The age group of 3 to 4 year olds has the highest likelihood of being enrolled in private schools, with 2 (100.0% in the age bracket) enrolled. Conversely, the age group of 20 to 24 year olds has the lowest likelihood of being enrolled in a private school, with 145 (100.0% in the age bracket) attending a public institution.
| Age Bracket | Public School | Private School |
| 3 to 4 Year Olds | 0 (0.0%) | 2 (100.0%) |
| 5 to 9 Year Old | 189 (79.1%) | 50 (20.9%) |
| 10 to 14 Year Olds | 152 (80.0%) | 38 (20.0%) |
| 15 to 17 Year Olds | 81 (85.3%) | 14 (14.7%) |
| 18 to 19 Year Olds | 60 (89.5%) | 7 (10.4%) |
| 20 to 24 Year Olds | 145 (100.0%) | 0 (0.0%) |
| 25 to 34 Year Olds | 42 (100.0%) | 0 (0.0%) |
| 35 Years and over | 12 (57.1%) | 9 (42.9%) |
| Total | 681 (85.0%) | 120 (15.0%) |
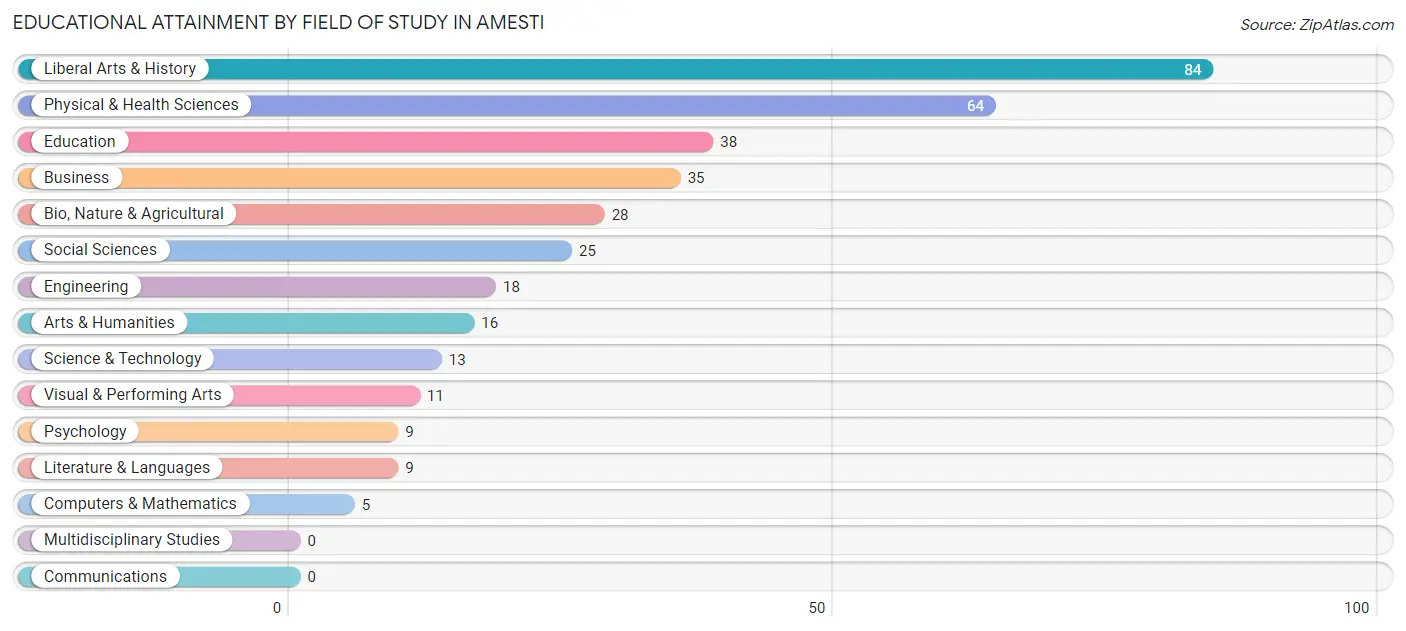
Educational Attainment by Field of Study in Amesti
Liberal arts & history (84 | 23.7%), physical & health sciences (64 | 18.0%), education (38 | 10.7%), business (35 | 9.9%), and bio, nature & agricultural (28 | 7.9%) are the most common fields of study among 355 individuals in Amesti who have obtained a bachelor's degree or higher.
| Field of Study | # Graduates | % Graduates |
| Computers & Mathematics | 5 | 1.4% |
| Bio, Nature & Agricultural | 28 | 7.9% |
| Physical & Health Sciences | 64 | 18.0% |
| Psychology | 9 | 2.5% |
| Social Sciences | 25 | 7.0% |
| Engineering | 18 | 5.1% |
| Multidisciplinary Studies | 0 | 0.0% |
| Science & Technology | 13 | 3.7% |
| Business | 35 | 9.9% |
| Education | 38 | 10.7% |
| Literature & Languages | 9 | 2.5% |
| Liberal Arts & History | 84 | 23.7% |
| Visual & Performing Arts | 11 | 3.1% |
| Communications | 0 | 0.0% |
| Arts & Humanities | 16 | 4.5% |
| Total | 355 | 100.0% |
Transportation & Commute in Amesti
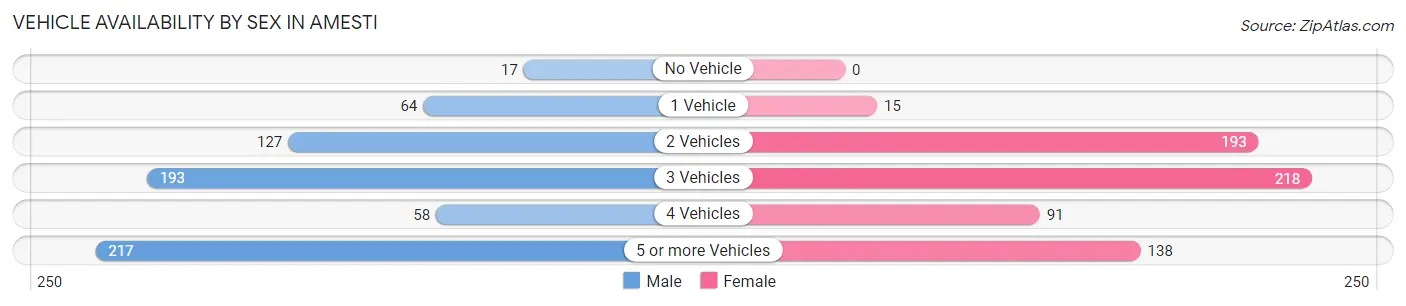
Vehicle Availability by Sex in Amesti
The most prevalent vehicle ownership categories in Amesti are males with 5 or more vehicles (217, accounting for 32.1%) and females with 5 or more vehicles (138, making up 33.1%).
| Vehicles Available | Male | Female |
| No Vehicle | 17 (2.5%) | 0 (0.0%) |
| 1 Vehicle | 64 (9.5%) | 15 (2.3%) |
| 2 Vehicles | 127 (18.8%) | 193 (29.5%) |
| 3 Vehicles | 193 (28.5%) | 218 (33.3%) |
| 4 Vehicles | 58 (8.6%) | 91 (13.9%) |
| 5 or more Vehicles | 217 (32.1%) | 138 (21.1%) |
| Total | 676 (100.0%) | 655 (100.0%) |
Commute Time in Amesti
The most frequently occuring commute durations in Amesti are 20 to 24 minutes (263 commuters, 22.6%), 45 to 59 minutes (150 commuters, 12.9%), and 10 to 14 minutes (143 commuters, 12.3%).
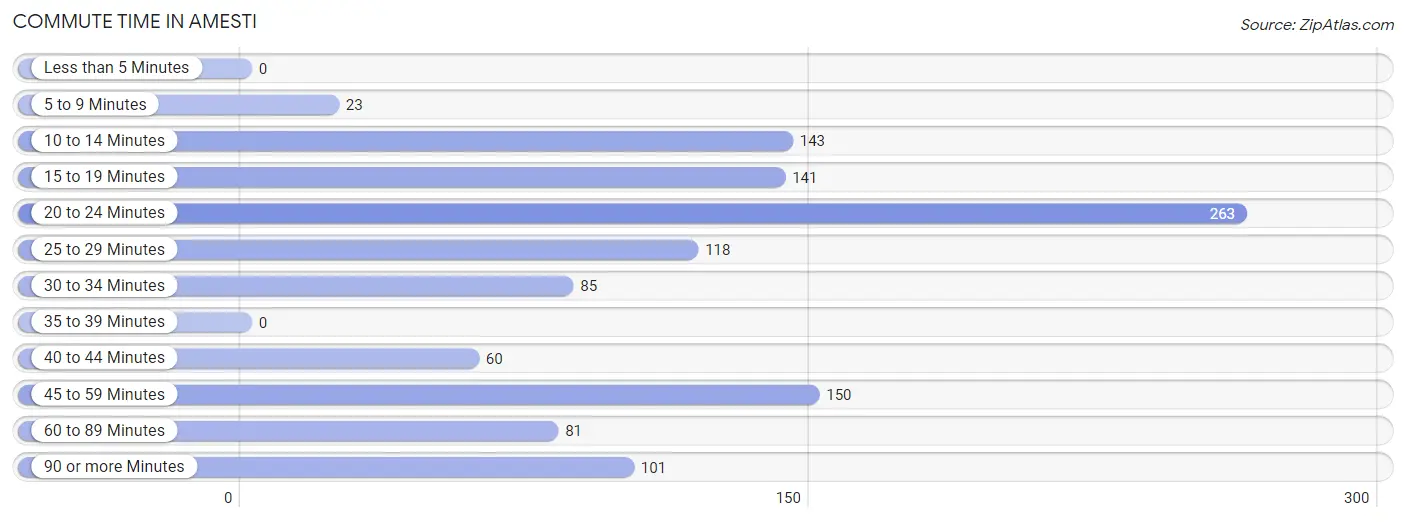
| Commute Time | # Commuters | % Commuters |
| Less than 5 Minutes | 0 | 0.0% |
| 5 to 9 Minutes | 23 | 2.0% |
| 10 to 14 Minutes | 143 | 12.3% |
| 15 to 19 Minutes | 141 | 12.1% |
| 20 to 24 Minutes | 263 | 22.6% |
| 25 to 29 Minutes | 118 | 10.1% |
| 30 to 34 Minutes | 85 | 7.3% |
| 35 to 39 Minutes | 0 | 0.0% |
| 40 to 44 Minutes | 60 | 5.1% |
| 45 to 59 Minutes | 150 | 12.9% |
| 60 to 89 Minutes | 81 | 7.0% |
| 90 or more Minutes | 101 | 8.7% |
Commute Time by Sex in Amesti
The most common commute times in Amesti are 20 to 24 minutes (144 commuters, 24.3%) for males and 10 to 14 minutes (125 commuters, 21.8%) for females.
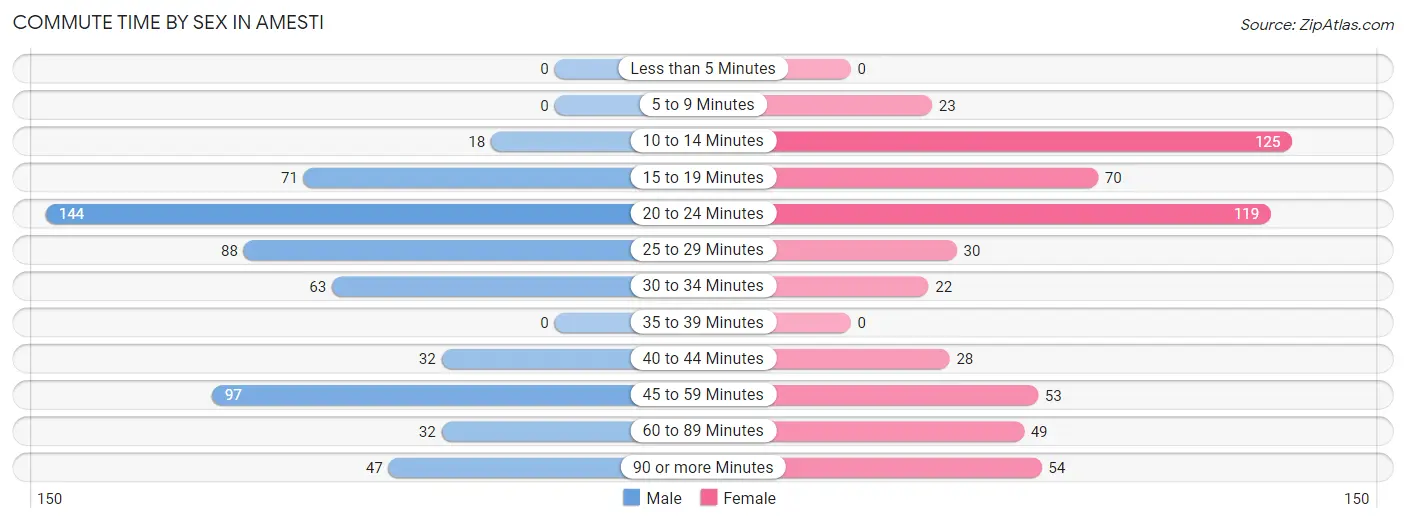
| Commute Time | Male | Female |
| Less than 5 Minutes | 0 (0.0%) | 0 (0.0%) |
| 5 to 9 Minutes | 0 (0.0%) | 23 (4.0%) |
| 10 to 14 Minutes | 18 (3.0%) | 125 (21.8%) |
| 15 to 19 Minutes | 71 (12.0%) | 70 (12.2%) |
| 20 to 24 Minutes | 144 (24.3%) | 119 (20.8%) |
| 25 to 29 Minutes | 88 (14.9%) | 30 (5.2%) |
| 30 to 34 Minutes | 63 (10.6%) | 22 (3.8%) |
| 35 to 39 Minutes | 0 (0.0%) | 0 (0.0%) |
| 40 to 44 Minutes | 32 (5.4%) | 28 (4.9%) |
| 45 to 59 Minutes | 97 (16.4%) | 53 (9.2%) |
| 60 to 89 Minutes | 32 (5.4%) | 49 (8.6%) |
| 90 or more Minutes | 47 (7.9%) | 54 (9.4%) |
Time of Departure to Work by Sex in Amesti
The most frequent times of departure to work in Amesti are 6:00 AM to 6:29 AM (152, 25.7%) for males and 8:00 AM to 8:29 AM (128, 22.3%) for females.
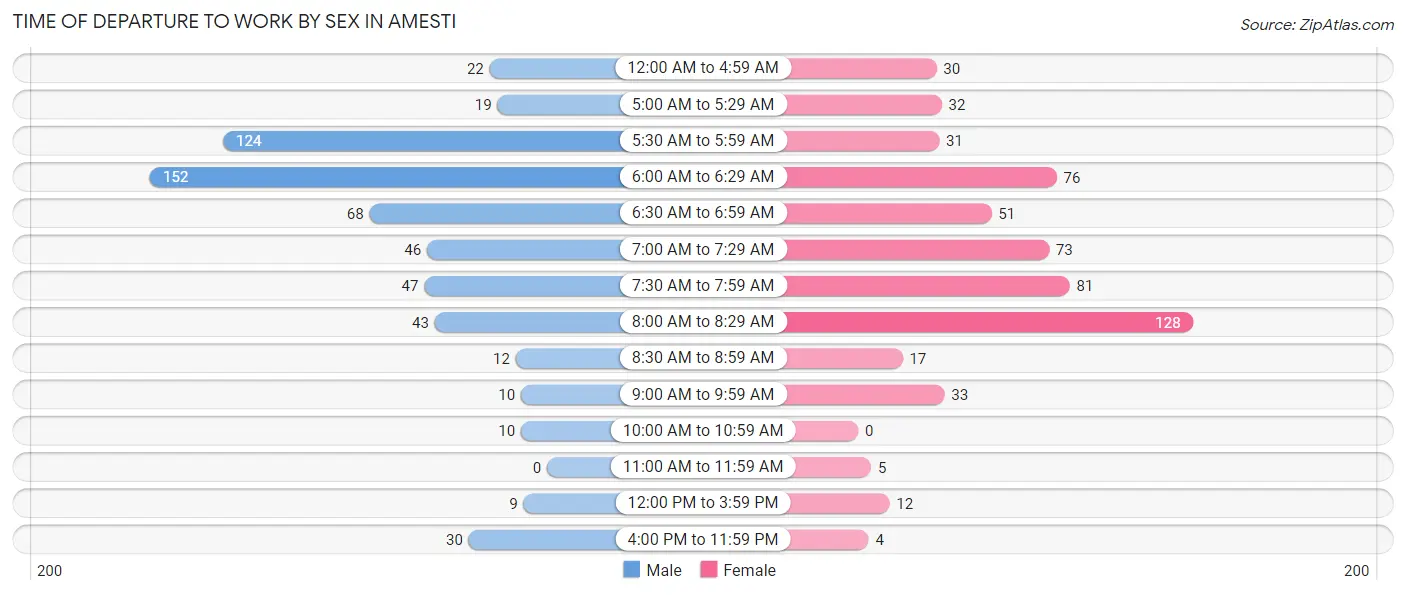
| Time of Departure | Male | Female |
| 12:00 AM to 4:59 AM | 22 (3.7%) | 30 (5.2%) |
| 5:00 AM to 5:29 AM | 19 (3.2%) | 32 (5.6%) |
| 5:30 AM to 5:59 AM | 124 (20.9%) | 31 (5.4%) |
| 6:00 AM to 6:29 AM | 152 (25.7%) | 76 (13.3%) |
| 6:30 AM to 6:59 AM | 68 (11.5%) | 51 (8.9%) |
| 7:00 AM to 7:29 AM | 46 (7.8%) | 73 (12.7%) |
| 7:30 AM to 7:59 AM | 47 (7.9%) | 81 (14.1%) |
| 8:00 AM to 8:29 AM | 43 (7.3%) | 128 (22.3%) |
| 8:30 AM to 8:59 AM | 12 (2.0%) | 17 (3.0%) |
| 9:00 AM to 9:59 AM | 10 (1.7%) | 33 (5.8%) |
| 10:00 AM to 10:59 AM | 10 (1.7%) | 0 (0.0%) |
| 11:00 AM to 11:59 AM | 0 (0.0%) | 5 (0.9%) |
| 12:00 PM to 3:59 PM | 9 (1.5%) | 12 (2.1%) |
| 4:00 PM to 11:59 PM | 30 (5.1%) | 4 (0.7%) |
| Total | 592 (100.0%) | 573 (100.0%) |
Housing Occupancy in Amesti
Occupancy by Ownership in Amesti
Of the total 845 dwellings in Amesti, owner-occupied units account for 683 (80.8%), while renter-occupied units make up 162 (19.2%).
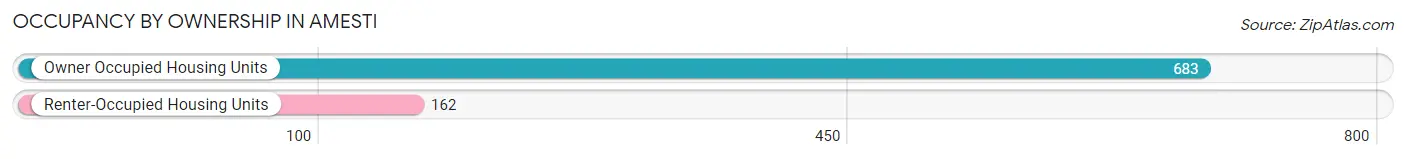
| Occupancy | # Housing Units | % Housing Units |
| Owner Occupied Housing Units | 683 | 80.8% |
| Renter-Occupied Housing Units | 162 | 19.2% |
| Total Occupied Housing Units | 845 | 100.0% |
Occupancy by Household Size in Amesti
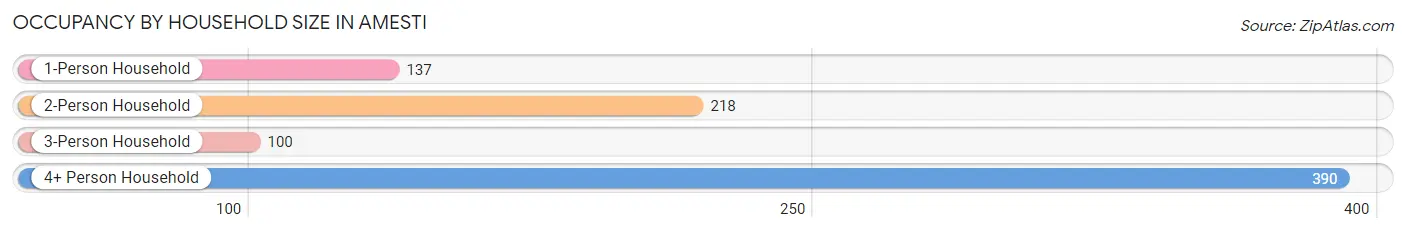
| Household Size | # Housing Units | % Housing Units |
| 1-Person Household | 137 | 16.2% |
| 2-Person Household | 218 | 25.8% |
| 3-Person Household | 100 | 11.8% |
| 4+ Person Household | 390 | 46.2% |
| Total Housing Units | 845 | 100.0% |
Occupancy by Ownership by Household Size in Amesti
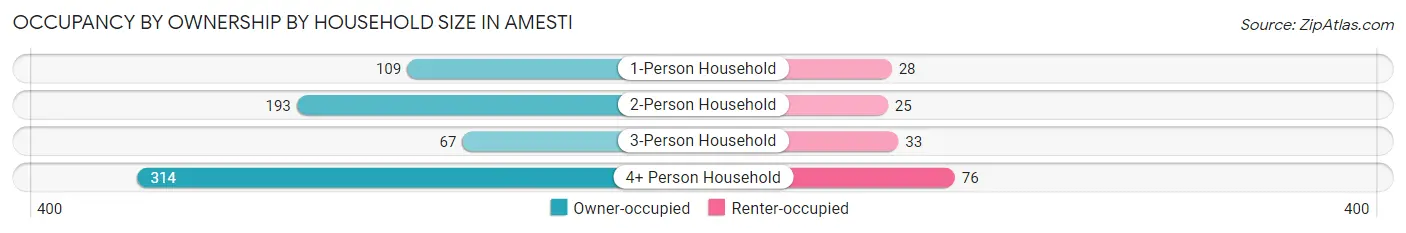
| Household Size | Owner-occupied | Renter-occupied |
| 1-Person Household | 109 (79.6%) | 28 (20.4%) |
| 2-Person Household | 193 (88.5%) | 25 (11.5%) |
| 3-Person Household | 67 (67.0%) | 33 (33.0%) |
| 4+ Person Household | 314 (80.5%) | 76 (19.5%) |
| Total Housing Units | 683 (80.8%) | 162 (19.2%) |
Occupancy by Educational Attainment in Amesti
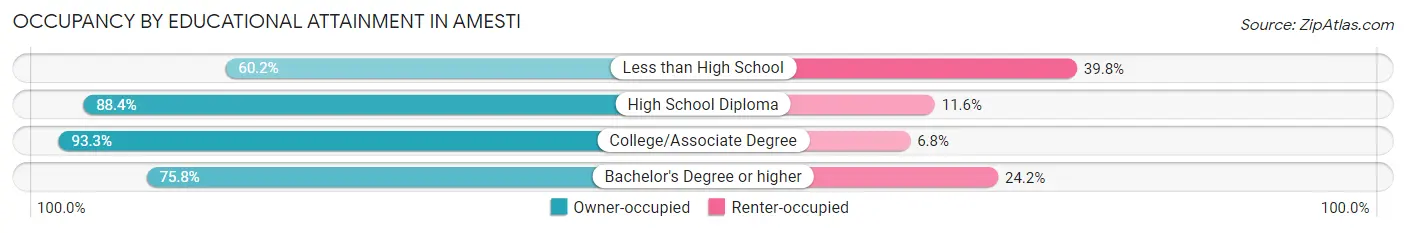
| Household Size | Owner-occupied | Renter-occupied |
| Less than High School | 121 (60.2%) | 80 (39.8%) |
| High School Diploma | 228 (88.4%) | 30 (11.6%) |
| College/Associate Degree | 221 (93.2%) | 16 (6.8%) |
| Bachelor's Degree or higher | 113 (75.8%) | 36 (24.2%) |
Occupancy by Age of Householder in Amesti
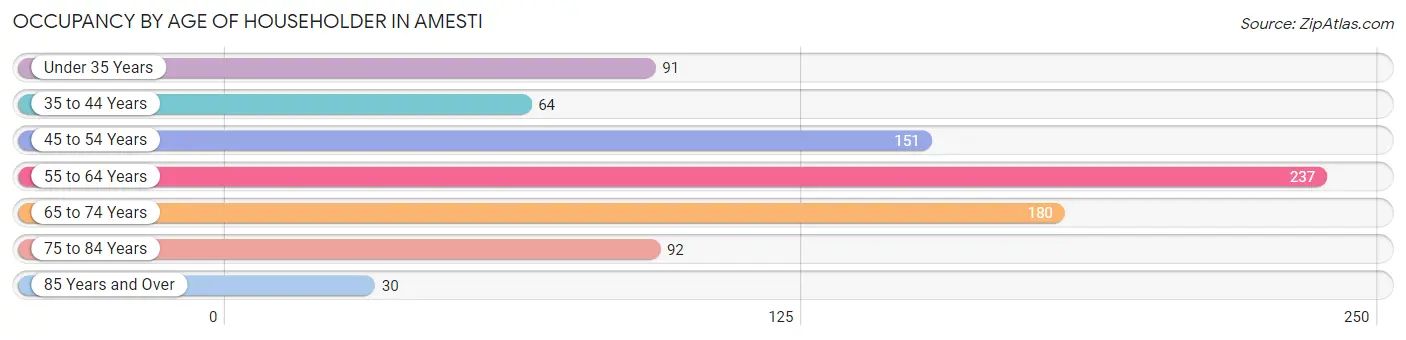
| Age Bracket | # Households | % Households |
| Under 35 Years | 91 | 10.8% |
| 35 to 44 Years | 64 | 7.6% |
| 45 to 54 Years | 151 | 17.9% |
| 55 to 64 Years | 237 | 28.1% |
| 65 to 74 Years | 180 | 21.3% |
| 75 to 84 Years | 92 | 10.9% |
| 85 Years and Over | 30 | 3.5% |
| Total | 845 | 100.0% |
Housing Finances in Amesti
Median Income by Occupancy in Amesti
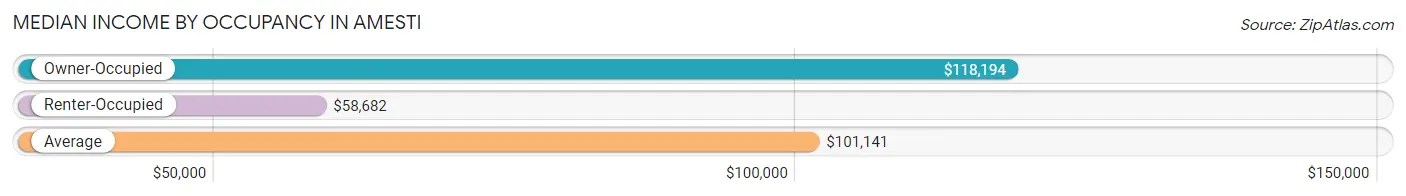
| Occupancy Type | # Households | Median Income |
| Owner-Occupied | 683 (80.8%) | $118,194 |
| Renter-Occupied | 162 (19.2%) | $58,682 |
| Average | 845 (100.0%) | $101,141 |
Occupancy by Householder Income Bracket in Amesti
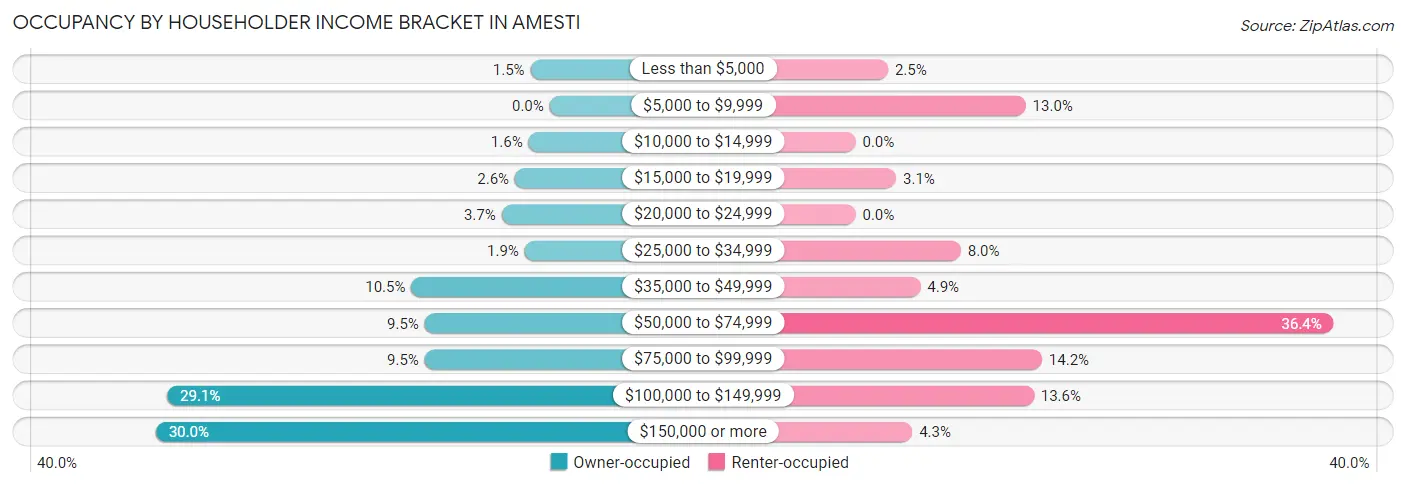
| Income Bracket | Owner-occupied | Renter-occupied |
| Less than $5,000 | 10 (1.5%) | 4 (2.5%) |
| $5,000 to $9,999 | 0 (0.0%) | 21 (13.0%) |
| $10,000 to $14,999 | 11 (1.6%) | 0 (0.0%) |
| $15,000 to $19,999 | 18 (2.6%) | 5 (3.1%) |
| $20,000 to $24,999 | 25 (3.7%) | 0 (0.0%) |
| $25,000 to $34,999 | 13 (1.9%) | 13 (8.0%) |
| $35,000 to $49,999 | 72 (10.5%) | 8 (4.9%) |
| $50,000 to $74,999 | 65 (9.5%) | 59 (36.4%) |
| $75,000 to $99,999 | 65 (9.5%) | 23 (14.2%) |
| $100,000 to $149,999 | 199 (29.1%) | 22 (13.6%) |
| $150,000 or more | 205 (30.0%) | 7 (4.3%) |
| Total | 683 (100.0%) | 162 (100.0%) |
Monthly Housing Cost Tiers in Amesti
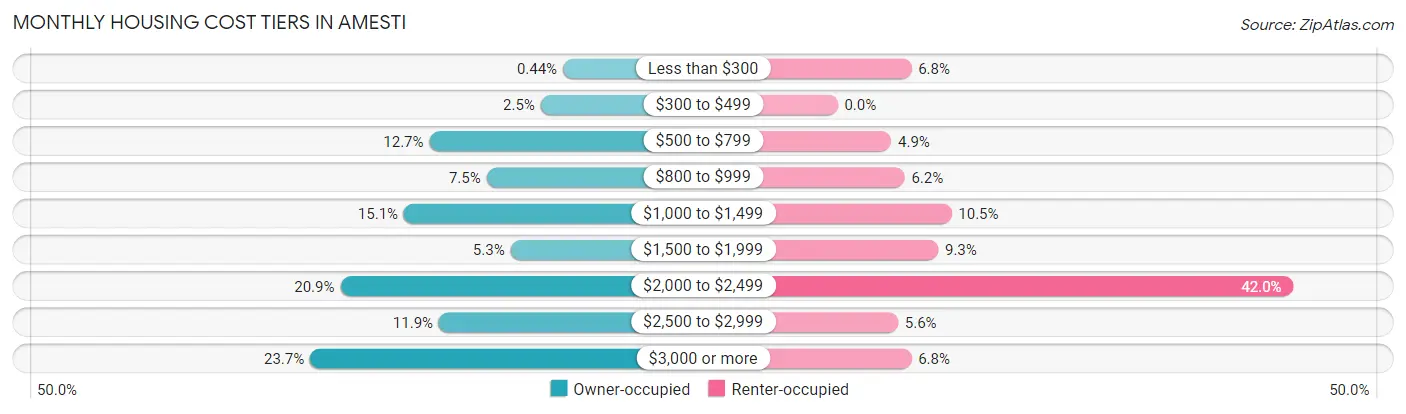
| Monthly Cost | Owner-occupied | Renter-occupied |
| Less than $300 | 3 (0.4%) | 11 (6.8%) |
| $300 to $499 | 17 (2.5%) | 0 (0.0%) |
| $500 to $799 | 87 (12.7%) | 8 (4.9%) |
| $800 to $999 | 51 (7.5%) | 10 (6.2%) |
| $1,000 to $1,499 | 103 (15.1%) | 17 (10.5%) |
| $1,500 to $1,999 | 36 (5.3%) | 15 (9.3%) |
| $2,000 to $2,499 | 143 (20.9%) | 68 (42.0%) |
| $2,500 to $2,999 | 81 (11.9%) | 9 (5.6%) |
| $3,000 or more | 162 (23.7%) | 11 (6.8%) |
| Total | 683 (100.0%) | 162 (100.0%) |
Physical Housing Characteristics in Amesti
Housing Structures in Amesti
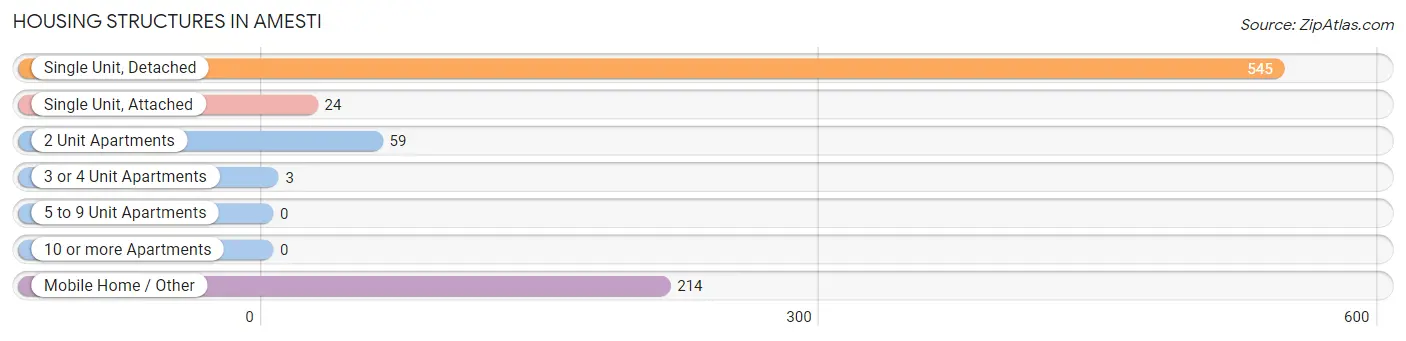
| Structure Type | # Housing Units | % Housing Units |
| Single Unit, Detached | 545 | 64.5% |
| Single Unit, Attached | 24 | 2.8% |
| 2 Unit Apartments | 59 | 7.0% |
| 3 or 4 Unit Apartments | 3 | 0.4% |
| 5 to 9 Unit Apartments | 0 | 0.0% |
| 10 or more Apartments | 0 | 0.0% |
| Mobile Home / Other | 214 | 25.3% |
| Total | 845 | 100.0% |
Housing Structures by Occupancy in Amesti
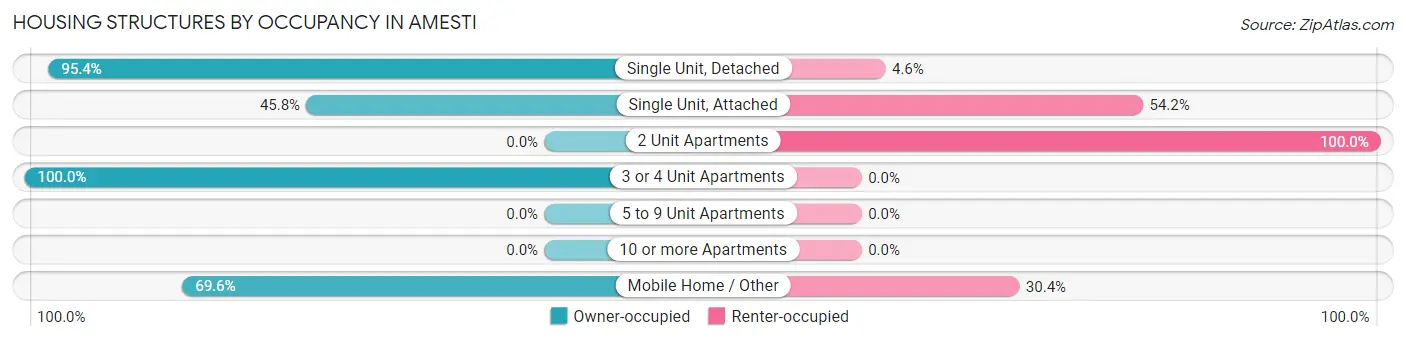
| Structure Type | Owner-occupied | Renter-occupied |
| Single Unit, Detached | 520 (95.4%) | 25 (4.6%) |
| Single Unit, Attached | 11 (45.8%) | 13 (54.2%) |
| 2 Unit Apartments | 0 (0.0%) | 59 (100.0%) |
| 3 or 4 Unit Apartments | 3 (100.0%) | 0 (0.0%) |
| 5 to 9 Unit Apartments | 0 (0.0%) | 0 (0.0%) |
| 10 or more Apartments | 0 (0.0%) | 0 (0.0%) |
| Mobile Home / Other | 149 (69.6%) | 65 (30.4%) |
| Total | 683 (80.8%) | 162 (19.2%) |
Housing Structures by Number of Rooms in Amesti
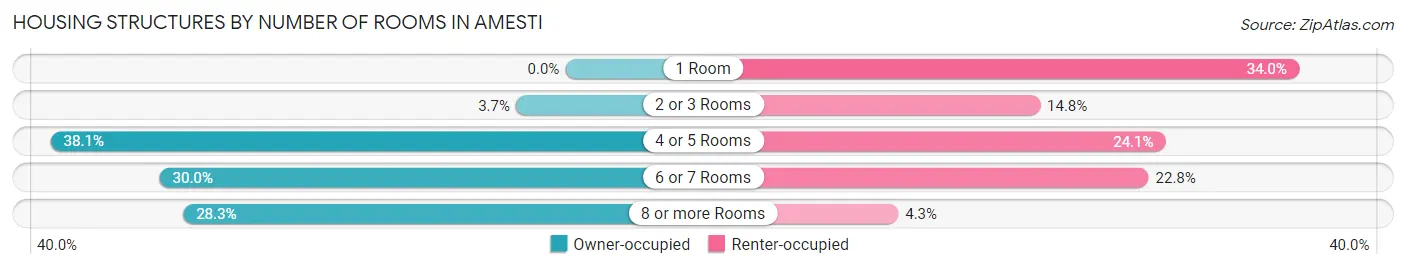
| Number of Rooms | Owner-occupied | Renter-occupied |
| 1 Room | 0 (0.0%) | 55 (34.0%) |
| 2 or 3 Rooms | 25 (3.7%) | 24 (14.8%) |
| 4 or 5 Rooms | 260 (38.1%) | 39 (24.1%) |
| 6 or 7 Rooms | 205 (30.0%) | 37 (22.8%) |
| 8 or more Rooms | 193 (28.3%) | 7 (4.3%) |
| Total | 683 (100.0%) | 162 (100.0%) |
Housing Structure by Heating Type in Amesti
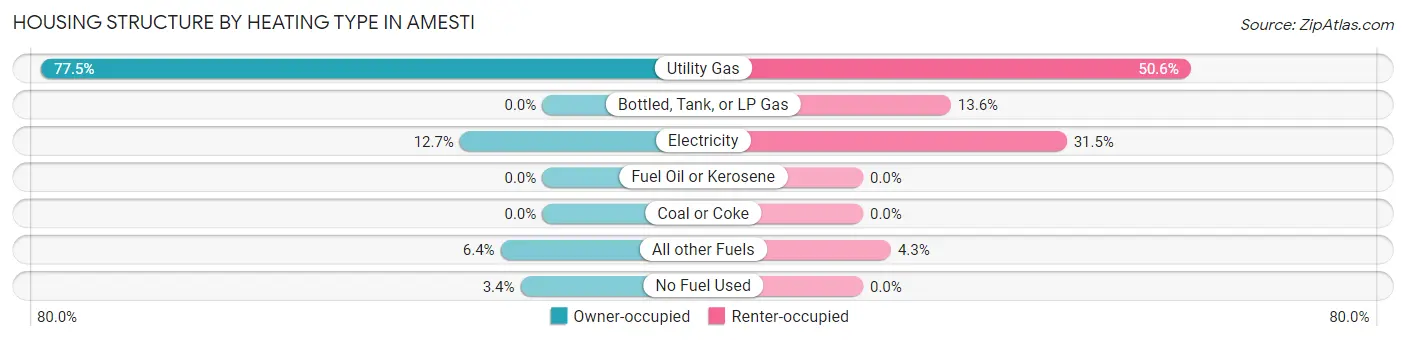
| Heating Type | Owner-occupied | Renter-occupied |
| Utility Gas | 529 (77.4%) | 82 (50.6%) |
| Bottled, Tank, or LP Gas | 0 (0.0%) | 22 (13.6%) |
| Electricity | 87 (12.7%) | 51 (31.5%) |
| Fuel Oil or Kerosene | 0 (0.0%) | 0 (0.0%) |
| Coal or Coke | 0 (0.0%) | 0 (0.0%) |
| All other Fuels | 44 (6.4%) | 7 (4.3%) |
| No Fuel Used | 23 (3.4%) | 0 (0.0%) |
| Total | 683 (100.0%) | 162 (100.0%) |
Household Vehicle Usage in Amesti
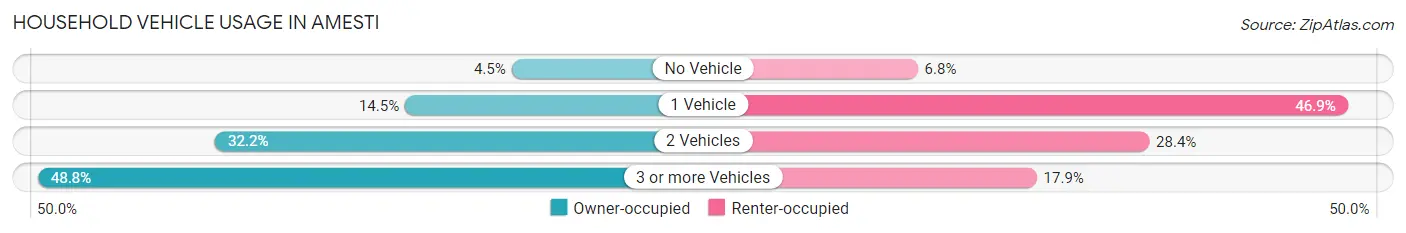
| Vehicles per Household | Owner-occupied | Renter-occupied |
| No Vehicle | 31 (4.5%) | 11 (6.8%) |
| 1 Vehicle | 99 (14.5%) | 76 (46.9%) |
| 2 Vehicles | 220 (32.2%) | 46 (28.4%) |
| 3 or more Vehicles | 333 (48.8%) | 29 (17.9%) |
| Total | 683 (100.0%) | 162 (100.0%) |
Real Estate & Mortgages in Amesti
Real Estate and Mortgage Overview in Amesti
| Characteristic | Without Mortgage | With Mortgage |
| Housing Units | 207 | 476 |
| Median Property Value | $326,200 | $853,600 |
| Median Household Income | - | - |
| Monthly Housing Costs | $798 | $162 |
| Real Estate Taxes | $3,015 | $8 |
Property Value by Mortgage Status in Amesti
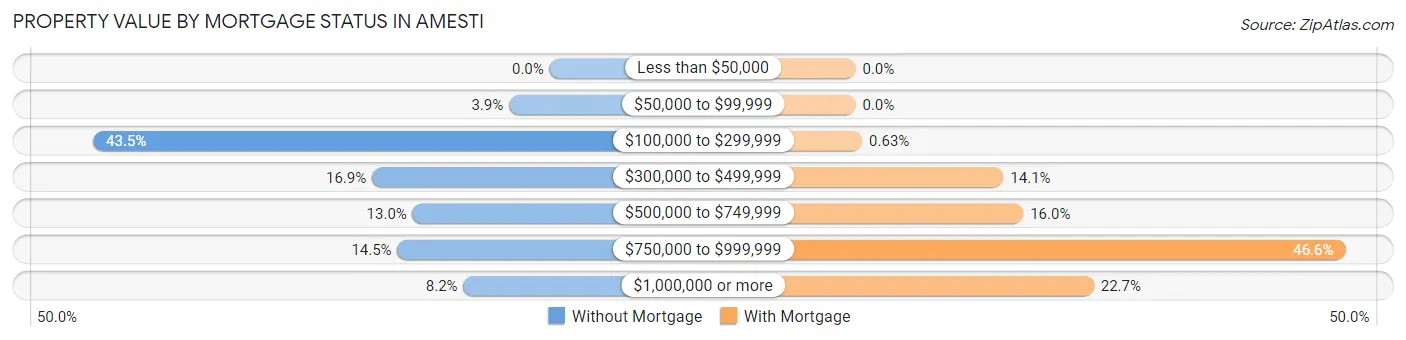
| Property Value | Without Mortgage | With Mortgage |
| Less than $50,000 | 0 (0.0%) | 0 (0.0%) |
| $50,000 to $99,999 | 8 (3.9%) | 0 (0.0%) |
| $100,000 to $299,999 | 90 (43.5%) | 3 (0.6%) |
| $300,000 to $499,999 | 35 (16.9%) | 67 (14.1%) |
| $500,000 to $749,999 | 27 (13.0%) | 76 (16.0%) |
| $750,000 to $999,999 | 30 (14.5%) | 222 (46.6%) |
| $1,000,000 or more | 17 (8.2%) | 108 (22.7%) |
| Total | 207 (100.0%) | 476 (100.0%) |
Household Income by Mortgage Status in Amesti
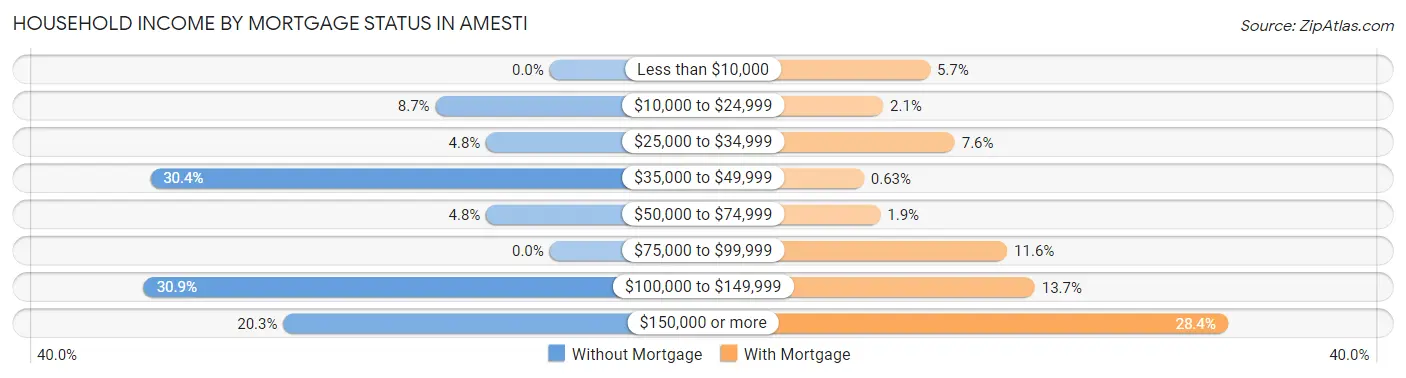
| Household Income | Without Mortgage | With Mortgage |
| Less than $10,000 | 0 (0.0%) | 27 (5.7%) |
| $10,000 to $24,999 | 18 (8.7%) | 10 (2.1%) |
| $25,000 to $34,999 | 10 (4.8%) | 36 (7.6%) |
| $35,000 to $49,999 | 63 (30.4%) | 3 (0.6%) |
| $50,000 to $74,999 | 10 (4.8%) | 9 (1.9%) |
| $75,000 to $99,999 | 0 (0.0%) | 55 (11.6%) |
| $100,000 to $149,999 | 64 (30.9%) | 65 (13.7%) |
| $150,000 or more | 42 (20.3%) | 135 (28.4%) |
| Total | 207 (100.0%) | 476 (100.0%) |
Property Value to Household Income Ratio in Amesti
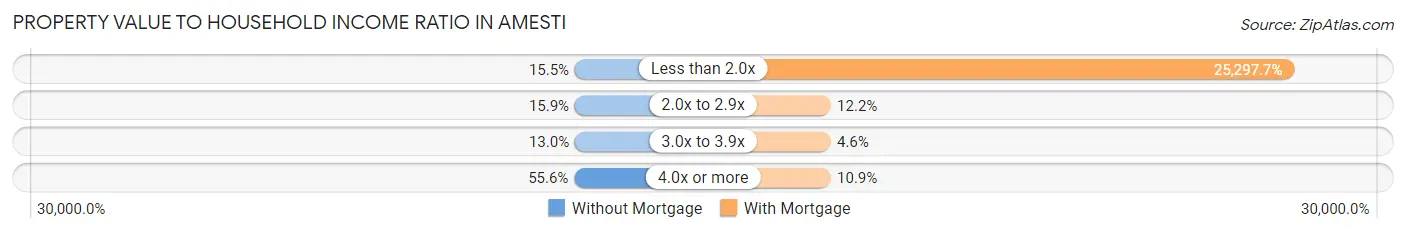
| Value-to-Income Ratio | Without Mortgage | With Mortgage |
| Less than 2.0x | 32 (15.5%) | 120,417 (25,297.7%) |
| 2.0x to 2.9x | 33 (15.9%) | 58 (12.2%) |
| 3.0x to 3.9x | 27 (13.0%) | 22 (4.6%) |
| 4.0x or more | 115 (55.6%) | 52 (10.9%) |
| Total | 207 (100.0%) | 476 (100.0%) |
Real Estate Taxes by Mortgage Status in Amesti
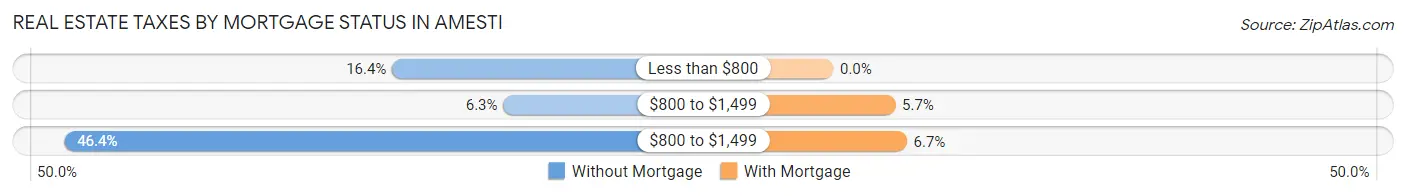
| Property Taxes | Without Mortgage | With Mortgage |
| Less than $800 | 34 (16.4%) | 0 (0.0%) |
| $800 to $1,499 | 13 (6.3%) | 27 (5.7%) |
| $800 to $1,499 | 96 (46.4%) | 32 (6.7%) |
| Total | 207 (100.0%) | 476 (100.0%) |
Health & Disability in Amesti
Health Insurance Coverage by Age in Amesti
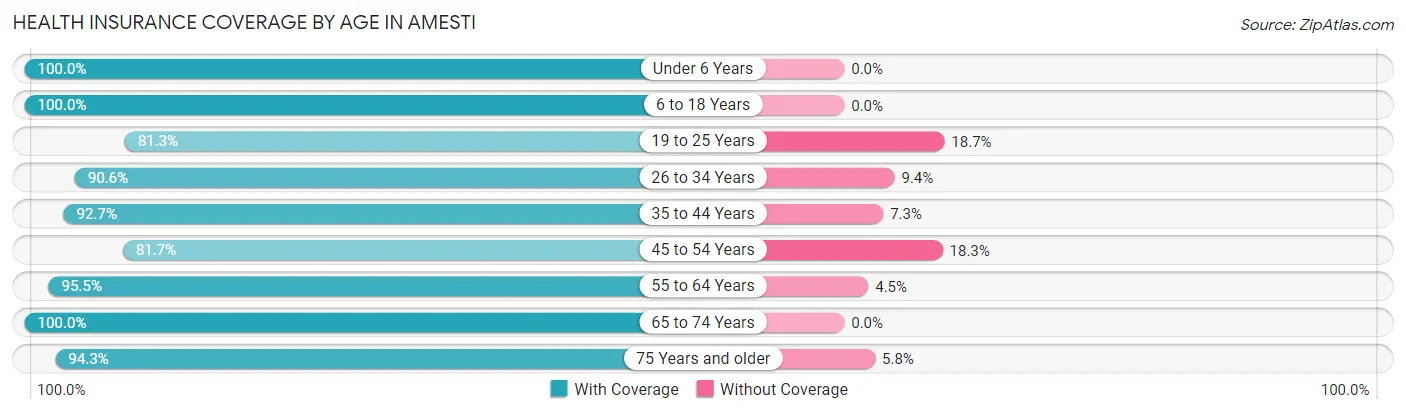
| Age Bracket | With Coverage | Without Coverage |
| Under 6 Years | 105 (100.0%) | 0 (0.0%) |
| 6 to 18 Years | 572 (100.0%) | 0 (0.0%) |
| 19 to 25 Years | 392 (81.3%) | 90 (18.7%) |
| 26 to 34 Years | 358 (90.6%) | 37 (9.4%) |
| 35 to 44 Years | 281 (92.7%) | 22 (7.3%) |
| 45 to 54 Years | 205 (81.7%) | 46 (18.3%) |
| 55 to 64 Years | 406 (95.5%) | 19 (4.5%) |
| 65 to 74 Years | 254 (100.0%) | 0 (0.0%) |
| 75 Years and older | 246 (94.3%) | 15 (5.8%) |
| Total | 2,819 (92.5%) | 229 (7.5%) |
Health Insurance Coverage by Citizenship Status in Amesti
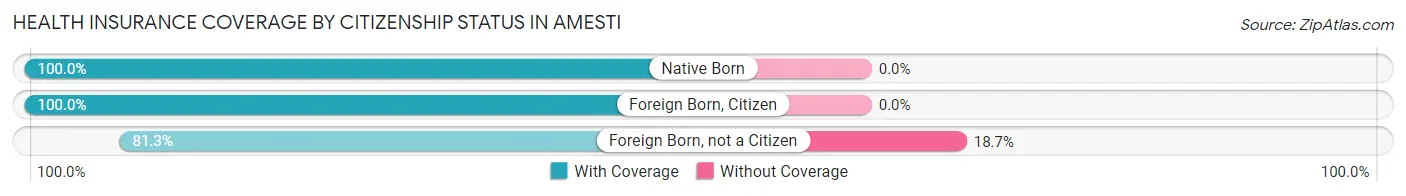
| Citizenship Status | With Coverage | Without Coverage |
| Native Born | 105 (100.0%) | 0 (0.0%) |
| Foreign Born, Citizen | 572 (100.0%) | 0 (0.0%) |
| Foreign Born, not a Citizen | 392 (81.3%) | 90 (18.7%) |
Health Insurance Coverage by Household Income in Amesti
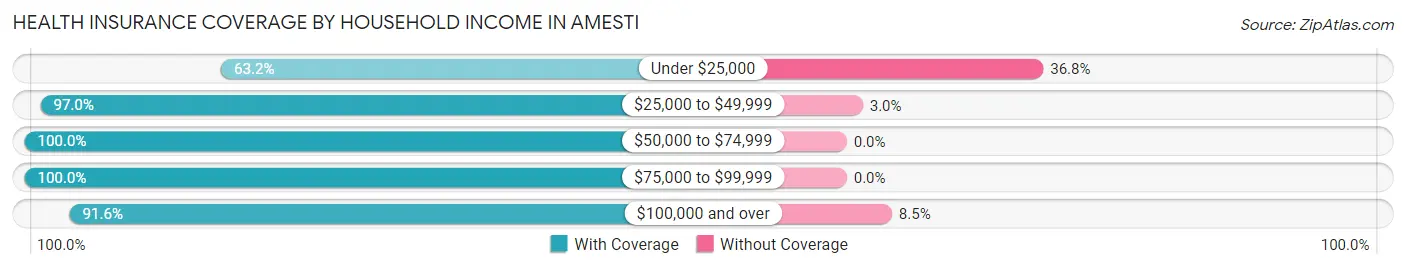
| Household Income | With Coverage | Without Coverage |
| Under $25,000 | 103 (63.2%) | 60 (36.8%) |
| $25,000 to $49,999 | 422 (97.0%) | 13 (3.0%) |
| $50,000 to $74,999 | 314 (100.0%) | 0 (0.0%) |
| $75,000 to $99,999 | 262 (100.0%) | 0 (0.0%) |
| $100,000 and over | 1,690 (91.5%) | 156 (8.5%) |
Public vs Private Health Insurance Coverage by Age in Amesti
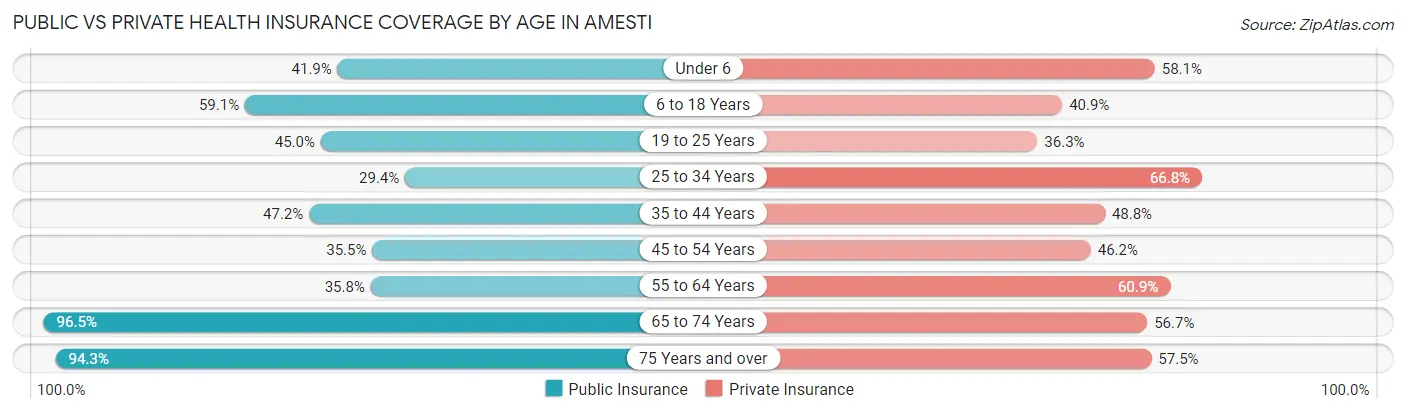
| Age Bracket | Public Insurance | Private Insurance |
| Under 6 | 44 (41.9%) | 61 (58.1%) |
| 6 to 18 Years | 338 (59.1%) | 234 (40.9%) |
| 19 to 25 Years | 217 (45.0%) | 175 (36.3%) |
| 25 to 34 Years | 116 (29.4%) | 264 (66.8%) |
| 35 to 44 Years | 143 (47.2%) | 148 (48.8%) |
| 45 to 54 Years | 89 (35.5%) | 116 (46.2%) |
| 55 to 64 Years | 152 (35.8%) | 259 (60.9%) |
| 65 to 74 Years | 245 (96.5%) | 144 (56.7%) |
| 75 Years and over | 246 (94.3%) | 150 (57.5%) |
| Total | 1,590 (52.2%) | 1,551 (50.9%) |
Disability Status by Sex by Age in Amesti
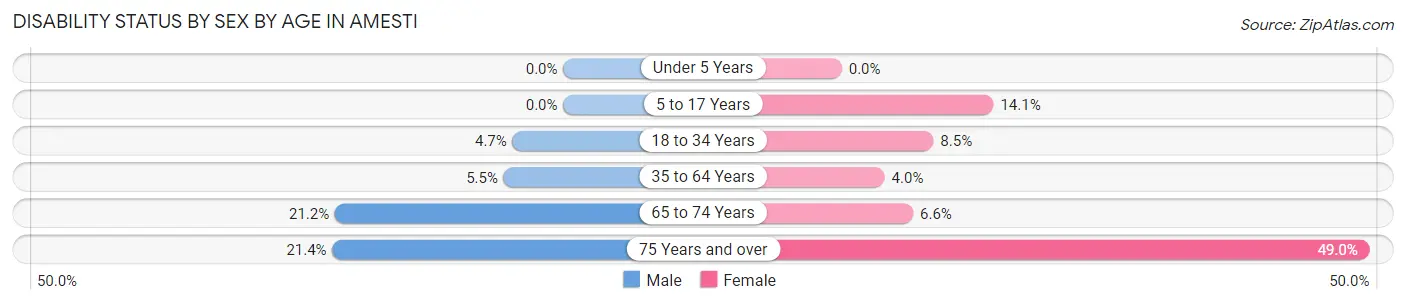
| Age Bracket | Male | Female |
| Under 5 Years | 0 (0.0%) | 0 (0.0%) |
| 5 to 17 Years | 0 (0.0%) | 30 (14.1%) |
| 18 to 34 Years | 28 (4.7%) | 29 (8.5%) |
| 35 to 64 Years | 25 (5.5%) | 21 (4.0%) |
| 65 to 74 Years | 25 (21.2%) | 9 (6.6%) |
| 75 Years and over | 24 (21.4%) | 73 (49.0%) |
Disability Class by Sex by Age in Amesti
Disability Class: Hearing Difficulty
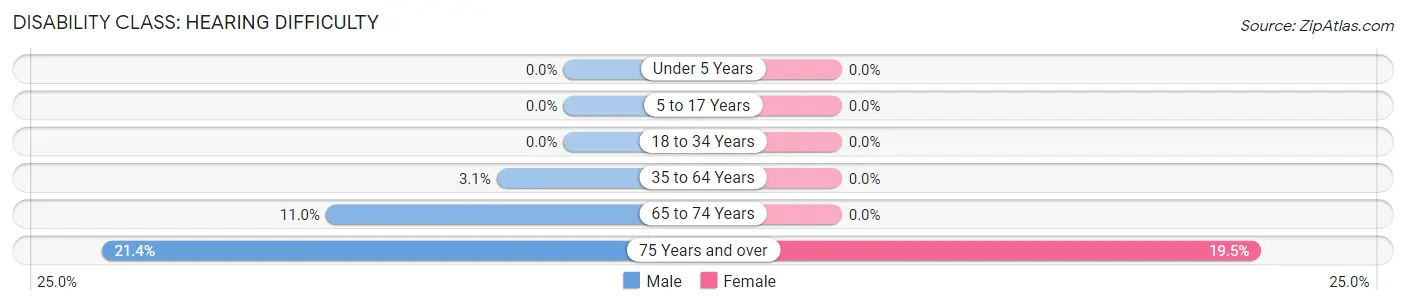
| Age Bracket | Male | Female |
| Under 5 Years | 0 (0.0%) | 0 (0.0%) |
| 5 to 17 Years | 0 (0.0%) | 0 (0.0%) |
| 18 to 34 Years | 0 (0.0%) | 0 (0.0%) |
| 35 to 64 Years | 14 (3.1%) | 0 (0.0%) |
| 65 to 74 Years | 13 (11.0%) | 0 (0.0%) |
| 75 Years and over | 24 (21.4%) | 29 (19.5%) |
Disability Class: Vision Difficulty
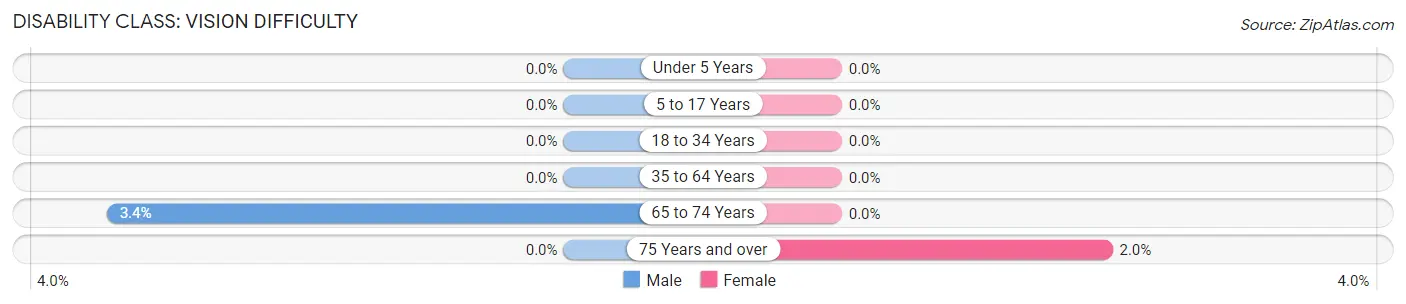
| Age Bracket | Male | Female |
| Under 5 Years | 0 (0.0%) | 0 (0.0%) |
| 5 to 17 Years | 0 (0.0%) | 0 (0.0%) |
| 18 to 34 Years | 0 (0.0%) | 0 (0.0%) |
| 35 to 64 Years | 0 (0.0%) | 0 (0.0%) |
| 65 to 74 Years | 4 (3.4%) | 0 (0.0%) |
| 75 Years and over | 0 (0.0%) | 3 (2.0%) |
Disability Class: Cognitive Difficulty
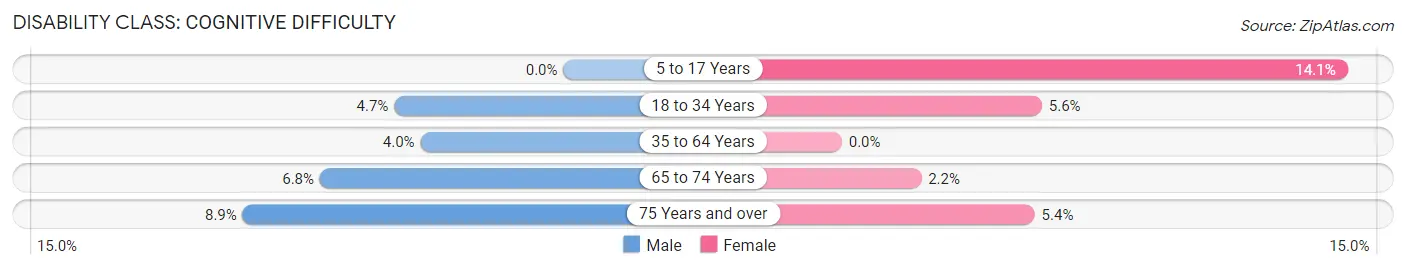
| Age Bracket | Male | Female |
| 5 to 17 Years | 0 (0.0%) | 30 (14.1%) |
| 18 to 34 Years | 28 (4.7%) | 19 (5.6%) |
| 35 to 64 Years | 18 (4.0%) | 0 (0.0%) |
| 65 to 74 Years | 8 (6.8%) | 3 (2.2%) |
| 75 Years and over | 10 (8.9%) | 8 (5.4%) |
Disability Class: Ambulatory Difficulty
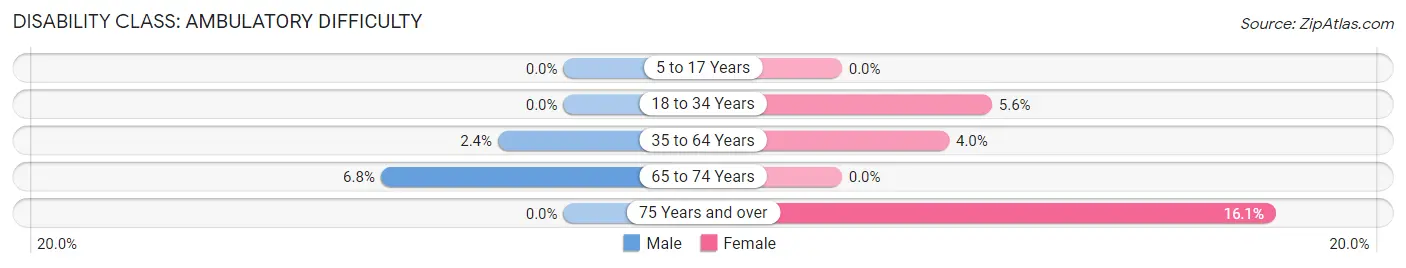
| Age Bracket | Male | Female |
| 5 to 17 Years | 0 (0.0%) | 0 (0.0%) |
| 18 to 34 Years | 0 (0.0%) | 19 (5.6%) |
| 35 to 64 Years | 11 (2.4%) | 21 (4.0%) |
| 65 to 74 Years | 8 (6.8%) | 0 (0.0%) |
| 75 Years and over | 0 (0.0%) | 24 (16.1%) |
Disability Class: Self-Care Difficulty
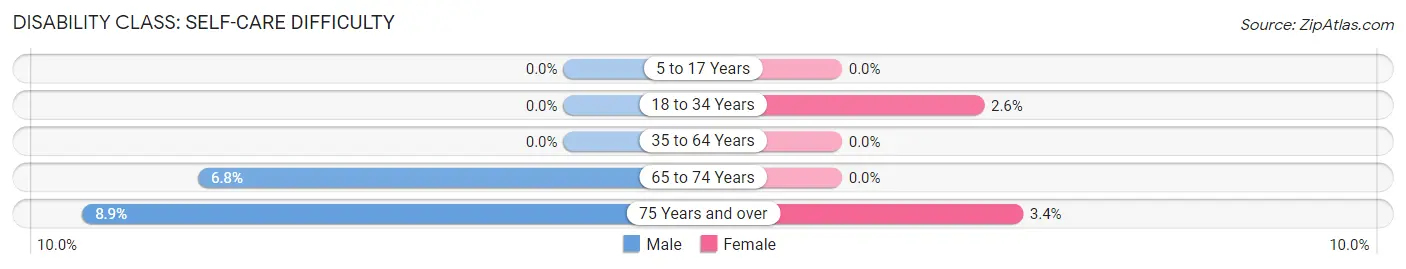
| Age Bracket | Male | Female |
| 5 to 17 Years | 0 (0.0%) | 0 (0.0%) |
| 18 to 34 Years | 0 (0.0%) | 9 (2.6%) |
| 35 to 64 Years | 0 (0.0%) | 0 (0.0%) |
| 65 to 74 Years | 8 (6.8%) | 0 (0.0%) |
| 75 Years and over | 10 (8.9%) | 5 (3.4%) |
Technology Access in Amesti
Computing Device Access in Amesti
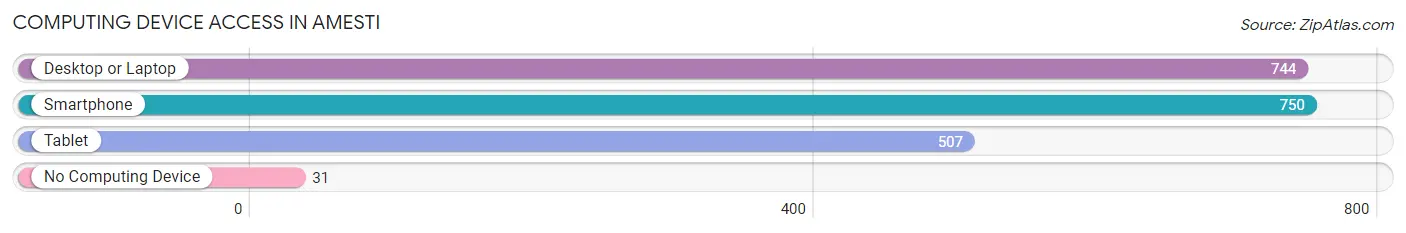
| Device Type | # Households | % Households |
| Desktop or Laptop | 744 | 88.0% |
| Smartphone | 750 | 88.8% |
| Tablet | 507 | 60.0% |
| No Computing Device | 31 | 3.7% |
| Total | 845 | 100.0% |
Internet Access in Amesti
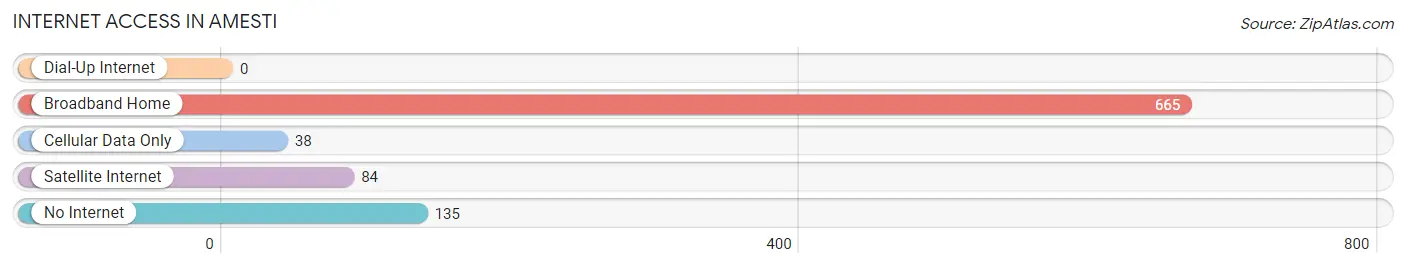
| Internet Type | # Households | % Households |
| Dial-Up Internet | 0 | 0.0% |
| Broadband Home | 665 | 78.7% |
| Cellular Data Only | 38 | 4.5% |
| Satellite Internet | 84 | 9.9% |
| No Internet | 135 | 16.0% |
| Total | 845 | 100.0% |
Amesti Summary
Amesti is a census-designated place located in Santa Cruz County, California. It is situated in the foothills of the Santa Cruz Mountains, about 8 miles (13 km) northwest of the city of Santa Cruz. The population was 2,845 at the 2010 census.
History
The area now known as Amesti was originally inhabited by the Ohlone people, who lived in the area for thousands of years before the arrival of Europeans. The first Europeans to settle in the area were Spanish missionaries, who established the Mission Santa Cruz in 1791. The mission was abandoned in 1834, and the land was divided into large ranchos.
In the late 19th century, the area was settled by Portuguese immigrants, who established small farms and vineyards. The area was known as "Portuguese Flats" until the early 20th century, when it was renamed Amesti, after a local rancher.
Geography
Amesti is located at 37°3'25"N 122°2'17"W (37.056944, -122.038333). It is situated in the foothills of the Santa Cruz Mountains, about 8 miles (13 km) northwest of the city of Santa Cruz. The area is mostly rural, with rolling hills and oak woodlands.
The climate in Amesti is Mediterranean, with mild, wet winters and dry, warm summers. The average annual precipitation is about 25 inches (635 mm).
Economy
The economy of Amesti is largely based on agriculture. The area is known for its vineyards and wineries, as well as its production of apples, pears, and other fruits and vegetables. There are also several small businesses in the area, including a few restaurants and shops.
Demographics
As of the 2010 census, there were 2,845 people, 1,072 households, and 745 families residing in Amesti. The population density was 545.3 people per square mile (210.9/km2). The racial makeup of Amesti was 79.2% White, 0.7% African American, 0.7% Native American, 0.7% Asian, 0.1% Pacific Islander, 15.2% from other races, and 3.4% from two or more races. Hispanic or Latino of any race were 33.2% of the population.
The median income for a household in Amesti was $50,938, and the median income for a family was $60,000. The per capita income for the CDP was $25,938. About 11.2% of families and 14.2% of the population were below the poverty line, including 18.2% of those under age 18 and 8.3% of those age 65 or over.
Common Questions
What is Per Capita Income in Amesti?
Per Capita income in Amesti is $38,014.
What is the Median Family Income in Amesti?
Median Family Income in Amesti is $100,750.
What is the Median Household income in Amesti?
Median Household Income in Amesti is $101,141.
What is Income or Wage Gap in Amesti?
Income or Wage Gap in Amesti is 13.2%.
Women in Amesti earn 86.8 cents for every dollar earned by a man.
What is Inequality or Gini Index in Amesti?
Inequality or Gini Index in Amesti is 0.47.
What is the Total Population of Amesti?
Total Population of Amesti is 3,048.
What is the Total Male Population of Amesti?
Total Male Population of Amesti is 1,625.
What is the Total Female Population of Amesti?
Total Female Population of Amesti is 1,423.
What is the Ratio of Males per 100 Females in Amesti?
There are 114.20 Males per 100 Females in Amesti.
What is the Ratio of Females per 100 Males in Amesti?
There are 87.57 Females per 100 Males in Amesti.
What is the Median Population Age in Amesti?
Median Population Age in Amesti is 34.5 Years.
What is the Average Family Size in Amesti
Average Family Size in Amesti is 4.0 People.
What is the Average Household Size in Amesti
Average Household Size in Amesti is 3.6 People.
How Large is the Labor Force in Amesti?
There are 1,509 People in the Labor Forcein in Amesti.
What is the Percentage of People in the Labor Force in Amesti?
60.7% of People are in the Labor Force in Amesti.
What is the Unemployment Rate in Amesti?
Unemployment Rate in Amesti is 6.8%.