Alturas, CA Map & Demographics
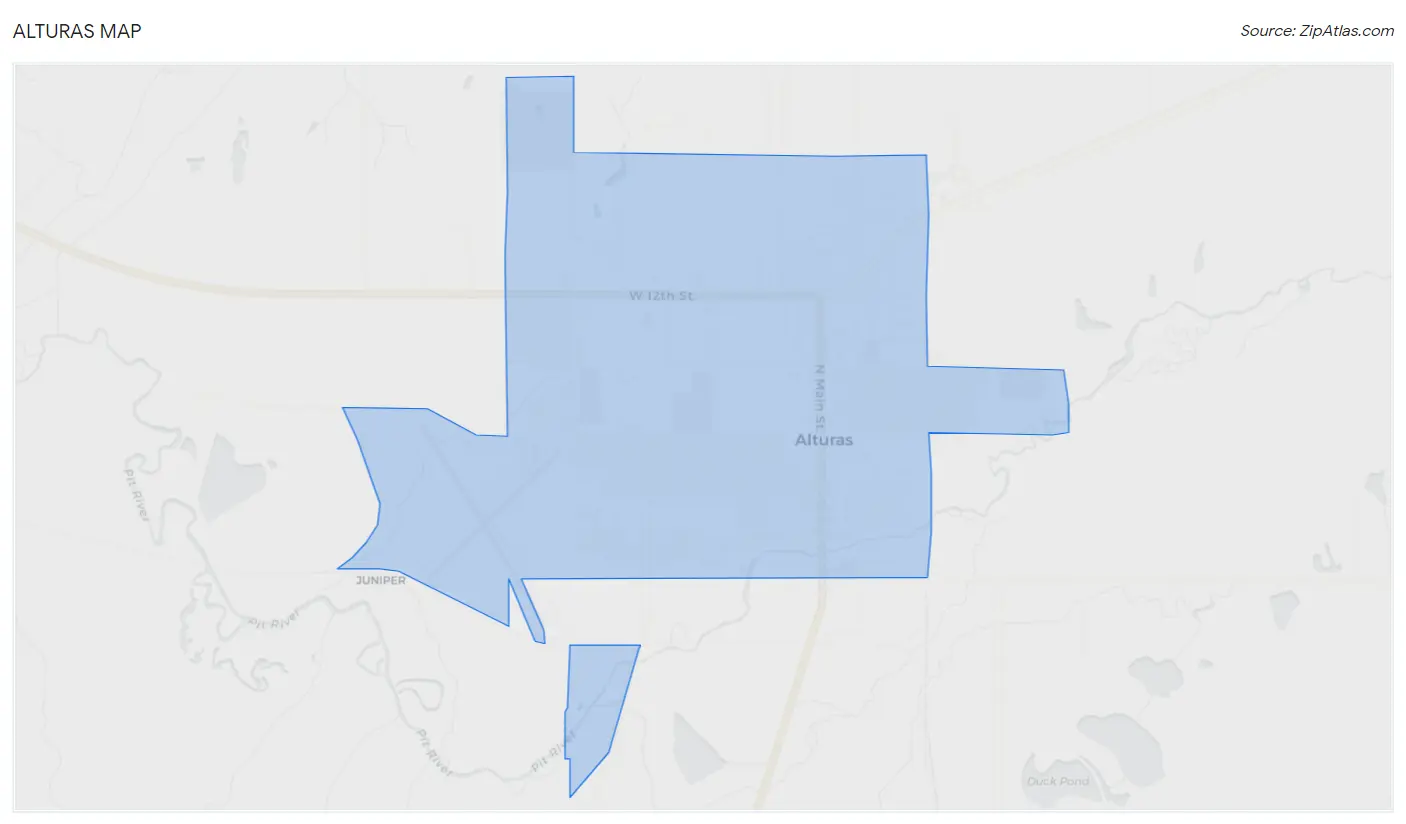
Alturas Map
Alturas Overview
$27,071
PER CAPITA INCOME
$56,636
AVG FAMILY INCOME
$51,051
AVG HOUSEHOLD INCOME
48.5%
WAGE / INCOME GAP [ % ]
51.5¢/ $1
WAGE / INCOME GAP [ $ ]
0.46
INEQUALITY / GINI INDEX
2,683
TOTAL POPULATION
1,199
MALE POPULATION
1,484
FEMALE POPULATION
80.80
MALES / 100 FEMALES
123.77
FEMALES / 100 MALES
41.4
MEDIAN AGE
3.0
AVG FAMILY SIZE
2.4
AVG HOUSEHOLD SIZE
1,123
LABOR FORCE [ PEOPLE ]
52.7%
PERCENT IN LABOR FORCE
10.5%
UNEMPLOYMENT RATE
Alturas Zip Codes
Alturas Area Codes
Income in Alturas
Income Overview in Alturas
Per Capita Income in Alturas is $27,071, while median incomes of families and households are $56,636 and $51,051 respectively.
| Characteristic | Number | Measure |
| Per Capita Income | 2,683 | $27,071 |
| Median Family Income | 712 | $56,636 |
| Mean Family Income | 712 | $74,337 |
| Median Household Income | 1,117 | $51,051 |
| Mean Household Income | 1,117 | $61,412 |
| Income Deficit | 712 | $0 |
| Wage / Income Gap (%) | 2,683 | 48.51% |
| Wage / Income Gap ($) | 2,683 | 51.49¢ per $1 |
| Gini / Inequality Index | 2,683 | 0.46 |
Earnings by Sex in Alturas
Average Earnings in Alturas are $27,453, $41,588 for men and $21,412 for women, a difference of 48.5%.
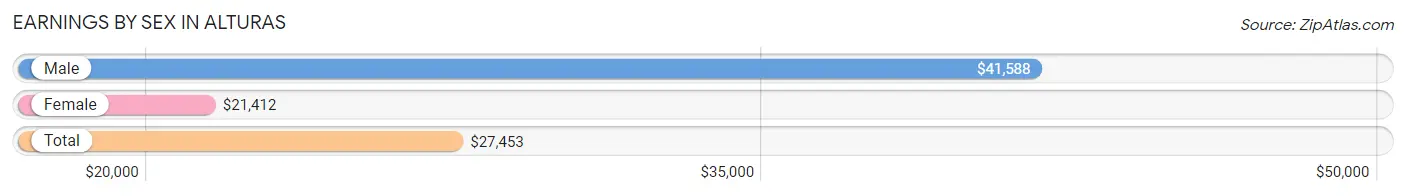
| Sex | Number | Average Earnings |
| Male | 479 (40.2%) | $41,588 |
| Female | 713 (59.8%) | $21,412 |
| Total | 1,192 (100.0%) | $27,453 |
Earnings by Sex by Income Bracket in Alturas
The most common earnings brackets in Alturas are $55,000 to $64,999 for men (78 | 16.3%) and $5,000 to $7,499 for women (86 | 12.1%).
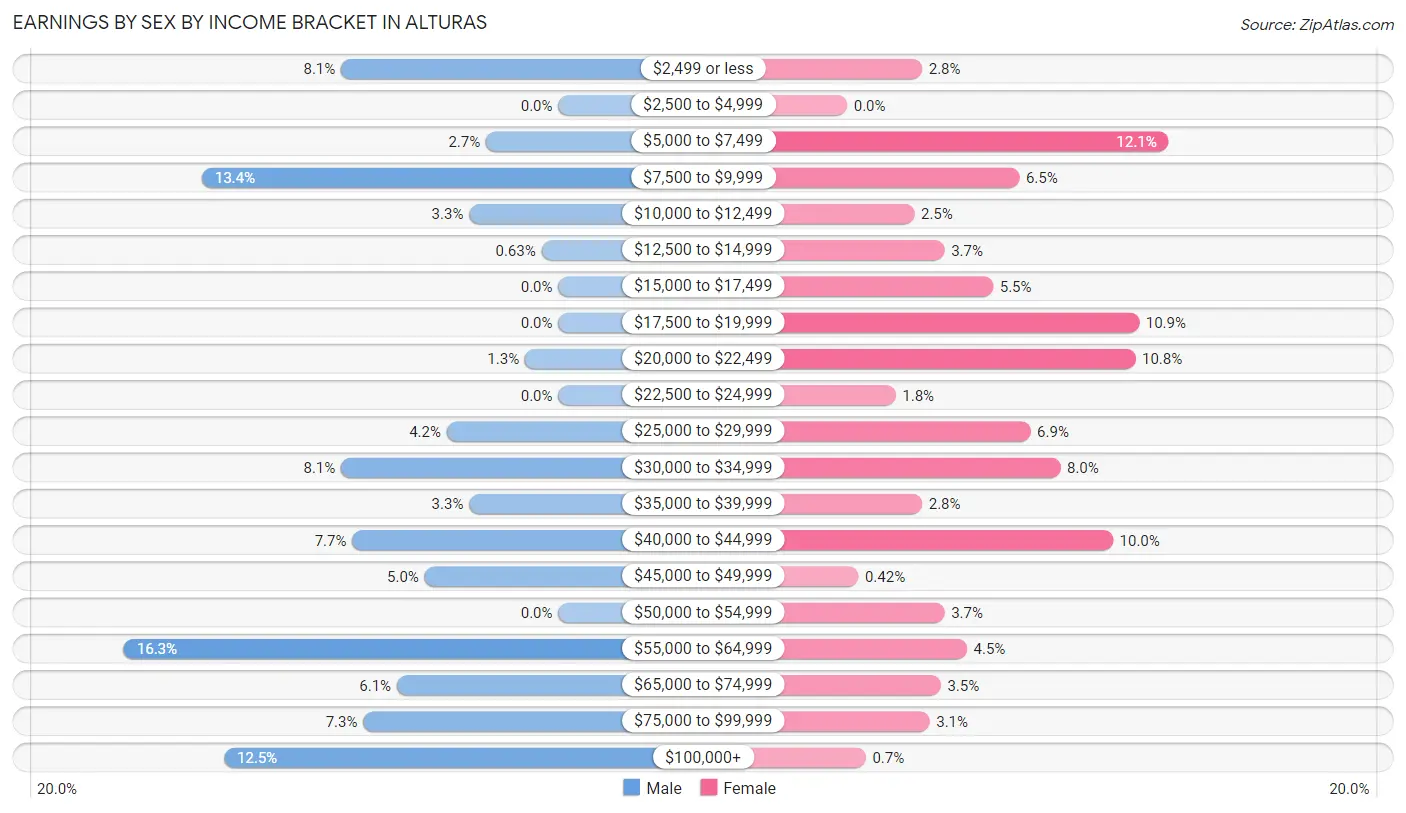
| Income | Male | Female |
| $2,499 or less | 39 (8.1%) | 20 (2.8%) |
| $2,500 to $4,999 | 0 (0.0%) | 0 (0.0%) |
| $5,000 to $7,499 | 13 (2.7%) | 86 (12.1%) |
| $7,500 to $9,999 | 64 (13.4%) | 46 (6.5%) |
| $10,000 to $12,499 | 16 (3.3%) | 18 (2.5%) |
| $12,500 to $14,999 | 3 (0.6%) | 26 (3.6%) |
| $15,000 to $17,499 | 0 (0.0%) | 39 (5.5%) |
| $17,500 to $19,999 | 0 (0.0%) | 78 (10.9%) |
| $20,000 to $22,499 | 6 (1.3%) | 77 (10.8%) |
| $22,500 to $24,999 | 0 (0.0%) | 13 (1.8%) |
| $25,000 to $29,999 | 20 (4.2%) | 49 (6.9%) |
| $30,000 to $34,999 | 39 (8.1%) | 57 (8.0%) |
| $35,000 to $39,999 | 16 (3.3%) | 20 (2.8%) |
| $40,000 to $44,999 | 37 (7.7%) | 71 (10.0%) |
| $45,000 to $49,999 | 24 (5.0%) | 3 (0.4%) |
| $50,000 to $54,999 | 0 (0.0%) | 26 (3.6%) |
| $55,000 to $64,999 | 78 (16.3%) | 32 (4.5%) |
| $65,000 to $74,999 | 29 (6.0%) | 25 (3.5%) |
| $75,000 to $99,999 | 35 (7.3%) | 22 (3.1%) |
| $100,000+ | 60 (12.5%) | 5 (0.7%) |
| Total | 479 (100.0%) | 713 (100.0%) |
Earnings by Sex by Educational Attainment in Alturas
Average earnings in Alturas are $56,346 for men and $23,438 for women, a difference of 58.4%. Men with an educational attainment of graduate degree enjoy the highest average annual earnings of $250,001, while those with high school diploma education earn the least with $40,473. Women with an educational attainment of bachelor's degree earn the most with the average annual earnings of $41,500, while those with college or associate's degree education have the smallest earnings of $19,455.
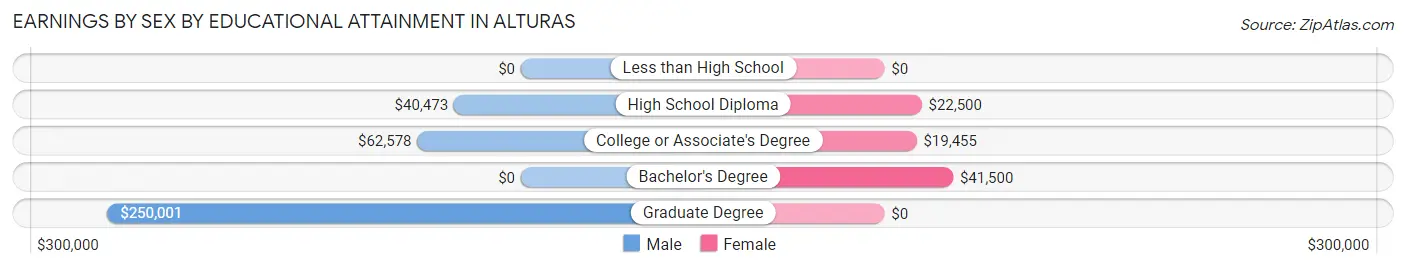
| Educational Attainment | Male Income | Female Income |
| Less than High School | - | - |
| High School Diploma | $40,473 | $22,500 |
| College or Associate's Degree | $62,578 | $19,455 |
| Bachelor's Degree | - | - |
| Graduate Degree | $250,001 | $0 |
| Total | $56,346 | $23,438 |
Family Income in Alturas
Family Income Brackets in Alturas
According to the Alturas family income data, there are 251 families falling into the $50,000 to $74,999 income range, which is the most common income bracket and makes up 35.2% of all families.
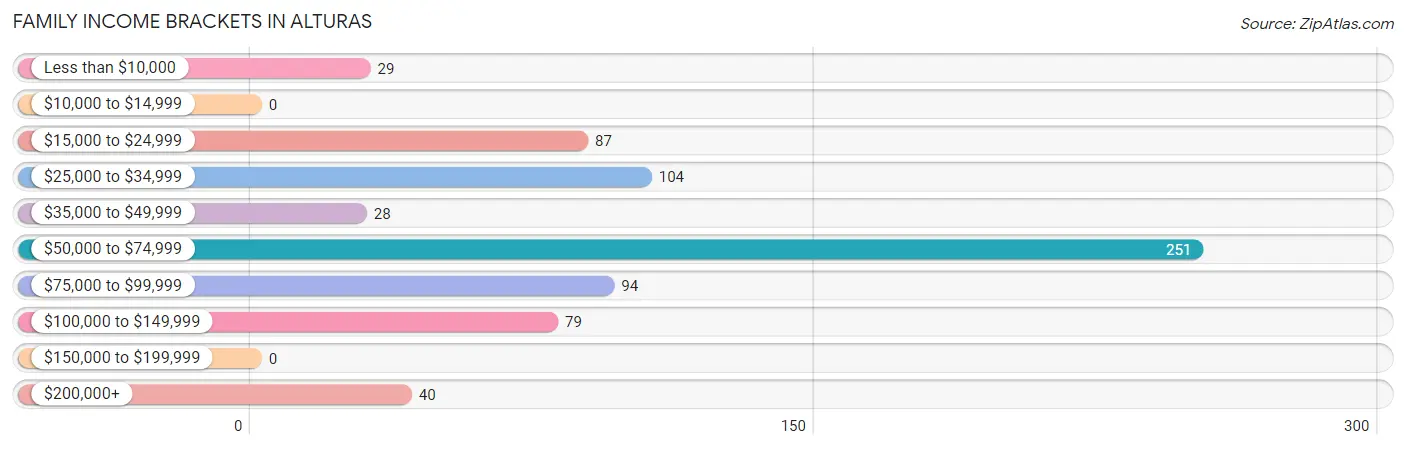
| Income Bracket | # Families | % Families |
| Less than $10,000 | 29 | 4.1% |
| $10,000 to $14,999 | 0 | 0.0% |
| $15,000 to $24,999 | 87 | 12.2% |
| $25,000 to $34,999 | 104 | 14.6% |
| $35,000 to $49,999 | 28 | 3.9% |
| $50,000 to $74,999 | 251 | 35.3% |
| $75,000 to $99,999 | 94 | 13.2% |
| $100,000 to $149,999 | 79 | 11.1% |
| $150,000 to $199,999 | 0 | 0.0% |
| $200,000+ | 40 | 5.6% |
Family Income by Famaliy Size in Alturas
4-person families (86 | 12.1%) account for the highest median family income in Alturas with $90,694 per family, while 2-person families (438 | 61.5%) have the highest median income of $27,754 per family member.
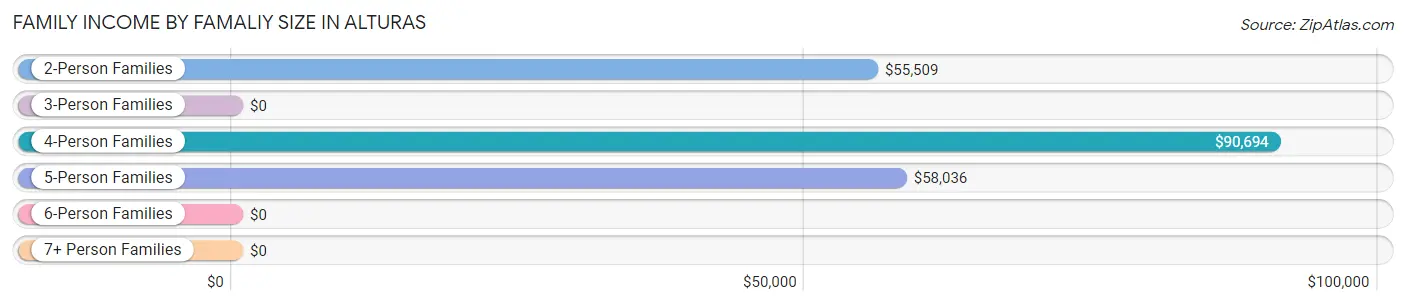
| Income Bracket | # Families | Median Income |
| 2-Person Families | 438 (61.5%) | $55,509 |
| 3-Person Families | 102 (14.3%) | $0 |
| 4-Person Families | 86 (12.1%) | $90,694 |
| 5-Person Families | 59 (8.3%) | $58,036 |
| 6-Person Families | 23 (3.2%) | $0 |
| 7+ Person Families | 4 (0.6%) | $0 |
| Total | 712 (100.0%) | $56,636 |
Family Income by Number of Earners in Alturas
The median family income in Alturas is $56,636, with families comprising 3+ earners (39) having the highest median family income of $109,148, while families with 1 earner (312) have the lowest median family income of $50,071, accounting for 5.5% and 43.8% of families, respectively.
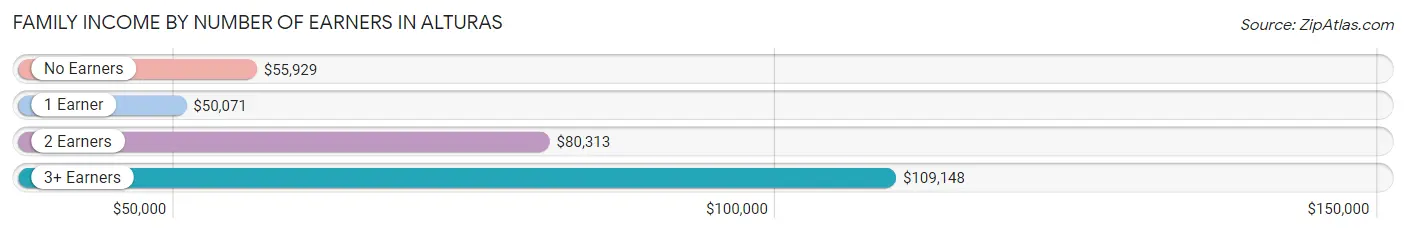
| Number of Earners | # Families | Median Income |
| No Earners | 161 (22.6%) | $55,929 |
| 1 Earner | 312 (43.8%) | $50,071 |
| 2 Earners | 200 (28.1%) | $80,313 |
| 3+ Earners | 39 (5.5%) | $109,148 |
| Total | 712 (100.0%) | $56,636 |
Household Income in Alturas
Household Income Brackets in Alturas
With 311 households falling in the category, the $50,000 to $74,999 income range is the most frequent in Alturas, accounting for 27.8% of all households. In contrast, only 15 households (1.3%) fall into the $150,000 to $199,999 income bracket, making it the least populous group.

| Income Bracket | # Households | % Households |
| Less than $10,000 | 90 | 8.1% |
| $10,000 to $14,999 | 37 | 3.3% |
| $15,000 to $24,999 | 183 | 16.4% |
| $25,000 to $34,999 | 187 | 16.7% |
| $35,000 to $49,999 | 42 | 3.8% |
| $50,000 to $74,999 | 311 | 27.8% |
| $75,000 to $99,999 | 117 | 10.5% |
| $100,000 to $149,999 | 96 | 8.6% |
| $150,000 to $199,999 | 15 | 1.3% |
| $200,000+ | 40 | 3.6% |
Household Income by Householder Age in Alturas
The median household income in Alturas is $51,051, with the highest median household income of $60,000 found in the 25 to 44 years age bracket for the primary householder. A total of 334 households (29.9%) fall into this category. Meanwhile, the 15 to 24 years age bracket for the primary householder has the lowest median household income of $0, with 15 households (1.3%) in this group.
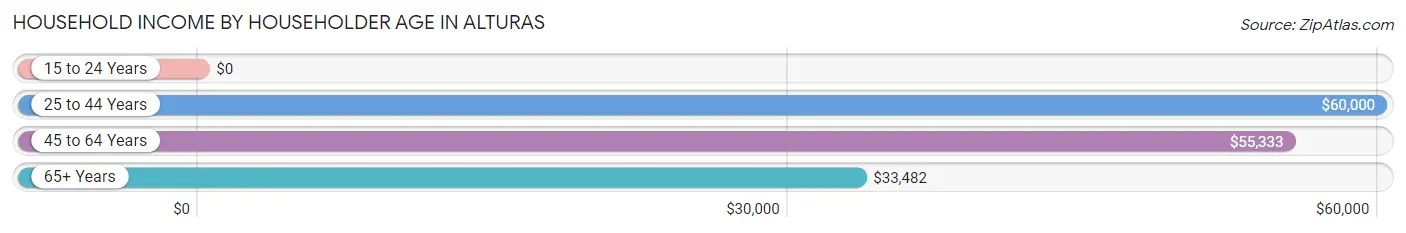
| Income Bracket | # Households | Median Income |
| 15 to 24 Years | 15 (1.3%) | $0 |
| 25 to 44 Years | 334 (29.9%) | $60,000 |
| 45 to 64 Years | 306 (27.4%) | $55,333 |
| 65+ Years | 462 (41.4%) | $33,482 |
| Total | 1,117 (100.0%) | $51,051 |
Poverty in Alturas
Income Below Poverty by Sex and Age in Alturas
With 20.1% poverty level for males and 18.9% for females among the residents of Alturas, 6 to 11 year old males and 12 to 14 year old females are the most vulnerable to poverty, with 39 males (76.5%) and 23 females (51.1%) in their respective age groups living below the poverty level.
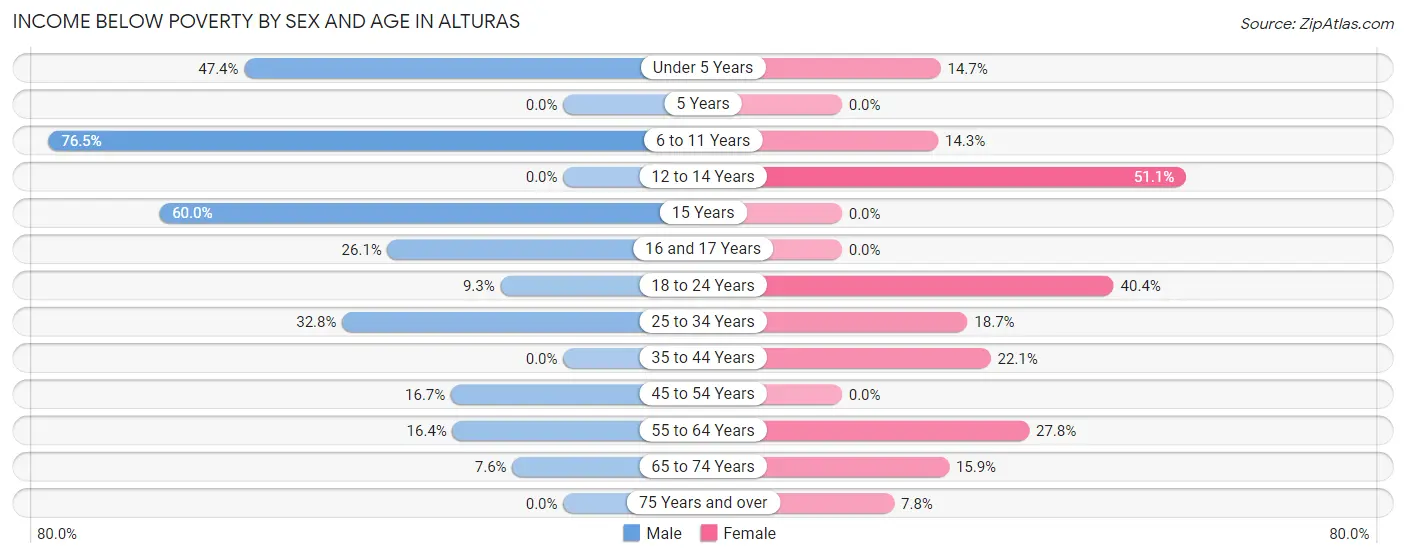
| Age Bracket | Male | Female |
| Under 5 Years | 45 (47.4%) | 17 (14.7%) |
| 5 Years | 0 (0.0%) | 0 (0.0%) |
| 6 to 11 Years | 39 (76.5%) | 13 (14.3%) |
| 12 to 14 Years | 0 (0.0%) | 23 (51.1%) |
| 15 Years | 12 (60.0%) | 0 (0.0%) |
| 16 and 17 Years | 6 (26.1%) | 0 (0.0%) |
| 18 to 24 Years | 7 (9.3%) | 44 (40.4%) |
| 25 to 34 Years | 64 (32.8%) | 47 (18.6%) |
| 35 to 44 Years | 0 (0.0%) | 40 (22.1%) |
| 45 to 54 Years | 31 (16.7%) | 0 (0.0%) |
| 55 to 64 Years | 12 (16.4%) | 57 (27.8%) |
| 65 to 74 Years | 18 (7.6%) | 28 (15.9%) |
| 75 Years and over | 0 (0.0%) | 8 (7.8%) |
| Total | 234 (20.1%) | 277 (18.9%) |
Income Above Poverty by Sex and Age in Alturas
According to the poverty statistics in Alturas, males aged 5 years and females aged 5 years are the age groups that are most secure financially, with 100.0% of males and 100.0% of females in these age groups living above the poverty line.
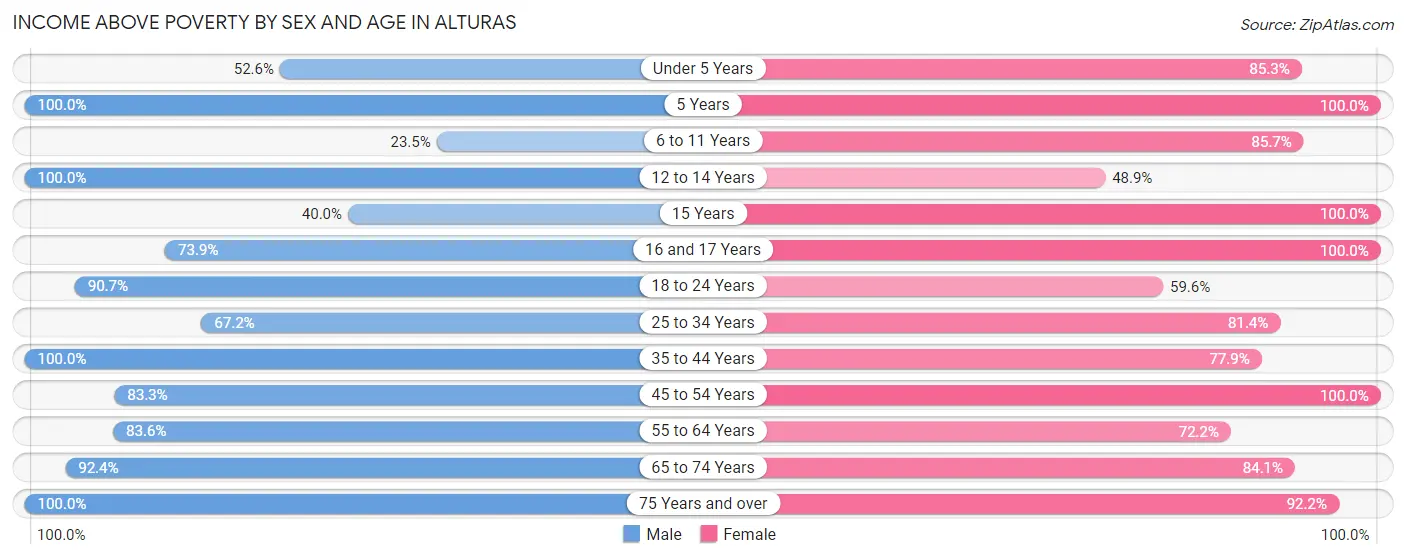
| Age Bracket | Male | Female |
| Under 5 Years | 50 (52.6%) | 99 (85.3%) |
| 5 Years | 13 (100.0%) | 53 (100.0%) |
| 6 to 11 Years | 12 (23.5%) | 78 (85.7%) |
| 12 to 14 Years | 25 (100.0%) | 22 (48.9%) |
| 15 Years | 8 (40.0%) | 12 (100.0%) |
| 16 and 17 Years | 17 (73.9%) | 29 (100.0%) |
| 18 to 24 Years | 68 (90.7%) | 65 (59.6%) |
| 25 to 34 Years | 131 (67.2%) | 205 (81.4%) |
| 35 to 44 Years | 71 (100.0%) | 141 (77.9%) |
| 45 to 54 Years | 155 (83.3%) | 94 (100.0%) |
| 55 to 64 Years | 61 (83.6%) | 148 (72.2%) |
| 65 to 74 Years | 220 (92.4%) | 148 (84.1%) |
| 75 Years and over | 99 (100.0%) | 95 (92.2%) |
| Total | 930 (79.9%) | 1,189 (81.1%) |
Income Below Poverty Among Married-Couple Families in Alturas
The poverty statistics for married-couple families in Alturas show that 11.8% or 61 of the total 518 families live below the poverty line. Families with 3 or 4 children have the highest poverty rate of 25.0%, comprising of 8 families. On the other hand, families with 5 or more children have the lowest poverty rate of 0.0%, which includes 0 families.
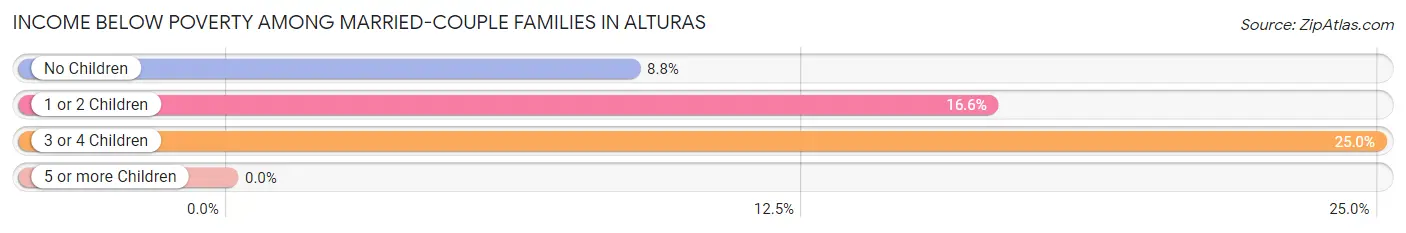
| Children | Above Poverty | Below Poverty |
| No Children | 313 (91.2%) | 30 (8.7%) |
| 1 or 2 Children | 116 (83.5%) | 23 (16.6%) |
| 3 or 4 Children | 24 (75.0%) | 8 (25.0%) |
| 5 or more Children | 4 (100.0%) | 0 (0.0%) |
| Total | 457 (88.2%) | 61 (11.8%) |
Income Below Poverty Among Single-Parent Households in Alturas
According to the poverty data in Alturas, 29.0% or 29 single-father households and 19.2% or 18 single-mother households are living below the poverty line. Among single-father households, those with 3 or 4 children have the highest poverty rate, with 6 households (100.0%) experiencing poverty. Likewise, among single-mother households, those with 1 or 2 children have the highest poverty rate, with 18 households (69.2%) falling below the poverty line.
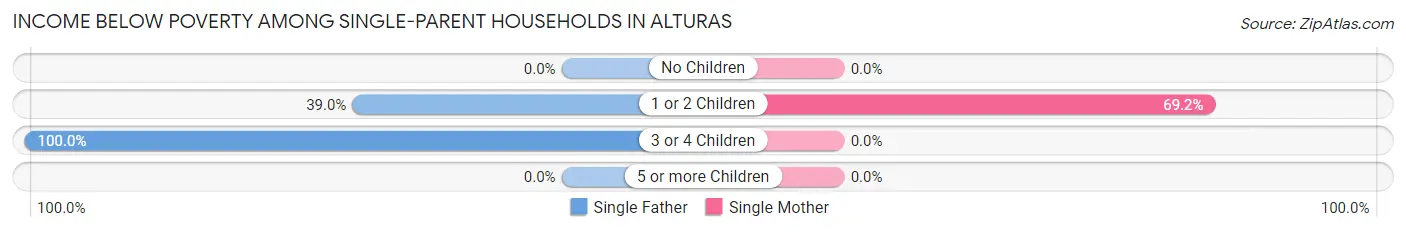
| Children | Single Father | Single Mother |
| No Children | 0 (0.0%) | 0 (0.0%) |
| 1 or 2 Children | 23 (39.0%) | 18 (69.2%) |
| 3 or 4 Children | 6 (100.0%) | 0 (0.0%) |
| 5 or more Children | 0 (0.0%) | 0 (0.0%) |
| Total | 29 (29.0%) | 18 (19.2%) |
Income Below Poverty Among Married-Couple vs Single-Parent Households in Alturas
The poverty data for Alturas shows that 61 of the married-couple family households (11.8%) and 47 of the single-parent households (24.2%) are living below the poverty level. Within the married-couple family households, those with 3 or 4 children have the highest poverty rate, with 8 households (25.0%) falling below the poverty line. Among the single-parent households, those with 1 or 2 children have the highest poverty rate, with 41 household (48.2%) living below poverty.
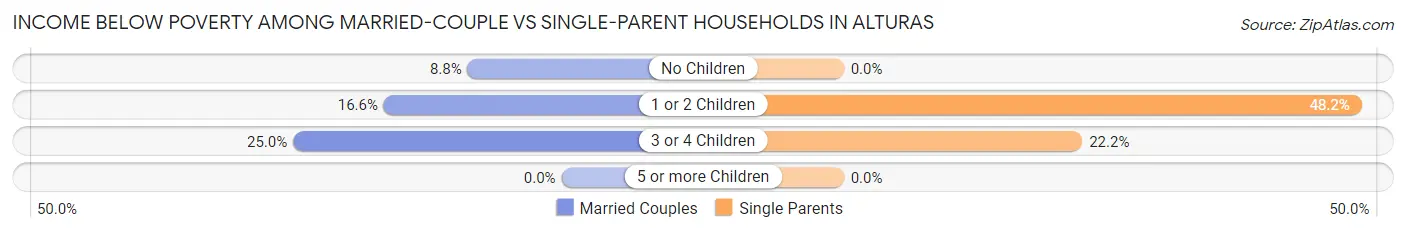
| Children | Married-Couple Families | Single-Parent Households |
| No Children | 30 (8.7%) | 0 (0.0%) |
| 1 or 2 Children | 23 (16.6%) | 41 (48.2%) |
| 3 or 4 Children | 8 (25.0%) | 6 (22.2%) |
| 5 or more Children | 0 (0.0%) | 0 (0.0%) |
| Total | 61 (11.8%) | 47 (24.2%) |
Race in Alturas
The most populous races in Alturas are White / Caucasian (2,077 | 77.4%), Hispanic or Latino (563 | 21.0%), and Some other Race (227 | 8.5%).
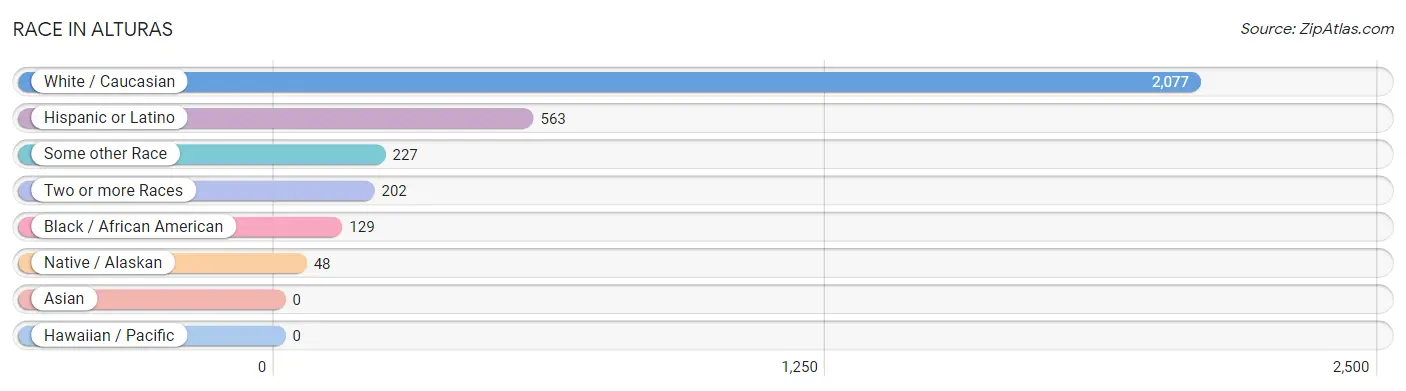
| Race | # Population | % Population |
| Asian | 0 | 0.0% |
| Black / African American | 129 | 4.8% |
| Hawaiian / Pacific | 0 | 0.0% |
| Hispanic or Latino | 563 | 21.0% |
| Native / Alaskan | 48 | 1.8% |
| White / Caucasian | 2,077 | 77.4% |
| Two or more Races | 202 | 7.5% |
| Some other Race | 227 | 8.5% |
| Total | 2,683 | 100.0% |
Ancestry in Alturas
The most populous ancestries reported in Alturas are German (575 | 21.4%), English (423 | 15.8%), Mexican (399 | 14.9%), Irish (358 | 13.3%), and American (177 | 6.6%), together accounting for 72.0% of all Alturas residents.
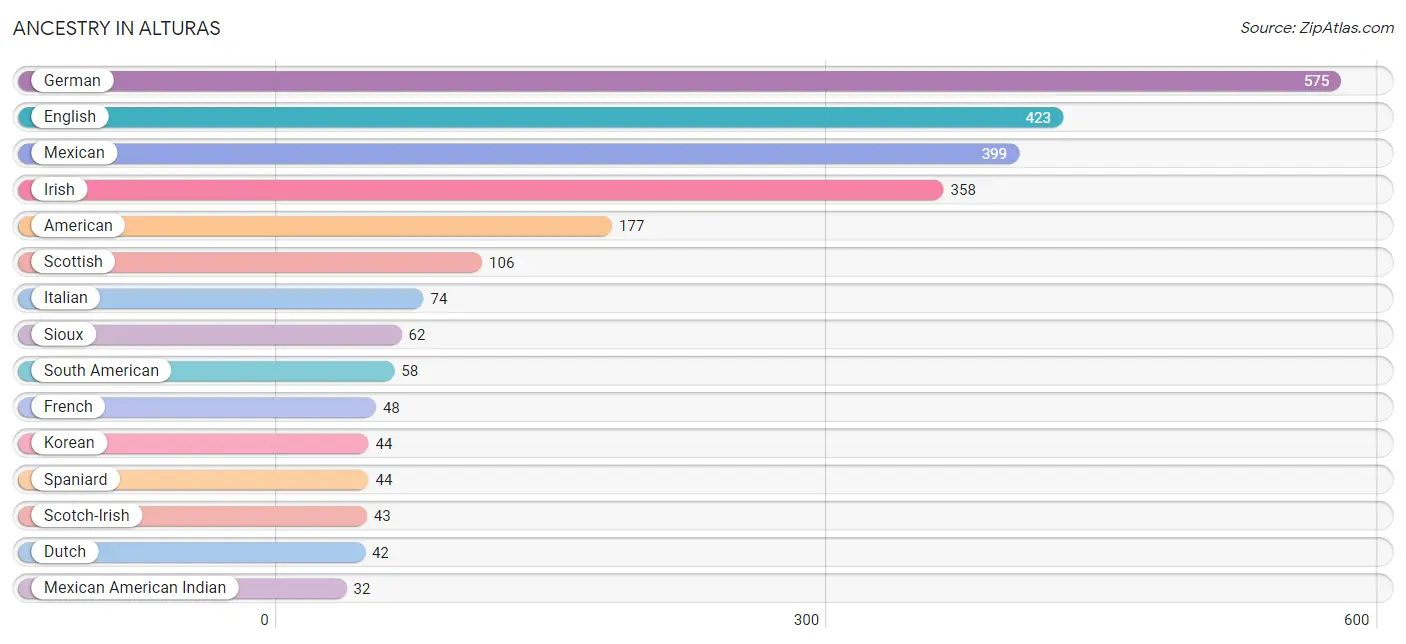
| Ancestry | # Population | % Population |
| American | 177 | 6.6% |
| Barbadian | 1 | 0.0% |
| Blackfeet | 18 | 0.7% |
| Bolivian | 23 | 0.9% |
| British | 17 | 0.6% |
| Central American | 22 | 0.8% |
| Cherokee | 13 | 0.5% |
| Choctaw | 7 | 0.3% |
| Comanche | 16 | 0.6% |
| Dutch | 42 | 1.6% |
| Ecuadorian | 12 | 0.4% |
| English | 423 | 15.8% |
| European | 29 | 1.1% |
| French | 48 | 1.8% |
| French Canadian | 2 | 0.1% |
| German | 575 | 21.4% |
| Irish | 358 | 13.3% |
| Italian | 74 | 2.8% |
| Korean | 44 | 1.6% |
| Mexican | 399 | 14.9% |
| Mexican American Indian | 32 | 1.2% |
| Norwegian | 14 | 0.5% |
| Peruvian | 23 | 0.9% |
| Polish | 16 | 0.6% |
| Portuguese | 31 | 1.2% |
| Salvadoran | 22 | 0.8% |
| Scandinavian | 6 | 0.2% |
| Scotch-Irish | 43 | 1.6% |
| Scottish | 106 | 4.0% |
| Sioux | 62 | 2.3% |
| South American | 58 | 2.2% |
| South American Indian | 12 | 0.4% |
| Spaniard | 44 | 1.6% |
| Spanish | 10 | 0.4% |
| Swiss | 30 | 1.1% |
| Welsh | 12 | 0.4% | View All 36 Rows |
Immigrants in Alturas
The most numerous immigrant groups reported in Alturas came from Latin America (148 | 5.5%), Central America (135 | 5.0%), Mexico (113 | 4.2%), Europe (27 | 1.0%), and El Salvador (22 | 0.8%), together accounting for 16.6% of all Alturas residents.
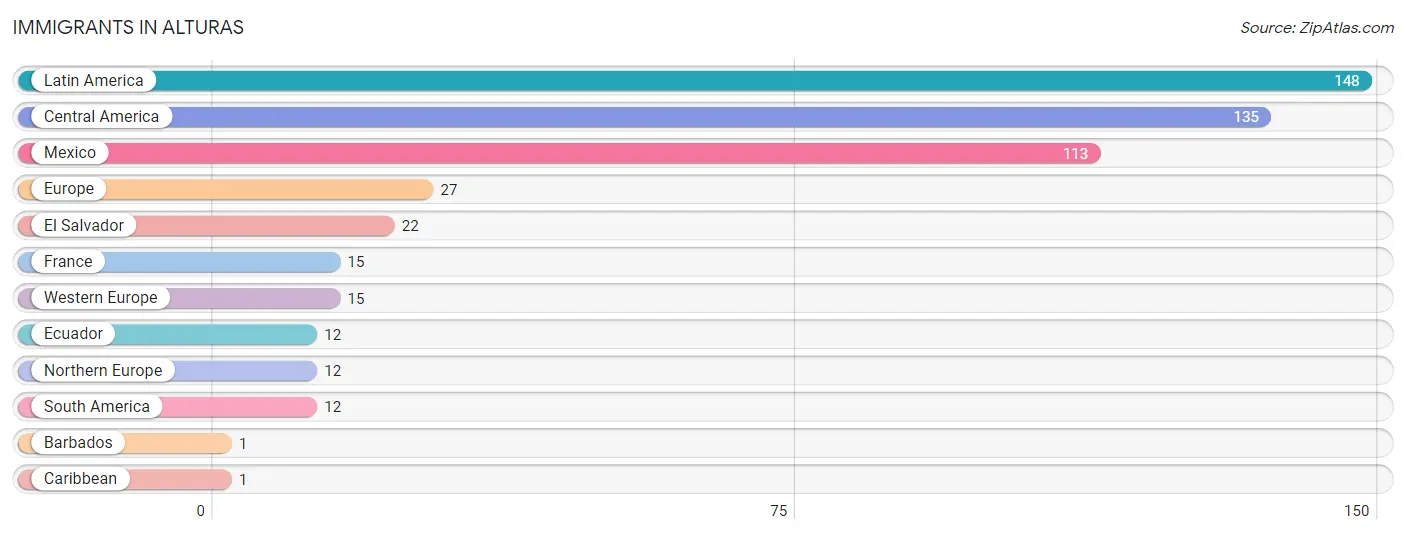
| Immigration Origin | # Population | % Population |
| Barbados | 1 | 0.0% |
| Caribbean | 1 | 0.0% |
| Central America | 135 | 5.0% |
| Ecuador | 12 | 0.4% |
| El Salvador | 22 | 0.8% |
| Europe | 27 | 1.0% |
| France | 15 | 0.6% |
| Latin America | 148 | 5.5% |
| Mexico | 113 | 4.2% |
| Northern Europe | 12 | 0.4% |
| South America | 12 | 0.4% |
| Western Europe | 15 | 0.6% | View All 12 Rows |
Sex and Age in Alturas
Sex and Age in Alturas
The most populous age groups in Alturas are 70 to 74 Years (199 | 16.6%) for men and 30 to 34 Years (153 | 10.3%) for women.
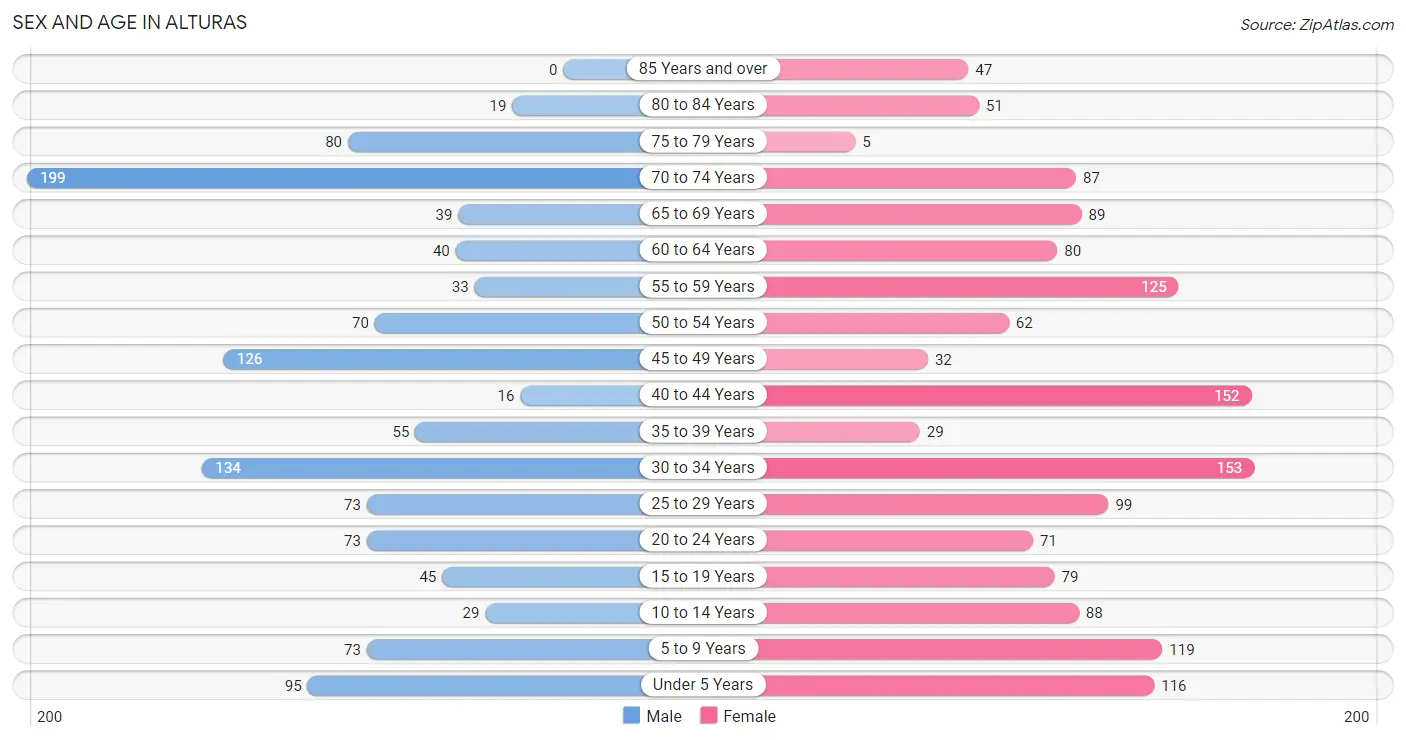
| Age Bracket | Male | Female |
| Under 5 Years | 95 (7.9%) | 116 (7.8%) |
| 5 to 9 Years | 73 (6.1%) | 119 (8.0%) |
| 10 to 14 Years | 29 (2.4%) | 88 (5.9%) |
| 15 to 19 Years | 45 (3.7%) | 79 (5.3%) |
| 20 to 24 Years | 73 (6.1%) | 71 (4.8%) |
| 25 to 29 Years | 73 (6.1%) | 99 (6.7%) |
| 30 to 34 Years | 134 (11.2%) | 153 (10.3%) |
| 35 to 39 Years | 55 (4.6%) | 29 (1.9%) |
| 40 to 44 Years | 16 (1.3%) | 152 (10.2%) |
| 45 to 49 Years | 126 (10.5%) | 32 (2.2%) |
| 50 to 54 Years | 70 (5.8%) | 62 (4.2%) |
| 55 to 59 Years | 33 (2.8%) | 125 (8.4%) |
| 60 to 64 Years | 40 (3.3%) | 80 (5.4%) |
| 65 to 69 Years | 39 (3.3%) | 89 (6.0%) |
| 70 to 74 Years | 199 (16.6%) | 87 (5.9%) |
| 75 to 79 Years | 80 (6.7%) | 5 (0.3%) |
| 80 to 84 Years | 19 (1.6%) | 51 (3.4%) |
| 85 Years and over | 0 (0.0%) | 47 (3.2%) |
| Total | 1,199 (100.0%) | 1,484 (100.0%) |
Families and Households in Alturas
Median Family Size in Alturas
The median family size in Alturas is 2.97 persons per family, with single female/mother families (94 | 13.2%) accounting for the largest median family size of 3.22 persons per family. On the other hand, single male/father families (100 | 14.0%) represent the smallest median family size with 2.25 persons per family.
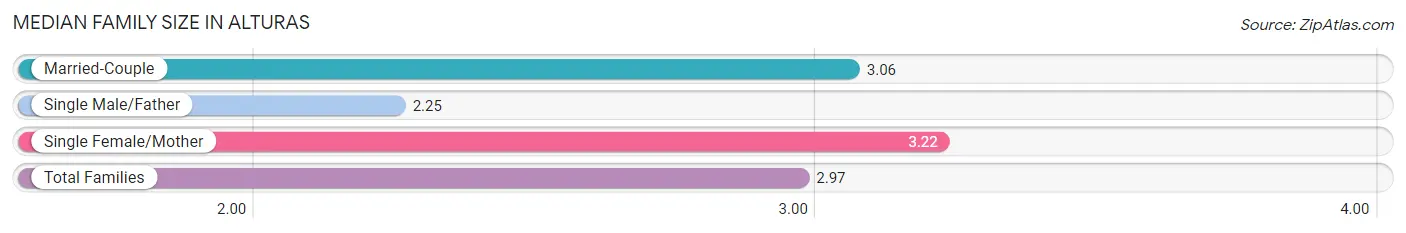
| Family Type | # Families | Family Size |
| Married-Couple | 518 (72.8%) | 3.06 |
| Single Male/Father | 100 (14.0%) | 2.25 |
| Single Female/Mother | 94 (13.2%) | 3.22 |
| Total Families | 712 (100.0%) | 2.97 |
Median Household Size in Alturas
The median household size in Alturas is 2.36 persons per household, with single female/mother households (94 | 8.4%) accounting for the largest median household size of 3.22 persons per household. non-family households (405 | 36.3%) represent the smallest median household size with 1.20 persons per household.
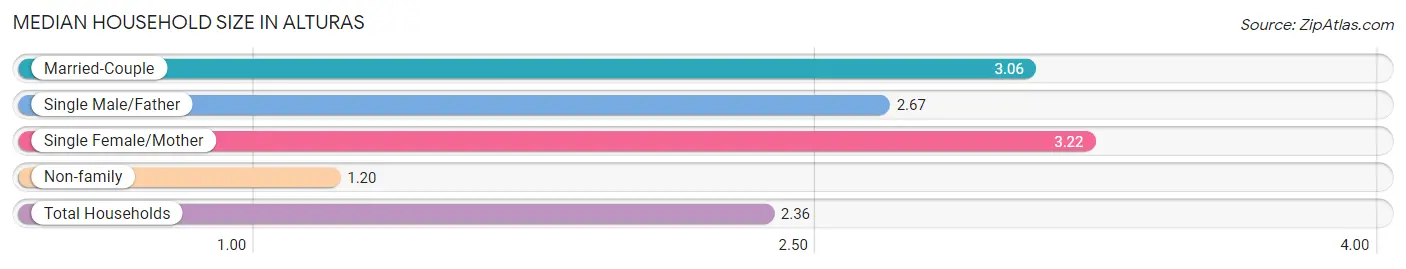
| Household Type | # Households | Household Size |
| Married-Couple | 518 (46.4%) | 3.06 |
| Single Male/Father | 100 (8.9%) | 2.67 |
| Single Female/Mother | 94 (8.4%) | 3.22 |
| Non-family | 405 (36.3%) | 1.20 |
| Total Households | 1,117 (100.0%) | 2.36 |
Household Size by Marriage Status in Alturas
Out of a total of 1,117 households in Alturas, 712 (63.7%) are family households, while 405 (36.3%) are nonfamily households. The most numerous type of family households are 2-person households, comprising 405, and the most common type of nonfamily households are 1-person households, comprising 353.
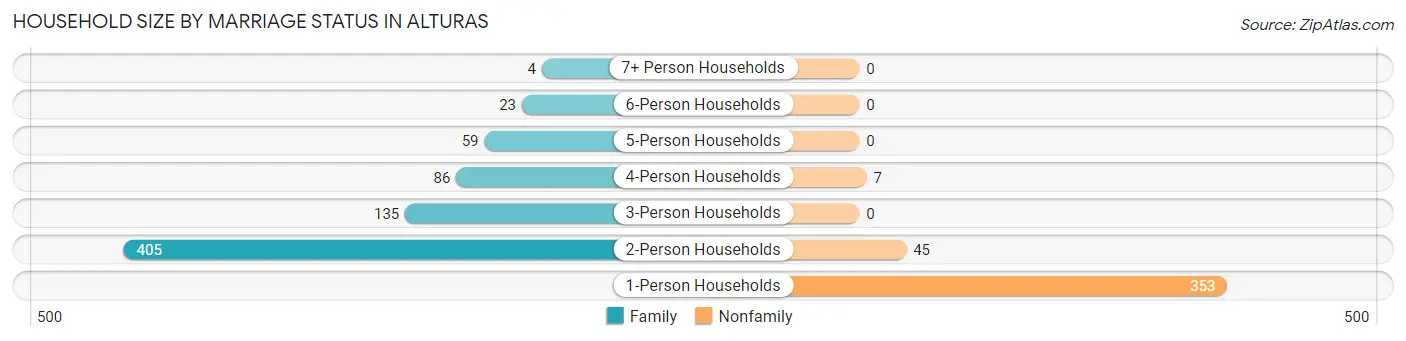
| Household Size | Family Households | Nonfamily Households |
| 1-Person Households | - | 353 (31.6%) |
| 2-Person Households | 405 (36.3%) | 45 (4.0%) |
| 3-Person Households | 135 (12.1%) | 0 (0.0%) |
| 4-Person Households | 86 (7.7%) | 7 (0.6%) |
| 5-Person Households | 59 (5.3%) | 0 (0.0%) |
| 6-Person Households | 23 (2.1%) | 0 (0.0%) |
| 7+ Person Households | 4 (0.4%) | 0 (0.0%) |
| Total | 712 (63.7%) | 405 (36.3%) |
Female Fertility in Alturas
Fertility by Age in Alturas
Average fertility rate in Alturas is 18.0 births per 1,000 women. Women in the age bracket of 20 to 34 years have the highest fertility rate with 34.0 births per 1,000 women. Women in the age bracket of 20 to 34 years acount for 100.0% of all women with births.
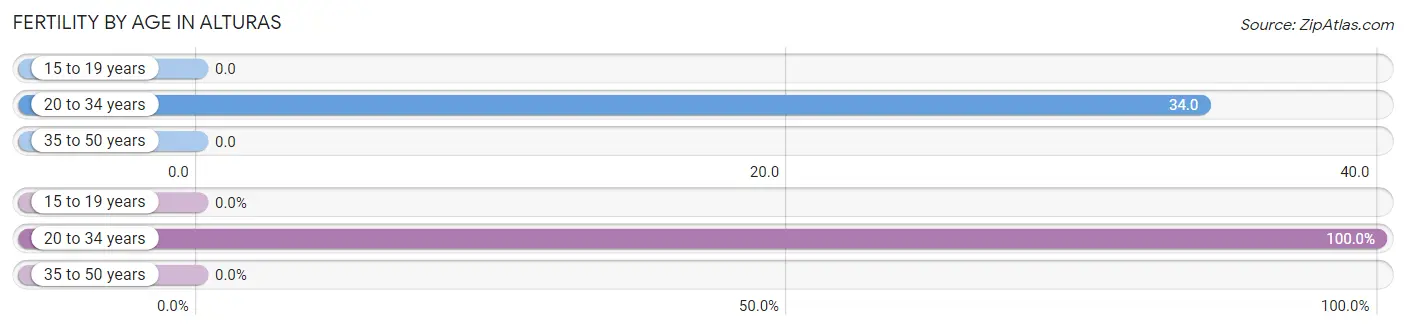
| Age Bracket | Women with Births | Births / 1,000 Women |
| 15 to 19 years | 0 (0.0%) | 0.0 |
| 20 to 34 years | 11 (100.0%) | 34.0 |
| 35 to 50 years | 0 (0.0%) | 0.0 |
| Total | 11 (100.0%) | 18.0 |
Fertility by Age by Marriage Status in Alturas
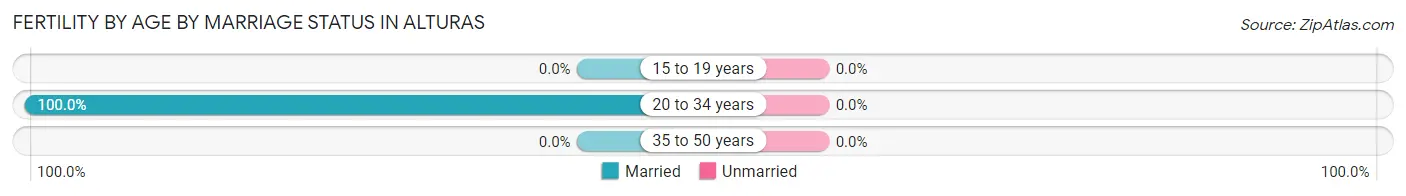
| Age Bracket | Married | Unmarried |
| 15 to 19 years | 0 (0.0%) | 0 (0.0%) |
| 20 to 34 years | 11 (100.0%) | 0 (0.0%) |
| 35 to 50 years | 0 (0.0%) | 0 (0.0%) |
| Total | 11 (100.0%) | 0 (0.0%) |
Fertility by Education in Alturas
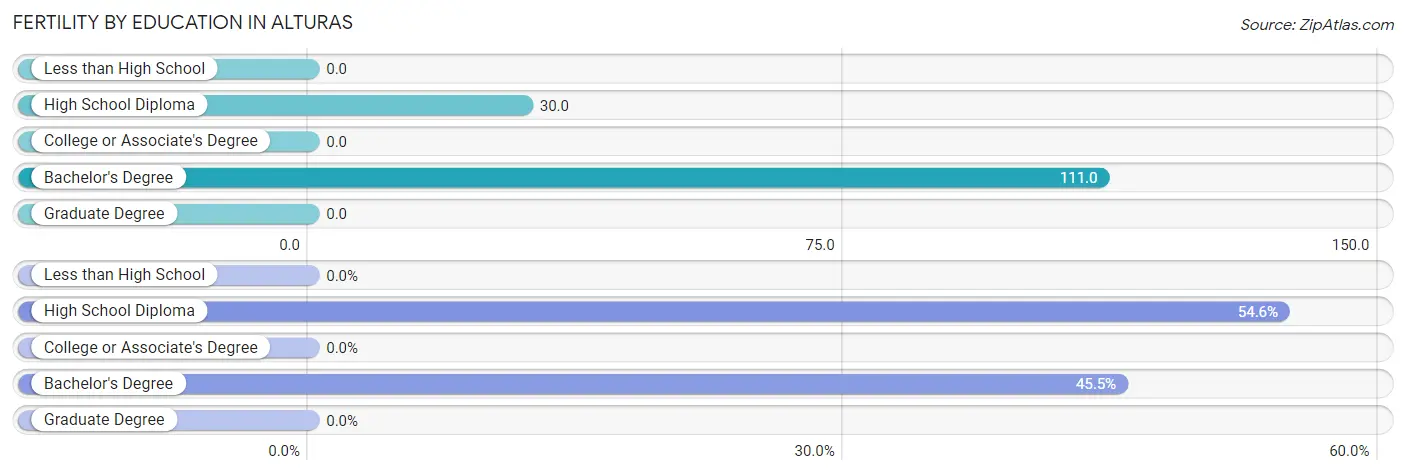
| Educational Attainment | Women with Births | Births / 1,000 Women |
| Less than High School | 0 (0.0%) | 0.0 |
| High School Diploma | 6 (54.5%) | 30.0 |
| College or Associate's Degree | 0 (0.0%) | 0.0 |
| Bachelor's Degree | 5 (45.5%) | 111.0 |
| Graduate Degree | 0 (0.0%) | 0.0 |
| Total | 11 (100.0%) | 18.0 |
Fertility by Education by Marriage Status in Alturas
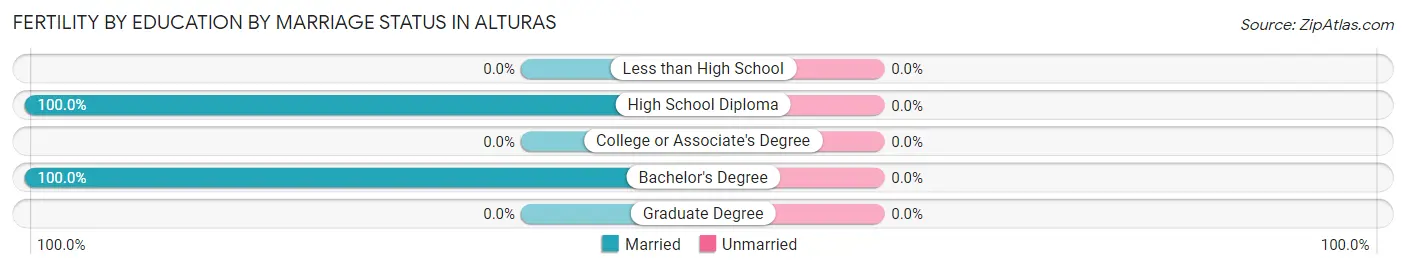
| Educational Attainment | Married | Unmarried |
| Less than High School | 0 (0.0%) | 0 (0.0%) |
| High School Diploma | 6 (100.0%) | 0 (0.0%) |
| College or Associate's Degree | 0 (0.0%) | 0 (0.0%) |
| Bachelor's Degree | 5 (100.0%) | 0 (0.0%) |
| Graduate Degree | 0 (0.0%) | 0 (0.0%) |
| Total | 11 (100.0%) | 0 (0.0%) |
Employment Characteristics in Alturas
Employment by Class of Employer in Alturas
Among the 1,001 employed individuals in Alturas, private company employees (509 | 50.8%), local government employees (168 | 16.8%), and federal government employees (145 | 14.5%) make up the most common classes of employment.
| Employer Class | # Employees | % Employees |
| Private Company Employees | 509 | 50.8% |
| Self-Employed (Incorporated) | 21 | 2.1% |
| Self-Employed (Not Incorporated) | 12 | 1.2% |
| Not-for-profit Organizations | 40 | 4.0% |
| Local Government Employees | 168 | 16.8% |
| State Government Employees | 106 | 10.6% |
| Federal Government Employees | 145 | 14.5% |
| Unpaid Family Workers | 0 | 0.0% |
| Total | 1,001 | 100.0% |
Employment Status by Age in Alturas
According to the labor force statistics for Alturas, out of the total population over 16 years of age (2,131), 52.7% or 1,123 individuals are in the labor force, with 10.5% or 118 of them unemployed. The age group with the highest labor force participation rate is 20 to 24 years, with 88.2% or 127 individuals in the labor force. Within the labor force, the 60 to 64 years age range has the highest percentage of unemployed individuals, with 27.3% or 18 of them being unemployed.
| Age Bracket | In Labor Force | Unemployed |
| 16 to 19 Years | 48 (52.2%) | 9 (18.8%) |
| 20 to 24 Years | 127 (88.2%) | 0 (0.0%) |
| 25 to 29 Years | 142 (82.6%) | 23 (16.2%) |
| 30 to 34 Years | 203 (70.7%) | 38 (18.7%) |
| 35 to 44 Years | 218 (86.5%) | 28 (12.8%) |
| 45 to 54 Years | 161 (55.5%) | 0 (0.0%) |
| 55 to 59 Years | 94 (59.5%) | 0 (0.0%) |
| 60 to 64 Years | 66 (55.0%) | 18 (27.3%) |
| 65 to 74 Years | 63 (15.2%) | 0 (0.0%) |
| 75 Years and over | 0 (0.0%) | 0 (0.0%) |
| Total | 1,123 (52.7%) | 118 (10.5%) |
Employment Status by Educational Attainment in Alturas
According to labor force statistics for Alturas, 69.1% of individuals (884) out of the total population between 25 and 64 years of age (1,279) are in the labor force, with 12.1% or 107 of them being unemployed. The group with the highest labor force participation rate are those with the educational attainment of bachelor's degree or higher, with 85.5% or 207 individuals in the labor force. Within the labor force, individuals with high school diploma education have the highest percentage of unemployment, with 25.7% or 68 of them being unemployed.
| Educational Attainment | In Labor Force | Unemployed |
| Less than High School | 21 (32.3%) | 0 (0.0%) |
| High School Diploma | 265 (62.9%) | 108 (25.7%) |
| College / Associate Degree | 391 (71.0%) | 55 (10.0%) |
| Bachelor's Degree or higher | 207 (85.5%) | 0 (0.0%) |
| Total | 884 (69.1%) | 155 (12.1%) |
Employment Occupations by Sex in Alturas
Management, Business, Science and Arts Occupations
The most common Management, Business, Science and Arts occupations in Alturas are Community & Social Service (110 | 11.1%), Management (99 | 10.0%), Education Instruction & Library (87 | 8.8%), Computers, Engineering & Science (66 | 6.7%), and Health Diagnosing & Treating (62 | 6.3%).
Management, Business, Science and Arts Occupations by Sex
Within the Management, Business, Science and Arts occupations in Alturas, the most male-oriented occupations are Health Diagnosing & Treating (59.7%), Architecture & Engineering (52.6%), and Health Technologists (50.0%), while the most female-oriented occupations are Business & Financial (100.0%), Life, Physical & Social Science (100.0%), and Education, Arts & Media (100.0%).
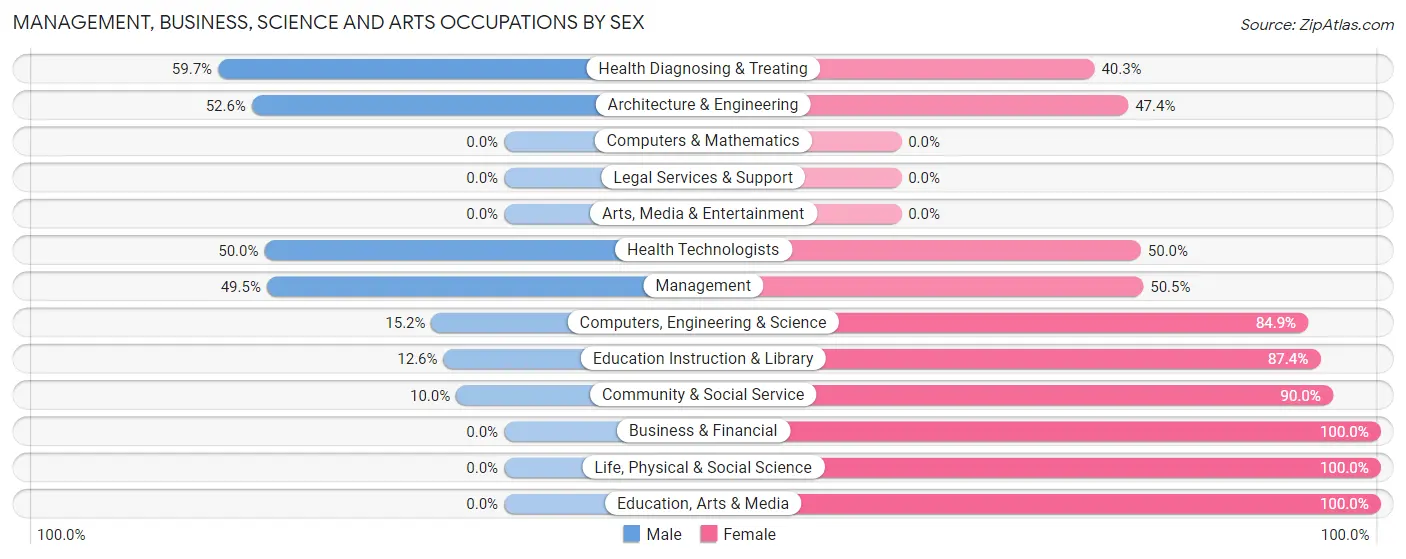
| Occupation | Male | Female |
| Management | 49 (49.5%) | 50 (50.5%) |
| Business & Financial | 0 (0.0%) | 25 (100.0%) |
| Computers, Engineering & Science | 10 (15.1%) | 56 (84.9%) |
| Computers & Mathematics | 0 (0.0%) | 0 (0.0%) |
| Architecture & Engineering | 10 (52.6%) | 9 (47.4%) |
| Life, Physical & Social Science | 0 (0.0%) | 47 (100.0%) |
| Community & Social Service | 11 (10.0%) | 99 (90.0%) |
| Education, Arts & Media | 0 (0.0%) | 23 (100.0%) |
| Legal Services & Support | 0 (0.0%) | 0 (0.0%) |
| Education Instruction & Library | 11 (12.6%) | 76 (87.4%) |
| Arts, Media & Entertainment | 0 (0.0%) | 0 (0.0%) |
| Health Diagnosing & Treating | 37 (59.7%) | 25 (40.3%) |
| Health Technologists | 25 (50.0%) | 25 (50.0%) |
| Total (Category) | 107 (29.6%) | 255 (70.4%) |
| Total (Overall) | 354 (35.8%) | 636 (64.2%) |
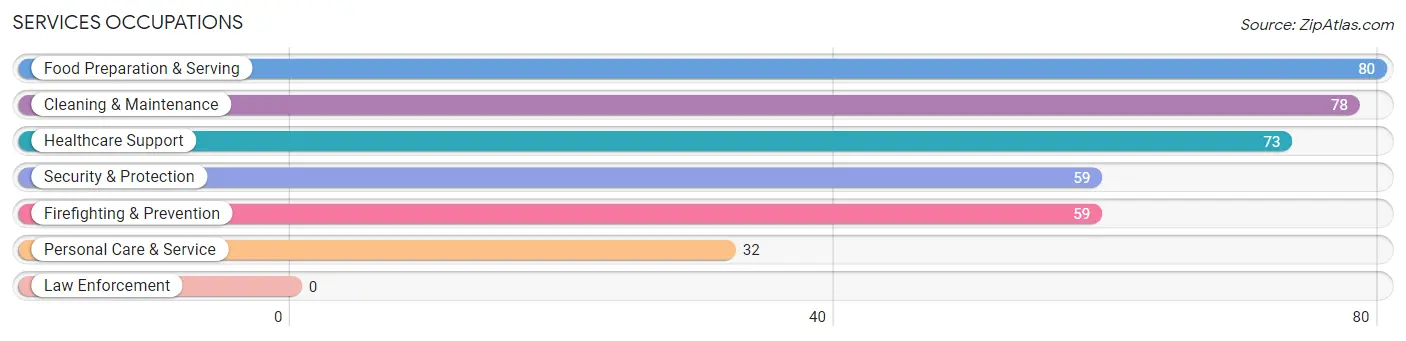
Services Occupations
The most common Services occupations in Alturas are Food Preparation & Serving (80 | 8.1%), Cleaning & Maintenance (78 | 7.9%), Healthcare Support (73 | 7.4%), Security & Protection (59 | 6.0%), and Firefighting & Prevention (59 | 6.0%).
Services Occupations by Sex
Within the Services occupations in Alturas, the most male-oriented occupations are Security & Protection (100.0%), Firefighting & Prevention (100.0%), and Personal Care & Service (100.0%), while the most female-oriented occupations are Healthcare Support (100.0%), Food Preparation & Serving (53.7%), and Cleaning & Maintenance (34.6%).
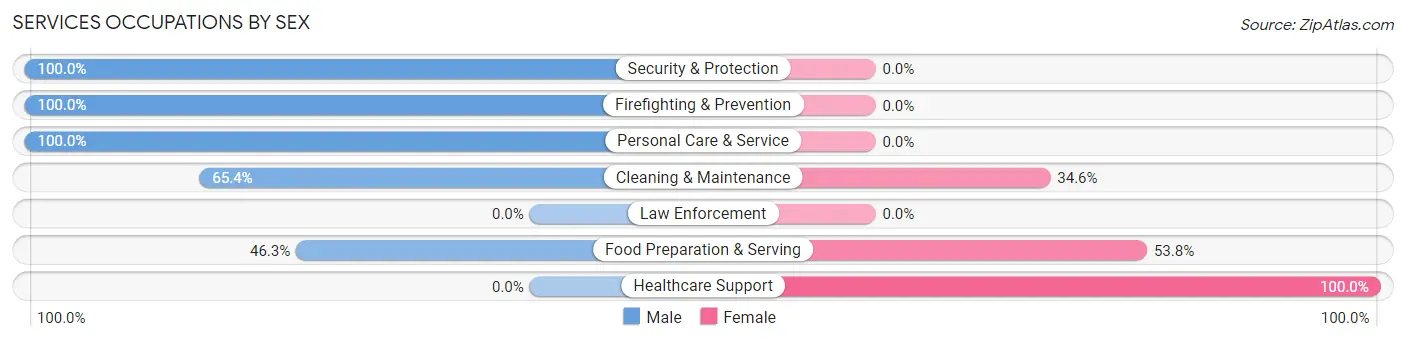
| Occupation | Male | Female |
| Healthcare Support | 0 (0.0%) | 73 (100.0%) |
| Security & Protection | 59 (100.0%) | 0 (0.0%) |
| Firefighting & Prevention | 59 (100.0%) | 0 (0.0%) |
| Law Enforcement | 0 (0.0%) | 0 (0.0%) |
| Food Preparation & Serving | 37 (46.3%) | 43 (53.7%) |
| Cleaning & Maintenance | 51 (65.4%) | 27 (34.6%) |
| Personal Care & Service | 32 (100.0%) | 0 (0.0%) |
| Total (Category) | 179 (55.6%) | 143 (44.4%) |
| Total (Overall) | 354 (35.8%) | 636 (64.2%) |
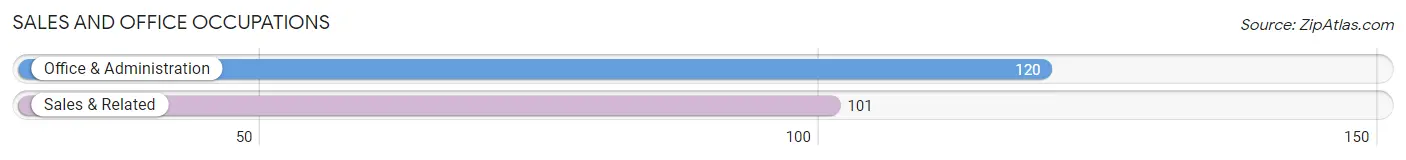
Sales and Office Occupations
The most common Sales and Office occupations in Alturas are Office & Administration (120 | 12.1%), and Sales & Related (101 | 10.2%).
Sales and Office Occupations by Sex
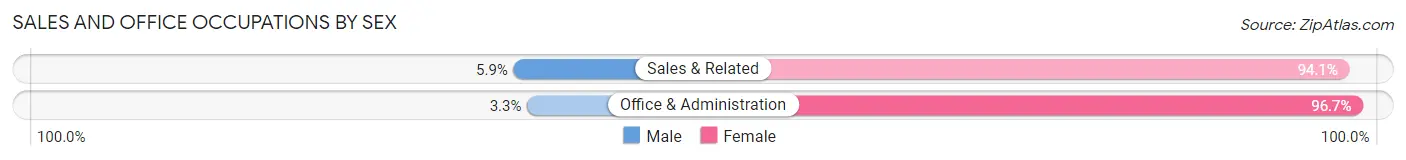
| Occupation | Male | Female |
| Sales & Related | 6 (5.9%) | 95 (94.1%) |
| Office & Administration | 4 (3.3%) | 116 (96.7%) |
| Total (Category) | 10 (4.5%) | 211 (95.5%) |
| Total (Overall) | 354 (35.8%) | 636 (64.2%) |
Natural Resources, Construction and Maintenance Occupations
The most common Natural Resources, Construction and Maintenance occupations in Alturas are Installation, Maintenance & Repair (21 | 2.1%), Farming, Fishing & Forestry (14 | 1.4%), and Construction & Extraction (9 | 0.9%).
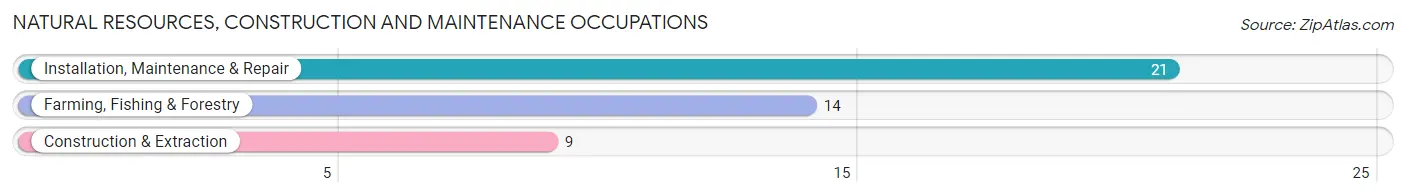
Natural Resources, Construction and Maintenance Occupations by Sex
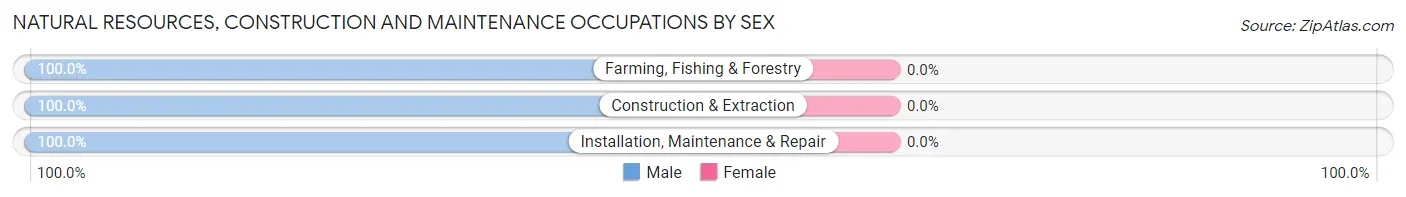
| Occupation | Male | Female |
| Farming, Fishing & Forestry | 14 (100.0%) | 0 (0.0%) |
| Construction & Extraction | 9 (100.0%) | 0 (0.0%) |
| Installation, Maintenance & Repair | 21 (100.0%) | 0 (0.0%) |
| Total (Category) | 44 (100.0%) | 0 (0.0%) |
| Total (Overall) | 354 (35.8%) | 636 (64.2%) |
Production, Transportation and Moving Occupations
The most common Production, Transportation and Moving occupations in Alturas are , and Transportation (41 | 4.1%).
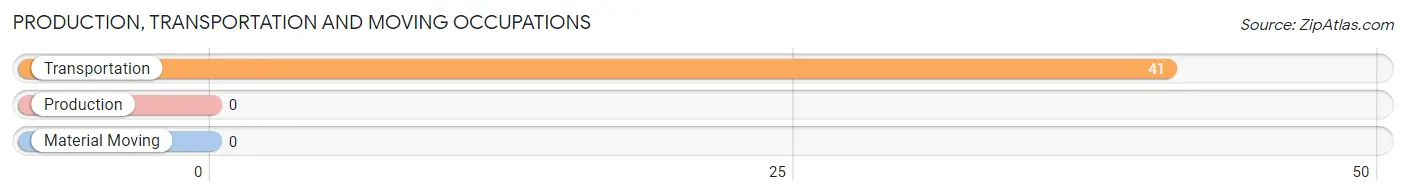
Production, Transportation and Moving Occupations by Sex
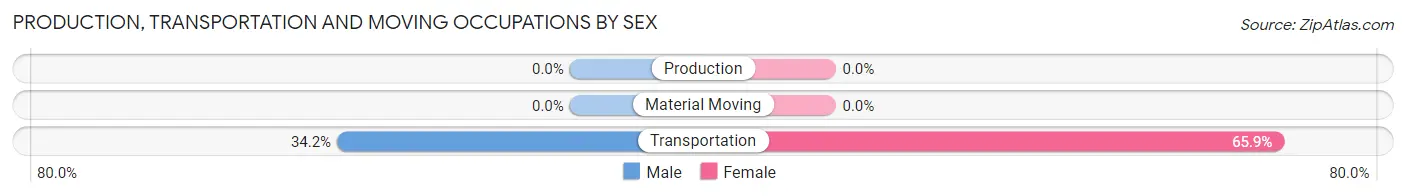
| Occupation | Male | Female |
| Production | 0 (0.0%) | 0 (0.0%) |
| Transportation | 14 (34.2%) | 27 (65.8%) |
| Material Moving | 0 (0.0%) | 0 (0.0%) |
| Total (Category) | 14 (34.2%) | 27 (65.8%) |
| Total (Overall) | 354 (35.8%) | 636 (64.2%) |
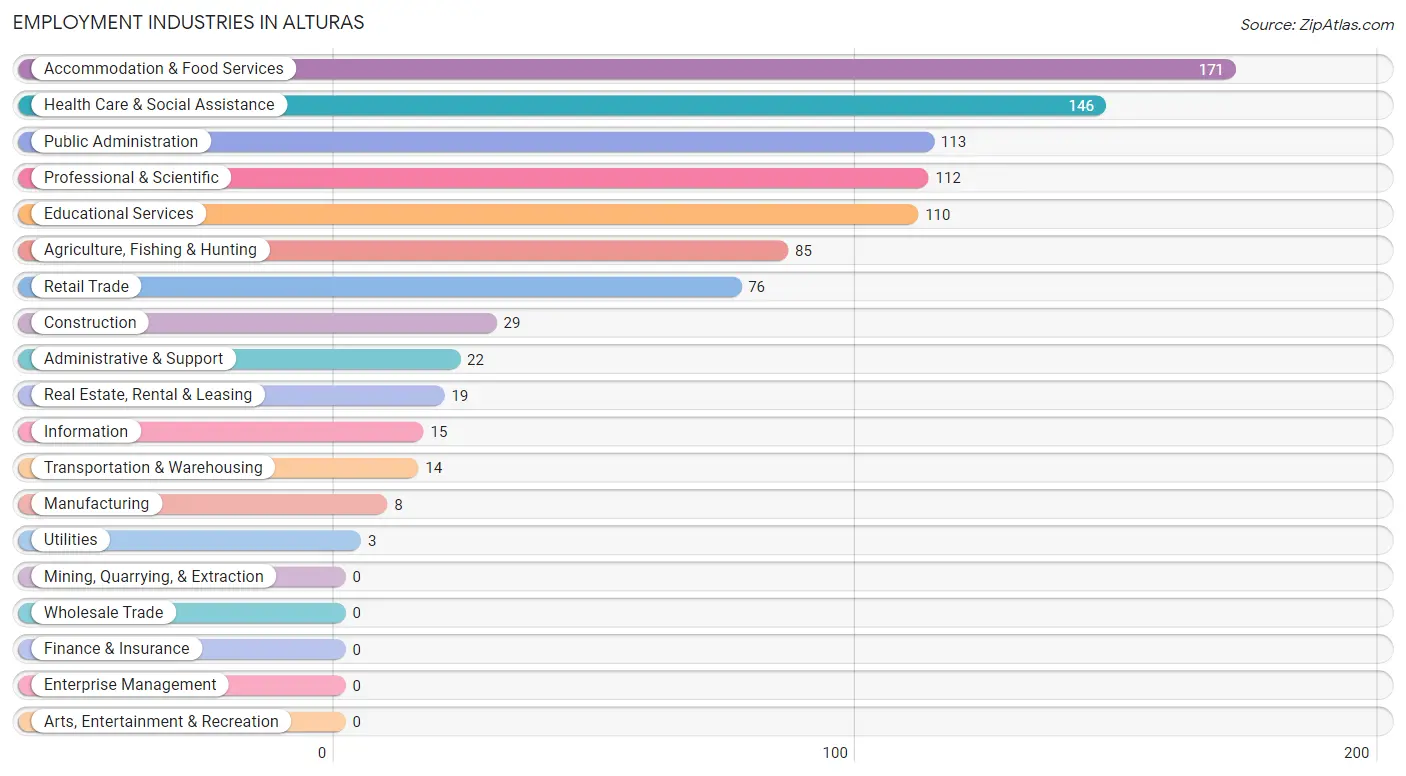
Employment Industries by Sex in Alturas
Employment Industries in Alturas
The major employment industries in Alturas include Accommodation & Food Services (171 | 17.3%), Health Care & Social Assistance (146 | 14.7%), Public Administration (113 | 11.4%), Professional & Scientific (112 | 11.3%), and Educational Services (110 | 11.1%).
Employment Industries by Sex in Alturas
The Alturas industries that see more men than women are Manufacturing (100.0%), Transportation & Warehousing (100.0%), and Utilities (100.0%), whereas the industries that tend to have a higher number of women are Information (100.0%), Real Estate, Rental & Leasing (100.0%), and Administrative & Support (100.0%).
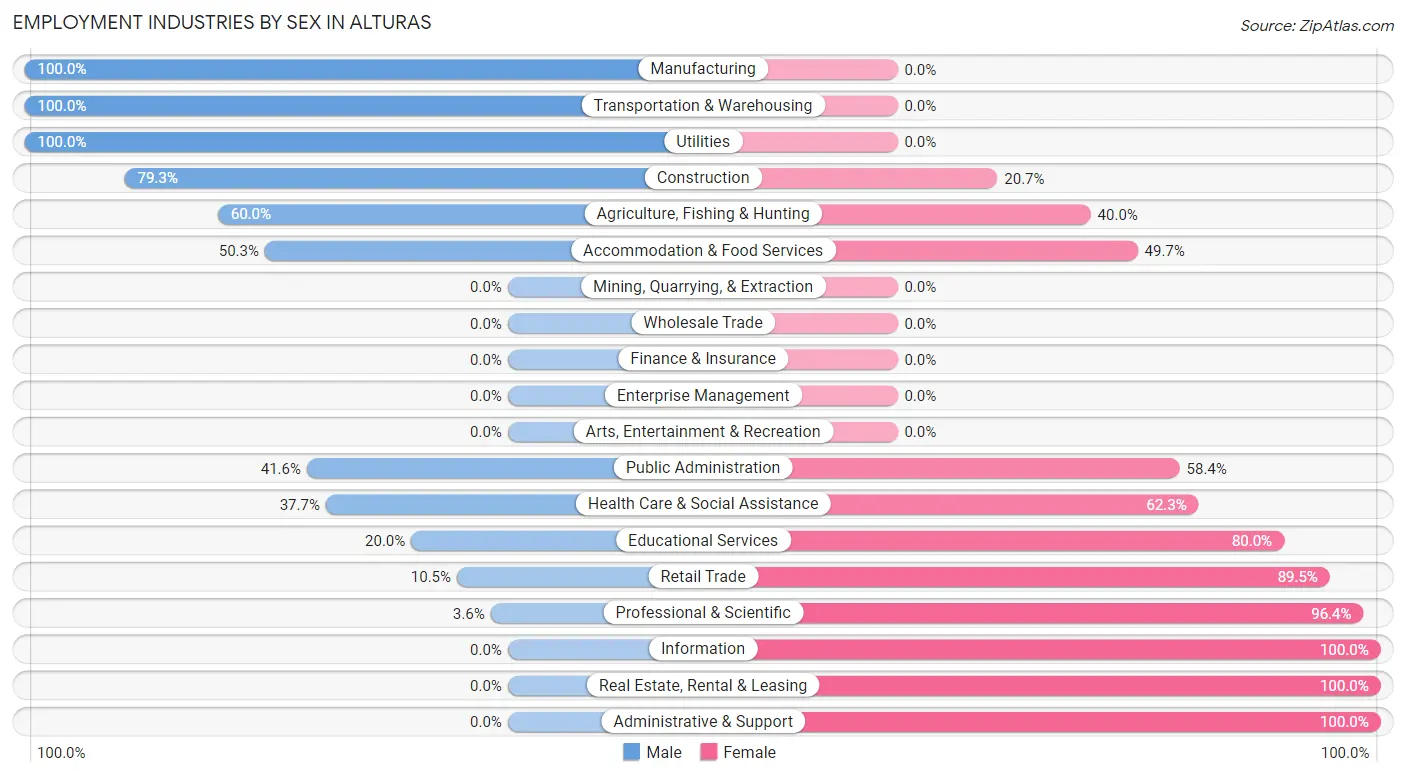
| Industry | Male | Female |
| Agriculture, Fishing & Hunting | 51 (60.0%) | 34 (40.0%) |
| Mining, Quarrying, & Extraction | 0 (0.0%) | 0 (0.0%) |
| Construction | 23 (79.3%) | 6 (20.7%) |
| Manufacturing | 8 (100.0%) | 0 (0.0%) |
| Wholesale Trade | 0 (0.0%) | 0 (0.0%) |
| Retail Trade | 8 (10.5%) | 68 (89.5%) |
| Transportation & Warehousing | 14 (100.0%) | 0 (0.0%) |
| Utilities | 3 (100.0%) | 0 (0.0%) |
| Information | 0 (0.0%) | 15 (100.0%) |
| Finance & Insurance | 0 (0.0%) | 0 (0.0%) |
| Real Estate, Rental & Leasing | 0 (0.0%) | 19 (100.0%) |
| Professional & Scientific | 4 (3.6%) | 108 (96.4%) |
| Enterprise Management | 0 (0.0%) | 0 (0.0%) |
| Administrative & Support | 0 (0.0%) | 22 (100.0%) |
| Educational Services | 22 (20.0%) | 88 (80.0%) |
| Health Care & Social Assistance | 55 (37.7%) | 91 (62.3%) |
| Arts, Entertainment & Recreation | 0 (0.0%) | 0 (0.0%) |
| Accommodation & Food Services | 86 (50.3%) | 85 (49.7%) |
| Public Administration | 47 (41.6%) | 66 (58.4%) |
| Total | 354 (35.8%) | 636 (64.2%) |
Education in Alturas
School Enrollment in Alturas
The most common levels of schooling among the 531 students in Alturas are high school (149 | 28.1%), elementary school (125 | 23.5%), and kindergarten (97 | 18.3%).
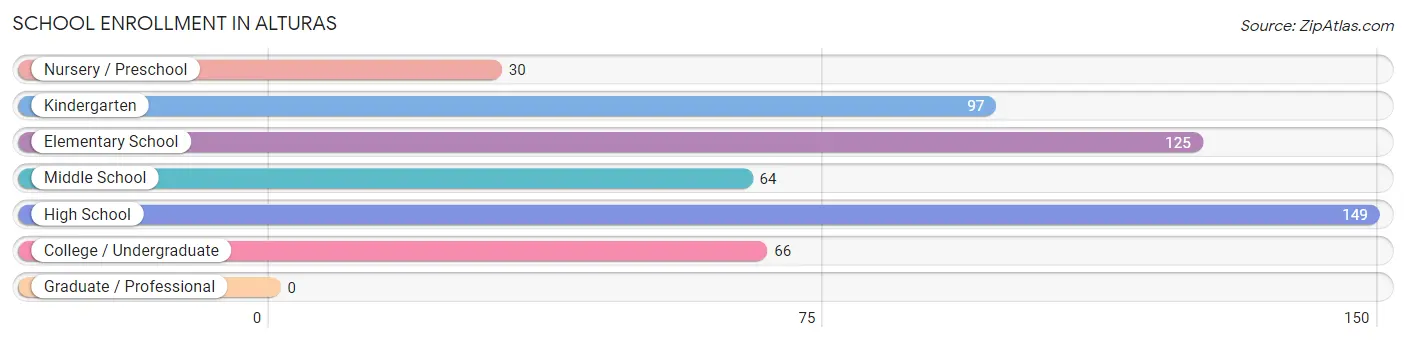
| School Level | # Students | % Students |
| Nursery / Preschool | 30 | 5.7% |
| Kindergarten | 97 | 18.3% |
| Elementary School | 125 | 23.5% |
| Middle School | 64 | 12.0% |
| High School | 149 | 28.1% |
| College / Undergraduate | 66 | 12.4% |
| Graduate / Professional | 0 | 0.0% |
| Total | 531 | 100.0% |
School Enrollment by Age by Funding Source in Alturas
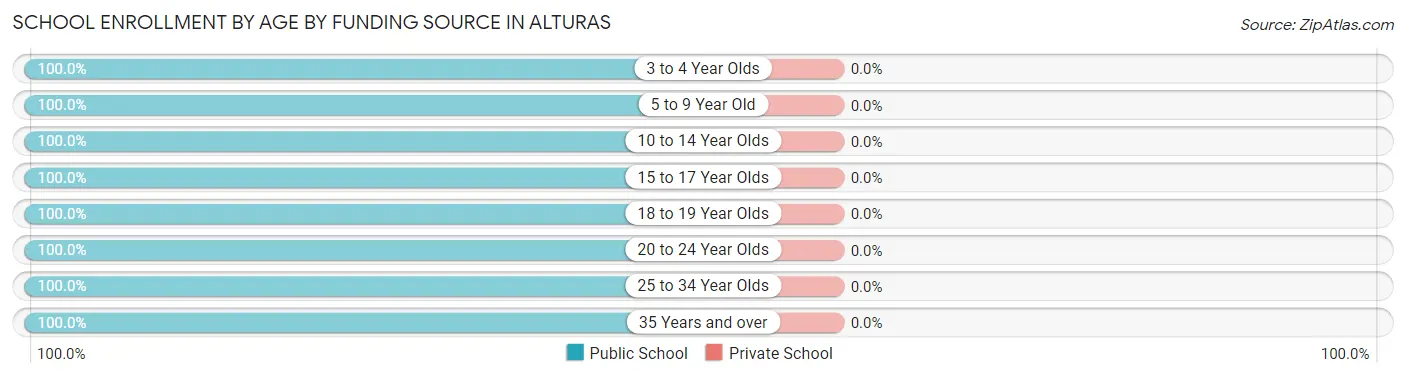
| Age Bracket | Public School | Private School |
| 3 to 4 Year Olds | 53 (100.0%) | 0 (0.0%) |
| 5 to 9 Year Old | 181 (100.0%) | 0 (0.0%) |
| 10 to 14 Year Olds | 117 (100.0%) | 0 (0.0%) |
| 15 to 17 Year Olds | 84 (100.0%) | 0 (0.0%) |
| 18 to 19 Year Olds | 40 (100.0%) | 0 (0.0%) |
| 20 to 24 Year Olds | 16 (100.0%) | 0 (0.0%) |
| 25 to 34 Year Olds | 16 (100.0%) | 0 (0.0%) |
| 35 Years and over | 24 (100.0%) | 0 (0.0%) |
| Total | 531 (100.0%) | 0 (0.0%) |
Educational Attainment by Field of Study in Alturas
Business (132 | 29.5%), bio, nature & agricultural (62 | 13.8%), arts & humanities (57 | 12.7%), literature & languages (50 | 11.2%), and social sciences (43 | 9.6%) are the most common fields of study among 448 individuals in Alturas who have obtained a bachelor's degree or higher.
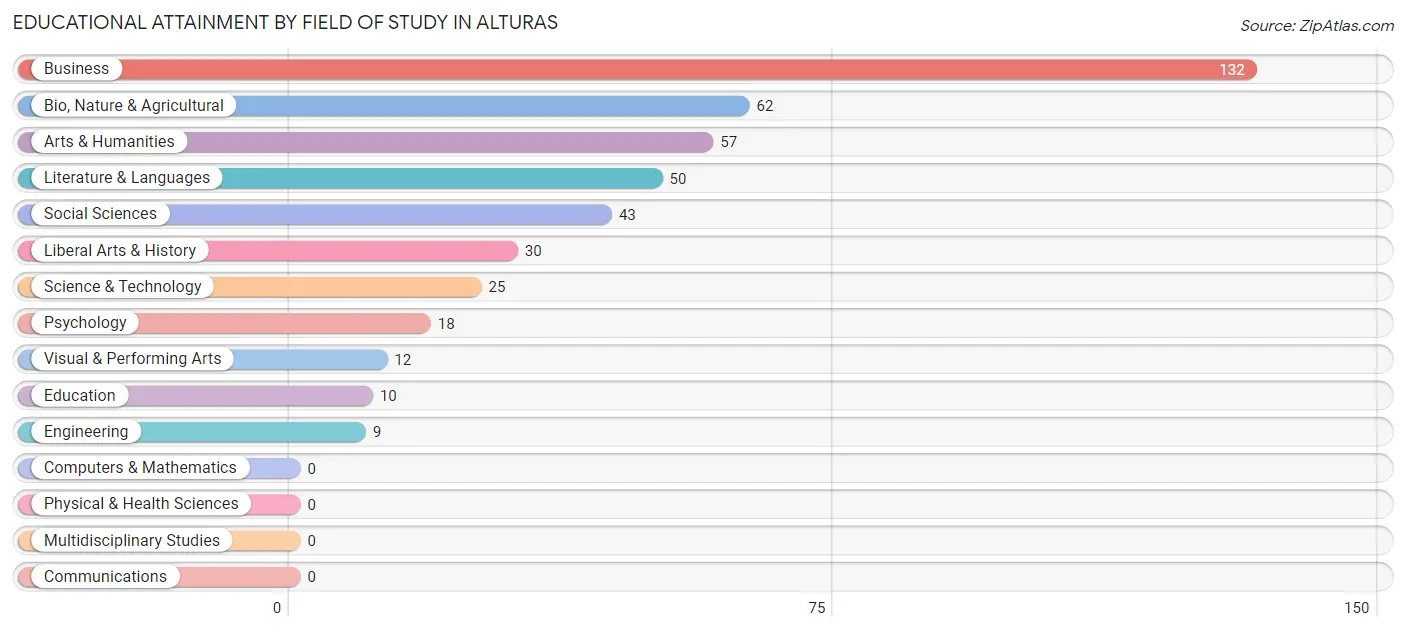
| Field of Study | # Graduates | % Graduates |
| Computers & Mathematics | 0 | 0.0% |
| Bio, Nature & Agricultural | 62 | 13.8% |
| Physical & Health Sciences | 0 | 0.0% |
| Psychology | 18 | 4.0% |
| Social Sciences | 43 | 9.6% |
| Engineering | 9 | 2.0% |
| Multidisciplinary Studies | 0 | 0.0% |
| Science & Technology | 25 | 5.6% |
| Business | 132 | 29.5% |
| Education | 10 | 2.2% |
| Literature & Languages | 50 | 11.2% |
| Liberal Arts & History | 30 | 6.7% |
| Visual & Performing Arts | 12 | 2.7% |
| Communications | 0 | 0.0% |
| Arts & Humanities | 57 | 12.7% |
| Total | 448 | 100.0% |
Transportation & Commute in Alturas
Vehicle Availability by Sex in Alturas
The most prevalent vehicle ownership categories in Alturas are males with 2 vehicles (196, accounting for 54.9%) and females with 2 vehicles (283, making up 30.8%).
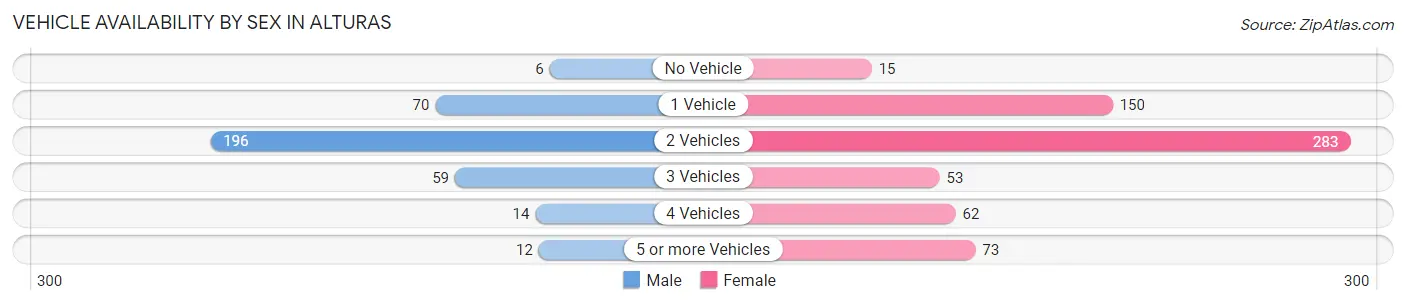
| Vehicles Available | Male | Female |
| No Vehicle | 6 (1.7%) | 15 (2.4%) |
| 1 Vehicle | 70 (19.6%) | 150 (23.6%) |
| 2 Vehicles | 196 (54.9%) | 283 (44.5%) |
| 3 Vehicles | 59 (16.5%) | 53 (8.3%) |
| 4 Vehicles | 14 (3.9%) | 62 (9.8%) |
| 5 or more Vehicles | 12 (3.4%) | 73 (11.5%) |
| Total | 357 (100.0%) | 636 (100.0%) |
Commute Time in Alturas
The most frequently occuring commute durations in Alturas are 5 to 9 minutes (387 commuters, 40.1%), less than 5 minutes (266 commuters, 27.5%), and 10 to 14 minutes (173 commuters, 17.9%).
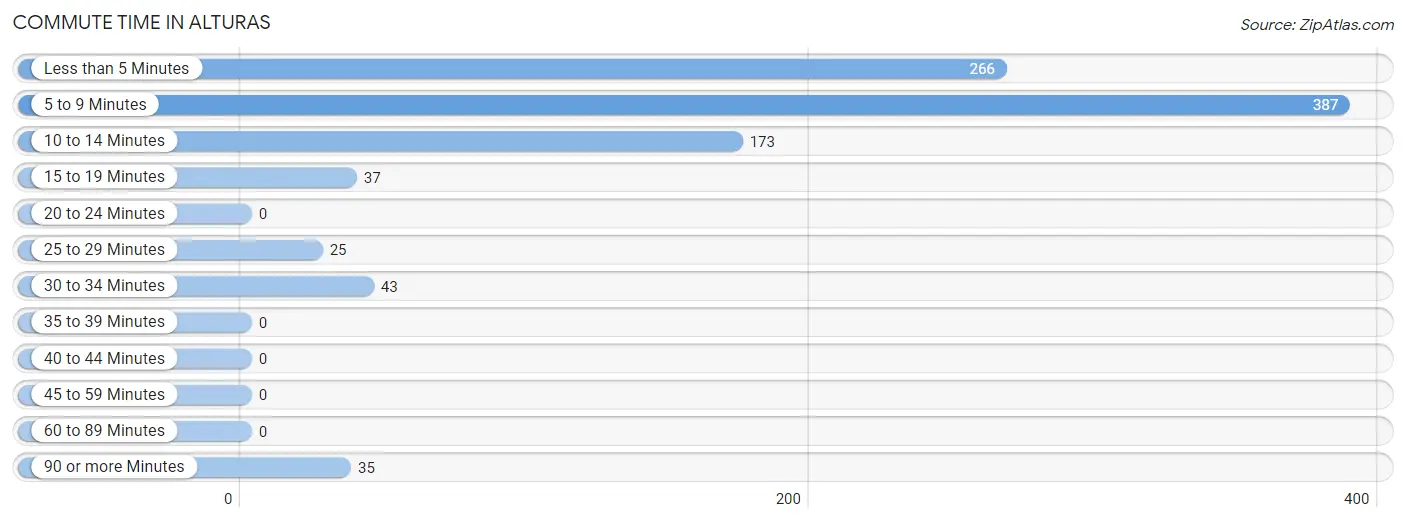
| Commute Time | # Commuters | % Commuters |
| Less than 5 Minutes | 266 | 27.5% |
| 5 to 9 Minutes | 387 | 40.1% |
| 10 to 14 Minutes | 173 | 17.9% |
| 15 to 19 Minutes | 37 | 3.8% |
| 20 to 24 Minutes | 0 | 0.0% |
| 25 to 29 Minutes | 25 | 2.6% |
| 30 to 34 Minutes | 43 | 4.4% |
| 35 to 39 Minutes | 0 | 0.0% |
| 40 to 44 Minutes | 0 | 0.0% |
| 45 to 59 Minutes | 0 | 0.0% |
| 60 to 89 Minutes | 0 | 0.0% |
| 90 or more Minutes | 35 | 3.6% |
Commute Time by Sex in Alturas
The most common commute times in Alturas are 5 to 9 minutes (95 commuters, 26.5%) for males and 5 to 9 minutes (292 commuters, 48.0%) for females.
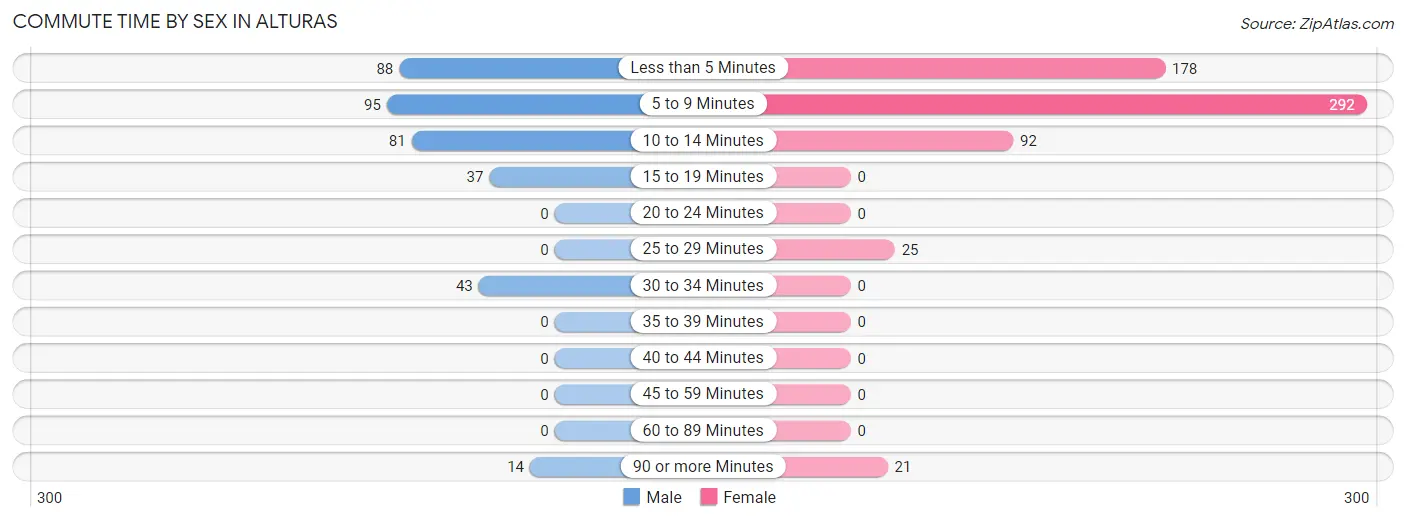
| Commute Time | Male | Female |
| Less than 5 Minutes | 88 (24.6%) | 178 (29.3%) |
| 5 to 9 Minutes | 95 (26.5%) | 292 (48.0%) |
| 10 to 14 Minutes | 81 (22.6%) | 92 (15.1%) |
| 15 to 19 Minutes | 37 (10.3%) | 0 (0.0%) |
| 20 to 24 Minutes | 0 (0.0%) | 0 (0.0%) |
| 25 to 29 Minutes | 0 (0.0%) | 25 (4.1%) |
| 30 to 34 Minutes | 43 (12.0%) | 0 (0.0%) |
| 35 to 39 Minutes | 0 (0.0%) | 0 (0.0%) |
| 40 to 44 Minutes | 0 (0.0%) | 0 (0.0%) |
| 45 to 59 Minutes | 0 (0.0%) | 0 (0.0%) |
| 60 to 89 Minutes | 0 (0.0%) | 0 (0.0%) |
| 90 or more Minutes | 14 (3.9%) | 21 (3.5%) |
Time of Departure to Work by Sex in Alturas
The most frequent times of departure to work in Alturas are 7:00 AM to 7:29 AM (71, 19.8%) for males and 8:00 AM to 8:29 AM (263, 43.3%) for females.
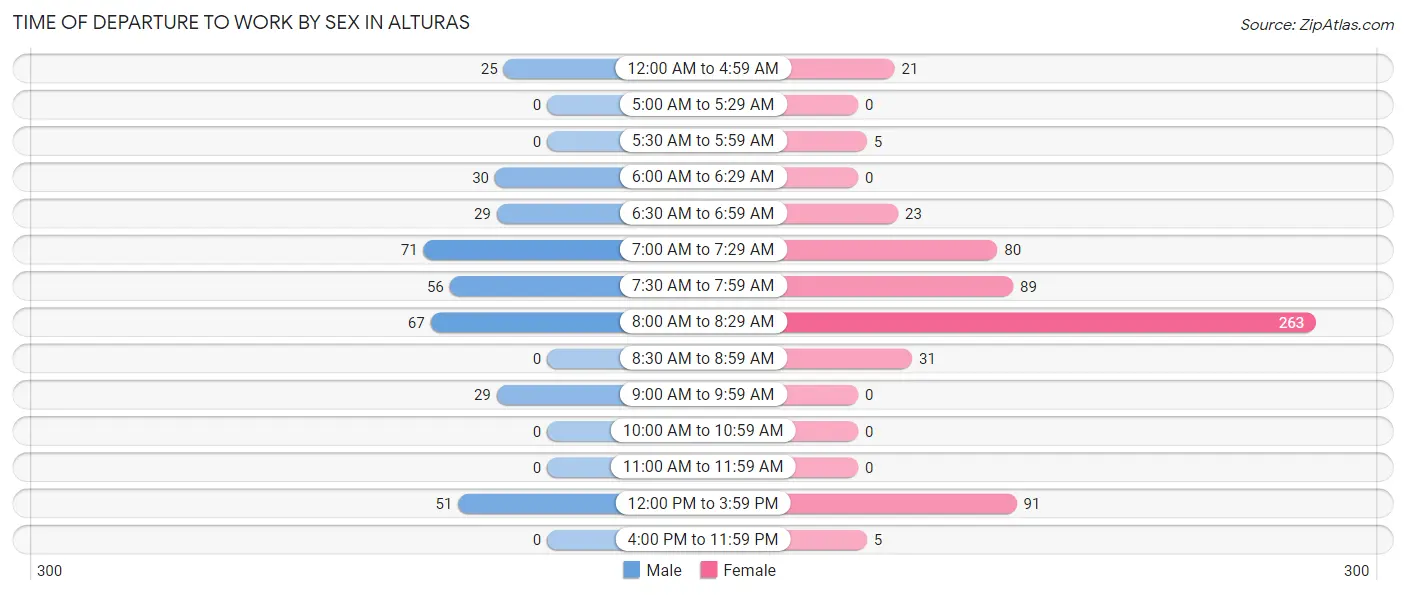
| Time of Departure | Male | Female |
| 12:00 AM to 4:59 AM | 25 (7.0%) | 21 (3.5%) |
| 5:00 AM to 5:29 AM | 0 (0.0%) | 0 (0.0%) |
| 5:30 AM to 5:59 AM | 0 (0.0%) | 5 (0.8%) |
| 6:00 AM to 6:29 AM | 30 (8.4%) | 0 (0.0%) |
| 6:30 AM to 6:59 AM | 29 (8.1%) | 23 (3.8%) |
| 7:00 AM to 7:29 AM | 71 (19.8%) | 80 (13.2%) |
| 7:30 AM to 7:59 AM | 56 (15.6%) | 89 (14.6%) |
| 8:00 AM to 8:29 AM | 67 (18.7%) | 263 (43.3%) |
| 8:30 AM to 8:59 AM | 0 (0.0%) | 31 (5.1%) |
| 9:00 AM to 9:59 AM | 29 (8.1%) | 0 (0.0%) |
| 10:00 AM to 10:59 AM | 0 (0.0%) | 0 (0.0%) |
| 11:00 AM to 11:59 AM | 0 (0.0%) | 0 (0.0%) |
| 12:00 PM to 3:59 PM | 51 (14.2%) | 91 (15.0%) |
| 4:00 PM to 11:59 PM | 0 (0.0%) | 5 (0.8%) |
| Total | 358 (100.0%) | 608 (100.0%) |
Housing Occupancy in Alturas
Occupancy by Ownership in Alturas
Of the total 1,117 dwellings in Alturas, owner-occupied units account for 670 (60.0%), while renter-occupied units make up 447 (40.0%).
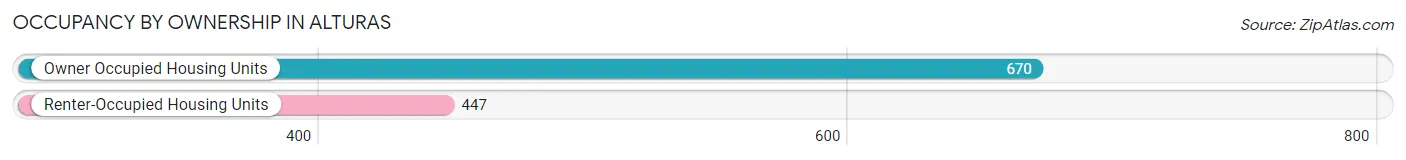
| Occupancy | # Housing Units | % Housing Units |
| Owner Occupied Housing Units | 670 | 60.0% |
| Renter-Occupied Housing Units | 447 | 40.0% |
| Total Occupied Housing Units | 1,117 | 100.0% |
Occupancy by Household Size in Alturas
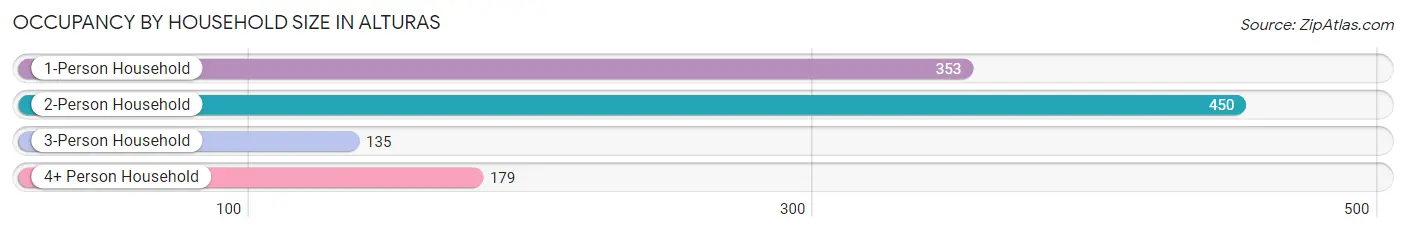
| Household Size | # Housing Units | % Housing Units |
| 1-Person Household | 353 | 31.6% |
| 2-Person Household | 450 | 40.3% |
| 3-Person Household | 135 | 12.1% |
| 4+ Person Household | 179 | 16.0% |
| Total Housing Units | 1,117 | 100.0% |
Occupancy by Ownership by Household Size in Alturas
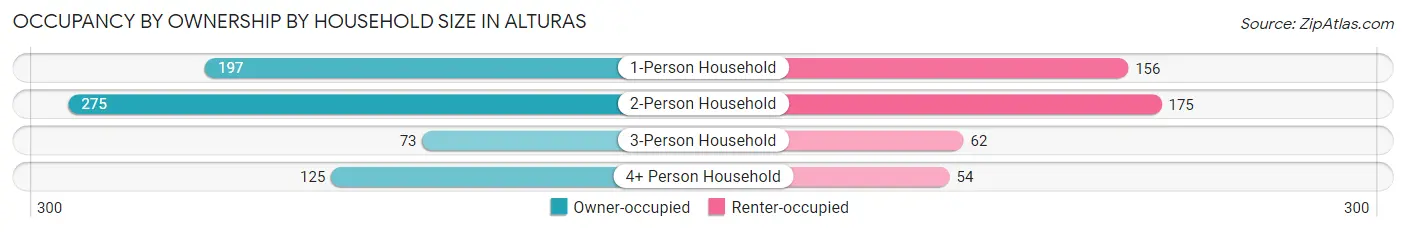
| Household Size | Owner-occupied | Renter-occupied |
| 1-Person Household | 197 (55.8%) | 156 (44.2%) |
| 2-Person Household | 275 (61.1%) | 175 (38.9%) |
| 3-Person Household | 73 (54.1%) | 62 (45.9%) |
| 4+ Person Household | 125 (69.8%) | 54 (30.2%) |
| Total Housing Units | 670 (60.0%) | 447 (40.0%) |
Occupancy by Educational Attainment in Alturas
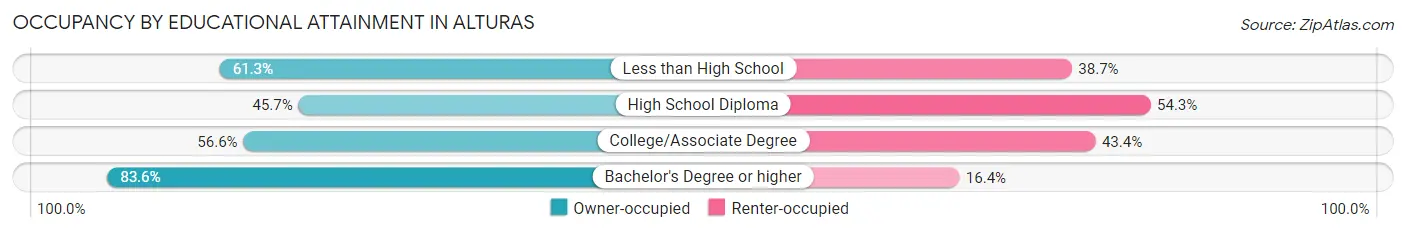
| Household Size | Owner-occupied | Renter-occupied |
| Less than High School | 57 (61.3%) | 36 (38.7%) |
| High School Diploma | 143 (45.7%) | 170 (54.3%) |
| College/Associate Degree | 261 (56.6%) | 200 (43.4%) |
| Bachelor's Degree or higher | 209 (83.6%) | 41 (16.4%) |
Occupancy by Age of Householder in Alturas
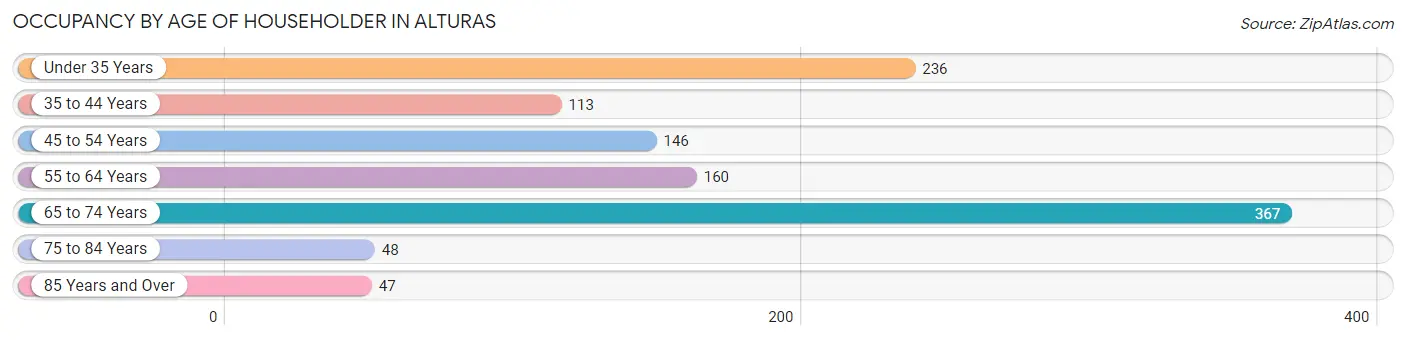
| Age Bracket | # Households | % Households |
| Under 35 Years | 236 | 21.1% |
| 35 to 44 Years | 113 | 10.1% |
| 45 to 54 Years | 146 | 13.1% |
| 55 to 64 Years | 160 | 14.3% |
| 65 to 74 Years | 367 | 32.9% |
| 75 to 84 Years | 48 | 4.3% |
| 85 Years and Over | 47 | 4.2% |
| Total | 1,117 | 100.0% |
Housing Finances in Alturas
Median Income by Occupancy in Alturas
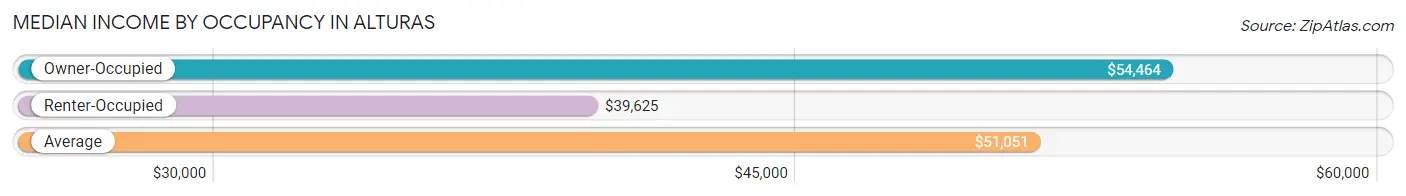
| Occupancy Type | # Households | Median Income |
| Owner-Occupied | 670 (60.0%) | $54,464 |
| Renter-Occupied | 447 (40.0%) | $39,625 |
| Average | 1,117 (100.0%) | $51,051 |
Occupancy by Householder Income Bracket in Alturas
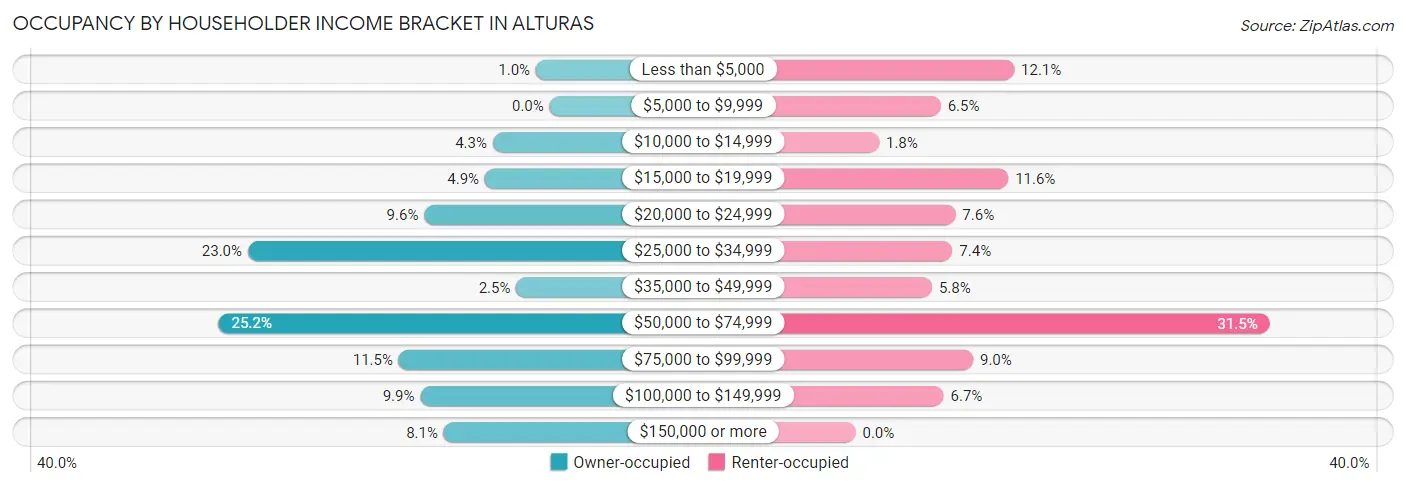
| Income Bracket | Owner-occupied | Renter-occupied |
| Less than $5,000 | 7 (1.0%) | 54 (12.1%) |
| $5,000 to $9,999 | 0 (0.0%) | 29 (6.5%) |
| $10,000 to $14,999 | 29 (4.3%) | 8 (1.8%) |
| $15,000 to $19,999 | 33 (4.9%) | 52 (11.6%) |
| $20,000 to $24,999 | 64 (9.6%) | 34 (7.6%) |
| $25,000 to $34,999 | 154 (23.0%) | 33 (7.4%) |
| $35,000 to $49,999 | 17 (2.5%) | 26 (5.8%) |
| $50,000 to $74,999 | 169 (25.2%) | 141 (31.5%) |
| $75,000 to $99,999 | 77 (11.5%) | 40 (8.9%) |
| $100,000 to $149,999 | 66 (9.9%) | 30 (6.7%) |
| $150,000 or more | 54 (8.1%) | 0 (0.0%) |
| Total | 670 (100.0%) | 447 (100.0%) |
Monthly Housing Cost Tiers in Alturas
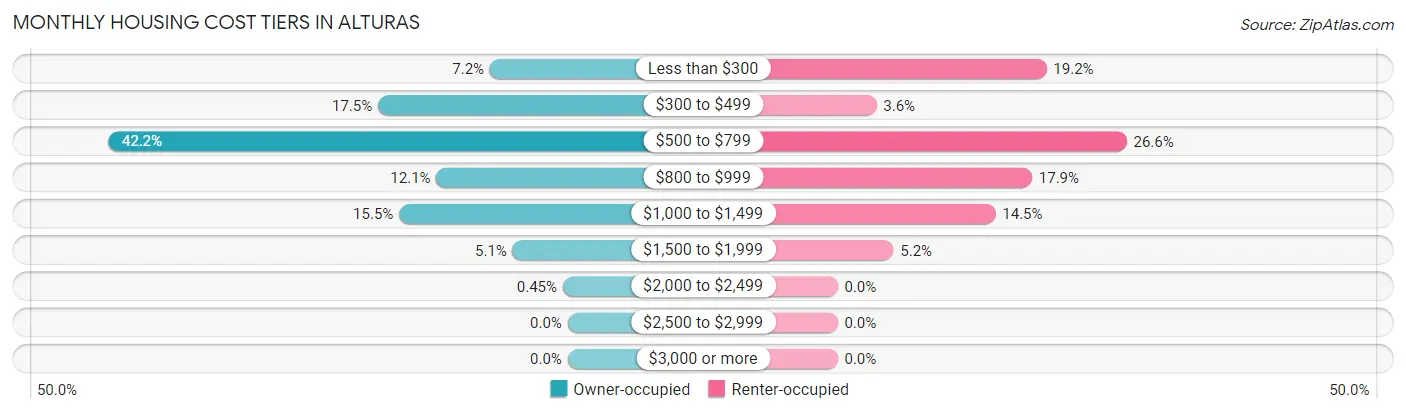
| Monthly Cost | Owner-occupied | Renter-occupied |
| Less than $300 | 48 (7.2%) | 86 (19.2%) |
| $300 to $499 | 117 (17.5%) | 16 (3.6%) |
| $500 to $799 | 283 (42.2%) | 119 (26.6%) |
| $800 to $999 | 81 (12.1%) | 80 (17.9%) |
| $1,000 to $1,499 | 104 (15.5%) | 65 (14.5%) |
| $1,500 to $1,999 | 34 (5.1%) | 23 (5.1%) |
| $2,000 to $2,499 | 3 (0.4%) | 0 (0.0%) |
| $2,500 to $2,999 | 0 (0.0%) | 0 (0.0%) |
| $3,000 or more | 0 (0.0%) | 0 (0.0%) |
| Total | 670 (100.0%) | 447 (100.0%) |
Physical Housing Characteristics in Alturas
Housing Structures in Alturas
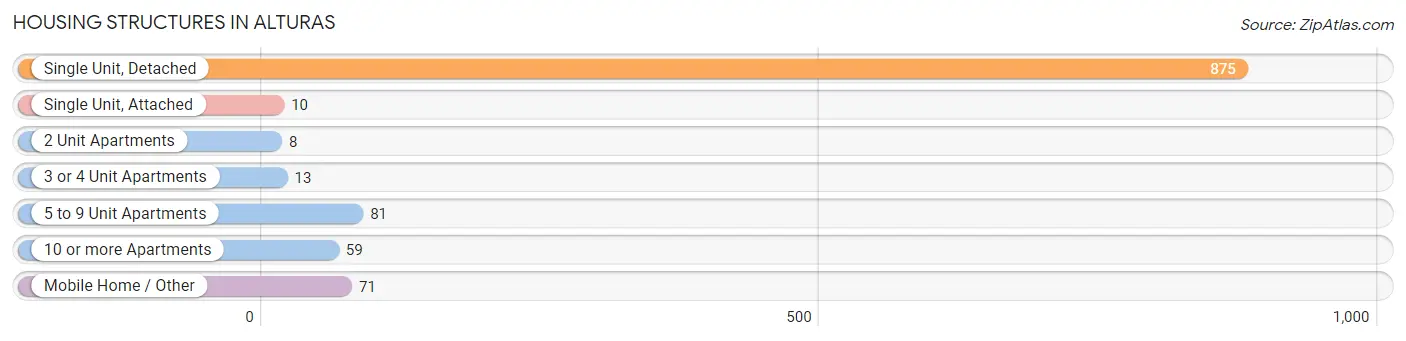
| Structure Type | # Housing Units | % Housing Units |
| Single Unit, Detached | 875 | 78.3% |
| Single Unit, Attached | 10 | 0.9% |
| 2 Unit Apartments | 8 | 0.7% |
| 3 or 4 Unit Apartments | 13 | 1.2% |
| 5 to 9 Unit Apartments | 81 | 7.2% |
| 10 or more Apartments | 59 | 5.3% |
| Mobile Home / Other | 71 | 6.4% |
| Total | 1,117 | 100.0% |
Housing Structures by Occupancy in Alturas
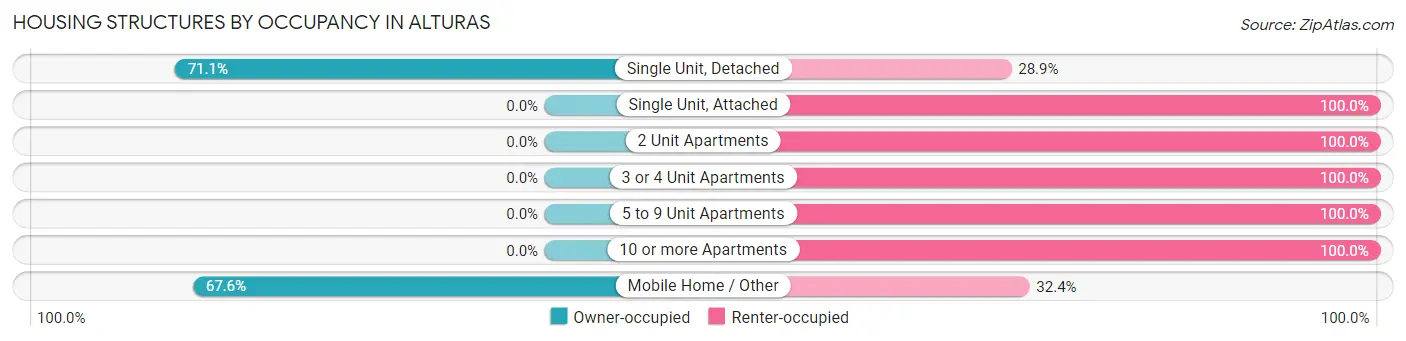
| Structure Type | Owner-occupied | Renter-occupied |
| Single Unit, Detached | 622 (71.1%) | 253 (28.9%) |
| Single Unit, Attached | 0 (0.0%) | 10 (100.0%) |
| 2 Unit Apartments | 0 (0.0%) | 8 (100.0%) |
| 3 or 4 Unit Apartments | 0 (0.0%) | 13 (100.0%) |
| 5 to 9 Unit Apartments | 0 (0.0%) | 81 (100.0%) |
| 10 or more Apartments | 0 (0.0%) | 59 (100.0%) |
| Mobile Home / Other | 48 (67.6%) | 23 (32.4%) |
| Total | 670 (60.0%) | 447 (40.0%) |
Housing Structures by Number of Rooms in Alturas
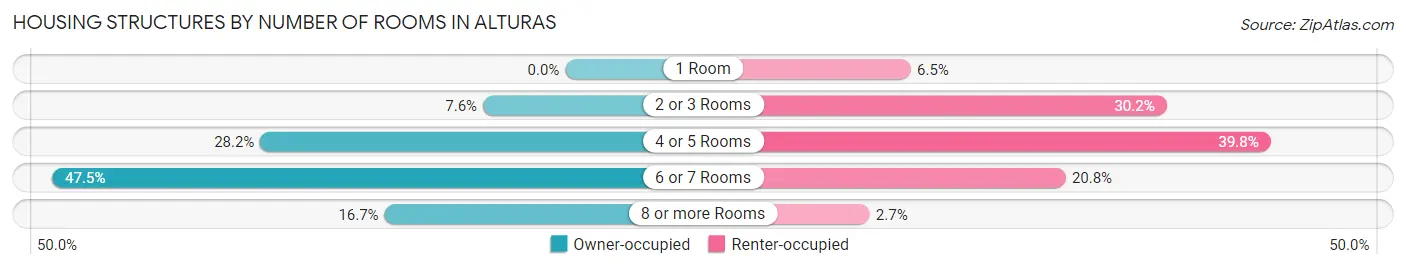
| Number of Rooms | Owner-occupied | Renter-occupied |
| 1 Room | 0 (0.0%) | 29 (6.5%) |
| 2 or 3 Rooms | 51 (7.6%) | 135 (30.2%) |
| 4 or 5 Rooms | 189 (28.2%) | 178 (39.8%) |
| 6 or 7 Rooms | 318 (47.5%) | 93 (20.8%) |
| 8 or more Rooms | 112 (16.7%) | 12 (2.7%) |
| Total | 670 (100.0%) | 447 (100.0%) |
Housing Structure by Heating Type in Alturas
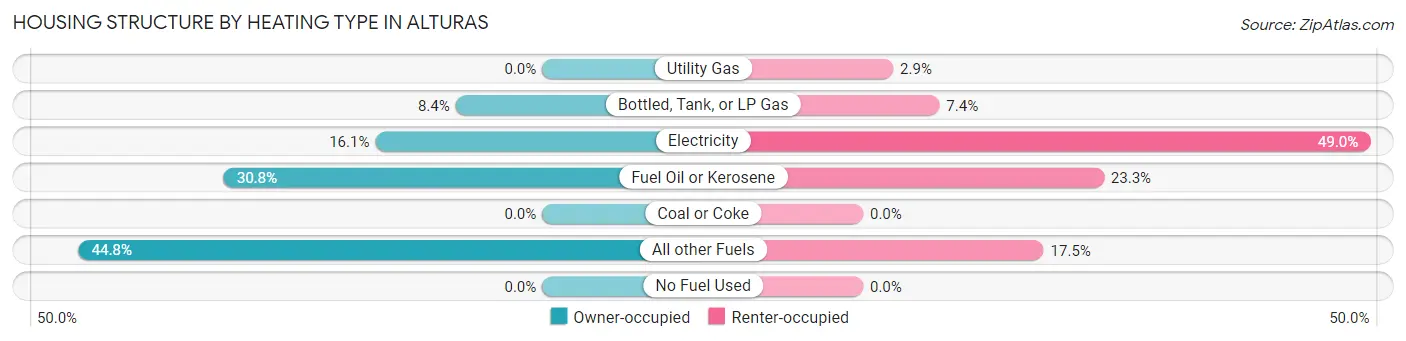
| Heating Type | Owner-occupied | Renter-occupied |
| Utility Gas | 0 (0.0%) | 13 (2.9%) |
| Bottled, Tank, or LP Gas | 56 (8.4%) | 33 (7.4%) |
| Electricity | 108 (16.1%) | 219 (49.0%) |
| Fuel Oil or Kerosene | 206 (30.7%) | 104 (23.3%) |
| Coal or Coke | 0 (0.0%) | 0 (0.0%) |
| All other Fuels | 300 (44.8%) | 78 (17.4%) |
| No Fuel Used | 0 (0.0%) | 0 (0.0%) |
| Total | 670 (100.0%) | 447 (100.0%) |
Household Vehicle Usage in Alturas
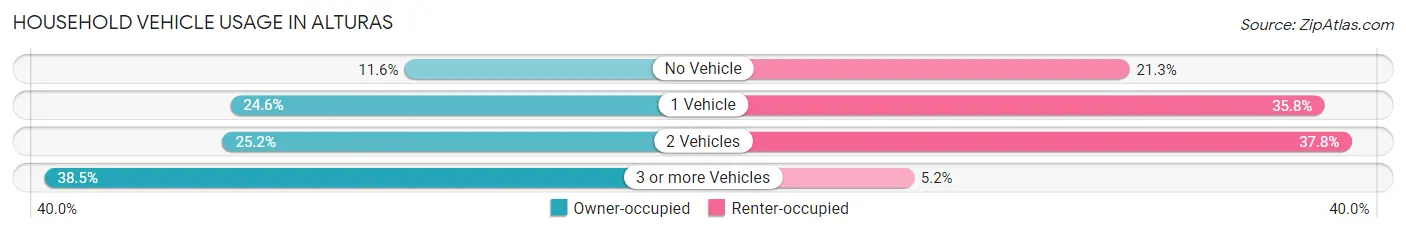
| Vehicles per Household | Owner-occupied | Renter-occupied |
| No Vehicle | 78 (11.6%) | 95 (21.2%) |
| 1 Vehicle | 165 (24.6%) | 160 (35.8%) |
| 2 Vehicles | 169 (25.2%) | 169 (37.8%) |
| 3 or more Vehicles | 258 (38.5%) | 23 (5.1%) |
| Total | 670 (100.0%) | 447 (100.0%) |
Real Estate & Mortgages in Alturas
Real Estate and Mortgage Overview in Alturas
| Characteristic | Without Mortgage | With Mortgage |
| Housing Units | 357 | 313 |
| Median Property Value | $148,000 | $125,100 |
| Median Household Income | $33,765 | $26 |
| Monthly Housing Costs | $523 | $0 |
| Real Estate Taxes | $761 | $0 |
Property Value by Mortgage Status in Alturas
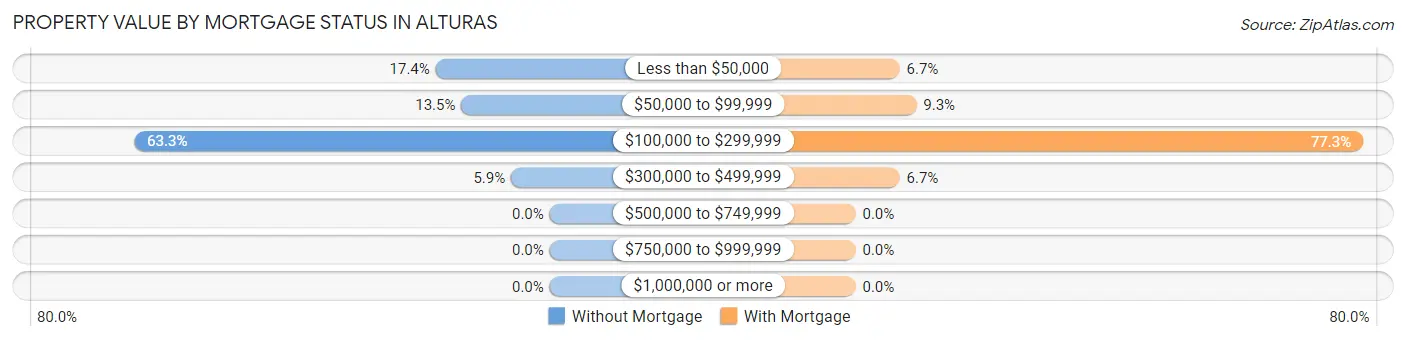
| Property Value | Without Mortgage | With Mortgage |
| Less than $50,000 | 62 (17.4%) | 21 (6.7%) |
| $50,000 to $99,999 | 48 (13.5%) | 29 (9.3%) |
| $100,000 to $299,999 | 226 (63.3%) | 242 (77.3%) |
| $300,000 to $499,999 | 21 (5.9%) | 21 (6.7%) |
| $500,000 to $749,999 | 0 (0.0%) | 0 (0.0%) |
| $750,000 to $999,999 | 0 (0.0%) | 0 (0.0%) |
| $1,000,000 or more | 0 (0.0%) | 0 (0.0%) |
| Total | 357 (100.0%) | 313 (100.0%) |
Household Income by Mortgage Status in Alturas
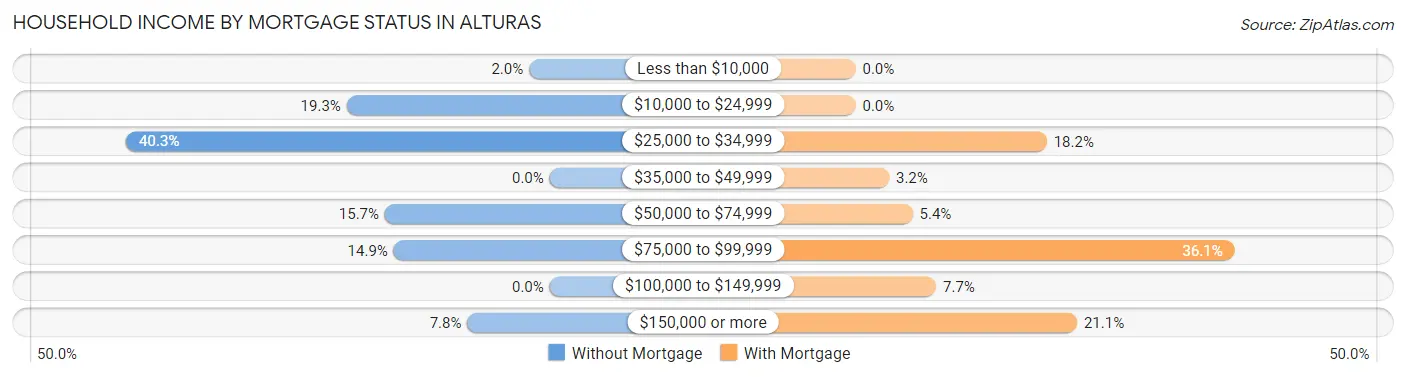
| Household Income | Without Mortgage | With Mortgage |
| Less than $10,000 | 7 (2.0%) | 0 (0.0%) |
| $10,000 to $24,999 | 69 (19.3%) | 0 (0.0%) |
| $25,000 to $34,999 | 144 (40.3%) | 57 (18.2%) |
| $35,000 to $49,999 | 0 (0.0%) | 10 (3.2%) |
| $50,000 to $74,999 | 56 (15.7%) | 17 (5.4%) |
| $75,000 to $99,999 | 53 (14.8%) | 113 (36.1%) |
| $100,000 to $149,999 | 0 (0.0%) | 24 (7.7%) |
| $150,000 or more | 28 (7.8%) | 66 (21.1%) |
| Total | 357 (100.0%) | 313 (100.0%) |
Property Value to Household Income Ratio in Alturas
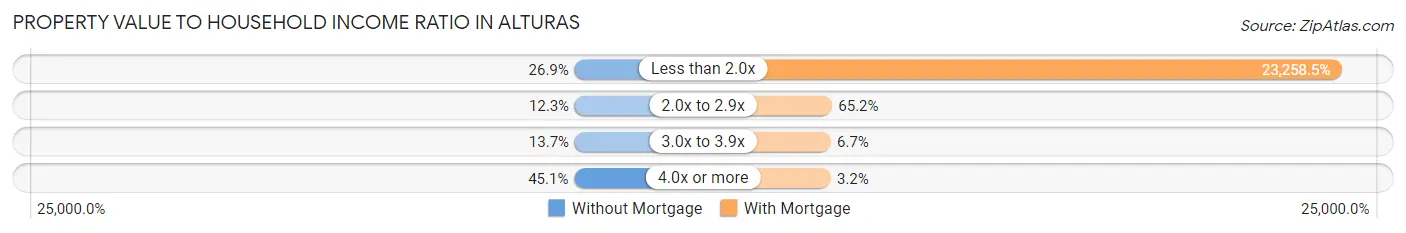
| Value-to-Income Ratio | Without Mortgage | With Mortgage |
| Less than 2.0x | 96 (26.9%) | 72,799 (23,258.5%) |
| 2.0x to 2.9x | 44 (12.3%) | 204 (65.2%) |
| 3.0x to 3.9x | 49 (13.7%) | 21 (6.7%) |
| 4.0x or more | 161 (45.1%) | 10 (3.2%) |
| Total | 357 (100.0%) | 313 (100.0%) |
Real Estate Taxes by Mortgage Status in Alturas
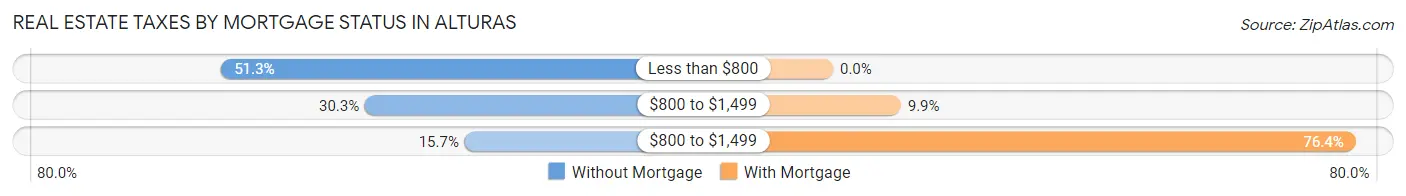
| Property Taxes | Without Mortgage | With Mortgage |
| Less than $800 | 183 (51.3%) | 0 (0.0%) |
| $800 to $1,499 | 108 (30.2%) | 31 (9.9%) |
| $800 to $1,499 | 56 (15.7%) | 239 (76.4%) |
| Total | 357 (100.0%) | 313 (100.0%) |
Health & Disability in Alturas
Health Insurance Coverage by Age in Alturas
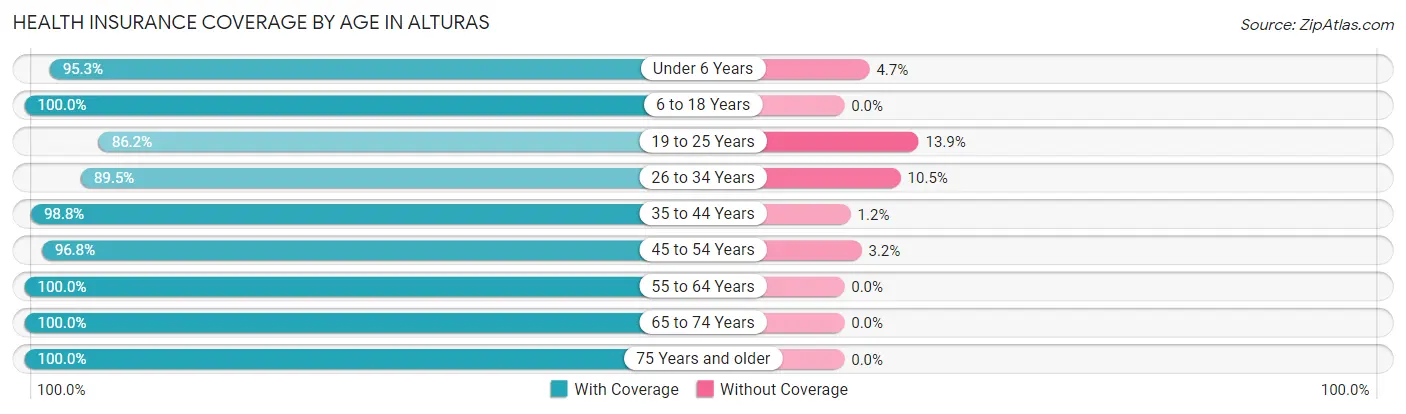
| Age Bracket | With Coverage | Without Coverage |
| Under 6 Years | 264 (95.3%) | 13 (4.7%) |
| 6 to 18 Years | 365 (100.0%) | 0 (0.0%) |
| 19 to 25 Years | 112 (86.2%) | 18 (13.9%) |
| 26 to 34 Years | 400 (89.5%) | 47 (10.5%) |
| 35 to 44 Years | 249 (98.8%) | 3 (1.2%) |
| 45 to 54 Years | 271 (96.8%) | 9 (3.2%) |
| 55 to 64 Years | 278 (100.0%) | 0 (0.0%) |
| 65 to 74 Years | 414 (100.0%) | 0 (0.0%) |
| 75 Years and older | 202 (100.0%) | 0 (0.0%) |
| Total | 2,555 (96.6%) | 90 (3.4%) |
Health Insurance Coverage by Citizenship Status in Alturas
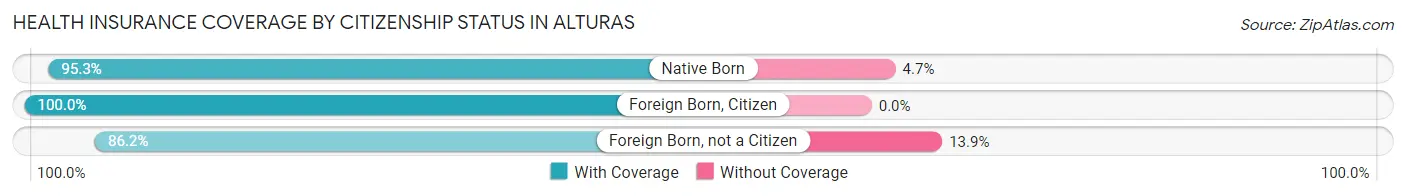
| Citizenship Status | With Coverage | Without Coverage |
| Native Born | 264 (95.3%) | 13 (4.7%) |
| Foreign Born, Citizen | 365 (100.0%) | 0 (0.0%) |
| Foreign Born, not a Citizen | 112 (86.2%) | 18 (13.9%) |
Health Insurance Coverage by Household Income in Alturas
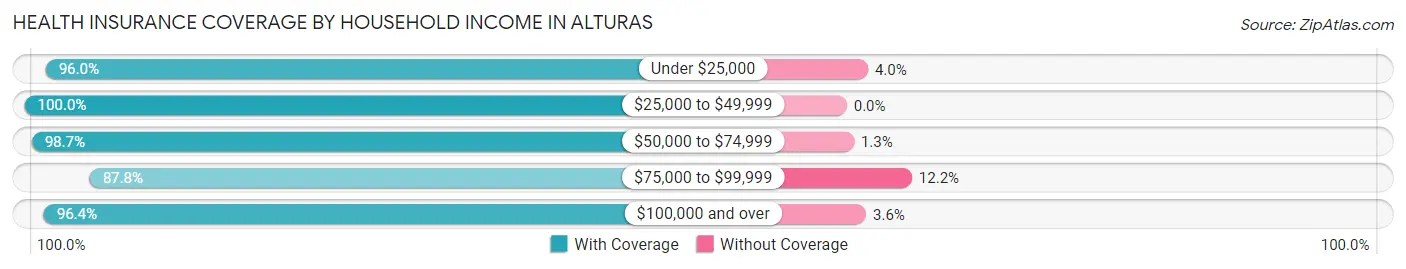
| Household Income | With Coverage | Without Coverage |
| Under $25,000 | 532 (96.0%) | 22 (4.0%) |
| $25,000 to $49,999 | 459 (100.0%) | 0 (0.0%) |
| $50,000 to $74,999 | 807 (98.7%) | 11 (1.3%) |
| $75,000 to $99,999 | 259 (87.8%) | 36 (12.2%) |
| $100,000 and over | 481 (96.4%) | 18 (3.6%) |
Public vs Private Health Insurance Coverage by Age in Alturas
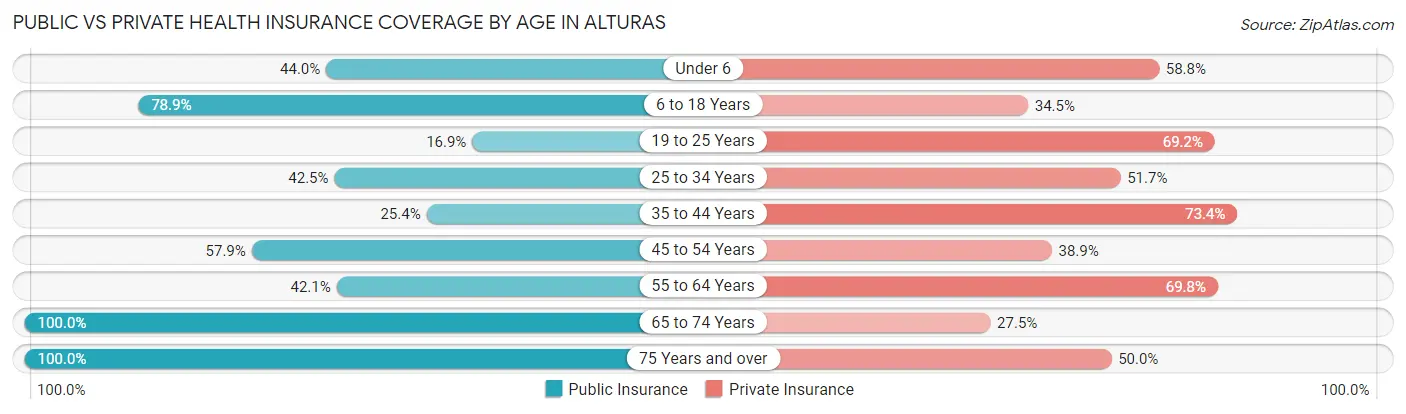
| Age Bracket | Public Insurance | Private Insurance |
| Under 6 | 122 (44.0%) | 163 (58.8%) |
| 6 to 18 Years | 288 (78.9%) | 126 (34.5%) |
| 19 to 25 Years | 22 (16.9%) | 90 (69.2%) |
| 25 to 34 Years | 190 (42.5%) | 231 (51.7%) |
| 35 to 44 Years | 64 (25.4%) | 185 (73.4%) |
| 45 to 54 Years | 162 (57.9%) | 109 (38.9%) |
| 55 to 64 Years | 117 (42.1%) | 194 (69.8%) |
| 65 to 74 Years | 414 (100.0%) | 114 (27.5%) |
| 75 Years and over | 202 (100.0%) | 101 (50.0%) |
| Total | 1,581 (59.8%) | 1,313 (49.6%) |
Disability Status by Sex by Age in Alturas
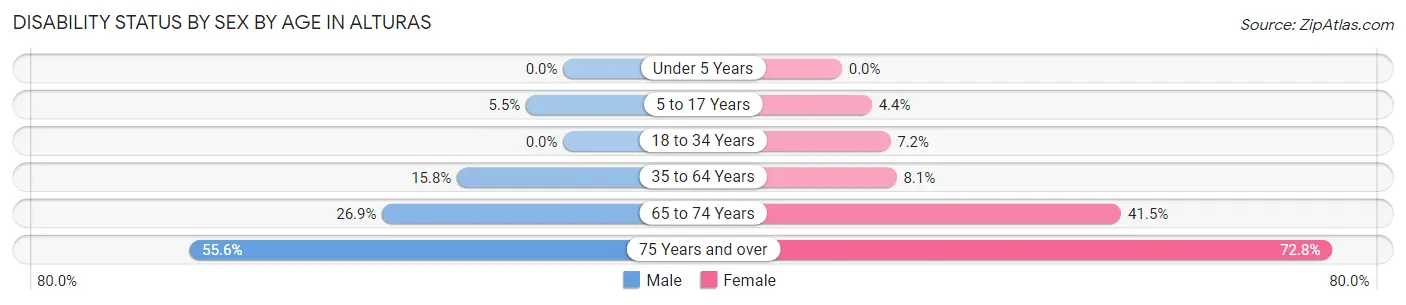
| Age Bracket | Male | Female |
| Under 5 Years | 0 (0.0%) | 0 (0.0%) |
| 5 to 17 Years | 8 (5.5%) | 11 (4.4%) |
| 18 to 34 Years | 0 (0.0%) | 26 (7.2%) |
| 35 to 64 Years | 52 (15.8%) | 39 (8.1%) |
| 65 to 74 Years | 64 (26.9%) | 73 (41.5%) |
| 75 Years and over | 55 (55.6%) | 75 (72.8%) |
Disability Class by Sex by Age in Alturas
Disability Class: Hearing Difficulty
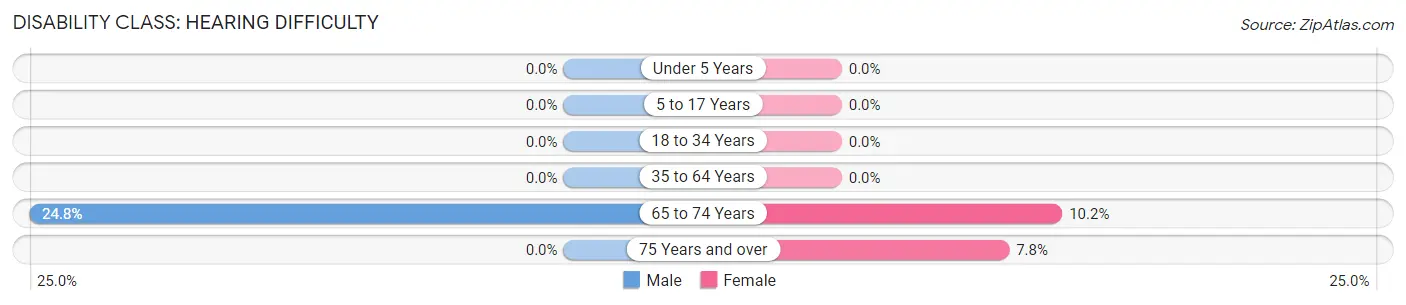
| Age Bracket | Male | Female |
| Under 5 Years | 0 (0.0%) | 0 (0.0%) |
| 5 to 17 Years | 0 (0.0%) | 0 (0.0%) |
| 18 to 34 Years | 0 (0.0%) | 0 (0.0%) |
| 35 to 64 Years | 0 (0.0%) | 0 (0.0%) |
| 65 to 74 Years | 59 (24.8%) | 18 (10.2%) |
| 75 Years and over | 0 (0.0%) | 8 (7.8%) |
Disability Class: Vision Difficulty
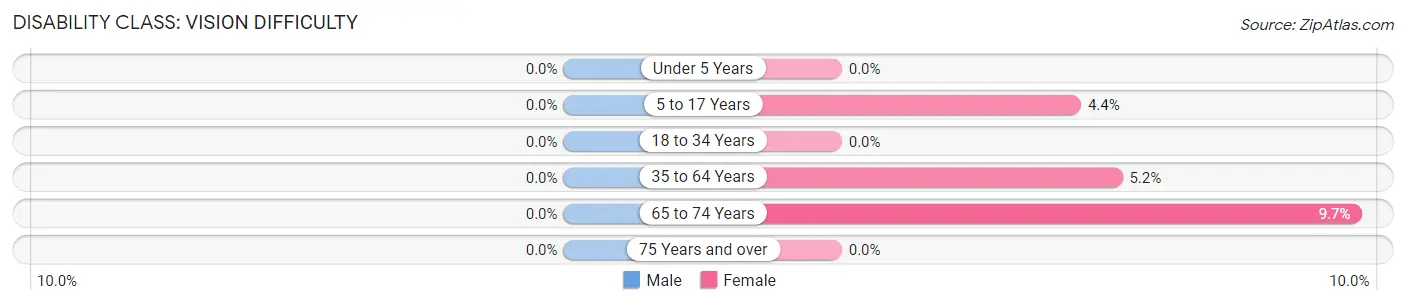
| Age Bracket | Male | Female |
| Under 5 Years | 0 (0.0%) | 0 (0.0%) |
| 5 to 17 Years | 0 (0.0%) | 11 (4.4%) |
| 18 to 34 Years | 0 (0.0%) | 0 (0.0%) |
| 35 to 64 Years | 0 (0.0%) | 25 (5.2%) |
| 65 to 74 Years | 0 (0.0%) | 17 (9.7%) |
| 75 Years and over | 0 (0.0%) | 0 (0.0%) |
Disability Class: Cognitive Difficulty
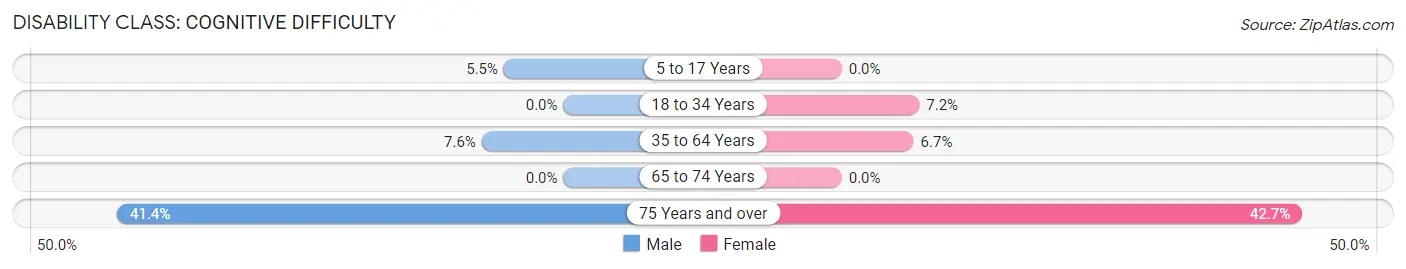
| Age Bracket | Male | Female |
| 5 to 17 Years | 8 (5.5%) | 0 (0.0%) |
| 18 to 34 Years | 0 (0.0%) | 26 (7.2%) |
| 35 to 64 Years | 25 (7.6%) | 32 (6.7%) |
| 65 to 74 Years | 0 (0.0%) | 0 (0.0%) |
| 75 Years and over | 41 (41.4%) | 44 (42.7%) |
Disability Class: Ambulatory Difficulty
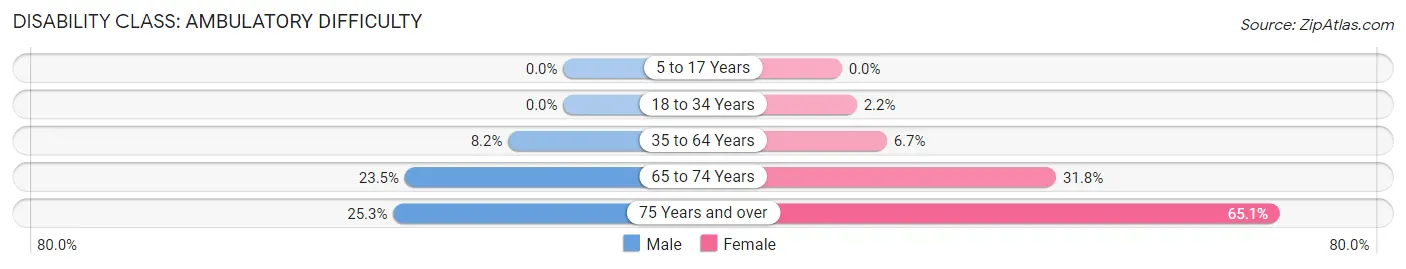
| Age Bracket | Male | Female |
| 5 to 17 Years | 0 (0.0%) | 0 (0.0%) |
| 18 to 34 Years | 0 (0.0%) | 8 (2.2%) |
| 35 to 64 Years | 27 (8.2%) | 32 (6.7%) |
| 65 to 74 Years | 56 (23.5%) | 56 (31.8%) |
| 75 Years and over | 25 (25.3%) | 67 (65.0%) |
Disability Class: Self-Care Difficulty
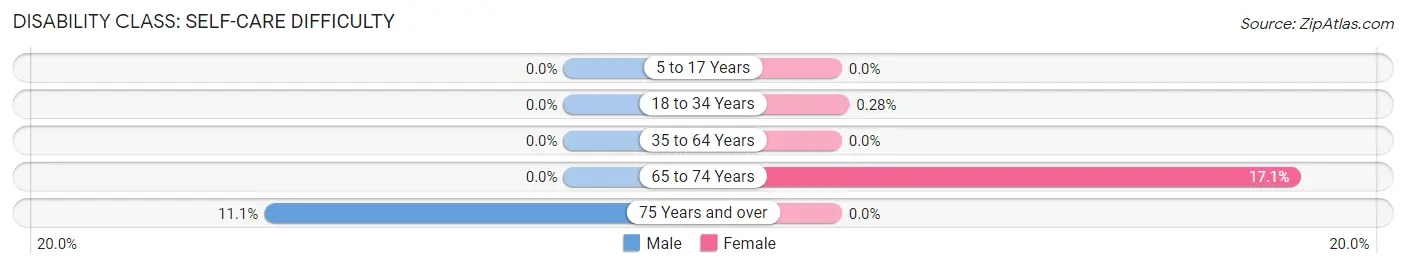
| Age Bracket | Male | Female |
| 5 to 17 Years | 0 (0.0%) | 0 (0.0%) |
| 18 to 34 Years | 0 (0.0%) | 1 (0.3%) |
| 35 to 64 Years | 0 (0.0%) | 0 (0.0%) |
| 65 to 74 Years | 0 (0.0%) | 30 (17.1%) |
| 75 Years and over | 11 (11.1%) | 0 (0.0%) |
Technology Access in Alturas
Computing Device Access in Alturas
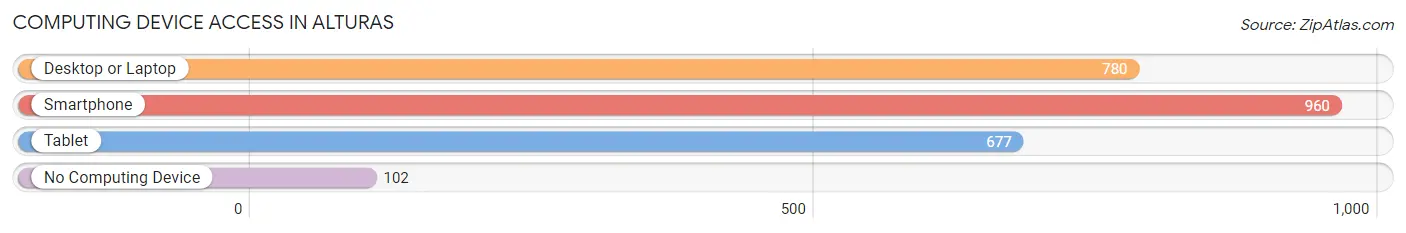
| Device Type | # Households | % Households |
| Desktop or Laptop | 780 | 69.8% |
| Smartphone | 960 | 85.9% |
| Tablet | 677 | 60.6% |
| No Computing Device | 102 | 9.1% |
| Total | 1,117 | 100.0% |
Internet Access in Alturas
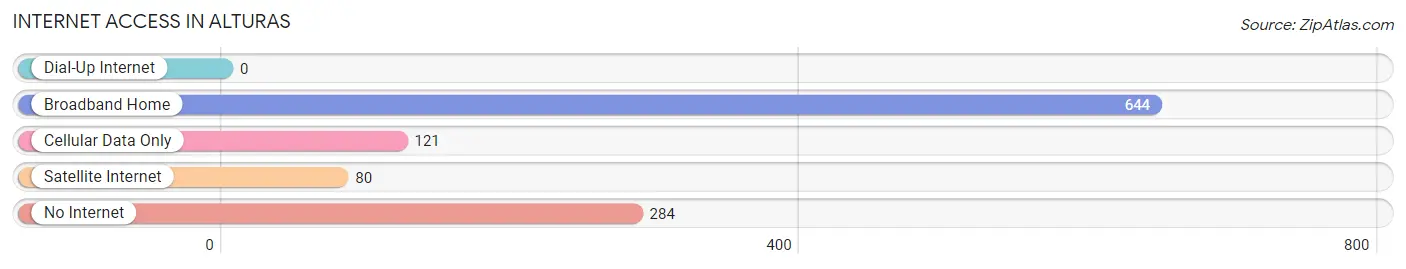
| Internet Type | # Households | % Households |
| Dial-Up Internet | 0 | 0.0% |
| Broadband Home | 644 | 57.7% |
| Cellular Data Only | 121 | 10.8% |
| Satellite Internet | 80 | 7.2% |
| No Internet | 284 | 25.4% |
| Total | 1,117 | 100.0% |
Alturas Summary
History
Alturas, California is a small city located in Modoc County in the northeastern corner of the state. It is the county seat and the only incorporated city in the county. The city was founded in 1876 and was originally known as Dorris Bridge after the first settler, William Dorris. The name was changed to Alturas, which is Spanish for “heights”, in 1877.
The area around Alturas was originally inhabited by the Pit River Tribe, a group of Native Americans who lived in the area for thousands of years. The first Europeans to settle in the area were miners who arrived in the 1850s. They were followed by ranchers and farmers who established homesteads in the area.
The city of Alturas was officially incorporated in 1876 and quickly became the center of commerce and government for the county. The city was home to a number of businesses, including a bank, a newspaper, a hotel, and a stagecoach line.
In the late 19th century, Alturas was a bustling town with a population of over 1,000 people. The city was home to a number of saloons, gambling halls, and brothels. It was also the site of a number of gunfights and other violent incidents.
In the early 20th century, the city’s population began to decline as people moved away to larger cities. The decline continued until the 1950s when the city began to experience a resurgence. The city’s population has remained relatively stable since then.
Geography
Alturas is located in the northeastern corner of California in Modoc County. The city is situated at an elevation of 4,400 feet and is surrounded by mountains and desert. The city is located at the intersection of State Route 299 and State Route 139.
The city is located in a semi-arid climate zone and experiences hot summers and cold winters. The average high temperature in the summer is 90 degrees Fahrenheit and the average low temperature in the winter is 20 degrees Fahrenheit.
The city is located near a number of natural attractions, including the Modoc National Forest, the Lava Beds National Monument, and the Surprise Valley Wildlife Refuge.
Economy
The economy of Alturas is largely based on agriculture and tourism. The city is home to a number of farms and ranches that produce a variety of crops, including alfalfa, hay, wheat, and potatoes. The city is also home to a number of tourist attractions, including the Modoc National Forest, the Lava Beds National Monument, and the Surprise Valley Wildlife Refuge.
The city is also home to a number of businesses, including restaurants, hotels, and retail stores. The city is also home to a number of government offices, including the Modoc County Courthouse and the Modoc County Sheriff’s Office.
Demographics
As of the 2010 census, the population of Alturas was 2,827. The population is largely white (90.2%) with a small Hispanic population (7.2%). The median household income is $35,938 and the median age is 41.
The city is home to a number of churches, including the First Baptist Church, the Church of Jesus Christ of Latter-day Saints, and the United Methodist Church. The city is also home to a number of schools, including the Alturas Elementary School, the Modoc High School, and the Modoc Community College.
Conclusion
Alturas, California is a small city located in Modoc County in the northeastern corner of the state. It is the county seat and the only incorporated city in the county. The city was founded in 1876 and was originally known as Dorris Bridge. The city’s economy is largely based on agriculture and tourism and the population is largely white with a small Hispanic population. The city is home to a number of churches, schools, and government offices. Alturas is a small city with a rich history and a bright future.
Common Questions
What is Per Capita Income in Alturas?
Per Capita income in Alturas is $27,071.
What is the Median Family Income in Alturas?
Median Family Income in Alturas is $56,636.
What is the Median Household income in Alturas?
Median Household Income in Alturas is $51,051.
What is Income or Wage Gap in Alturas?
Income or Wage Gap in Alturas is 48.5%.
Women in Alturas earn 51.5 cents for every dollar earned by a man.
What is Inequality or Gini Index in Alturas?
Inequality or Gini Index in Alturas is 0.46.
What is the Total Population of Alturas?
Total Population of Alturas is 2,683.
What is the Total Male Population of Alturas?
Total Male Population of Alturas is 1,199.
What is the Total Female Population of Alturas?
Total Female Population of Alturas is 1,484.
What is the Ratio of Males per 100 Females in Alturas?
There are 80.80 Males per 100 Females in Alturas.
What is the Ratio of Females per 100 Males in Alturas?
There are 123.77 Females per 100 Males in Alturas.
What is the Median Population Age in Alturas?
Median Population Age in Alturas is 41.4 Years.
What is the Average Family Size in Alturas
Average Family Size in Alturas is 3.0 People.
What is the Average Household Size in Alturas
Average Household Size in Alturas is 2.4 People.
How Large is the Labor Force in Alturas?
There are 1,123 People in the Labor Forcein in Alturas.
What is the Percentage of People in the Labor Force in Alturas?
52.7% of People are in the Labor Force in Alturas.
What is the Unemployment Rate in Alturas?
Unemployment Rate in Alturas is 10.5%.