Acton, CA Map & Demographics
Acton Map
Acton Overview
$48,536
PER CAPITA INCOME
$127,717
AVG FAMILY INCOME
$119,091
AVG HOUSEHOLD INCOME
40.2%
WAGE / INCOME GAP [ % ]
59.8¢/ $1
WAGE / INCOME GAP [ $ ]
0.41
INEQUALITY / GINI INDEX
7,286
TOTAL POPULATION
3,642
MALE POPULATION
3,644
FEMALE POPULATION
99.95
MALES / 100 FEMALES
100.05
FEMALES / 100 MALES
46.8
MEDIAN AGE
3.3
AVG FAMILY SIZE
2.9
AVG HOUSEHOLD SIZE
3,493
LABOR FORCE [ PEOPLE ]
58.3%
PERCENT IN LABOR FORCE
1.5%
UNEMPLOYMENT RATE
Acton Zip Codes
Acton Area Codes
Income in Acton
Income Overview in Acton
Per Capita Income in Acton is $48,536, while median incomes of families and households are $127,717 and $119,091 respectively.
| Characteristic | Number | Measure |
| Per Capita Income | 7,286 | $48,536 |
| Median Family Income | 1,898 | $127,717 |
| Mean Family Income | 1,898 | $151,818 |
| Median Household Income | 2,510 | $119,091 |
| Mean Household Income | 2,510 | $138,751 |
| Income Deficit | 1,898 | $0 |
| Wage / Income Gap (%) | 7,286 | 40.23% |
| Wage / Income Gap ($) | 7,286 | 59.77¢ per $1 |
| Gini / Inequality Index | 7,286 | 0.41 |
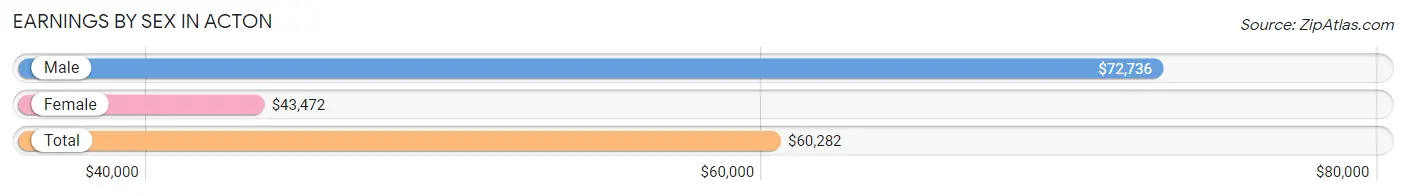
Earnings by Sex in Acton
Average Earnings in Acton are $60,282, $72,736 for men and $43,472 for women, a difference of 40.2%.
| Sex | Number | Average Earnings |
| Male | 2,105 (59.0%) | $72,736 |
| Female | 1,461 (41.0%) | $43,472 |
| Total | 3,566 (100.0%) | $60,282 |
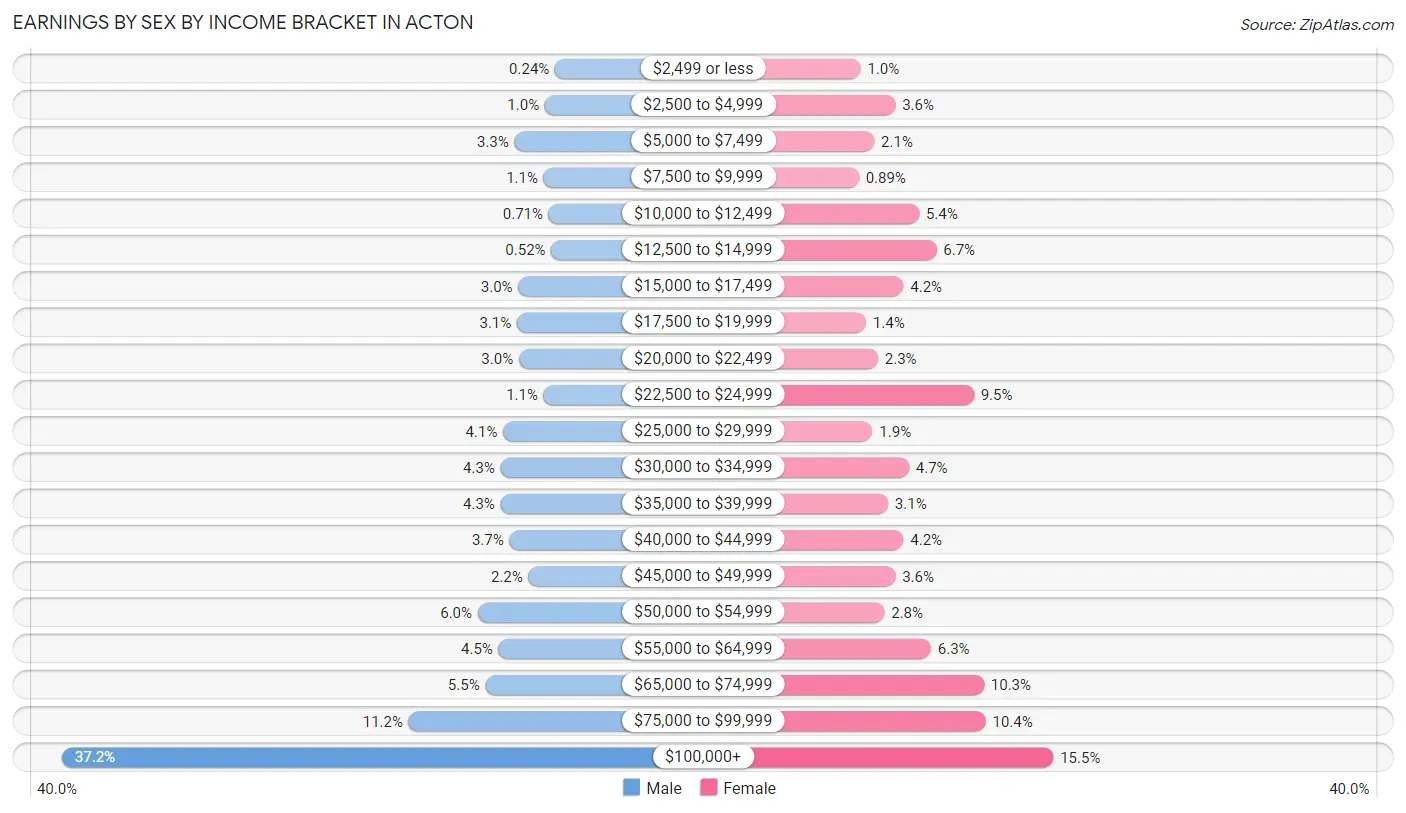
Earnings by Sex by Income Bracket in Acton
The most common earnings brackets in Acton are $100,000+ for men (783 | 37.2%) and $100,000+ for women (226 | 15.5%).
| Income | Male | Female |
| $2,499 or less | 5 (0.2%) | 15 (1.0%) |
| $2,500 to $4,999 | 21 (1.0%) | 53 (3.6%) |
| $5,000 to $7,499 | 69 (3.3%) | 30 (2.1%) |
| $7,500 to $9,999 | 23 (1.1%) | 13 (0.9%) |
| $10,000 to $12,499 | 15 (0.7%) | 79 (5.4%) |
| $12,500 to $14,999 | 11 (0.5%) | 98 (6.7%) |
| $15,000 to $17,499 | 63 (3.0%) | 62 (4.2%) |
| $17,500 to $19,999 | 65 (3.1%) | 21 (1.4%) |
| $20,000 to $22,499 | 62 (2.9%) | 34 (2.3%) |
| $22,500 to $24,999 | 23 (1.1%) | 139 (9.5%) |
| $25,000 to $29,999 | 87 (4.1%) | 28 (1.9%) |
| $30,000 to $34,999 | 91 (4.3%) | 68 (4.6%) |
| $35,000 to $39,999 | 91 (4.3%) | 45 (3.1%) |
| $40,000 to $44,999 | 77 (3.7%) | 62 (4.2%) |
| $45,000 to $49,999 | 47 (2.2%) | 53 (3.6%) |
| $50,000 to $54,999 | 127 (6.0%) | 41 (2.8%) |
| $55,000 to $64,999 | 94 (4.5%) | 92 (6.3%) |
| $65,000 to $74,999 | 115 (5.5%) | 150 (10.3%) |
| $75,000 to $99,999 | 236 (11.2%) | 152 (10.4%) |
| $100,000+ | 783 (37.2%) | 226 (15.5%) |
| Total | 2,105 (100.0%) | 1,461 (100.0%) |
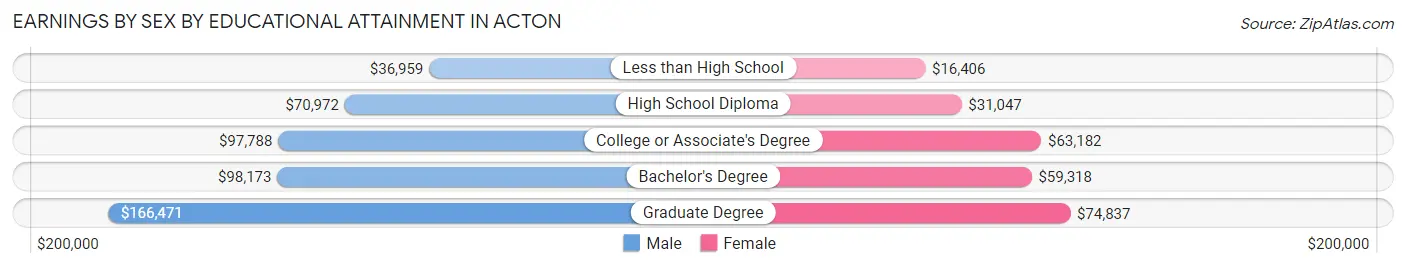
Earnings by Sex by Educational Attainment in Acton
Average earnings in Acton are $84,500 for men and $55,486 for women, a difference of 34.3%. Men with an educational attainment of graduate degree enjoy the highest average annual earnings of $166,471, while those with less than high school education earn the least with $36,959. Women with an educational attainment of graduate degree earn the most with the average annual earnings of $74,837, while those with less than high school education have the smallest earnings of $16,406.
| Educational Attainment | Male Income | Female Income |
| Less than High School | $36,959 | $16,406 |
| High School Diploma | $70,972 | $31,047 |
| College or Associate's Degree | $97,788 | $63,182 |
| Bachelor's Degree | $98,173 | $59,318 |
| Graduate Degree | $166,471 | $74,837 |
| Total | $84,500 | $55,486 |
Family Income in Acton
Family Income Brackets in Acton
According to the Acton family income data, there are 512 families falling into the $100,000 to $149,999 income range, which is the most common income bracket and makes up 27.0% of all families.
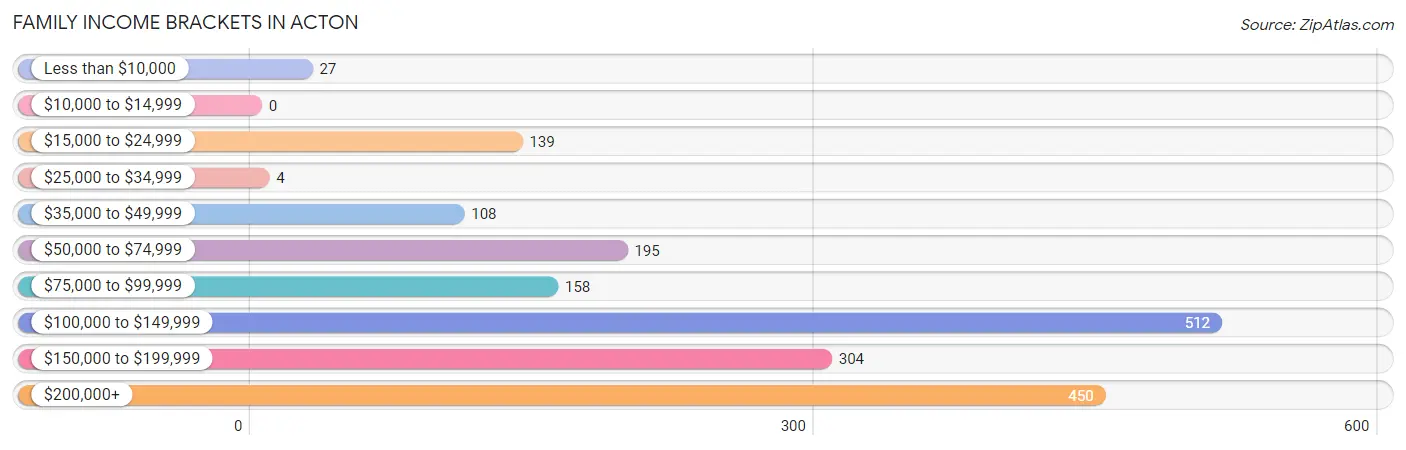
| Income Bracket | # Families | % Families |
| Less than $10,000 | 27 | 1.4% |
| $10,000 to $14,999 | 0 | 0.0% |
| $15,000 to $24,999 | 139 | 7.3% |
| $25,000 to $34,999 | 4 | 0.2% |
| $35,000 to $49,999 | 108 | 5.7% |
| $50,000 to $74,999 | 195 | 10.3% |
| $75,000 to $99,999 | 158 | 8.3% |
| $100,000 to $149,999 | 512 | 27.0% |
| $150,000 to $199,999 | 304 | 16.0% |
| $200,000+ | 450 | 23.7% |
Family Income by Famaliy Size in Acton
6-person families (85 | 4.5%) account for the highest median family income in Acton with $208,750 per family, while 2-person families (844 | 44.5%) have the highest median income of $71,111 per family member.
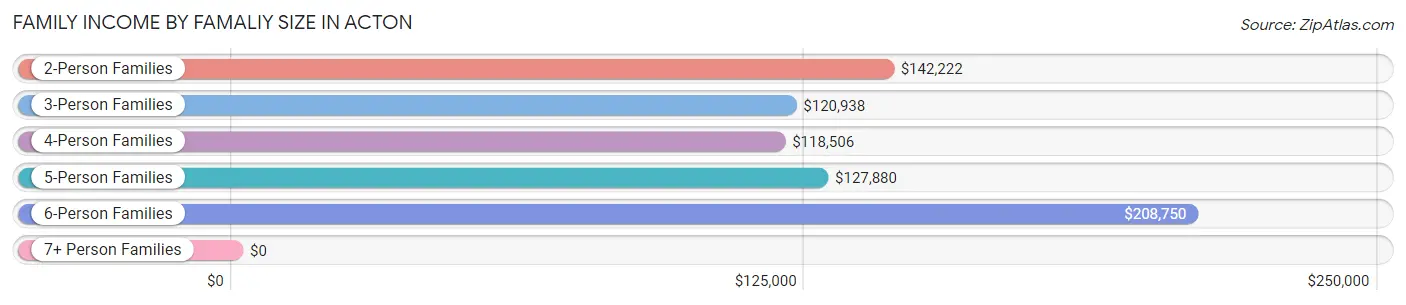
| Income Bracket | # Families | Median Income |
| 2-Person Families | 844 (44.5%) | $142,222 |
| 3-Person Families | 396 (20.9%) | $120,938 |
| 4-Person Families | 324 (17.1%) | $118,506 |
| 5-Person Families | 199 (10.5%) | $127,880 |
| 6-Person Families | 85 (4.5%) | $208,750 |
| 7+ Person Families | 50 (2.6%) | $0 |
| Total | 1,898 (100.0%) | $127,717 |
Family Income by Number of Earners in Acton
The median family income in Acton is $127,717, with families comprising 3+ earners (212) having the highest median family income of $209,054, while families with no earners (317) have the lowest median family income of $51,146, accounting for 11.2% and 16.7% of families, respectively.
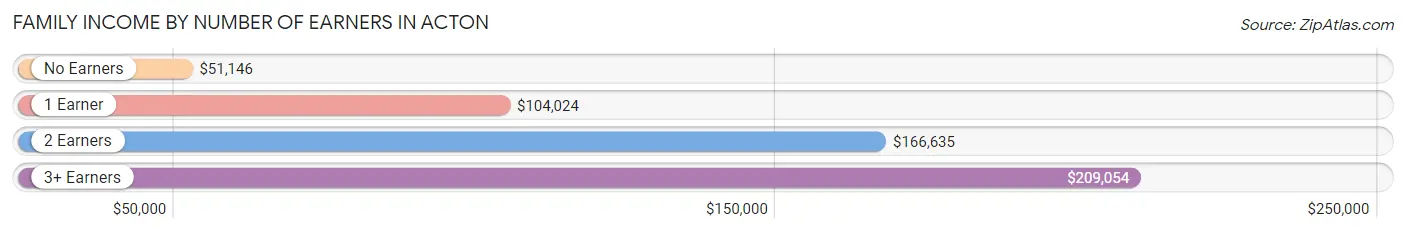
| Number of Earners | # Families | Median Income |
| No Earners | 317 (16.7%) | $51,146 |
| 1 Earner | 652 (34.4%) | $104,024 |
| 2 Earners | 717 (37.8%) | $166,635 |
| 3+ Earners | 212 (11.2%) | $209,054 |
| Total | 1,898 (100.0%) | $127,717 |
Household Income in Acton
Household Income Brackets in Acton
With 630 households falling in the category, the $100,000 to $149,999 income range is the most frequent in Acton, accounting for 25.1% of all households. In contrast, only 63 households (2.5%) fall into the less than $10,000 income bracket, making it the least populous group.
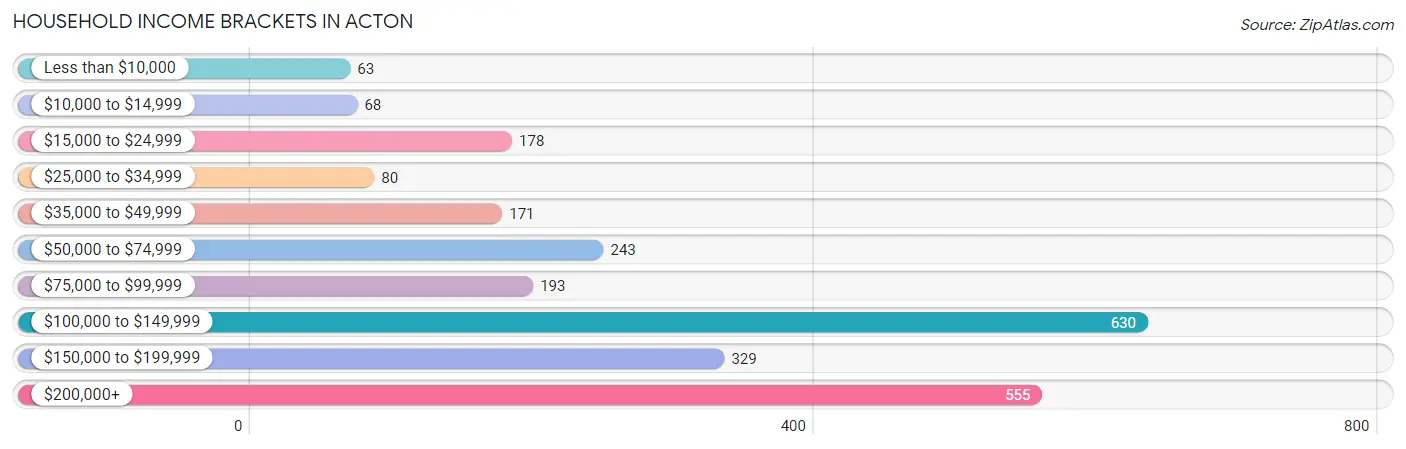
| Income Bracket | # Households | % Households |
| Less than $10,000 | 63 | 2.5% |
| $10,000 to $14,999 | 68 | 2.7% |
| $15,000 to $24,999 | 178 | 7.1% |
| $25,000 to $34,999 | 80 | 3.2% |
| $35,000 to $49,999 | 171 | 6.8% |
| $50,000 to $74,999 | 243 | 9.7% |
| $75,000 to $99,999 | 193 | 7.7% |
| $100,000 to $149,999 | 630 | 25.1% |
| $150,000 to $199,999 | 329 | 13.1% |
| $200,000+ | 555 | 22.1% |
Household Income by Householder Age in Acton
The median household income in Acton is $119,091, with the highest median household income of $143,401 found in the 45 to 64 years age bracket for the primary householder. A total of 1,277 households (50.9%) fall into this category. Meanwhile, the 15 to 24 years age bracket for the primary householder has the lowest median household income of $0, with 14 households (0.6%) in this group.
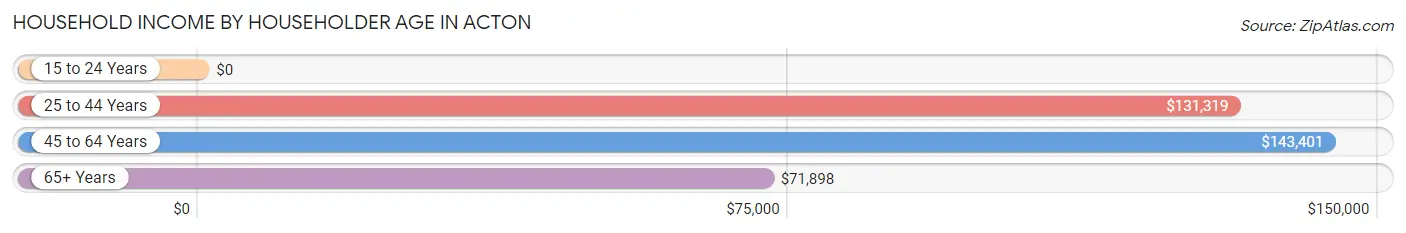
| Income Bracket | # Households | Median Income |
| 15 to 24 Years | 14 (0.6%) | $0 |
| 25 to 44 Years | 360 (14.3%) | $131,319 |
| 45 to 64 Years | 1,277 (50.9%) | $143,401 |
| 65+ Years | 859 (34.2%) | $71,898 |
| Total | 2,510 (100.0%) | $119,091 |
Poverty in Acton
Income Below Poverty by Sex and Age in Acton
With 10.1% poverty level for males and 10.4% for females among the residents of Acton, 12 to 14 year old males and 12 to 14 year old females are the most vulnerable to poverty, with 35 males (20.3%) and 42 females (51.2%) in their respective age groups living below the poverty level.
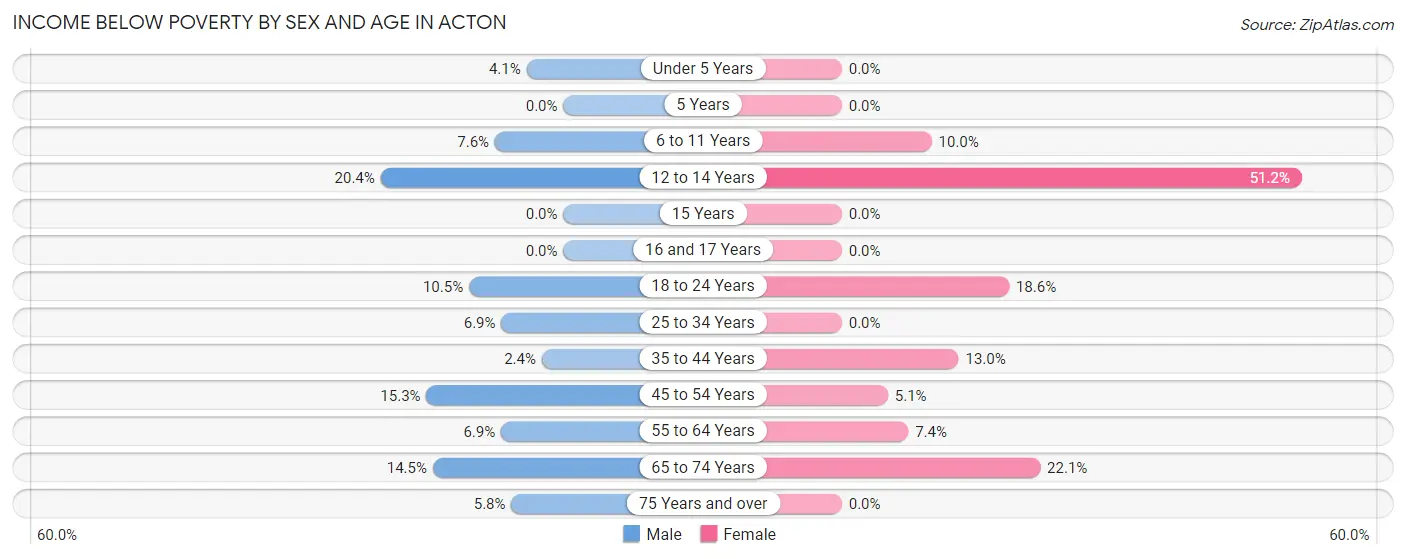
| Age Bracket | Male | Female |
| Under 5 Years | 8 (4.1%) | 0 (0.0%) |
| 5 Years | 0 (0.0%) | 0 (0.0%) |
| 6 to 11 Years | 8 (7.6%) | 34 (10.0%) |
| 12 to 14 Years | 35 (20.3%) | 42 (51.2%) |
| 15 Years | 0 (0.0%) | 0 (0.0%) |
| 16 and 17 Years | 0 (0.0%) | 0 (0.0%) |
| 18 to 24 Years | 29 (10.5%) | 78 (18.6%) |
| 25 to 34 Years | 20 (6.9%) | 0 (0.0%) |
| 35 to 44 Years | 7 (2.4%) | 59 (13.0%) |
| 45 to 54 Years | 86 (15.2%) | 23 (5.1%) |
| 55 to 64 Years | 51 (6.9%) | 51 (7.4%) |
| 65 to 74 Years | 108 (14.5%) | 91 (22.1%) |
| 75 Years and over | 7 (5.8%) | 0 (0.0%) |
| Total | 359 (10.1%) | 378 (10.4%) |
Income Above Poverty by Sex and Age in Acton
According to the poverty statistics in Acton, males aged 15 years and females aged under 5 years are the age groups that are most secure financially, with 100.0% of males and 100.0% of females in these age groups living above the poverty line.
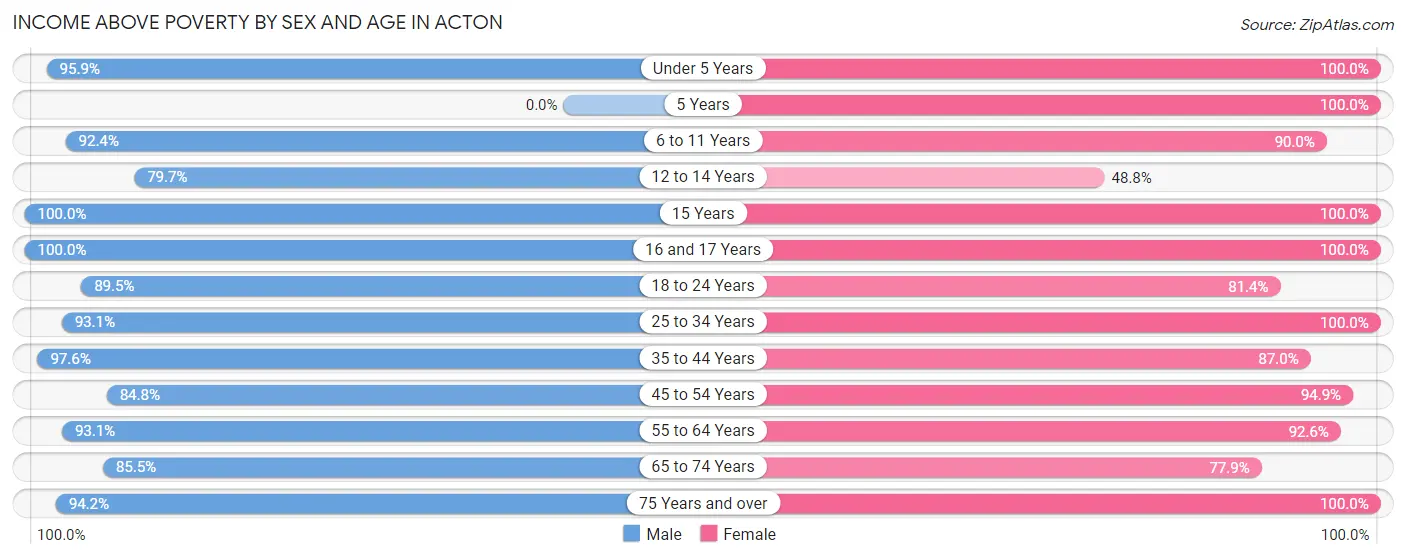
| Age Bracket | Male | Female |
| Under 5 Years | 187 (95.9%) | 149 (100.0%) |
| 5 Years | 0 (0.0%) | 57 (100.0%) |
| 6 to 11 Years | 97 (92.4%) | 306 (90.0%) |
| 12 to 14 Years | 137 (79.6%) | 40 (48.8%) |
| 15 Years | 61 (100.0%) | 55 (100.0%) |
| 16 and 17 Years | 9 (100.0%) | 73 (100.0%) |
| 18 to 24 Years | 247 (89.5%) | 341 (81.4%) |
| 25 to 34 Years | 270 (93.1%) | 308 (100.0%) |
| 35 to 44 Years | 285 (97.6%) | 395 (87.0%) |
| 45 to 54 Years | 478 (84.8%) | 425 (94.9%) |
| 55 to 64 Years | 684 (93.1%) | 638 (92.6%) |
| 65 to 74 Years | 635 (85.5%) | 321 (77.9%) |
| 75 Years and over | 114 (94.2%) | 155 (100.0%) |
| Total | 3,204 (89.9%) | 3,263 (89.6%) |
Income Below Poverty Among Married-Couple Families in Acton
The poverty statistics for married-couple families in Acton show that 8.0% or 125 of the total 1,570 families live below the poverty line. Families with no children have the highest poverty rate of 11.1%, comprising of 118 families. On the other hand, families with 1 or 2 children have the lowest poverty rate of 0.0%, which includes 0 families.
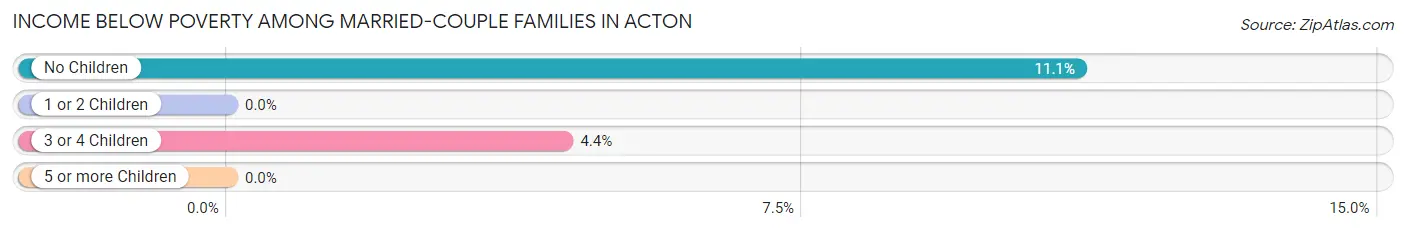
| Children | Above Poverty | Below Poverty |
| No Children | 947 (88.9%) | 118 (11.1%) |
| 1 or 2 Children | 331 (100.0%) | 0 (0.0%) |
| 3 or 4 Children | 153 (95.6%) | 7 (4.4%) |
| 5 or more Children | 14 (100.0%) | 0 (0.0%) |
| Total | 1,445 (92.0%) | 125 (8.0%) |
Income Below Poverty Among Single-Parent Households in Acton
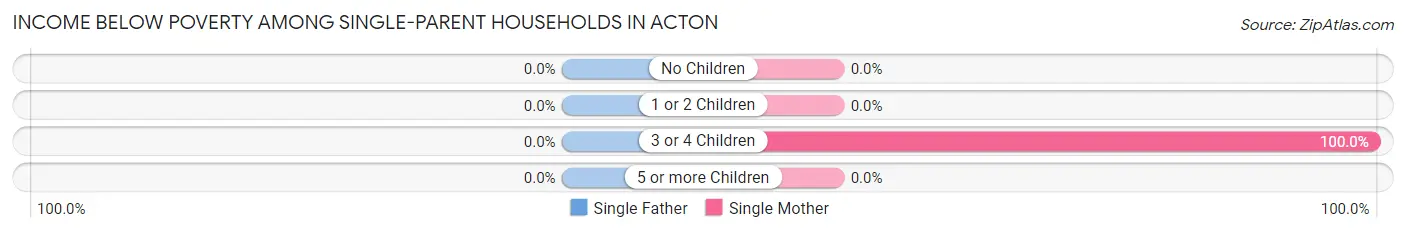
| Children | Single Father | Single Mother |
| No Children | 0 (0.0%) | 0 (0.0%) |
| 1 or 2 Children | 0 (0.0%) | 0 (0.0%) |
| 3 or 4 Children | 0 (0.0%) | 30 (100.0%) |
| 5 or more Children | 0 (0.0%) | 0 (0.0%) |
| Total | 0 (0.0%) | 30 (13.4%) |
Income Below Poverty Among Married-Couple vs Single-Parent Households in Acton
The poverty data for Acton shows that 125 of the married-couple family households (8.0%) and 30 of the single-parent households (9.1%) are living below the poverty level. Within the married-couple family households, those with no children have the highest poverty rate, with 118 households (11.1%) falling below the poverty line. Among the single-parent households, those with 3 or 4 children have the highest poverty rate, with 30 household (100.0%) living below poverty.
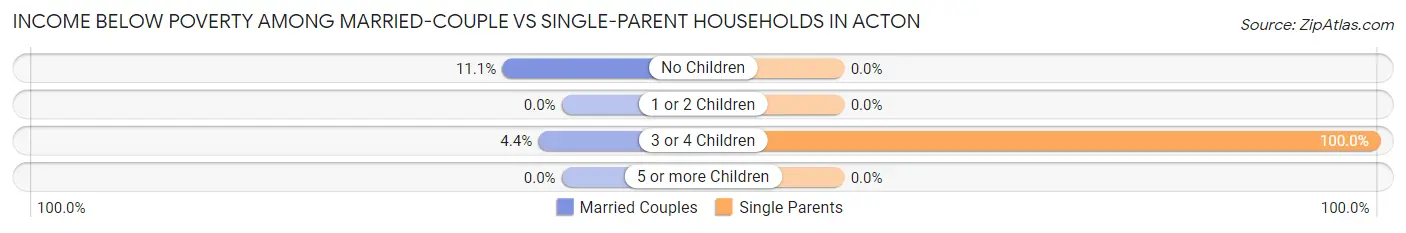
| Children | Married-Couple Families | Single-Parent Households |
| No Children | 118 (11.1%) | 0 (0.0%) |
| 1 or 2 Children | 0 (0.0%) | 0 (0.0%) |
| 3 or 4 Children | 7 (4.4%) | 30 (100.0%) |
| 5 or more Children | 0 (0.0%) | 0 (0.0%) |
| Total | 125 (8.0%) | 30 (9.1%) |
Race in Acton
The most populous races in Acton are White / Caucasian (5,383 | 73.9%), Hispanic or Latino (2,267 | 31.1%), and Some other Race (1,017 | 14.0%).
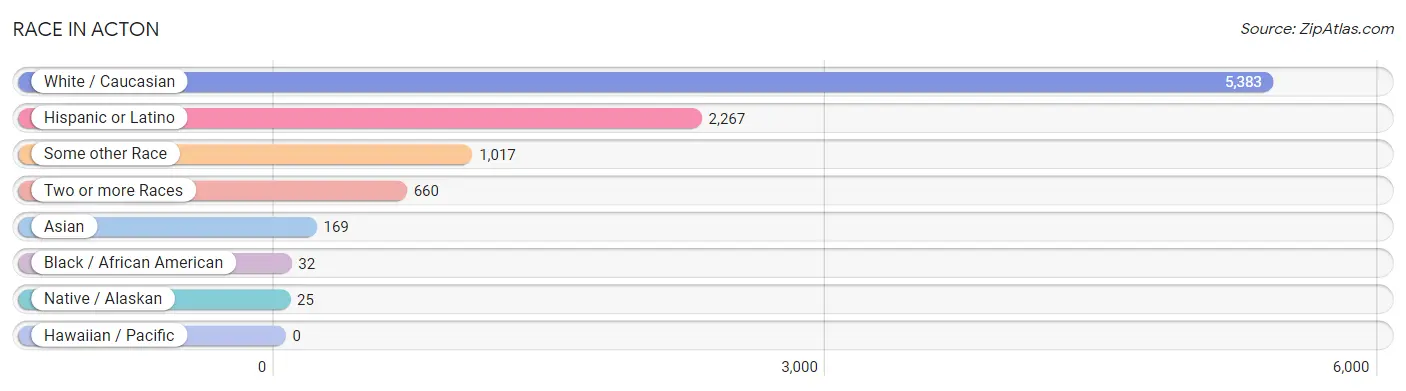
| Race | # Population | % Population |
| Asian | 169 | 2.3% |
| Black / African American | 32 | 0.4% |
| Hawaiian / Pacific | 0 | 0.0% |
| Hispanic or Latino | 2,267 | 31.1% |
| Native / Alaskan | 25 | 0.3% |
| White / Caucasian | 5,383 | 73.9% |
| Two or more Races | 660 | 9.1% |
| Some other Race | 1,017 | 14.0% |
| Total | 7,286 | 100.0% |
Ancestry in Acton
The most populous ancestries reported in Acton are Mexican (1,978 | 27.2%), German (912 | 12.5%), English (676 | 9.3%), Italian (348 | 4.8%), and Irish (335 | 4.6%), together accounting for 58.3% of all Acton residents.
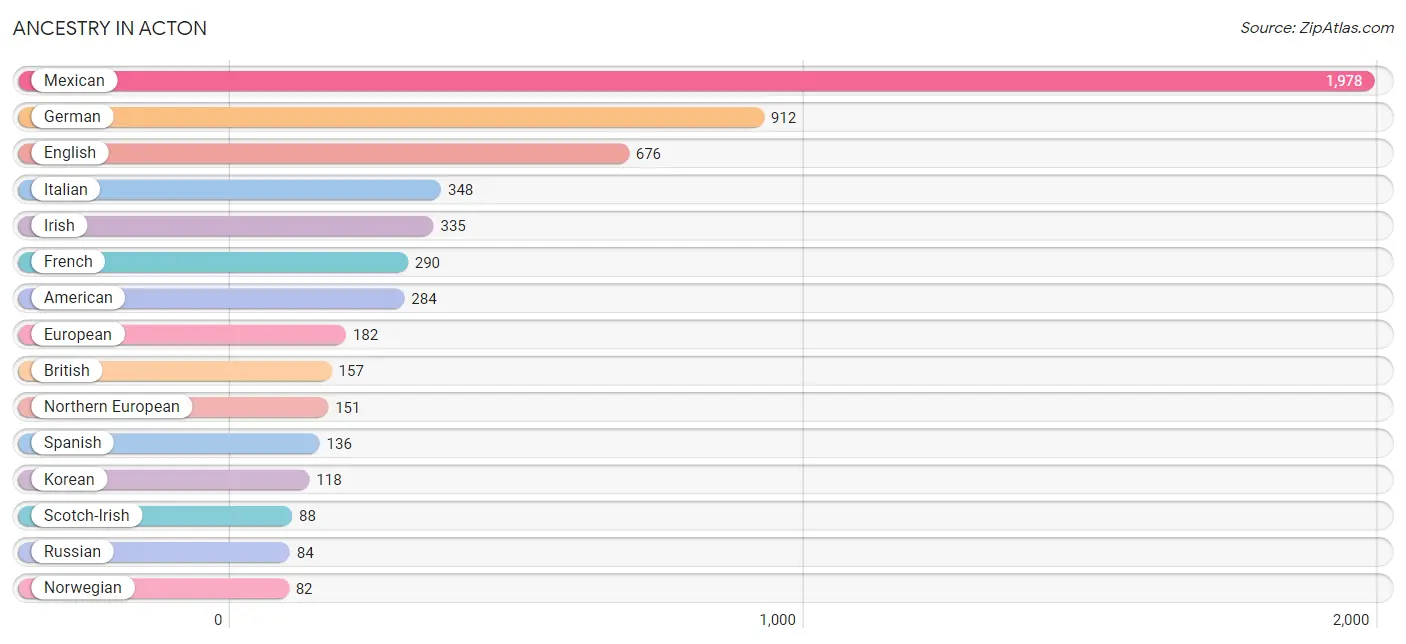
| Ancestry | # Population | % Population |
| American | 284 | 3.9% |
| Armenian | 21 | 0.3% |
| Austrian | 16 | 0.2% |
| Belizean | 1 | 0.0% |
| Bhutanese | 44 | 0.6% |
| British | 157 | 2.1% |
| Burmese | 22 | 0.3% |
| Central American | 37 | 0.5% |
| Cherokee | 6 | 0.1% |
| Cheyenne | 44 | 0.6% |
| Chilean | 17 | 0.2% |
| Choctaw | 44 | 0.6% |
| Costa Rican | 9 | 0.1% |
| Cuban | 27 | 0.4% |
| Czechoslovakian | 10 | 0.1% |
| Danish | 39 | 0.5% |
| Dutch | 35 | 0.5% |
| Eastern European | 4 | 0.1% |
| Ecuadorian | 2 | 0.0% |
| English | 676 | 9.3% |
| European | 182 | 2.5% |
| French | 290 | 4.0% |
| German | 912 | 12.5% |
| Greek | 23 | 0.3% |
| Guatemalan | 8 | 0.1% |
| Hungarian | 35 | 0.5% |
| Indian (Asian) | 53 | 0.7% |
| Irish | 335 | 4.6% |
| Italian | 348 | 4.8% |
| Korean | 118 | 1.6% |
| Mexican | 1,978 | 27.2% |
| Navajo | 28 | 0.4% |
| Northern European | 151 | 2.1% |
| Norwegian | 82 | 1.1% |
| Polish | 82 | 1.1% |
| Portuguese | 50 | 0.7% |
| Puerto Rican | 20 | 0.3% |
| Russian | 84 | 1.1% |
| Salvadoran | 20 | 0.3% |
| Scandinavian | 27 | 0.4% |
| Scotch-Irish | 88 | 1.2% |
| Scottish | 44 | 0.6% |
| South American | 19 | 0.3% |
| Spaniard | 13 | 0.2% |
| Spanish | 136 | 1.9% |
| Spanish American | 37 | 0.5% |
| Swedish | 58 | 0.8% |
| Swiss | 5 | 0.1% |
| Thai | 10 | 0.1% |
| Welsh | 18 | 0.3% | View All 50 Rows |
Immigrants in Acton
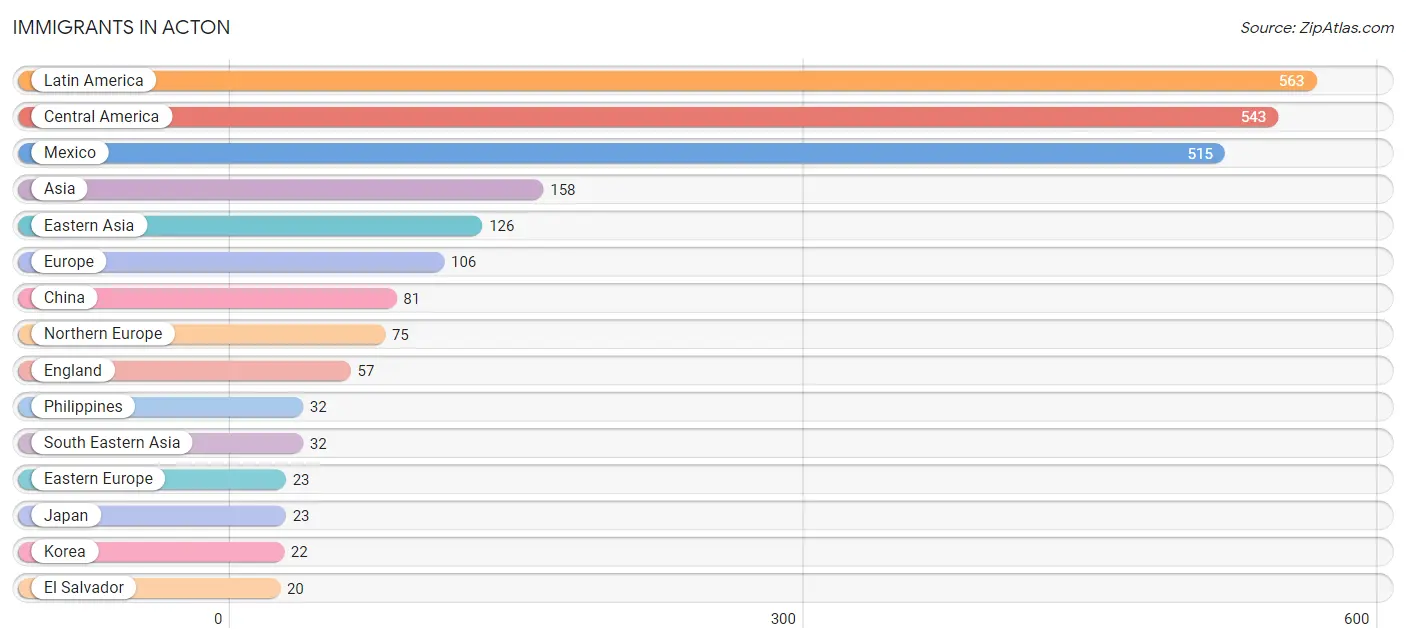
The most numerous immigrant groups reported in Acton came from Latin America (563 | 7.7%), Central America (543 | 7.4%), Mexico (515 | 7.1%), Asia (158 | 2.2%), and Eastern Asia (126 | 1.7%), together accounting for 26.1% of all Acton residents.
| Immigration Origin | # Population | % Population |
| Asia | 158 | 2.2% |
| Canada | 17 | 0.2% |
| Caribbean | 18 | 0.3% |
| Central America | 543 | 7.4% |
| China | 81 | 1.1% |
| Cuba | 18 | 0.3% |
| Denmark | 5 | 0.1% |
| Eastern Asia | 126 | 1.7% |
| Eastern Europe | 23 | 0.3% |
| Ecuador | 2 | 0.0% |
| El Salvador | 20 | 0.3% |
| England | 57 | 0.8% |
| Europe | 106 | 1.5% |
| Germany | 8 | 0.1% |
| Guatemala | 8 | 0.1% |
| Hong Kong | 10 | 0.1% |
| Hungary | 8 | 0.1% |
| Japan | 23 | 0.3% |
| Korea | 22 | 0.3% |
| Latin America | 563 | 7.7% |
| Mexico | 515 | 7.1% |
| Northern Europe | 75 | 1.0% |
| Philippines | 32 | 0.4% |
| Russia | 15 | 0.2% |
| South America | 2 | 0.0% |
| South Eastern Asia | 32 | 0.4% |
| Western Europe | 8 | 0.1% | View All 27 Rows |
Sex and Age in Acton
Sex and Age in Acton
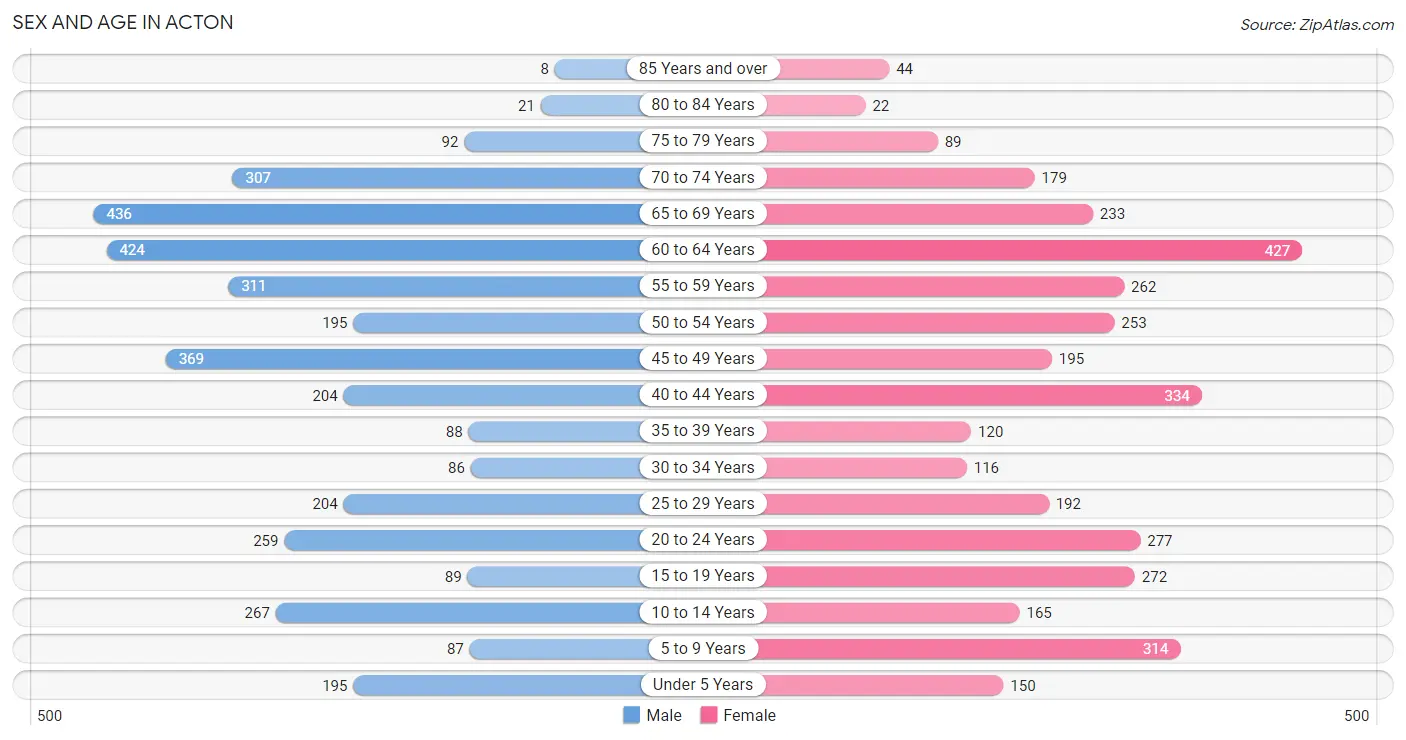
The most populous age groups in Acton are 65 to 69 Years (436 | 12.0%) for men and 60 to 64 Years (427 | 11.7%) for women.
| Age Bracket | Male | Female |
| Under 5 Years | 195 (5.3%) | 150 (4.1%) |
| 5 to 9 Years | 87 (2.4%) | 314 (8.6%) |
| 10 to 14 Years | 267 (7.3%) | 165 (4.5%) |
| 15 to 19 Years | 89 (2.4%) | 272 (7.5%) |
| 20 to 24 Years | 259 (7.1%) | 277 (7.6%) |
| 25 to 29 Years | 204 (5.6%) | 192 (5.3%) |
| 30 to 34 Years | 86 (2.4%) | 116 (3.2%) |
| 35 to 39 Years | 88 (2.4%) | 120 (3.3%) |
| 40 to 44 Years | 204 (5.6%) | 334 (9.2%) |
| 45 to 49 Years | 369 (10.1%) | 195 (5.3%) |
| 50 to 54 Years | 195 (5.3%) | 253 (6.9%) |
| 55 to 59 Years | 311 (8.5%) | 262 (7.2%) |
| 60 to 64 Years | 424 (11.6%) | 427 (11.7%) |
| 65 to 69 Years | 436 (12.0%) | 233 (6.4%) |
| 70 to 74 Years | 307 (8.4%) | 179 (4.9%) |
| 75 to 79 Years | 92 (2.5%) | 89 (2.4%) |
| 80 to 84 Years | 21 (0.6%) | 22 (0.6%) |
| 85 Years and over | 8 (0.2%) | 44 (1.2%) |
| Total | 3,642 (100.0%) | 3,644 (100.0%) |
Families and Households in Acton
Median Family Size in Acton
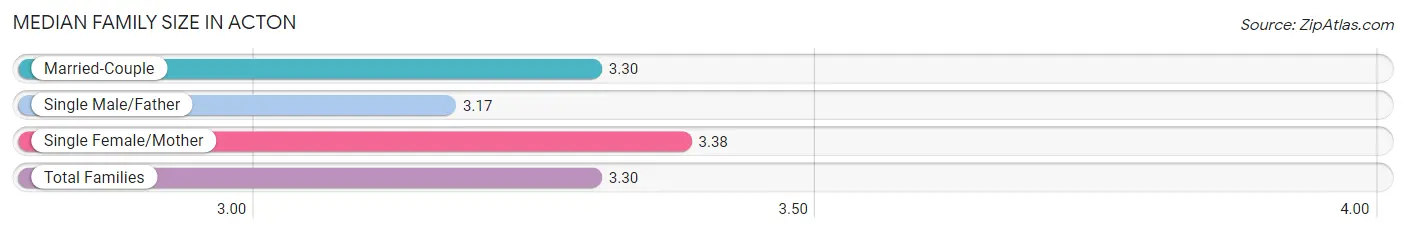
The median family size in Acton is 3.30 persons per family, with single female/mother families (224 | 11.8%) accounting for the largest median family size of 3.38 persons per family. On the other hand, single male/father families (104 | 5.5%) represent the smallest median family size with 3.17 persons per family.
| Family Type | # Families | Family Size |
| Married-Couple | 1,570 (82.7%) | 3.30 |
| Single Male/Father | 104 (5.5%) | 3.17 |
| Single Female/Mother | 224 (11.8%) | 3.38 |
| Total Families | 1,898 (100.0%) | 3.30 |
Median Household Size in Acton
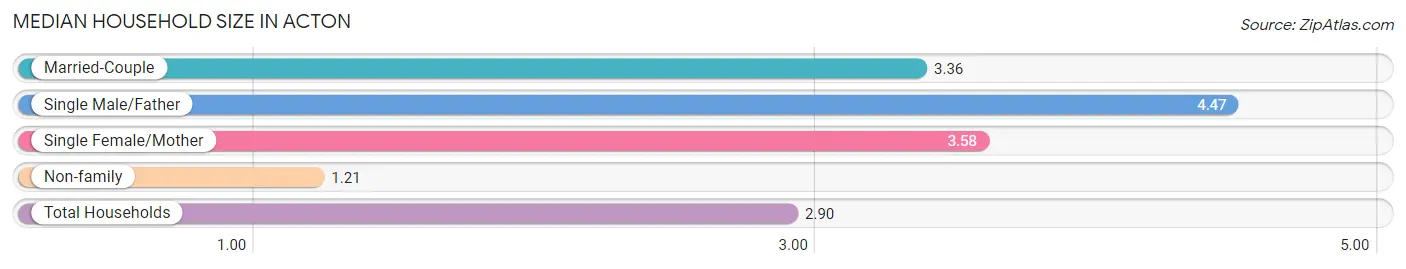
The median household size in Acton is 2.90 persons per household, with single male/father households (104 | 4.1%) accounting for the largest median household size of 4.47 persons per household. non-family households (612 | 24.4%) represent the smallest median household size with 1.21 persons per household.
| Household Type | # Households | Household Size |
| Married-Couple | 1,570 (62.5%) | 3.36 |
| Single Male/Father | 104 (4.1%) | 4.47 |
| Single Female/Mother | 224 (8.9%) | 3.58 |
| Non-family | 612 (24.4%) | 1.21 |
| Total Households | 2,510 (100.0%) | 2.90 |
Household Size by Marriage Status in Acton
Out of a total of 2,510 households in Acton, 1,898 (75.6%) are family households, while 612 (24.4%) are nonfamily households. The most numerous type of family households are 2-person households, comprising 822, and the most common type of nonfamily households are 1-person households, comprising 518.
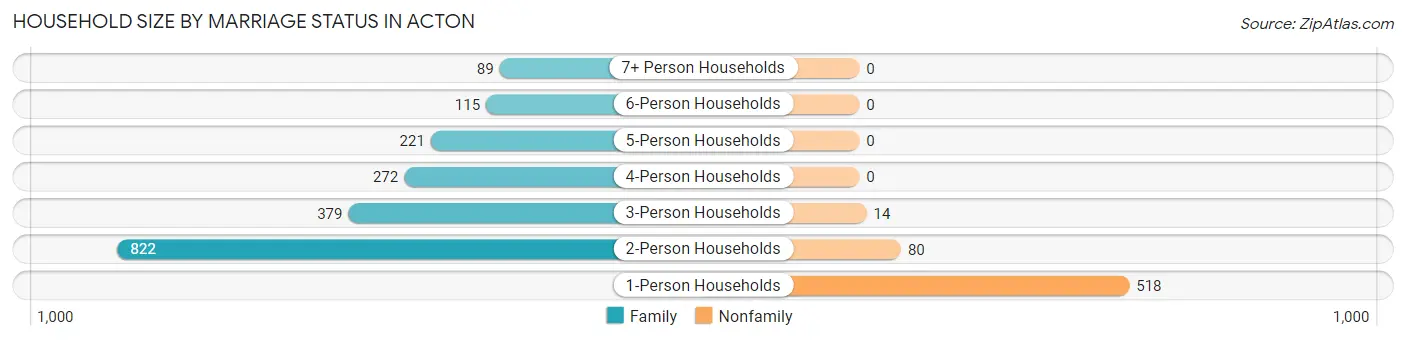
| Household Size | Family Households | Nonfamily Households |
| 1-Person Households | - | 518 (20.6%) |
| 2-Person Households | 822 (32.8%) | 80 (3.2%) |
| 3-Person Households | 379 (15.1%) | 14 (0.6%) |
| 4-Person Households | 272 (10.8%) | 0 (0.0%) |
| 5-Person Households | 221 (8.8%) | 0 (0.0%) |
| 6-Person Households | 115 (4.6%) | 0 (0.0%) |
| 7+ Person Households | 89 (3.5%) | 0 (0.0%) |
| Total | 1,898 (75.6%) | 612 (24.4%) |
Female Fertility in Acton
Fertility by Age in Acton
Average fertility rate in Acton is 84.0 births per 1,000 women. Women in the age bracket of 20 to 34 years have the highest fertility rate with 140.0 births per 1,000 women. Women in the age bracket of 20 to 34 years acount for 63.1% of all women with births.
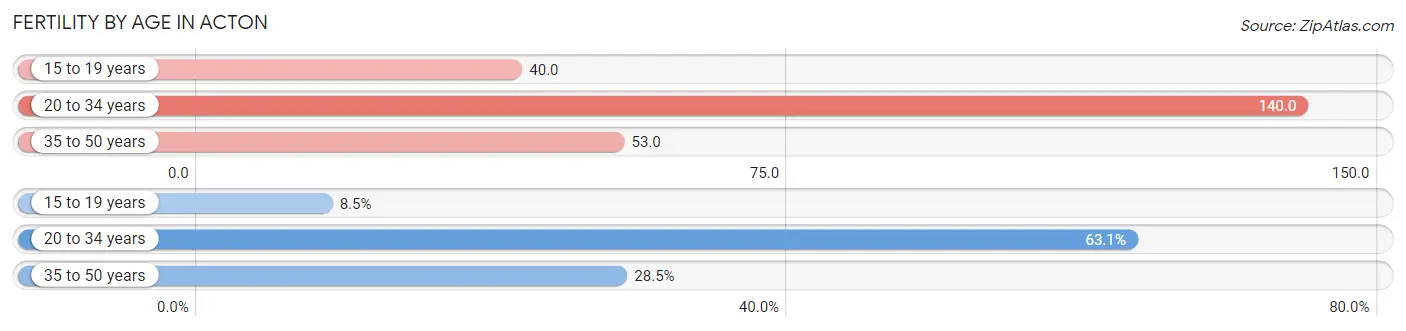
| Age Bracket | Women with Births | Births / 1,000 Women |
| 15 to 19 years | 11 (8.5%) | 40.0 |
| 20 to 34 years | 82 (63.1%) | 140.0 |
| 35 to 50 years | 37 (28.5%) | 53.0 |
| Total | 130 (100.0%) | 84.0 |
Fertility by Age by Marriage Status in Acton
72.3% of women with births (130) in Acton are married. The highest percentage of unmarried women with births falls into 15 to 19 years age bracket with 100.0% of them unmarried at the time of birth, while the lowest percentage of unmarried women with births belong to 35 to 50 years age bracket with 0.0% of them unmarried.
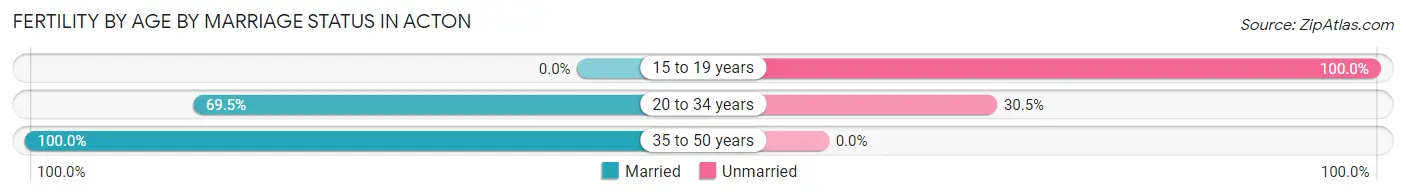
| Age Bracket | Married | Unmarried |
| 15 to 19 years | 0 (0.0%) | 11 (100.0%) |
| 20 to 34 years | 57 (69.5%) | 25 (30.5%) |
| 35 to 50 years | 37 (100.0%) | 0 (0.0%) |
| Total | 94 (72.3%) | 36 (27.7%) |
Fertility by Education in Acton
Average fertility rate in Acton is 84.0 births per 1,000 women. Women with the education attainment of graduate degree have the highest fertility rate of 205.0 births per 1,000 women, while women with the education attainment of high school diploma have the lowest fertility at 28.0 births per 1,000 women. Women with the education attainment of college or associate's degree represent 39.2% of all women with births.
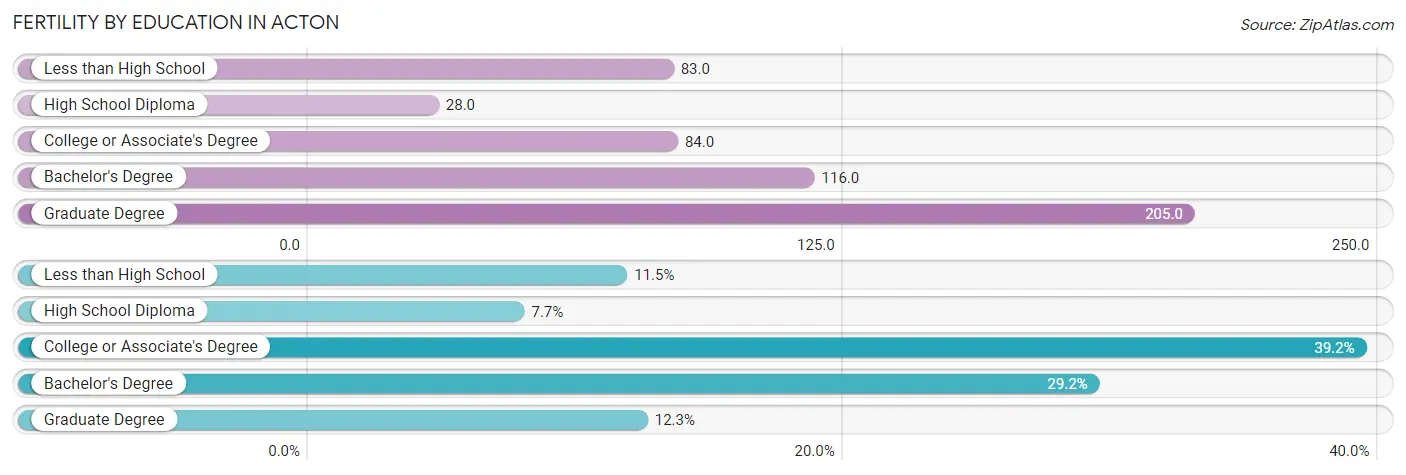
| Educational Attainment | Women with Births | Births / 1,000 Women |
| Less than High School | 15 (11.5%) | 83.0 |
| High School Diploma | 10 (7.7%) | 28.0 |
| College or Associate's Degree | 51 (39.2%) | 84.0 |
| Bachelor's Degree | 38 (29.2%) | 116.0 |
| Graduate Degree | 16 (12.3%) | 205.0 |
| Total | 130 (100.0%) | 84.0 |
Fertility by Education by Marriage Status in Acton
27.7% of women with births in Acton are unmarried. Women with the educational attainment of bachelor's degree are most likely to be married with 100.0% of them married at childbirth, while women with the educational attainment of high school diploma are least likely to be married with 100.0% of them unmarried at childbirth.
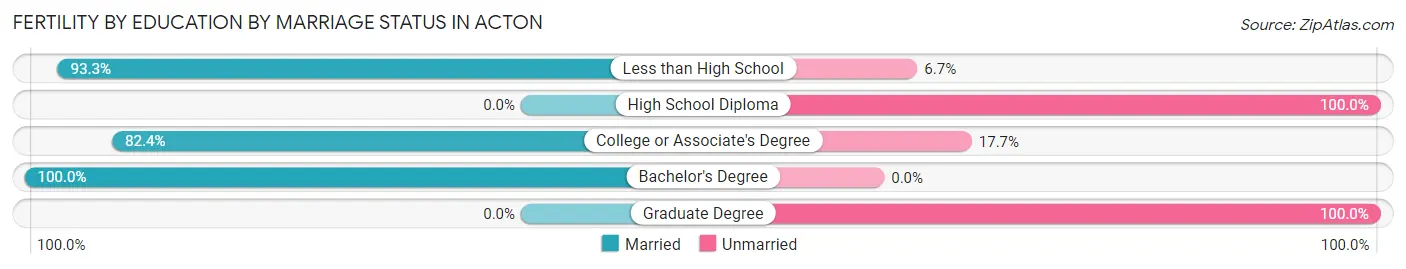
| Educational Attainment | Married | Unmarried |
| Less than High School | 14 (93.3%) | 1 (6.7%) |
| High School Diploma | 0 (0.0%) | 10 (100.0%) |
| College or Associate's Degree | 42 (82.4%) | 9 (17.6%) |
| Bachelor's Degree | 38 (100.0%) | 0 (0.0%) |
| Graduate Degree | 0 (0.0%) | 16 (100.0%) |
| Total | 94 (72.3%) | 36 (27.7%) |
Employment Characteristics in Acton
Employment by Class of Employer in Acton
Among the 3,363 employed individuals in Acton, private company employees (2,071 | 61.6%), local government employees (442 | 13.1%), and self-employed (not incorporated) (438 | 13.0%) make up the most common classes of employment.
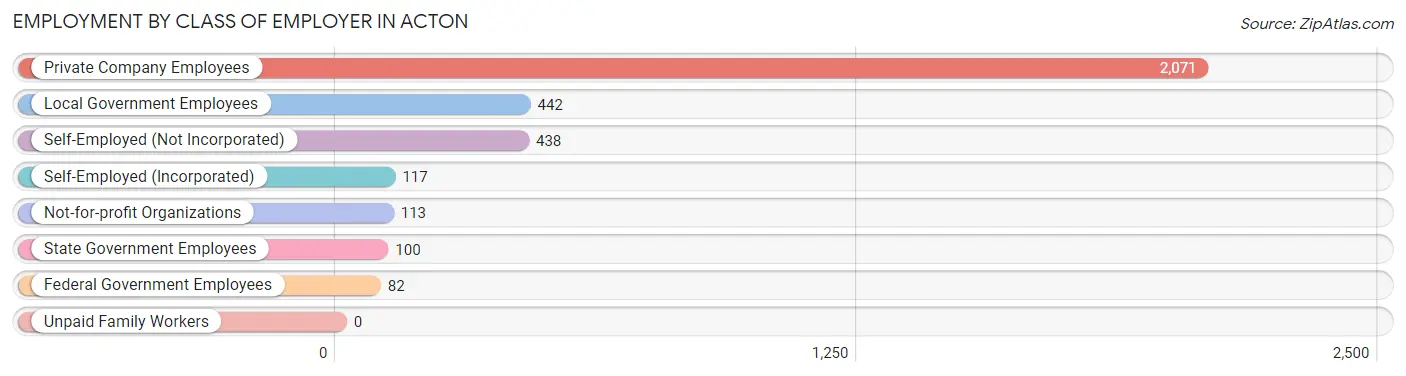
| Employer Class | # Employees | % Employees |
| Private Company Employees | 2,071 | 61.6% |
| Self-Employed (Incorporated) | 117 | 3.5% |
| Self-Employed (Not Incorporated) | 438 | 13.0% |
| Not-for-profit Organizations | 113 | 3.4% |
| Local Government Employees | 442 | 13.1% |
| State Government Employees | 100 | 3.0% |
| Federal Government Employees | 82 | 2.4% |
| Unpaid Family Workers | 0 | 0.0% |
| Total | 3,363 | 100.0% |
Employment Status by Age in Acton
According to the labor force statistics for Acton, out of the total population over 16 years of age (5,992), 58.3% or 3,493 individuals are in the labor force, with 1.5% or 52 of them unemployed. The age group with the highest labor force participation rate is 25 to 29 years, with 82.1% or 325 individuals in the labor force. Within the labor force, the 30 to 34 years age range has the highest percentage of unemployed individuals, with 6.0% or 8 of them being unemployed.
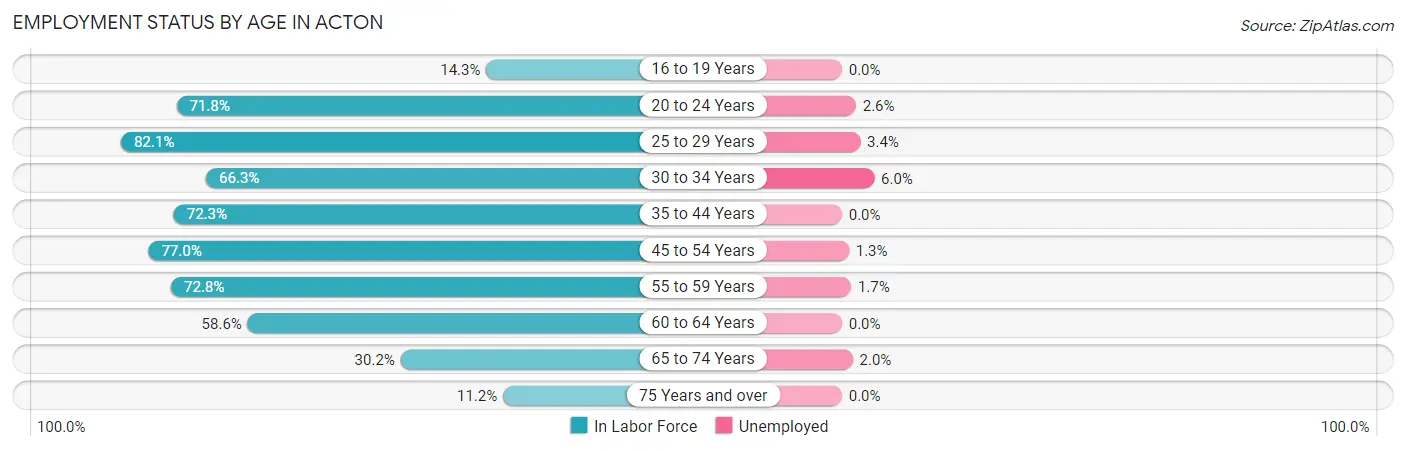
| Age Bracket | In Labor Force | Unemployed |
| 16 to 19 Years | 35 (14.3%) | 0 (0.0%) |
| 20 to 24 Years | 385 (71.8%) | 10 (2.6%) |
| 25 to 29 Years | 325 (82.1%) | 11 (3.4%) |
| 30 to 34 Years | 134 (66.3%) | 8 (6.0%) |
| 35 to 44 Years | 539 (72.3%) | 0 (0.0%) |
| 45 to 54 Years | 779 (77.0%) | 10 (1.3%) |
| 55 to 59 Years | 417 (72.8%) | 7 (1.7%) |
| 60 to 64 Years | 499 (58.6%) | 0 (0.0%) |
| 65 to 74 Years | 349 (30.2%) | 7 (2.0%) |
| 75 Years and over | 31 (11.2%) | 0 (0.0%) |
| Total | 3,493 (58.3%) | 52 (1.5%) |
Employment Status by Educational Attainment in Acton
According to labor force statistics for Acton, 71.2% of individuals (2,691) out of the total population between 25 and 64 years of age (3,780) are in the labor force, with 1.3% or 35 of them being unemployed. The group with the highest labor force participation rate are those with the educational attainment of bachelor's degree or higher, with 79.3% or 913 individuals in the labor force. Within the labor force, individuals with less than high school education have the highest percentage of unemployment, with 8.1% or 10 of them being unemployed.
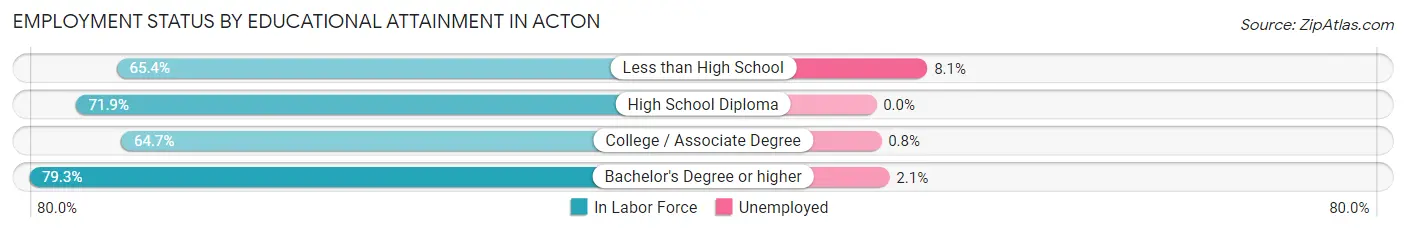
| Educational Attainment | In Labor Force | Unemployed |
| Less than High School | 123 (65.4%) | 15 (8.1%) |
| High School Diploma | 774 (71.9%) | 0 (0.0%) |
| College / Associate Degree | 883 (64.7%) | 11 (0.8%) |
| Bachelor's Degree or higher | 913 (79.3%) | 24 (2.1%) |
| Total | 2,691 (71.2%) | 49 (1.3%) |
Employment Occupations by Sex in Acton
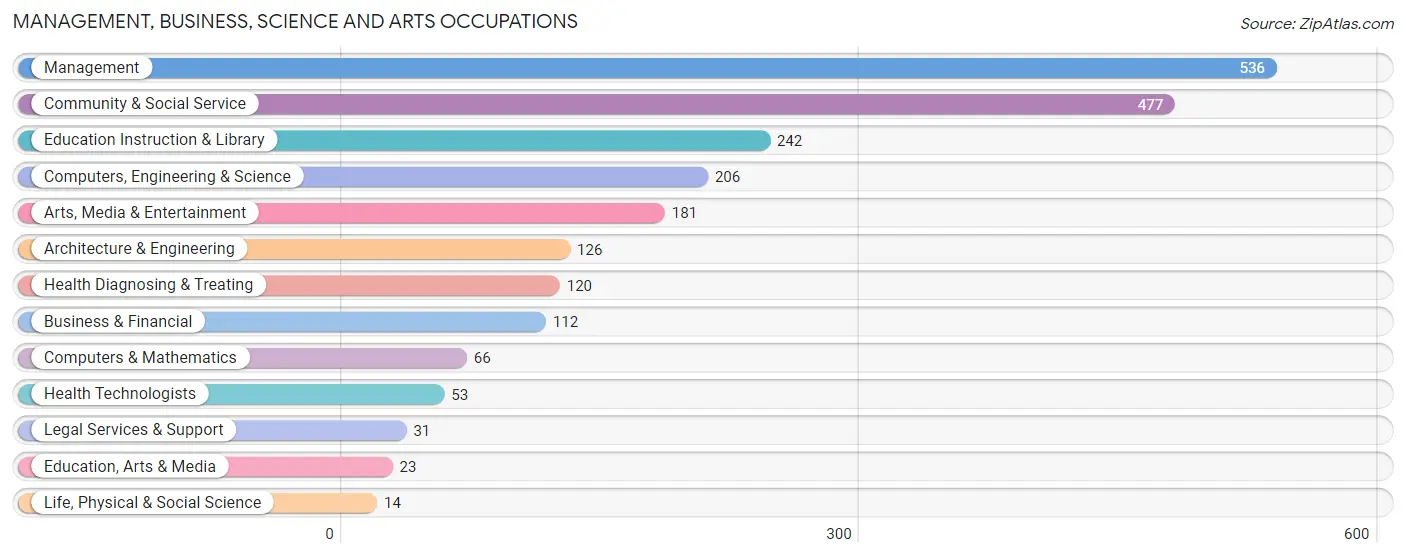
Management, Business, Science and Arts Occupations
The most common Management, Business, Science and Arts occupations in Acton are Management (536 | 15.7%), Community & Social Service (477 | 14.0%), Education Instruction & Library (242 | 7.1%), Computers, Engineering & Science (206 | 6.0%), and Arts, Media & Entertainment (181 | 5.3%).
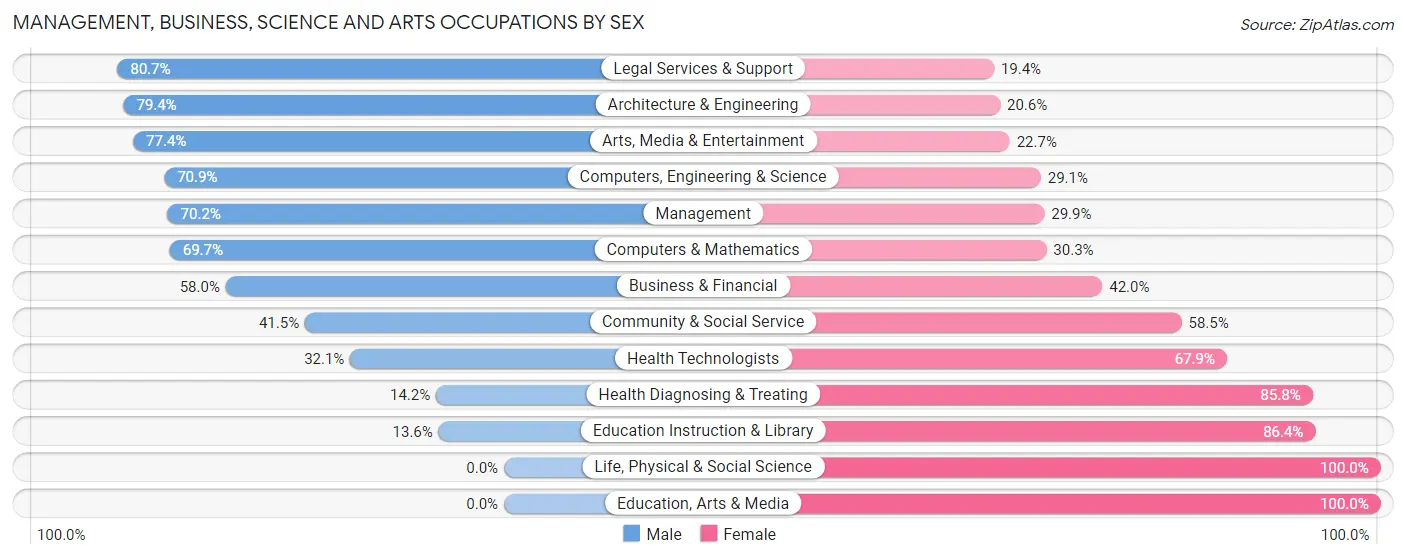
Management, Business, Science and Arts Occupations by Sex
Within the Management, Business, Science and Arts occupations in Acton, the most male-oriented occupations are Legal Services & Support (80.6%), Architecture & Engineering (79.4%), and Arts, Media & Entertainment (77.3%), while the most female-oriented occupations are Life, Physical & Social Science (100.0%), Education, Arts & Media (100.0%), and Education Instruction & Library (86.4%).
| Occupation | Male | Female |
| Management | 376 (70.2%) | 160 (29.8%) |
| Business & Financial | 65 (58.0%) | 47 (42.0%) |
| Computers, Engineering & Science | 146 (70.9%) | 60 (29.1%) |
| Computers & Mathematics | 46 (69.7%) | 20 (30.3%) |
| Architecture & Engineering | 100 (79.4%) | 26 (20.6%) |
| Life, Physical & Social Science | 0 (0.0%) | 14 (100.0%) |
| Community & Social Service | 198 (41.5%) | 279 (58.5%) |
| Education, Arts & Media | 0 (0.0%) | 23 (100.0%) |
| Legal Services & Support | 25 (80.6%) | 6 (19.4%) |
| Education Instruction & Library | 33 (13.6%) | 209 (86.4%) |
| Arts, Media & Entertainment | 140 (77.3%) | 41 (22.7%) |
| Health Diagnosing & Treating | 17 (14.2%) | 103 (85.8%) |
| Health Technologists | 17 (32.1%) | 36 (67.9%) |
| Total (Category) | 802 (55.3%) | 649 (44.7%) |
| Total (Overall) | 1,982 (58.0%) | 1,434 (42.0%) |
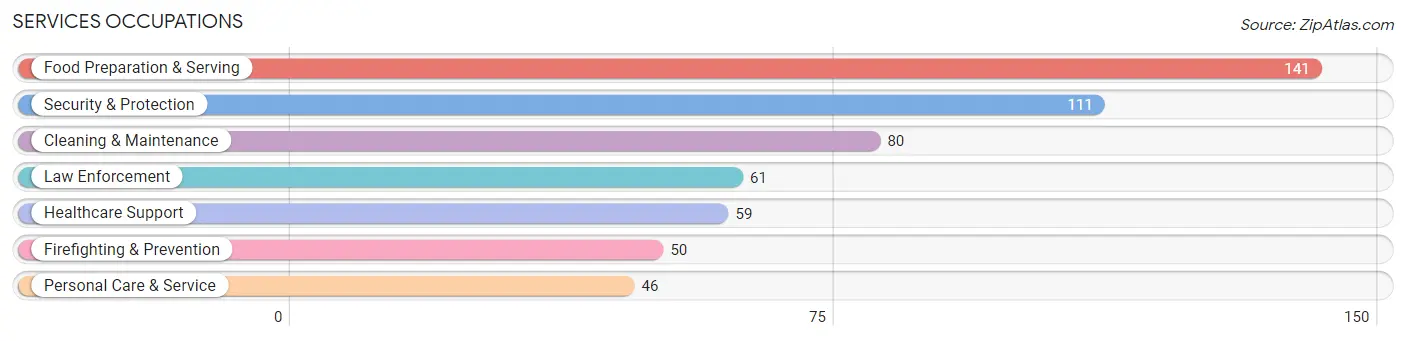
Services Occupations
The most common Services occupations in Acton are Food Preparation & Serving (141 | 4.1%), Security & Protection (111 | 3.3%), Cleaning & Maintenance (80 | 2.3%), Law Enforcement (61 | 1.8%), and Healthcare Support (59 | 1.7%).
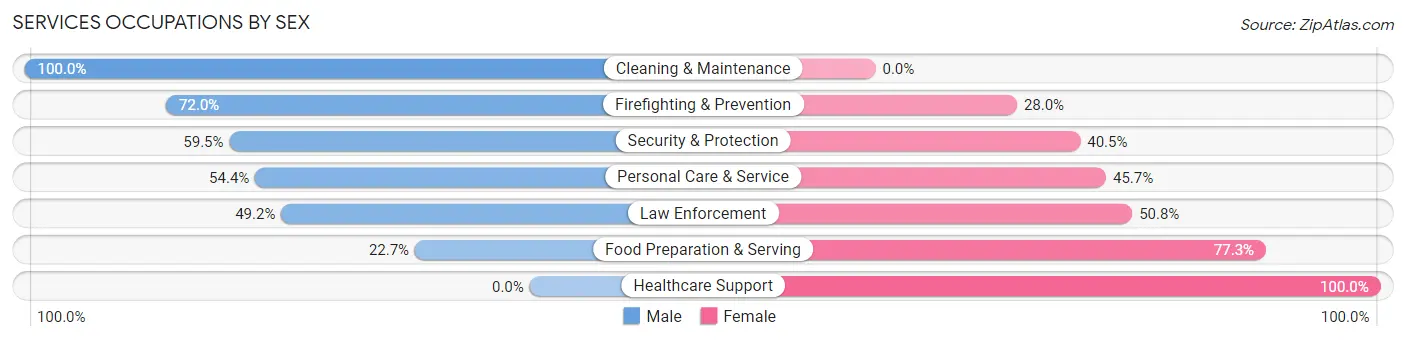
Services Occupations by Sex
Within the Services occupations in Acton, the most male-oriented occupations are Cleaning & Maintenance (100.0%), Firefighting & Prevention (72.0%), and Security & Protection (59.5%), while the most female-oriented occupations are Healthcare Support (100.0%), Food Preparation & Serving (77.3%), and Law Enforcement (50.8%).
| Occupation | Male | Female |
| Healthcare Support | 0 (0.0%) | 59 (100.0%) |
| Security & Protection | 66 (59.5%) | 45 (40.5%) |
| Firefighting & Prevention | 36 (72.0%) | 14 (28.0%) |
| Law Enforcement | 30 (49.2%) | 31 (50.8%) |
| Food Preparation & Serving | 32 (22.7%) | 109 (77.3%) |
| Cleaning & Maintenance | 80 (100.0%) | 0 (0.0%) |
| Personal Care & Service | 25 (54.3%) | 21 (45.7%) |
| Total (Category) | 203 (46.5%) | 234 (53.5%) |
| Total (Overall) | 1,982 (58.0%) | 1,434 (42.0%) |
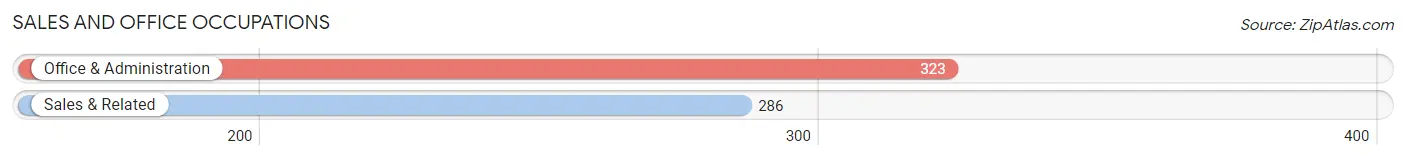
Sales and Office Occupations
The most common Sales and Office occupations in Acton are Office & Administration (323 | 9.5%), and Sales & Related (286 | 8.4%).
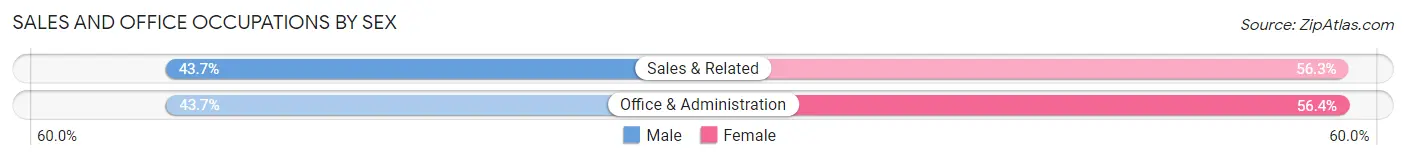
Sales and Office Occupations by Sex
| Occupation | Male | Female |
| Sales & Related | 125 (43.7%) | 161 (56.3%) |
| Office & Administration | 141 (43.6%) | 182 (56.4%) |
| Total (Category) | 266 (43.7%) | 343 (56.3%) |
| Total (Overall) | 1,982 (58.0%) | 1,434 (42.0%) |
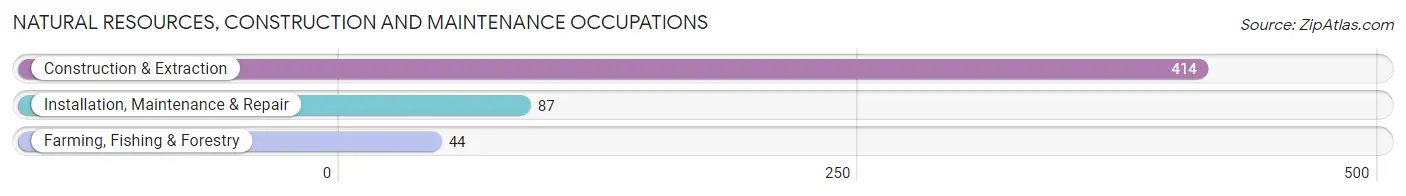
Natural Resources, Construction and Maintenance Occupations
The most common Natural Resources, Construction and Maintenance occupations in Acton are Construction & Extraction (414 | 12.1%), Installation, Maintenance & Repair (87 | 2.5%), and Farming, Fishing & Forestry (44 | 1.3%).
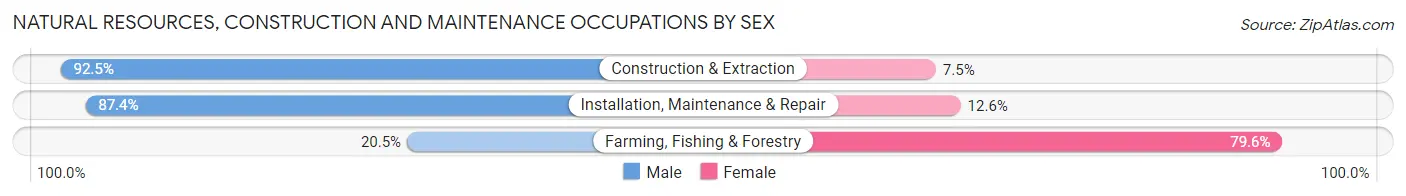
Natural Resources, Construction and Maintenance Occupations by Sex
| Occupation | Male | Female |
| Farming, Fishing & Forestry | 9 (20.4%) | 35 (79.5%) |
| Construction & Extraction | 383 (92.5%) | 31 (7.5%) |
| Installation, Maintenance & Repair | 76 (87.4%) | 11 (12.6%) |
| Total (Category) | 468 (85.9%) | 77 (14.1%) |
| Total (Overall) | 1,982 (58.0%) | 1,434 (42.0%) |
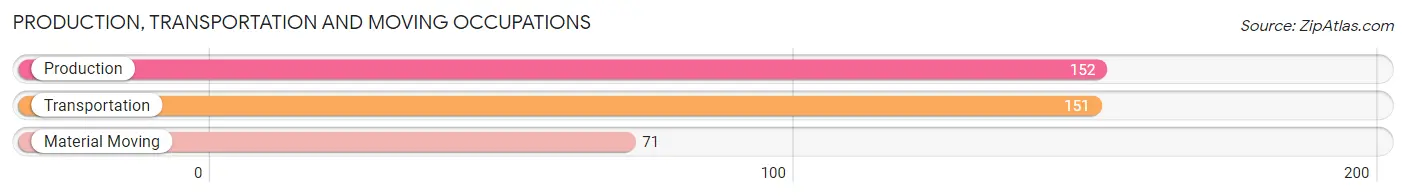
Production, Transportation and Moving Occupations
The most common Production, Transportation and Moving occupations in Acton are Production (152 | 4.4%), Transportation (151 | 4.4%), and Material Moving (71 | 2.1%).
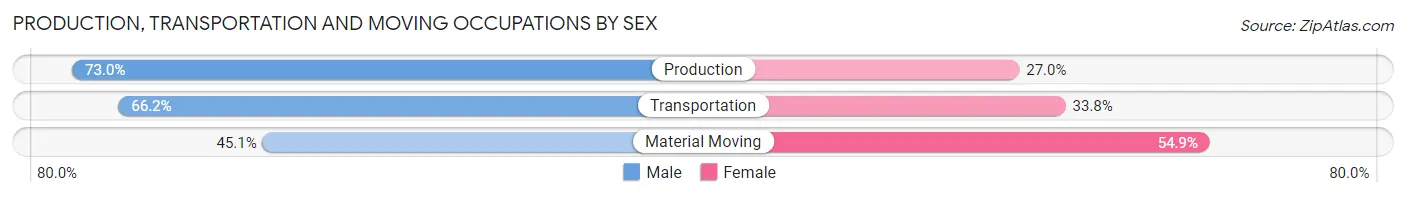
Production, Transportation and Moving Occupations by Sex
| Occupation | Male | Female |
| Production | 111 (73.0%) | 41 (27.0%) |
| Transportation | 100 (66.2%) | 51 (33.8%) |
| Material Moving | 32 (45.1%) | 39 (54.9%) |
| Total (Category) | 243 (65.0%) | 131 (35.0%) |
| Total (Overall) | 1,982 (58.0%) | 1,434 (42.0%) |
Employment Industries by Sex in Acton
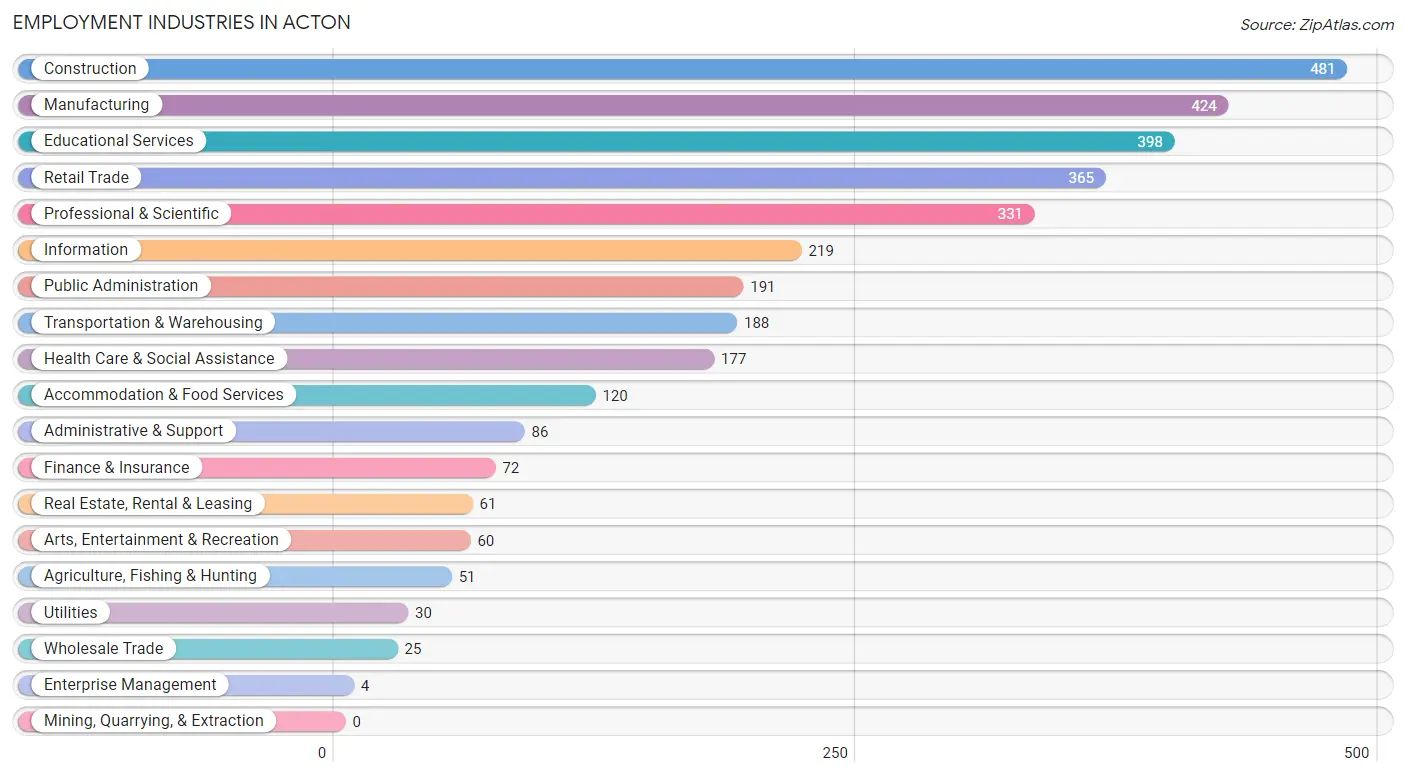
Employment Industries in Acton
The major employment industries in Acton include Construction (481 | 14.1%), Manufacturing (424 | 12.4%), Educational Services (398 | 11.7%), Retail Trade (365 | 10.7%), and Professional & Scientific (331 | 9.7%).
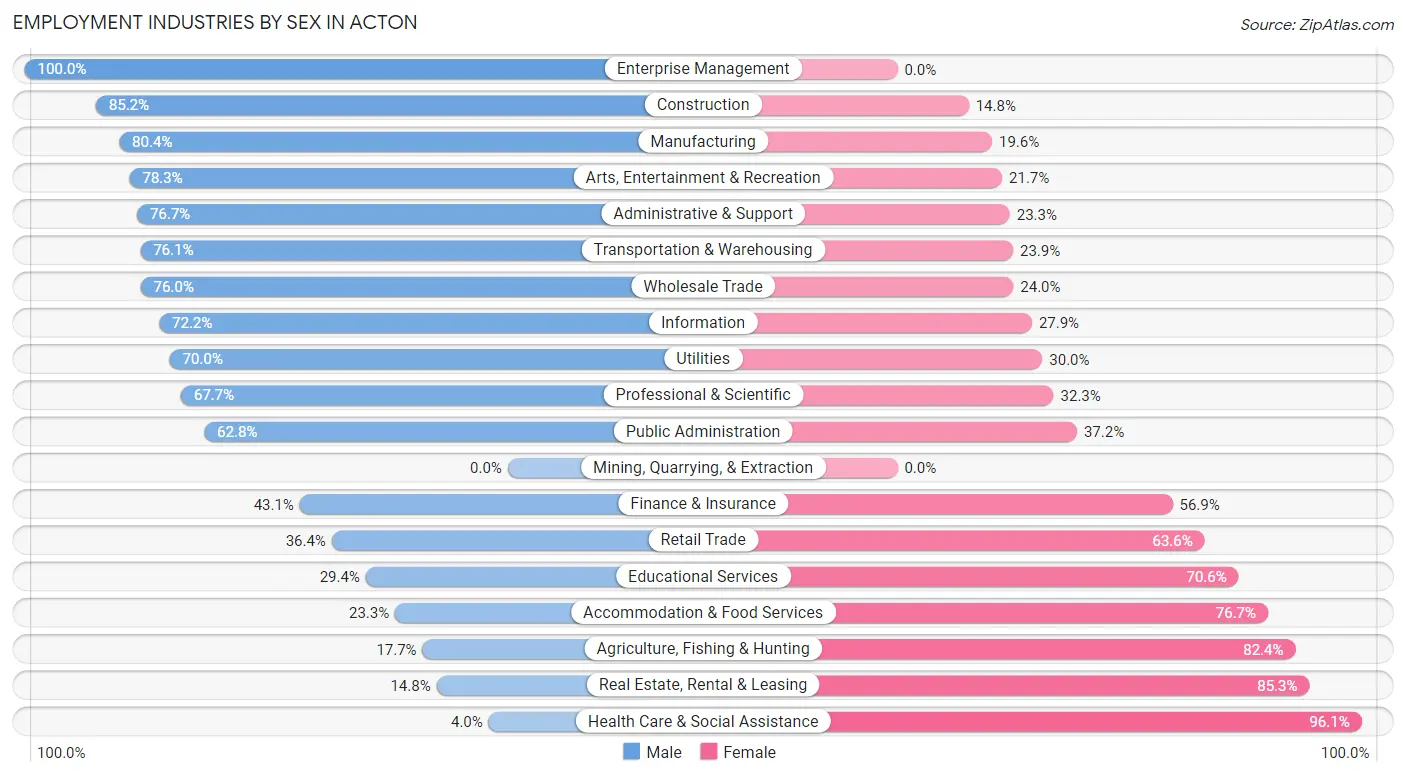
Employment Industries by Sex in Acton
The Acton industries that see more men than women are Enterprise Management (100.0%), Construction (85.2%), and Manufacturing (80.4%), whereas the industries that tend to have a higher number of women are Health Care & Social Assistance (96.1%), Real Estate, Rental & Leasing (85.3%), and Agriculture, Fishing & Hunting (82.4%).
| Industry | Male | Female |
| Agriculture, Fishing & Hunting | 9 (17.6%) | 42 (82.4%) |
| Mining, Quarrying, & Extraction | 0 (0.0%) | 0 (0.0%) |
| Construction | 410 (85.2%) | 71 (14.8%) |
| Manufacturing | 341 (80.4%) | 83 (19.6%) |
| Wholesale Trade | 19 (76.0%) | 6 (24.0%) |
| Retail Trade | 133 (36.4%) | 232 (63.6%) |
| Transportation & Warehousing | 143 (76.1%) | 45 (23.9%) |
| Utilities | 21 (70.0%) | 9 (30.0%) |
| Information | 158 (72.2%) | 61 (27.9%) |
| Finance & Insurance | 31 (43.1%) | 41 (56.9%) |
| Real Estate, Rental & Leasing | 9 (14.7%) | 52 (85.3%) |
| Professional & Scientific | 224 (67.7%) | 107 (32.3%) |
| Enterprise Management | 4 (100.0%) | 0 (0.0%) |
| Administrative & Support | 66 (76.7%) | 20 (23.3%) |
| Educational Services | 117 (29.4%) | 281 (70.6%) |
| Health Care & Social Assistance | 7 (4.0%) | 170 (96.1%) |
| Arts, Entertainment & Recreation | 47 (78.3%) | 13 (21.7%) |
| Accommodation & Food Services | 28 (23.3%) | 92 (76.7%) |
| Public Administration | 120 (62.8%) | 71 (37.2%) |
| Total | 1,982 (58.0%) | 1,434 (42.0%) |
Education in Acton
School Enrollment in Acton
The most common levels of schooling among the 1,476 students in Acton are elementary school (340 | 23.0%), high school (325 | 22.0%), and college / undergraduate (324 | 22.0%).
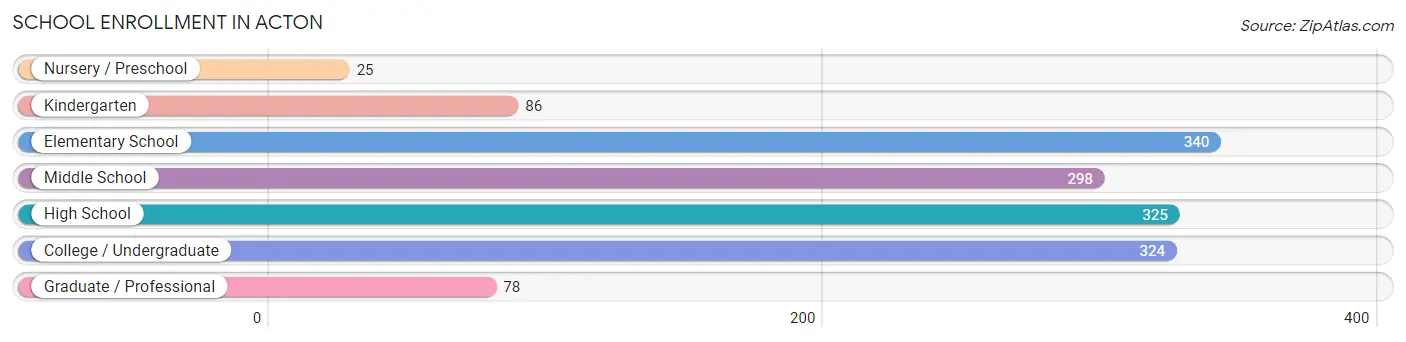
| School Level | # Students | % Students |
| Nursery / Preschool | 25 | 1.7% |
| Kindergarten | 86 | 5.8% |
| Elementary School | 340 | 23.0% |
| Middle School | 298 | 20.2% |
| High School | 325 | 22.0% |
| College / Undergraduate | 324 | 22.0% |
| Graduate / Professional | 78 | 5.3% |
| Total | 1,476 | 100.0% |
School Enrollment by Age by Funding Source in Acton
Out of a total of 1,476 students who are enrolled in schools in Acton, 184 (12.5%) attend a private institution, while the remaining 1,292 (87.5%) are enrolled in public schools. The age group of 35 years and over has the highest likelihood of being enrolled in private schools, with 39 (35.8% in the age bracket) enrolled. Conversely, the age group of 25 to 34 year olds has the lowest likelihood of being enrolled in a private school, with 44 (100.0% in the age bracket) attending a public institution.
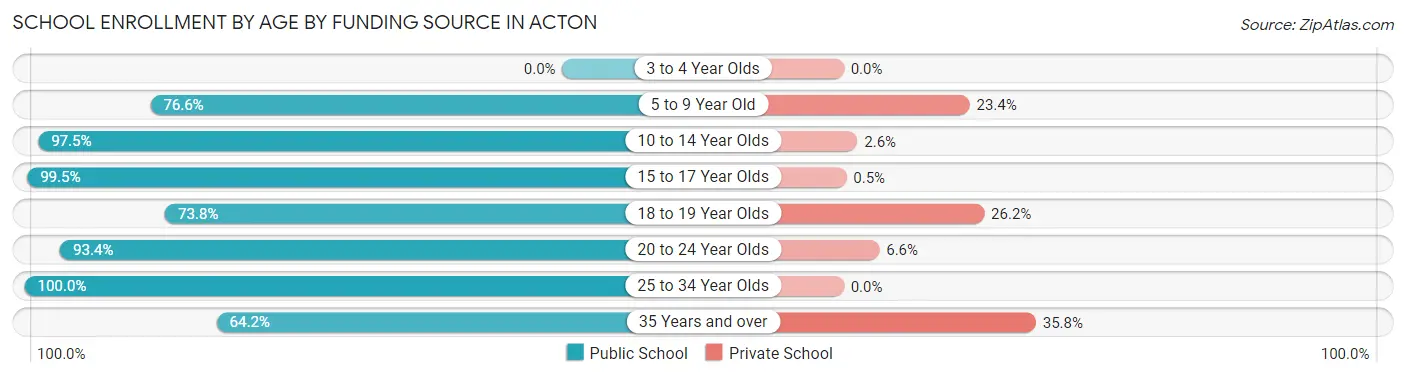
| Age Bracket | Public School | Private School |
| 3 to 4 Year Olds | 0 (0.0%) | 0 (0.0%) |
| 5 to 9 Year Old | 307 (76.6%) | 94 (23.4%) |
| 10 to 14 Year Olds | 421 (97.5%) | 11 (2.5%) |
| 15 to 17 Year Olds | 201 (99.5%) | 1 (0.5%) |
| 18 to 19 Year Olds | 79 (73.8%) | 28 (26.2%) |
| 20 to 24 Year Olds | 169 (93.4%) | 12 (6.6%) |
| 25 to 34 Year Olds | 44 (100.0%) | 0 (0.0%) |
| 35 Years and over | 70 (64.2%) | 39 (35.8%) |
| Total | 1,292 (87.5%) | 184 (12.5%) |
Educational Attainment by Field of Study in Acton
Education (210 | 13.3%), science & technology (172 | 10.9%), liberal arts & history (165 | 10.5%), social sciences (163 | 10.3%), and business (149 | 9.5%) are the most common fields of study among 1,576 individuals in Acton who have obtained a bachelor's degree or higher.
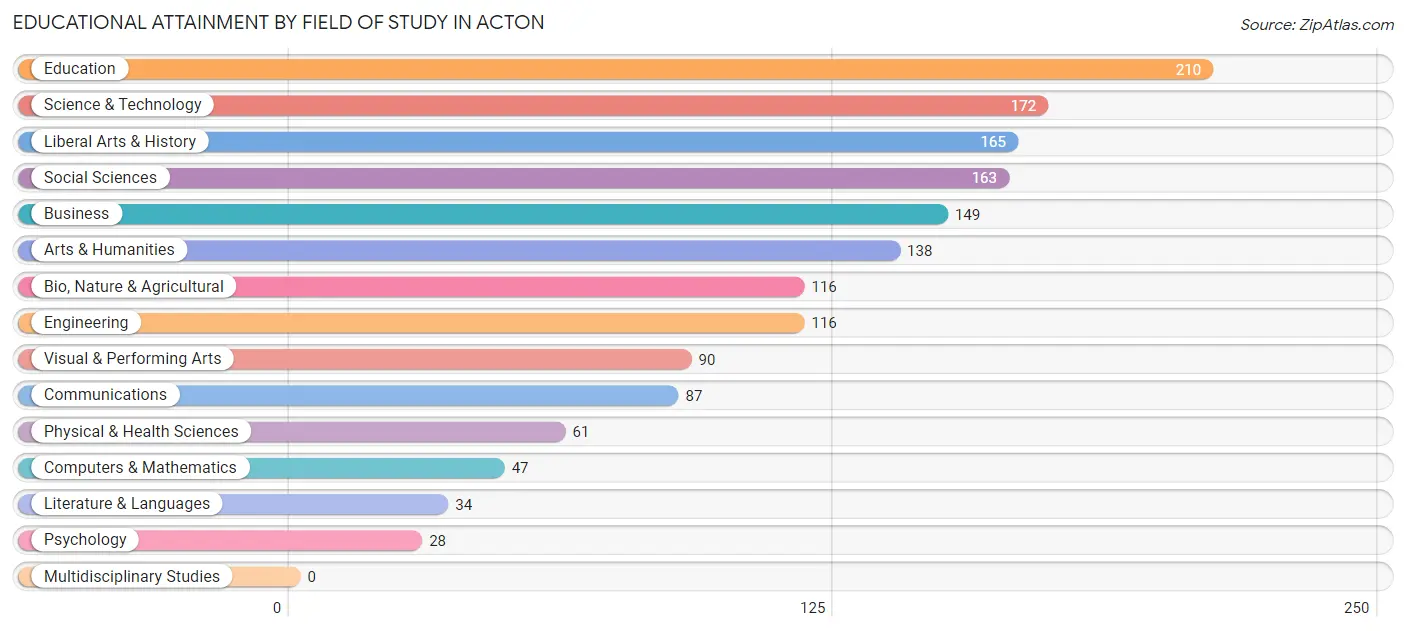
| Field of Study | # Graduates | % Graduates |
| Computers & Mathematics | 47 | 3.0% |
| Bio, Nature & Agricultural | 116 | 7.4% |
| Physical & Health Sciences | 61 | 3.9% |
| Psychology | 28 | 1.8% |
| Social Sciences | 163 | 10.3% |
| Engineering | 116 | 7.4% |
| Multidisciplinary Studies | 0 | 0.0% |
| Science & Technology | 172 | 10.9% |
| Business | 149 | 9.5% |
| Education | 210 | 13.3% |
| Literature & Languages | 34 | 2.2% |
| Liberal Arts & History | 165 | 10.5% |
| Visual & Performing Arts | 90 | 5.7% |
| Communications | 87 | 5.5% |
| Arts & Humanities | 138 | 8.8% |
| Total | 1,576 | 100.0% |
Transportation & Commute in Acton
Vehicle Availability by Sex in Acton
The most prevalent vehicle ownership categories in Acton are males with 3 vehicles (526, accounting for 26.7%) and females with 3 vehicles (295, making up 37.8%).
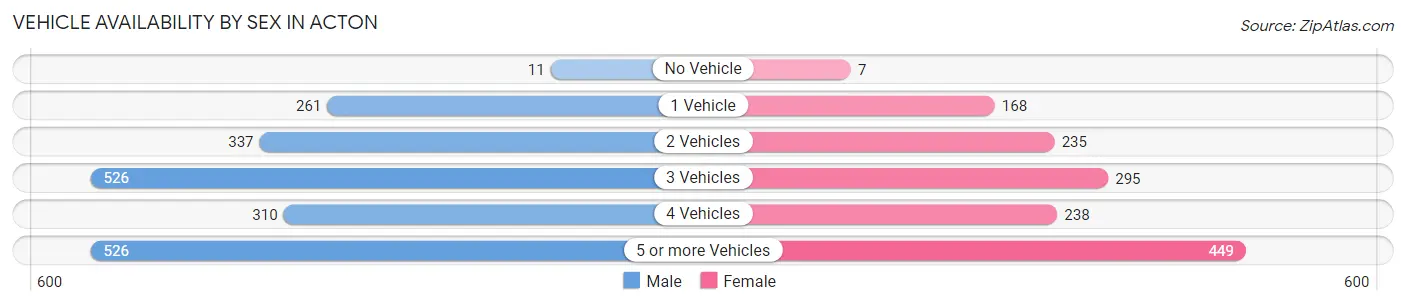
| Vehicles Available | Male | Female |
| No Vehicle | 11 (0.6%) | 7 (0.5%) |
| 1 Vehicle | 261 (13.2%) | 168 (12.1%) |
| 2 Vehicles | 337 (17.1%) | 235 (16.9%) |
| 3 Vehicles | 526 (26.7%) | 295 (21.2%) |
| 4 Vehicles | 310 (15.7%) | 238 (17.1%) |
| 5 or more Vehicles | 526 (26.7%) | 449 (32.3%) |
| Total | 1,971 (100.0%) | 1,392 (100.0%) |
Commute Time in Acton
The most frequently occuring commute durations in Acton are 60 to 89 minutes (684 commuters, 24.6%), 90 or more minutes (438 commuters, 15.7%), and 45 to 59 minutes (345 commuters, 12.4%).
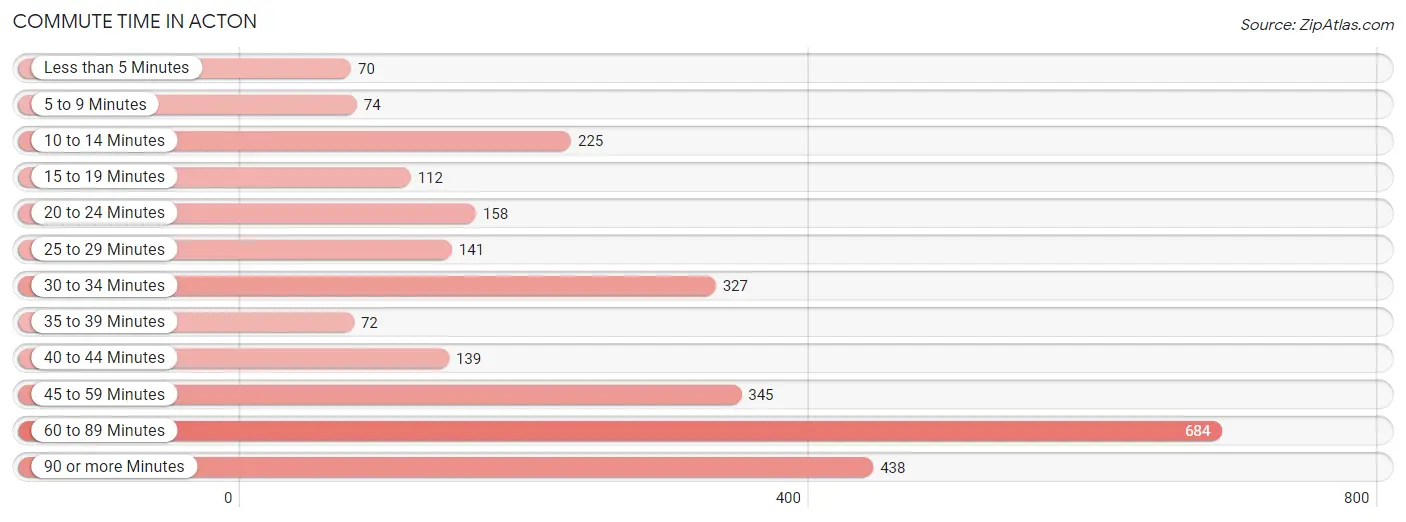
| Commute Time | # Commuters | % Commuters |
| Less than 5 Minutes | 70 | 2.5% |
| 5 to 9 Minutes | 74 | 2.7% |
| 10 to 14 Minutes | 225 | 8.1% |
| 15 to 19 Minutes | 112 | 4.0% |
| 20 to 24 Minutes | 158 | 5.7% |
| 25 to 29 Minutes | 141 | 5.1% |
| 30 to 34 Minutes | 327 | 11.7% |
| 35 to 39 Minutes | 72 | 2.6% |
| 40 to 44 Minutes | 139 | 5.0% |
| 45 to 59 Minutes | 345 | 12.4% |
| 60 to 89 Minutes | 684 | 24.6% |
| 90 or more Minutes | 438 | 15.7% |
Commute Time by Sex in Acton
The most common commute times in Acton are 60 to 89 minutes (427 commuters, 25.7%) for males and 60 to 89 minutes (257 commuters, 22.9%) for females.
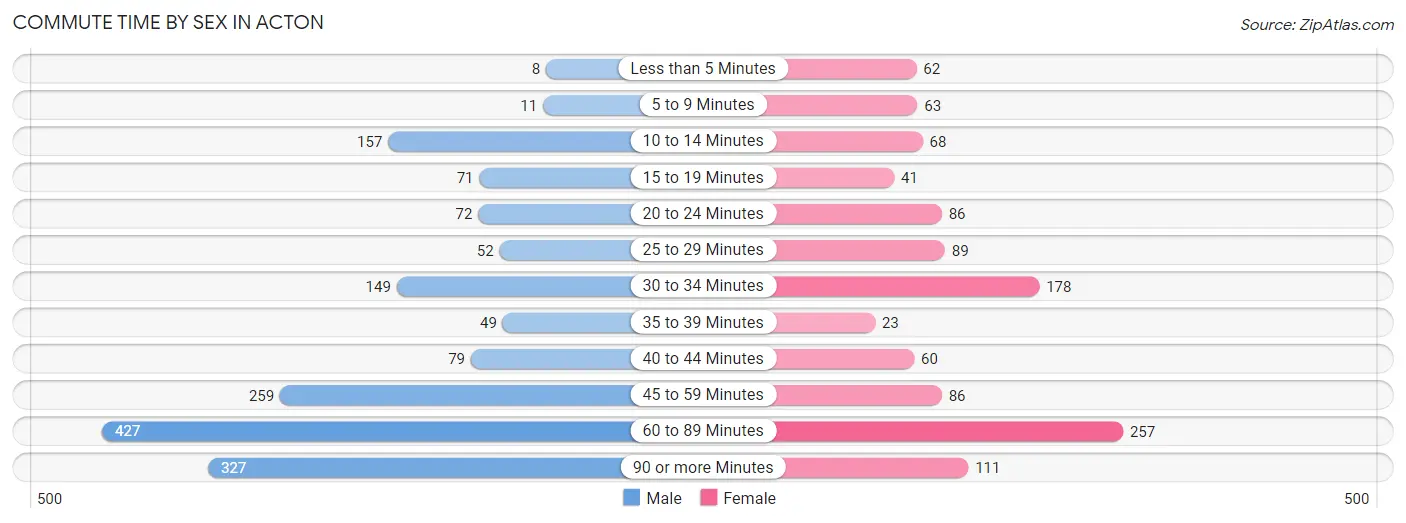
| Commute Time | Male | Female |
| Less than 5 Minutes | 8 (0.5%) | 62 (5.5%) |
| 5 to 9 Minutes | 11 (0.7%) | 63 (5.6%) |
| 10 to 14 Minutes | 157 (9.5%) | 68 (6.0%) |
| 15 to 19 Minutes | 71 (4.3%) | 41 (3.6%) |
| 20 to 24 Minutes | 72 (4.3%) | 86 (7.6%) |
| 25 to 29 Minutes | 52 (3.1%) | 89 (7.9%) |
| 30 to 34 Minutes | 149 (9.0%) | 178 (15.8%) |
| 35 to 39 Minutes | 49 (2.9%) | 23 (2.1%) |
| 40 to 44 Minutes | 79 (4.8%) | 60 (5.3%) |
| 45 to 59 Minutes | 259 (15.6%) | 86 (7.6%) |
| 60 to 89 Minutes | 427 (25.7%) | 257 (22.9%) |
| 90 or more Minutes | 327 (19.7%) | 111 (9.9%) |
Time of Departure to Work by Sex in Acton
The most frequent times of departure to work in Acton are 7:00 AM to 7:29 AM (302, 18.2%) for males and 6:00 AM to 6:29 AM (186, 16.6%) for females.
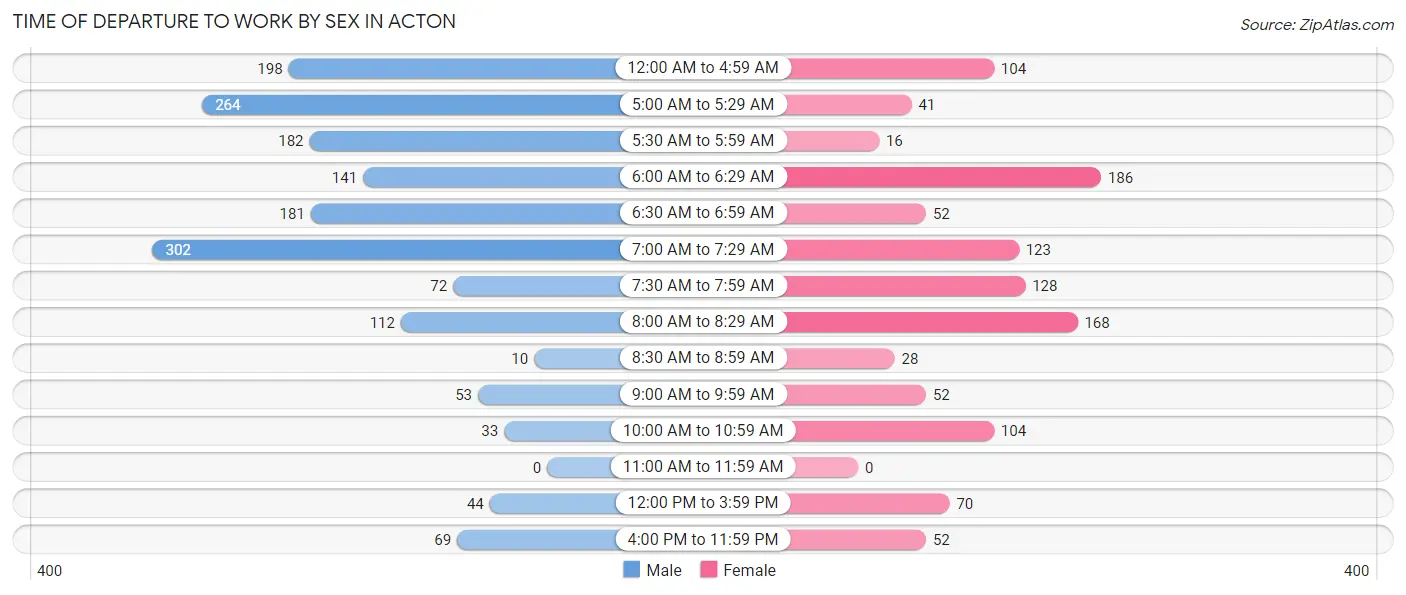
| Time of Departure | Male | Female |
| 12:00 AM to 4:59 AM | 198 (11.9%) | 104 (9.2%) |
| 5:00 AM to 5:29 AM | 264 (15.9%) | 41 (3.6%) |
| 5:30 AM to 5:59 AM | 182 (11.0%) | 16 (1.4%) |
| 6:00 AM to 6:29 AM | 141 (8.5%) | 186 (16.6%) |
| 6:30 AM to 6:59 AM | 181 (10.9%) | 52 (4.6%) |
| 7:00 AM to 7:29 AM | 302 (18.2%) | 123 (10.9%) |
| 7:30 AM to 7:59 AM | 72 (4.3%) | 128 (11.4%) |
| 8:00 AM to 8:29 AM | 112 (6.7%) | 168 (14.9%) |
| 8:30 AM to 8:59 AM | 10 (0.6%) | 28 (2.5%) |
| 9:00 AM to 9:59 AM | 53 (3.2%) | 52 (4.6%) |
| 10:00 AM to 10:59 AM | 33 (2.0%) | 104 (9.2%) |
| 11:00 AM to 11:59 AM | 0 (0.0%) | 0 (0.0%) |
| 12:00 PM to 3:59 PM | 44 (2.6%) | 70 (6.2%) |
| 4:00 PM to 11:59 PM | 69 (4.2%) | 52 (4.6%) |
| Total | 1,661 (100.0%) | 1,124 (100.0%) |
Housing Occupancy in Acton
Occupancy by Ownership in Acton
Of the total 2,510 dwellings in Acton, owner-occupied units account for 2,309 (92.0%), while renter-occupied units make up 201 (8.0%).
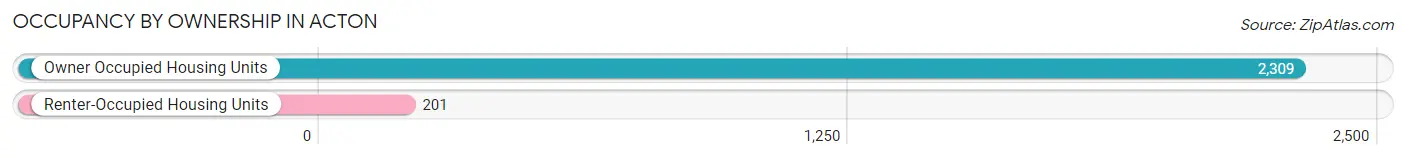
| Occupancy | # Housing Units | % Housing Units |
| Owner Occupied Housing Units | 2,309 | 92.0% |
| Renter-Occupied Housing Units | 201 | 8.0% |
| Total Occupied Housing Units | 2,510 | 100.0% |
Occupancy by Household Size in Acton
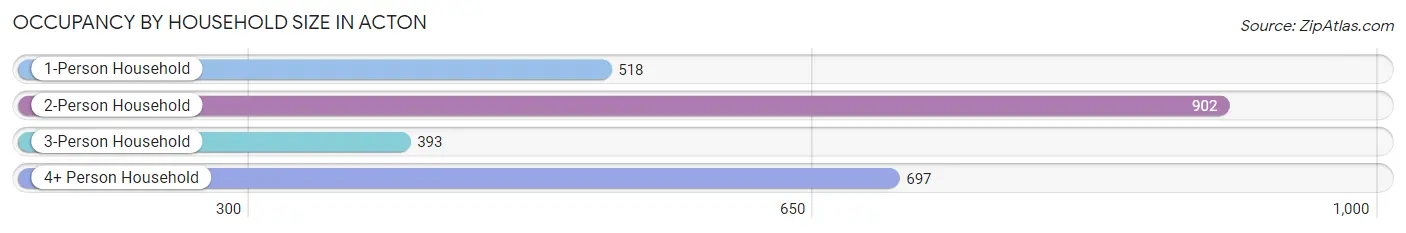
| Household Size | # Housing Units | % Housing Units |
| 1-Person Household | 518 | 20.6% |
| 2-Person Household | 902 | 35.9% |
| 3-Person Household | 393 | 15.7% |
| 4+ Person Household | 697 | 27.8% |
| Total Housing Units | 2,510 | 100.0% |
Occupancy by Ownership by Household Size in Acton
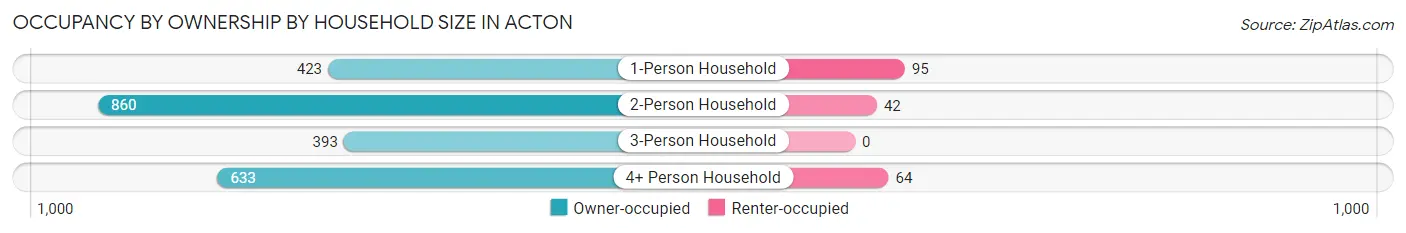
| Household Size | Owner-occupied | Renter-occupied |
| 1-Person Household | 423 (81.7%) | 95 (18.3%) |
| 2-Person Household | 860 (95.3%) | 42 (4.7%) |
| 3-Person Household | 393 (100.0%) | 0 (0.0%) |
| 4+ Person Household | 633 (90.8%) | 64 (9.2%) |
| Total Housing Units | 2,309 (92.0%) | 201 (8.0%) |
Occupancy by Educational Attainment in Acton
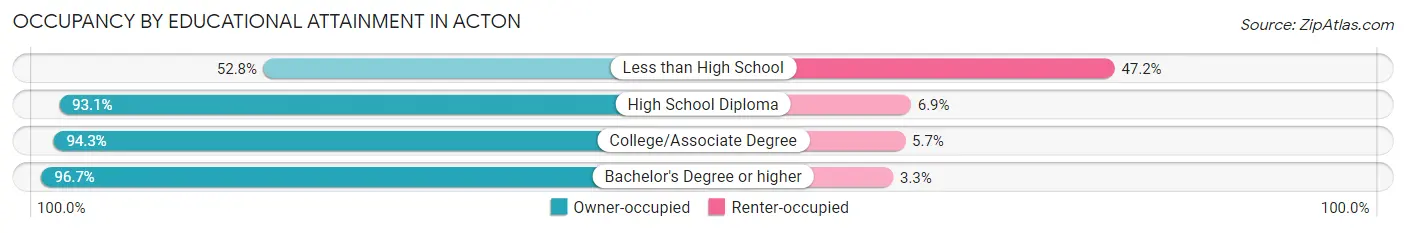
| Household Size | Owner-occupied | Renter-occupied |
| Less than High School | 86 (52.8%) | 77 (47.2%) |
| High School Diploma | 611 (93.1%) | 45 (6.9%) |
| College/Associate Degree | 889 (94.3%) | 54 (5.7%) |
| Bachelor's Degree or higher | 723 (96.7%) | 25 (3.3%) |
Occupancy by Age of Householder in Acton
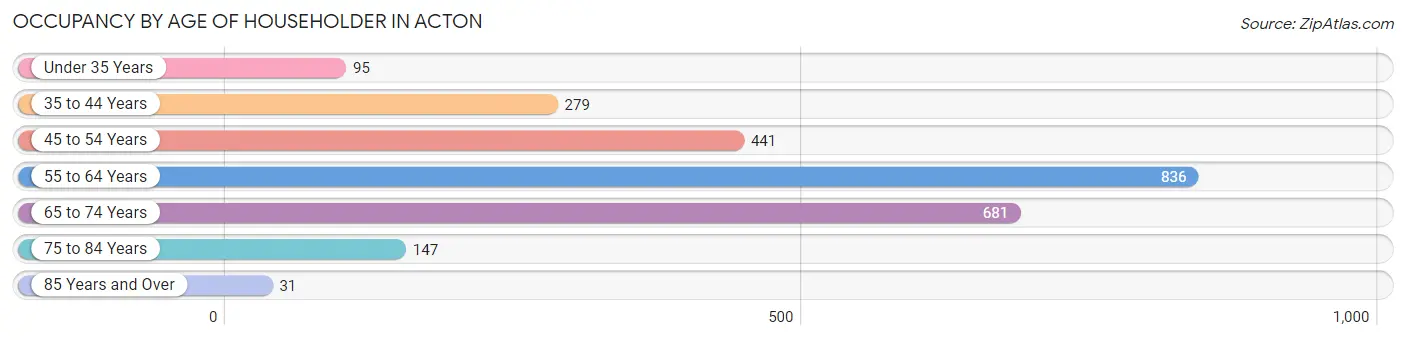
| Age Bracket | # Households | % Households |
| Under 35 Years | 95 | 3.8% |
| 35 to 44 Years | 279 | 11.1% |
| 45 to 54 Years | 441 | 17.6% |
| 55 to 64 Years | 836 | 33.3% |
| 65 to 74 Years | 681 | 27.1% |
| 75 to 84 Years | 147 | 5.9% |
| 85 Years and Over | 31 | 1.2% |
| Total | 2,510 | 100.0% |
Housing Finances in Acton
Median Income by Occupancy in Acton
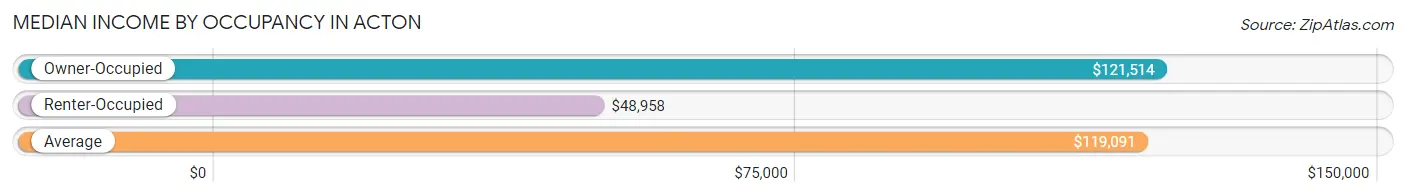
| Occupancy Type | # Households | Median Income |
| Owner-Occupied | 2,309 (92.0%) | $121,514 |
| Renter-Occupied | 201 (8.0%) | $48,958 |
| Average | 2,510 (100.0%) | $119,091 |
Occupancy by Householder Income Bracket in Acton
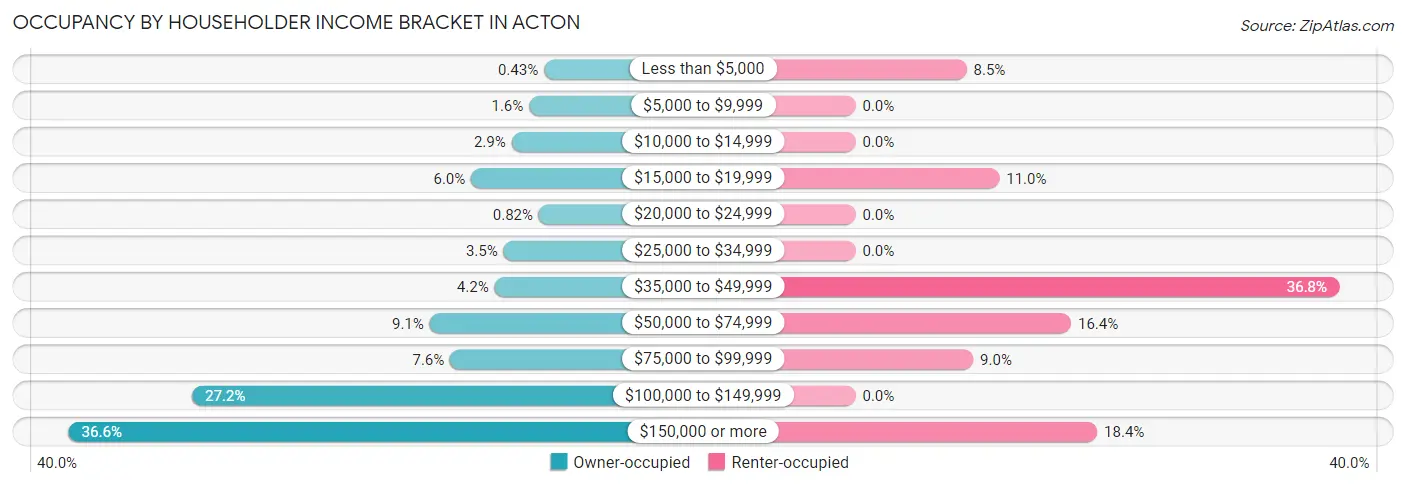
| Income Bracket | Owner-occupied | Renter-occupied |
| Less than $5,000 | 10 (0.4%) | 17 (8.5%) |
| $5,000 to $9,999 | 36 (1.6%) | 0 (0.0%) |
| $10,000 to $14,999 | 67 (2.9%) | 0 (0.0%) |
| $15,000 to $19,999 | 138 (6.0%) | 22 (11.0%) |
| $20,000 to $24,999 | 19 (0.8%) | 0 (0.0%) |
| $25,000 to $34,999 | 81 (3.5%) | 0 (0.0%) |
| $35,000 to $49,999 | 97 (4.2%) | 74 (36.8%) |
| $50,000 to $74,999 | 211 (9.1%) | 33 (16.4%) |
| $75,000 to $99,999 | 175 (7.6%) | 18 (9.0%) |
| $100,000 to $149,999 | 629 (27.2%) | 0 (0.0%) |
| $150,000 or more | 846 (36.6%) | 37 (18.4%) |
| Total | 2,309 (100.0%) | 201 (100.0%) |
Monthly Housing Cost Tiers in Acton
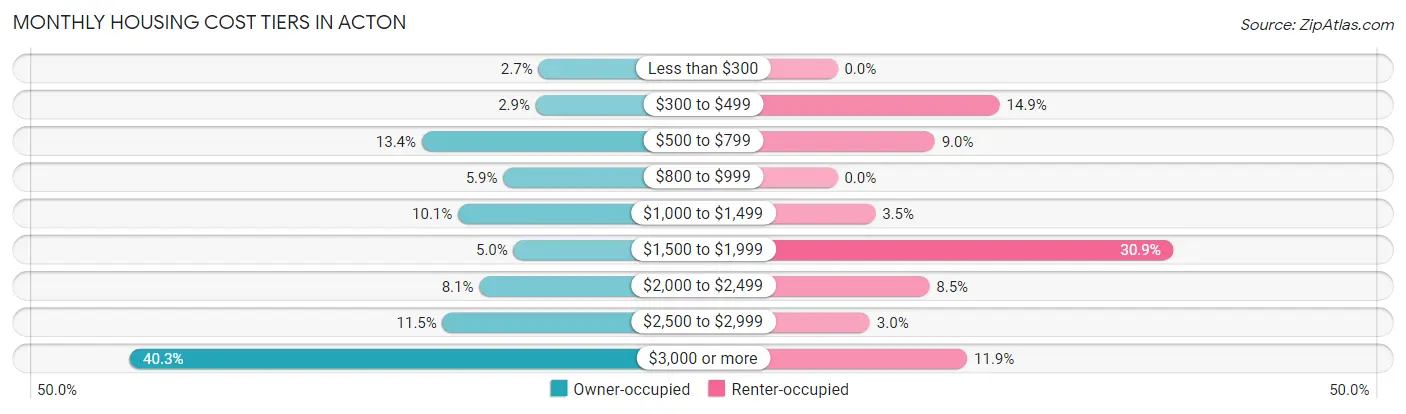
| Monthly Cost | Owner-occupied | Renter-occupied |
| Less than $300 | 62 (2.7%) | 0 (0.0%) |
| $300 to $499 | 68 (2.9%) | 30 (14.9%) |
| $500 to $799 | 310 (13.4%) | 18 (9.0%) |
| $800 to $999 | 137 (5.9%) | 0 (0.0%) |
| $1,000 to $1,499 | 233 (10.1%) | 7 (3.5%) |
| $1,500 to $1,999 | 115 (5.0%) | 62 (30.8%) |
| $2,000 to $2,499 | 188 (8.1%) | 17 (8.5%) |
| $2,500 to $2,999 | 266 (11.5%) | 6 (3.0%) |
| $3,000 or more | 930 (40.3%) | 24 (11.9%) |
| Total | 2,309 (100.0%) | 201 (100.0%) |
Physical Housing Characteristics in Acton
Housing Structures in Acton
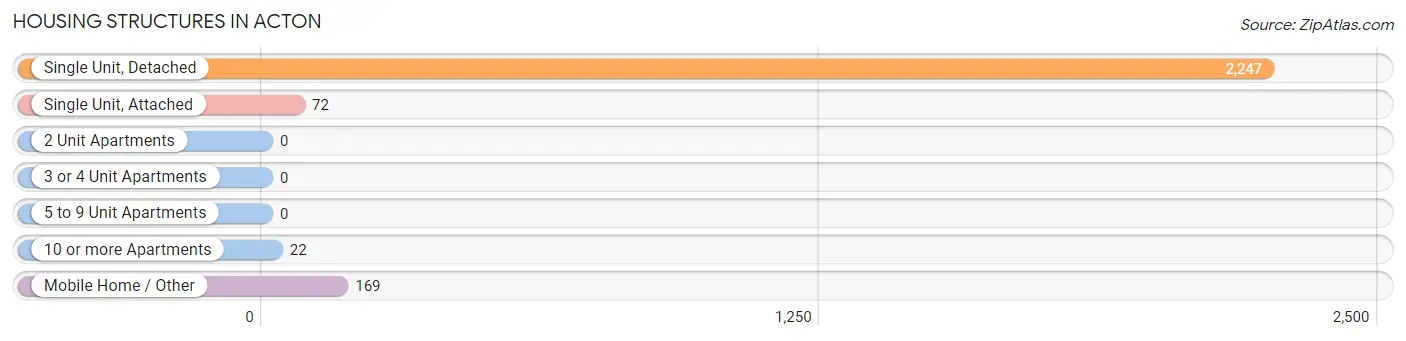
| Structure Type | # Housing Units | % Housing Units |
| Single Unit, Detached | 2,247 | 89.5% |
| Single Unit, Attached | 72 | 2.9% |
| 2 Unit Apartments | 0 | 0.0% |
| 3 or 4 Unit Apartments | 0 | 0.0% |
| 5 to 9 Unit Apartments | 0 | 0.0% |
| 10 or more Apartments | 22 | 0.9% |
| Mobile Home / Other | 169 | 6.7% |
| Total | 2,510 | 100.0% |
Housing Structures by Occupancy in Acton
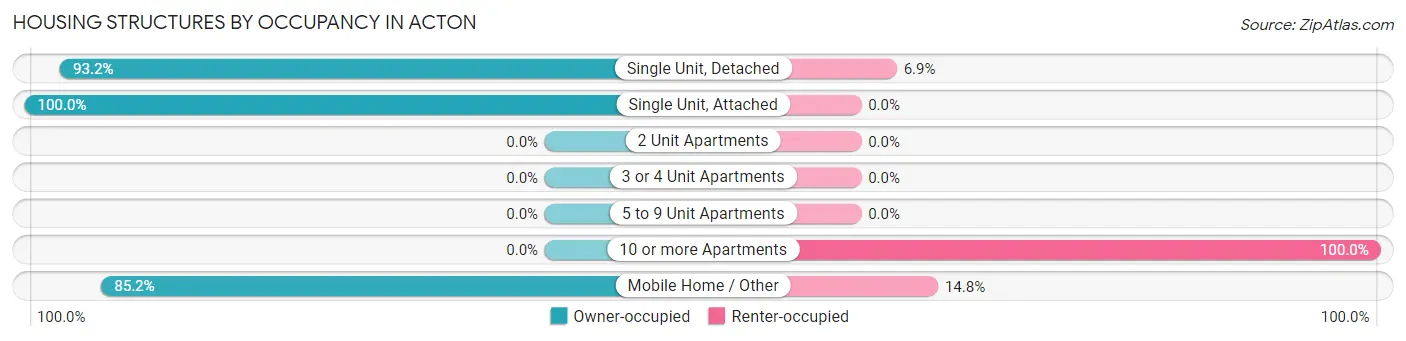
| Structure Type | Owner-occupied | Renter-occupied |
| Single Unit, Detached | 2,093 (93.1%) | 154 (6.9%) |
| Single Unit, Attached | 72 (100.0%) | 0 (0.0%) |
| 2 Unit Apartments | 0 (0.0%) | 0 (0.0%) |
| 3 or 4 Unit Apartments | 0 (0.0%) | 0 (0.0%) |
| 5 to 9 Unit Apartments | 0 (0.0%) | 0 (0.0%) |
| 10 or more Apartments | 0 (0.0%) | 22 (100.0%) |
| Mobile Home / Other | 144 (85.2%) | 25 (14.8%) |
| Total | 2,309 (92.0%) | 201 (8.0%) |
Housing Structures by Number of Rooms in Acton
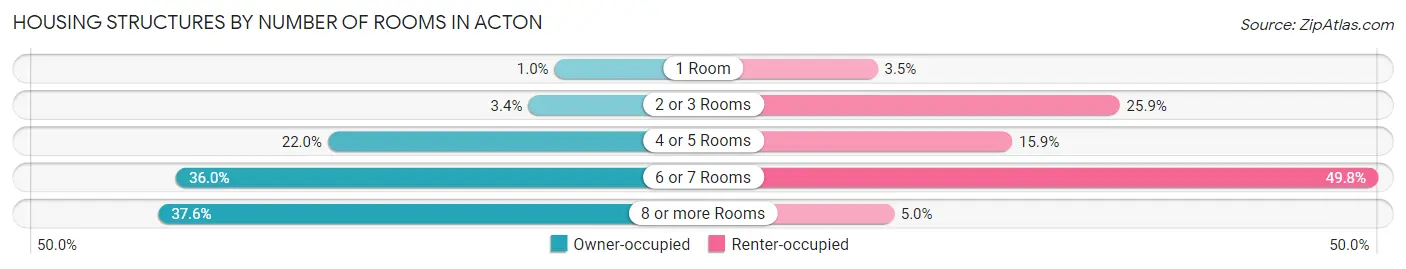
| Number of Rooms | Owner-occupied | Renter-occupied |
| 1 Room | 23 (1.0%) | 7 (3.5%) |
| 2 or 3 Rooms | 79 (3.4%) | 52 (25.9%) |
| 4 or 5 Rooms | 507 (22.0%) | 32 (15.9%) |
| 6 or 7 Rooms | 831 (36.0%) | 100 (49.7%) |
| 8 or more Rooms | 869 (37.6%) | 10 (5.0%) |
| Total | 2,309 (100.0%) | 201 (100.0%) |
Housing Structure by Heating Type in Acton
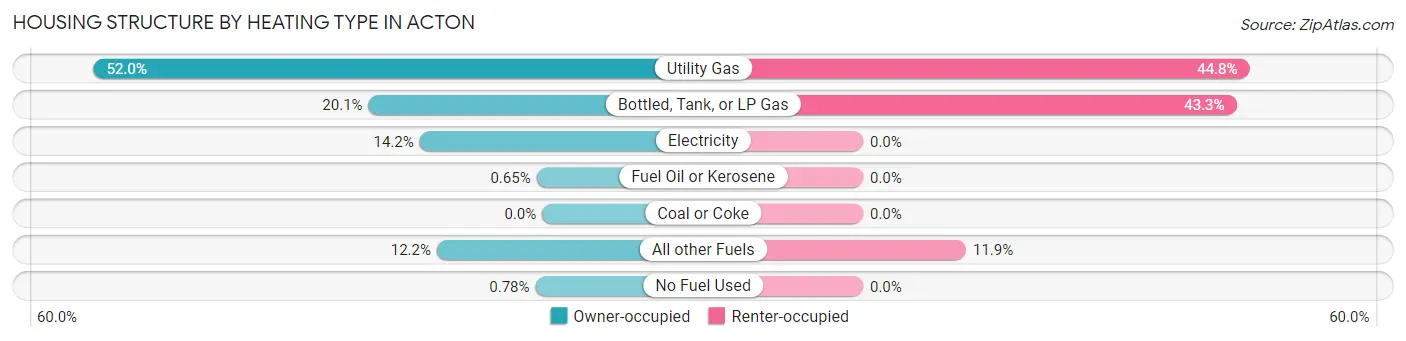
| Heating Type | Owner-occupied | Renter-occupied |
| Utility Gas | 1,201 (52.0%) | 90 (44.8%) |
| Bottled, Tank, or LP Gas | 465 (20.1%) | 87 (43.3%) |
| Electricity | 328 (14.2%) | 0 (0.0%) |
| Fuel Oil or Kerosene | 15 (0.6%) | 0 (0.0%) |
| Coal or Coke | 0 (0.0%) | 0 (0.0%) |
| All other Fuels | 282 (12.2%) | 24 (11.9%) |
| No Fuel Used | 18 (0.8%) | 0 (0.0%) |
| Total | 2,309 (100.0%) | 201 (100.0%) |
Household Vehicle Usage in Acton
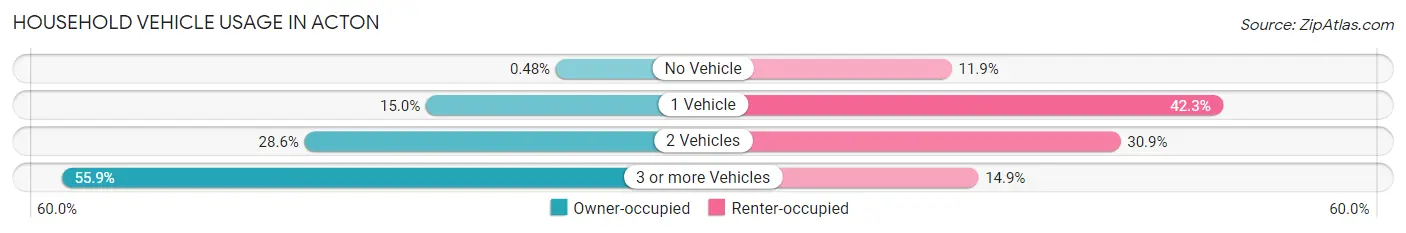
| Vehicles per Household | Owner-occupied | Renter-occupied |
| No Vehicle | 11 (0.5%) | 24 (11.9%) |
| 1 Vehicle | 347 (15.0%) | 85 (42.3%) |
| 2 Vehicles | 661 (28.6%) | 62 (30.8%) |
| 3 or more Vehicles | 1,290 (55.9%) | 30 (14.9%) |
| Total | 2,309 (100.0%) | 201 (100.0%) |
Real Estate & Mortgages in Acton
Real Estate and Mortgage Overview in Acton
| Characteristic | Without Mortgage | With Mortgage |
| Housing Units | 641 | 1,668 |
| Median Property Value | $591,500 | $670,700 |
| Median Household Income | $70,139 | $722 |
| Monthly Housing Costs | $711 | $930 |
| Real Estate Taxes | $4,352 | $21 |
Property Value by Mortgage Status in Acton
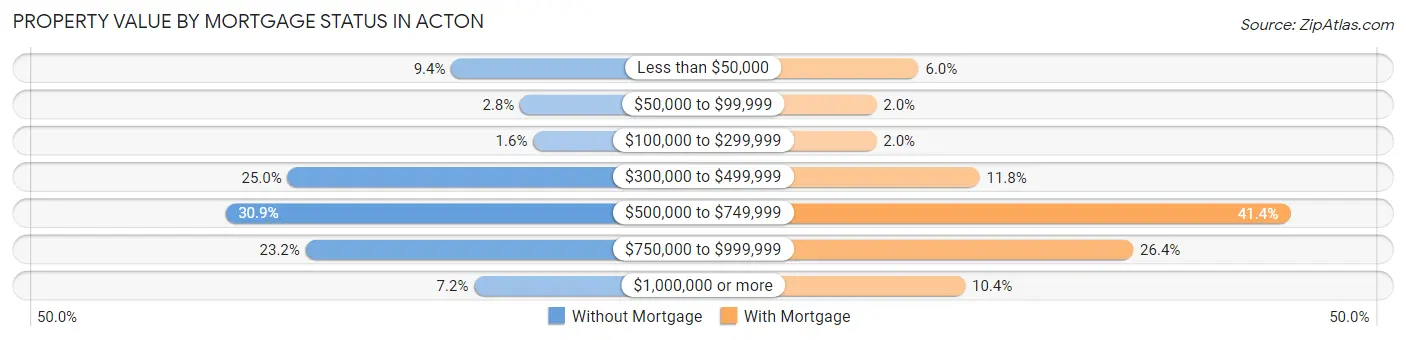
| Property Value | Without Mortgage | With Mortgage |
| Less than $50,000 | 60 (9.4%) | 100 (6.0%) |
| $50,000 to $99,999 | 18 (2.8%) | 33 (2.0%) |
| $100,000 to $299,999 | 10 (1.6%) | 33 (2.0%) |
| $300,000 to $499,999 | 160 (25.0%) | 197 (11.8%) |
| $500,000 to $749,999 | 198 (30.9%) | 690 (41.4%) |
| $750,000 to $999,999 | 149 (23.2%) | 441 (26.4%) |
| $1,000,000 or more | 46 (7.2%) | 174 (10.4%) |
| Total | 641 (100.0%) | 1,668 (100.0%) |
Household Income by Mortgage Status in Acton
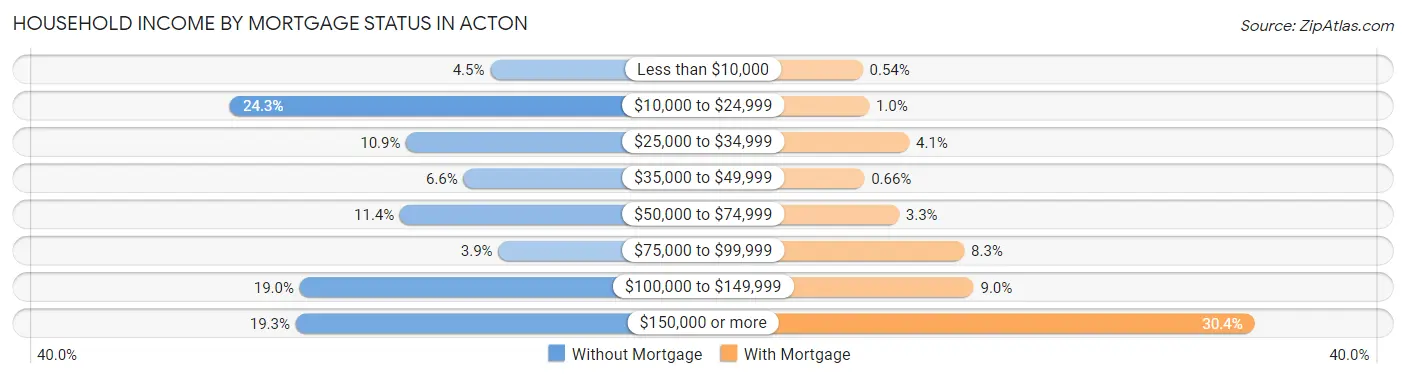
| Household Income | Without Mortgage | With Mortgage |
| Less than $10,000 | 29 (4.5%) | 9 (0.5%) |
| $10,000 to $24,999 | 156 (24.3%) | 17 (1.0%) |
| $25,000 to $34,999 | 70 (10.9%) | 68 (4.1%) |
| $35,000 to $49,999 | 42 (6.6%) | 11 (0.7%) |
| $50,000 to $74,999 | 73 (11.4%) | 55 (3.3%) |
| $75,000 to $99,999 | 25 (3.9%) | 138 (8.3%) |
| $100,000 to $149,999 | 122 (19.0%) | 150 (9.0%) |
| $150,000 or more | 124 (19.3%) | 507 (30.4%) |
| Total | 641 (100.0%) | 1,668 (100.0%) |
Property Value to Household Income Ratio in Acton
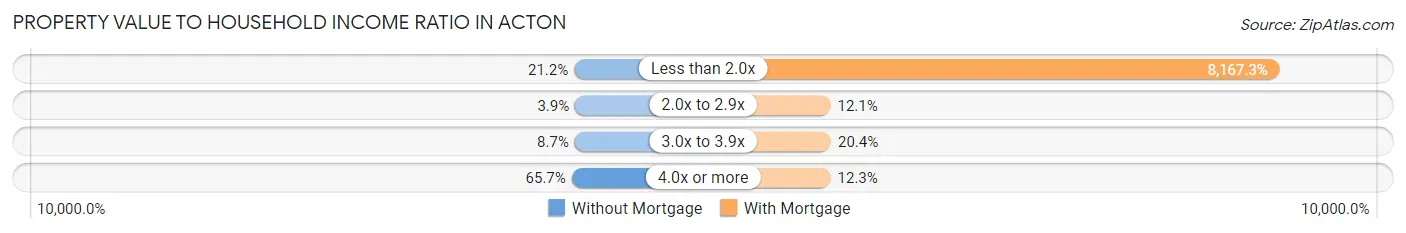
| Value-to-Income Ratio | Without Mortgage | With Mortgage |
| Less than 2.0x | 136 (21.2%) | 136,231 (8,167.3%) |
| 2.0x to 2.9x | 25 (3.9%) | 201 (12.0%) |
| 3.0x to 3.9x | 56 (8.7%) | 341 (20.4%) |
| 4.0x or more | 421 (65.7%) | 205 (12.3%) |
| Total | 641 (100.0%) | 1,668 (100.0%) |
Real Estate Taxes by Mortgage Status in Acton
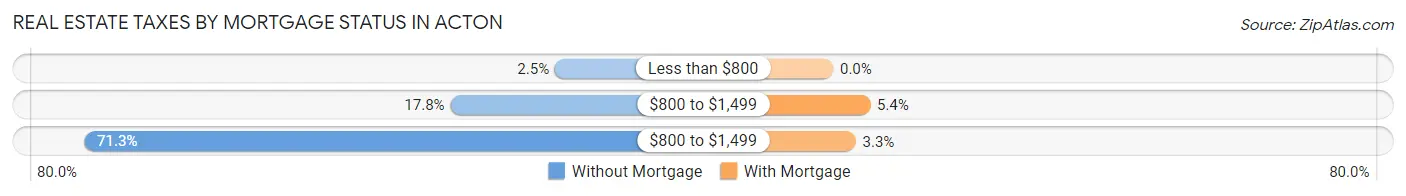
| Property Taxes | Without Mortgage | With Mortgage |
| Less than $800 | 16 (2.5%) | 0 (0.0%) |
| $800 to $1,499 | 114 (17.8%) | 90 (5.4%) |
| $800 to $1,499 | 457 (71.3%) | 55 (3.3%) |
| Total | 641 (100.0%) | 1,668 (100.0%) |
Health & Disability in Acton
Health Insurance Coverage by Age in Acton
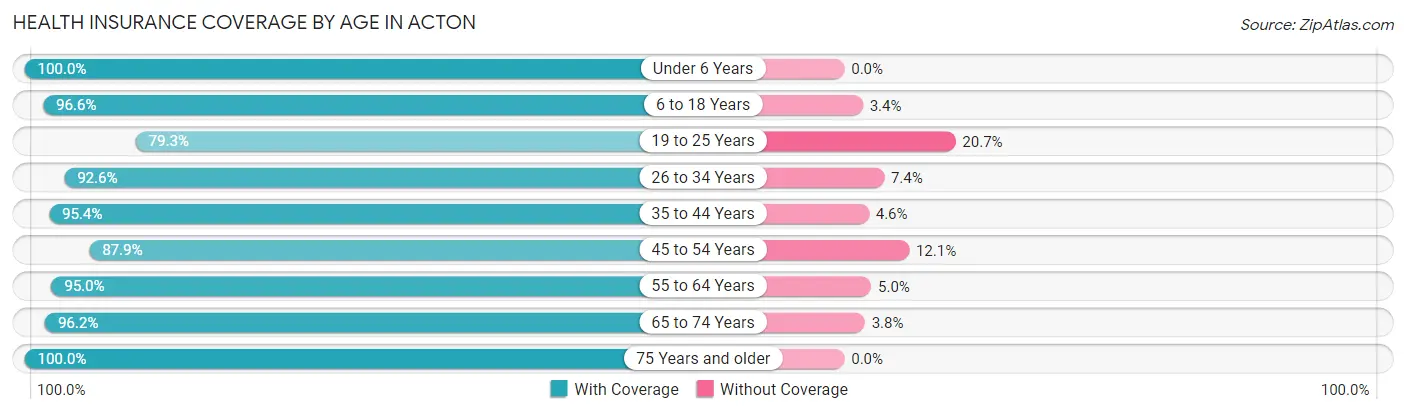
| Age Bracket | With Coverage | Without Coverage |
| Under 6 Years | 401 (100.0%) | 0 (0.0%) |
| 6 to 18 Years | 1,040 (96.6%) | 37 (3.4%) |
| 19 to 25 Years | 547 (79.3%) | 143 (20.7%) |
| 26 to 34 Years | 463 (92.6%) | 37 (7.4%) |
| 35 to 44 Years | 689 (95.4%) | 33 (4.6%) |
| 45 to 54 Years | 890 (87.9%) | 122 (12.1%) |
| 55 to 64 Years | 1,353 (95.0%) | 71 (5.0%) |
| 65 to 74 Years | 1,111 (96.2%) | 44 (3.8%) |
| 75 Years and older | 276 (100.0%) | 0 (0.0%) |
| Total | 6,770 (93.3%) | 487 (6.7%) |
Health Insurance Coverage by Citizenship Status in Acton
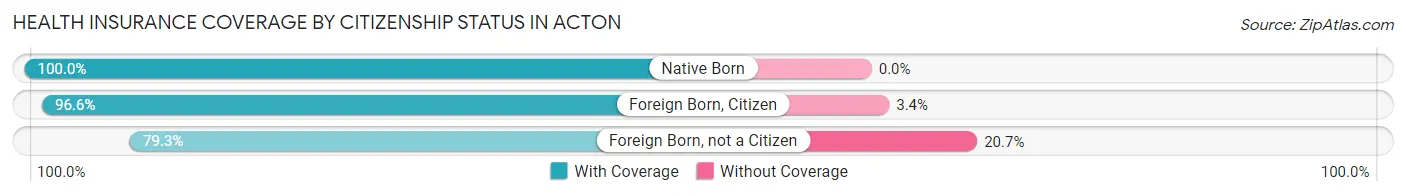
| Citizenship Status | With Coverage | Without Coverage |
| Native Born | 401 (100.0%) | 0 (0.0%) |
| Foreign Born, Citizen | 1,040 (96.6%) | 37 (3.4%) |
| Foreign Born, not a Citizen | 547 (79.3%) | 143 (20.7%) |
Health Insurance Coverage by Household Income in Acton
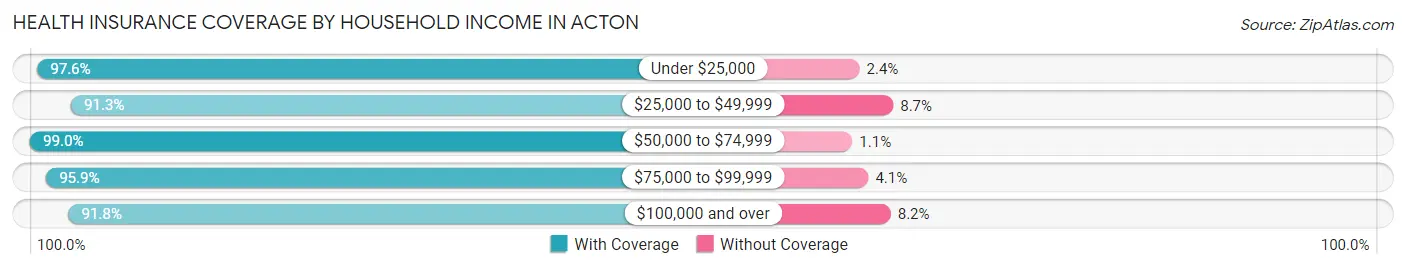
| Household Income | With Coverage | Without Coverage |
| Under $25,000 | 570 (97.6%) | 14 (2.4%) |
| $25,000 to $49,999 | 388 (91.3%) | 37 (8.7%) |
| $50,000 to $74,999 | 756 (99.0%) | 8 (1.1%) |
| $75,000 to $99,999 | 543 (95.9%) | 23 (4.1%) |
| $100,000 and over | 4,513 (91.8%) | 405 (8.2%) |
Public vs Private Health Insurance Coverage by Age in Acton
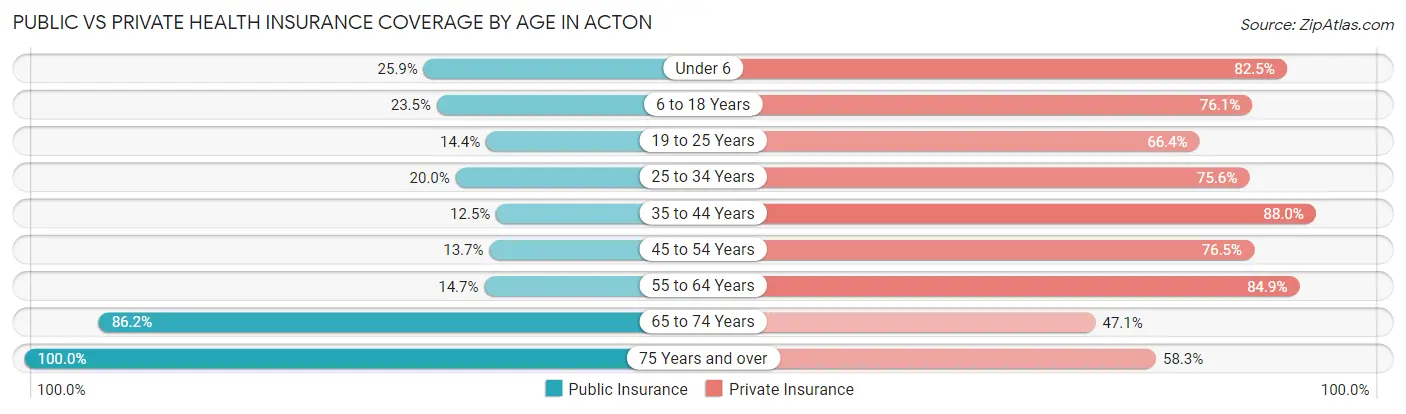
| Age Bracket | Public Insurance | Private Insurance |
| Under 6 | 104 (25.9%) | 331 (82.5%) |
| 6 to 18 Years | 253 (23.5%) | 820 (76.1%) |
| 19 to 25 Years | 99 (14.3%) | 458 (66.4%) |
| 25 to 34 Years | 100 (20.0%) | 378 (75.6%) |
| 35 to 44 Years | 90 (12.5%) | 635 (87.9%) |
| 45 to 54 Years | 139 (13.7%) | 774 (76.5%) |
| 55 to 64 Years | 209 (14.7%) | 1,209 (84.9%) |
| 65 to 74 Years | 996 (86.2%) | 544 (47.1%) |
| 75 Years and over | 276 (100.0%) | 161 (58.3%) |
| Total | 2,266 (31.2%) | 5,310 (73.2%) |
Disability Status by Sex by Age in Acton
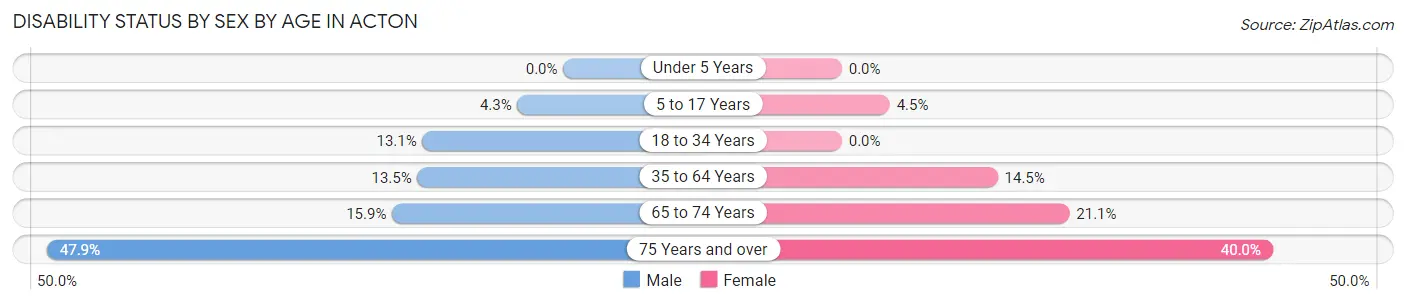
| Age Bracket | Male | Female |
| Under 5 Years | 0 (0.0%) | 0 (0.0%) |
| 5 to 17 Years | 18 (4.3%) | 27 (4.4%) |
| 18 to 34 Years | 74 (13.1%) | 0 (0.0%) |
| 35 to 64 Years | 212 (13.5%) | 230 (14.5%) |
| 65 to 74 Years | 118 (15.9%) | 87 (21.1%) |
| 75 Years and over | 58 (47.9%) | 62 (40.0%) |
Disability Class by Sex by Age in Acton
Disability Class: Hearing Difficulty
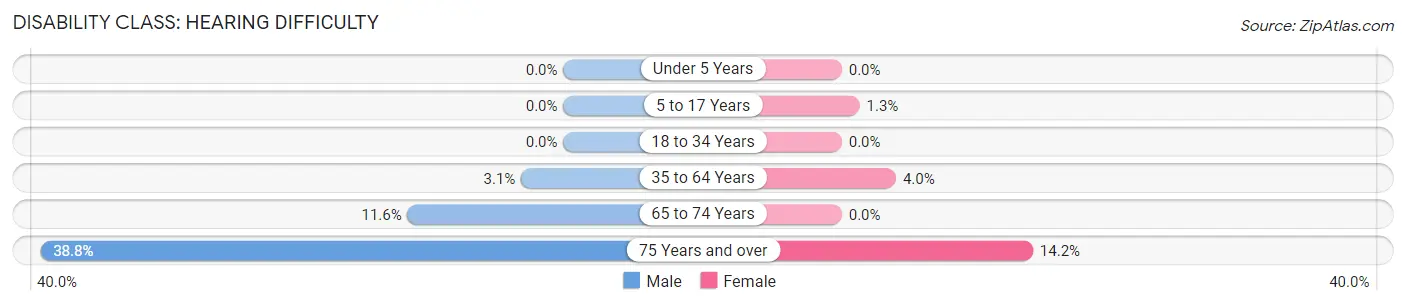
| Age Bracket | Male | Female |
| Under 5 Years | 0 (0.0%) | 0 (0.0%) |
| 5 to 17 Years | 0 (0.0%) | 8 (1.3%) |
| 18 to 34 Years | 0 (0.0%) | 0 (0.0%) |
| 35 to 64 Years | 49 (3.1%) | 64 (4.0%) |
| 65 to 74 Years | 86 (11.6%) | 0 (0.0%) |
| 75 Years and over | 47 (38.8%) | 22 (14.2%) |
Disability Class: Vision Difficulty
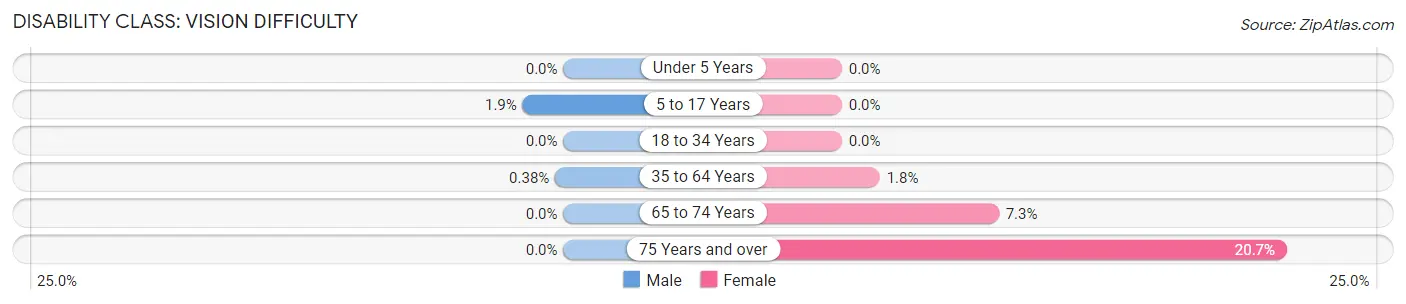
| Age Bracket | Male | Female |
| Under 5 Years | 0 (0.0%) | 0 (0.0%) |
| 5 to 17 Years | 8 (1.9%) | 0 (0.0%) |
| 18 to 34 Years | 0 (0.0%) | 0 (0.0%) |
| 35 to 64 Years | 6 (0.4%) | 28 (1.8%) |
| 65 to 74 Years | 0 (0.0%) | 30 (7.3%) |
| 75 Years and over | 0 (0.0%) | 32 (20.6%) |
Disability Class: Cognitive Difficulty
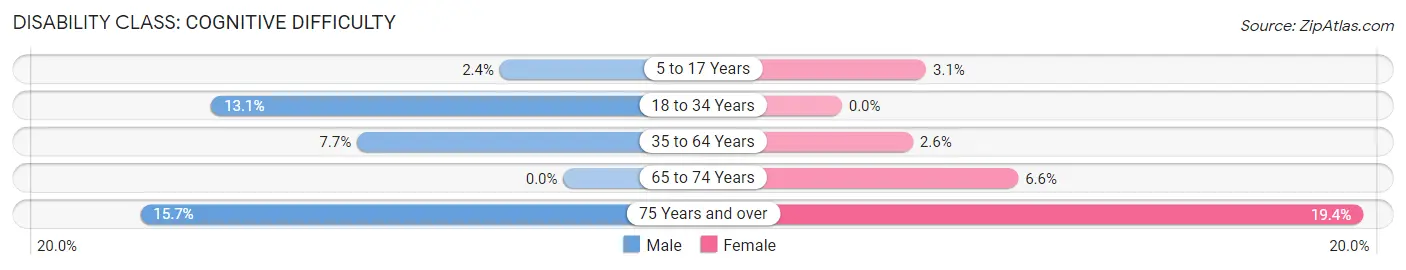
| Age Bracket | Male | Female |
| 5 to 17 Years | 10 (2.4%) | 19 (3.1%) |
| 18 to 34 Years | 74 (13.1%) | 0 (0.0%) |
| 35 to 64 Years | 120 (7.7%) | 42 (2.6%) |
| 65 to 74 Years | 0 (0.0%) | 27 (6.6%) |
| 75 Years and over | 19 (15.7%) | 30 (19.4%) |
Disability Class: Ambulatory Difficulty
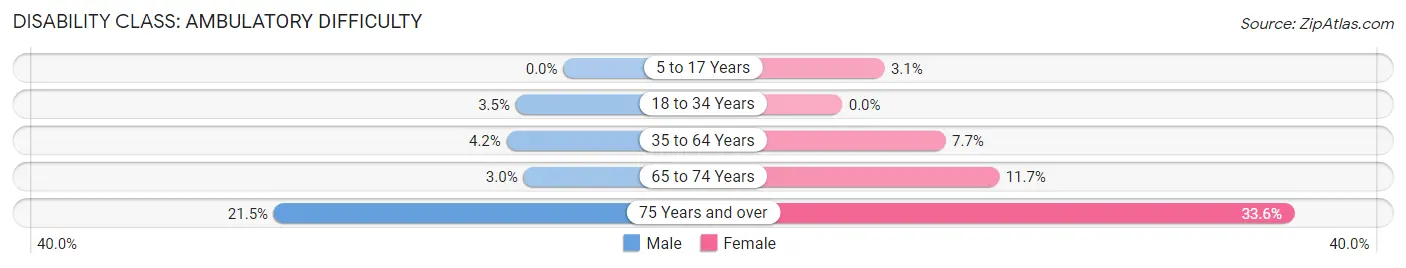
| Age Bracket | Male | Female |
| 5 to 17 Years | 0 (0.0%) | 19 (3.1%) |
| 18 to 34 Years | 20 (3.5%) | 0 (0.0%) |
| 35 to 64 Years | 66 (4.2%) | 122 (7.7%) |
| 65 to 74 Years | 22 (3.0%) | 48 (11.7%) |
| 75 Years and over | 26 (21.5%) | 52 (33.6%) |
Disability Class: Self-Care Difficulty
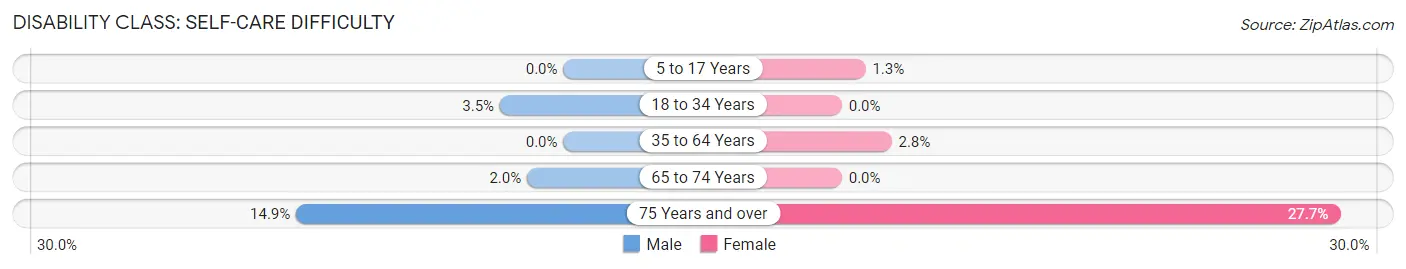
| Age Bracket | Male | Female |
| 5 to 17 Years | 0 (0.0%) | 8 (1.3%) |
| 18 to 34 Years | 20 (3.5%) | 0 (0.0%) |
| 35 to 64 Years | 0 (0.0%) | 44 (2.8%) |
| 65 to 74 Years | 15 (2.0%) | 0 (0.0%) |
| 75 Years and over | 18 (14.9%) | 43 (27.7%) |
Technology Access in Acton
Computing Device Access in Acton
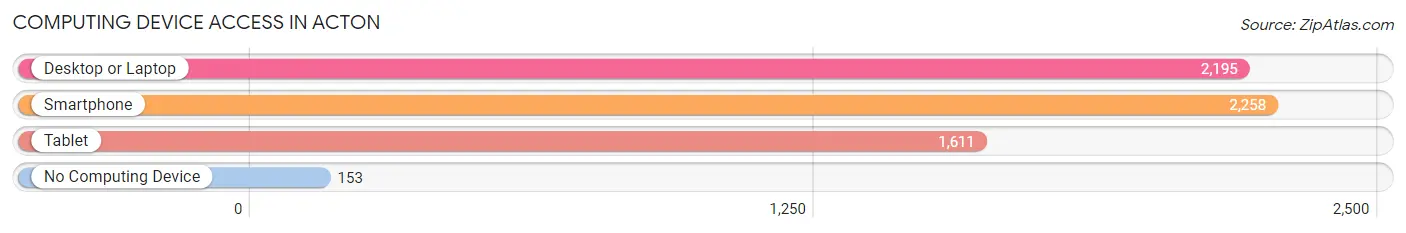
| Device Type | # Households | % Households |
| Desktop or Laptop | 2,195 | 87.5% |
| Smartphone | 2,258 | 90.0% |
| Tablet | 1,611 | 64.2% |
| No Computing Device | 153 | 6.1% |
| Total | 2,510 | 100.0% |
Internet Access in Acton
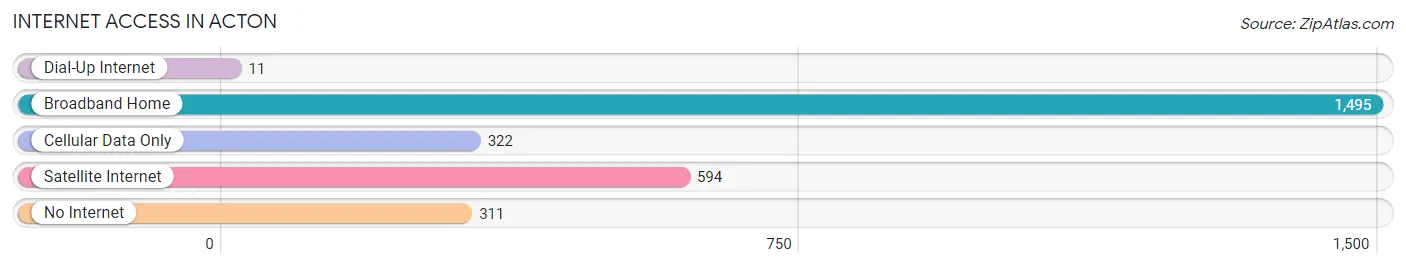
| Internet Type | # Households | % Households |
| Dial-Up Internet | 11 | 0.4% |
| Broadband Home | 1,495 | 59.6% |
| Cellular Data Only | 322 | 12.8% |
| Satellite Internet | 594 | 23.7% |
| No Internet | 311 | 12.4% |
| Total | 2,510 | 100.0% |
Acton Summary
Acton is a census-designated place (CDP) located in Los Angeles County, California, United States. It is situated in the Antelope Valley, approximately 25 miles (40 km) northeast of the county seat of Los Angeles. The population was 7,596 at the 2010 census, up from 7,122 at the 2000 census.
History
Acton was founded in 1887 by gold miners who were working in the Red Rover Mine. It was named after Acton, Massachusetts by one of the miners. The town quickly grew and soon became a bustling mining town with a population of over 1,000. The town was home to several saloons, hotels, and stores.
In the early 1900s, Acton began to decline as the gold mines began to close. By the 1950s, the population had dropped to just a few hundred. In the 1960s, the town was revitalized when the Antelope Valley Freeway (now State Route 14) was built through the area. This brought new businesses and residents to the area, and the population began to grow again.
Geography
Acton is located at 34°23'25" North, 118°11'51" West (34.3903, -118.1974). It is situated in the Antelope Valley, approximately 25 miles (40 km) northeast of the county seat of Los Angeles.
According to the United States Census Bureau, the CDP has a total area of 8.3 square miles (21.5 km2), all of it land.
Economy
Acton is primarily a bedroom community for the nearby cities of Palmdale and Lancaster. The town is home to several small businesses, including a few restaurants, a gas station, and a few convenience stores.
The town is also home to several large industrial and manufacturing companies, including the Acton Industrial Park, which is home to several aerospace and defense contractors.
Demographics
As of the census of 2000, there were 7,122 people, 2,541 households, and 1,945 families residing in the CDP. The population density was 856.2 people per square mile (331.2/km2). There were 2,717 housing units at an average density of 327.7 per square mile (126.6/km2). The racial makeup of the CDP was 81.2% White, 1.2% African American, 1.2% Native American, 0.7% Asian, 0.1% Pacific Islander, 11.7% from other races, and 3.8% from two or more races. Hispanic or Latino of any race were 22.2% of the population.
There were 2,541 households, out of which 39.3% had children under the age of 18 living with them, 58.2% were married couples living together, 11.7% had a female householder with no husband present, and 24.2% were non-families. 19.2% of all households were made up of individuals, and 5.2% had someone living alone who was 65 years of age or older. The average household size was 2.81 and the average family size was 3.21.
In the CDP, the population was spread out, with 29.2% under the age of 18, 8.2% from 18 to 24, 30.2% from 25 to 44, 24.2% from 45 to 64, and 8.2% who were 65 years of age or older. The median age was 35 years. For every 100 females, there were 103.2 males. For every 100 females age 18 and over, there were 102.2 males.
The median income for a household in the CDP was $45,938, and the median income for a family was $50,938. Males had a median income of $41,944 versus $30,938 for females. The per capita income for the CDP was $19,938. About 8.2% of families and 10.2% of the population were below the poverty line, including 13.2% of those under age 18 and 4.2% of those age 65 or over.
Common Questions
What is Per Capita Income in Acton?
Per Capita income in Acton is $48,536.
What is the Median Family Income in Acton?
Median Family Income in Acton is $127,717.
What is the Median Household income in Acton?
Median Household Income in Acton is $119,091.
What is Income or Wage Gap in Acton?
Income or Wage Gap in Acton is 40.2%.
Women in Acton earn 59.8 cents for every dollar earned by a man.
What is Inequality or Gini Index in Acton?
Inequality or Gini Index in Acton is 0.41.
What is the Total Population of Acton?
Total Population of Acton is 7,286.
What is the Total Male Population of Acton?
Total Male Population of Acton is 3,642.
What is the Total Female Population of Acton?
Total Female Population of Acton is 3,644.
What is the Ratio of Males per 100 Females in Acton?
There are 99.95 Males per 100 Females in Acton.
What is the Ratio of Females per 100 Males in Acton?
There are 100.05 Females per 100 Males in Acton.
What is the Median Population Age in Acton?
Median Population Age in Acton is 46.8 Years.
What is the Average Family Size in Acton
Average Family Size in Acton is 3.3 People.
What is the Average Household Size in Acton
Average Household Size in Acton is 2.9 People.
How Large is the Labor Force in Acton?
There are 3,493 People in the Labor Forcein in Acton.
What is the Percentage of People in the Labor Force in Acton?
58.3% of People are in the Labor Force in Acton.
What is the Unemployment Rate in Acton?
Unemployment Rate in Acton is 1.5%.